

Submitted:
24 January 2025
Posted:
27 January 2025
You are already at the latest version
Abstract
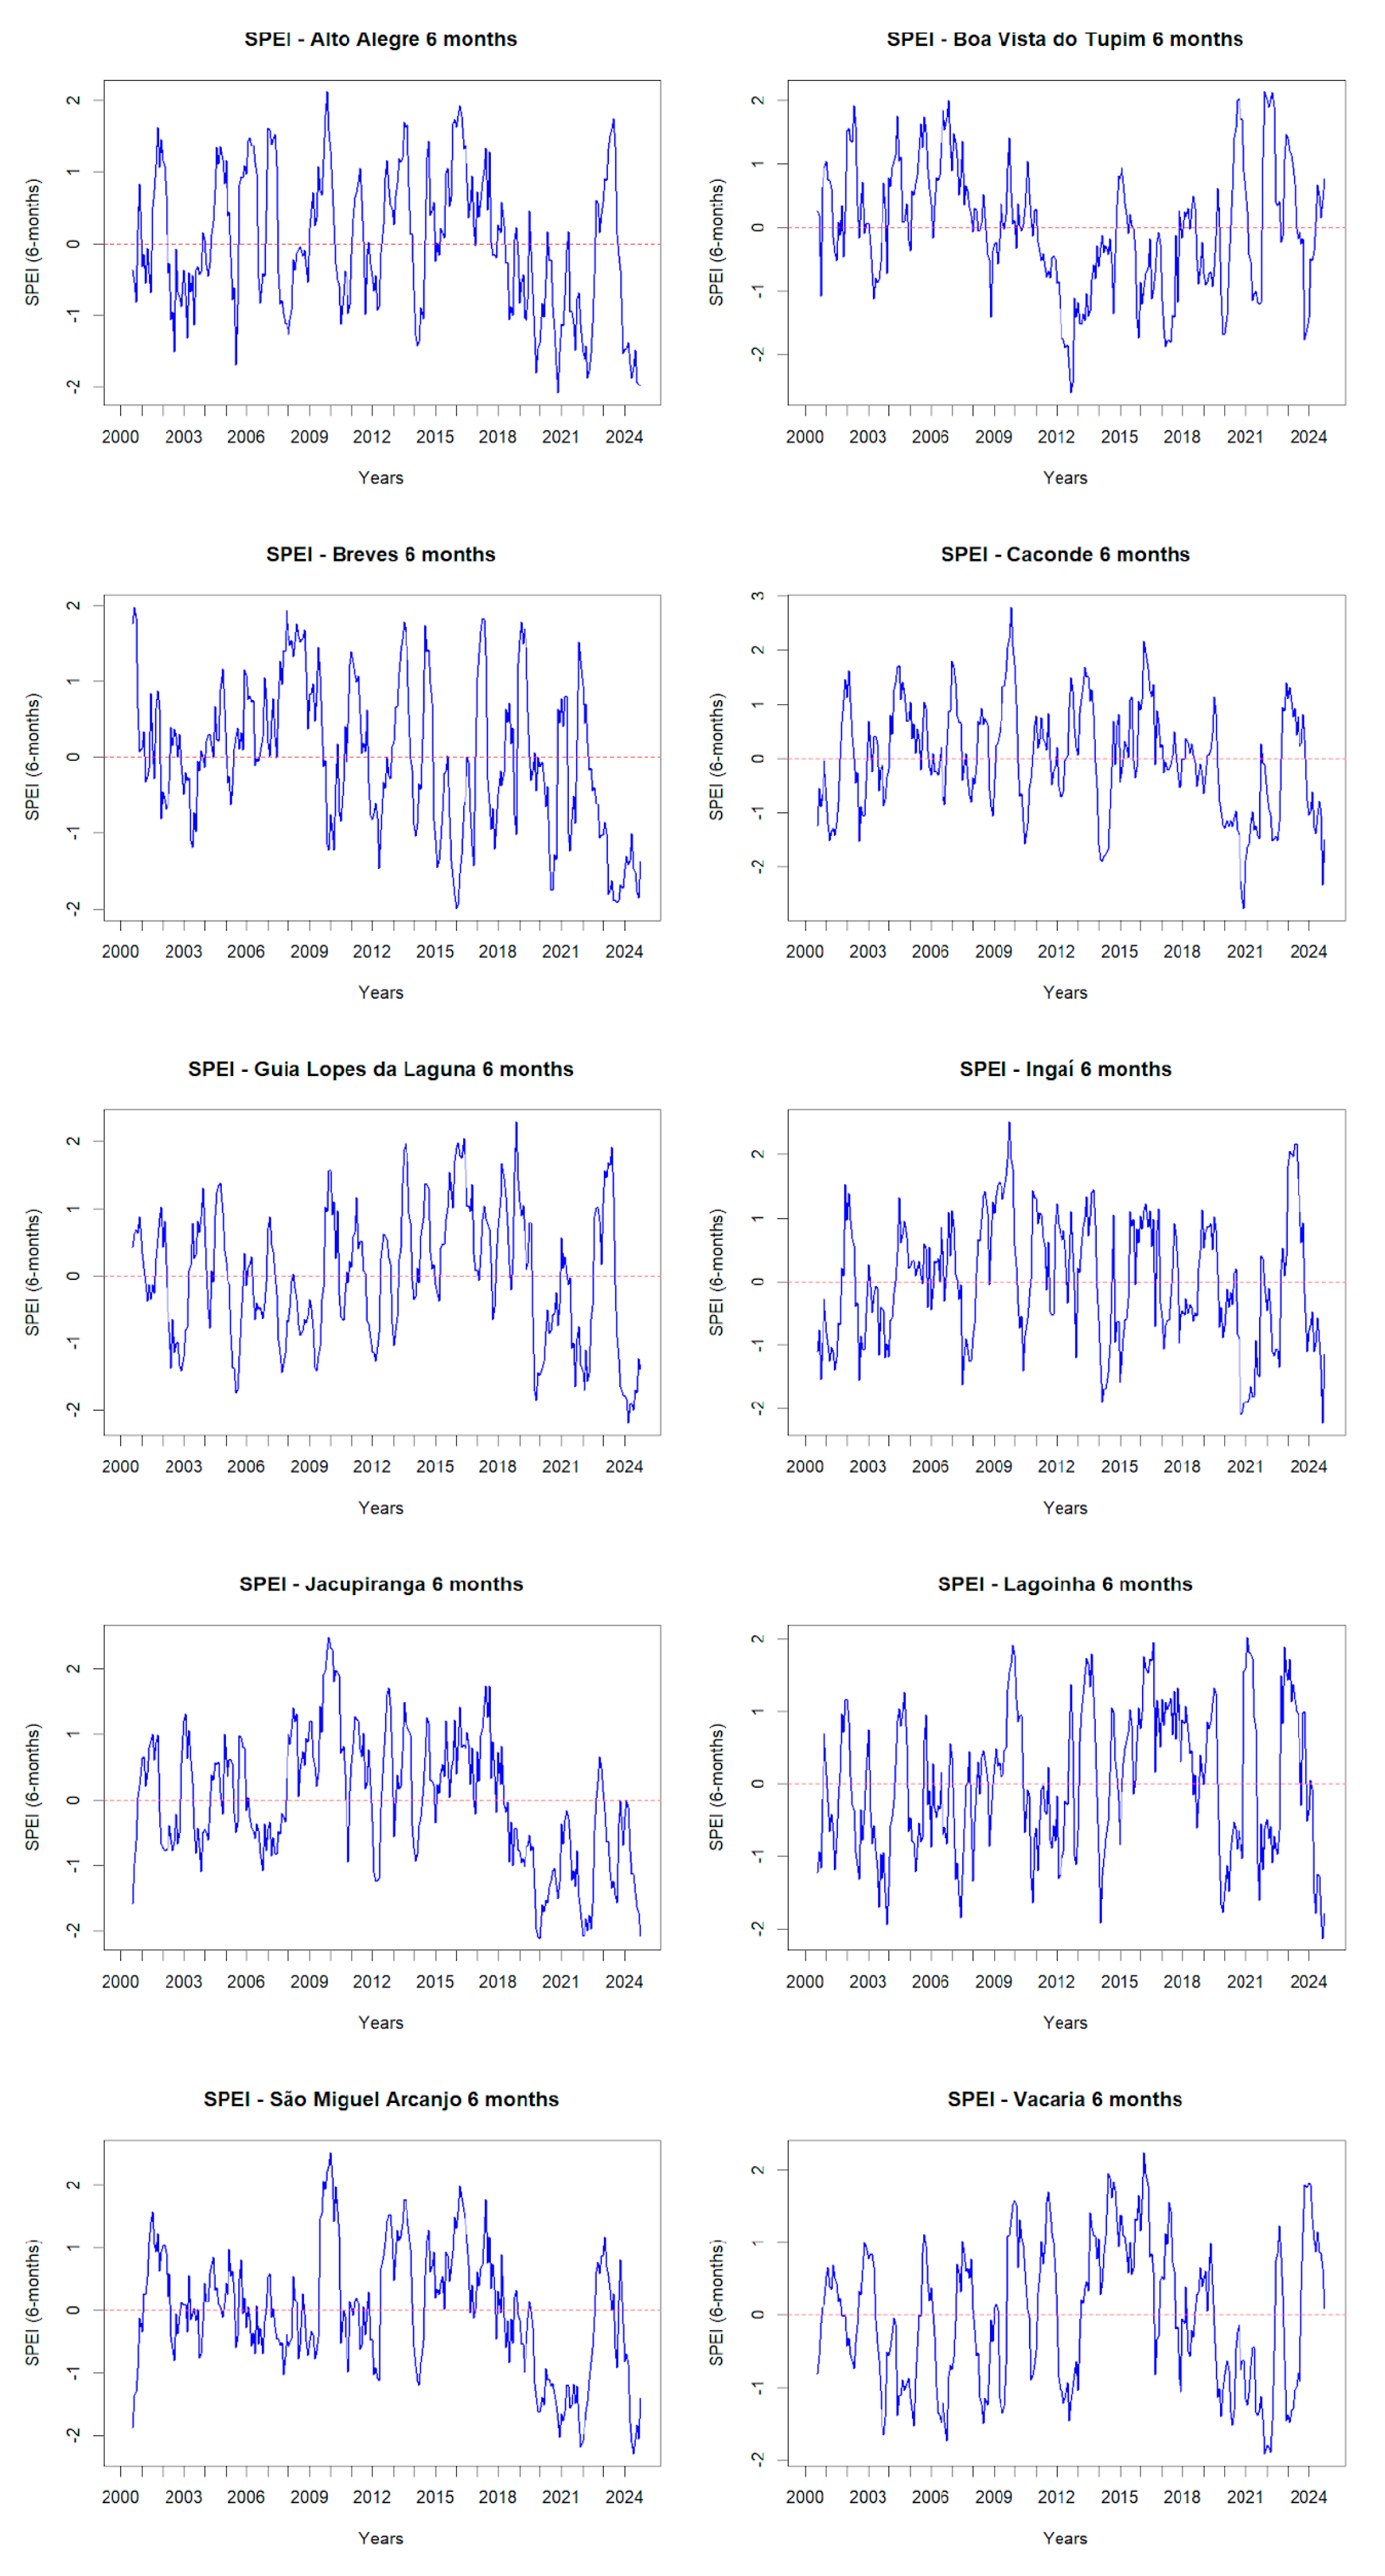
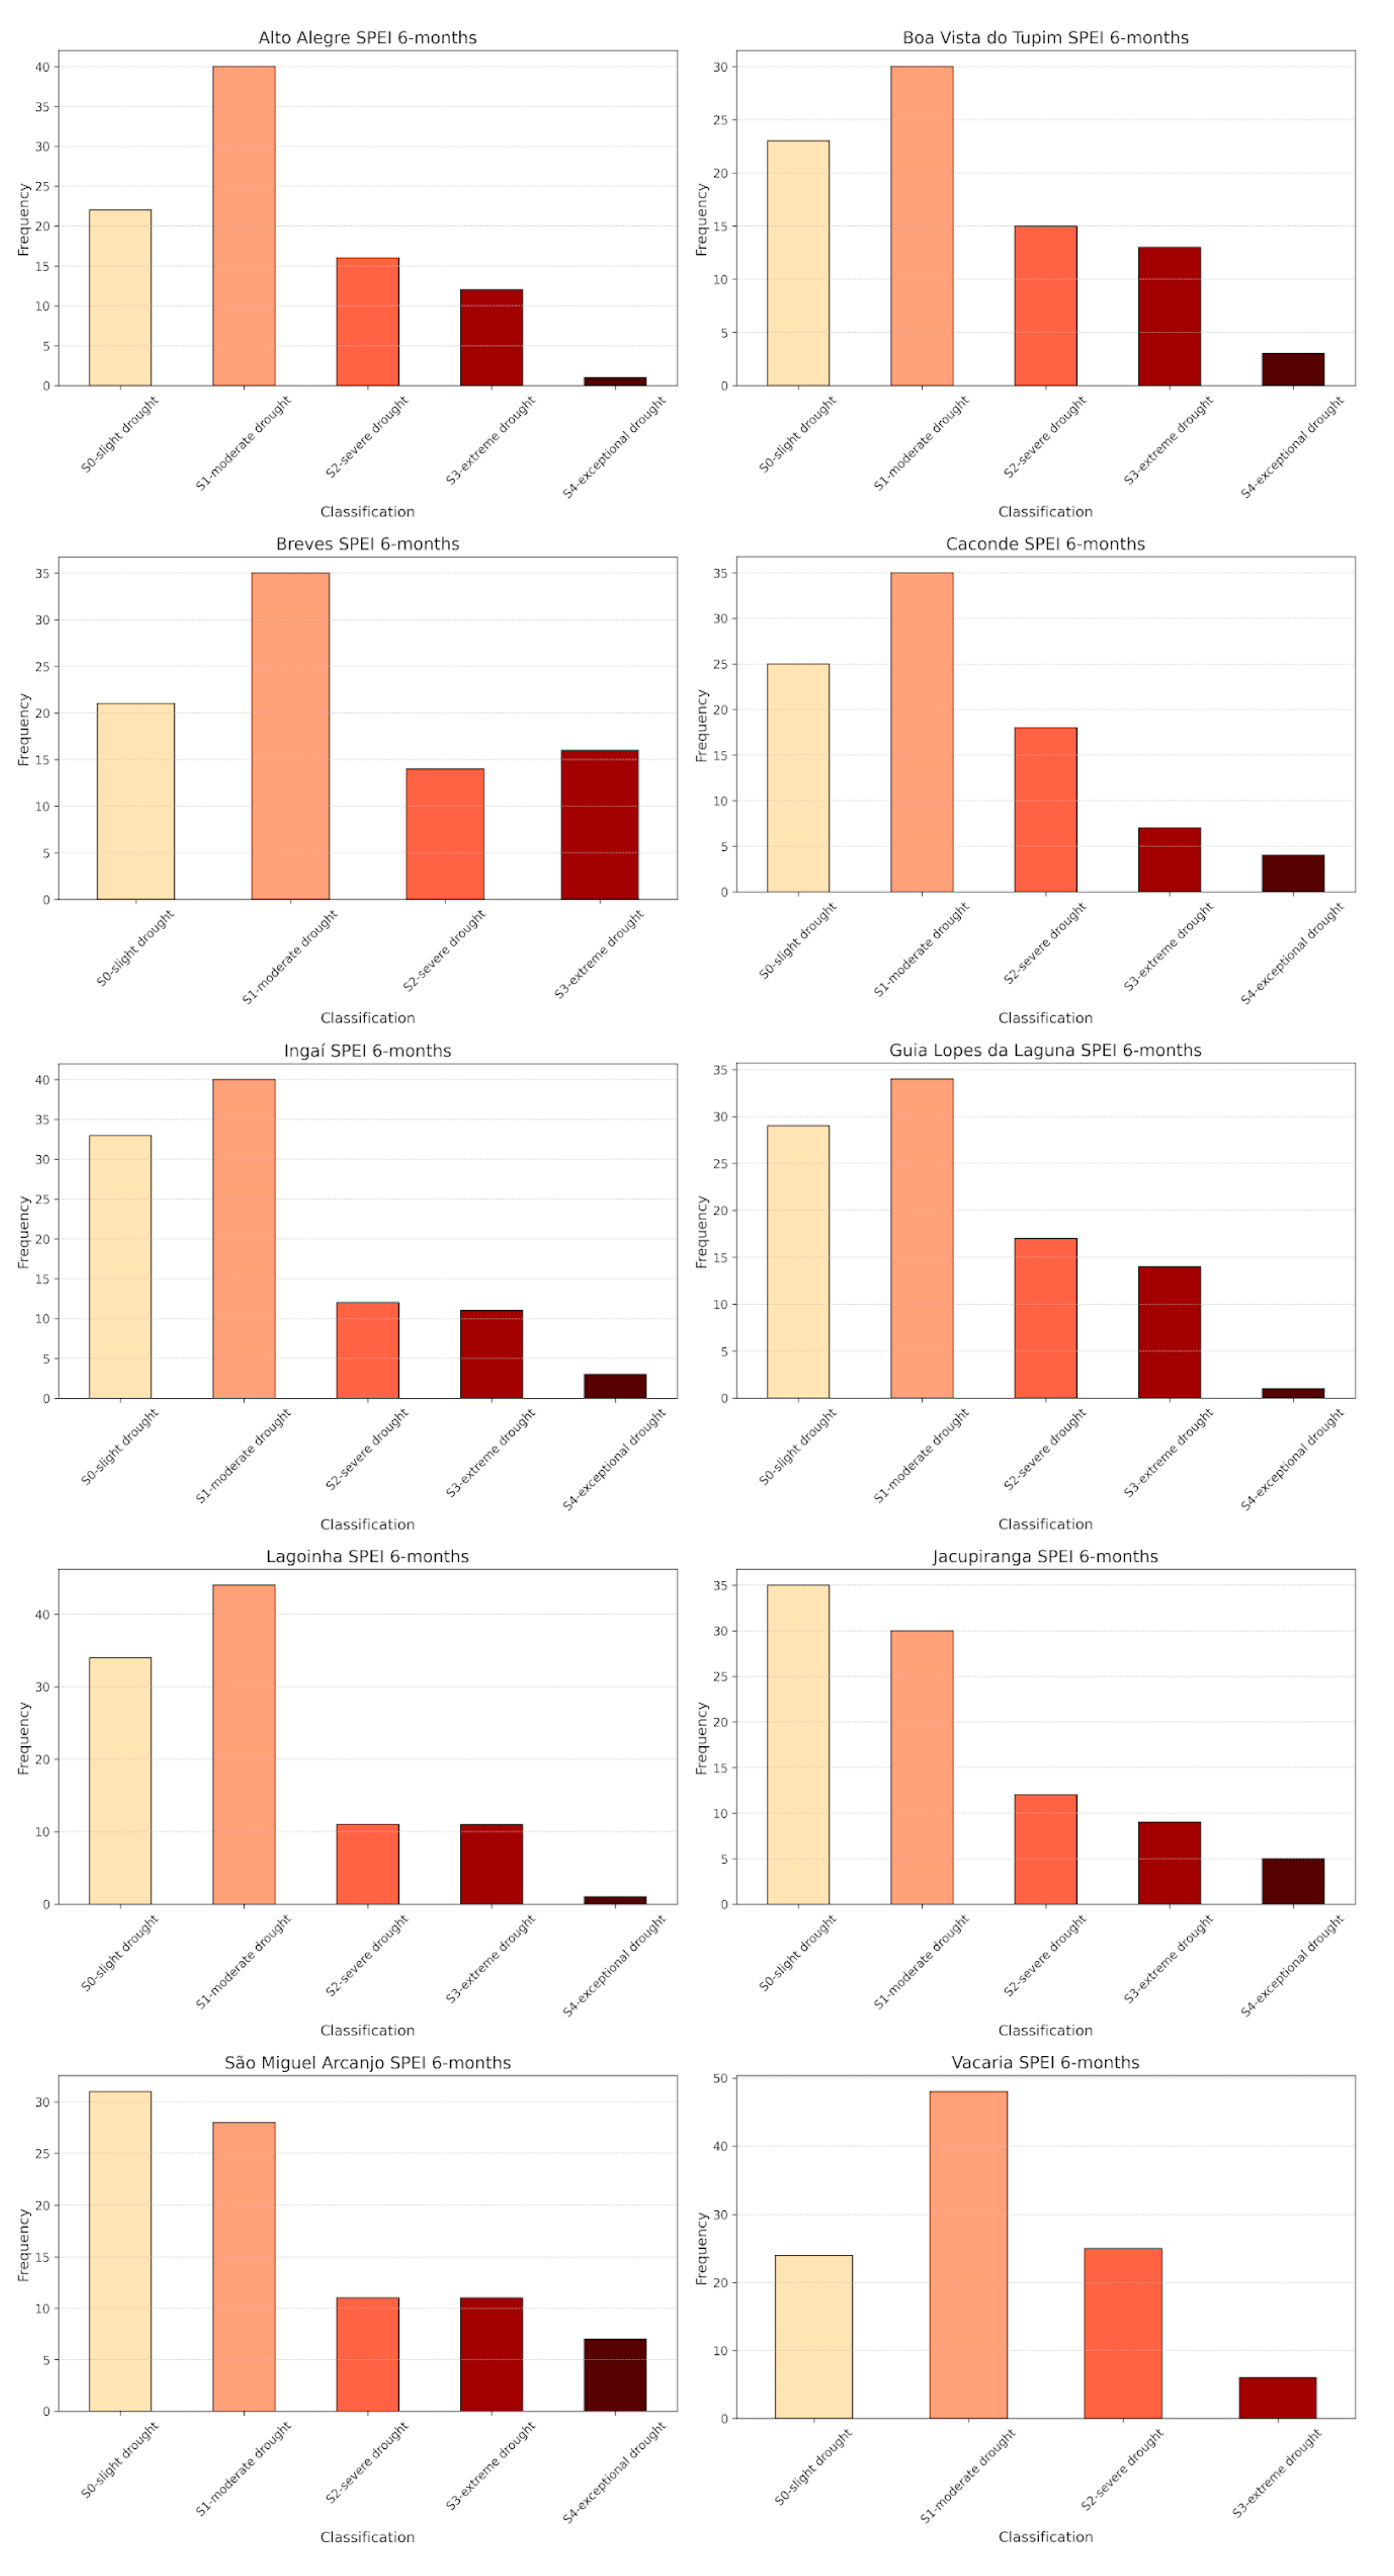
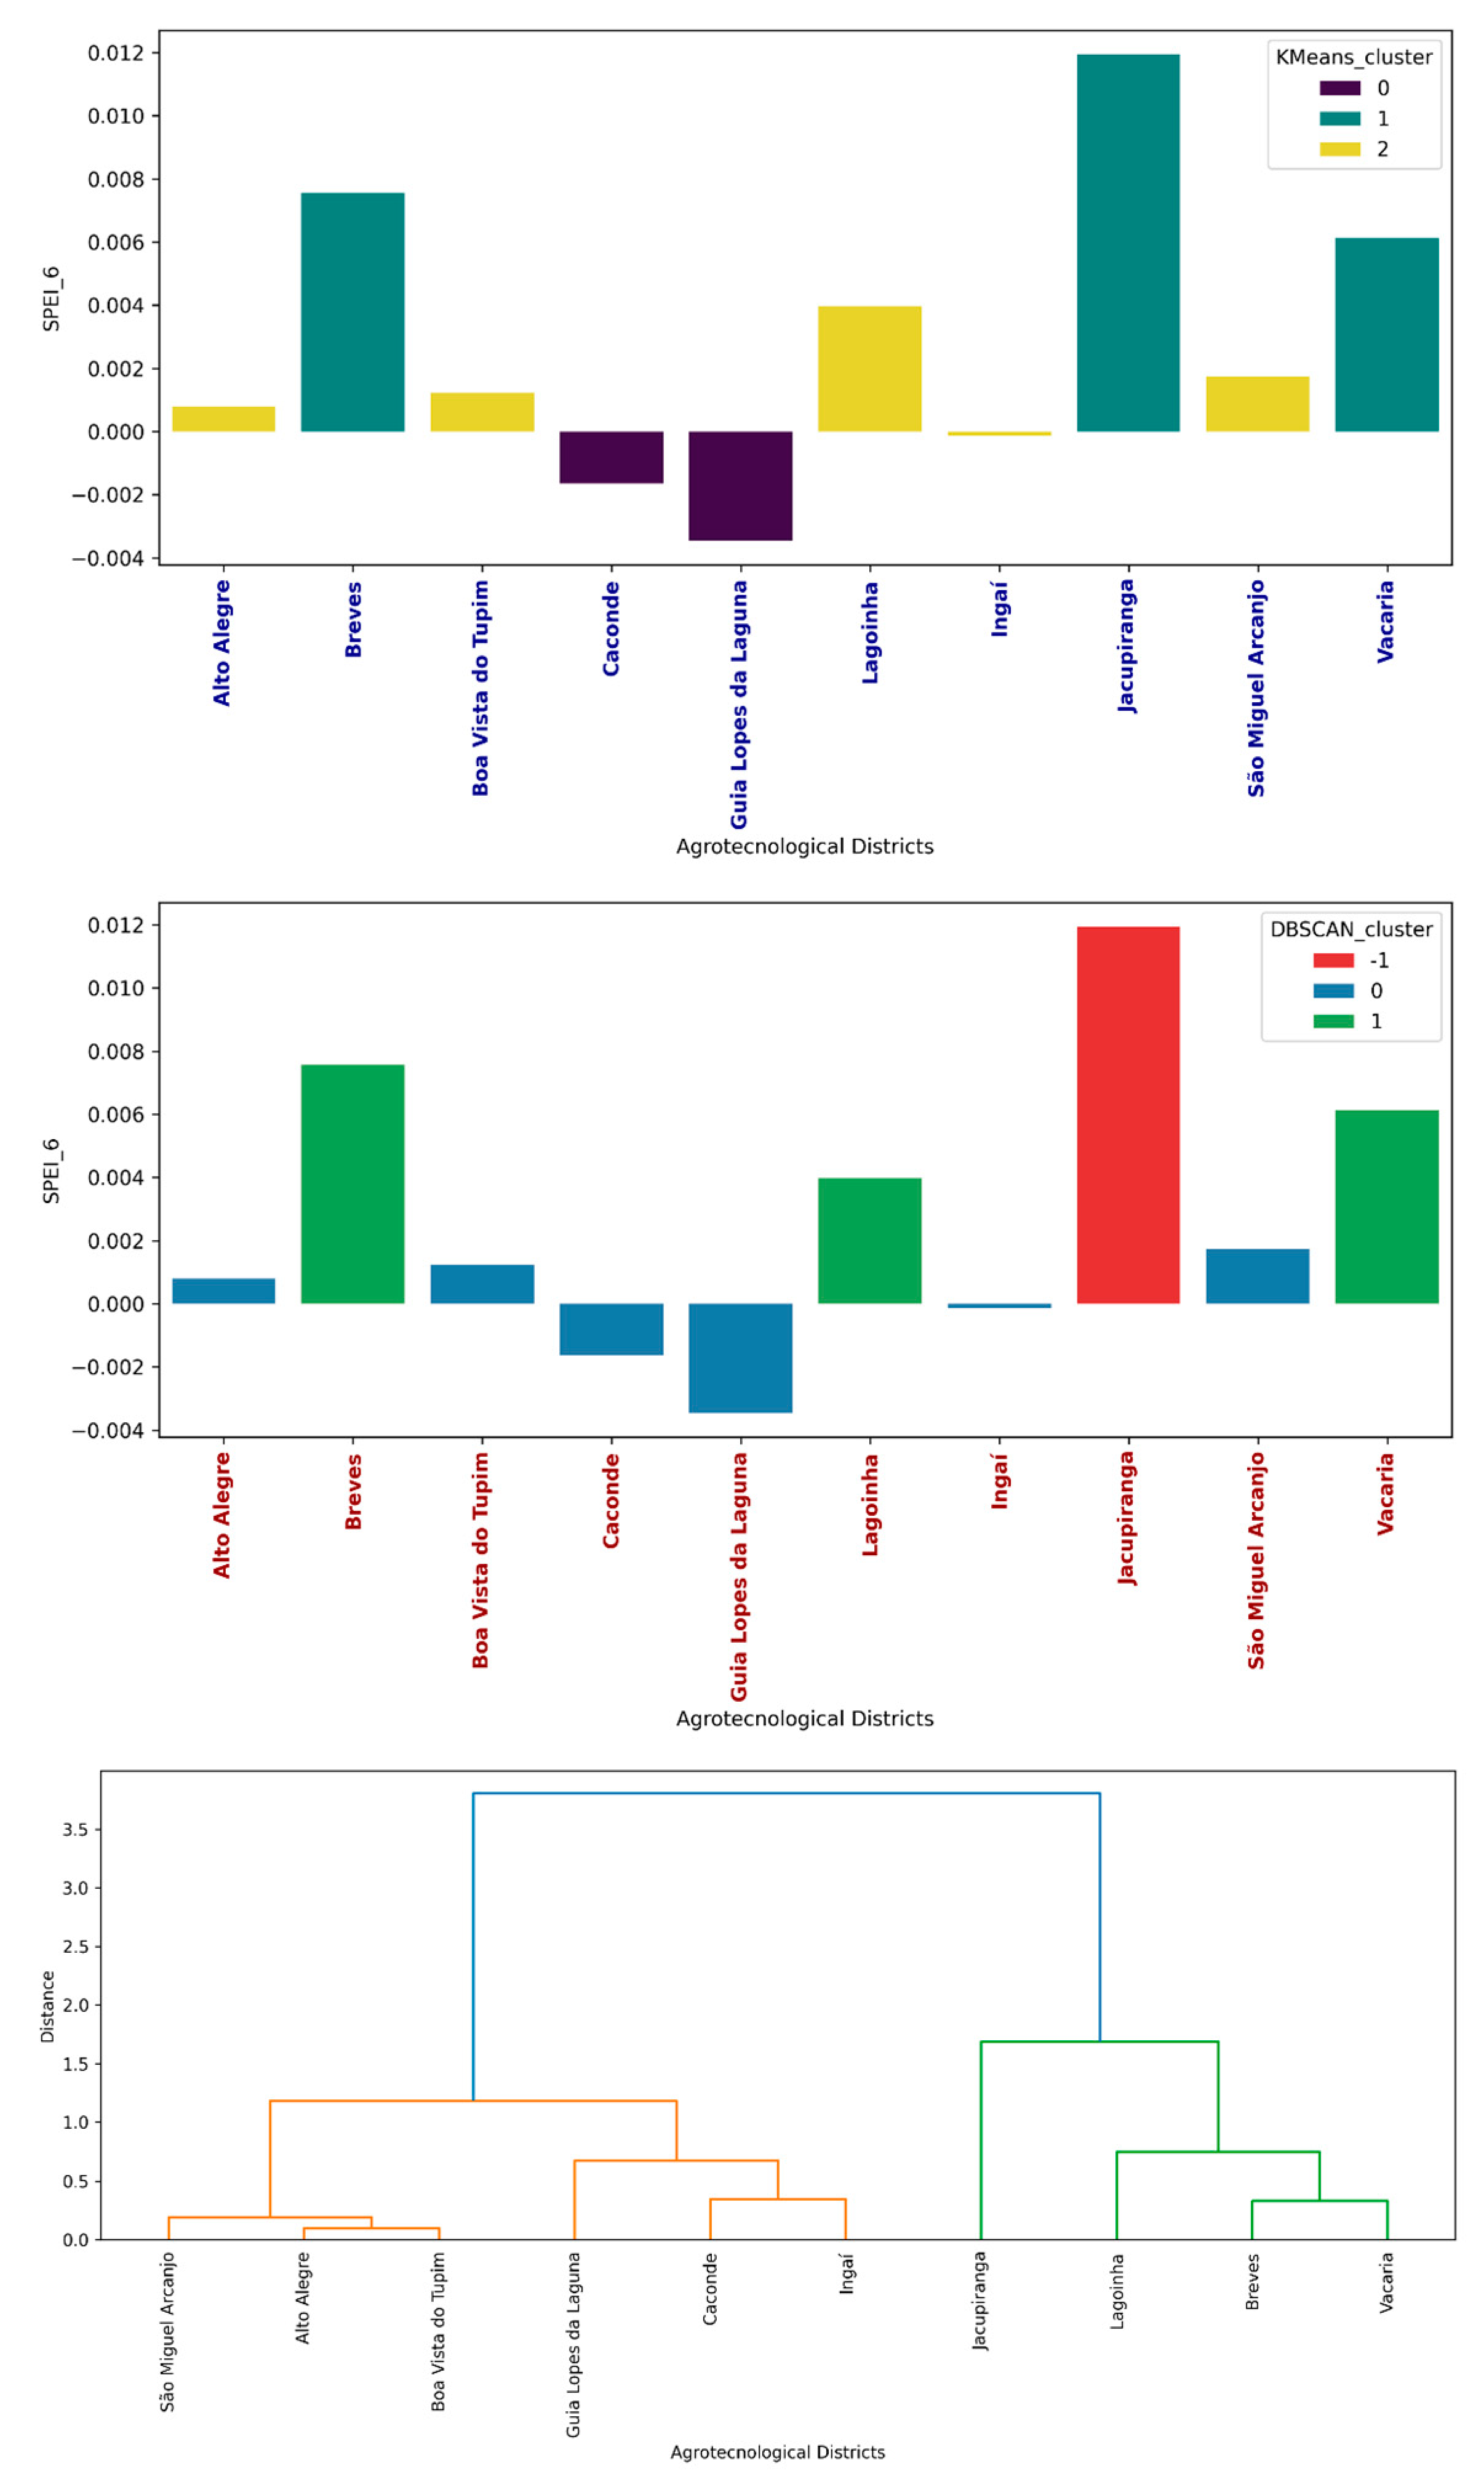
Drought affects the agricultural sector, posing challenges for farm management, particularly among medium- and small-scale producers. This study calculates the Standardized Precipitation-Evapotranspiration Index (SPEI) using climate data derived from remote sensing products to assess drought frequency and intensity in the Agrotechnological Districts (DATs) of the Semear Digital Center. DATs are characterized by a high concentration of small and medium-sized farms. The SPEI, a robust tool for evaluating the increasing severity of droughts under global warming conditions, was calculated for timescales of 3 and 6 months, covering the period from 2000 to 2024. Drought intensity was classified into five categories: slight drought (S0), moderate drought (S1), severe drought (S2), extreme drought (S3), and exceptional drought (S4). Moderate and slight drought were the most frequently observed drought severity categories in the DATs. However, temporal trend analyses revealed variations among these regions. While Vacaria Ingaí, and Guia Lopes da Laguna presented no trend (SPEI-3 and SPEI-6 months), negative trends were observed in the majority of the DATs, indicating a potential increase in drought severity. Clustering analyses consistently grouped Jacupiranga and Vacaria, suggesting similar drought patterns. These findings offer crucial information for developing strategies to mitigate agricultural risks associated with drought.
Keywords:
1. Introduction
2. Materials and Methods
2.1. Study Area
2.2. Climate Data and SPEI Calculations
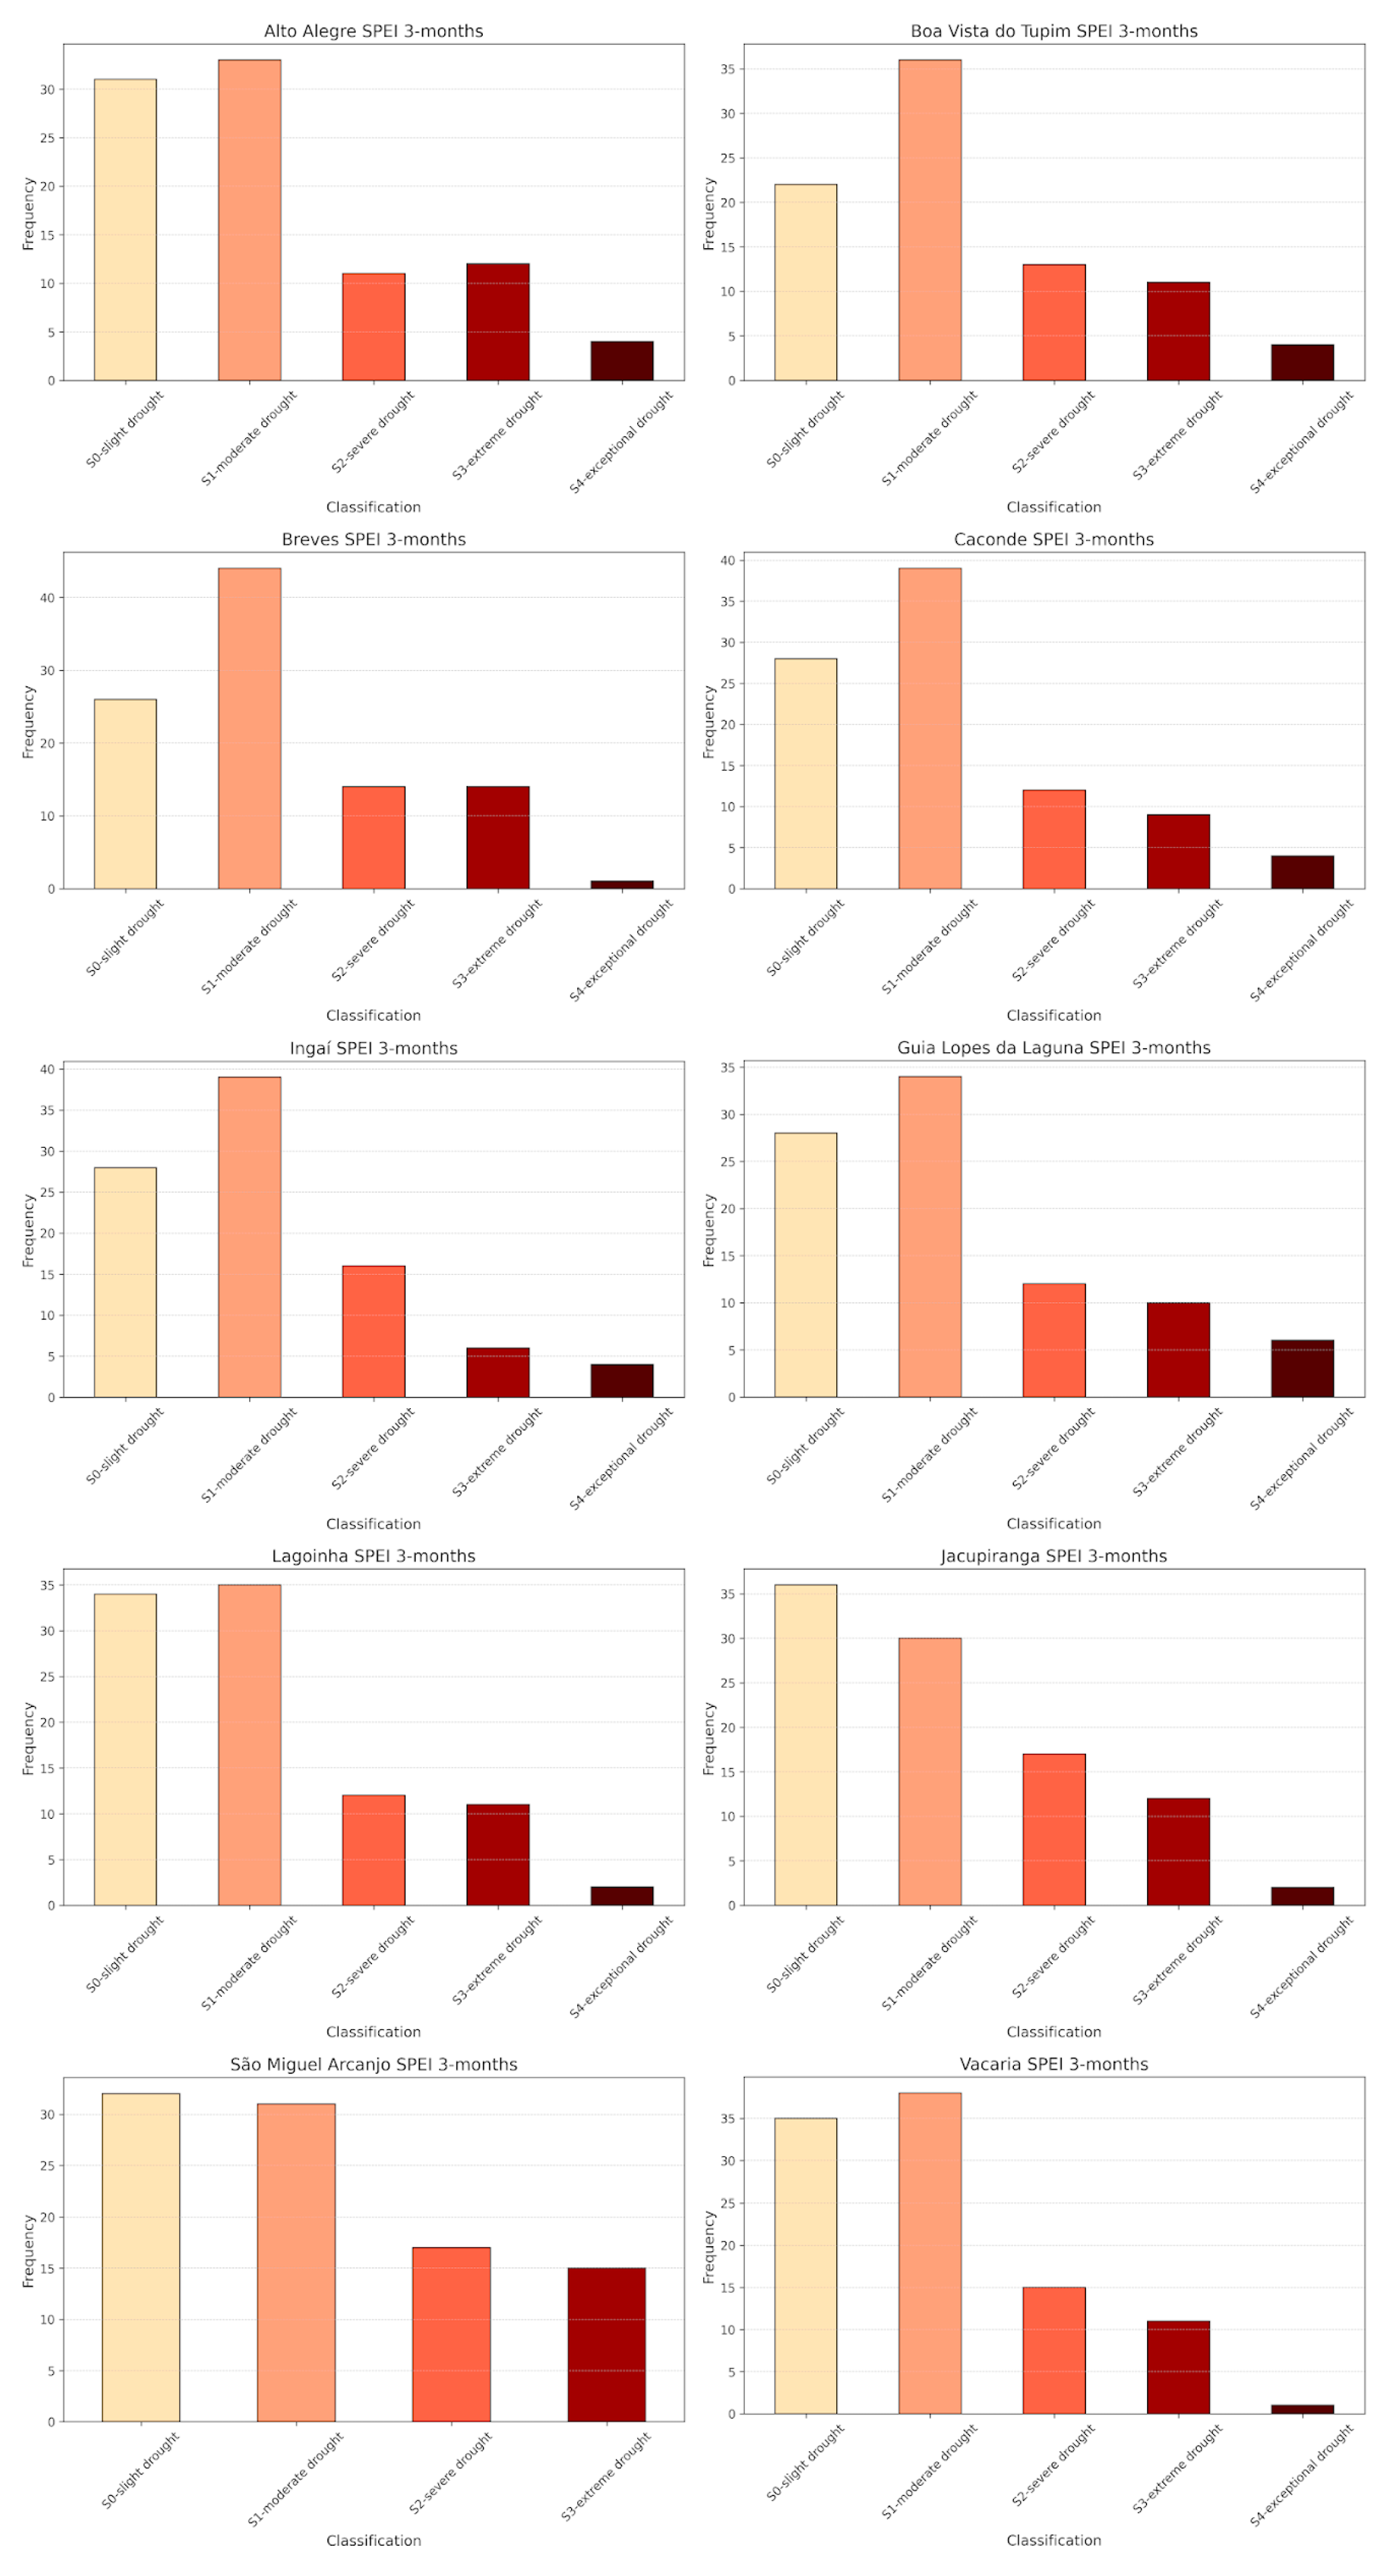
2.3. SPEI Intensity and Frequency
2.4. SPEI Tendency
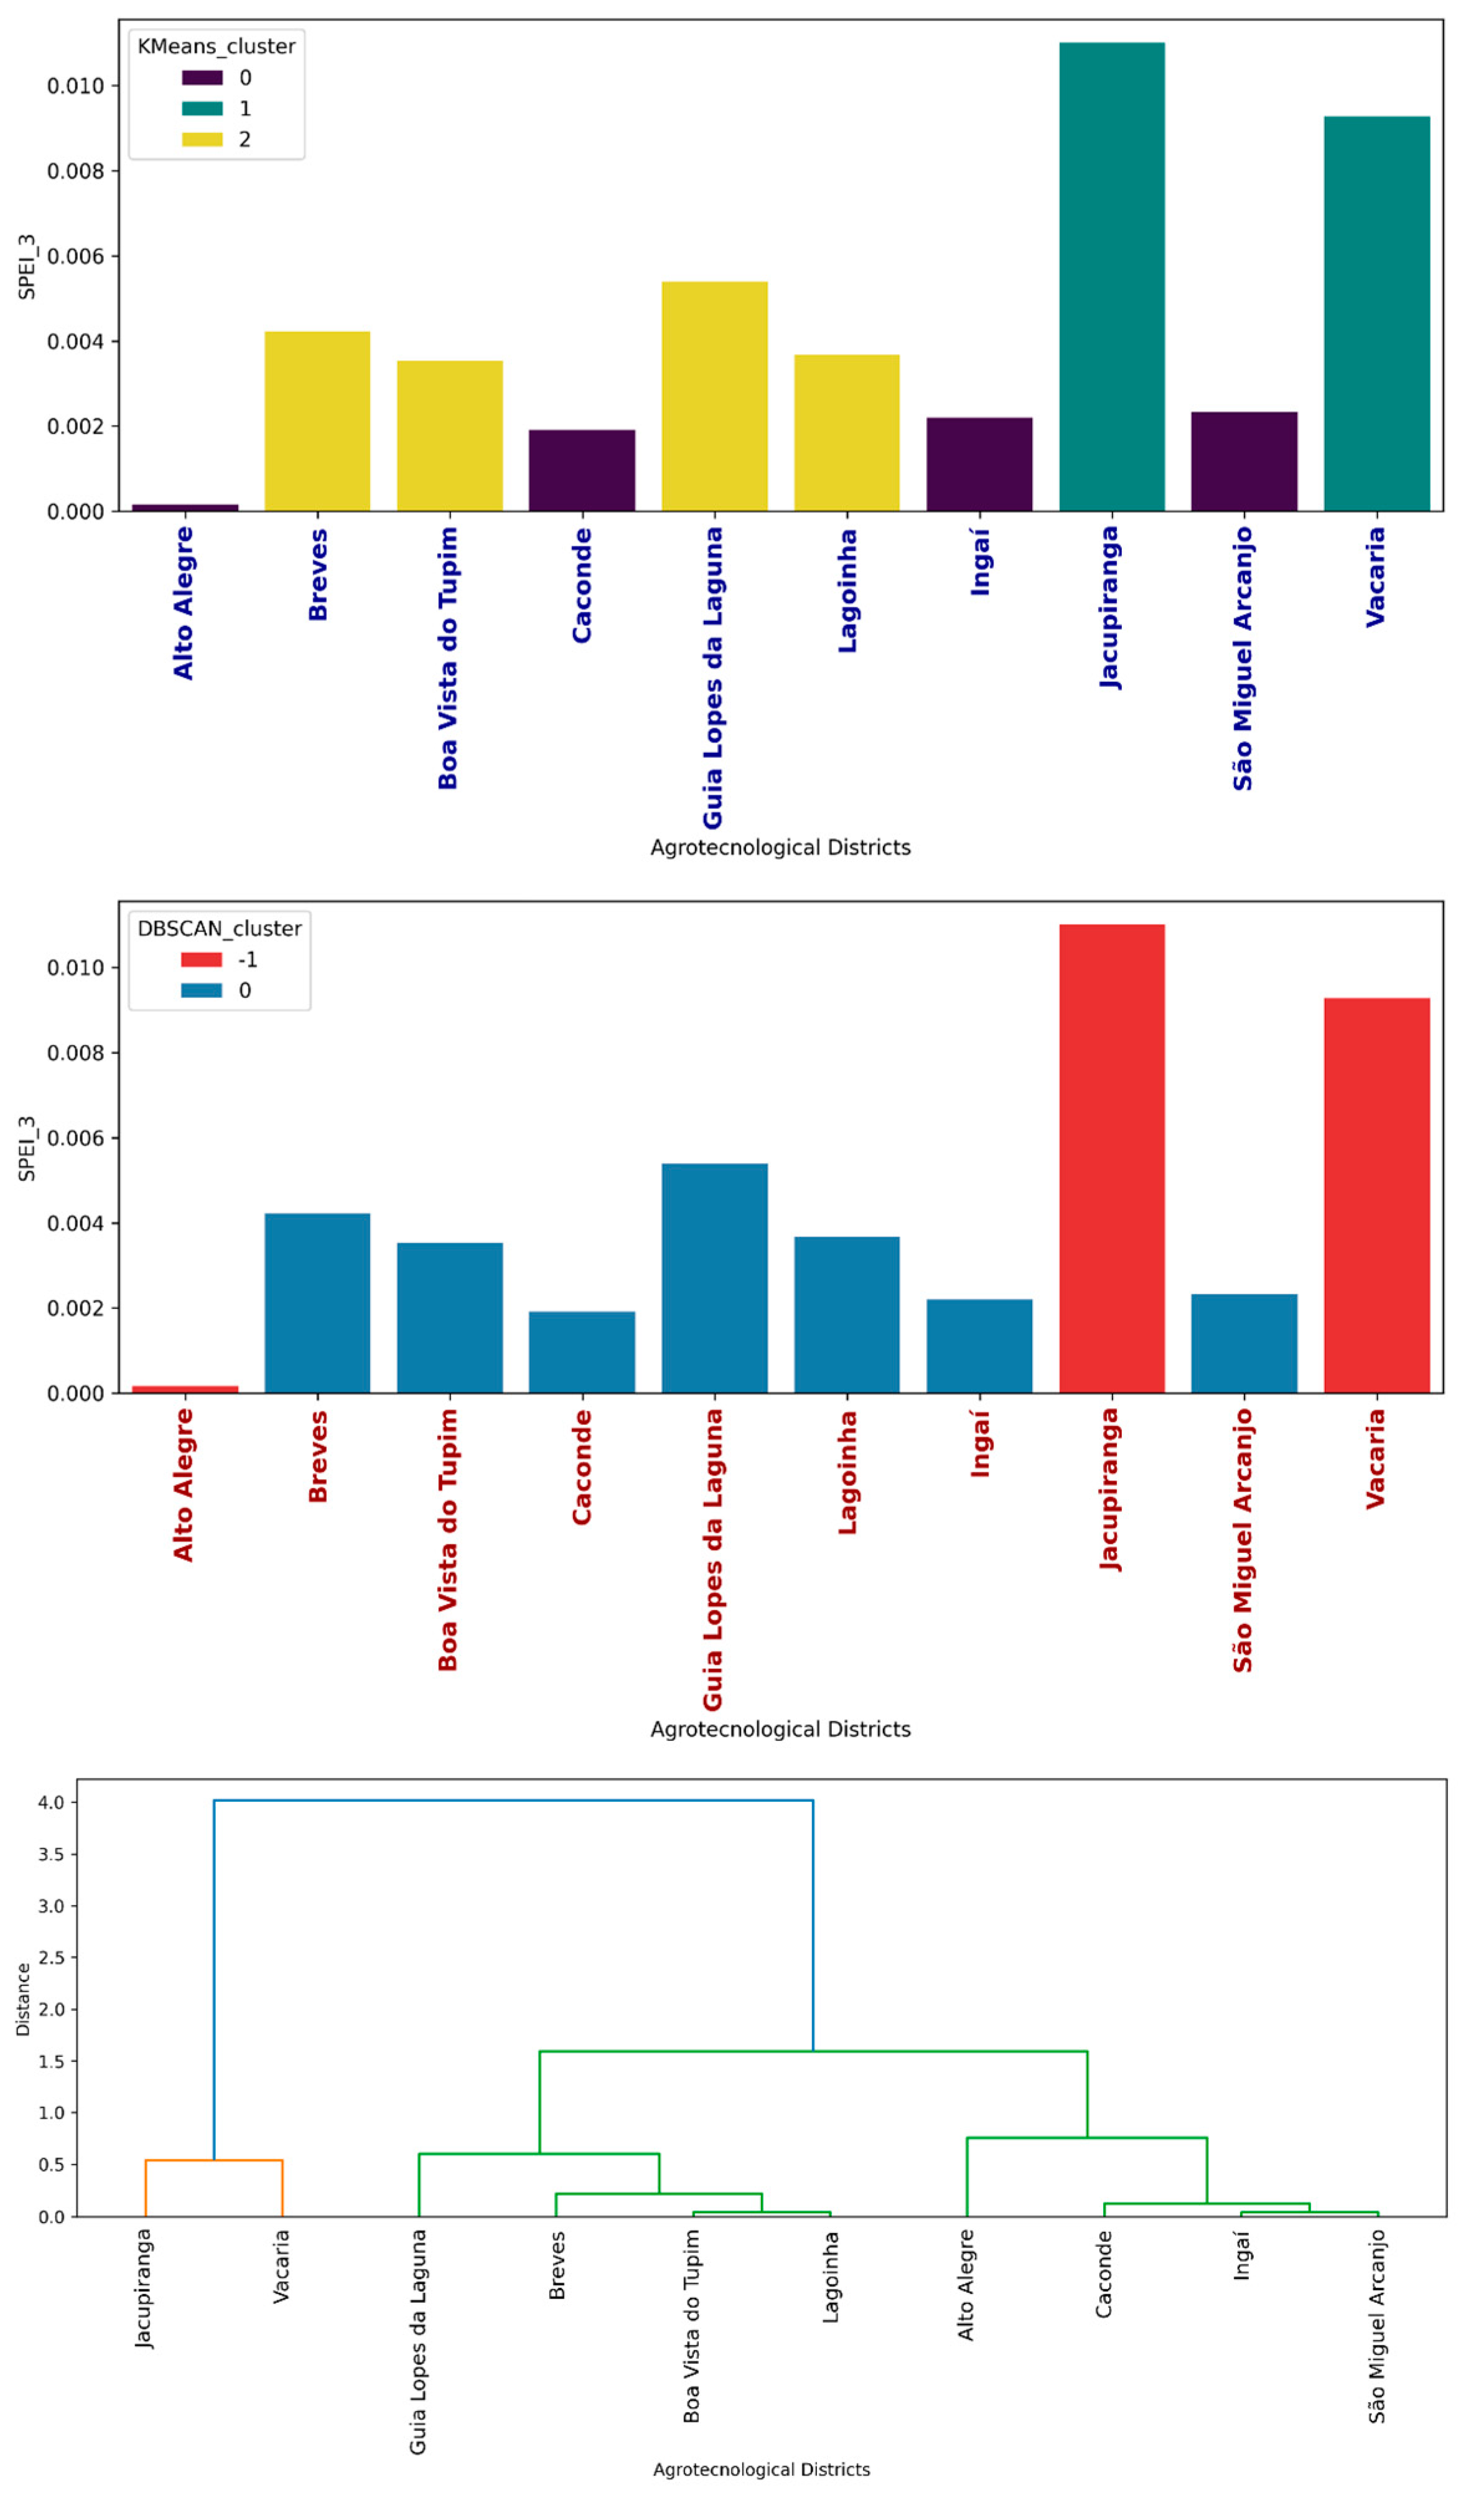
2.5. Clustering
- KMeans with the number of clusters fixed at 3 (three);
- Density-Based Spatial Clustering of Applications with Noise (DBSCAN) with the premises that points must be within a maximum distance of 0.5 to be considered neighbors, and a cluster must consist of at least 2 (two) points; and
- Dendrogram (Ward’s method) with the number of final groups set to 3 (three).
3. Results
3.1. Validation of Climate Data Derived from Remote Sensing
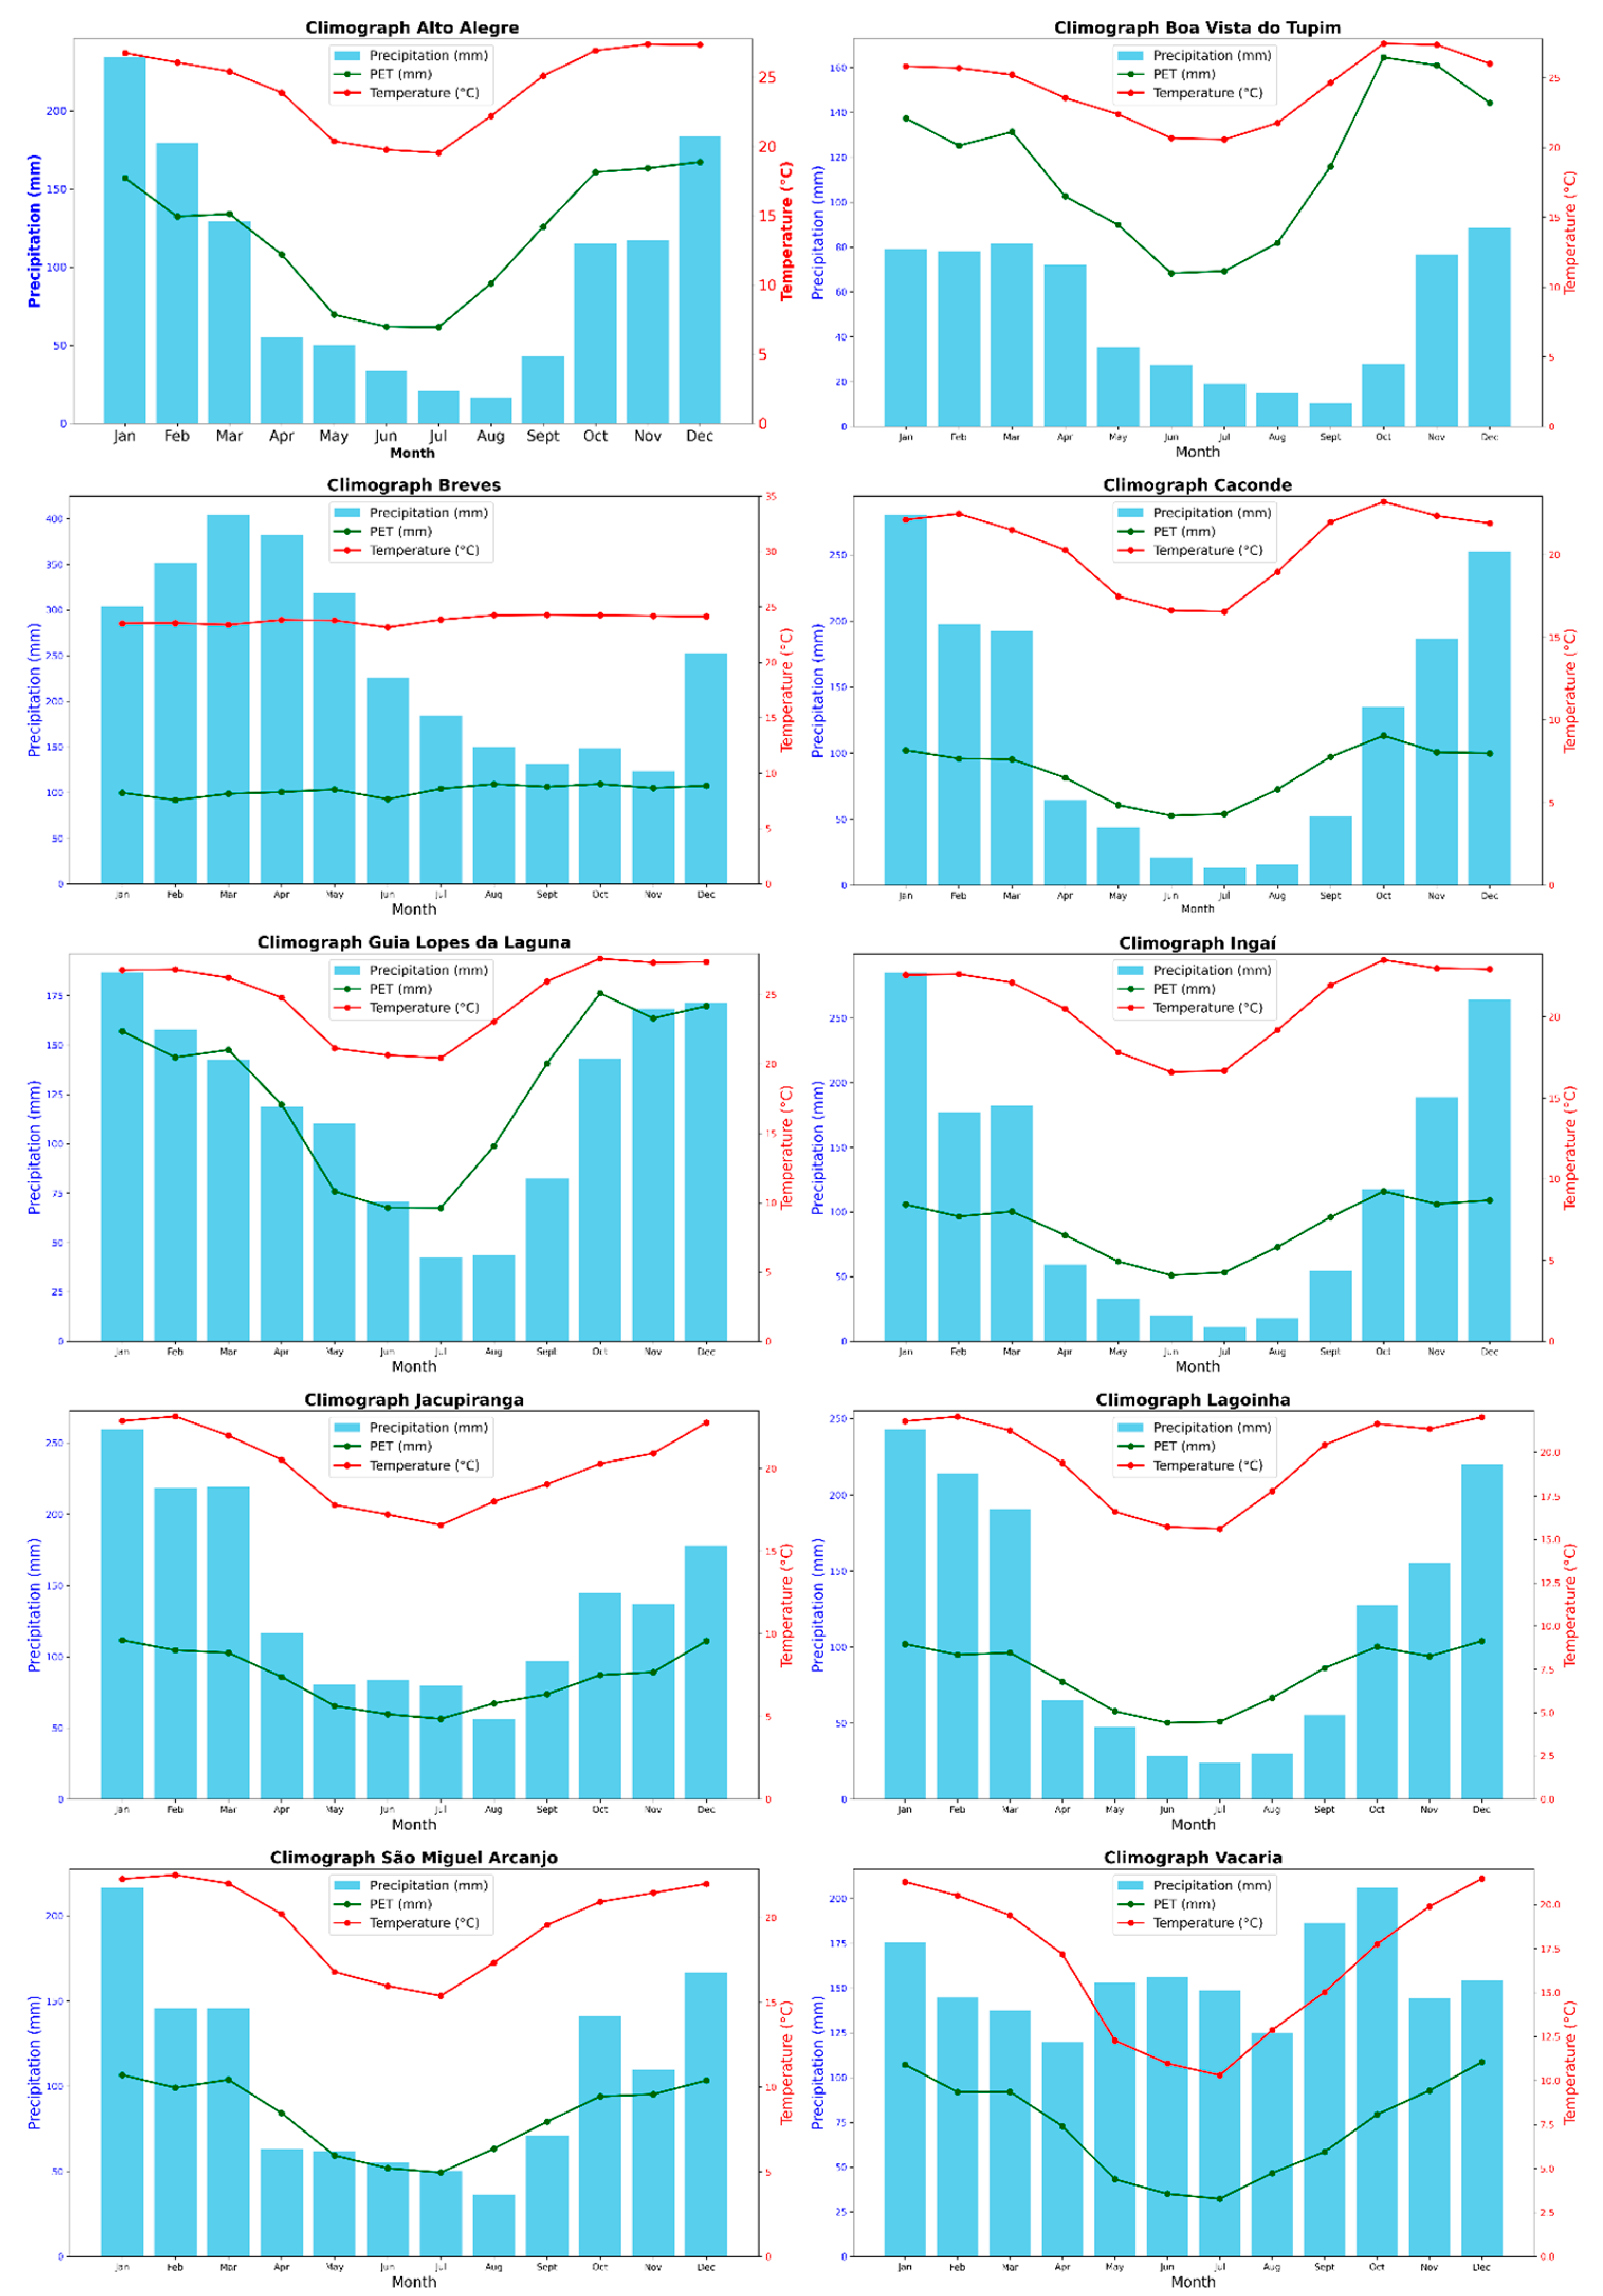
3.2. Climate
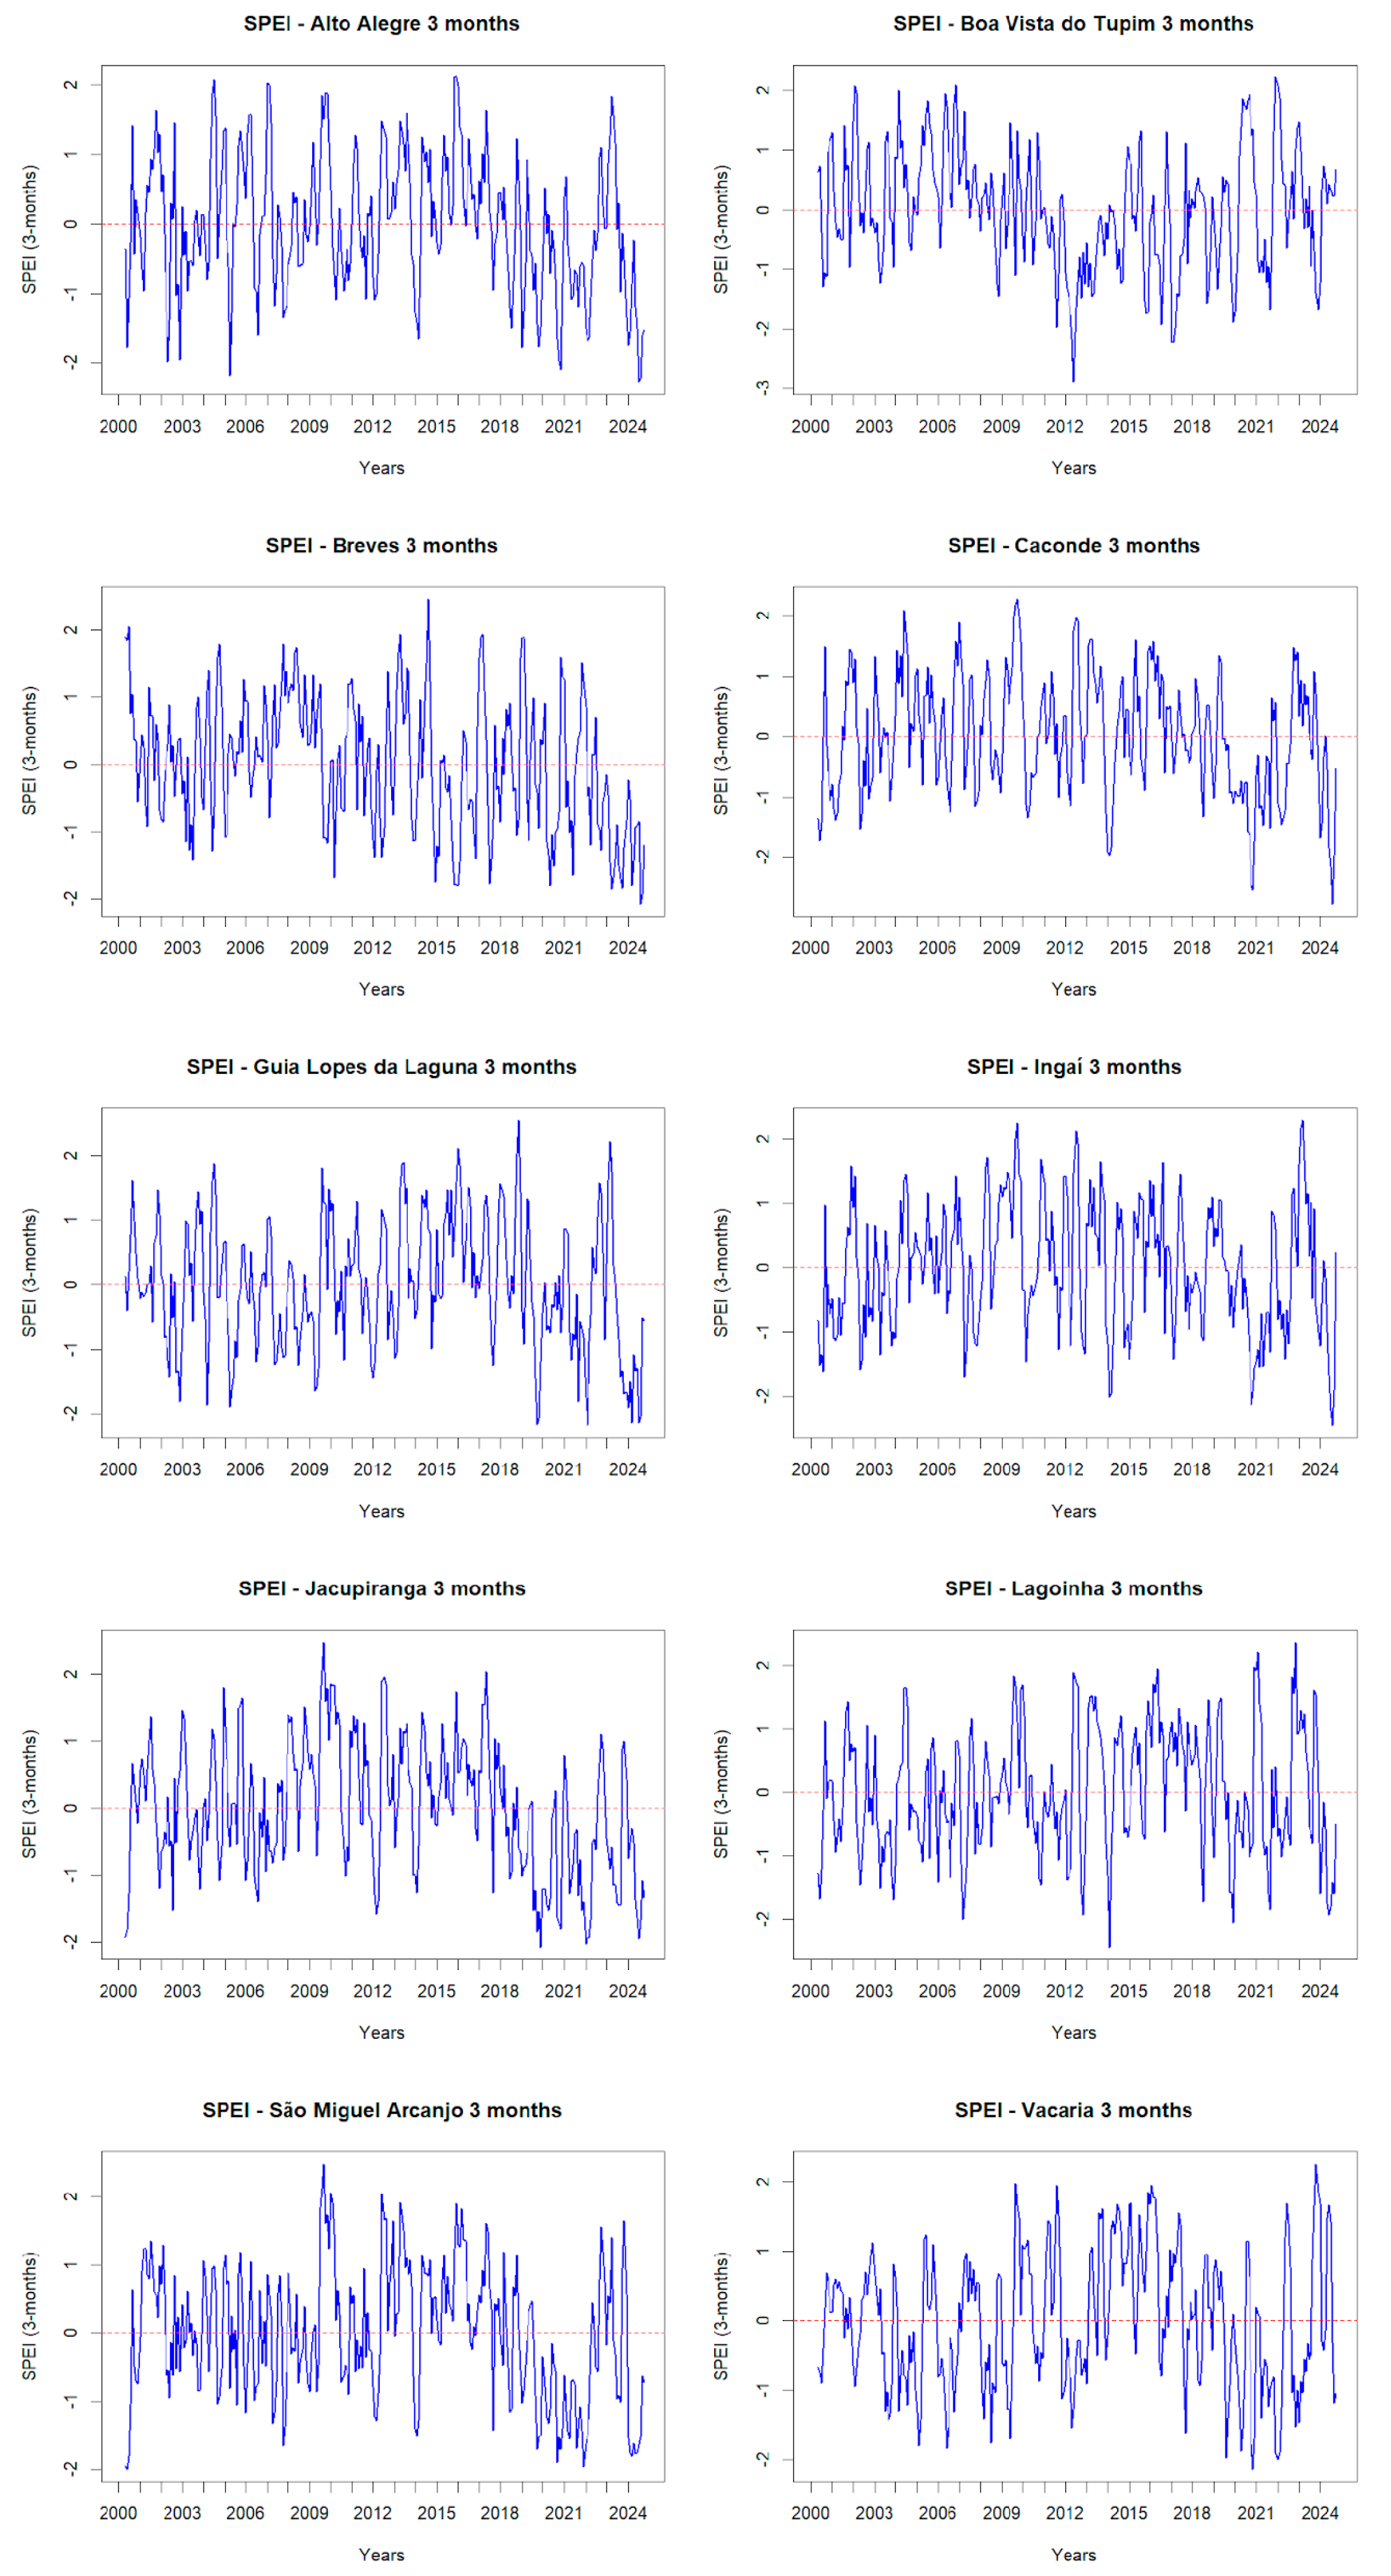
3.3. SPEI-3 Months
3.4. SPEI-3 Months Clusters
3.5. SPEI-6 Months
3.6. SPEI-6 Months Clusters
4. Discussion
5. Conclusions
Supplementary Materials
Author Contributions
Funding
Data Availability Statement
Acknowledgments
Conflicts of Interest
References
- Semear Digital. Available online: https://www.semear-digital.cnptia.embrapa.br/dats/ (accessed on 11 January 2025).
- Confederação Nacional de Municípios. Prejuízos da agropecuária nos últimos 10 anos; CNM: Brasília, Brasil, 2023. [Google Scholar]
- Van Ginkel, M.; Biradar, C. Drought Early Warning in Agri-Food Systems. Climate 2021, 9, 134. [Google Scholar] [CrossRef]
- Sass, K. S.; Konak, A.; Macedo, M. B. de; Benso, M. R.; Shrimpton, E.; Balta-Ozkan, N.; Sarmah, T.; Mendiondo, E. M.; Silva, G. J. da; Silva, P. G. C. da; Nardocci, A. C.; Jacobson, M. Enhancing drought resilience and vulnerability assessment in small farms: A global expert survey on multidimensional indicators. International Journal of Disaster Risk Reduction 2024, 110, 104616. [Google Scholar] [CrossRef]
- Intergovernmental Panel on Climate Change (IPCC). Central and South America. In Climate Change 2022—Impacts, Adaptation and Vulnerability: Working Group II Contribution to the Sixth Assessment Report of the Intergovernmental Panel on Climate Change; Cambridge University Press: Cambridge, UK, 2023; Volume 1, pp. 1689–1816. [Google Scholar] [CrossRef]
- Vicente-Serrano, S. M.; Beguería, S.; López-Moreno, J. I. A Multiscalar Drought Index Sensitive to Global Warming: The Standardized Precipitation Evapotranspiration Index. J. Climate 2010, 23, 1696–1718. [Google Scholar] [CrossRef]
- Khand, K.; Taghvaeian, S.; Gowda, P.; Paul, G. A Modeling Framework for Deriving Daily Time Series of Evapotranspiration Maps Using a Surface Energy Balance Model. Remote Sens. 2019, 11, 508. [Google Scholar] [CrossRef]
- Junior, A.L.P.; Biudes, M.S.; Machado, N.G.; Vourlitis, G.L.; Geli, H.M.E.; Santos, L.O.F.d.; Querino, C.A.S.; Ivo, I.O.; Neto, N.L. Assessment of Remote Sensing and Re-Analysis Estimates of Regional Precipitation over Mato Grosso, Brazil. Water 2021, 13, 333. [Google Scholar] [CrossRef]
- Li, Z.-L.; Wu, H.; Duan, S.-B.; Zhao, W.; Ren, H.; Liu, X.-Y.; Leng, P.; Tang, R.; Ye, X.; Zhu, J.; Sun, Y.; Si, M.; Liu, M.Z.; Li, J; Zhang, X.; Shang, G.; Tang, B.; Yan, G.; Zhou, C. Satellite Remote Sensing of Global Land Surface Temperature: Definition, Methods, Products, and Applications. Reviews of Geophysics 2023, 61, e2022RG000777. [Google Scholar] [CrossRef]
- Alvares, C. A.; Stape, J. L.; Sentelhas, P. C.; de Moraes Gonçalves, J. L.; Sparovek, G. Köppen’s Climate Classification Map for Brazil. Meteorologische Zeitschrift 2013, 22, 711–728. [Google Scholar] [CrossRef]
- European Union, Copernicus Land Monitoring Service. (2024). Copernicus Digital Elevation Model GLO-30. Available online: https://dataspace.copernicus.eu/ (accessed on 12 December 2024).
- Agritempo. Available online: https://www.agritempo.gov.br/br/sobre-nos/ (accessed on 10 December 2024).
- Wan, Z.; Hook, S.; Hulley, G. MOD11A1 MODIS/Terra Land Surface Temperature/Emissivity Daily L3 Global 1 km SIN Grid V061 [Data set]. NASA EOSDIS Land Processes DAAC. 2015. Available online: https://developers.google.com/earth-engine/datasets/catalog/MODIS_061_MOD11A1#dois (accessed on 12 December 2024). [CrossRef]
- Funk, C.; Peterson, P.; Landsfeld, M.; Pedreros, D.; Verdin, J.; Shukla, S.; Husak, G.; Rowland, J.; Harrison, L.; Hoell, A.; Michaelsen, J. The Climate Hazards Infrared Precipitation with Stations—a New Environmental Record for Monitoring Extremes. Scientific Data 2015, 2, 150066. [Google Scholar] [CrossRef] [PubMed]
- Monitor de Secas do Brasil. Available online: https://monitordesecas.ana.gov.br/tabela-de-classificacao (accessed on 10 December 2024).
- Jiménez-Muñoz, J. C.; Sobrino, J. A.; Mattar, C.; Malhi, Y. Spatial and Temporal Patterns of the Recent Warming of the Amazon Forest. J. Geophys. Res. Atmos. 2013, 118, 5204–5215. [Google Scholar] [CrossRef]
- Paredes-Trejo, F. J.; Barbosa, H. A.; Lakshmi Kumar, T. V. Validating CHIRPS-Based Satellite Precipitation Estimates in Northeast Brazil. Journal of Arid Environments 2017, 139, 26–40. [Google Scholar] [CrossRef]
- Caparoci Nogueira, S.; Moreira, M.; Lordelo Volpato, M. Evaluating Precipitation Estimates from Eta, TRMM and CHRIPS Data in the South-Southeast Region of Minas Gerais State—Brazil. Remote Sens. 2018, 10, 313. [Google Scholar] [CrossRef]
- de Oliveira-Júnior, J. F.; da Silva Junior, C.A.; Teodoro, P. E.; Rossi, F. S.; Blanco, C. J. C.; Lima, M.; de Gois, G.; Correia Filho, W. L. F.; Santiago, D. de B.; Vanderley, M. H. G. dos S. Confronting CHIRPS Dataset and in Situ Stations in the Detection of Wet and Drought Conditions in the Brazilian Midwest. Int J Climatol. 2021, 41, 4478–4493. [Google Scholar] [CrossRef]
- Cunha, A. P. M. A.; Zeri, M.; Deusdará Leal, K.; Costa, L.; Cuartas, L. A.; Marengo, J. A.; Tomasella, J.; Vieira, R. M.; Barbosa, A. A.; Cunningham, C.; Cal Garcia, J. V.; Broedel, E.; Alvalá, R.; Ribeiro-Neto, G. Extreme Drought Events over Brazil from 2011 to 2019. Atmosphere 2019, 10, 642. [Google Scholar] [CrossRef]
- G1. Available online: https://g1.globo.com/sp/sao-carlos-regiao/noticia/2020/10/09/falta-de-chuva-e-baixa-umidade-do-ar-devem-causar-prejuizo-a-safra-do-cafe-em-caconde.ghtml (accessed on 10 December 2024).
- AP News. Available online: https://apnews.com/article/brazil-climate-change-drought-coffee-harvest-a6516a4b314e6ba7c11513c08afb6996 (accessed on 10 December 2024).
- Marengo, J. A.; Espinoza, J. C. Extreme Seasonal Droughts and Floods in Amazonia: Causes, Trends and Impacts. Int. J. Climatol. 2016, 36, 1033–1050. [Google Scholar] [CrossRef]

| ID | Category | SPEI | Probably Impacts |
|---|---|---|---|
| S0 | Slight drought | -0.5 to -0.79 | Reduced planting, decrease in crops and pasture growth. |
| S1 | Moderate drought | -0.8 to -1.29 | Some damage to crops and pastures; streams, reservoirs, or wells at low levels; developing or imminent water shortages; voluntary water use restrictions requested. |
| S2 | Severe drought | -1.3 to -1.59 | Crop or pasture losses likely; water shortages common; mandatory water restrictions imposed. |
| S3 | Extreme drought | -1.6 to -1.99 | Major crop and pasture losses; widespread water shortages; strict water restrictions enforced. |
| S4 | Exceptional drought | <-2 | Exceptional and widespread crop and pasture losses; severe water shortages in reservoirs, streams, and wells, creating emergency situations. |
| Agrotechnological Districts | Z | P-Value | Trend | Sen’s Slope |
|---|---|---|---|---|
| Alto Alegre | -2.8279 | 0.0046 | Decreasing | -0.0020 |
| Boa Vista do Tupim | -2.5110 | 0.0120 | Decreasing | -0.0018 |
| Breves | -5.2855 | 0.0000 | Decreasing | -0.0038 |
| Caconde | -2.6451 | 0.0082 | Decreasing | -0.0020 |
| Guia Lopes da Laguna | -1.0637 | 0.2874 | No trend | -0.0008 |
| Ingaí | -0.7076 | 0.4792 | No trend | -0.0005 |
| Jacupiranga | -4.0282 | 0.0001 | Decreasing | -0.0029 |
| Lagoinha | 1.486 | 0.137 | No trend | 0.001 |
| São Miguel Arcanjo | -3.1877 | 0.0014 | Decreasing | -0.0024 |
| Vacaria | 0.3562 | 0.7217 | No trend | 0.0003 |
| Agrotechnological Districts | Z | P-Value | Trend | Sen’s Slope |
|---|---|---|---|---|
| Alto Alegre | -3.4757 | 0.0005 | Decreasing | -0.0027 |
| Boa Vista do Tupim | -3.9556 | 0.0001 | Decreasing | -0.0029 |
| Breves | -5.6072 | 0.0000 | Decreasing | -0.0040 |
| Caconde | -3.2431 | 0.0012 | Decreasing | -0.0025 |
| Guia Lopes da Laguna | -0.1459 | 0.8840 | No trend | -0.0001 |
| Ingaí | -0.8403 | 0.4007 | No trend | -0.0006 |
| Jacupiranga | -5.1334 | 0.0000 | Decreasing | -0.0037 |
| Lagoinha | 3.3443 | 0.0008 | Increasing | 0.0026 |
| São Miguel Arcanjo | -4.4920 | 0.0000 | Decreasing | -0.0035 |
| Vacaria | 0.7173 | 0.4732 | No trend | 0.0005 |
Disclaimer/Publisher’s Note: The statements, opinions and data contained in all publications are solely those of the individual author(s) and contributor(s) and not of MDPI and/or the editor(s). MDPI and/or the editor(s) disclaim responsibility for any injury to people or property resulting from any ideas, methods, instructions or products referred to in the content. |
© 2025 by the authors. Licensee MDPI, Basel, Switzerland. This article is an open access article distributed under the terms and conditions of the Creative Commons Attribution (CC BY) license (https://creativecommons.org/licenses/by/4.0/).