1. Introduction
Seafood plays a vital role in global food security, offering essential nutrients and supporting the livelihoods of millions worldwide [
1,
2]. Unlike agricultural products, fisheries possess the unique capacity for self-renewal through natural marine ecosystem processes [
3]. Despite this advantage, the seafood supply chain is increasingly challenged by factors such as the COVID-19 pandemic, geopolitical conflicts, rising energy costs, and the effects of climate change. These issues highlight the pressing need for sustainable production and consumption practices [
4,
5].
International trade has emerged as a key mechanism for efficiently distributing seafood worldwide. By facilitating access to diverse seafood products, trade allows countries to overcome the limitations of their natural resource endowments. Moreover, trade has the potential to alleviate pressure on individual nations to overexploit their fisheries, contributing to more sustainable global resource management [
6,
7,
8]. However, the relationship between trade openness and sustainable seafood consumption is complex, with ongoing debates about its benefits and challenges [
9,
10].
This study explores the relationship between trade openness and the Human Trophic Level (HTL) in the context of seafood consumption. The central hypothesis suggests that greater trade openness improves access to a wider variety of seafood products, potentially increasing the seafood-specific HTL at the national level. The findings aim to offer valuable insights into the role of trade in shaping sustainable seafood consumption patterns on a global scale.
2. Literature Review
The role of international seafood trade in global resource distribution has been widely explored in existing literature. According to the World Bank, international trade enhances seafood supply chains by addressing regional imbalances, improving market access, stabilizing prices, and ensuring consistent availability of seafood products [
11]. However, studies have identified inequalities in seafood distribution, with developing nations often exporting high-quality seafood while importing lower-quality products [
6,
12]. Watson et al. (2017) further explained this pattern as a strategy aimed at promoting economic growth and food security in developing countries, where high-value seafood is exported, and low-value seafood is imported [
26].
The relationship between trade liberalization and fisheries sustainability is highly dependent on governance and management frameworks. In regions with weak governance structures, trade liberalization can exacerbate overfishing, depleting fish stocks and reducing resource renewability over time. Increased trade elasticity has been linked to declines in overall fish catches, reflecting unsustainable exploitation of resources. However, research by Erhardt et al. (2018) suggests that trade openness can lead to resource stock recovery in countries with weaker governance, while the impact on well-governed nations remains minimal. Sustainable fisheries management requires an integration of trade policies with domestic governance, production methods, and socio-economic factors. Institutions like the World Trade Organization (WTO) are critical in establishing trade rules that incorporate sustainability standards, ensuring a balance between economic benefits and conservation efforts [
11,
27,
28].
Trophic levels have emerged as an important concept in understanding energy flow within ecosystems and evaluating the impact of fisheries on marine biodiversity. Bonhommeau et al. (2013) introduced the calculation of HTL using Food Balance Sheet data, revealing a 3% global increase in HTL from 1961 to 2009 [
16]. This increase was largely attributed to higher meat and fat consumption and showed significant variation across countries, correlating with GDP, life expectancy, and urbanization. Pérez-Martínez et al. (2023) identified a negative correlation between HTL and digitalization, suggesting that highly digitized nations tend to rely more on animal-based diets [
29].
Further exploration by Zhao et al. (2024) examined the Human Aquatic Trophic Level (HATL), focusing on the influence of international seafood trade on global consumption patterns. Unlike the increasing trend in HTL, HATL declined from 3.42 in 1976 to 3.18 in 2019, primarily due to the expansion of aquaculture production favoring low-trophic-level species. Their findings emphasized the role of international trade in increasing the availability and trophic level of aquatic foods in over 60% of countries, contributing to discussions on sustainable fisheries [
17]. Shannon et al. (2014) proposed trophic-level-based indicators to assess the impact of fishing on marine ecosystems, while Gascuel et al. (2011) developed ecosystem modeling frameworks incorporating trophic levels to evaluate fishing pressures [
18,
19]. Branch et al. (2010) observed stable mean trophic levels of fish catches but highlighted significant shifts in species composition with ecosystem-wide implications [
20]. Smith et al. (2011) analyzed the effects of fishing on low-trophic-level species and advocated for sustainable management strategies, while Couvet et al. (2014) interpreted declines in trophic levels as indicators of predator loss and ecosystem overexploitation [
21,
30].
Studies have also focused on regional and historical changes in trophic levels. Pinnegar et al. (2002) analyzed long-term trophic level changes in the Celtic Sea fish community, linking them to socio-economic factors and market price distributions [
22]. Similarly, Pasquaud et al. (2010) used stable isotope analysis to determine trophic levels in estuarine systems, accounting for variability across size classes [
23].
The role of aquaculture in shaping trophic levels has gained attention in recent years. Tacon et al. (2009) explored the shift toward the production of low-trophic-level species in aquaculture, emphasizing its potential to reduce pressure on wild fisheries [
20]. Cottrell et al. (2021) called for a reassessment of trophic-level metrics in aquaculture policy to better align with ecosystem sustainability objectives [
25]. Together, these studies provide a comprehensive understanding of the interplay between trade, trophic levels, and fisheries sustainability, highlighting the importance of integrating ecological, economic, and governance considerations in global seafood management
3. Evolution of HTLs
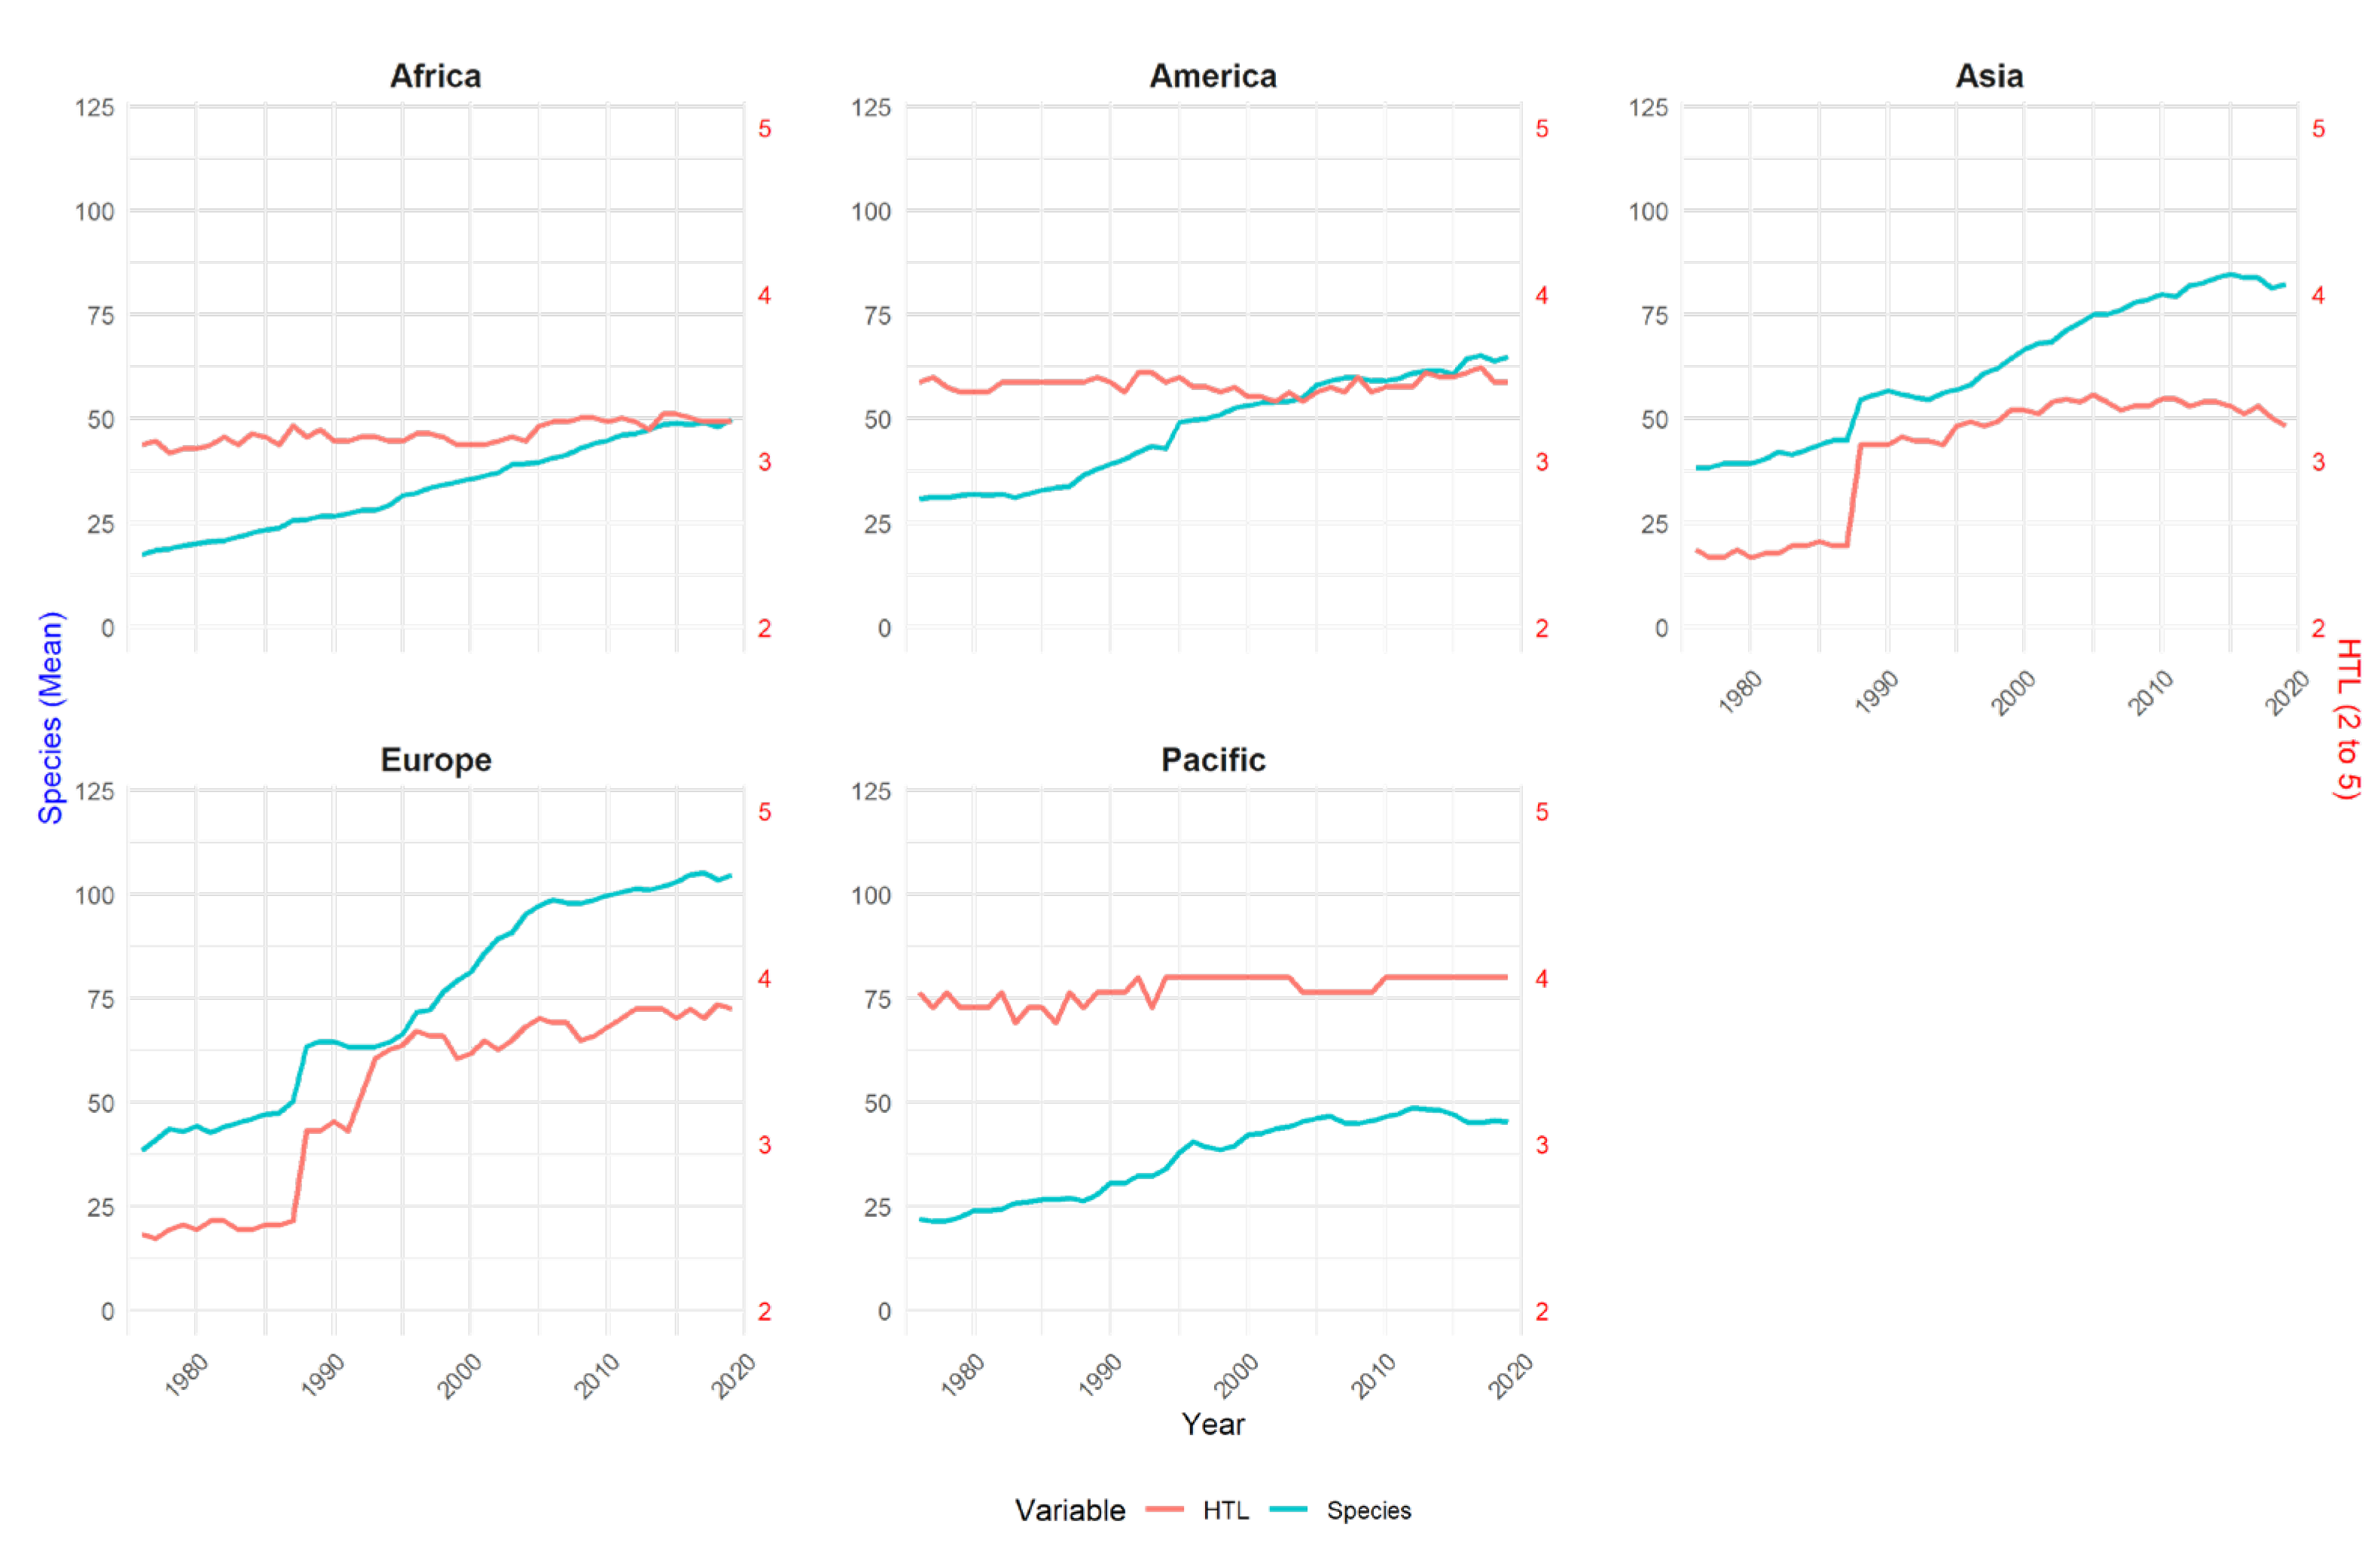
Figure 1 depicts the long-term trends in HTL alongside the composition of fish species in numerical terms. These trends reveal significant regional variations, driven by differences in economic development, cultural preferences, and resource availability. For example, Africa and Asia prioritize expanding species availability through aquaculture to address challenges related to population growth and food security. Conversely, Europe and the Pacific focus on consuming high-trophic-level species, influenced by economic affluence and traditional dietary practices. The Americas, particularly North America, exhibit a balanced trajectory that combines species diversification with moderate HTL growth.
In particular, the increase in specific resource availability has driven the HTL in Asian and European countries. These variations underscore the influence of socioeconomic and geographic factors in shaping regional seafood consumption patterns.
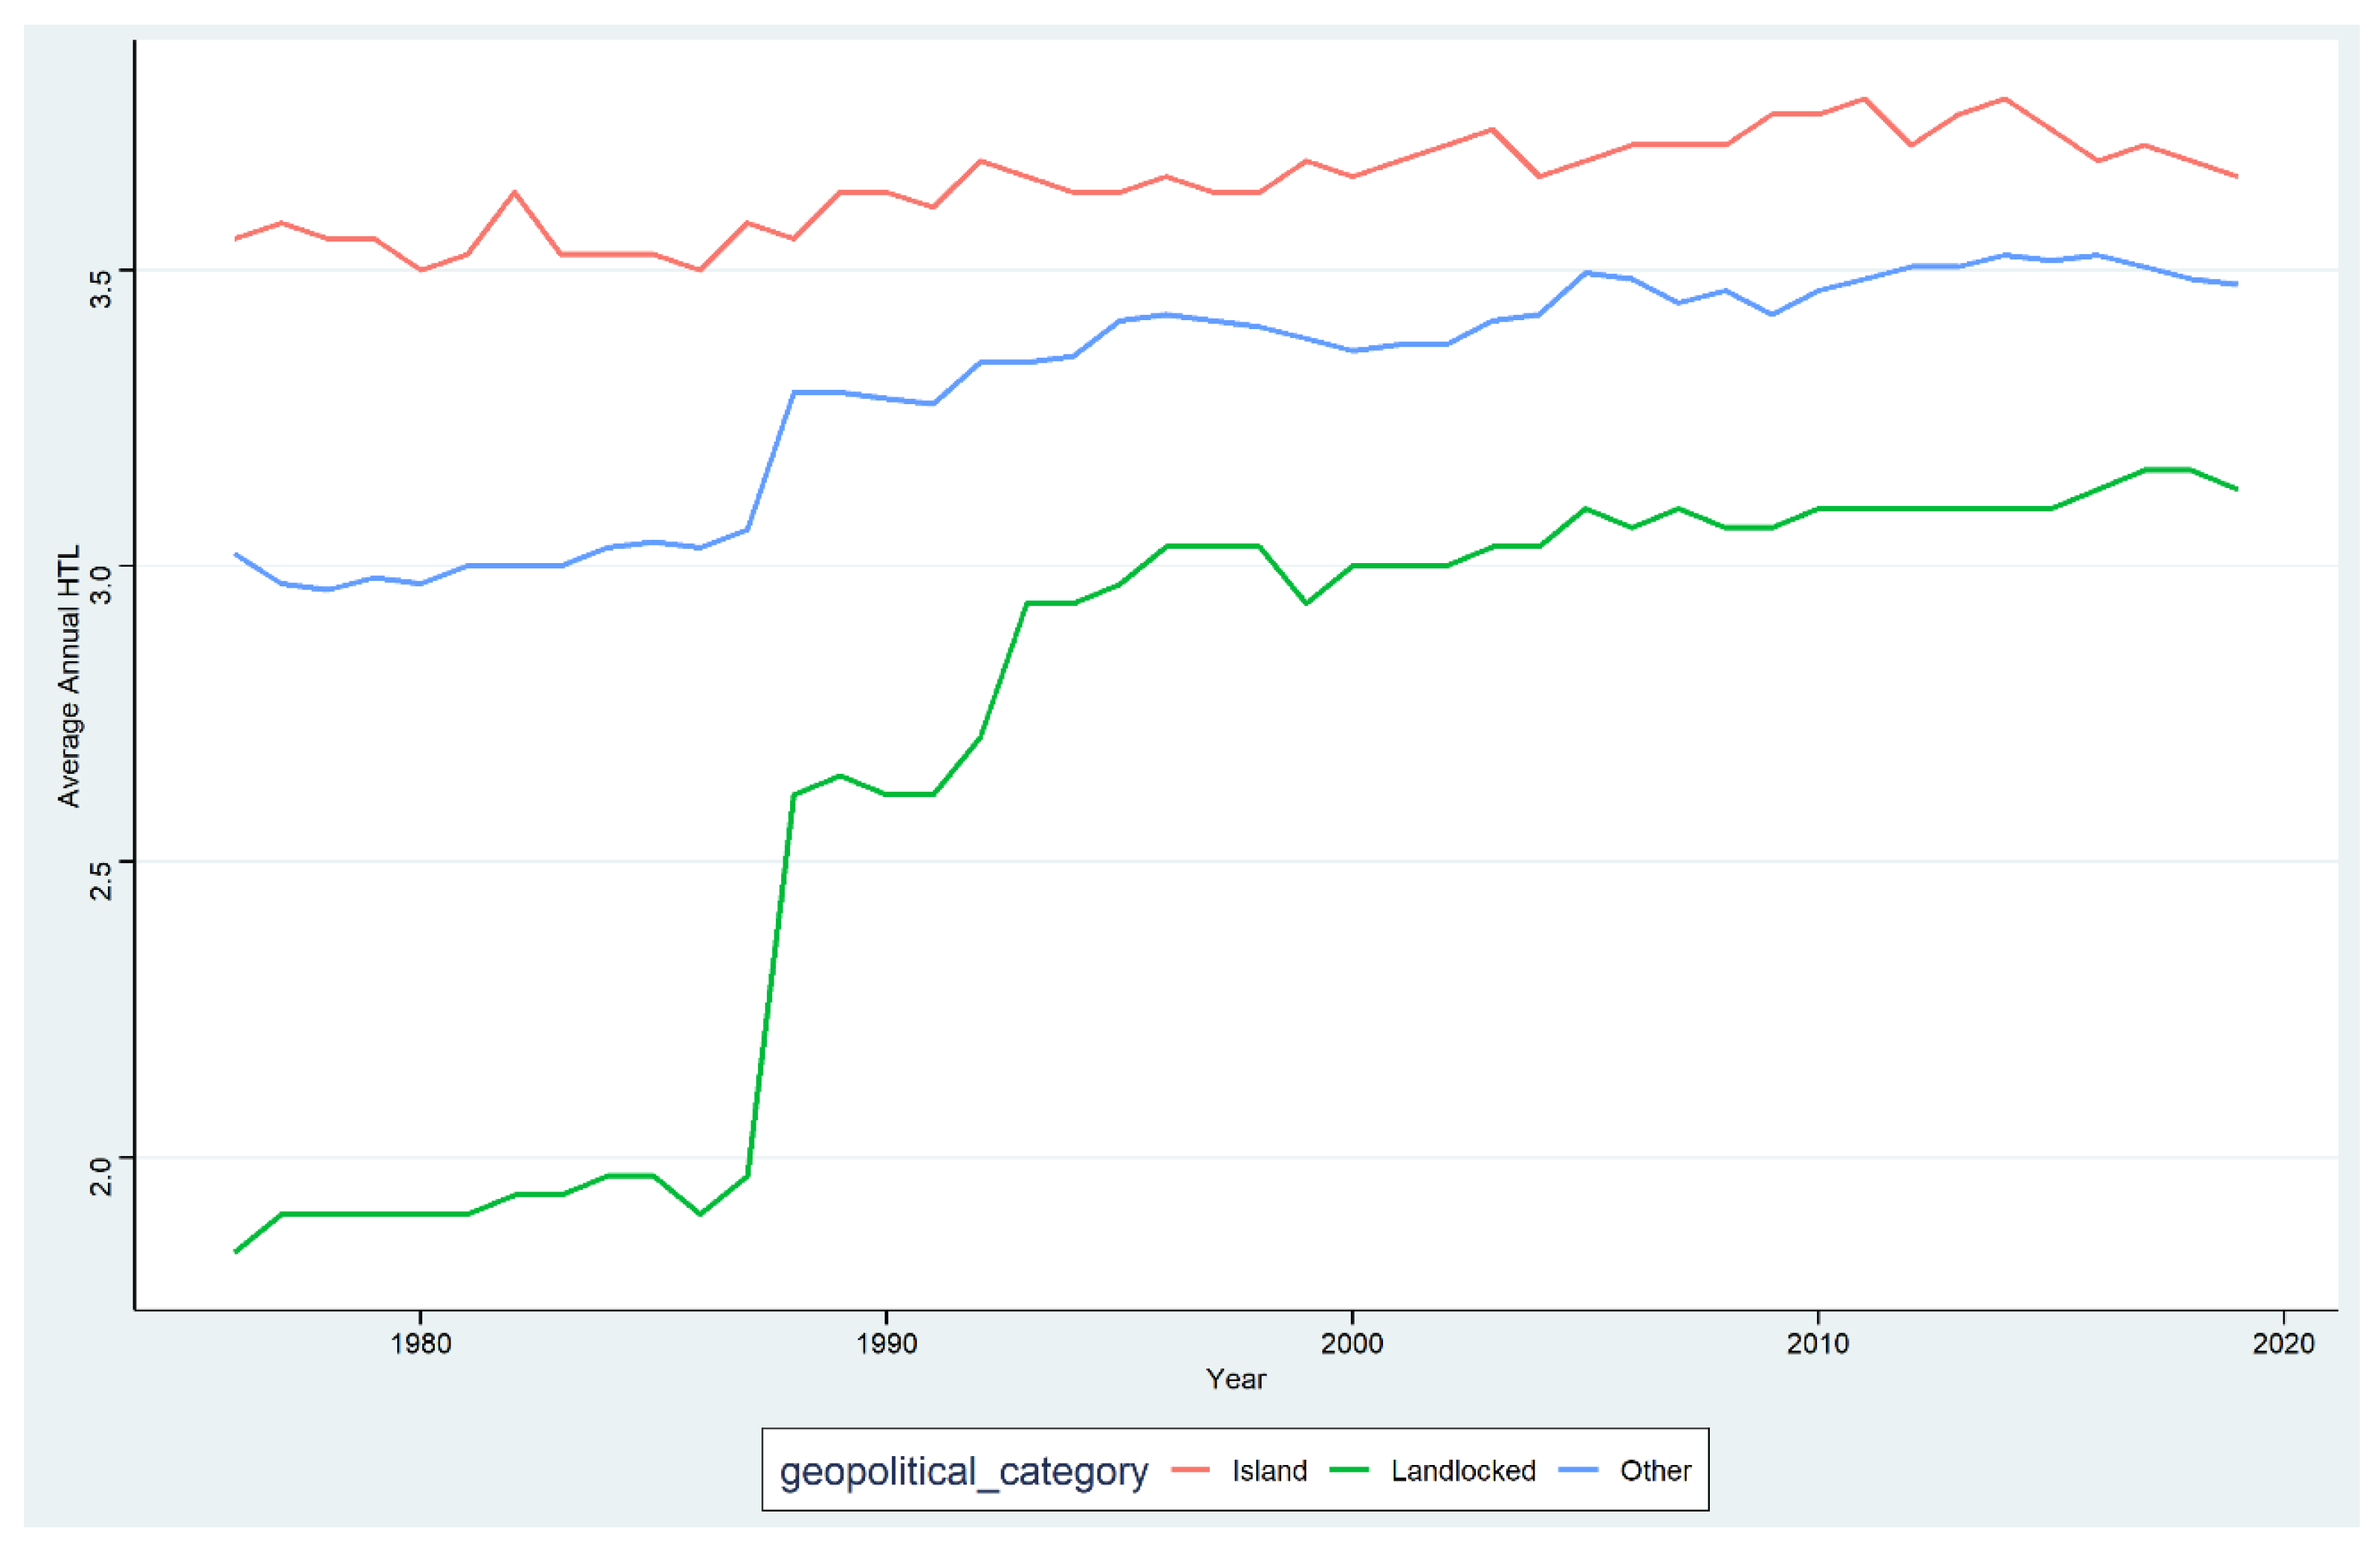
As illustrated in
Figure 2, HTL trends based on geographic characteristics underscore the pivotal role of access to marine resources in shaping seafood consumption patterns. Island nations, with their proximity to marine ecosystems, exhibit the highest HTL levels, whereas landlocked regions fall behind due to inherent geographic limitations. Other regions display intermediate trends, which reflect a combination of ecological factors and trade-based influences.
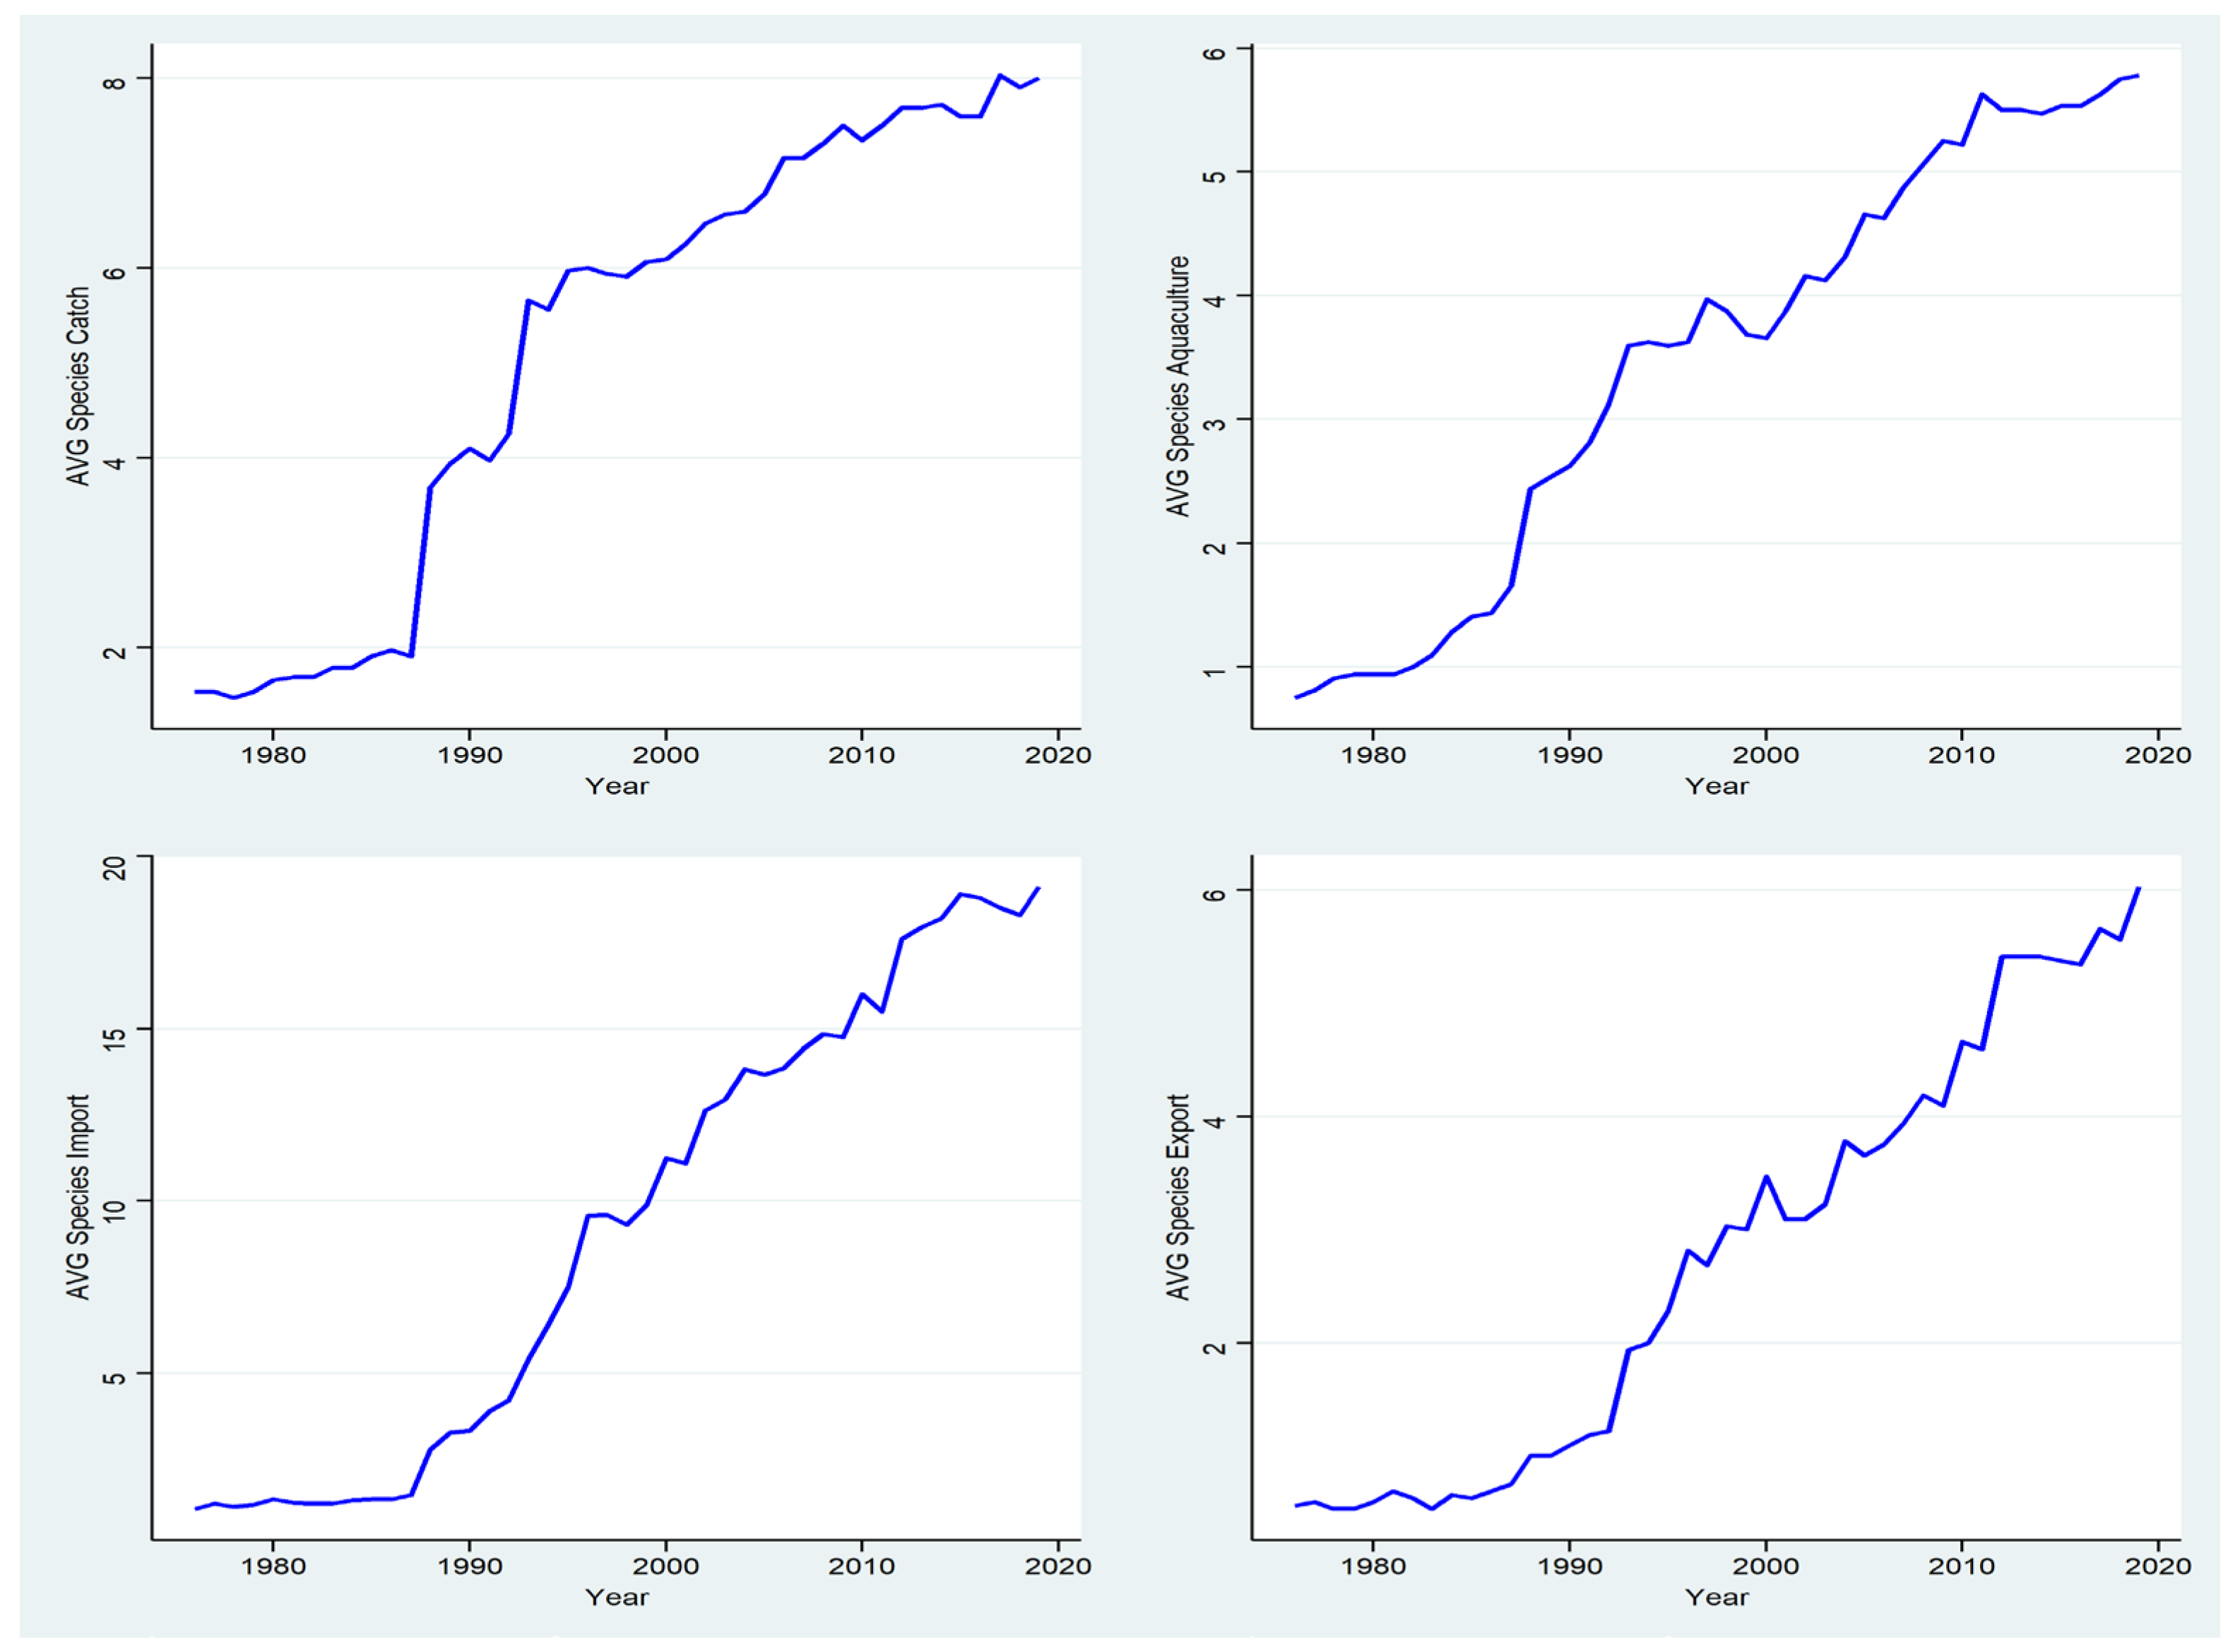
In particular, Figure 3 highlights that resource accessibility significantly impacts HTL changes in landlocked countries.
4. Model Specification and Data
4.1. Model Specification
This study examines the determinants of the Human Tropic Level (HTL) by employing a panel data model, incorporating variables such as trade openness, the number of accessible fishery species, and income levels. The model is formalized as follows:
where
represents the
for country
at time
,
is a vector of explanatory variables including trade openness, the number of accessible fishery species, and income indicators [
17]. The term
captures unobserved, time-invariant country-specific effects, such as geographic or institutional characteristics and
denotes idiosyncratic errors that vary across entities and over time.
To address potential correlation between the unobserved effect,
and the explanatory variables,
, a fixed effects model (FEM) is employed. The FEM eliminates the unobserved individual-specific effects through a within-transformation:
where
and
are the time averages of
and
for country
, respectively. This transformation ensures unbiased coefficient estimates by eliminating time-invariant, country-specific effects,
[
31,
32,
33,
34]. The appropriateness of the fixed effects approach was confirmed using the Hausman Test. The null hypothesis assumes that the Random Effects Model (REM) is consistent and efficient, while the alternative hypothesis supports the FEM as more appropriate [
35]. The Hausman test results rejected the null hypothesis, validating the use of the fixed effects approach for this study.
4.2. Data Description
A balanced panel dataset spanning 1990–2019 was constructed for 168 countries to investigate the relationship between HTL and its determinants. The temporal scope is delimited to data spanning up to 2019, despite the availability of the 2021 dataset. This methodological decision stems from two primary considerations. First, the research consistently applies the mass balance principle as proposed by Zhao et al. (2024), which necessitate adherence to the 2019 dataset. Second, excluding the Covid-19 period is inevitable to mitigate potential structural disruptions that could significantly compromise the statistical validity and reliability of the quantitative modeling. By deliberately omitting data from the pandemic period, the study aims to preserve the integrity of the long-term trend analysis of HTL. This dataset consolidates national HTL values, the number of fish species captured through fisheries, and the number of imported species [
17].
HTL was calculated using data from Zhao et al. (2024), as a weighted average of the annual seafood consumption by species in each country, multiplied by the trophic level (TL) of each species. The calculation method is as follows:
where HTLi represents the HTL of country i, TLj refers to the trophic level of seafood j, and DCij indicates the proportion of seafood j consumed in the diet composition of country i.
Economic variables, such as Purchasing Power Parity (PPP), are included to represent income levels and relative price effects. Geographic influences are accounted for using indicators for landlocked and island nations, derived from the CEPII database.
Table 1 provides definitions of the variables used in the analysis, while
Table 2 presents their descriptive statistics.
5. Estimation Results and Discussion
Logarithmic transformations were applied to both dependent and explanatory variables to standardize scales and simplify the interpretation of results. This method allows the coefficients to be interpreted as elasticities, indicating proportional changes, while also reducing data skewness to enhance the reliability and robustness of regression estimates [
36,
37].
Table 4 presents the estimation results across three models—Pooled Ordinary Least Squares (POLS), Random Effects (RE), and Fixed Effects (FE). All models reveal a statistically significant positive relationship between Trade Openness (Ln_TO) and HTL. The estimated elasticities suggest that a 1% increase in trade openness corresponds to a 1.56% increase in HTL (FE model) to a 2.94% increase (POLS model). These results strongly support the hypothesis that greater trade openness positively influences national HTL by improving access to diverse and high-trophic-level seafood products.
Purchasing Power Parity (PPP) also demonstrates a strong positive association with HTL in both the RE and FE models, indicating that higher-income countries tend to consume species at higher trophic levels. However, the squared term of PPP (Ln_PPP²) is negatively associated with HTL, indicating a non-linear relationship. While HTL initially rises with increasing PPP, it begins to decline beyond a specific income threshold. This pattern suggests a transition in dietary preferences toward greater species diversity and potentially lower-cost or lower-trophic-level seafood as income levels grow.
Both the number of domestically captured fish species (Ln_CSN) and the number of imported species (Ln_ISN) exhibit significant positive associations with HTL. These results are consistent with prior research, which emphasizes that wild-capture fisheries often yield higher-trophic-level species compared to aquaculture-dominated imports [
17].
Geographical factors also play a critical role in influencing HTL. Landlocked countries (LL) show a significant negative association with HTL across all models, reflecting their limited access to marine resources and reliance on freshwater fish or lower-trophic-level species. Conversely, island nations (ISL) display a significant positive association with HTL, highlighting the advantages of geographic proximity to marine ecosystems and reliance on high-trophic-level species from capture fisheries. Regionally, Europe and the Pacific stand out with significantly higher HTL levels compared to other continents. This trend likely results from access to warm-water species with inherently higher trophic levels, robust fisheries management practices, and cultural dietary patterns that prioritize high-trophic-level seafood.
These findings underscore the interplay between trade, income, species diversity, and geography in shaping national HTL levels and provide valuable insights for formulating targeted policies to enhance dietary quality and sustainability.
To further explore the geographical disparities affecting HTL,
Table 4 presents the regression results for three groups of countries—landlocked, island, and peninsula—utilizing the Fixed Effects Model (FEM) validated by the Hausman test. The findings underscore significant variations in the factors influencing HTL across these geographical classifications.
Among the three groups, landlocked countries demonstrate the strongest positive association between trade openness (Ln_TO) and HTL, with a significant elasticity of 3.99%. This finding underscores the critical role of trade openness in enabling landlocked nations to access seafood with relatively higher trophic levels. Given their reliance on freshwater fish, which generally occupy lower trophic levels, imports of marine species significantly contribute to elevating their HTL. Regarding species availability, both the number of captured species (Ln_CSN) and imported species (Ln_ISN) are positively and significantly associated with HTL. This indicates that an increase in species diversity, particularly through imports, has a profound impact on improving the trophic quality of diets in landlocked countries.
For island countries, while trade openness is positively associated with HTL, the relationship is statistically significant only at a lower confidence level. This suggests that island nations, with their inherent access to marine resources, depend less on trade to enhance HTL compared to landlocked countries. Interestingly, the number of captured species (Ln_CSN) shows a negative but statistically insignificant relationship with HTL in island nations. This could reflect a reliance on traditional fishing practices focused on specific species, which may not always be of the highest trophic levels. Additionally, island nations exhibit a positive yet insignificant relationship with PPP, indicating that HTL in these nations is more strongly influenced by geographical advantages and marine ecosystems than by economic factors.
In the case of peninsula countries, the impact of trade openness on HTL is the weakest and statistically insignificant. This is likely due to their geographic proximity to both marine and inland resources, which reduces their reliance on imports. However, peninsula nations show the strongest positive association between PPP and HTL, with an elasticity of 17.36%, highlighting the pivotal role of economic power in facilitating access to higher-trophic-level species. As income levels rise, dietary preferences tend to shift toward premium seafood and higher-trophic-level species. Consistent with findings from
Table 3, the squared term of PPP is negatively associated with HTL. This suggests that beyond a certain threshold of economic development, dietary patterns may transition toward more sustainable or diverse options, lessening the emphasis on high-trophic-level species.
6. Conclusions
Empirical evidence on the relationship between HTL and trade openness is provided in this paper by focusing on seafood consumption. The findings, when estimated from three different econometric models—namely, Pooled OLS (POLS), Random Effects Model (REM), and Fixed Effects Model (FEM)—all support that trade openness promotes HTL at a national scale. This relationship is primarily supported through increased access to diversity in seafood resources, while confirming the hypothesis that international trade has improved diets through a mix of high-trophic-level species. These results underscore, anew, the pivotal role taken by global trade networks in influencing seafood consumption patterns and assisting food security.
It also points out a non-linear relationship between PPP and HTL, in which economic development first encourages the consumption of high-trophic-level species but then, at higher income levels, this trend is reversed as a reflection of dietary diversification and perhaps more sustainable consumption behaviors. This insight will be of special interest to policymakers in high-income countries, as it calls for a reduction in overdependence on high-trophic-level species and for the promotion of a more balanced and sustainable pattern of seafood consumption.
From the geographical classification analysis, the geographical classification analysis showed that there were significant gaps in the HTL determinants of landlocked, island, and peninsula countries. In the case of landlocked countries, trade openness is the most critical factor to improve HTL in order to compensate for their disadvantage of not having access to marine resources. Island countries have natural geographical advantages, but their dependency on traditional fisheries may impede further improvement in HTL. There is a very strong positive correlation between economic power and HTL in the peninsula countries, suggesting that economic growth in those regions could serve as a driver for dietary quality improvement. These findings underscore the importance of tailored policies that take specific geographic and economic contexts into consideration to foster equitable and sustainable improvements in seafood consumption.
The results of this study therefore carry some policy implications that are actionable. In sum, trade connectivity for landlocked nations, sustainable seafood practice in high-income countries, and economic policies to drive dietary improvements in peninsula nations are crucial to achieve sustainable seafood consumption. Additionally, the findings make it clear that economic development has to be balanced with ecological sustainability, especially while nations are diversifying their seafood sources without depleting high-trophic-level species.
Nutritional and ecological variables are required in future research to create a more holistic understanding of sustainable seafood consumption. It would be appropriate to approach global seafood consumption from a multidisciplinary point of view, drawing on ecological impacts, dietary outcomes, and socioeconomic factors, with refined insights. Such would allow policy and stakeholders to better develop methods by which dietary improvement and environmental sustainability can take place, hence ensuring that the global seafood system is viable long into the future.
Author Contributions
Kyu Sung Lee: Formal analysis, Methodology, Writing – original draft, Dae Eui Kim: Methodology, Software, Song Soo Lim: Conceptualization, Supervision, Validation, Writing – review & editing.
Funding
This research received no external funding
Institutional Review Board Statement
Not applicable.
Informed Consent Statement
Not applicable
Data Availability Statement
Data are contained within the article.
Conflicts of Interest
The authors declare no conflicts of interest.
References
- FAO. The State of World Fisheries and Aquaculture 2020. FAO: Rome, Italy, 2020.
- Golden, C.D.; Allison, E.H.; Cheung, W.W.; Dey, M.M.; Halpern, B.S.; McCauley, D.J.; Smith, M.; Vaitla, B.; Zeller, D.; Myers, S.S. Nutrition: Fall in fish catch threatens human health. Nature 2016, 534, 317–320. [Google Scholar] [CrossRef] [PubMed]
- Costello, C.; Cao, L.; Gelcich, S.; Cisneros-Mata, M.Á.; Free, C.M.; Froehlich, H.E.; Golden, C.D.; Ishimura, G.; Maier, J.; Macadam-Somer, I.; et al. The future of food from the sea. Nature 2020, 588, 95–100. [Google Scholar] [CrossRef]
- Love, D.C.; Allison, E.H.; Asche, F.; Belton, B.; Cottrell, R.S.; Froehlich, H.E.; Gephart, J.A.; Hicks, C.C.; Little, D.C.; Nussbaumer, E.M.; et al. Emerging COVID-19 impacts, responses, and lessons for building resilience in the seafood system. Glob. Food Sec. 2021, 28, 100494. [Google Scholar] [CrossRef] [PubMed]
- Gephart, J.A.; Cottrell, R.S.; Froehlich, H.E.; Nussbaumer, E.M.; Stoll, J.S.; White, E.R. Covid-19 seafood impacts. Nat. Food 2021, 2, 153–155. [Google Scholar]
- Asche, F.; Bellemare, M.F.; Roheim, C.; Smith, M.D.; Tveteras, S. Fair enough? Food security and the international trade of seafood. World Dev. 2015, 67, 151–160. [Google Scholar] [CrossRef]
- Bellmann, C.; Tipping, A.; Sumaila, U.R. Global trade in fish and fishery products: An overview. Mar. Policy 2016, 69, 181–188. [Google Scholar] [CrossRef]
- Watson, R.A.; Green, B.S.; Tracey, S.R.; Farmery, A.; Pitcher, T.J. Provenance of global seafood. Fish Fish. 2016, 17, 585–595. [Google Scholar] [CrossRef]
- Crona, B.I.; Basurto, X.; Squires, D.; Gelcich, S.; Daw, T.M.; Khan, A.; Havice, E.; Chomo, V.; Troell, M.; Buchary, E.A.; et al. Towards a typology of interactions between small-scale fisheries and global seafood trade. Mar. Policy 2016, 65, 1–10. [Google Scholar] [CrossRef]
- Gephart, J.A.; Pace, M.L. Structure and evolution of the global seafood trade network. Environ. Res. Lett. 2015, 10, 125014. [Google Scholar] [CrossRef]
- World Bank. Fish to 2030: Prospects for Fisheries and Aquaculture; World Bank: Washington, DC, USA, 2013. [Google Scholar]
- Béné, C.; Lawton, R.; Allison, E.H. “Trade matters in the fight against poverty”: Narratives, perceptions, and (lack of) evidence in the case of fish trade in Africa. World Dev. 2010, 38, 933–954. [Google Scholar] [CrossRef]
- Sumaila, U.R.; Bellmann, C.; Tipping, A. Fishing for the future: An overview of challenges and opportunities. Mar. Policy 2016, 69, 173–180. [Google Scholar] [CrossRef]
- Smith, M.D.; Roheim, C.A.; Crowder, L.B.; Halpern, B.S.; Turnipseed, M.; Anderson, J.L.; Asche, F.; Bourillón, L.; Guttormsen, A.G.; Khan, A.; et al. Sustainability and global seafood. Science 2010, 327, 784–786. [Google Scholar] [CrossRef] [PubMed]
- Lindeman, R.L. The trophic-dynamic aspect of ecology. Ecology 1942, 23, 399–417. [Google Scholar] [CrossRef]
- Bonhommeau, S.; Dubroca, L.; Le Pape, O.; Barde, J.; Kaplan, D.M.; Chassot, E.; Nieblas, A.E. Eating up the world’s food web and the human trophic level. Proc. Natl. Acad. Sci. USA 2013, 110, 20617–20620. [Google Scholar] [CrossRef] [PubMed]
- Zhao, Y.; Cao, L.; Li, Y.; Miao, Z.; Xue, Y.; Naylor, R.L.; Battista, W.; Costello, C.; Troell, M.; Zhang, W. Effect of trade on global aquatic food consumption patterns. Nat. Commun. 2024, 15, 1–12. [Google Scholar] [CrossRef] [PubMed]
- Shannon, L.; Coll, M.; Bundy, A.; Gascuel, D. Trophic level-based indicators to track fishing impacts across marine ecosystems. Mar. Ecol. Prog. Ser. 2014, 512, 115–140. [Google Scholar] [CrossRef]
- Gascuel, D.; Guénette, S.; Pauly, D. The trophic-level-based ecosystem modeling approach: Theoretical overview and practical uses. ICES J. Mar. Sci. 2011, 68, 1403–1416. [Google Scholar] [CrossRef]
- Branch, T.A.; Watson, R.; Fulton, E.A.; Jennings, S. The trophic fingerprint of marine fisheries. Nature 2010, 468, 431–435. [Google Scholar] [CrossRef] [PubMed]
- Smith, A.D.M.; Brown, C.J.; Bulman, C.M.; Fulton, E.A. Impacts of fishing low-trophic level species on marine ecosystems. Science 2011, 333, 1147–1150. [Google Scholar] [CrossRef] [PubMed]
- Pinnegar, J.K.; Jennings, S.; O’Brien, C.M. Long-term changes in the trophic level of the Celtic Sea fish community and fish market price distribution. J. Appl. Ecol. 2002, 39, 377–390. [Google Scholar] [CrossRef]
- Pasquaud, S.; Pillet, M.; David, V.; Sautour, B. Determination of fish trophic levels in an estuarine system. Estuar. Coast. Shelf Sci. 2010, 89, 235–245. [Google Scholar] [CrossRef]
- Tacon, A.G.J.; Metian, M.; Turchini, G.M. Responsible aquaculture and trophic level implications to global fish supply. Rev. Aquacult. 2009, 1, 33–46. [Google Scholar] [CrossRef]
- Cottrell, R.S.; Metian, M.; Froehlich, H.E. Time to rethink trophic levels in aquaculture policy. Rev. Aquacult. 2021, 13, 1253–1266. [Google Scholar] [CrossRef]
- Watson, R. A. , Nichols, R., Lam, V. W., & Sumaila, U. R. Global seafood trade flows and developing economies: Insights from linking trade and production. Marine Policy 2017, 82, 41–49. [Google Scholar]
- Abe, K. , Ishimura, G., Tsurumi, T., Managi, S., & Sumaila, U. R. Does trade openness reduce a domestic fisheries catch? Fisheries science 2017, 83, 897–906. [Google Scholar]
- Erhardt, T. Does international trade cause overfishing? Journal of the Association of Environmental and Resource Economists 2018, 5, 695–711. [Google Scholar] [CrossRef]
- Pérez-Martínez, J. , Hernandez-Gil, F., San Miguel, G., Ruiz, D., & Arredondo, M. T. Analysing associations between digitalization and the accomplishment of the Sustainable Development Goals. Science of The Total Environment 2023, 857, 159700. [Google Scholar]
- Couvet, D. , & Ducarme, F. Reconciliation ecology, from biological to social challenges. Revue d’ethnoécologie 2014. [Google Scholar]
- Hsiao, C. Panel data analysis—Advantages and challenges. TEST 2007, 16, 1–22. [Google Scholar] [CrossRef]
- Allison, Paul. (2009). Fixed Effects Regression Models. Thousand Oaks, CA: Sage Publications.
- Bell, A. , & Jones, K. Explaining fixed effects: Random effects modeling of time-series cross-sectional and panel data. Political Science Research and Methods 2015, 3, 133–153. [Google Scholar] [CrossRef]
- Fox, John. Applied Regression Analysis and Generalized Linear Models. Los Angeles, CA: Sage Publications, 2016.
- Hausman, J. A. Specification tests in econometrics. Econometrica: Journal of the econometric society 1271, 1251–1271. [Google Scholar] [CrossRef]
- Bland, J. M. , & Altman, D. G. Transformations, means, and confidence intervals. BMJ 1996, 312, 1079. [Google Scholar] [CrossRef] [PubMed]
- Lo, S. , & Andrews, S. To transform or not to transform: Using generalized linear mixed models to analyse reaction time data. Frontiers in Psychology 2015, 6, 1171. [Google Scholar] [CrossRef]
|
Disclaimer/Publisher’s Note: The statements, opinions and data contained in all publications are solely those of the individual author(s) and contributor(s) and not of MDPI and/or the editor(s). MDPI and/or the editor(s) disclaim responsibility for any injury to people or property resulting from any ideas, methods, instructions or products referred to in the content. |
© 2025 by the authors. Licensee MDPI, Basel, Switzerland. This article is an open access article distributed under the terms and conditions of the Creative Commons Attribution (CC BY) license (http://creativecommons.org/licenses/by/4.0/).