1. Introduction
Cooking oil plays a crucial role in society as it is widely used in daily life, particularly for cooking. Almost all individuals, whether living in urban or rural areas, consume cooking oil. According to data from the Central Bureau of Statistics, the national per capita consumption of cooking oil was 3.62 liters per month in March 2021, increasing by 1.02% to 3.66 liters in March 2022. In Indonesia, the consumption of bulk cooking oil remains significantly higher, contributing up to 65% of the total national cooking oil demand, while the remaining 35% comes from packaged cooking oil consumption [
1]. Hence, ensuring the availability of cooking oil stock is crucial.
Indonesia experienced a shortage of cooking oil supplies from early 2022 to March 2022. Cooking oil became difficult to obtain, leading to skyrocketing prices. The significant increase in cooking oil prices has impacted society, particularly the lower-middle-income group. Based on data from the National Strategic Food Price Information Center [
2], the average price of bulk cooking oil was IDR 13,950/kg in April 2021, which increased to IDR 19,900/kg in April 2022. However, in May 2022, the price decreased to IDR 18,850/kg compared to the previous month. These unpredictable fluctuations in cooking oil prices over time can affect the stability of cooking oil prices.
Given this issue, a solution is needed to monitor cooking oil prices in the future. In this regard, price forecasting becomes essential to predict cooking oil prices for upcoming periods. Forecasting is a technique used to estimate or predict future events based on data from previous or current periods. Its purpose is to minimize the impact of future events [
3]. In this study, the forecasting method used is the Chen Fuzzy Time Series. The Time Series model is applied by analyzing events that occur in a specific period, referencing previous period data to predict future periods [
4]. The advantage of this method is its ability to be applied to real-time data across a wide range. This method uses arithmetic calculations based on averages for creating fuzzy relationships and defuzzification, reducing computational complexity and improving prediction accuracy when using small datasets [
5]. A forecasting method capable of working with small datasets is necessary because reports on cooking oil prices are provided monthly, resulting in limited data on price changes [
6].
There have been several previous studies on price forecasting using the Chen Fuzzy Time Series method, such as those conducted by [
7] and [
8] which focused on forecasting gold prices, and [
9] which predicted rice prices in Jember Regency. Other studies have also compared the Chen Fuzzy Time Series algorithm with other algorithms, such as the research by [
4] which forecasted palladium prices by comparing the Double Exponential Smoothing Holt method with the Chen Fuzzy Time Series method, and, [
10] which predicted food prices by comparing the Chen Fuzzy Time Series and Markov Chain methods.
From the previously mentioned studies, the application of the Chen Fuzzy Time Series method yielded very low forecasting errors, with MAPE (Mean Absolute Percentage Error) values below 10%. Therefore, by applying the Chen Fuzzy Time Series method to forecast the average cooking oil prices in Indonesia, it is expected to achieve a high level of accuracy with MAPE values <10%. This is because the lower the MAPE value, the more accurate the forecasting results and the closer they align with the actual data.
2. Research Methodology
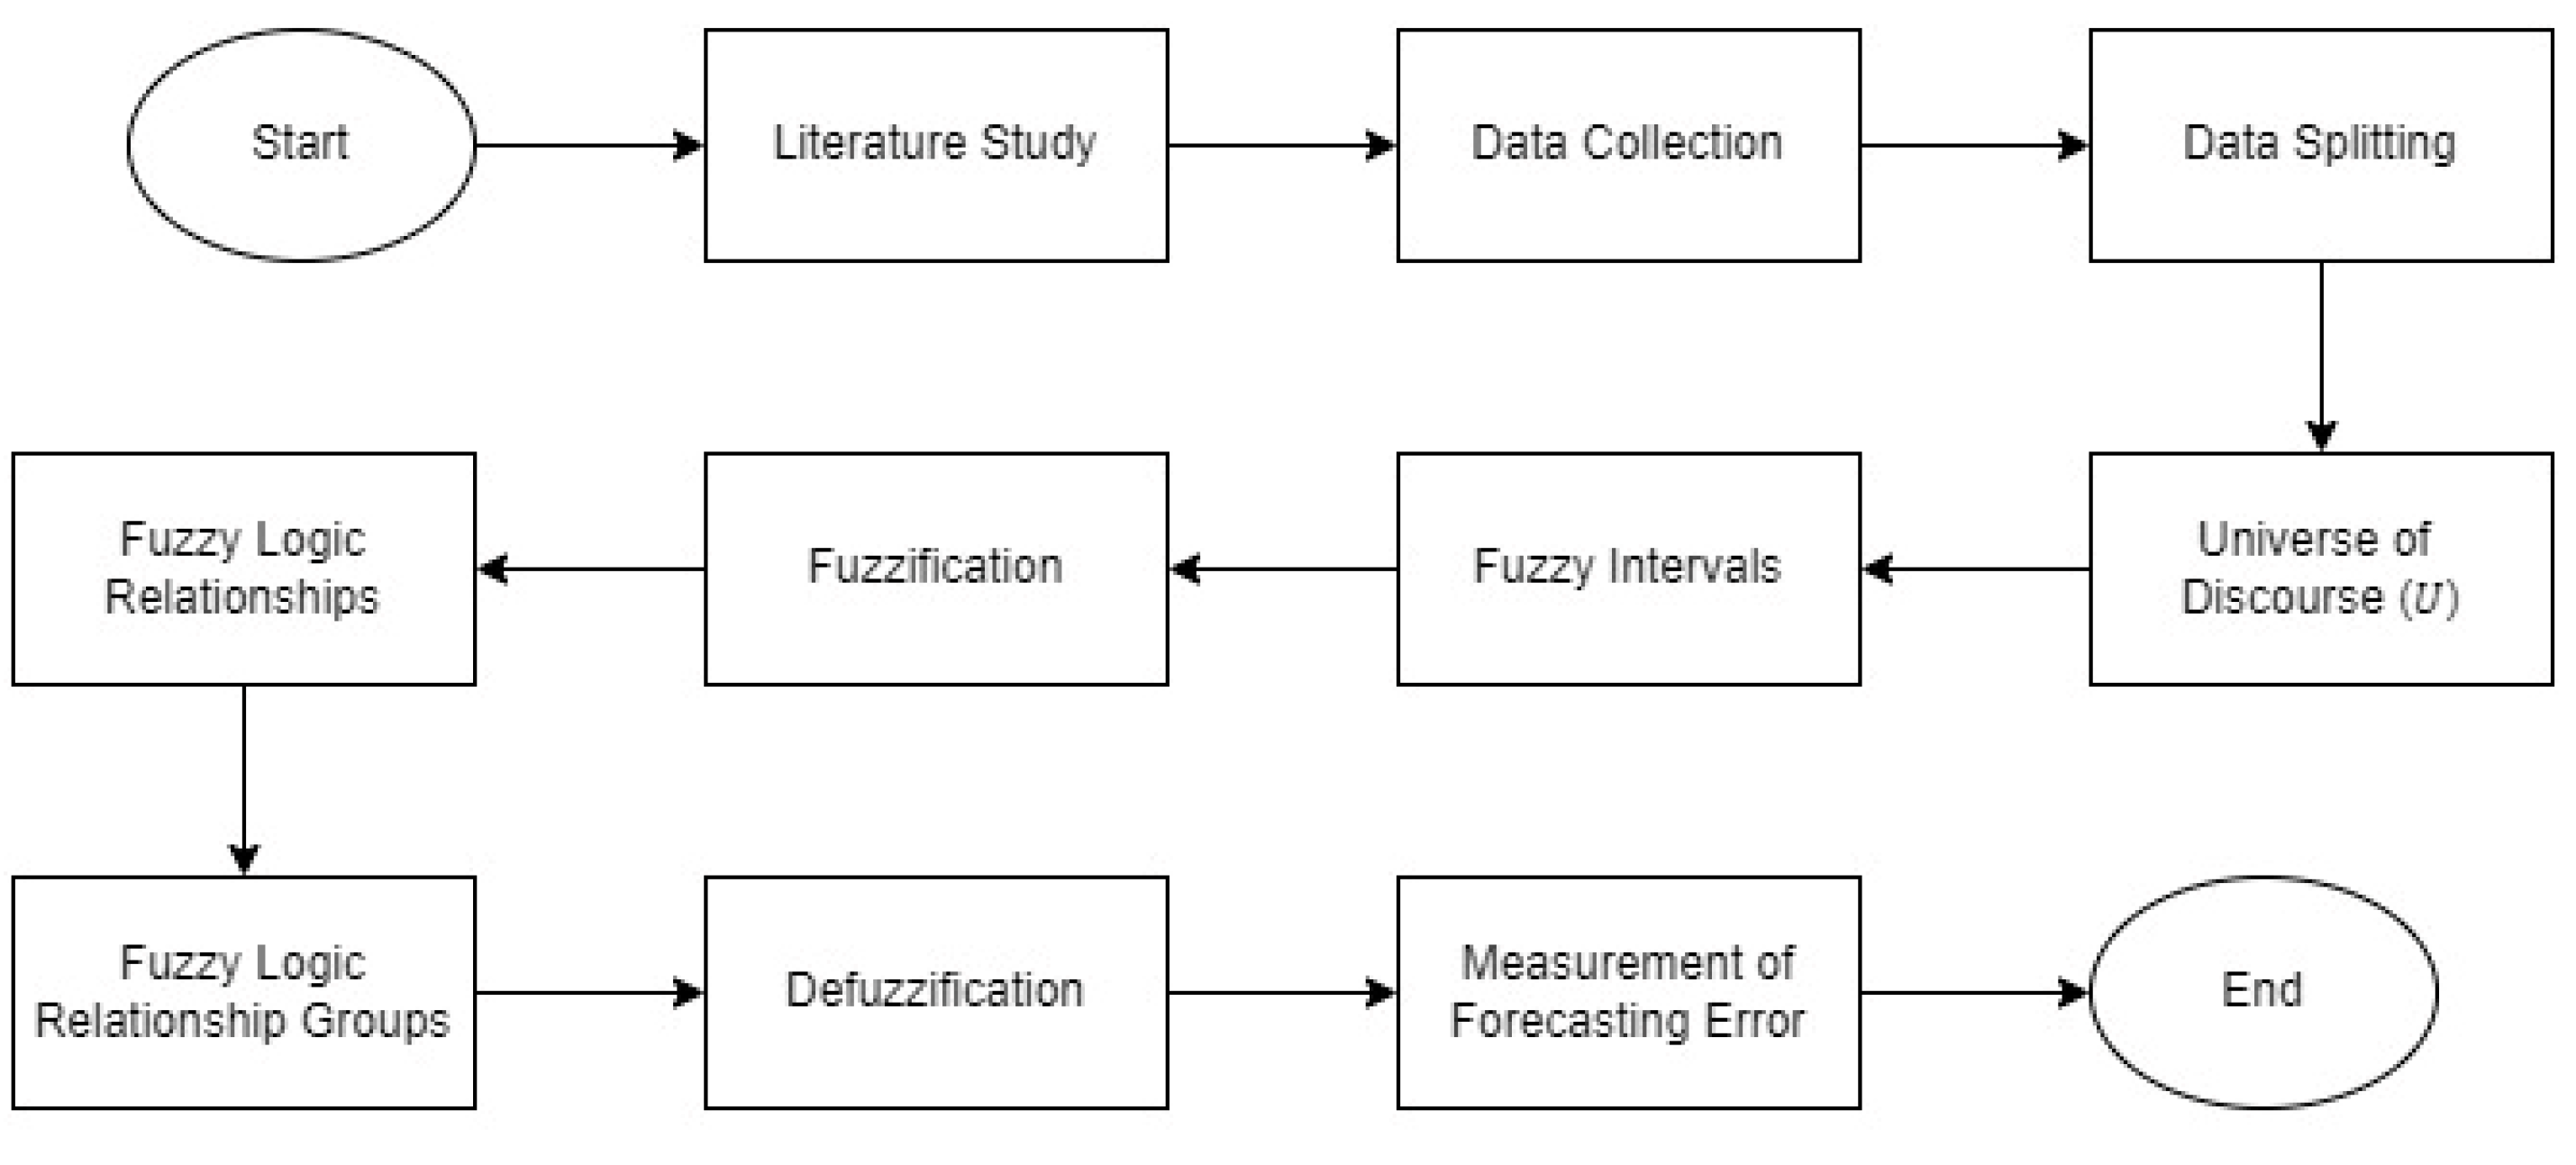
This study was conducted through several stages to predict the average price of bulk cooking oil in Indonesia using the Chen Fuzzy Time Series method, as illustrated in
Figure 1.
Figure 1.
Research Stages.
Figure 1.
Research Stages.
The first stage is the literature review, where this stage explains the theoretical foundation necessary to support the researcher in addressing the problems in the study. The second stage is data collection, where the researcher obtains cooking oil price data in Indonesia from the National PIHPS website. The cooking oil price data used in this study is the average monthly price of bulk cooking oil in Indonesia, covering the period from January 2018 to December 2022. The third stage is data splitting, where the data is divided into two sets: training data and testing data, with a ratio of 80:20. The fourth stage is the formation of the universal set U, derived from the maximum value, minimum value, D1 value, and D2 value. The fifth stage is interval formation, where the researcher uses an average-based interval. The use of average-based intervals can lead to more accurate predictions [
8].
The sixth stage is fuzzification, where non-fuzzy variables (numerical variables) are converted into fuzzy variables (linguistic variables) from each of the formed intervals. The seventh stage is the formation of FLR (Fuzzy Logic Relationship), where FLR is formed from the relationship betweenwhich represents data for the ith month, and which represents data for the (i+1)th month. The eighth stage is the formation of FLRG, which occurs after FLR is formed. In this stage, FLRs with similar relationships are grouped together to form FLRG (Fuzzy Logical Relationship Group). The ninth stage is defuzzification, where fuzzy variables (linguistic variables) are converted into real numbers to obtain specific forecasting results.
The final stage of this research is the
measurement of forecasting error, performed after the forecasting process is complete. In this study, to measure the magnitude of the error in the forecasting results RMSE [
11] and MAPE[
12] are used. In a forecasting model, the lower the RMSE and MAPE values, the higher the accuracy of the forecast, as the results become more accurate and closer to the actual data.
3. Results and Analysis
The cooking oil price data used in this study is the average monthly price of bulk cooking oil in Indonesia from January 2018 to December 2022, obtained from the National PIHPS website, with a total of 60 data points. According to a study by [
13], it is stated that there is no clear guideline on what ratio is the best and optimal for a specific dataset. However, common ratios used are 50:50, 60:40, 70:30, and 80:20. In this study, the researcher uses an 80:20 ratio, where 80% of the dataset is used for training data, covering the period from January 2018 to December 2021, and the remaining 20% is used for testing data from January 2022 to December 2022.
3.1. Hasil Pembentukan Himpunan Semesta U
The forecasting calculation using the Chen Fuzzy Time Series method begins with the formation of the universal set U [
14]. The following
Table 1 presents the parameters along with their values in the formation of the universal set U.
Table 1.
Universe of Discourse (U).
Table 1.
Universe of Discourse (U).
| Parameter |
Value |
| Xmax |
18050 |
| Xmin |
11050 |
| D1 |
1000 |
| D2 |
3000 |
| U |
[10050, 21050] |
3.2. Results of the Formation of Average-Based Intervals
The stage of forming average-based intervals begins by calculating the average difference from the actual data. Next, the interval length, the number of intervals, and the median value for each formed interval are determined. The results of the fuzzy interval formation are presented in
Table 2.
Table 2.
Fuzzy Interval.
| Interval |
Median |
| Minimum |
Class |
Maximum |
| 10050 |
A1 |
10346 |
10198 |
| 10346 |
A2 |
10642 |
10494 |
| 10642 |
A3 |
10938 |
10790 |
| ⁝ |
⁝ |
⁝ |
⁝ |
| 20114 |
A35 |
20410 |
20262 |
| 20410 |
A36 |
20706 |
20558 |
| 20706 |
A37 |
21002 |
20854 |
3.3. Fuzzification Results
The fuzzification stage for the actual data is carried out by converting the data in the price column into fuzzy variables, based on the reference in
Table 2. The fuzzification results for all data are presented in
Table 3.
Table 3.
Fuzzification and Fuzzy Logic Relationship.
Table 3.
Fuzzification and Fuzzy Logic Relationship.
| Year |
Month |
Price |
Fuzzification |
FLR |
| 2018 |
January |
11.950 |
A7 |
A7>A7 |
| February |
11.850 |
A7 |
A7>A7 |
| March |
11.900 |
A7 |
A7>A7 |
| ⁝ |
⁝ |
⁝ |
⁝ |
⁝ |
| 2021 |
October |
16.000 |
A21 |
A21>A25 |
| November |
17.350 |
A25 |
A25>A28 |
| December |
18.050 |
A28 |
A28>A28 |
3.4. Fuzzy Logic Relationship (FLR) Formation Results
The formation of FLR is carried out by determining the fuzzy relations from the actual data. FLR is formed from the fuzzification results of data in the ith month with the fuzzification results of data in the (i+1)th month. The results of the fuzzy relationship formation for all data can be seen in
Table 3.
3.5. Fuzzy Logic Relationship Group (FLRG) Formation Results
The formation of FLRG is carried out by grouping FLRs that have the same relationship, where the next state parts are grouped together. The FLRG formation results are presented in
Table 4.
Table 4.
FLRG and Defuzzification.
Table 4.
FLRG and Defuzzification.
| FLRG |
Defuzzification Result |
| current state |
next state |
| A1 |
- |
10198 |
| A2 |
- |
10494 |
| A3 |
- |
10790 |
| ⁝ |
⁝ |
⁝ |
| A34 |
- |
20262 |
| A35 |
- |
20558 |
| A36 |
- |
20854 |
3.6. Defuzzification
The defuzzification stage is carried out by converting the fuzzy variables into real numbers to obtain specific forecasting results. The defuzzification results are obtained by calculating the average median value from the next state column. However, if the next state value generated at index i is empty, the defuzzification result is obtained from the median of the current state. The defuzzification results for all data are presented in
Table 4.
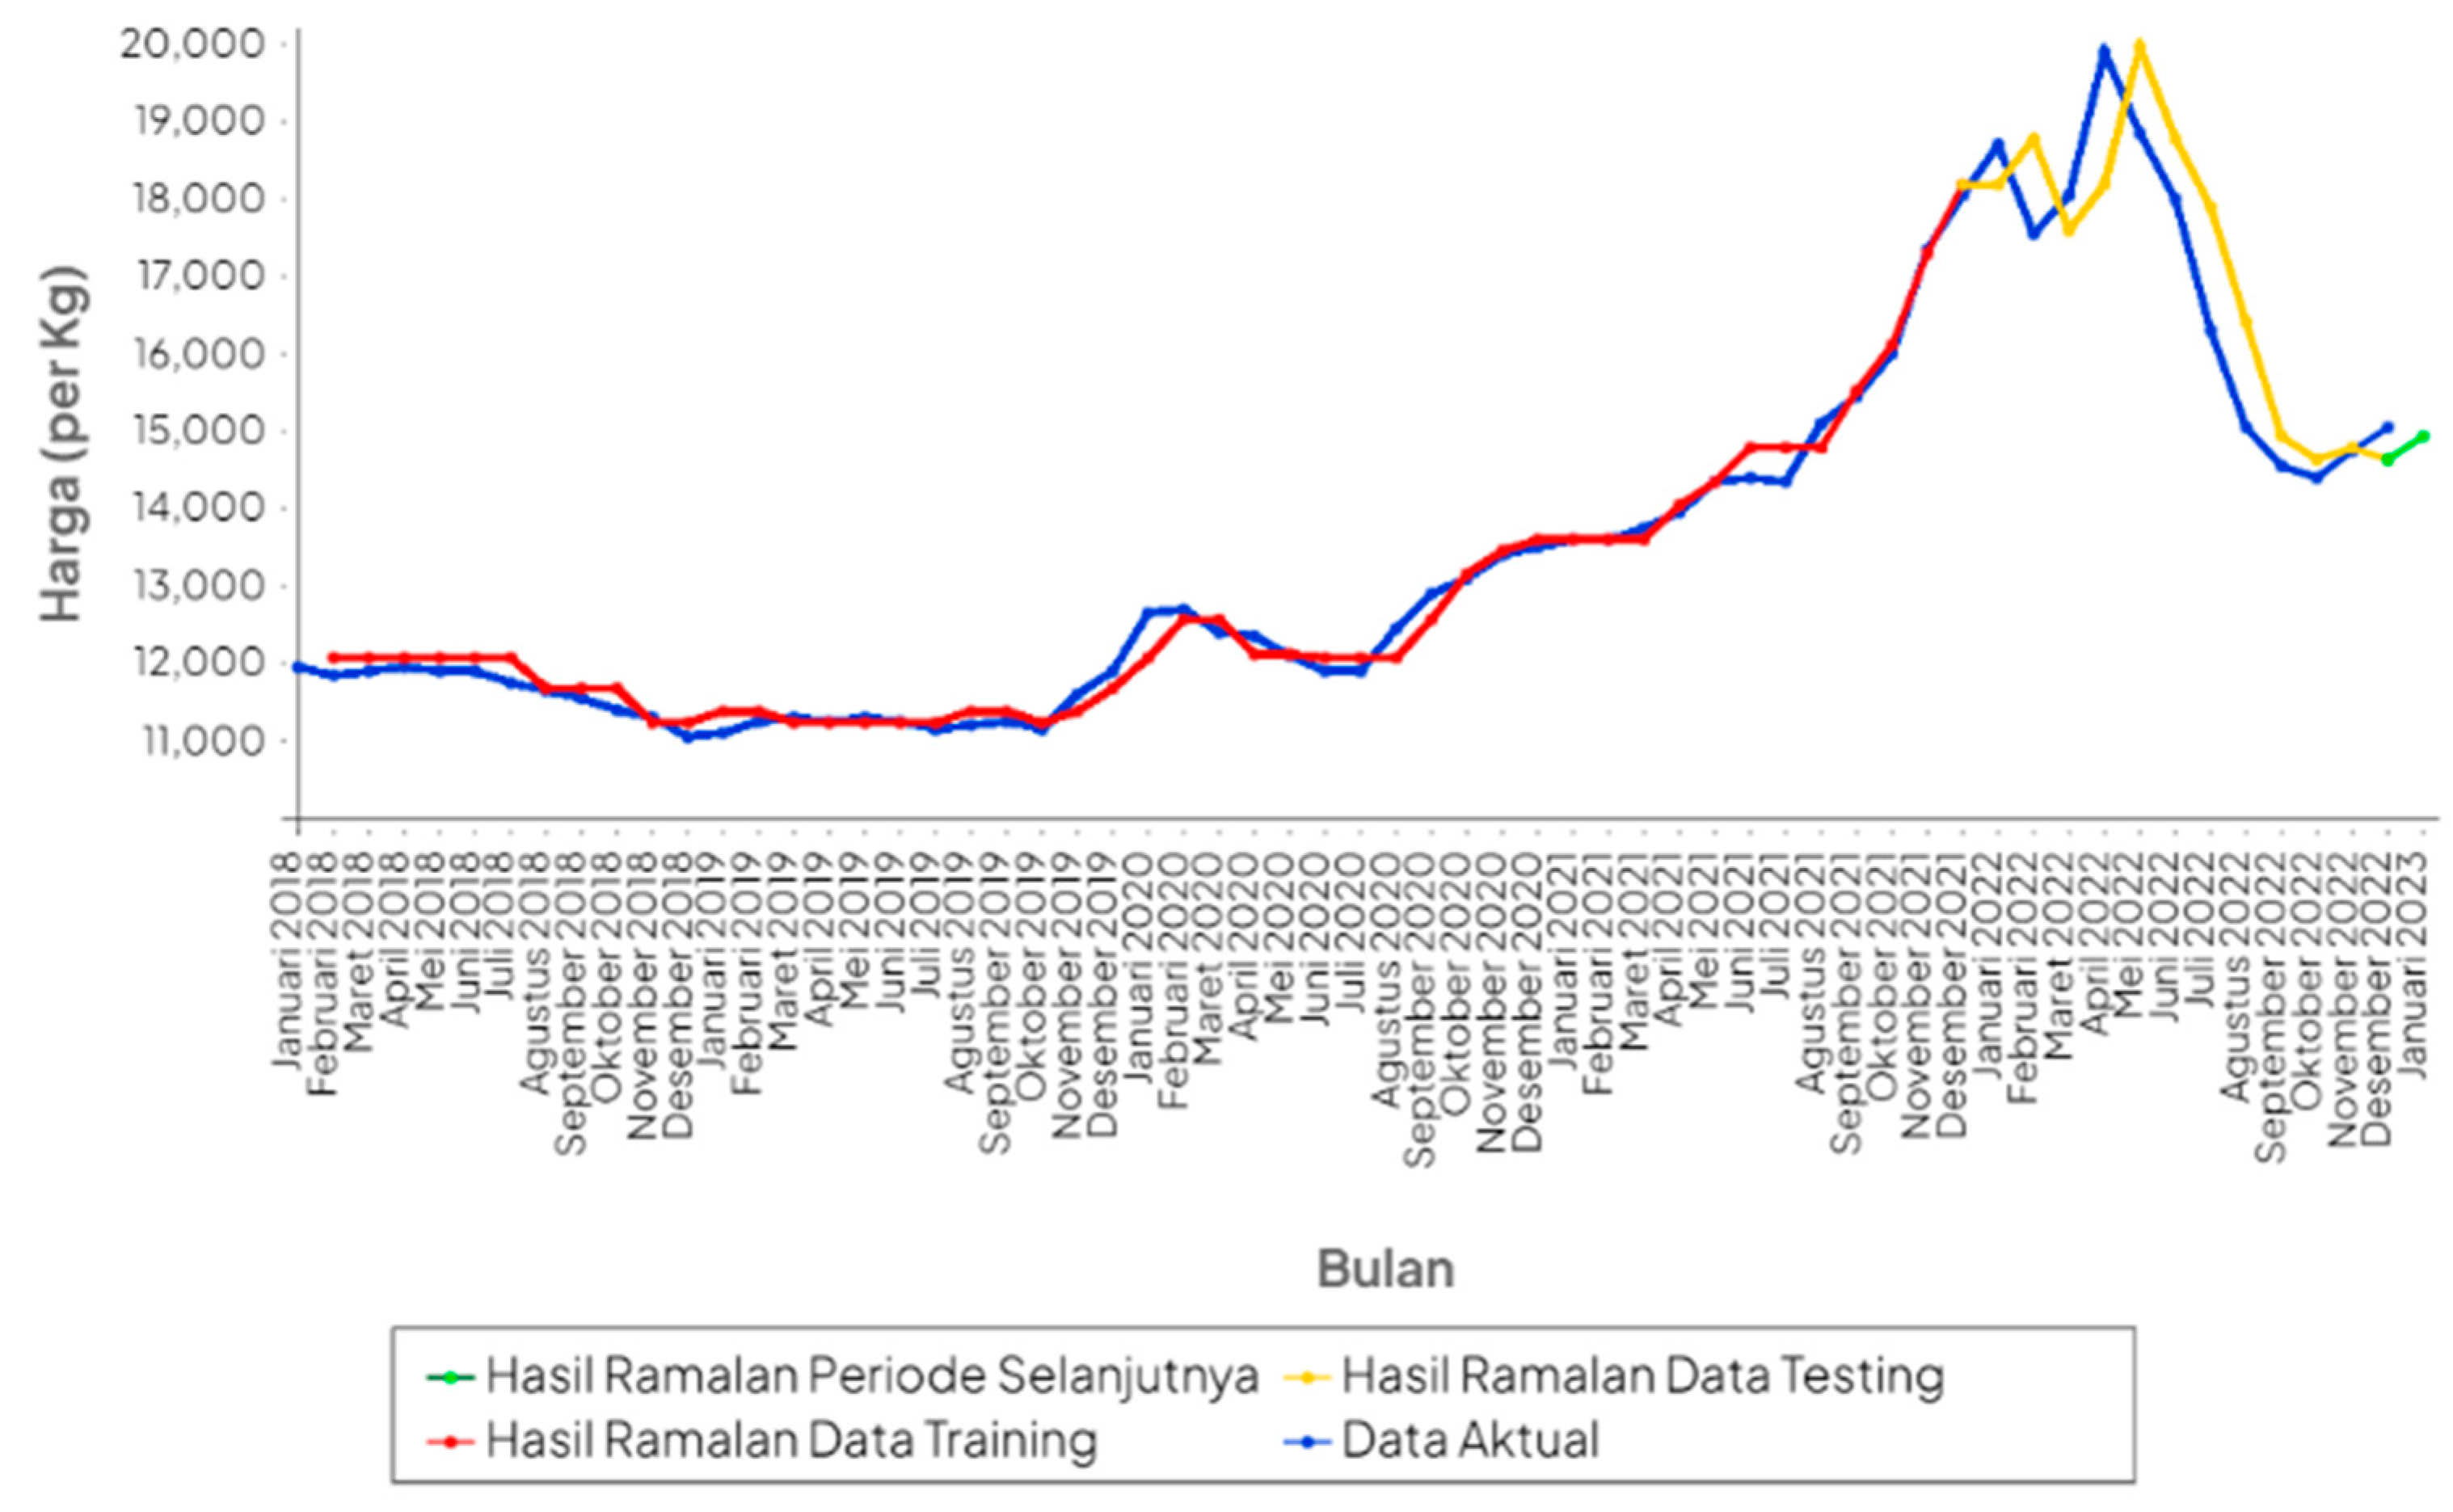
Based on the defuzzification results in
Table 4, the defuzzification result obtained for the i-th data will be the forecasted value for the (i+1)-th data. The forecasting results for the bulk cooking oil prices for the training data, from January 2018 to December 2021, are presented in
Table 5. Meanwhile, the forecasting results for the testing data, from January 2022 to December 2022, and the forecast for the subsequent period are presented in
Table 6. The graphical visualization comparing the actual data with the forecasting results using the Chen Fuzzy Time Series method is presented in
Figure 2.
Table 5.
Forecast results on training.
Table 5.
Forecast results on training.
| Year |
Month |
Price |
Fuzzification |
Forecast Results |
| 2018 |
January |
11.950 |
A7 |
- |
| February |
11.850 |
A7 |
12073 |
| March |
11.900 |
A7 |
12073 |
| ⁝ |
⁝ |
⁝ |
⁝ |
⁝ |
| 2021 |
October |
16.000 |
A21 |
16118 |
| November |
17.350 |
A25 |
17302 |
| December |
18.050 |
A28 |
18190 |
Table 6.
Forecast results on testing data and the next period.
Table 6.
Forecast results on testing data and the next period.
| Year |
Month |
Price |
Fuzzification |
Forecast Results |
| 2022 |
January |
18700 |
A30 |
18190 |
| February |
17550 |
A26 |
18782 |
| March |
18050 |
A28 |
17598 |
| April |
19900 |
A34 |
18190 |
| May |
18850 |
A30 |
19966 |
| Juny |
18000 |
A27 |
18782 |
| July |
16300 |
A22 |
17894 |
| August |
15050 |
A17 |
16414 |
| September |
14550 |
A16 |
14934 |
| October |
14400 |
A15 |
14638 |
| November |
14750 |
A16 |
14786 |
| December |
15050 |
A17 |
14638 |
| 2023 |
January |
- |
- |
14934 |
Figure 2.
Comparison chart of actual data with forecast results.
Figure 2.
Comparison chart of actual data with forecast results.
3.7. Results of Forecasting Error Measurement
The error measurement stage aims to evaluate the bulk cooking oil price forecasting model that was created in the previous stages. In this study, to measure the magnitude of the errors in the forecasting results, MSE and MAPE are used with an 80:20 data splitting ratio. The results of the RMSE and MAPE measurements are 980.64 and 4.77%, respectively. The lower the error values, the more accurate the forecasting results, as they get closer to the actual data. The bulk cooking oil price forecasting model in Indonesia that was developed falls within the very accurate criteria because it yields a value of MAPE < 10%[
15].
4. Conclusions
Based on the results of the research conducted, the forecasting results for the average price of bulk cooking oil in Indonesia from January 2018 to December 2022 using the Chen Fuzzy Time Series method produced highly accurate predictions and can be used as a reference for forecasting future periods. The forecasted result for the subsequent period, January 2023, is IDR 14,934. As for the error level, the forecasting of the average price of bulk cooking oil in Indonesia using the Chen Fuzzy Time Series method resulted in an RMSE value of 980.64 and a MAPE value of 4.77%. The forecasting model for the average price of bulk cooking oil in Indonesia using the Chen Fuzzy Time Series method falls into the very accurate category due to the MAPE value being less than 10%.
In future research, it is recommended to use a longer period of data, as the more data used in the Fuzzy Time Series forecasting, the more accurate the results will be. Additionally, it is important to consider external factors that may influence the fluctuations in bulk cooking oil prices in Indonesia.
Acknowledgements
This research is supported by the Faculty of Computer Science, University of Jember.
References
- Republika.co.id, “Konsumen Minyak Goreng Kemasan Bakal Beralih ke Curah,” 2022. Accessed: Jan. 05, 2023. [Online]. Available: https://www.republika.co.id/berita/r8zf4g428/ylki-konsumen-minyak-goreng-kemasan-bakal-beralih-ke-curah.
- “PIHPS Nasional.” Accessed: Dec. 01, 2022. [Online]. Available: https://hargapangan.id/tabel-harga/pasar-tradisional/daerah.
- M. W. Pramana, I. M. W. Pramana, I. Purnamasari, and S. Prangga, “Peramalan Data Ekspor Nonmigas Provinsi Kalimantan Timur menggunakan Metode Weighted Fuzzy Time Series Lee,” 2021. [Online]. Available: www.unipasby.ac.id.
- Desduana Selasakmida, Tarno, and T. Wuryandari, “PERBANDINGAN METODE DOUBLE EXPONENTIAL SMOOTHING HOLT DAN FUZZY TIME SERIES CHEN UNTUK PERAMALAN HARGA PALADIUM,” vol. 10, no. 3, pp. 325–336, 2021, [Online]. Available: https://ejournal3.undip.ac.id/index.php/gaussian/.
- Arnita, N. Afnisah, and F. Marpaung, “A Comparison of the Fuzzy Time Series Methods of Chen, Cheng and Markov Chain in Predicting Rainfall in Medan,” in Journal of Physics: Conference Series, Institute of Physics Publishing, Mar. 2020. [CrossRef]
- M. Yoka Fathoni and S. Wijayanto, “Forecasting Penjualan Gas LPG di Toko Sembako 87,” 2021.
- N. Hafiyya, F. N. Hafiyya, F. Virgantari, and M. Widyastiti, “IMPLEMENTASI METODE FUZZY TIME SERIES PADA PERAMALAN HARGA EMAS DI INDONESIA,” vol. 2, no. 2, pp. 94–103, 2022, [Online]. Available: https://harga-emas.org/.
- D. Nababan and E. Alexander, “IMPLEMENTASI METODE FUZZY TIME SERIES DENGAN MODEL ALGORITMA CHEN UNTUK MEMPREDIKSI HARGA EMAS,” Jurnal Teknik Informatika, vol. 13, no. 1, 2020.
- F. Muhammad, “Peramalan Harga Beras di Kabupaten Jember Menggunakan Metode Fuzzy Time Series Model Chen,” 2021, Accessed: Jan. 08, 2023. [Online]. Available: https://repository.unej.ac.id/handle/123456789/105986.
- H. Kartini, Y. H. Kartini, Y. Ramdani, and Y. Permanasari, “Prediksi Harga Bahan Pangan dengan Metode Fuzzy Time Series Chen dan Markov Chain,” Bandung Conference Series: Mathematics, vol. 2, no. 2, Aug. 2022. [CrossRef]
- N. Somu, G. R. N. Somu, G. R. M R, and K. Ramamritham, “A hybrid model for building energy consumption forecasting using long short term memory networks,” Appl Energy, vol. 261, Mar. 2020. [CrossRef]
- H. Sofhya, “Comparison of Fuzzy Time Series Chen and Cheng to Forecast Indonesia Rice Productivity,” Eduma : Mathematics Education Learning and Teaching, vol. 11, no. 1, pp. 119–128, 2022. [CrossRef]
- V. R. Joseph, “Optimal ratio for data splitting,” Stat Anal Data Min, vol. 15, no. 4, pp. 531–538, Aug. 2022. [CrossRef]
- S.-M. Chen, “PU||’Y sets and systems Forecasting enrollments based on fuzzy time series,” 1996.
- C. D. Lewis, Industrial and business forecasting methods : a practical guide to exponential smoothing and curve fitting. London ; Boston : Butterworth Scientific, 1982. Accessed: Mar. 12, 2023. [Online]. Available: https://worldcat.org/en/title/1358664930.
|
Disclaimer/Publisher’s Note: The statements, opinions and data contained in all publications are solely those of the individual author(s) and contributor(s) and not of MDPI and/or the editor(s). MDPI and/or the editor(s) disclaim responsibility for any injury to people or property resulting from any ideas, methods, instructions or products referred to in the content. |
© 2025 by the authors. Licensee MDPI, Basel, Switzerland. This article is an open access article distributed under the terms and conditions of the Creative Commons Attribution (CC BY) license (https://creativecommons.org/licenses/by/4.0/).