
Submitted:
20 January 2025
Posted:
22 January 2025
You are already at the latest version
Abstract
Conventional wastewater treatment is often insufficient in the case of mature landfill leachate. Among novel methods internal micro-electrolysis (IME) has been recently recognized as an effective method for refractory wastewaters treatment. The aim of this study was the evaluation of the impact of various parameters (pH, time, types and ratios of Fe/GAC, H2O2 dose and time of application, soaking of GAC in LL) on the efficiency of the IME process applied to mature landfill leachate. As microelectrodes were used waste cast-iron chips and granulated activated carbon (GAC). Application of a multi-step treatment of leachates: PC>m-IME>m-IME/H2O2 resulted in 82.1% COD removal and significant increase in bio-degradability (BOD5/COD rose up to 0.39). The optimal parameters were established as follows: pH 3, 120 min, ratio Fe/GAC 40/10 g/g/dm3 and ratio COD/H2O2 = 1/2. Results showed that the PC is a reasonable pretreatment process before IME - improvement in total COD removal was up to 12.5%. COD removal in IME process in-creased with the increase in GAC dose only up to a certain level. Also too high doses of Fe negatively affected the efficiency of the IME process which shows that the efficiency depends not only on the dose, but also on the mass ratio of Fe/GAC. Addition of H2O2 significantly improved the COD removal effectiveness, especially when it was applied after 120 min of the m-IME process. Results showed also that soaking of GAC in LL before the process did not eliminate sorption process.
Keywords:
internal microelectrolysis
; landfill leachate
; hydroxyl radicals
1. Introduction
In mature and stabilized leachate dominate a high molecular mass organic compounds - humic substances (HS). They are characterized by rather low TOC, COD, BOD5 values, BOD5/COD ratio and could contain compounds that are hazardous and resistant to biological treatment. In most cases only pre-treatment methods, such as: coagulation-flocculation, adsorption, biological treatment are applied to landfill leachates (LL), which are not sufficient in case of mature LL and do not remove all hazardous substances. That is why there is a need to apply more powerful methods like membrane methods or advanced oxidation methods. High efficiency of AOP’s is related to the activity of hydroxyl radicals with a high redox potential (2,8 V). In recent years, the internal microelectrolysis (IME) process, which is derived from the heterogeneous ZVI/H2O2 process [1], has attracted much interest. The idea of the process is based on the formation of galvanic microcells as a result of the difference in potential between the microelectrode materials: cathode (activated carbon (AC)) and anode (iron chips), in an acidic electrolyte solution. [1, 2a-c, 3]
The electrode reactions on the microcells are presented by the following reaction equations:
Anode: Fe0 → Fe2+ + 2e, E(Fe0/Fe2+) = 0,44 V
Fe2+ → Fe3+ + e E(Fe2+/Fe3+) = -0,77 V
Cathode: 2H+ + 2e → H2 (g) E(2H+/H2) = 0,00 V
In an acidic environment and anaerobic conditions hydrogen is created at the cathode, contrary in aerobic conditions - the oxygen atom becomes an electron acceptor instead of the hydrogen atom and hydrogen peroxide is formed [1,2,3,4,5,6]
O2(g) + 4H+ + 4e → 2O• + 4[H] → 2H2O E (O2/ H2O) = 1,23 V
O2(g) + 2e + 2H+ → H2O2 E(O2/H2O2) = 0,69 V
In neutral or alkaline conditions, an unfavorable reaction occurs at the cathode (6) [6]:
O2 + 2H2O + 4e → 4OH- E(O2/OH-) = 0.40 V
The hydrogen peroxide formed in reaction 5 immediately reacts with iron cations Fe2+ released in the oxidation process of the iron microelectrode, initiates the Fenton reaction (reaction 7) [2a-c].
Fe2+(aq) + H2O2(aq) → Fe3+(aq) + OH−(aq) + OH•
In IME method as the anode material iron or cast iron chips are used, while as the cathode the AC in granulated (GAC) or in powder form is used.
The efficiency of the IME process depends on many factors, such as pH, the number of cathode and anode centers (microcells), i.e. the dose of microelectrodes and their mass ratio (Fe/GAC). An important parameter is the surface and granulation of the microelectrodes – fine-grained iron materials are more susceptible to dissolution. The use of carbon and iron material with similar granulation facilitates both: the formation of microcells and the accessibility of impurities to the microelectrode surface.
Although the IME process was used to treat wastewater from various industries there [5,6,7,8,9,10,11,12,13,14,15,16,17,18,19,20,21,22,23,24] are only few papers devoted to the issue of LL treatment with IME process (Table 1) [1,2,3,25,26,27,28,29,30,31,32]. In those publications the IME process was investigated under pre-defined conditions (in narrow range of parameters) and were focused on the highest efficiency of COD removal. The correlation between the efficiency of the process and the dose of microelectrodes or the iron/GAC ratio has not been detailed studied. Moreover, the researchers used different methods of microelectrodes preparation before the process. Some authors propose soaking GAC in raw leachates before the IME process to saturate the active surface of the activated carbon and eliminate sorption process [25,26].
The main aims of the presented studies were to investigate in more detail the IME process which seems to be effective in COD removal but more complex than it is considered in the literature. Authors focused on more detailed description of the correlations between the wide range of parameters and the efficiency of the IME process. As part of the presented research the following issues were investigated:
- determination of the impact of different parameters on the effectiveness of the IME process: pH; microelectrodes ratios and doses; time; the addition of H2O2 in different doses and moment of the process;
- determination of the impact of humic substances removal by precipitation in pH 2, 3 and 4 (preliminary coagulation PC) on the IME effectiveness.
- investigation of the validity of soaking of the GAC in LL before the IME process (in different variants).

Table 1.
A list of publications on the use of IME for LL treatment.
| Name of the process | Characteristics of LL | Characteristics of microelectrodes | Process parameters | Parameters recognized as optimal | IME efficiency | Bibliography |
|---|---|---|---|---|---|---|
| Microelectrolysis/Fenton process | pH 6.4, NNH4 1,300 mg/L, CaCO3 alcalinity 10,400 mg/L, COD 8,546 mg O2/L |
Cast iron degreased 20 min in ethanol | pH 1,0; 3,0; 5,0; 7,0. Fe0 25; 50; 75 and 100 g/L, H2O2: 97.0, 195.6, 324.9 i 538.8 mM |
Cast iron dosage 75 g/L H2O2 dose 195.6 mM 90 min IME + 105 min IME/H2O2 |
COD removal after IME 38.2%, after IME/H2O2 65.1% |
[1] |
| SIME reactor | COD 538 mgO2/L, BOD5 38 mgO2/L, BOD5/COD 0.07, pH 7,2 |
Scrap cast iron with an area of 0,3-0,4 m2g-1, washed in hexane and washed again in 0,1 M HCl GAC |
Preliminary tests: pH: 3; 5; 7; 8.5, Fe/C mass ratio: 1/3, 2/2; 3/3; 4/3; 5/3; 6/3 SIME Reactor: Air flow rate: 20; 40; 80; 120 L/h, H2O2: 0; 50; 100; 150; 200; 250 mg/L |
SIME Reactor: pH 5, Fe/GAC 1/1, Air flow rate 80 L/h, H2O2 dose 100 mg/L |
COD removal 73.7% in the combined process (without aeration 60 min and with aeration 90 min) COD removal 86.1% in a SIME reactor with H2O2 addition |
[2a, 2b, 2c] |
| Coupled coagulation and aerated micro-electrolysis process with in situ addition of H2O2 | Concentrate LL after the NF process: pH 7,48 COD 6500 mgO2/L, BOD5 200 mgO2/L, BOD5/COD 0.03. |
Medium size scrap cast iron 2 mm, washed 20% NaOH and re-rinsed H2SO4 GAC rinsed in distilled water |
Fe/GAC: 3.0 Air flow rate: 200 L/h H2O2 (30%): 0, 0,24, 0,50; 0,75; 1,0; 1,25; 1,88; 2,5 mM pH: 2; 3; 4; 5; 6; 7 |
pH 4, H2O2: 0.75 mM HRT; 2 h in IME reactor with aeration |
Removal: COD 79.2% OWO 79.9% Color 90.8% UV 81.8% Increase in the BOD5/COD ratio 0.31 |
[25] |
| Microelectrolysis | pH 8.5 ± 0.1 Color: 500 ± 50 COD 3318.2 ± 205.5 mgO2/L BZT5 397.5 ± 48.5 mgO2/L TOC 843.4 ± 71.5 mg/L BOD5/COD 0.12 |
Information not included | Fe/GAC 2/1; 1/1; 1/2; GAC: 1, 5, 10 g/L, pH: 2, 3, 4, Time: 30, 60 and 90 min |
pH 2.0; GAC 10 g/L; Fe0/GAC 2/1; Time 90 min |
Removal: COD 85% Increase in ratio BOD5/COD 0.31 |
[27] |
| Iron–carbon internal micro-electrolysis | Leachate after the biological treatment process: pH 7.5–8. COD 237.3–262.6 mgO2/L NO3-N 69.19–71.8 NO2-N 2.38–2.7 NNH4+-N 217.9–234.0 mg/L |
Commercial Iron dust washed in 0.1 M HCl, and washed 10 times in distilled water AC rinsed 10 times in distilled water Both microelectrodes with a size of M. 100 mesh. |
pH 3, 5, 6, Fe/AC: 12/4 g/L Time: 5, 10, 20, 40 min |
pH 3, Fe/AC: 12/4 g/L Time: 20 min |
Removal: COD 46% TKN 54% |
[28] |
| Microelectrolysis -Fenton process | pH 7.52 ChZT 4980 mgO2/L, BZT5 548 mgO2/L, BOD5/COD 0.11, NNH4 1850 mg/L. |
Cast iron filings with an area of 0.3-0.4 m2/g, defatted in ethanol and washed out in 0.1 M H2SO4 and in water, GAC with a diameter of 2-4 mm |
Preliminary tests: pH: 2; 3; 4, H2O2: 10; 12; 14 ml/L, Fe/GAC: 44; 52; 60 g/L, in a ratio of 3:1, Time: 60 min. Column experiment: LL flow rate: 1.0; 1.5; 2.0; 3.0; 6.0 ml/min |
Fe-C: 55.72% H2O2 12.32 ml/L pH 3.12, Time 60 min |
Removal: COD 74.59% BOD5 0.50 |
[3] |
| Iron–carbon micro–electrolysis (ICME) coupled with H2O2 | RO leachate concentrate: pH 7.35 COD 1980-2100 mgO2/L BOD5 97.0-102.9 mgO2/L BOD5/COD 0.049 |
Cast iron scraps soaked in 2% H2SO4 and rinsed in water GAC size 0.2-1.5 × 4 mm with a specific surface area of 925.2 m2/g, rinsed in distilled water |
Cylindrical reactor: pH 0.64; 2; 4; 6; 7.36, C/Fe with an area of 342; 164; 500.0; 687; 500; 875; 1002, 836. H2O2: 659; 1000; 1500; 2000; 2340 mg/L |
C/Fe with an area of 717.1438, H2O2 1687,6 mg/L, pH 3,8 |
Removal: COD 86.9% |
[29] |
| Coagulation/flocculation process coupled with microelectrolysis-Fenton process (MEF) | pH 8.5 COD 6880 mgO2/L BOD5 572 mgO2/L BOD5/COD 0.081 |
0.3-0.4 m2/g cast iron filings soaked in 0.1 M NaOH, rinsed in water and soaked in 0.1 M H2SO4 and rinsed again in the water, GAC 2-4 mm in size, soaked in raw leachate for 72 h and dried at 40 degrees. |
pH: 2, 3 and 4 H2O2 (30%): 2.66; 3.33; 4.0 mg/L, Fe/GAC: 80; 100; 120 g/L, at ratio 1/1 |
pH 3.20, H2O2 3.57 mg/L Fe/GAC 104,52 g/L |
Removal: COD 40.27% at IME process 90.27% - total in the MEF proces |
[26] |
| Microelectrolysis-Fenton oxidation process combined with biological degradation and coagulative precipitation | pH 7.47 COD, 1590.9-1790.7 mg/L NH3-N 808.1-894.7 mg/L TN 895.9-944.4 mg/L |
Information not included | Full-scale testing: IME tank: f 0.87 × 4.5 m Fenton IME tank: f 1.84 × 0.5 × 0.8 m |
Dose of H2O2 (27.5%) 25 L four times diluted | Removal: COD 85% Metal content > 60% |
[30] |
| Process IME-O3/OH-/H2O2 | COD 1224 mgO2/L TOC 578 mg/L BOD5 220 mgO2/L, BOD5/ChZT 0.18, pH 7,2 |
Cast iron filings with size 2-4 mm, soaked in ethanol for 2 hours, GAC from walnut shells with a size of 0.4–0.85 mm and a surface area of 1100 m2/g |
Glass reactor with a volume of 0.5 L, Fe/GAC: 20/10, 20/20, 20/40, 20/60, 20/80, 20/100, and 20/120 g/L, Experiment time: 60 minutes |
Fe/GAC 20/80 g/L | Removal: COD 76,7% at IME process total COD removal 95.4% at IME-O3/OH-/H2O2 |
[31] |
2. Materials and Methods
As microanodes grey cast iron – waste material after CNC machining processes (turning, milling, etc.) were used. As microcatods granulated activated carbon (GAC) 4H Gryfskand from Hajnówka in Poland (Table 2) was used. Cast iron and GAC filings were prepared before used according to the procedure described in the Supplementary date.
LL were collected in polypropylene canisters and refrigerated until analysis (such LL were treated as raw leaches). Some samples of LL were acidified to pH 2, 3 or 4 and left for sedimentation within 4 hours. Then the leachate was separated from the sediment of precipitated humic substances (HS) and refrigerated until analysis (LL after preliminary coagulation – PC). Studies on PC were performed to determine the effect of removal of humic substances (HS) on the efficiency of the IME process. The experiments preceded by PC were marked as a modified process (m-IME). The experiments conducted on raw leachates (without PC) were named as the classic process (c-IME) and were carried out only at pH 3.
Internal microelectrolysis (IME) process was carried out in a glass reactor (sample volume 0,2 L) to which mechanical stirring was applied (120 rpm). The following doses of microelectrodes were used in different mass ratios: cast iron – Fe: 4; 6; 8; 9; 12; 16; 18; 20; 24; 30; 36; 40 and 48 g/L and GAC: 2; 3; 4; 5; 6; 7; 7,5; 8; 10; 12; 14; 15; 20; 30; 40; 60; 80; 90 and 120 g/L. In IME/H2O2 process additionally H2O2 in proper COD/H2O2 ratio (1/1, 1/2 or 1/3) was added (at the beginning of the process or after 120 min of m-IME). After an appropriate process time, the sample was alkalized to pH 9 (with 3 M NaOH) to inhibit the oxidation process and remove Fe2+/Fe3+ ions in coagulation process. Additionally, to samples after m-IME/H2O2 process proper amount of catalase solution was added to remove residue H2O2.
Total nitrogen, ammonia nitrogen, chlorides, pH, electrolytic conductivity, and COD were determined according to the European Standard Methods. UV254 absorbance was determined with the use of HACH DR 5000 spectrophotometer. BOD5 was measured by an OxiTop® set. Total organic carbon (TOC) was determined according to the EN 1484:1999 standard with a TOC-L analyzer (Shimadzu, Kyoto, Japan) with an OCT-L8-port sampler (Shimadzu, Kyoto, Japan). The combustion temperature was set to 680 °C.
3. Results and Discussion
3.1. The Characteristics of Raw LL
The characteristics of raw LL samples are presented in Table 3. LL had dark brown color (Figure 8), characteristic odor, and high salinity. COD was in the range 1045-1715 mg O2/dm3. TOC and UV254 absorbance were as follows: 362-543 mg C/dm3 and 11.75-11.92 cm-1, respectively. Attention deserves low ratio BOD5/COD demonstrating low biodegradability of this leachate
3.2. The Impact of Different Parameters on the Efficency of IME Process
3.2.1. The Impact of pH and PC on the Efficiency of IME Process
The results of studies on the impact of pH values (2, 3 and 4) on the efficiency of the m-IME process (after 120 min) for Fe/GAC doses range from 20/2 to 40/120 g/L are presented in Figure 1. The results show a clear relationship between the efficiency of the PC process and pH – the decrease in the pH value, increased the COD removal of LL caused by PC increased. At pH 2, the PC process allowed for reduction of COD value by 15.6%, at pH 3 by 9,4% and at pH 4 by with 3.1% (Figure 1).
The PC process was first described by Krzysztoszek et al. [32], who used it to treat LL from a stabilized municipal waste landfill, before the Fenton process. The PC process at pH 2, 3 and 4 allowed to reduce COD values by: 42.2, 33.3 and 22.2%, respectively The high efficiency of PC was probably due to the presence of a large amount of humic substances in the LL, as evidenced by the low degree of biodegradability of organic compounds present in the leachate (BOD5/COD 0.073) The PC process is based on the phenomenon of decreasing the solubility of humic substances as the pH value of the LL decreases. The decrease in the solubility of these substances results from the regression of their dissociation and the disappearance of the negative charge stabilizing the macromolecule. Kucharska et al. obtained a 22.4% reduction in COD value in the PC process at pH 3 (before the IME/O3/H2O2 process). Similarly, Bogacki et al. in the PC process at pH 3 applied before the ZVI process achieved a reduction in COD values by 22.9% Lower values of COD removal by PC obtained in this research were probably related to the lower amount of humic substances in LL.
Figure 1.
Total COD removal after 120 min of the m-IME process conducted after PC at pH: 2, 3 and 4, for Fe/GAC doses in range: a) 20/2-20/60 g/L, b) 30/3-30/90 g/L, and c) 40/4-40/120 g/L – sample 1.1.
Figure 1.
Total COD removal after 120 min of the m-IME process conducted after PC at pH: 2, 3 and 4, for Fe/GAC doses in range: a) 20/2-20/60 g/L, b) 30/3-30/90 g/L, and c) 40/4-40/120 g/L – sample 1.1.
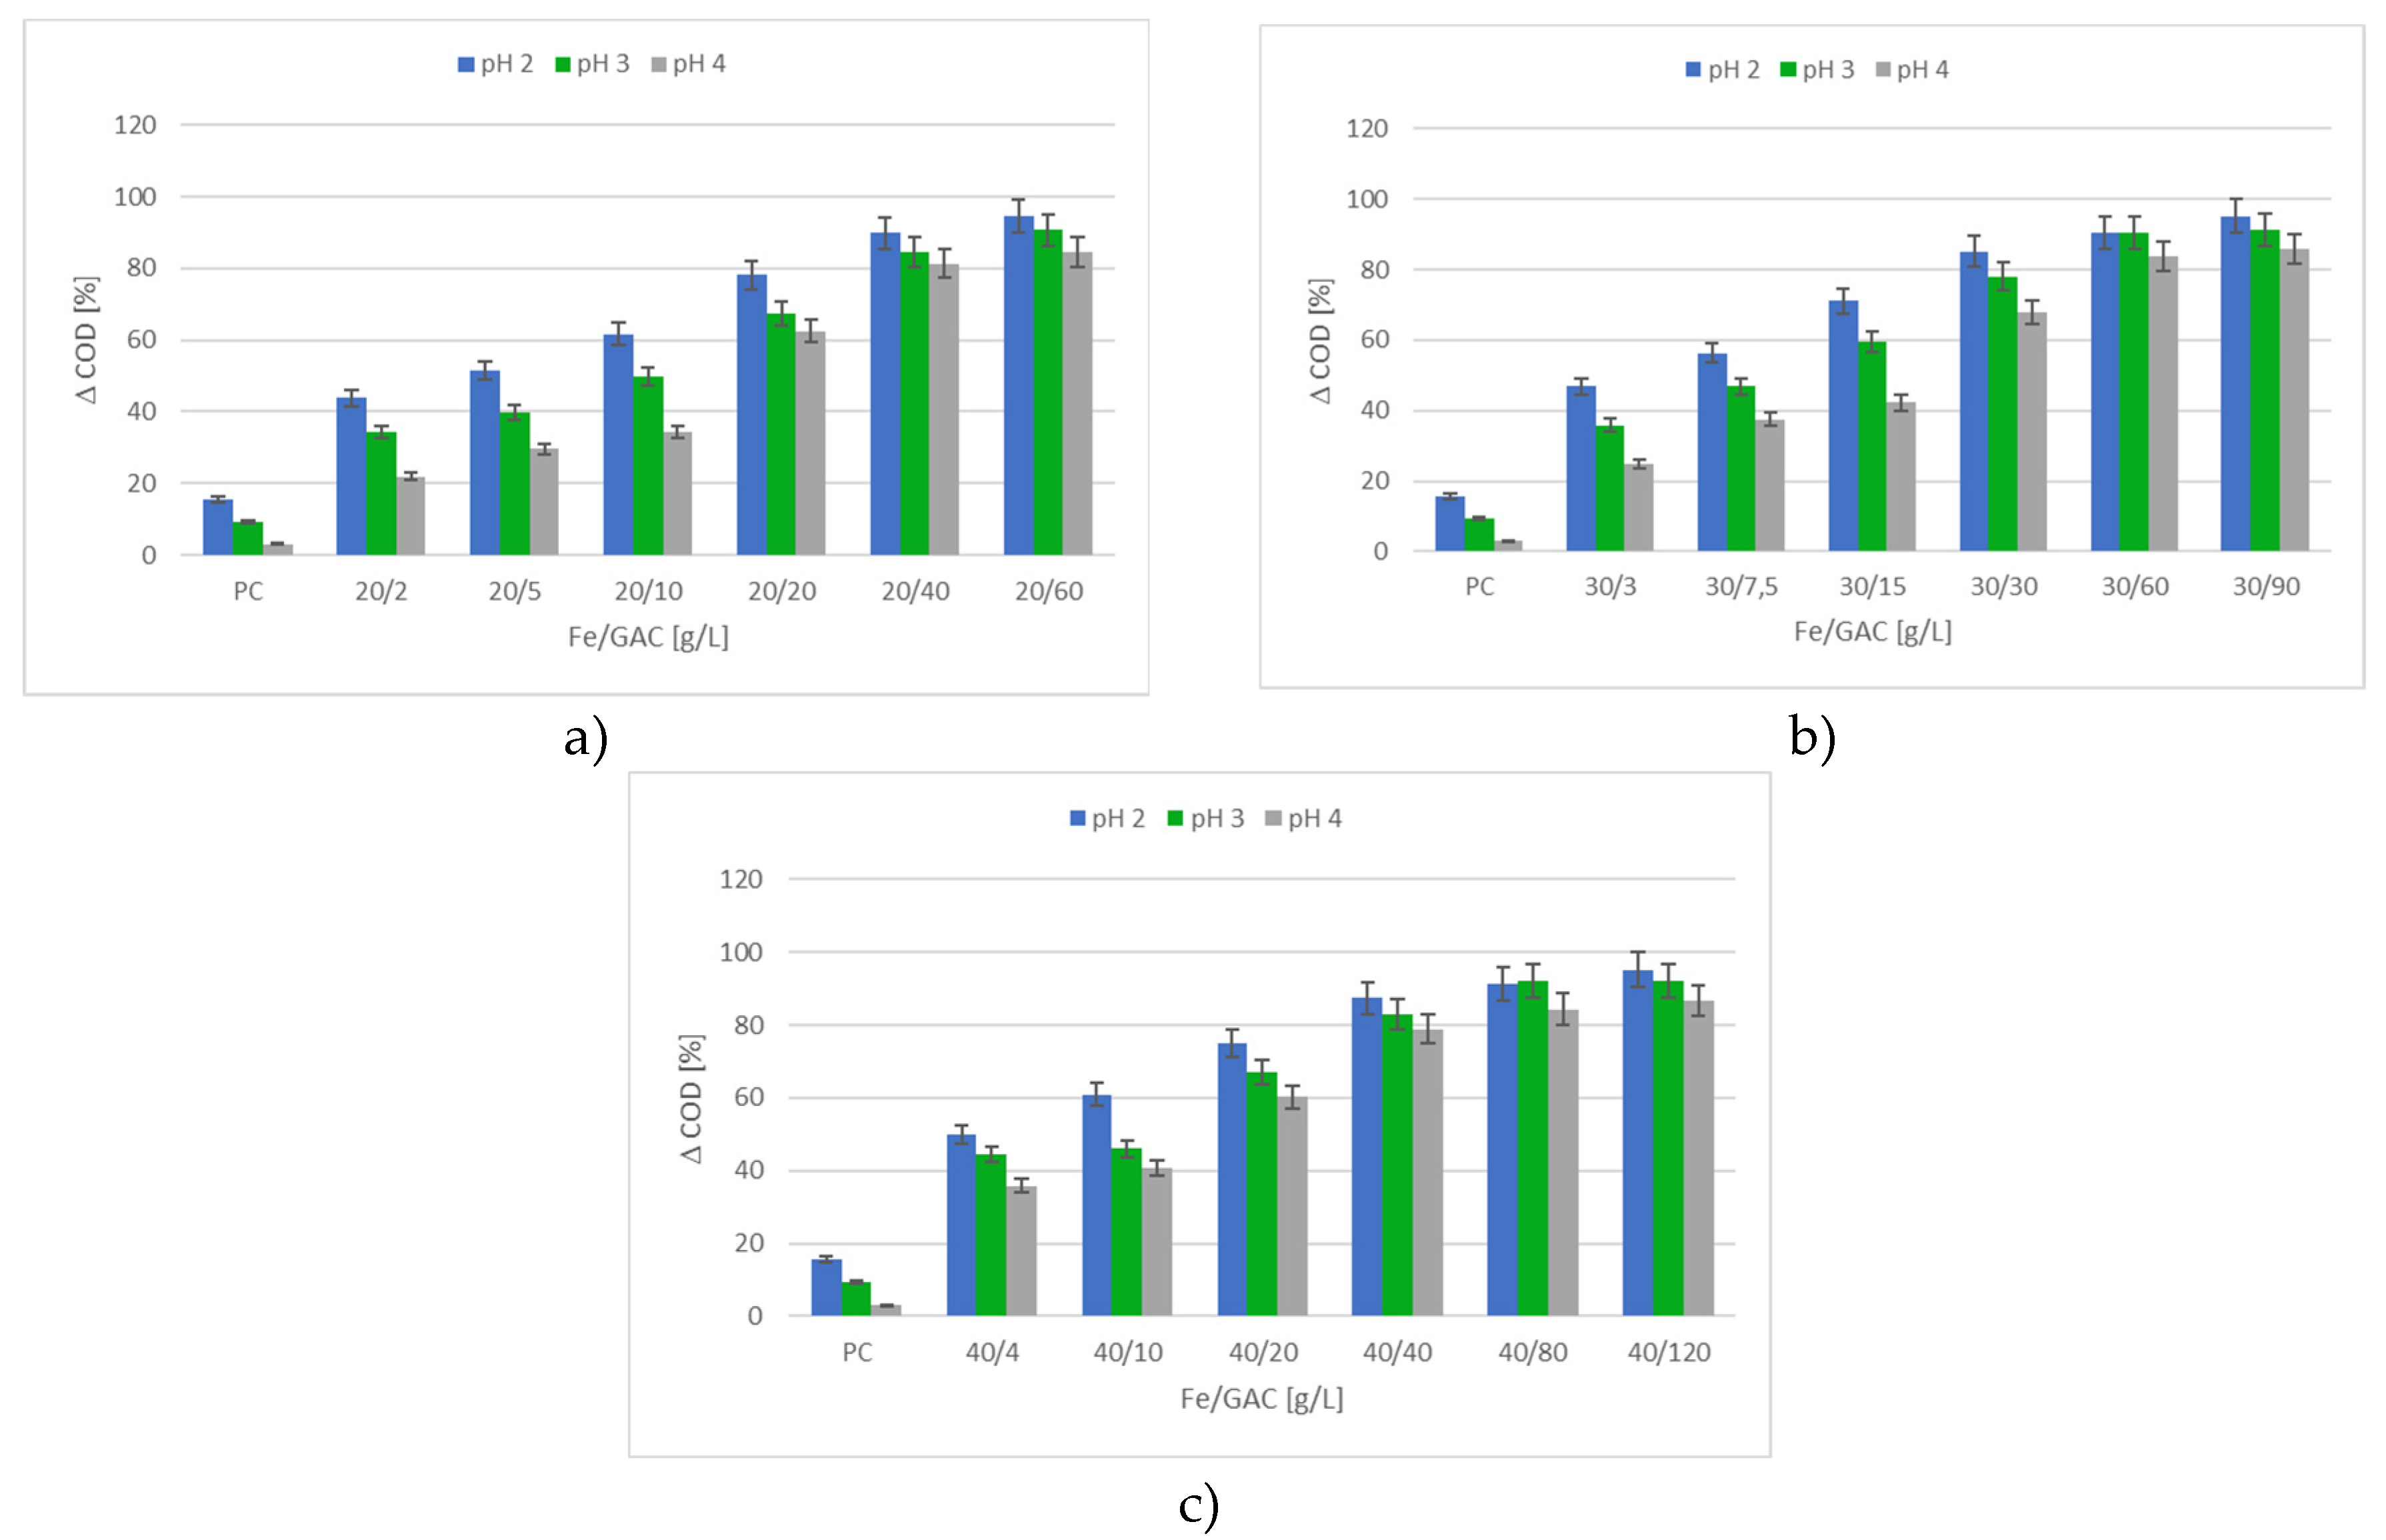
The highest COD removal was obtained in the m-IME process conducted at pH 2 in the full range of Fe/GAC doses - 20/2-40/120 g/L (Figure 1 a-c). The COD removal obtained in the same process conducted at pH 3 was slightly lower, maximally by 11,0% (Figure 1 a-c). The lowest purification effect was obtained in the m-IME process conducted at pH 4 (Figure 1 a-c) -COD removal was lower 14.1-8.6% for all Fe/GAC range of doses than COD removal obtained in pH 3.
The effect of pH on the efficiency of the m-IME process varied depending on the Fe/GAC dose. The strongest effect of pH on process efficiency was observed for the lower doses of microelectrodes, up to Fe/GAC doses of 20/60, 30/60, 40/80 g/g/L. Above these doses, the differences in COD removals between pH 2 and pH 3 were less significant (Figure 1), and did not exceed 3,1%. In the m-IME process at pH 4, this effect was not observed. The COD removal obtained for all Fe/GAC doses was about 10% lower than the COD removal obtained at pH 3. This phenomenon can be explained by the complex mechanism of the IME process. The IME process efficiency consists mainly of the efficiency of ZVI and sorption processes. For higher doses of microelectrodes probably dominates sorption process which is less dependent on pH value. That issue was discussed in more detail elswhere [31,34]. Moreover, the higher efficiency of the m-IME process at a lower pH is also probably related to the significant removal of humic substances in the PC process at a lower pH. Therefore, at a lower pH, the negative effect of HS (humic substances) on the sorption on GAC and microelectrolysis process is very low - carbon pores and the surface of the microelectrodes are only slightly blocked by macromolecular particles and HS flocks after acidification.
Due to the higher acid consumption required to obtain pH 2 and slightly worse COD removal obtained at pH 3 compared to pH 2, pH 3 was considered to be the optimal pH in the m-IME process.
3.2.2. Efficiency of the m-IME and c-IME Processes
Studies on the comparison of the efficiency of the m-IME and c-IME processes were carried out only at pH 3. The differences between the efficiency of the m-IME and c-IME processes for microelectrodes doses in the range of 20/2-40/120 g/L are shown in Figure 2a)-c).
Results showed that the separation of HS in PC step positively affected the COD removal. Studies on the m-IME process showed that it is possible to achieve high efficiency of COD removal - the maximum efficiency of the process was ranged from 34.4 to 92.2%, depending on the doses of microelectrodes used (Fe/GAC from 20/2 to 40/120 g/g/L). Lower efficiency of the IME process was observed in the case of the process conducted without PC (c-IME), however, the differences in the efficiency of the m-IME and c-IME processes with the increase in doses were similar. In the entire range of microelectrodes, the COD removals obtained in the modified process were higher than the COD removals obtained in the classic process by approximately 5.5 to 7.0%. The PC process conducted alone allowed for COD removal 9.4%. Application of PC before IME process allows avoiding negative phenomena of covering microelectrodes with flocks of HS and blocking the active surface of microelectrodes. It is also worth noting that for lower doses of GAC the oxidation processes (mainly ZVI) dominate over sorption process. Therefore, in further studies focused on better understanding the nature of IME process lower doses of microelectrodes were used – mainly the Fe/GAC ratio 40/10 g/L.
3.2.3. Effects of Fe/GAC Doses
Results of research on the efficiency of the m-IME process (pH 3, 120 min) with the use of Fe/GAC microelectrodes in the following ratios and doses are depicted:
However, the COD removal in the m-IME and c-IME processes increased with the increase in carbon and iron doses in the Fe/GAC, the dose of the microcathode in the system affect that rise stronger. Moreover, this increase was not the same across the dose range. In m-IME process (sample 1.1—Figure 2 a)) for the Fe dose of 20 g/L, an intensive increase in the total COD removal was observed up to the Fe/GAC dose of 20/40 g/L (CODtotal removal 84.4%), in case of 30 g/L to the Fe/GAC dose of 30/60 g/L (CODtotal removal 90.6%), and in case of 40 g/L to the Fe/GAC dose of 40/40 g/L (CODtotal removal 92.2%). With a further increase in the GAC dose, the COD removal increased maximally by 6.2, 0.8%, for cast iron doses of 20, 30 g/L, respectively. For Fe dose of 40 g/L, an increase in the GAC dose from 40 to 60 g/L even did not cause any change in the COD removal.
On the other hand, process m-IME conducted with low GAC doses was characterized by low efficiency of COD removal. In Fe/GAC doses range from 20/2 to 70/7 g/L, the total COD removal was from 36.1 to 44.3% (Figure 2 a)). In the case of Fe/GAC doses from 20/4 to 70/14 g/L total COD removal was in the range of 40.2 – 54.9%, (Figure 2 b)).
An increase in the cast iron dose in the system for fixed, low carbon dose (2, 3 and 4 g/L) did not cause significant differences in the process efficiency in all range of Fe/GAC ratios 2/1–12/1. In the range of Fe/GAC doses from 4/2 to 48/4 g/L, minor changes in the total COD removal were observed (Figure 2 c)). With the increase of the microanode dose from 4 to 24 g/L in the system, and fixed microcathode dose of 2 g/L, the total COD removal changed slightly - only by 4%. An increase in the cast iron dose from 6 to 36 g/L for 3 g/L GAC caused an increase in the total COD removal also by 4%, while an increase in the cast iron dose from 8 to 48 g/L at a GAC dose of 4 g/L only by 2.5%.
It is difficult to compare those results with the results achieved by other authors. As was mentioned, most papers concern the use of single dose Fe/GAC 12/4 g/L [28] or Fe/GAC ratios: 1/1 [2a-c; 26], 3/0 [25] and 3/1 Although Ying et al present the results of studies for a wider range of Fe/GAC ratios (1/3; 2/3, 3/3; 4/3; 5/3 and 6/3), they also do not specify the specific amounts of microelectrodes used [2a-c]. Ying et al noted that an increase in COD removal was observed up to a Fe/GAC ratio of 3/3. Much lower IME process efficiency of 48.9% and 45.0% was obtained by Ying in. and Wu et al. [2a-c, 153]. The authors conducted the IME process at a higher pH (pH 5) and used different doses of Fe/GAC microelectrodes, which could have resulted in lower process efficiency.
Also, Kucharska et al conducted studies with the use of different doses of GAC (10, 20, 40, 60, 80, 100, and 120 g/L) with the same dose of cast iron at 20 g/L In this case, a noticeable increase in COD removal was observed up to the Fe/GAC dose of 20/80 g/L (76.7% reduction in COD after 60 min of the process at pH 3).
3.2.4. Effect of Time of the Process
Changes in COD removal in m-IME (pH 3) over time for two doses of Fe/GAC microelectrodes: 40/4 and 40/10 g/L are presented on the Figure 4.
Increase in the efficiency of COD value reduction in the IME process was observed with the time of the process up to a certain limit. The highest increase in the efficiency of the m-IME process was observed up to 15 minutes, for both microelectrodes doses of Fe/GAC, 40/4 and 40/10 g/g/L the COD removal was 25.9% and 29.5% respectively. The process carried out to 120 minutes allowed to reduce COD value by an additional 12.5% in case of sample 1.1 and 15.1% in case of sample 1.3 (Figure 4). Due to the fact that in most cases the highest increase in COD removal was observed during the first 120 minutes, that time was considered to be the optimal process time. Extending the process time by another 120 minutes resulted in an increase in COD removal by about 7%.
Although there are several publications in which the authors give the optimal time of the IME process, there is a lack of detailed research on the effect of the time of the process, the effectiveness of COD removal and the results obtained by different authors are practically impossible to compare due to the differences in the conditions of the process. Different authors suggest different optimal times for the IME process: 20 min [28], 60 min [25,26,31] and 90 min [30, 2a-c]. In column experiments, the concept of bed-leachate contact time, regulated flow time [3], or HRT/retention time [25, 2a-c] is used, the authors report 60 minutes as the optimal process time, but the comparison of their results with the results obtained in stationary reactors can only be approximate. Ying, on the other hand, conducting a column experiment, proposed a total time of 90 minutes for the sequential IME process. (D COD 73.7%) (without aeration—60 min. (COD 48.9%), with aeration—90 min (58.5%) [2a-c]. In the case of the experiment conducted in stationary reactors, 60 minutes was also considered to be the optimal process time [26,31] (COD removal of 90.27% and 76.7%, respectively). On the other hand, Wu achieved the maximum COD removal (45%) in the first 20 minutes of the IME process The longest process time (90 minutes) is proposed by Zhao (D COD 75-80%)
During the studies on the effectiveness of m-IME, an increase in pH was observed over time, which is probably a result of electrode reactions (reaction 7). Figure 5 presents the results of the studies on the changes in pH during the z-IME process from 15 to 240 min.
3.3. Hybrid Process m-IME/H2O2
The results of the studies comparing the efficiency of total COD removal in the processes: m-IME process, m-IME/H2O2, with the addition of H2O2 at the beginning of the m-IME process (tIME0) and the sorption process for GAC dose used in the m-IME process (10 g/L) are presented in Figure 6 for sample 1.3. The hydrogen peroxide was added in m-IME/H2O2 process in three different doses of H2O2 in relation to COD; 1/1, 2/1 and 3/1.
Generally, the addition of hydrogen peroxide from the beginning of the m-IME/H2O2 process resulted in an improvement of the efficiency of COD removal compared to the m-IME process. For the dose of hydrogen peroxide in the mass ratio COD/H2O2 = 1/1, the improvement of COD removal ranged from 8.0% after 15 minutes to 10.7% after 240 minutes. For higher doses (mass ratio COD/H2O2 = 1/2 and 1/3), the improvement was higher and rose with the time of the process: from 11.6% after 15 minutes to 23.2% after 240 minutes for COD/H2O2 = 1/2 and from 20.5% after 15 minutes to 31.3% after 240 minutes for COD/H2O2 = 1/3. It is also worth noticing that the differences in efficiency between higher doses (COD/H2O2 1/2 and 1/3) decreased with time and after 60 min it almost disappeared. After 120 min of the process with H2O2 efficiency of COD removal for ratio COD/H2O2 = 1/2 was 76,0% which was almost two times higher than in case of the m-IME process.
In the available literature, there are some papers in which the authors investigated the efficiency of the IME process with H2O2 adding, from the beginning of the process. Wang achieved a COD removal of 74.59% at a dose of H2O2 of 12.32 ml/L [3], Huang of 79.2% at a dose of H2O2 of 0.75 mM) Other authors obtained higher efficiency in COD removal, but they used higher doses of H2O2. Song et al. achieved a COD removal of 86.9% at a dose of H2O2 of 1687.6 mg H2O2/L [29] and Luo et al. obtained a COD removal of 90.2% at a dose of H2O2 of 3.57 g H2O2/L [26] or carried out a process with aeration of Ying et al. (D COD 87.0%, dose of H2O2 100 mg H2O2/L and D COD 93.0%, dose of H2O2 200 mg H2O2/L) [2a-c].
In methods based on hydroxyl radicals the excess of hydrogen peroxide could inhibit the process by acting as hydroxyl radical scavengers. To overcome this problem some authors, recommend dosing H2O2 in stages Therefore, in the presented work, the effect of the addition of H2O2 in m-IME process was investigated not only at the beginning of the process but also after 120 minutes. How it was mentioned before, the pH value of the solution increased during the m-IME process and after 30 min of the process it reached values over 6. Therefore, in presented studies also the effect of the pH correction to value 3, before addition of H2O2, was investigated. The results of research on the efficiency of the m-IME/H2O2 process carried out with H2O2 added after 120 min of the z-IME process with and without pH correction are presented on Figure 7 for sample 1.3.
The addition of hydrogen peroxide after 120 min of the m-IME/H2O2 process (tIME 120 min) caused a further decrease in COD values compared to the m-IME process. The highest increase in COD removal was observed up to 15 minutes after addition of H2O2. Depending on the H2O2 dose and pH correction, an efficiency improvement by 20.6 up to 33.1% was achieved compared to the 120 min m-IME process. By extending the process time of m-IME/H2O2 to 240 minutes, further efficiency improvement up to 11% was achieved.
However, in case of lower doses of H2O2 (in ratio COD/H2O2 = 1/1) the correction of pH value resulted in the improvement in efficiency of COD removal max by 8% in relation to the efficiency of m-IME/H2O2, conducted without correction of pH. In the case of higher doses of H2O2 (in ratio COD/H2O2 = 1/2) that positive effect was almost insignificant.
The presented results are innovative and suggest that the mechanism of the process is complex and requires much more extensive research in order to describe it accurately. The observed trends may be related to the change in the stability of the H2O2 molecule depending on pH – as the pH increases, the stability of the molecule decreases. Similarly, the Fenton reaction (8), which results in the formation of hydroxyl radicals, is more effective at pH < 4. On the other hand, acidic impurities present in LL will be more easily oxidized due to the dominance of dissociated forms in solution at a higher pH. The resultant of all these phenomena determines the efficiency of the process at a given pH value.
The efficiency of COD removal in the m-IME/H2O2 process conducted with the addition of hydrogen peroxide after 120 minutes of the m-IME process was higher than the process carried out with the addition of hydrogen peroxide from the beginning of the m-IME process. For the dose of COD/H2O2 1/2 hydrogen peroxide after a total time of 150 min of the process (120 min m-IME + 30 min m-IME/H2O2), the COD removal was obtained as after 240 min of the m-IME/H2O2 process (77.7%) with the addition of H2O2 from the beginning, regardless of the pH correction. In case of dose 1/3 that effect was even more noticeable – the efficiency of the process m-IME/H2O2 after 135 min (120 min m-IME + 15 min m-IME/H2O2) reached the efficiency (77.7%) of the m-IME/H2O2 process after 180 min with the addition of H2O2 from the beginning and after 150 min it even slightly exceed. Those results seem to be valuable, because they show that the simple change of the moment of addition of H2O2 results in a significant improvement in process efficiency.
3.4. Characteristics of LL After Subsequent Purification Stages
After each step of step treatment of leachates: PC, m-IME and m-IME/H2O2 the improvement in COD efficency was observed from 12.5 to 82.1%. Similarly, the absorbance at 254 nm and the SUVA parameter decreased significantly after m-IME and m-IME/H2O2 processes (Table 4). The low value of these parameters indicates that the treated leachate contains low amounts of high molecular weight compounds [36,37]. Those results well corelate with the significant increase in biodegrability (BOD5/COD ratio) of treated LL - from 0.12 to 0.32 after the m-IME process and to 0.39 after the m-IME/H2O2 process. Additionally total nitrogen content decreased in LL after treatment up to 198 mg/L.
Figure 8.
Efficiency of LL treatment, from the left: raw leachate, after PC, after m-IME and after m-IME/H2O2 (sample 1.3).
Figure 8.
Efficiency of LL treatment, from the left: raw leachate, after PC, after m-IME and after m-IME/H2O2 (sample 1.3).
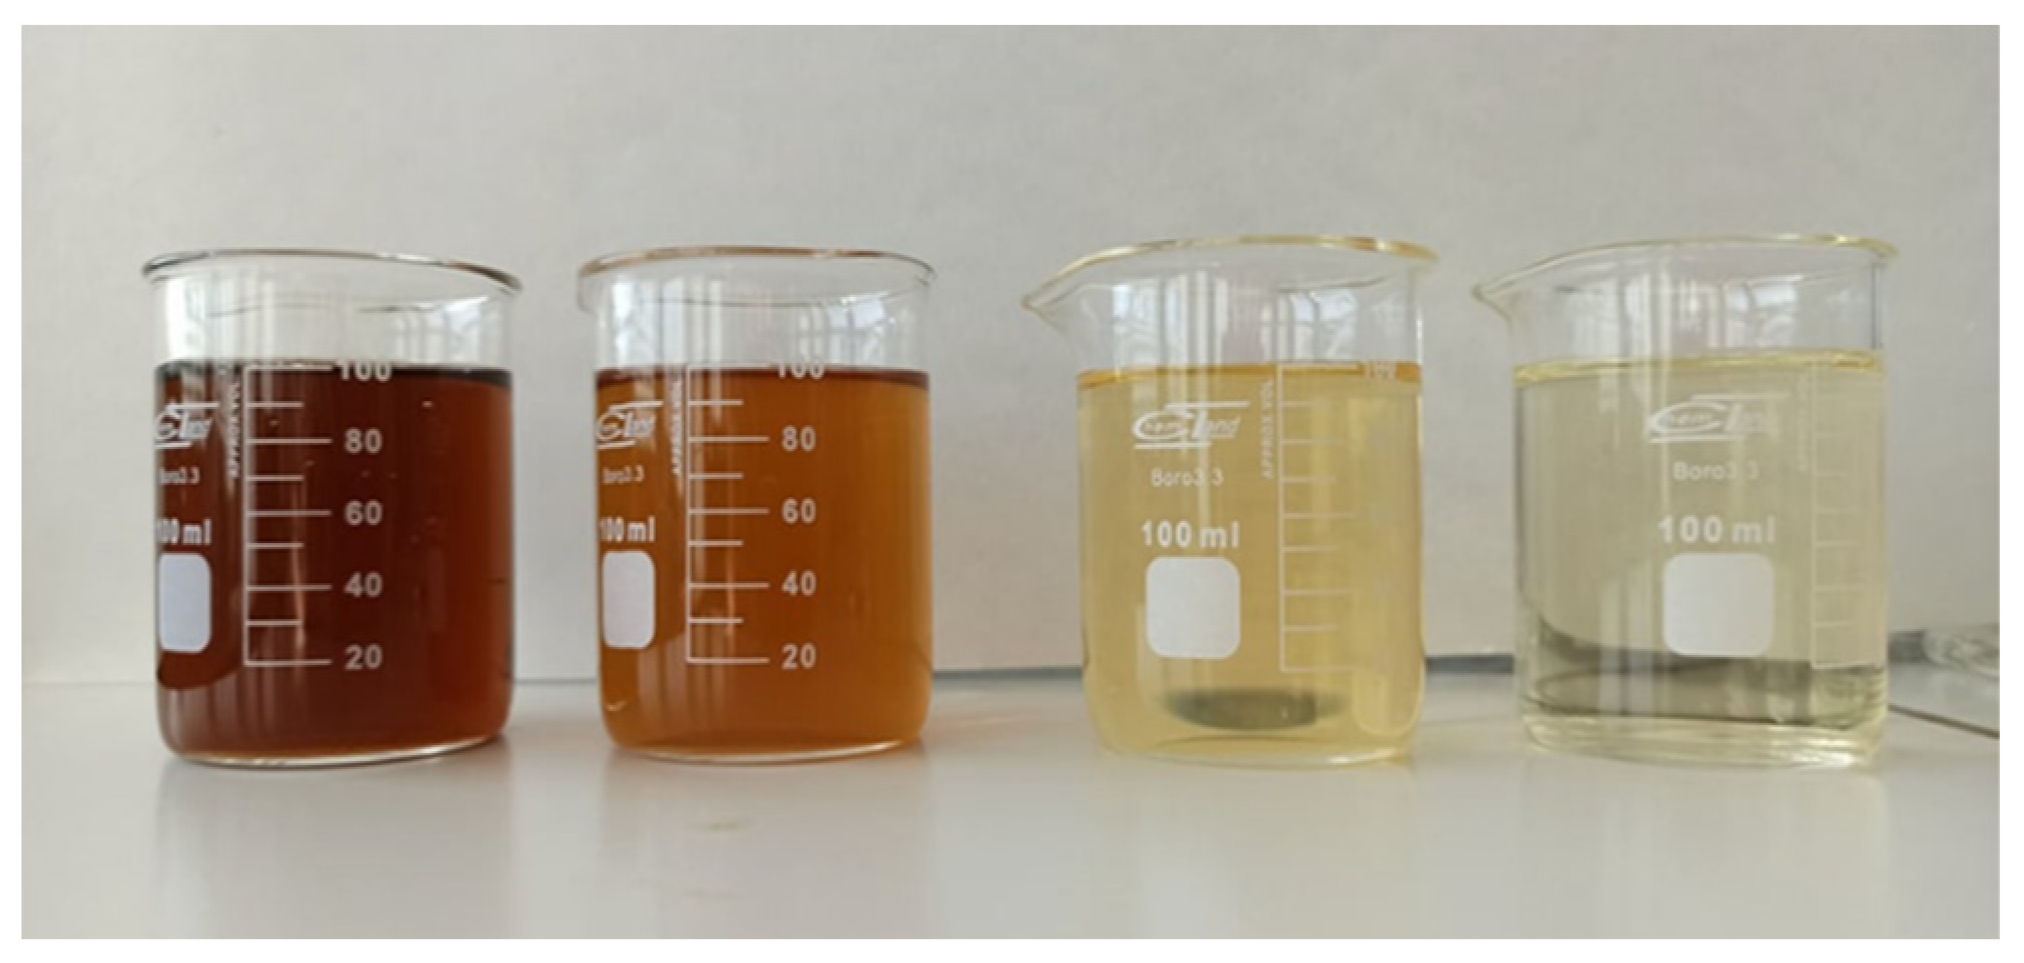
There was also observed the change of the color of the solution. Initially dark brown color during the IME process turned into orange or yellow depending on the parameters of the process. After 120 min of m-IME/H2O2 (for optimal parameters) the solution was almost colorless. (Figure 8).
3.5. Comparison of the Efficiency of IME* and Sorption Processes with a Use of GAC Soaked in LL
The results of the experiments with the use of GAC 4H subjected to preliminary saturation before IME process in the LL: raw (pH 7.8) and LL after PC at pH 3 are presented for pr. 1.4 in Table 5. The results obtained in the c-IME* and m-IME* processes (Fe/GAC 40/10 g/L) were compared with the results for the IME process and sorption on GAC without pre-saturation for the same LL sample.
Presented results show that after 24 h of soaking in LL GAC still could adsorb some loan of impurities from new portion of the LL - after transferring preliminary soaked in LL GAC to the new batch of LL, after 60 min additional sorption process an additional value of COD removal was obtained. The value of additional COD removal depended on the type of LL in which GAC was preliminary soaked and the type of LL in which additional sorption was carried out.
The total COD removal in the “sorption” (there is sorption toegether with precipitation of HS from acidic solution) process from raw LL, acidified to pH 3 (without PC), with the use of GAC soaking in raw leachates at pH 7.8 was 21.9%. Similarly, the “sorption” from raw LL with a use of GAC after soaking in LL after PC in pH 3 was: 18.1%. The presented results show that some additional sorption on GAC occurred – COD removal is higher than those caused only by PC (16.2%), especially in case of GAC soaking in raw LL.
In the case of the LL after PC the additional sorption process investigated on the GAC soaked in raw LL was the most significant – 18.7%. It is worth noticing that the total COD removal in c-IME process conducted with a use of that type of GAC was 38.1%, thus the additional sorption (which was assumed by most authors as not occurring in LL after soaking in LL) has big share in COD removal. On the contrary, additional sorption on the GAC soaking in LL after PC and from the LL also after PC in pH 3, was insignificantly low – 1.1% (the total COD removal in m-IME process with a use of that GAC was 40.9%).
Presented results clearly show that the assumption which is made by some authors that after soaking GAC in LL the sorption is eliminated from the IME process is wrong. That phenomenon could be explained based on the nature of sorption process – soaking of GAC in LL lead to establishing some sorption balance and some saturation of GAC, but after transferring GAC to the new portion of LL new sorption balance must be establish and additional sorption on GAC occurs. The only way of almost total elimination of sorption from IME process is conducted the process in LL after PC and with a use of GAC after soaking in LL also after PC.
Table 5.
Comparison of the efficiency of IME*, IME and sorption processes depending on the GAC saturation method; in raw LL at pH 7.8 and after PC at pH 3 and also without pre-saturation.
Table 5.
Comparison of the efficiency of IME*, IME and sorption processes depending on the GAC saturation method; in raw LL at pH 7.8 and after PC at pH 3 and also without pre-saturation.
| Sample 1.4, COD 1715 mg O2/L | ||
| GAC saturated in raw LL pH 7,8 | GAC saturated in LL after PC pH 3 (COD after PC 1438 mgO2/L) | |
| c-IME* Fe/GAC 40/8 g/L, 60 min | ||
| COD [mg O2/L] | 1144 | 1078 |
| D COD total. [%] | 33.3 | 37.1 |
| Sorption in acidified LL pH 3, time 60 min | ||
| COD [mg O2/L] | 1340 | 1405 |
| D COD total. [%] | 21.9 | 18.1 |
| m-IME* Fe/GAC 40/8 g/L, 60 min, D COD after PC 16,2% | ||
| COD [mg O2/L] | 1062 | 1013 |
| D COD [%] | 26.1 | 29.5 |
| D COD total. [%] | 38.1 | 40.9 |
| Sorption in LL after PC at pH 3, time 60 min | ||
| COD [mg O2/L] | 1177 | 1422 |
| D COD [%] | 18.7 | 1.1 |
| D COD total. [%] | 31.4 | 17.1 |
|
IME (GAC whitout preliminary saturation) | ||
| c-IME | m-IME | |
| COD [mg O2/L] | 947.7 | 817.0 |
| D COD [%] | Not applicable | 43,2 |
| D COD total. [%] | 44.7 | 52.4 |
|
Sorption in LL after PC at pH 3 (GAC whitout preliminary saturation) | ||
| COD [mg O2/L] | 1078 | 1045 |
| D COD [%] | Not applicable | 34.6 |
| D COD total. [%] | 37.1 | 39.0 |
4. Conclusions
Results showed that in case of all investigated processes (IME, IME/H2O2, IME*) the separation of HS in PC step positively affected the COD removal. PC allows avoiding negative phenomena of covering microelectrodes with flocks of HS and blocking the active surface of microelectrodes. Studies on the IME process showed that it is possible to achieve high efficiency of COD removal - the maximum efficiency of the process was ranged from 34.4 to 92.2%, depending on the doses of microelectrodes used (Fe/GAC from 20/2 to 40/120 g/g/L) and was obtained for the process carried out in a modified way (after PC) at pH 3 and for 120 min. It is also worth noting that for lower doses of GAC the oxidation processes (mainly ZVI) dominate over sorption process. For optimal conditions of the process, after each step of treatment: the PC, m-IME and IME/H2O2 processes, an increase in COD removal was observed and it was up to 12.5%, 44,6% and 82.2%, respectively. COD removal correlated well with a decrease in TOC values from 381 in row LL to: 326 mg/L after PC, m-IME and m-IME/H2O2: 130 mg/L and 88 mg/L, respectively.
The results showed that the effectiveness of the IME process depended on doses of Fe and GAC. For higher doses of Fe and GAC, higher efficiency of the IME process was observed. What is worth to notice the increase was not the same across the dose range and changes in GAC doses affect the effectiveness of the process much more strongly. The effectiveness of the IME process rose also with the time of the process up to 120 min. The highest increase in the efficiency of the m-IME process for the microelectrodes doses of Fe/GAC 40/4 and 40/10 g/g/L was observed for 120 minutes: 38.4 and 44.6% respectively.
The addition of hydrogen peroxide from the beginning of the m-IME/H2O2 process improved the efficiency of COD removal compared to the m-IME process. After 120 min of IME/H2O2 process the efficiency of COD removal for ratio COD/H2O2 = 1/2 was 76.0% which was almost two times higher than in case of the m-IME process. What is more the addition of that dose of H2O2 after 120 min of the m-IME process allowed to achieved better results in shorter time - after a total time of 150 min of the process (120 min m-IME + 30 min m-IME/H2O2), the COD removal was almost equal to that obtained after 240 min of the m-IME/H2O2 process (77.7%) with the addition of H2O2 from the beginning, regardless of the pH correction. Also, high color removal (the solution became almost colorless), reduction of the UV254 absorbance by 99.0%, and improvement of biodegradability - BOD5/COD ratio rose up to 0.39. These results show that the process ensures the LL is suitable for further biological treatment in municipal plants.
Presented results show that after 24 h of soaking in LL GAC still could adsorb some loan of impurities from new portion of the LL - after transferring preliminary soaked in LL GAC to the new batch of LL, after 60 min additional sorption process an additional value of COD removal was obtained – up to 38.1%. Therefore, presented results clearly show that the assumption which is made by some authors that after soaking GAC in LL the sorption is eliminated from the IME process is not correct.
Author Contributions
Conceptualization, methodology, validation: Joanna Ładyńska and Małgorzata Kucharska; formal analysis: Joanna Ładyńska; writing—original draft preparation, and review and editing: Joanna Ładyńska and Małgorzata Kucharska; supervision: Jeremi Naumczyk. All authors have read and agreed to the published version of the manuscript.
Funding
This research received no external funding.
Conflicts of Interest
The authors declare no conflicts of interest.
Abbreviations
The following abbreviations are used in this manuscript:
| IME | Internal Microelectrolysis |
| m-IME | Modified internal microelectrolysis |
| c-IME | Classic internal microelectrolysis |
| AOP’s | Advanced oxidation process |
| COD | Chemical oxygen demand |
| BOD | Biological oxygen demand |
| TOC | Total organic carbon |
| LL | Landfill leachate |
| PC | Preliminary coagulation |
| HS | Humic substances |
| SUVA | Specific UV Absorbance |
| AC | Activated carbon |
| GAC | Granular activated carbon |
| CNC | Computer Numerical Control |
| ZVI | Zero valent iron |
References
- Zang, H.; Xiang, L.; Zhang, D.; Qing, H. Treatment of landfill leachate by internal microelectrolysis and sequent Fenton process. Desalination and Water Treatment 2012, 47, 243–248. [Google Scholar] [CrossRef]
- Ying, D.; Xu, X.; Ch, Y.; Wang, Y.; Jia, J. Treatment of mature landfill leachate by a continuous modular internal micro-electrolysis Fenton reactor. Research on Chemical Intermediates 2012, 39, 2763–2776. [Google Scholar] [CrossRef]
- Ying, D.; Peng, J.; Xu, X.; Li, K.; Wang, Y.; Jia, J. Treatment of mature landfill leachate by internal micro-electrolysis integrated with coagulation: a comparative study on a novel sequencing batch reactor based on zero valent iron. Journal of Hazardous Materials 2012, 229–230, 426–433. [Google Scholar] [CrossRef] [PubMed]
- Ying, D.; Xu, X.; Li, K.; Wang, Y.; Jia, J. Design of a novel sequencing batch internal micro-electrolysis reactor for treating mature landfill leachate. Chemical Engineering Research and Design 2012, 90, 2278–2286. [Google Scholar] [CrossRef]
- Wang, L.; Yang, Q.; Wang, D.; Li, X.; Zeng, G.; Li, Z.; Deng, Y.; Liu, J.; Yi, K. Advanced landfill leachate treatment using iron-carbon microelectrolysis- Fenton process: Process optimization and column experiments. Journal of Hazardous Materials 2016, 318, 460–467. [Google Scholar] [CrossRef]
- Yang, Z.; Ma, Y.; Liu, Y.; Li, Q.; Zhou, Z.; Ren, Z. Degradation of organic pollutants in near-neutral pH solution by Fe-C microelectrolysis system. Chemical Engineering Journal 2017, 315, 403–414. [Google Scholar] [CrossRef]
- Li, X.; Jia, Y.; Qin, Y.; Zhou, M.; Sun, J. Iron-carbon microelectrolysis for wastewater remediation: Preparation, performance and interaction mechanisms. Chemosphere 2021, 278, 130483. [Google Scholar] [CrossRef]
- Mahdizadeh, H.; Malakootian, M. Optimization of ciprofloxacin removal from aqueous solutions by a novel semi-fluid Fe/charcoal micro-electrolysis reactor using response surface methodology. Process Saf. Environ. Protect. 2019, 123, 299–308. [Google Scholar] [CrossRef]
- Chen, R.; Chai, L.; Wang, Y.; Liu, H.; Shu, Y. Degradation of organic wastewater containing Cu-EDTA by Fe-C micro-electrolysis. Trans. Nonferrous Metals Soc. China 2012, 22, 983–990. [Google Scholar] [CrossRef]
- Lin, H.; Lin, Y.; Liu, L. Treatment of dinitrodiazophenol production wastewater by Fe/C and Fe/Cu internal electrolysis and the COD removal kinetics. Journal of the Taiwan Institute of Chemical Engineers 2016, 58, 148–154. [Google Scholar] [CrossRef]
- Wang, Y.; Wang, L.; Peng, P.; Lu, T. Treatment of naphthalene derivatives with iron-carbon micro-electrolysis. Trans. Nonferrous Metals Soc. China 2006, 16, 1442–1447. [Google Scholar] [CrossRef]
- Wu, L.; Liao, L.; Lv, G.; Qin, F.; He, Y.; Wang, X. Micro-electrolysis of Cr (VI) in the nanoscale zero-valent iron loaded activated carbon. J. Hazard Mater 2013. [Google Scholar] [CrossRef] [PubMed]
- Sun, Z.; Xu, Z.; Zhou, Y.; Zhang, D.; Chen, W. Effects of different scrap iron as anode in Fe-C micro-electrolysis system for textile wastewater degradation. Environ. Sci. Pollut. Res. 2019, 26, 26869–26882, 254–255, 277–283. [Google Scholar] [CrossRef] [PubMed]
- Malakootian, M.; Mahdizadeh, H.; Khavari, M.; Nasiri, A.; Gharaghani, M.A.; Khatami, M.; Sahle-Demessie, E.; Varma, R.S. Efficiency of novel Fe/charcoal/ultrasonic micro-electrolysis strategy in the removal of Acid Red 18 from aqueous solutions. J. Environ. Chem. Eng. 2020, 8, 103553. [Google Scholar] [CrossRef]
- Zhou, H.; Lv, P.; Shen, Y.; Wang, J.; Fan, J. Identification of degradation products of ionic liquids in an ultrasound assisted zero-valent iron activated carbon micro-electrolysis system and their degradation mechanism. Water Res. 2013, 47, 3514–3522. [Google Scholar] [CrossRef]
- Zhou, H.; Shen, Y.; Lv, P.; Wang, J.; Fan, J. Degradation of 1-butyl-3-methylimidazolium chloride ionic liquid by ultrasound and zero-valent iron/activated carbon. Separation and Purification Technology 2013, 104, 208–213. [Google Scholar] [CrossRef]
- Ruan, X.; Liu, M.; Zeng, Q.; Ding, Y. Degradation and decolorization of reactive red X-3B aqueous solution by ozone integrated with internal micro-electrolysis and zero-valent iron/activated carbon. Separ. Purif. Technol. 2010, 104, 208–213, Separ. Purif. Technol. 74, 195–201. [Google Scholar] [CrossRef]
- Zhang, X.; Dong, W.; Sun, F.; Yang, W.; Dong, J. Degradation efficiency and mechanism of azo dye RR2 by a novel ozone aerated internal micro-electrolysis filter. J. Hazard Mater. 2014, 276, 77–87. [Google Scholar] [CrossRef]
- Wang, Y.; Wu, X.; Yi, J.; Chen, L.; Lan, T.; Dai, J. Pretreatment of printing and dyeing wastewater by Fe/C micro-electrolysis combined with H2O2 process. Water Sci. Technol. 2018, 707–717. [Google Scholar] [CrossRef]
- Qin, Y.; Yu, L.; Luo, S.; Jiao, W.; Liu, Y. Degradation of nitrobenzene wastewater via iron/carbon micro-electrolysis enhanced by ultrasound coupled with hydrogen peroxide. China Pet. Process. Petrochem. Technol. 2017, 19, 72–81. [Google Scholar]
- An, L.; Xiao, P. Zero-valent iron/activated carbon microelectrolysis to activate peroxydisulfate for efficient degradation of chlortetracycline in aqueous solution. RSC Adv. 2020, 10, 19401–19409. [Google Scholar] [CrossRef] [PubMed]
- Xu, X.; Xi, B.; Zhang, Y.; Xia, F.; Han, X.; Gao, P.; Wan, S.; Jiang, Y.; Yang, Y. a comparative study on the treatment of 2,4-dinitrotoluene contaminated groundwater in the combined system: efficiencies, intermediates and mechanisms. Sci. Total Environ. 2020, 735, 139161. [Google Scholar] [CrossRef] [PubMed]
- Qin, L.; Zhang, G.; Meng, Q.; Xu, L.; Lv, B. Enhanced MBR by internal microelectrolysis for degradation of anthraquinone dye wastewater. Chem. Eng. J. 2012, 210, 575–584. [Google Scholar] [CrossRef]
- Xing, W.; Li, D.; Li, J.; Hu, Q.; Deng, S. Nitrate removal and microbial analysis by combined micro-electrolysis and autotrophic denitrification. Bioresour. Technol. 2016. [Google Scholar] [CrossRef]
- Zheng, X.; Jin, M.; Zhou, X.; Chen, W.; Lu, D.; Zhang, Y.; Shao, X. Enhanced removal mechanism of iron carbon micro-electrolysis constructed wetland on C, N, and P in salty permitted effluent of wastewater. 2019, 649, 21–30. [Google Scholar] [CrossRef]
- Xu, X.; Cheng, Y.; Zhang, T.; Ji, F.; Xu, X. Treatment of pharmaceutical wastewater using interior micro-electrolysis/Fenton oxidation-coagulation and biological degradation. Chemosphere 2016, 152, 23–30. [Google Scholar] [CrossRef]
- Zhang, X.; Wu, Y. Application of coupled zero-valent iron/biochar system for degradation of chlorobenzene-contaminated groundwater. Water Science and Technology 2017, 75, 571–580. [Google Scholar] [CrossRef]
- Huang, J.; Chen, J.; Xie, Z.; Xu, X. Treatment of nanofiltration concentrates of mature landfill leachate by a coupled process of coagulation and internal micro-electrolysis adding hydrogen peroxide. Environmental Technology 2014, 36, 1001–1007. [Google Scholar] [CrossRef]
- Luo, K.; Pang, Y.; Li, X.; Chen, F.; Liao, X.; Lei, M.; Song, Y. Landfill leachate treatment by coagulation/flocculation combined with microelectrolysis Fenton processes. Environmental Technology 2018, 40, 1862–1870. [Google Scholar] [CrossRef]
- Zhao, L.; Cheng, X.G.; Yin, P.H.; Lu, G.; Suo, J.C. The Performance of Microelectrolysis in Improving the Biodegradability Landfill Leachate. Applied Mechanics and Materials 2013, 448–453, 1399–1402. [Google Scholar] [CrossRef]
- Wu, L.; Chen, S.; Zhou, J.; Zhang, C.; Liu, J.; Luo, J.; Song, G.; Qian, G.; Song, L.; Xia, M. Simultaneous removal of organic matter and nitrate from bio-treated leachate via iron-carbon internal micro-electrolysis. Royal Society of Chemistry Adv. 2015, 5, 68356–68360. [Google Scholar] [CrossRef]
- Song, J.; Li, W.; Li, Y.; Mosa, A.; Wang, H.; Jin, Y. Treatment of landfill leachate RO concentration by Iron–carbon micro–electrolysis (ICME) coupled with H2O2 with emphasis on convex optimization method. Environmental Pollutants and Bioavailability 2019, 31, 49–55. [Google Scholar] [CrossRef]
- Zhao, Y.; Xua, Y.; Zhoua, S.; Liub, J.M.; Cheng, Y.; Fu, G.Y.; He, X.S. Field-scale performance of microelectrolysis-Fenton oxidation process combined with biological degradation and coagulative precipitation for landfill leachate treatment. In Proceedings of the 2019 4th International Conference on Advances in Energy and Environment Research (ICAEER 2019); Environmental Protection, Pollution and Treatment. 2019; Volume 118. [Google Scholar] [CrossRef]
- Kucharska, M.A.; Mirehbar, S.K.; Ładyńska, J.A. Novel combined IME-O3/OH*/H2O2 process in application for mature landfill leachate treatment. Journal of Water Process Engineering 2022, 45, 102441. [Google Scholar] [CrossRef]
- Krzysztoszek, A.; Naumczyk, J. Landfill Leachate Treatment by Fenton, Photo-Fenton Processes and their Modification. Journal of Advanced Oxidation Technologies 2012. [Google Scholar] [CrossRef]
- Bogacki, J.; Marcinowski, P.; El-Khozondar, B. Treatment of Landfill Leachates with Combined Acidification/Coagulation and the Fe0/H2O2 Process. Water 2019, 11, 194. [Google Scholar] [CrossRef]
- Joanna Ładyńska. Stabilized municipal landfill leachate treatment by the internal microelectrolysis proces. Doctoral dissertation, Warsaw Uniwersity of Technology, Warsaw, 2024. [Google Scholar]
- Zhou, W.; Zhao, H.; Gao, J.; Meng, X.; Wu, S.; Qin, Y. Influence of a reagents addition strategy on the Fenton oxidation of rhodamine B: control of the competitive reaction of ·OH. RSC Advances 2016, 6, 108791–108800. [Google Scholar] [CrossRef]
- Krupińska, I. Problemy związane z występowaniem substancji humusowych w wodach podziemnych. Zeszyty Naukowe Uniwersytet Zielonogórski, 2012. [Google Scholar]
- Pietrzyk, A.; Papciak, D. Wpływ właściwości związków organicznych na efektywność procesów uzdatniania wody-podstawy teoretyczne. Czasopismo Inżynierii Lądowej, Środowiska i Architektury, 2017. [Google Scholar] [CrossRef]
Figure 2.
Total COD removal after 120 min of the m-IME and c-IME process at pH 3, for Fe/GAC microelectrode doses ranging: a) 20/2 to 20/60 g/L, b) 30/3 to 30/90 g/L and c) 40/4 to 40/120 g/L (sample 1.1).
Figure 2.
Total COD removal after 120 min of the m-IME and c-IME process at pH 3, for Fe/GAC microelectrode doses ranging: a) 20/2 to 20/60 g/L, b) 30/3 to 30/90 g/L and c) 40/4 to 40/120 g/L (sample 1.1).
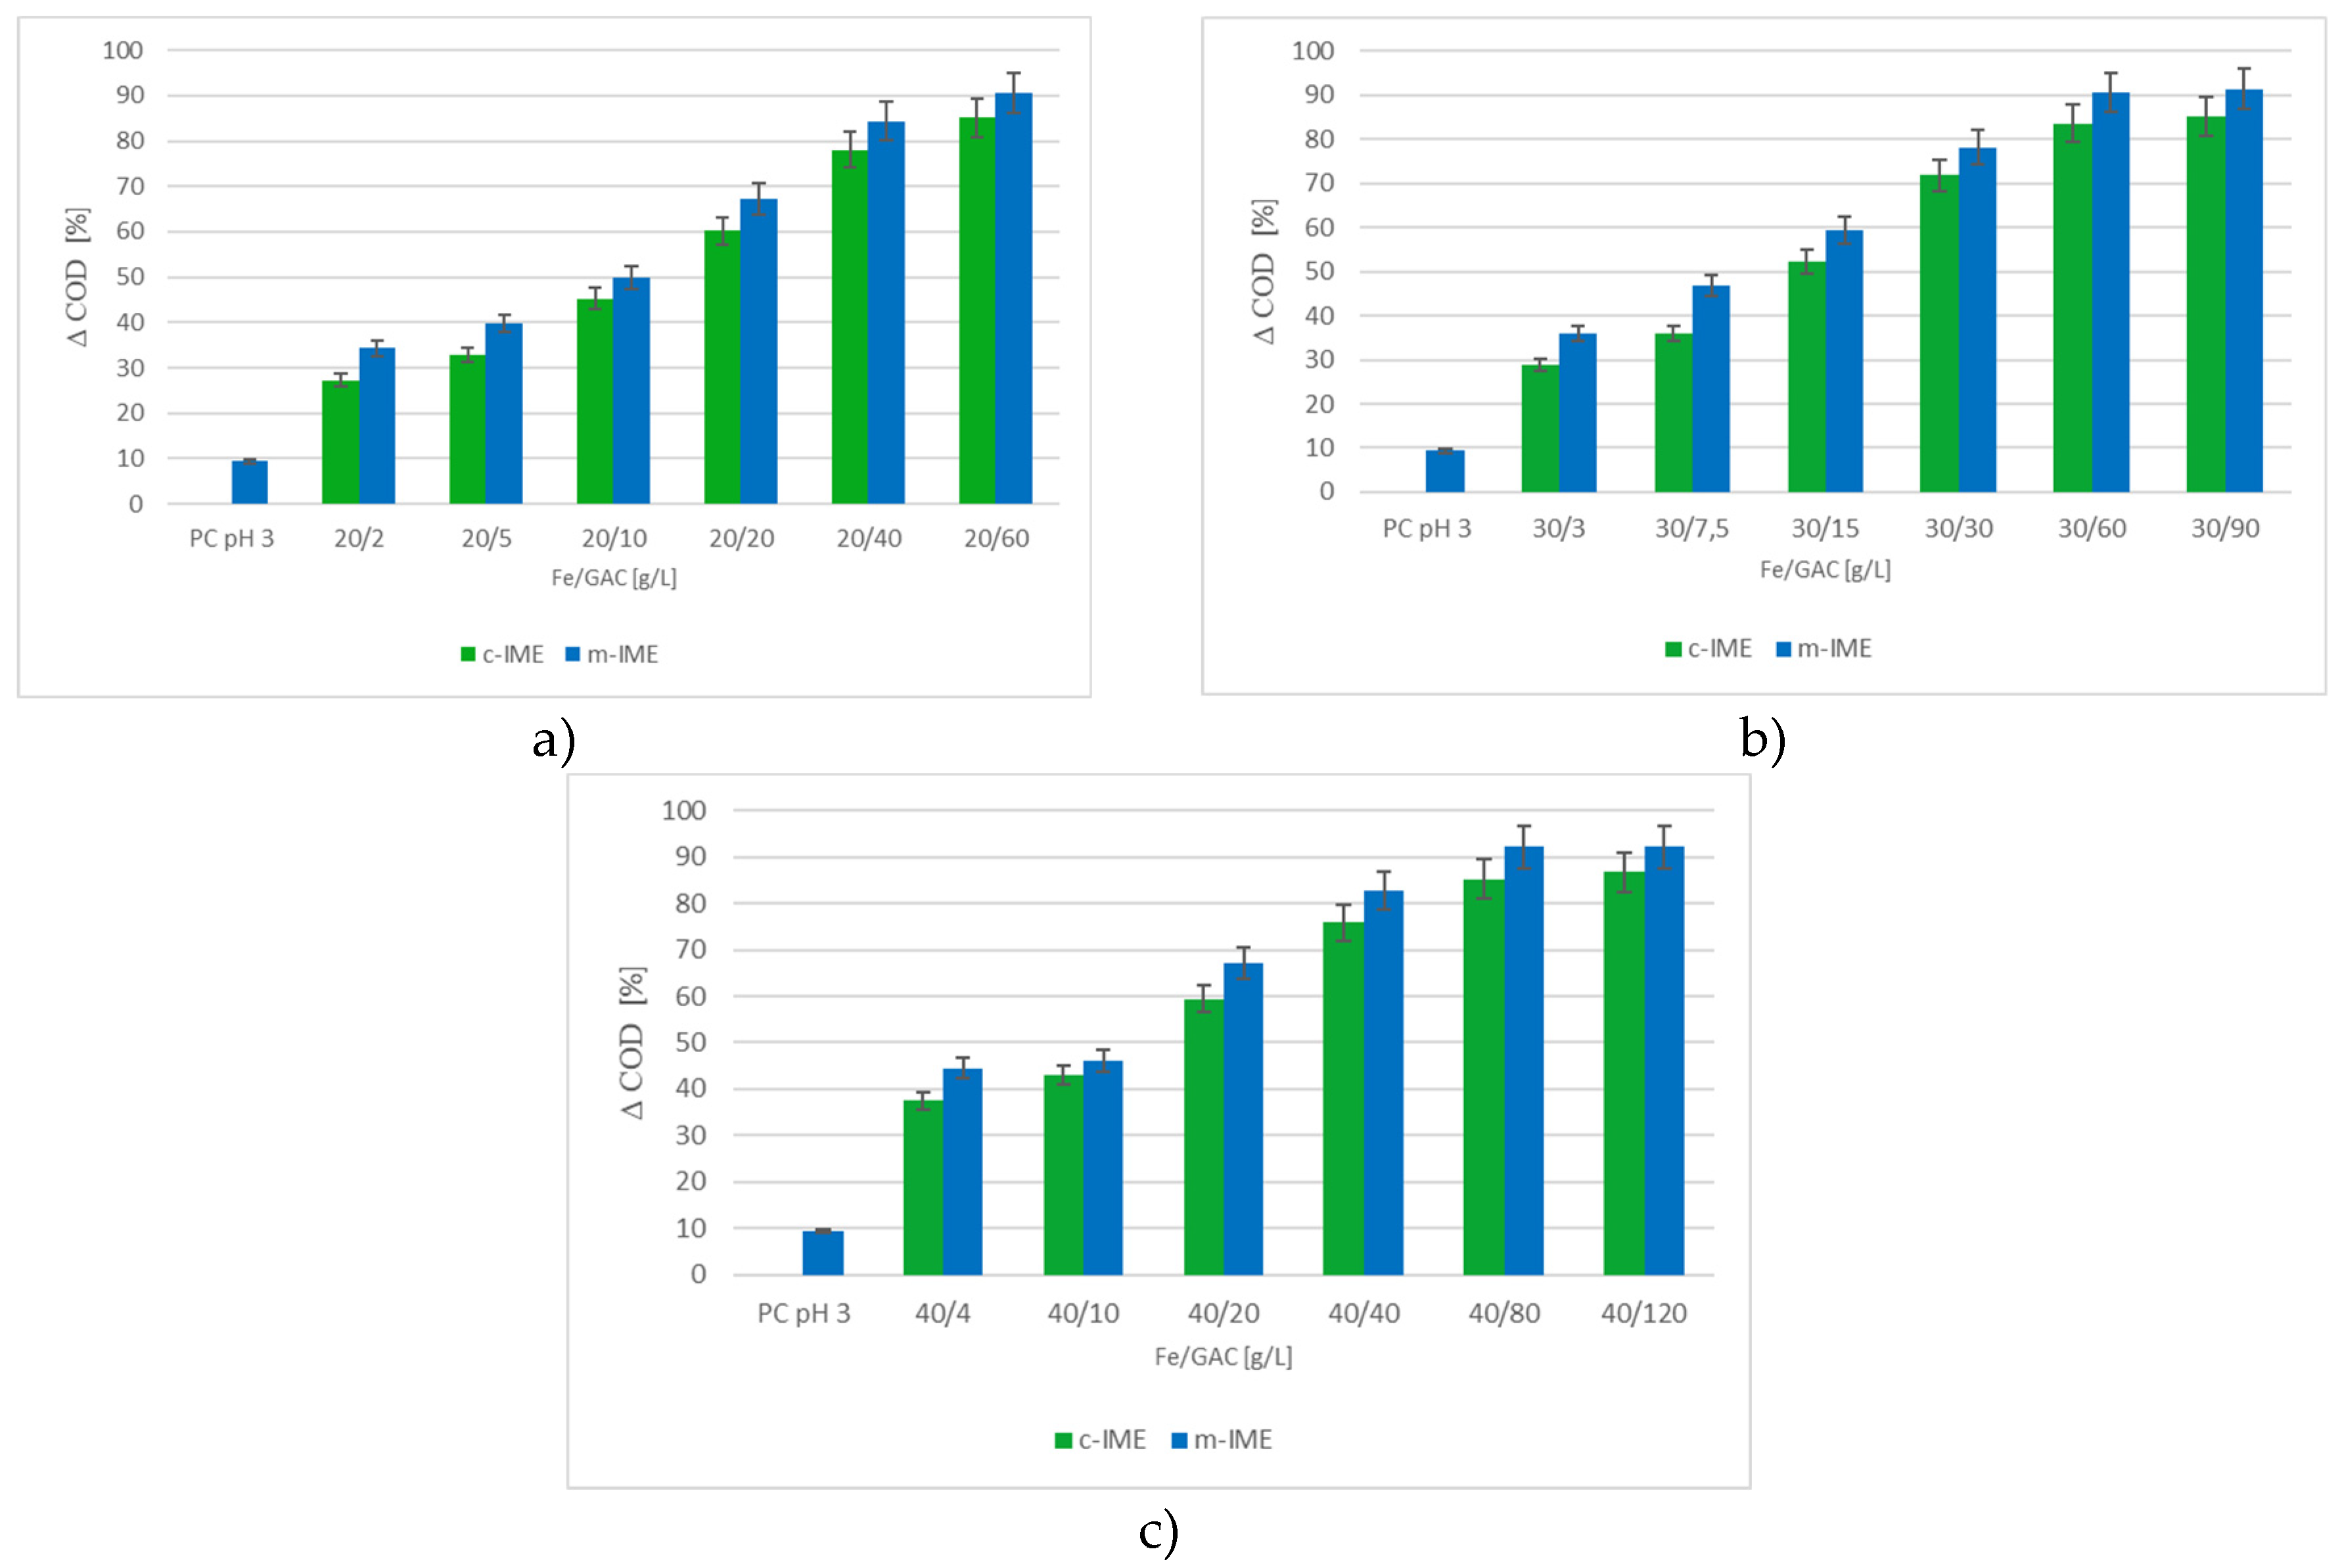
Figure 3.
Total COD removal after the m-IME process (120 min, pH 3), for Fe/GAC doses in the ranges: a) 20/2-70/7 g/L; b) 20/4-70/14 g/L and c) for Fe/GAC ratio 2/1–12/1, in range doses: 4/2-48/4, sample 1.2.
Figure 3.
Total COD removal after the m-IME process (120 min, pH 3), for Fe/GAC doses in the ranges: a) 20/2-70/7 g/L; b) 20/4-70/14 g/L and c) for Fe/GAC ratio 2/1–12/1, in range doses: 4/2-48/4, sample 1.2.
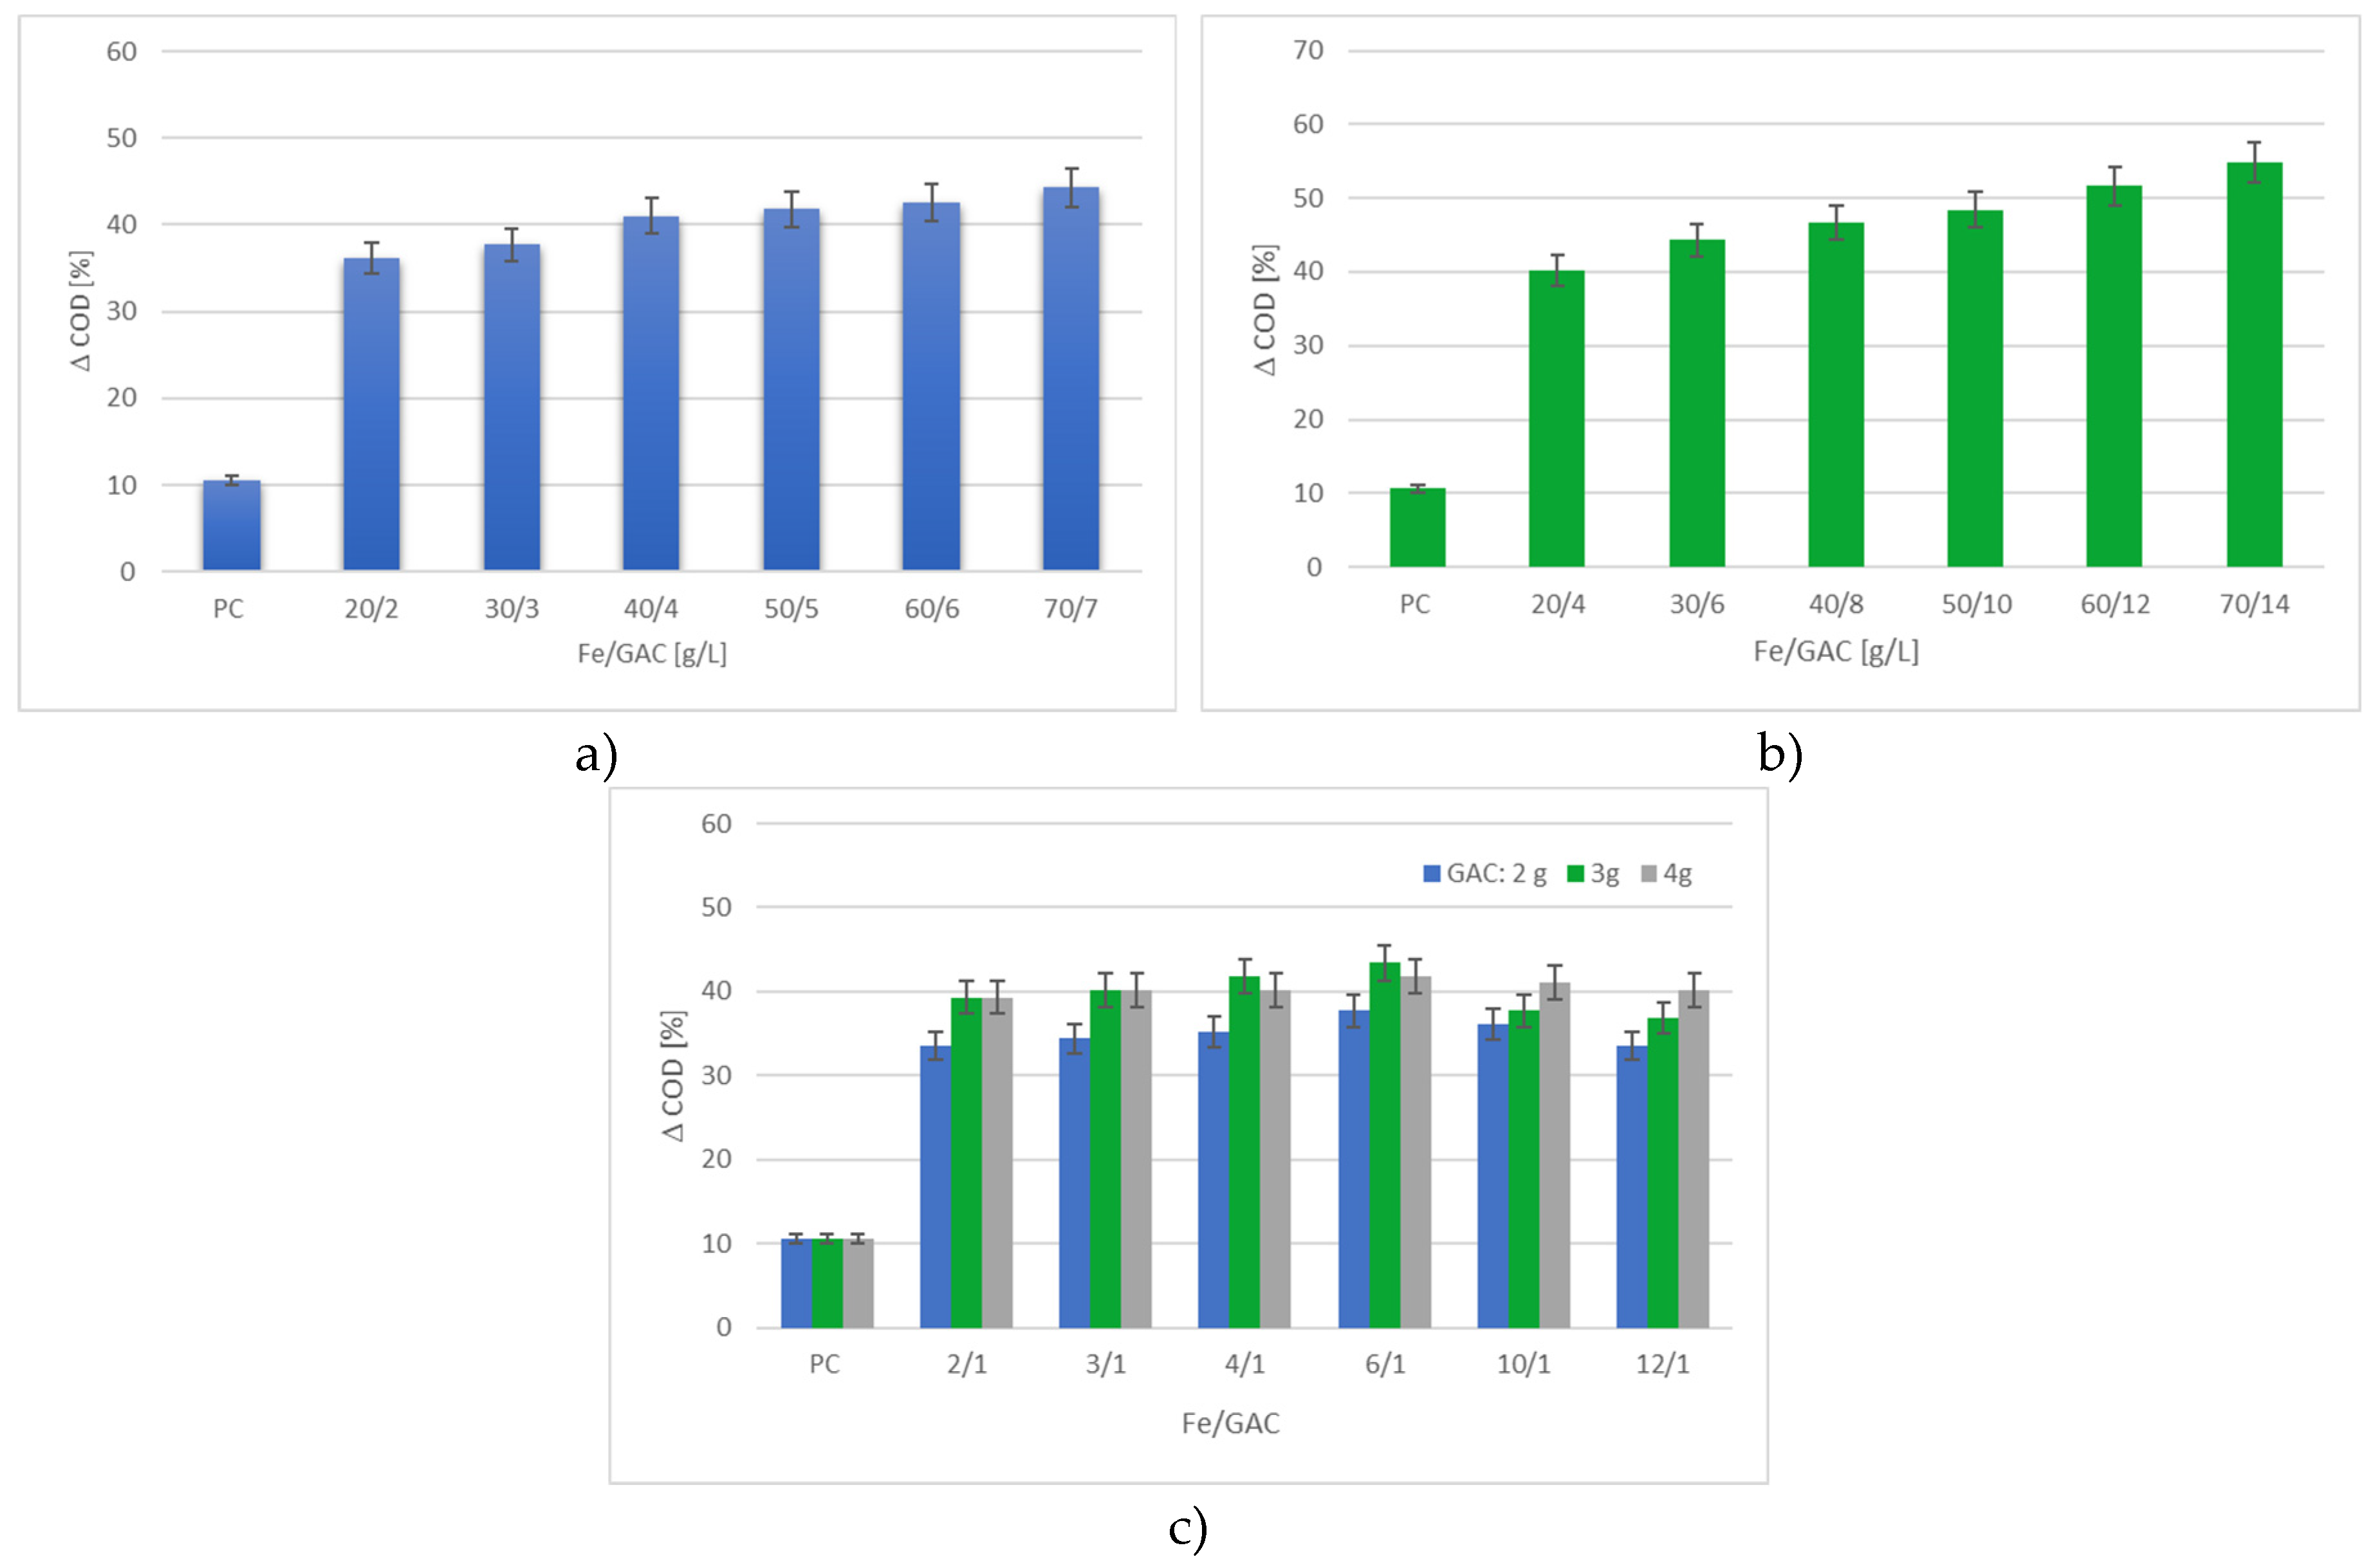
Figure 4.
Changes in D COD for m-IME (pH 3) over time for doses of Fe/GAC microelectrodes: 40/4 g/L—sample. 1.1 and 40/10 g/L—sample. 1.3.
Figure 4.
Changes in D COD for m-IME (pH 3) over time for doses of Fe/GAC microelectrodes: 40/4 g/L—sample. 1.1 and 40/10 g/L—sample. 1.3.
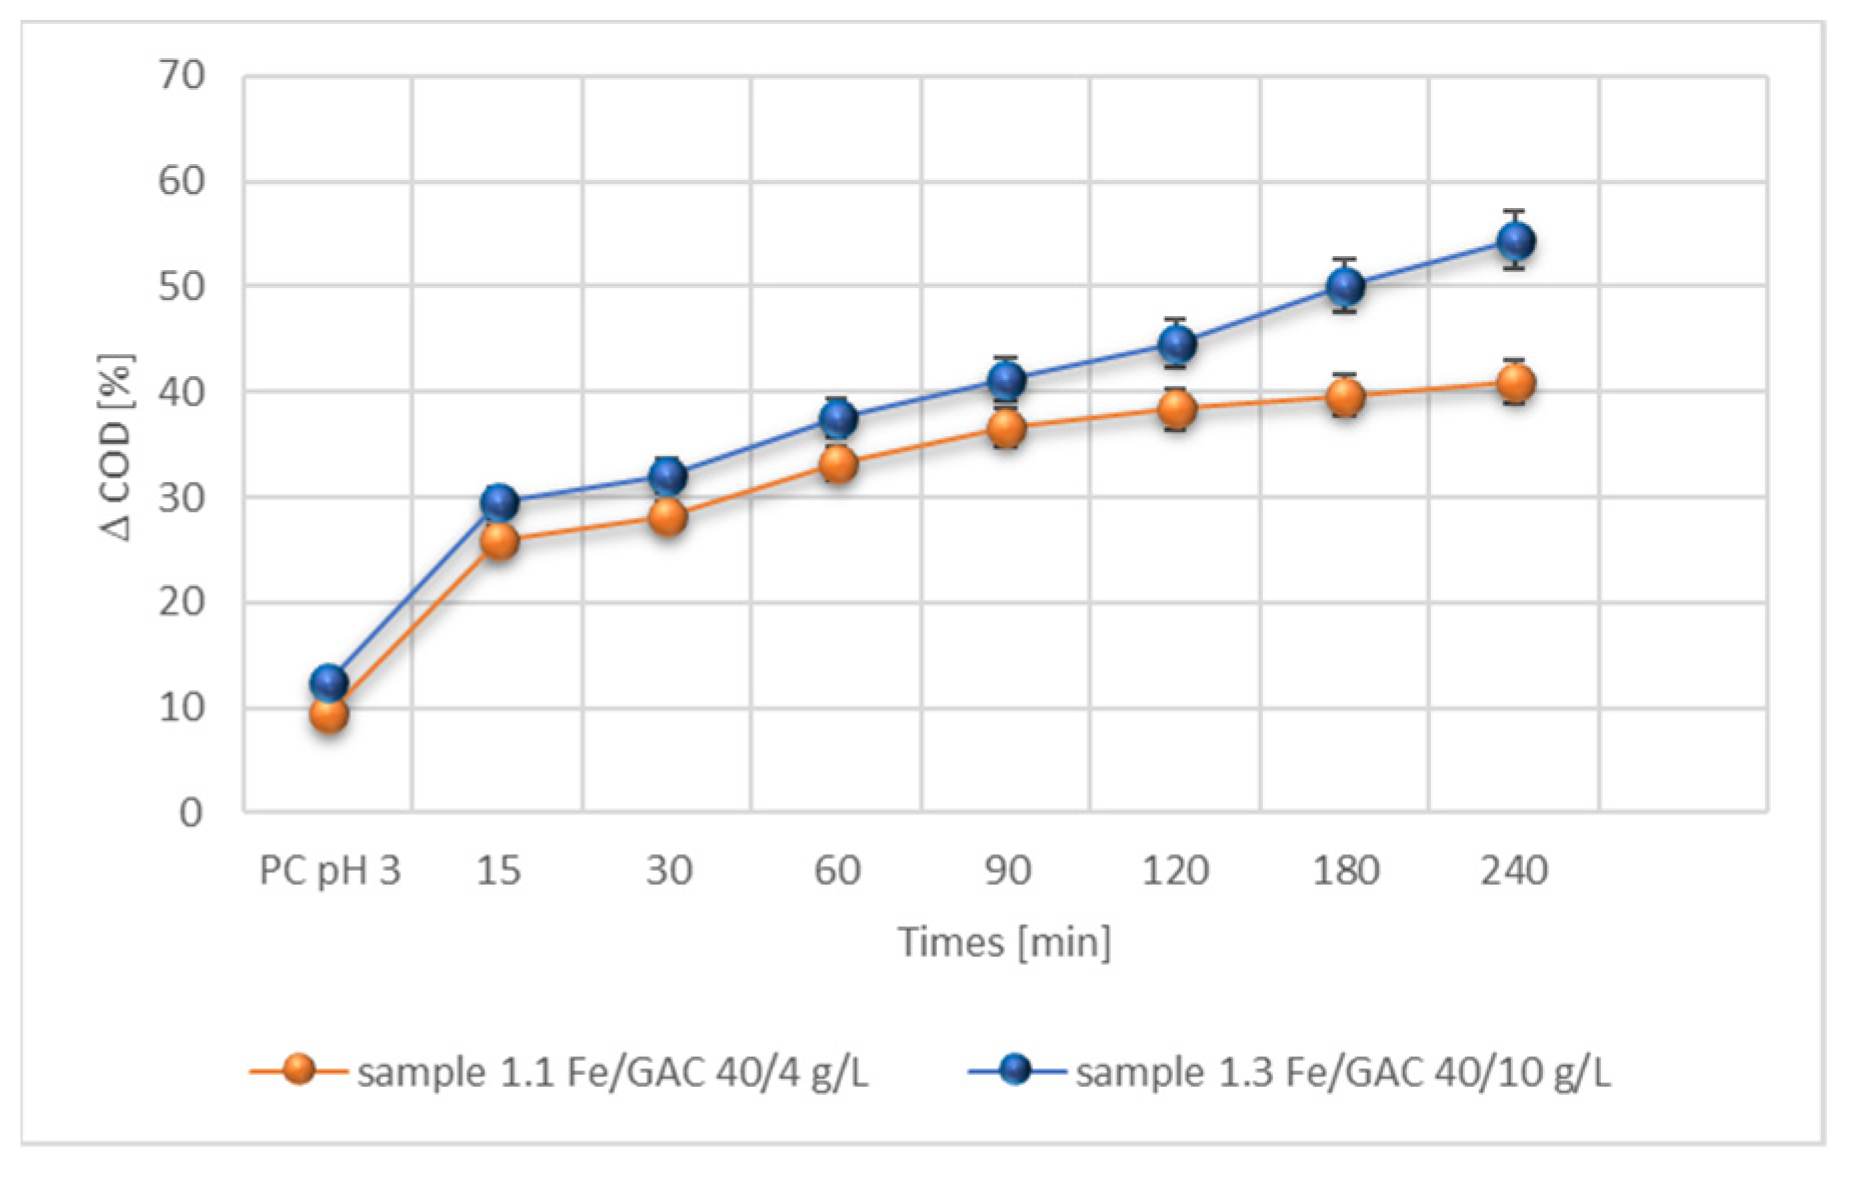
Figure 5.
pH changes in time of m-IME process (sample 1.3).
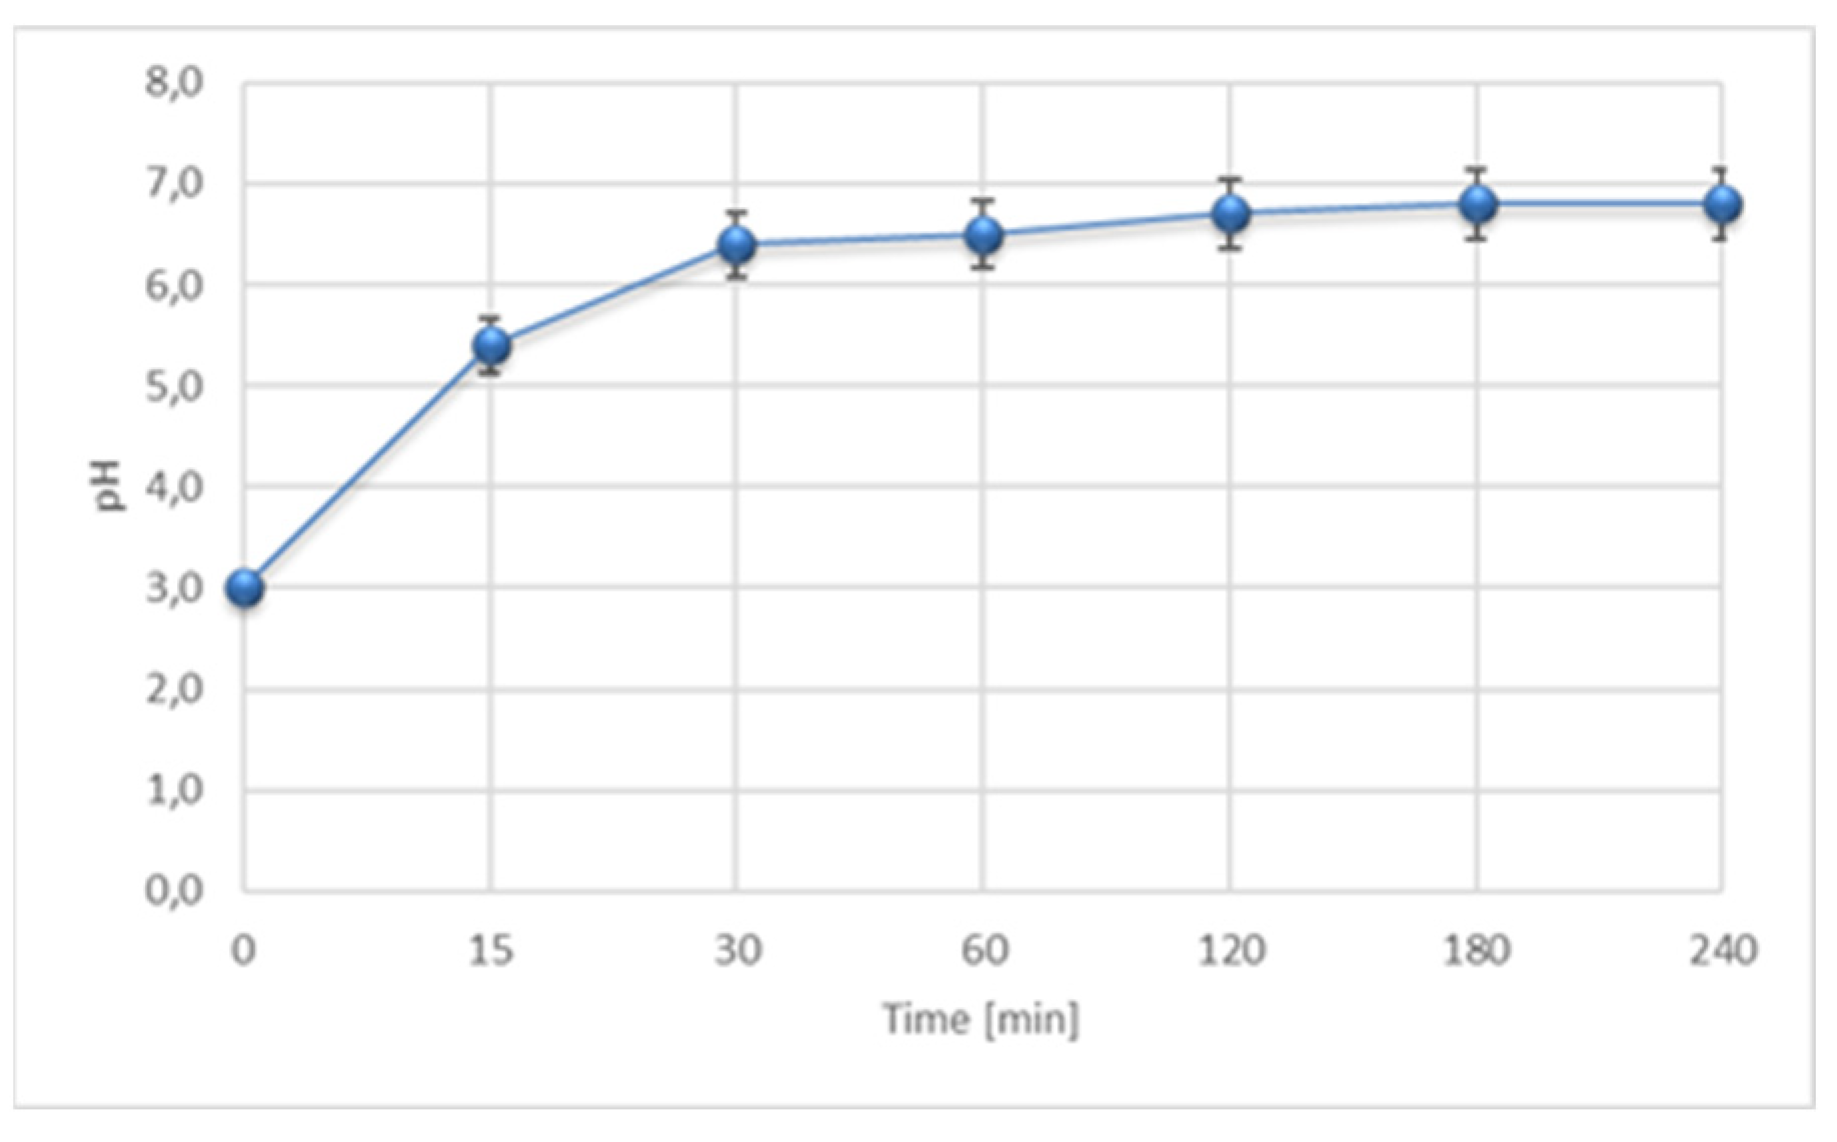
Figure 6.
Total COD removal after the m-IME and m-IME/H2O2 process carried out for 15-240 min, depending on the COD/H2O2 ratio; 1/1, 1/2 and 1/3. H2O2 addition from the beginning of the z-IME/H2O2 process (sample 1.3).
Figure 6.
Total COD removal after the m-IME and m-IME/H2O2 process carried out for 15-240 min, depending on the COD/H2O2 ratio; 1/1, 1/2 and 1/3. H2O2 addition from the beginning of the z-IME/H2O2 process (sample 1.3).
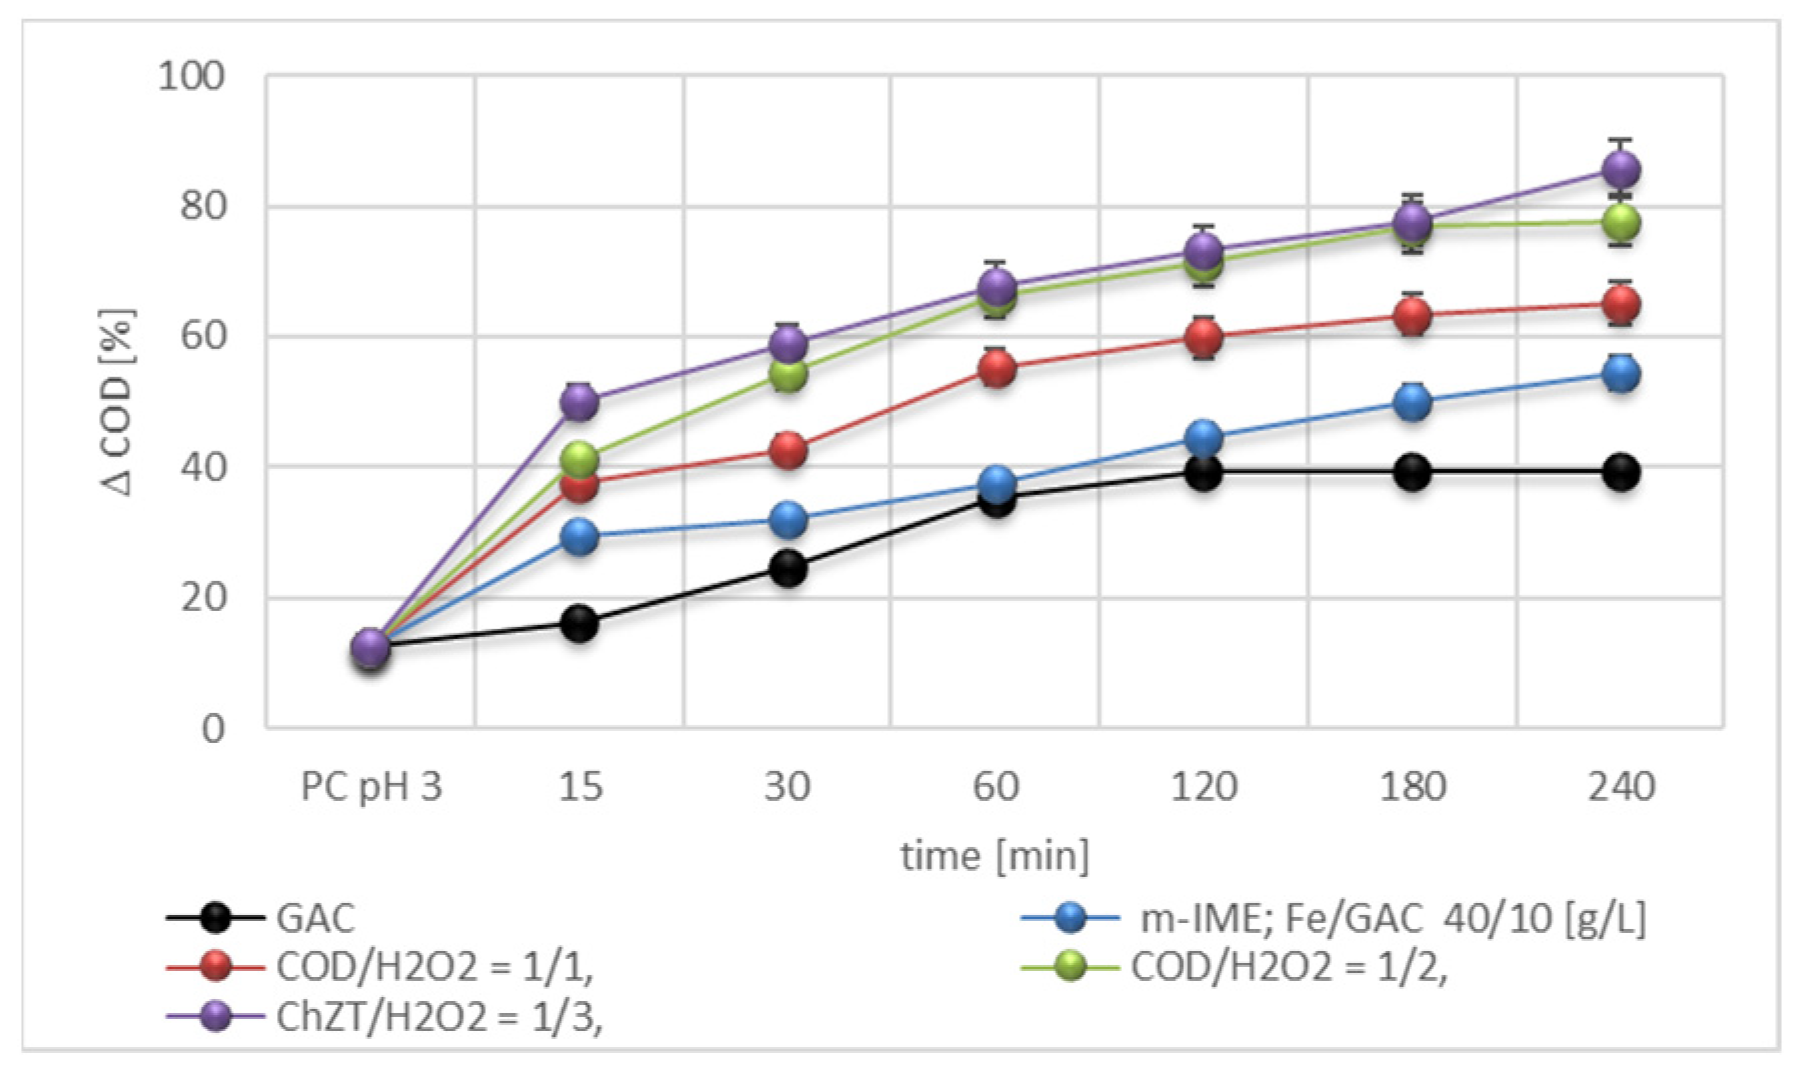
Figure 7.
Total COD removal after m-IME/H2O2 process (addition of H2O2 after 120 min of the z-IME process; tIME 120 min) carried out after PC at pH 3 for Fe/GAC 40/10 g/L depending on the COD/H2O2 (sample 1.3).
Figure 7.
Total COD removal after m-IME/H2O2 process (addition of H2O2 after 120 min of the z-IME process; tIME 120 min) carried out after PC at pH 3 for Fe/GAC 40/10 g/L depending on the COD/H2O2 (sample 1.3).
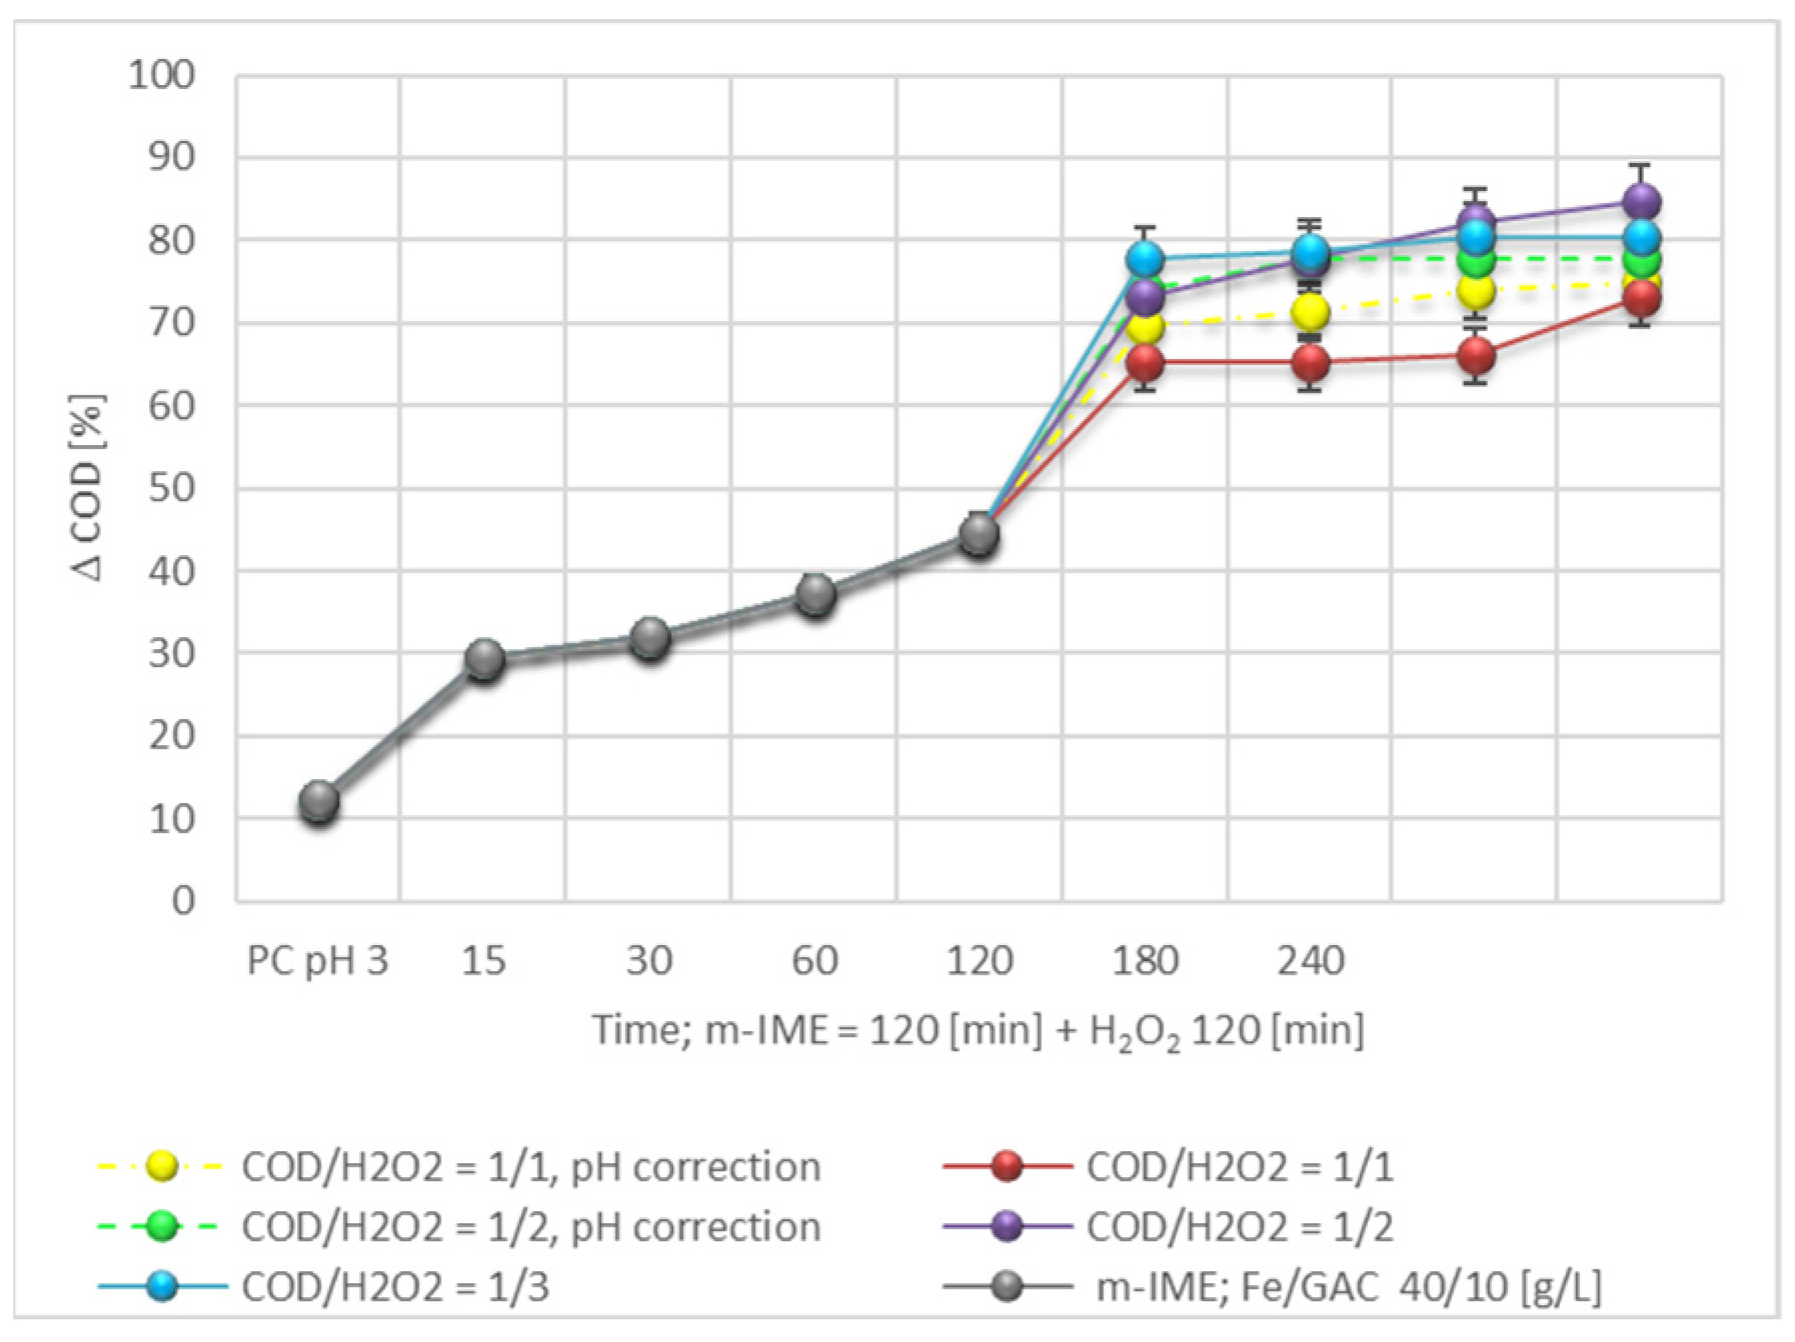
Table 2.
Characteristics of the microelectrodes.
| Material/symbol | GAC Gryfskand | Grey cast iron |
|---|---|---|
| Trade name | WD extra, 4H | EN-GJL 200 |
| Form | granulated | filings |
| Size | 2-0,75 mm | 2-1 mm |
| Bulk density | 472 g/L | 7,15 kg/L |
| Other |
|
chemical composition (approximate % by weight):
|
Table 3.
Characteristics of row LL samples.
| Sample nr | 1.1 | 1.2 | 1.3 | 1.4 |
|---|---|---|---|---|
| COD [mg O2/L] | 1073 | 1045 | 1092 | 1715 |
| pH | 7,81 | 7,31 | 8,20 | 7,80 |
| Conductivity [mS/cm] | 11,8 | 11,6 | 8,19 | 9,8 |
| Ntotal [g/L] | 298 | 236 | 343 | 432 |
| Cl- [mg/L] | 420 | 390 | 370 | 412 |
| TOC [mg/L] | 376 | 362 | 381 | 543 |
| BOD5 [mg O2/L] | 92 | 104 | 131 | 190 |
| BOD5/COD | 0,08 | 0,10 | 0,12 | 0,11 |
| N-NH4 [g/L] | 268 | 197 | 294 | 387 |
| Absorbance 254 nm | 11,80 | 11,75 | 11,82 | 11,92 |
| SUVA [m2/gC] | 0,0314 | 0,0324 | 0,0309 | 0,0219 |
Table 4.
LL Characteristics after subsequent purification stages, sample 1.3.
| Sample 1.4 | Raw LL | PC pH 3 | m-IME 120 min | m-IME 120 min/H2O2 60 min (H2O2/COD 2/1) |
|---|---|---|---|---|
| COD [mg O2/L] | 1092 | 955 | 402 | 170 |
| D COD [%] | 12,5 | 44,6 | 82,1 | |
| pH | 8,2 | 3,0 | 6,2 | 9,0 |
| Conductivity [mS/cm] | 8,19 | 9,71 | 8,96 | 9,81 |
| Ntotal [g/dm3] | 343 | 336 | 242 | 198 |
| TOC [mg/dm3] | 381 | 326 | 130 | 88 |
| BOD5 [mg O2/dm3] | 131 | - | 129 | 78 |
| BOD5/COD | 0,12 | - | 0,32 | 0,39 |
| Absorbance 254 [nm] | 11,82 | 8,96 | 0,562 | 0,103 |
| SUVA [m2/gC] | 0,0309 | 0,0275 | 0,0042 | 0,0011 |
Disclaimer/Publisher’s Note: The statements, opinions and data contained in all publications are solely those of the individual author(s) and contributor(s) and not of MDPI and/or the editor(s). MDPI and/or the editor(s) disclaim responsibility for any injury to people or property resulting from any ideas, methods, instructions or products referred to in the content. |
© 2025 by the authors. Licensee MDPI, Basel, Switzerland. This article is an open access article distributed under the terms and conditions of the Creative Commons Attribution (CC BY) license (http://creativecommons.org/licenses/by/4.0/).
Copyright: This open access article is published under a Creative Commons CC BY 4.0 license, which permit the free download, distribution, and reuse, provided that the author and preprint are cited in any reuse.


