
Submitted:
20 January 2025
Posted:
21 January 2025
You are already at the latest version
Abstract
Vs30, the average shear wave velocity in the uppermost 30 meters, is critical for seismic hazard analysis. In the Philippines, the Refraction Microtremor (ReMi) survey is one of the methods used to determine Vs30. This study investigates the use of an elitist Genetic Algorithm (GA) to invert Horizontal to Vertical Spectral Ratio (HVSR) data as a more efficient alternative. Unlike the ReMi survey, which requires laying out lines and geophones, the HVSR survey uses a single-unit, 3-component microtremor seismograph and can be operated by one person. Analyzing 174 HVSR and 52 ReMi datasets from the Greater Metro Manila Area (GMMA) and Leyte Province, we found that the estimated Vs30 estimates are satisfactory for site classes C, D, and E of the National Structural Code of the Philippines 2015 (NSCP 2015). The overall site class match rate is 76% in GMMA and 81% in Leyte. The R-squared values for measured Vs30 and estimated Vs30 comparisons for GMMA and Leyte are 0.885 and 0.806, respectively, indicating strong correlations. Additionally, the relationship between the fundamental site period and estimated Vs30 values was explored. The R-squared values range of 0.772 for GMMA and 0.707 for Leyte indicate a strong correlation and demonstrate the expected inversely proportion relationship between the two variables. Given the Philippines' high seismic activity, this approach could enable faster updates to seismic hazard maps, improving earthquake preparedness and mitigation.
Keywords:
HVSR
; Vs30
; NSCP 2015
; Refraction Microtremor
; Genetic Algorithm
; Seismic Hazard Analysis
1. Introduction
Vs30, defined as the average seismic shear-wave velocity from the surface to a depth of 30 meters, is a parameter widely used in seismic hazard analysis. Vs30 measurements acquired at strong motion stations globally provide a foundation for developing ground motion prediction equations [1]. These equations utilize site classifications defined by Vs30 such as in the NSCP 2015 [2] to incorporate site amplification in modeling peak ground motions.
Various strategies exist for mapping Vs30. Wald and Allen (2007) [3] use the correlation between topographic gradient and shallow shear-wave velocity for rapid Vs30 estimations. However, this method cannot distinguish sharp Vs30 contrasts. Combining geological or geomorphological data with slope information can improve Vs30 mapping accuracy, particularly in regions with extensive Vs30 measurements to validate these approaches [4]. For more detailed Vs30 mapping, local in-situ measurements are crucial. Commonly used invasive techniques for measuring Vs30 include borehole methods (down-hole, cross-hole, up-hole) where empirical correlations between Standard Penetration Resistance (SPT-N) and shear wave velocity (Vs) have been developed [5]. Non-invasive geophysical methods for Vs30 measurement consist of seismic refraction, Multichannel Analysis of Surface Waves (MASW), Spectral Analysis of Surface Waves (SASW), and Refraction Microtremor (ReMi). The ReMi method is the focus of this analysis, where an array of geophone receivers is utilized to record seismic waves [6]. ReMi surveys, which typically last 1-2 hours, require specific site conditions, including low gradient and the accommodation of an array length ranging from 60 to 120 meters to obtain reliable Vs30 measurements.
To complement ReMi, faster yet precise Vs30 survey methods are being explored, such as the inversion of the Horizontal-to-Vertical Spectral Ratio (HVSR). Earlier studies made use of HVSR inversion of ambient noise measurements from a single-station, three-component microtremor seismograph to extract Vs profiles and estimate Vs30 values. These ambient measurements only require 30 minutes of recording time performed by a single operator [7]. Previous publications utilize automated inversion methods. Grutas and Yamanaka (2012) [8] applied a hybrid simulated annealing algorithm to extract Vs profiles from phase velocity dispersion curves of Greater Metro Manila, while Zuhair et al. (2023) [9] used a neighborhood algorithm to estimate shear wave velocity at a 30-meter depth.
In this study, HVSR data of ambient measurements from survey campaigns in the Greater Metro Manila Area (GMMA) and the province of Leyte in the Philippines were subjected to inversion using an elitist genetic algorithm (GA) in the software HVSRInv developed by Kafadar and Imamoğlu (2022) [10]. This GA optimizes the inversion process by searching the parameter space for multiple possibilities at the same time and selecting the best-fit model based on the indicated parameters.
The primary objective is to evaluate the R-squared values to assess the correlation between Vs30 estimates derived from HVSR inversion using GA and those from ReMi surveys, as well as with fundamental site period. This comparison will demonstrate GA’s potential as a supplementary Vs30 estimation method. Geomorphological data were primarily used to assess and assign Vs30 at various test locations, while available geological maps were also consulted.
2. Study Area
2.1 Greater Metro Manila
The study examined datasets from two regions in the Philippines: the Greater Metro Manila Area (GMMA) and Leyte Province.
GMMA includes the cities and municipalities of Metropolitan Manila, the national capital, as well as the adjacent provinces of Bulacan, Cavite, Laguna, and Rizal. For this study, data were utilized from Metro Manila, Bulacan, and Cavite. This densely populated area is located at the southernmost extension of the Central Luzon Basin, bordered by Manila Bay to the west and the Sierra Madre Mountain Range to the east.
Metro Manila, where most of the survey sites are located, is divided morphologically into three terranes: the Coastal Lowland, the Central Plateau, and the Marikina Valley [11]. The Coastal Lowland and Marikina Valley are primarily composed of Quaternary Alluvium, characterized by soft and unconsolidated sediments with interlayers of sand, clay, and silt. The Coastal Lowland is the flat, low-lying plain facing Manila Bay, formed by deposits from sandbars, backmarshes, tidal flats, the Pasig River Delta, and reclaimed land. The Marikina Valley, in contrast, consists of flood plains along the Marikina River and a delta along Laguna de Bay. This valley formed as a pull-apart basin linked to the Marikina Valley Fault System, consisting of the West Valley Fault (WVF) and East Valley Fault (EVF), which together make up a dominantly dextral strike-slip fault system [12].
Situated between these two terranes is the Central Plateau, which comprises the Guadalupe Formation. This formation is characterized by a sequence of conglomerates, sandstones, and mudstones, along with flat-lying, medium to thin-bedded fine-grained vitric tuff and welded pyroclastic breccias.
In GMMA, microtremor HVSR data from 25 public schools on quaternary alluvium deposits were utilized, representing the coastal lowlands. These sites were selected from the data set utilized by Daag et al. (2023) [13] in their study on site response measurements and implications to soil liquefaction potential in Metro Manila. Figure 1 shows the distribution of ReMi and three-component microtremor (3CMT) sites in GMMA. These sites were selected for their natural ground conditions (i.e., without fill materials), which are expected to minimize errors in Vs30 estimation. The data consists of a 1:1 ratio of ReMi and three-component microtremor (3CMT) datasets. While this selective approach provides detailed insights into the Coastal Lowland region, it may limit the generalizability of findings to other geomorphological units or areas within GMMA. The Leyte dataset, which includes a diverse set of geomorphological units, offers an opportunity to assess the GA's performance in a different geological context and compare it with findings from GMMA.
2.2 Leyte Province
The Province of Leyte is located in the island of Leyte in the Eastern Visayas region. The province is bounded by the Carigara Bay in the north, the San Juanico Strait and Leyte Gulf in the east, Visayas Sea and Ormoc Sea in the west, and the province of Southern Leyte, also located within Leyte Island, in the south.
The province and the whole of Leyte Island is bisected by the 140-km segment of the Philippine fault. Along the fault trace, features such as west-facing fault scarps and narrow linear valleys with displaced stream channels are present [16]. These topographic expressions contribute to the overall geomorphology of the province.
The regional geomorphologic units of Leyte province were classified based on geology, elevation, slope gradient and curvature. The province is divided into seven terranes: Lowlands, Footslopes, Upper and Lower Denudational Slopes and Hills, Denudational Mountains, Volcanic Denudational Mountains, and Karstic Environment (Figure 2).
Lowlands and Footslopes are characterized as landforms with low elevation, low slope gradient, and low curvature. These units are composed of thick deposits of Quaternary unconsolidated alluvium.
Upper and Lower Denudational Slopes and Hills are mostly composed of Late Miocene to Pliocene agglomerate, tuff, calcareous and tuffaceous sandstone, conglomerate, shale, and clastic limestone. In the central portion of the province, the slopes are made of more recent Pliocene to Pleistocene agglomerate, tuff, conglomerate sandstone, shale and local limestone.
Denudational mountains comprise the central mountain range that runs from north to south of the province found along the Leyte segment of the Philippine Fault. The mountains are comprised of Late Miocene to Pliocene coralline limestone underlain by shale, sandstone, and local conglomerate. The Volcanic Denudational Mountains are differentiated to recognize the more recent Pliocene to Pleistocene volcanic rocks of andesite and basalt lava flow, shallow intrusives, agglomerate, and tuff located in the higher elevations.
Karstic environments refer to the Pliocene to Pleistocene coralline limestone underlain by minor sandstone, shale, and agglomerate particularly located in northwestern coastal municipalities of the province, such as Isabel, Merida, and Palompon.
Representative points across all geomorphologic units in the province were selected as study sites. A total of 27 refraction microtremor and three-component microtremor pair sites and 136 stand-alone three-component microtremor sites were considered in the Vs30 estimation.
3. Field Investigations
3.1. Refraction Microtremor Surveys
A Refraction Microtremor survey (ReMi) is a common method for acquiring shear wave velocity profiles, developed by Louie in 2001 [18]. This survey uses a portable seismograph connected to an array of evenly spaced geophones to record surface waves or Rayleigh waves generated by background acoustic sources.
In the GMMA and Leyte surveys, twelve geophones with a frequency of 4.5 Hz were used. The array length was set to at least twice the depth of interest. Due to space constraints, GMMA schools allowed for a geophone spacing of 4 to 8 meters, whereas Leyte sites had a spacing of 8 to 10 meters.
The geophones were connected to either a DAQLink II or DAQLink III seismograph, recording a total of thirty recordings of at least 30 continuous seconds each. The first ten recordings captured ambient noise (e.g., vehicles, pedestrians, wind, construction). Additional recordings were made with an active noise source—a sledgehammer striking a steel plate—at each end of the array. The recorded distance-time traces were processed using SeisOpt ReMi software modules VSpect and Disper, following the data processing guidelines by Louie et al. (2022) [5]. In VSpect, recordings were converted into a slowness-frequency (p-f) spectrum. The minimum velocity envelope was determined from this spectrum by selecting picks along the lower bounds, which were then used in Disper to produce a dispersion curve and a 1-D shear wave velocity profile through inversion. Disper also automatically calculates the 100 ft (approximately 30-meter) average velocity, which is used as the Vs30 value for the processed site.
3.2. Horizontal-to-Vertical Spectral Ratio (HVSR) Survey
An HVSR (horizontal-to-vertical spectral ratio) survey measures the seismic ambient noise or vibrations to calculate the average ratio of the horizontal-to-vertical Fourier amplitude spectra [19].
HVSR surveys were conducted at all ReMi sites in both GMMA and Leyte Province. Ideally, these surveys were performed at the center of the ReMi array; if this was not feasible, they were relocated only a few meters to ensure representativeness. In Leyte Province, HVSR surveys were also conducted at additional sites around the ReMi locations to maximize the genetic algorithm's utility.
The HVSR survey used the OYO McSEIS MT-NEO single-station three-component microtremor (3CMT) unit. This unit was oriented north and positioned on level ground using a bubble sensor. All connection cables and an external GPS signal were ensured before recording commenced. The recording length was influenced by the minimum expected frequency, which depends on the area’s geology, and the “quietness” of the vicinity. Quietness refers to the absence of transients such as footsteps, passing heavy vehicles, and industrial machinery, which can affect the quality of the recording. The maximum recording time undertaken was 30 minutes for sites with discernible transient sources, such as roadsides or public spaces.
Raw recording files were extracted using OYO SeisImager software PickWin and converted into a three-column ASCII format for processing in Geopsy software. The processing followed the Site Effects Assessment Using Ambient Excitations (SESAME) Guidelines for the H/V Spectral Ratio Technique. Thirty-second windows representing ambient noise were selected to produce the HVSR curve, with the peak amplitude period considered the predominant period for the site.
4. Materials and Methods
4.1. Prcocessing Using Genetic Algorithm in HVSRInv
The estimation of the shear wave velocity of the HVSR sites were conducted in the software HVSRInv developed by Kafadar and Imamoğlu (2022) [10]. HVSRInv makes use of the equivalent linear approximation based on the viscoelastic Kelvin-Viogt model to calculate the site response of horizontally stratified soil layers. An elitist genetic algorithm (GA) is employed to perform multiple inversions in obtaining the shear wave velocity profile of the HVSR site. The GA has the feature of elitism, which ensures that the best fit generation is chosen. The software requires the HVSR data, user-defined initial model parameters, and inversion parameters.
The HVSR data from the previously extracted three-column ASCII files were converted into text files and loaded into the software. The user-defined initial model parameters are used to constrain the values of the resulting Vs profile. These values are typically lifted from literature and in-situ surveys characterizing the general subsurface where the HVSR survey was conducted. The initial model parameters such as the number of layers and the minimum and maximum thickness and shear wave velocity of each layer were derived from the Vs profile of a ReMi site, provided that the HVSR site is either centered on, very close to, or within the same geomorphologic unit of the ReMi array. A ReMi site whose site period is closer to the HVSR site period is preferred. Table 1 presents the model parameters used for a selected site located within the lower denudational slopes and hills geomorphologic unit in Leyte.
The minimum and maximum density and damping ratio are automatically calculated by the software. The minimum and maximum frequency refer to the frequency range to be used for the inversions. The frequencies where the peak amplitude of the HVSR curve occurs (i.e., the predominant frequency) were selected.

Table 2.
Number of layers, Minimum Frequency (Hz) and Maximum Frequency (Hz) for the selected site.
| Number of Layers | Minimum Frequency (Hz) | Maximum Frequency (Hz) |
| 3 | 0.6 | 10 |
The inversion parameters dictate the quantity of generations and inversions. These parameters, together with the computer specifications, influence the execution time of the GA. In this study, the inversion parameters utilized by Grutas and Yamanaka (2012) [8] were adopted. The number of genes, populations, iterations and inversions were set at 10, 100, 300, and 10, respectively. The computer specifications were 12th Gen Intel Core i9-12900 CPU, 2.40 GHz, 32 GB RAM, 64-bit operating system and took 55.87s to execute per HVSR site.
Table 3.
Inversion parameters adopted from Grutas and Yamanaka (2012) [8].
Table 3.
Inversion parameters adopted from Grutas and Yamanaka (2012) [8].
| Number of Genes | Number of Populations | Number of Iterations | Number of Inversions |
| 10 | 100 | 300 | 10 |
The inversion produces an estimated Vs profile with an accompanying estimated HVSR curve. The estimated curves are accepted if their trends align with the observed HVSR curves. Additionally, the minimum and maximum standard deviations of the HVSR as analyzed in Geopsy served as guides on whether the estimated curves qualify as matches.
This ensures that the estimated site parameters will behave similarly to the initial model parameters from the reference ReMi site. Mismatches in the curves can be due to different site response, such as amplification, at certain frequencies in nature versus theoretically.
Figure 3.
The observed HVSR (red solid line) overlain with the estimated HVSR (blue solid line) from the HVSR inversion. Gray broken lines represent the minimum and maximum standard deviations obtained from Geopsy.
Figure 3.
The observed HVSR (red solid line) overlain with the estimated HVSR (blue solid line) from the HVSR inversion. Gray broken lines represent the minimum and maximum standard deviations obtained from Geopsy.
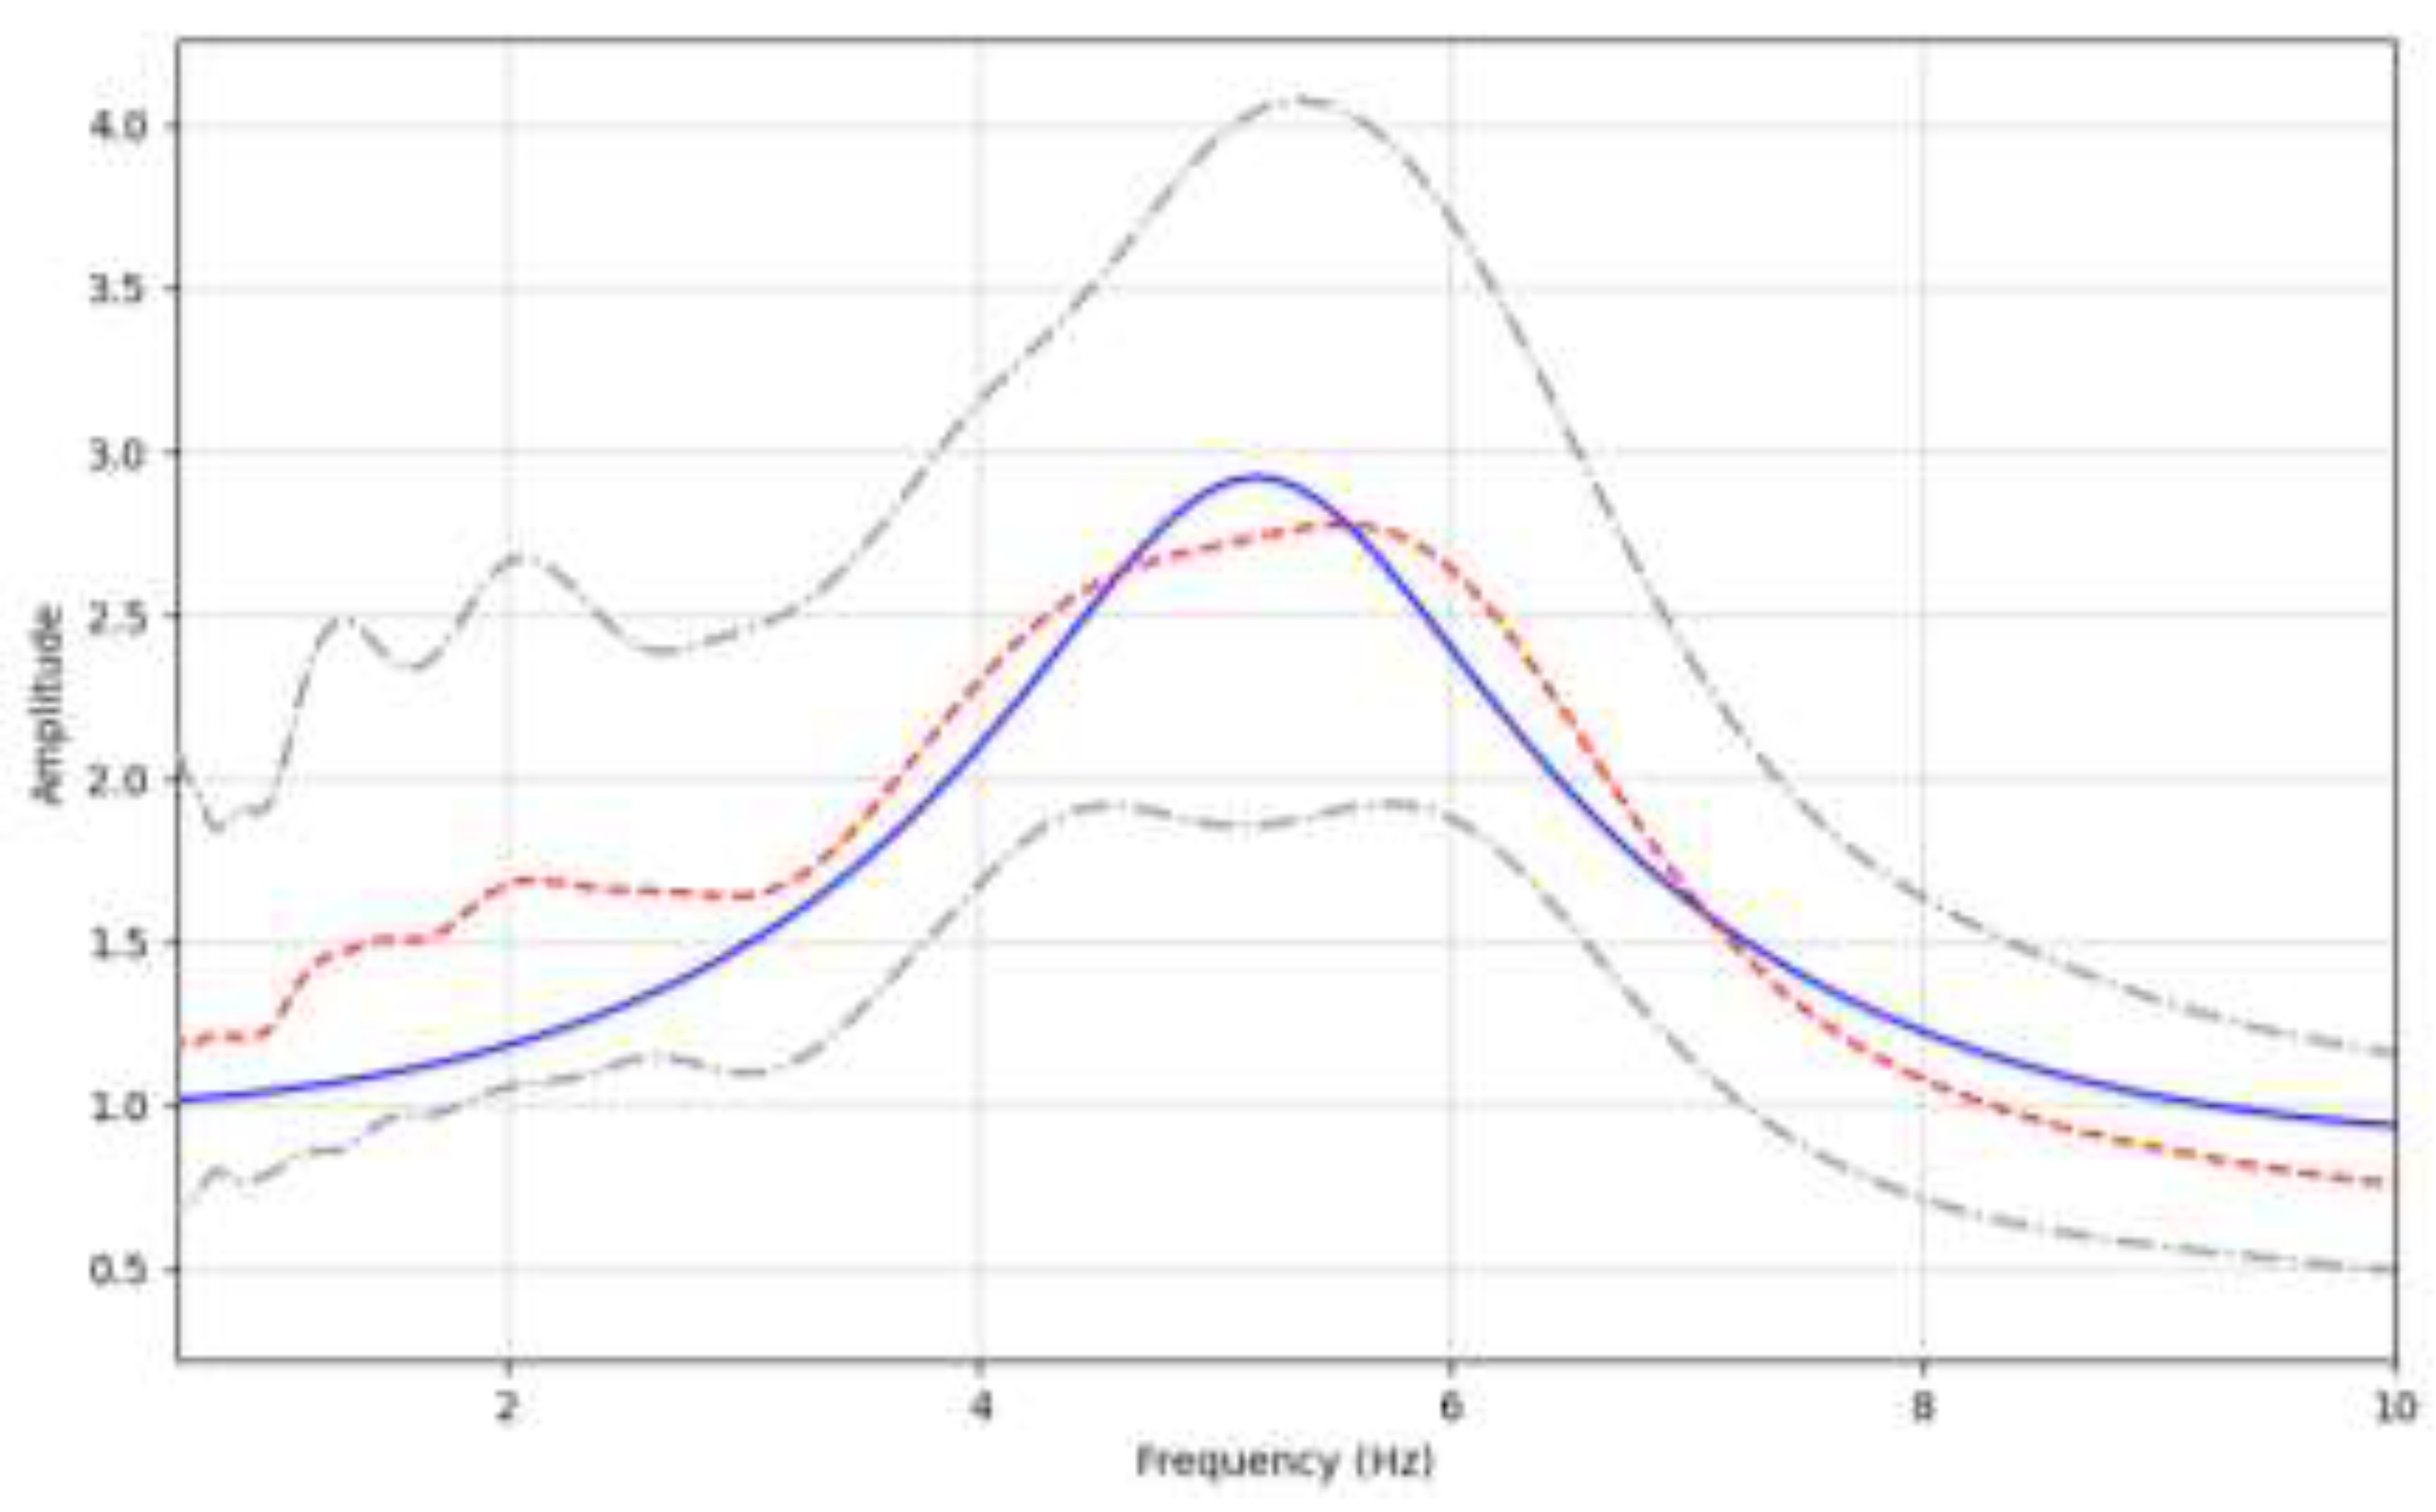
Figure 4.
The estimated VS profiles for each inversion (gray thin lines) and the estimated mean Vs profile (red thick line).
Figure 4.
The estimated VS profiles for each inversion (gray thin lines) and the estimated mean Vs profile (red thick line).
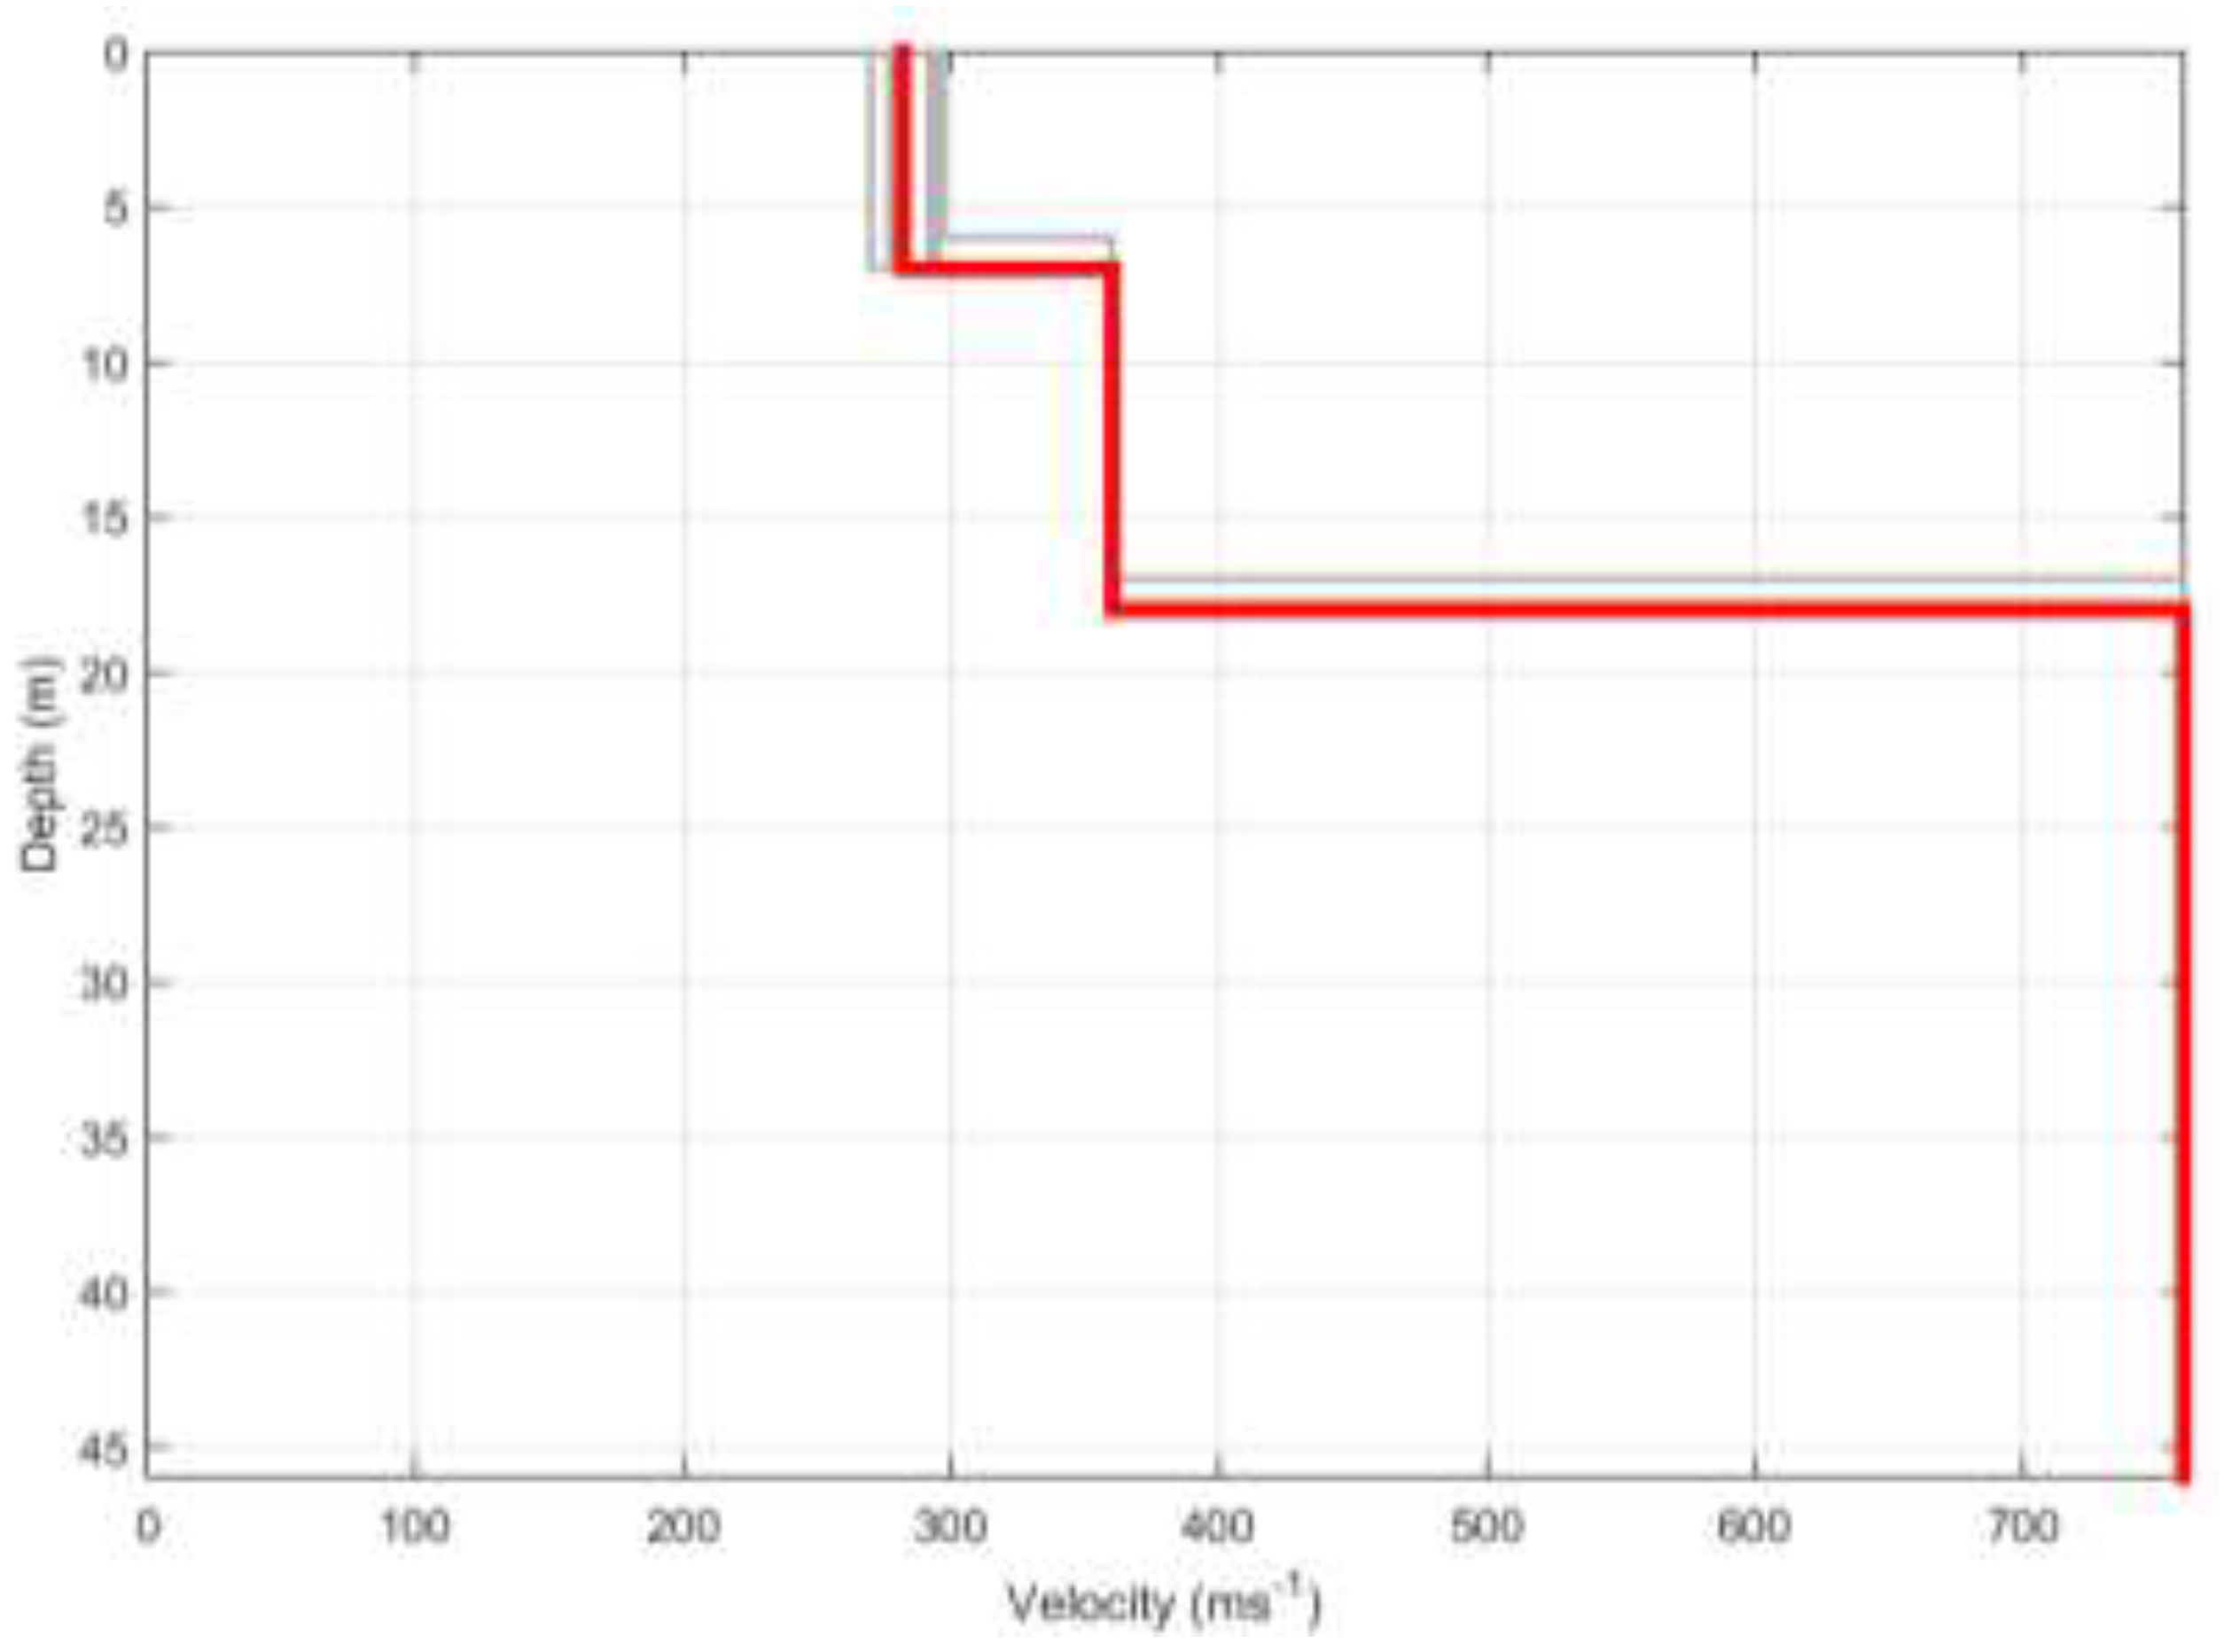
Table 4.
Resulting Vs profile parameters from the HVSR Inversion of the selected site.
| Thickness (m) | S-Wave Velocity (ms-1) | Density (gcm-3) | Damping Ratio |
| 7 | 282 | 1.8917 | 0.0238 |
| 11 | 360 | 1.9378 | 0.011 |
| 0* | 760 | 2.1514 | 0.0114 |
*A thickness of 0 indicates that the thickness extends indefinitely.
4.2 Estimation of Vs30
From the resulting Vs profile, the Vs30 was calculated by obtaining the harmonic mean of the first 30 meters of the profile. The harmonic mean is given by Equation 1:
Where = the depth of interest, 30 meters, and refers to the reciprocal of the shear wave velocity of each layer within the upper 30 meters of the Vs profile.
4.3 Analysis of Genetic Algorithm-Derived Vs30 Values
To evaluate the reliability of the GA approach in estimating Vs30 values via HVSR Inversion, a comparison of the estimated and measured ReMi Vs30 values was done for each of the sites across GMMA and for 27 ReMi sites in Leyte. These values were also classified according to the NSCP Seismic Site Classification (Table 5), which is essential for assessing seismic hazards and for designing earthquake-resistant structures. The comparison was based on the closeness of the estimated Vs30 values to the actual measurements and the site classification match rate between them.
The relationship of the ReMi-derived Vs30 values with the estimated Vs30 values and the site class match were also examined via linear regression. The original form of the non-linear power function to be utilized is given by Equation 2:
where is a constant and is the power exponent. By applying a natural logarithmic function to Eqiation 2, the linear regression equation shown by Equation 3 is obtained:
where represents the values of dependent variable, the slope of the regression, the independent variable and is the intercept of the regression.
The regression parameter was determined using the least squares estimation, given by Equation 4:
where n represents the number of considered sites. The value of was incorporated in the formula in deriving given by Equation 5:
The R2 value indicates how well the regression line fits that data and measures how much the variation of a dependent variable is explained by the independent variable. The R2 value is comprised of two components: the regression sum of squares the regression sum of squares (SSreg) and the total sum of squares (). The values of these are given by Equations 6 and 7:
where refers to the predicted values calculated using Equation 3, and refers to the average of the values of the dependent variable.
The coefficient of correlation (r), measured on a scale that varies from +1 to -1, measures the strength and direction of the linear relationship between two variables. It is given by Equation 8:
The root mean square error (RMSE) measures the average difference between the predicted and the actual values. It is expressed as Equation 9:
The relationships between natural site period and ReMi-derived Vs30 with the estimated Vs30 values were analyzed to assess whether the estimated Vs30 exhibited the expected inverse proportionality with site period. A power regression model was employed in this analysis using Equation 2.
5. Results and Discussion
5.1 Greater Metro Manila Area
For the GMMA dataset, HVSR inversion via GA generally yielded Vs30 values close to those obtained through ReMi surveys (Figure 5), with percent differences mostly ranging from 10% to 30%. While no consistent trend was observed, the Vs30 values were underestimated in most cases—specifically in 18 out of 25 sites—compared to the ReMi-derived values. This tendency may suggest that HVSR inversion may systematically provide slightly lower estimates under certain site conditions.
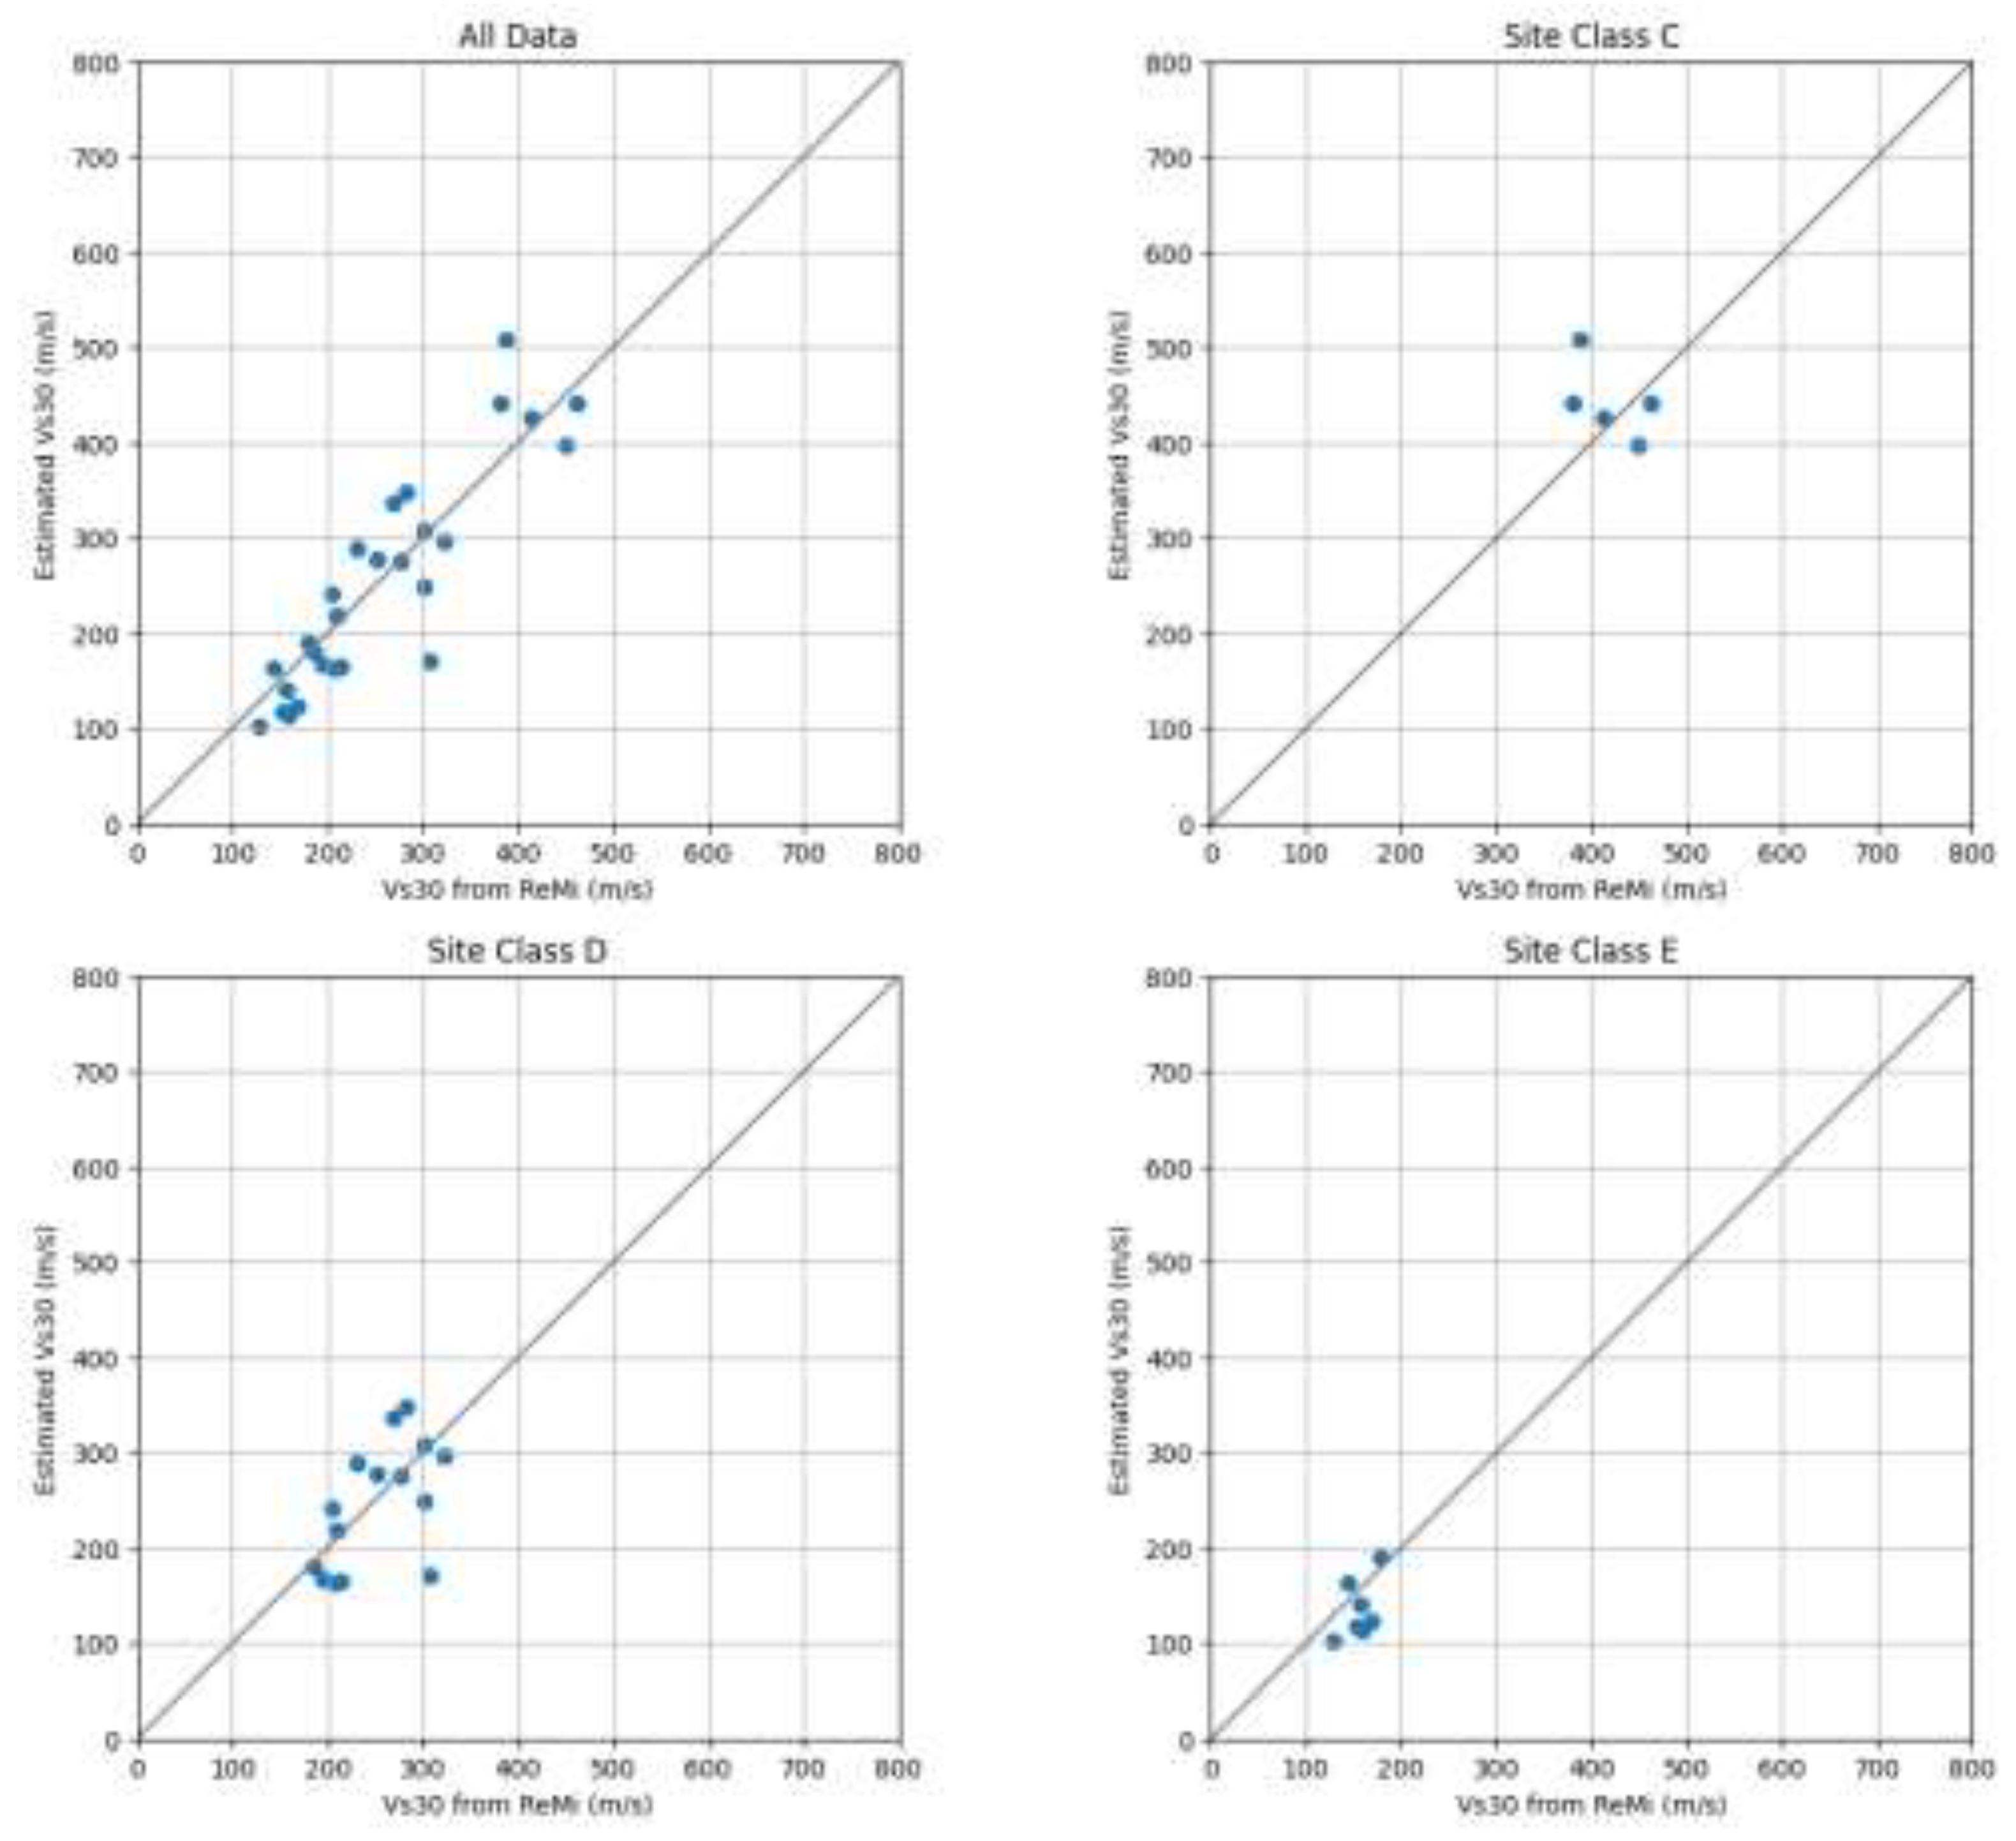
Table 6 shows the values of statistical parameters, namely the coefficient of regression (R²), coefficient of correlation (r), and root mean square error (RMSE) for the measured ReMi Vs30 values and the estimated Vs30 values. A visual comparison between the two is also shown in Figure 6.
Based on these statistical parameters, the overall results demonstrate that the inversion process provides reasonably accurate estimates of Vs30, although with some variability in performance across different site classes. Class E, based on the match rate, exhibits the highest accuracy, with an R² of 0.920, and the lowest RMSE of 8.402. Class D sites, composed of stiff soils, also perform well with high R² and r values, although the RMSE increases. In contrast, class C sites, which include a mix of dense soil and soft rock, show the weakest correlation and the highest RMSE. The variability in subsurface conditions for this class may be contributing to these larger errors, as the HVSR method may struggle to accurately capture wave propagation behavior in more complex subsurface settings.
Overall, the estimated values has a 76% match rate with high R² and r values of 0.885 and 0.941, respectively. This is indicative of a strong positive correlation between the ReMi- and estimated values, and showcases that the inversion can reflect the overall trend of the ReMi data. The RMSE presents that the algorithm can effectively estimate the Vs30 values, excluding some individual outliers.
The correlation between the site period and Vs30 was also examined through a power regression, producing an R² value of 0.772, as shown in Figure 7. This indicates a strong correlation between the variables, aligning with the expectation that the relationship between site period and Vs30 is typically inverse. As Vs30 decreases, which indicates softer and less rigid soil, the site period increases, meaning the natural period of vibration of the soil profile is longer. Conversely, higher Vs30 values, reflecting stiffer and more rigid soil or rock, correspond to shorter site periods [20].
5.2. Leyte Data
For the Leyte sites where both ReMi and HVSR surveys were conducted, the estimated Vs30 values were compared with the VS30 values obtained from ReMi. Figure 8 shows no clear pattern of overestimation or underestimation, however, the estimated Vs30 values deviate 10-30% away from the ReMi-derived Vs30 values. This shows reasonable agreement with the ReMi-derived Vs30 values and shows no consistent bias of results in one direction. The discrepancies are likely attributed to inherent differences in the methodology employed by ReMi Disper and the GA in estimating Vs30. Inconsistencies attributed to the acquired HVSR data from the field may have also contributed as the HVSR surveys were not always centrally located along the ReMi array, unlike the GMMA sites. This was often due to unsuitable conditions for conducting the HVSR survey near the ReMi site, or because noise interference prevented the HVSR survey from being conducted near and simultaneously with the ReMi survey.
The match rate of site classes between the ReMi and estimated Vs30 values was also observed for the Leyte sites. When the values are separated based on the NSCP site classification, site class C has the highest match rate of 88%. Site Classes D and E have lower match rates of 78% and 50%, respectively.
Table 8.
Match Rate, R², r, and RMSE values for all site classes in Leyte Province.
| Site Class | No. of Samples | Match Rate (%) | R2 | r | RMSE |
| C | 5 | 100 | 0.328 | -0.573 | 29.335 |
| D | 15 | 73.33 | 0.327 | 0.573 | 51.493 |
| E | 7 | 85.71 | 0.294 | 0.572 | 51.493 |
| All | 27 | 81.48 | 0.806 | 0.898 | 50.026 |
Site Class C exhibits a 100% match rate, but a low R² indicates a weak correlation between estimated and ReMi-derived values. The r value suggests a moderate inverse relationship, with no consistent trends in over or underestimation, as illustrated in Figure 8. Despite this, the lower RMSE indicates that the inversion estimates ReMi-derived values better for Site Class C.
Site Classes D and E show match rates of 73.33% and 85.71%, respectively, with R² values also reflecting no clear trends. However, the r values indicate a moderate positive linear relationship for both classes, contrasting with Site Class C.
Overall, the dataset reveals a strong positive correlation between ReMi- and estimated Vs30 values, supported by high R² and r values. Although the RMSE is higher than that for GMMA sites, it suggests that the inversion effectively captures the trend of ReMi-derived Vs30. Notable prediction errors may stem from individual outliers influenced by variations in subsurface conditions.
Figure 9.
Comparison of ReMi-derived Vs30 and estimated Vs30 for all site classes as well as the overall data for Leyte Province data.
Figure 9.
Comparison of ReMi-derived Vs30 and estimated Vs30 for all site classes as well as the overall data for Leyte Province data.
The power regression between site period and the estimated Vs30 shows a strong inverse correlation, with an R2 value of 0.707. As Vs30 decreases, the site period increases. However, some data points deviate from this trend, as shown in Figure 10. These points were determined to be particularly from the lowlands. These sites have deep layers of sediments, resulting in long site periods despite relatively high Vs30 values. The soft sediments extend the site period, while underlying hard bedrock or stiff soil layers raise in Vs30 [14]. The inversion efficiently estimates Vs30 for shorter period sites (site periods less than 1), where most data points align closely with the trendline. The estimated values accurately reflect the known relationship between period and Vs30.
6. Conclusions
This work presents an efficient alternative method of estimating Vs30 values through HVSR inversion using an elitist genetic algorithm (GA).
In the Greater Metro Manila Area, the estimation of Vs30 via HVSR inversion demonstrated satisfactory results, achieving a 76% match rate between the seismic site classes derived from the original refraction microtremor (ReMi) Vs30 values and those derived from inversion. The R² and r values show strong positive correlations, suggesting that the inversion reflects the overall trends in the ReMi data. Although underestimation of values was observed in some sites, the overall data shows that this method remains functional and convenient, offering a viable alternative for the rapid estimation of Vs30 values.
Results for the overall Leyte data set likewise show strong positive correlation exists between ReMi- and estimated Vs30 values as evidenced by high R² and r values. While the RMSE is higher than for GMMA sites, it is still able to present that the inversion effectively captures the trend in Vs30 values derived from ReMi data. Additionally, the power regression analysis highlights a strong inverse correlation between site period and estimated Vs30 values, with deviations primarily observed in lowland sites characterized by deep sediment layers. This underscores the effectiveness of HVSR inversion in modeling subsurface conditions while highlighting areas for potential improvement.
Author Contributions
Conceptualization, R.N.G.; methodology, R.N.G., A.T.S., J.M.L.C.T., and R.A.F.C.; software, R.N.G.; validation, R.N.G., formal analysis, A.T.S., J.M.L.C.T, and R.A.F.C.; investigation, A.T.S, J.M.L.C.T and R.A.F.C.; resources, R.N.G. and A.T.S.; data curation, A.T.S., J.M.L.C.T., and R.A.F.C.; writing – original draft preparation, A.T.S., J.M.L.C.T., and R.A.F.C.; writing – reviewing and editing, R.N.G., A.T.S., J.M.L.C.T, and R.A.F.C.; visualization, R.N.G., A.T.S., J.M.L.C.T., and R.A.F.C.; supervision, R.N.G. and A.T.S.; project administration, A.T.S.; funding acquisition, R.N.G. All authors have read and agreed upon to the published version of the manuscript.
Funding
This research was funded by the Republic of the Philippines – Department of Sciences and Technology (DOST) and Philippine Council for Industry, Energy and Emerging Technology (DOST-PCIEERD) Grants-in-Aid (GIA).
Institutional Review Board Statement
Not Applicable.
Informed Consent Statement
Not Applicable.
Data Availability Statement
Not Applicable.
Acknowledgments
The authors would like to thank M.M.Y. Quimson, T.M.F. Manalo, J.L.A. Figura, J.K.L. Ricaplaza, G.A. Ramilo, J.B.P. Pabello and the local government unit of the province of Leyte for their assistance in data acquisition; P.J.M. Romaguera and D.J.L. Caloracan for assistance in data acquisition and data processing; Dr. A. S. Daag for further technical support; DOST-PCIEERD for support in funding and Dr. Teresito C. Bacolcol for support in the publication of this research.
Conflicts of Interest
The authors declare no conflict of interest.
References
- Borcherdt, R.D. Vs30 – A Site-Characterization Parameter for Use in Building Codes, Simplified Earthquake Resistant Design, GMPEs, and ShakeMaps. In Proceedings of the 15th World Conference on Earthquake Engineering, Lisbon, Portugal, 24-28 September 2012. [Google Scholar]
- Association of Structural Engineers of the Philippines, Inc. National Structural Code of the Philippines, 7th ed.; Association of Structural Engineers of the Philippines, Inc.: Quezon City, Philippines, 2015. [Google Scholar]
- Wald, D.J.; Allen, T.I. Topographic Slope as a Proxy Seismic Site Conditions and Amplification. Bulletin of the Seismological Society of America 2007, 97(5), 1379–1395. [Google Scholar] [CrossRef]
- Thompson, E.M.; Wald, D.J. Developing Vs30 site-condition maps by combining observations with geologic and topographic constraints. In Proceedings of the 15th World Conference on Earthquake Engineering, Lisbon, Portugal, 24-28 September 2012. [Google Scholar]
- Louie, J.N.; Pancha, A.; Kissane, B. Guidelines and pitfalls of refraction microtremor surveys. Journal of Seismology 2022, 26, 567–582. [Google Scholar] [CrossRef]
- Daag, A.; Halasan, O.P.; Magnaye, A.A; Grutas, R.; Solidum, Jr., R. ; Empirical Correlation between Standard Penetration Resistance (SPT-N_ and Shear Wave Velocity (Vs) for Soils in Metro Manila, Philippines. Appl. Sci. 2022, 12(16), 8067. [Google Scholar] [CrossRef]
- Isburhan, R.W.P.; Nuraeni, G.; Ry, R.V.; Yudistira, T.; Cipta, A.; Cummins, P. Horizontal-to-Vertical Spectral Ratio (HVSR) Method for Earthquake Risk Determination of Jakarta City with Microtremor Data. IOP Conference Series: Earth and Environmental Science 2019, 138. [CrossRef]
- Grutas, R.; Yamanaka, H. Shallow shear-wave velocity profiles and site response characteristics from microtremor array measurements in Metro Manila, the Philippines. Exploration Geophysics 2012, 43, 255–266. [Google Scholar] [CrossRef]
- Zuhair, M.B.; Suhardja, S.K.; Pranata, B.; Adi, S.P. Seismic microzonation based on HVSR inversions results for shear wave (Vs30) mapping and soil vulnerability in West Sulawesi and South Sulawesi Regions. ES3 Web of Conferences 2023, 464. [Google Scholar]
- Kafadar, O.; Imamoğlu, C. Estimation of the amplification properties of soil through HVSR inversion based on an elitist genetic algorithm. Earth Science Informatics 2022, 15, 2319–2334. [Google Scholar] [CrossRef]
- Japan International Cooperation Agency. ; Department of Public Works and Highways. The study of masterplan on high standard highway network development in the Republic of the Philippines; Japan International Cooperation Agency: Tokyo, Japan, 2010. [Google Scholar]
- Rimando, R.E.; Knuepfer, P.L.K. Neotectonics of the Marikina Valley fault system (MVFS) and tectonic framework of structures in northern and central Luzon, Philippines. Tectonophysics 2006, 415, 17–38. [Google Scholar] [CrossRef]
- Daag, A.; Aque, L.E.; Locaba, O.; Grutas, R.; Solidum, Jr., R. Site response measurements and implications to soil liquefaction potential using microtremor H/V in Greater Metro Manila, Philippines. Geomatics, Natural Hazards and Risk 2023, 14 (1). [CrossRef]
- Bureau of Mines and Geosciences. Geological Map of Manila and Quezon City Quadrangle-Sheet 3263-IV [Map]; Bureau of Mines and Geosciences: Quezon City, Philippines, 1983. [Google Scholar]
- Japan International Cooperation Agency; Metropolitan Manila Development Agency; Philippine Institute of Volcanology and Seismology. Earthquake Impact Reduction Study for Metro Manila, Republic of the Philippines; Japan International Cooperation Agency: Makati City, Philippines, 2004. [Google Scholar]
- Tsutsumi, H. and Perez, J. Large-scale active fault map of the Philippine fault based on aerial photograph interpretation. Active Fault Research 2013, 2013, 29-37.
- Mines and Geosciences Bureau Regional Office VIII. Geological Map of Leyte Province. Mines and Geosciences Bureau Regional Office VIII: Palo, Leyte, Philippines, 2023.
- Louie, J.N. Shear-Wave Velocity to 100 Meters Depth from Refraction Microtremor Arrays. Bulletin of the Seismological Society of America 2001, 91(2), 347–364. [Google Scholar] [CrossRef]
- Molnar, S.; Sirohey, A.; Bard, P.-Y.; Castelaro, S.; Cornou, C.; Cox, B.; Guillier, B.; Hassani, B.; Kawase, H.; Sanchez-Sesma, F.J.; Yong, A. A review of the microtremor horizontal-to-vertical spectral ratio (MHVSR) method. Journal of Seismology 2022, 26, 653–685. [Google Scholar] [CrossRef] [PubMed]
- Pitilakis, K.; Riga, E.; Anastasiadis, A. New code site classification, amplification factors and normalized response spectra based on a worldwide ground-motion database. Bulletin of Earthquake Engineering 2013, 11, 925–966. [Google Scholar] [CrossRef]
Figure 1.
(A) Geological and (B) geomorphologic map of GMMA, as well as the location of the ReMi and 3CMT survey sites depicted by red points. Maps adapted from Daag et al. (2022) [6]. Geologic map modified from BMG (1983) [13] and geomorphologic map adapted from MMEIRS (2004) [14].
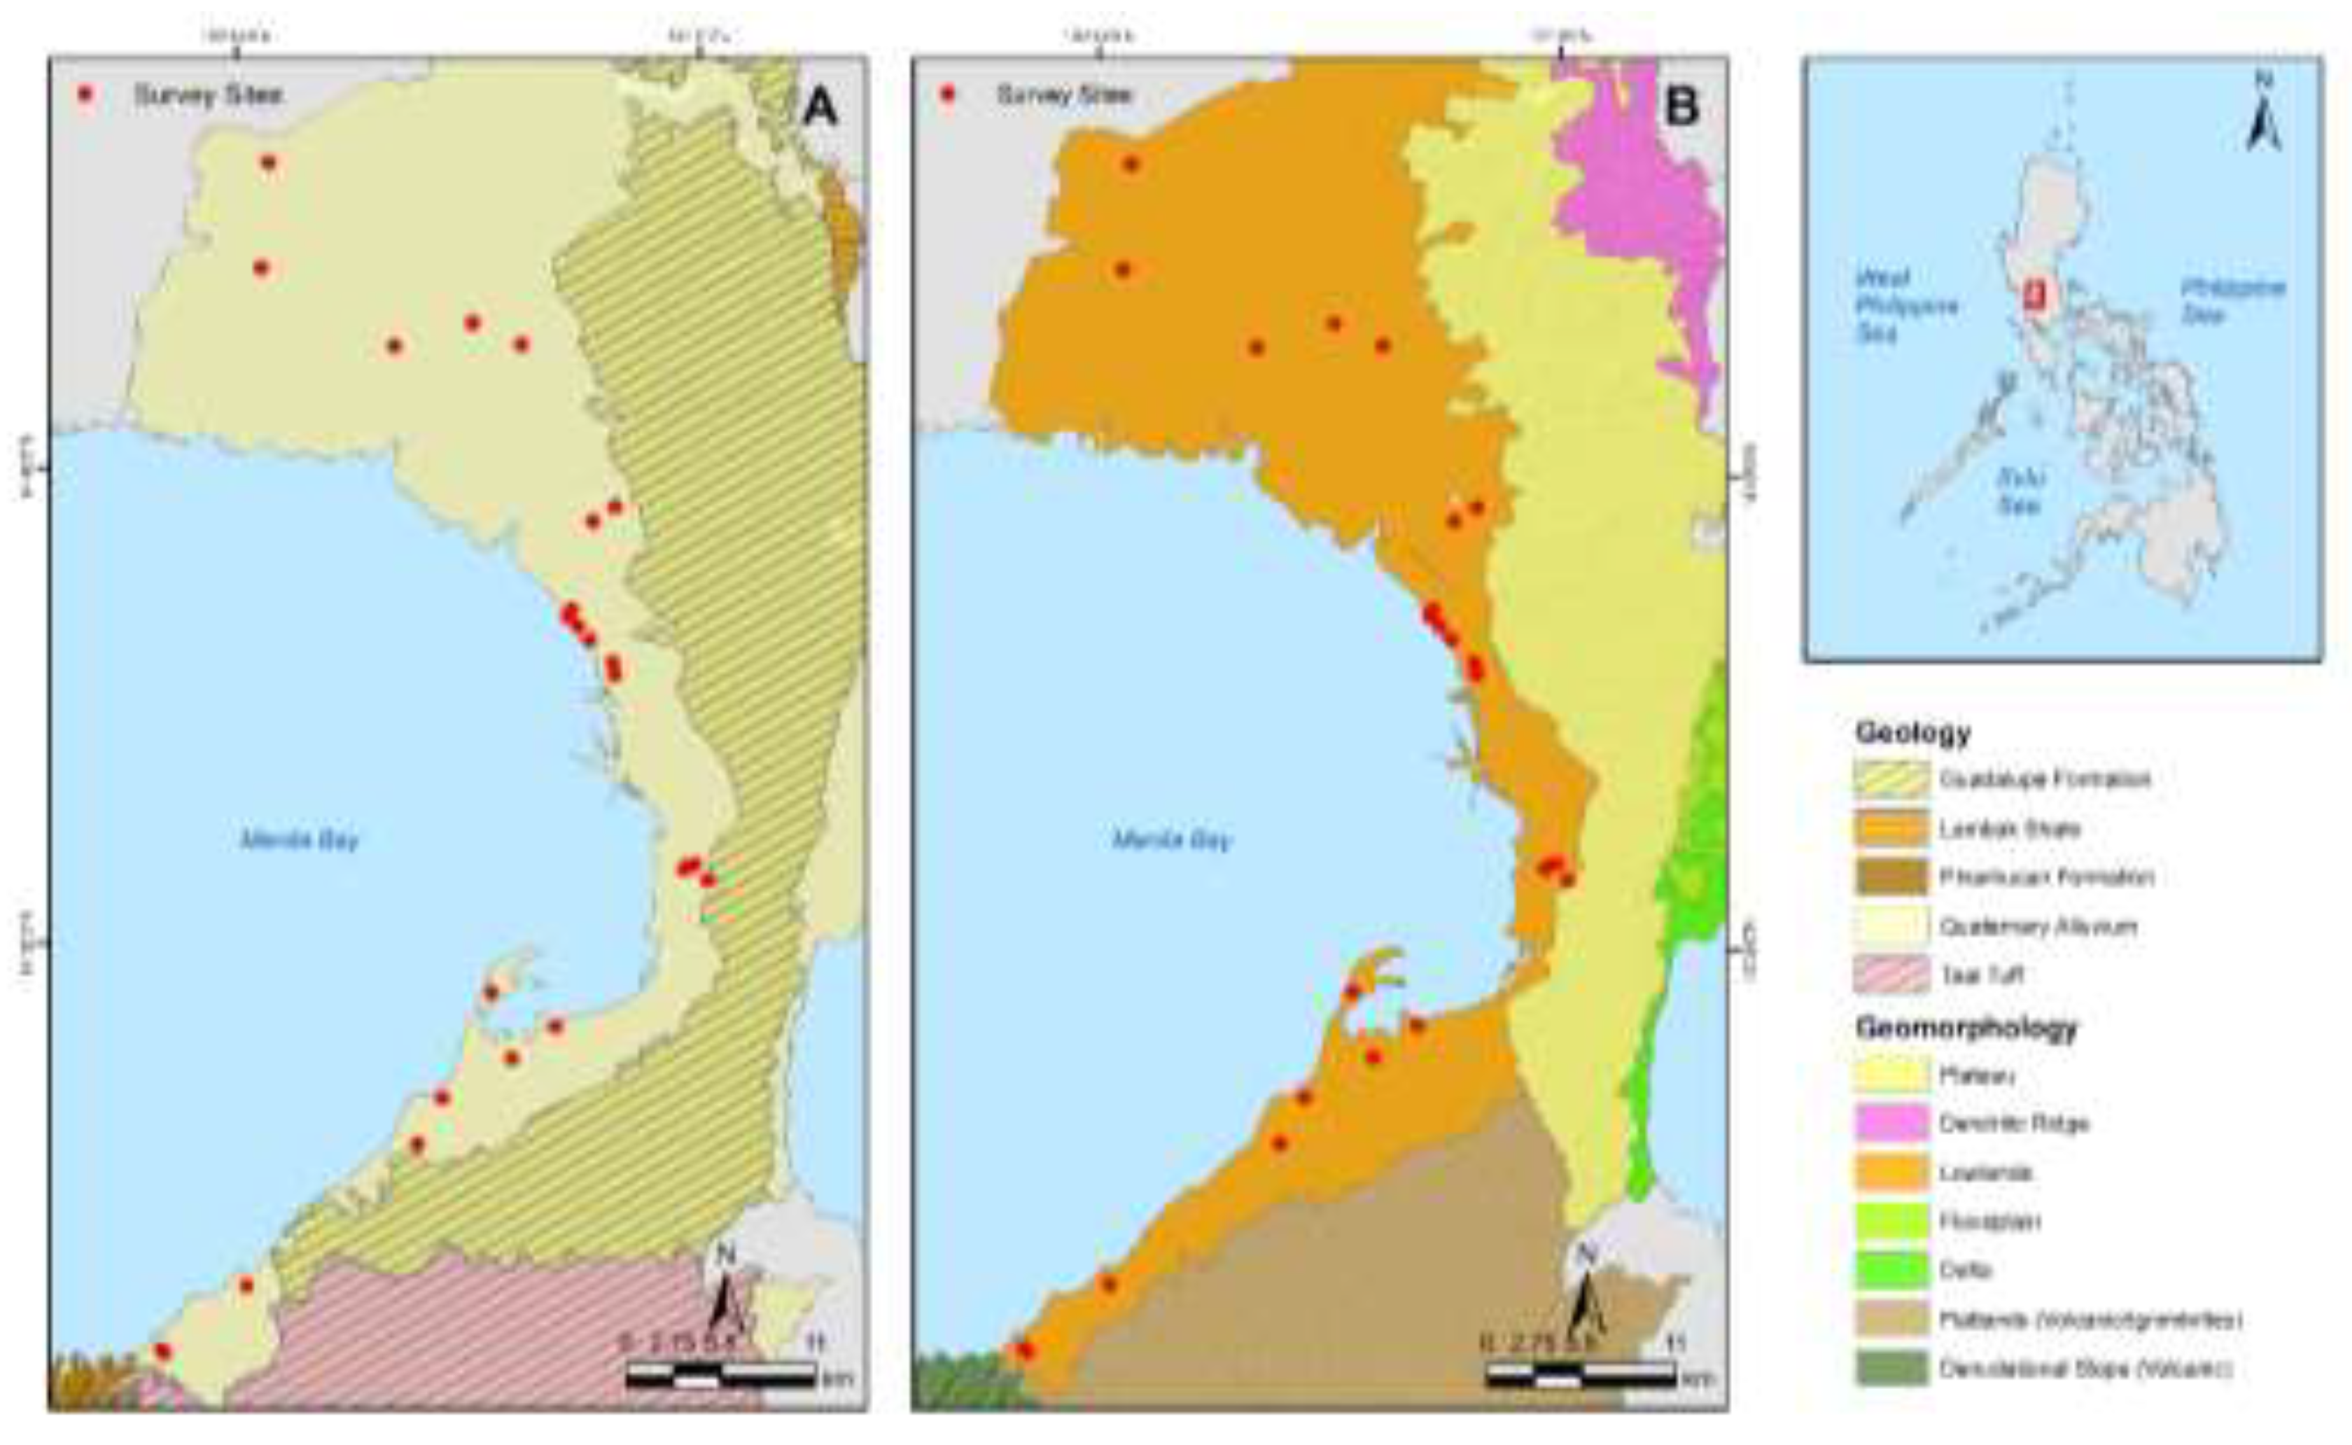
Figure 2.
(A) Geological and (B) geomorphologic map of Leyte, as well as the location of the ReMi and 3CMT survey sites depicted by green triangles and red points, respectively. Geologic map based on unpublished map from Mines and Geosciences Bureau Regional Office VIII (2023) [17]. Geomorphologic map generated by the Ground Shaking Component of the PHIVOLCS Accelerated Earthquake Multi-hazards and Risk Assessment Program in the Philippines (ACER).
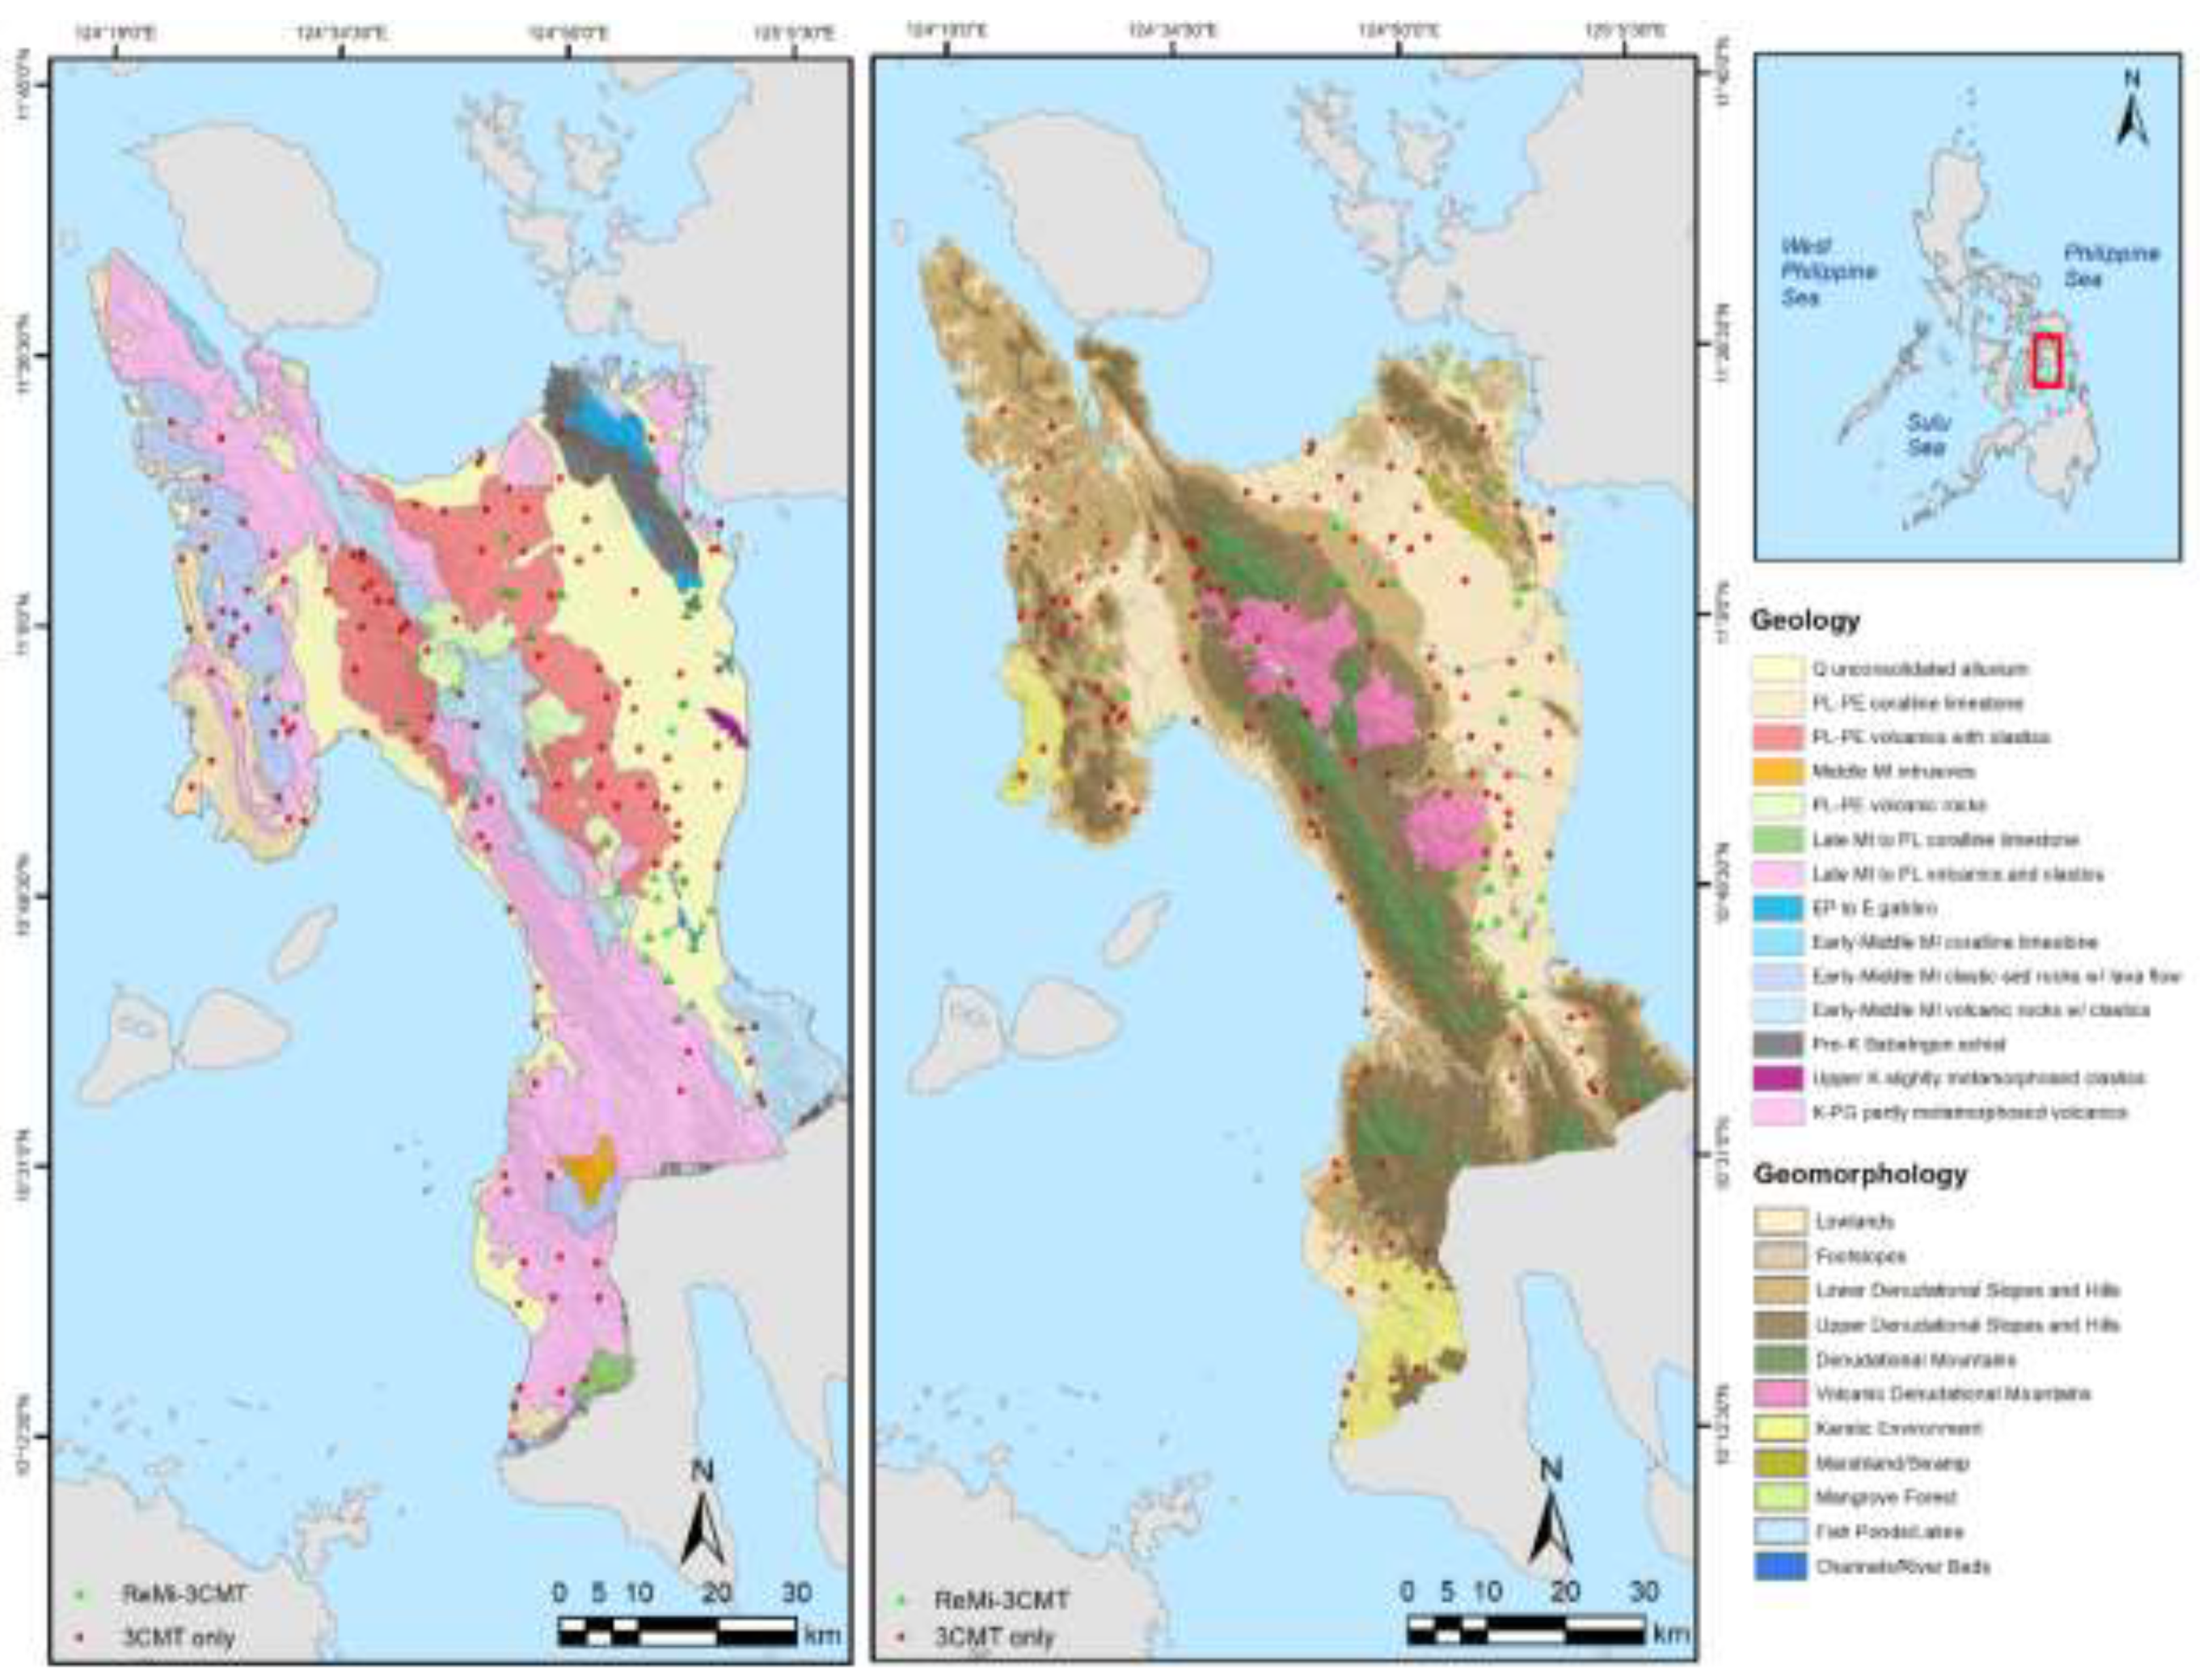
Figure 5.
Comparison between ReMi-derived Vs30 (in blue) and GA-derived Vs30 (in orange) in GMMA sites.
Figure 5.
Comparison between ReMi-derived Vs30 (in blue) and GA-derived Vs30 (in orange) in GMMA sites.
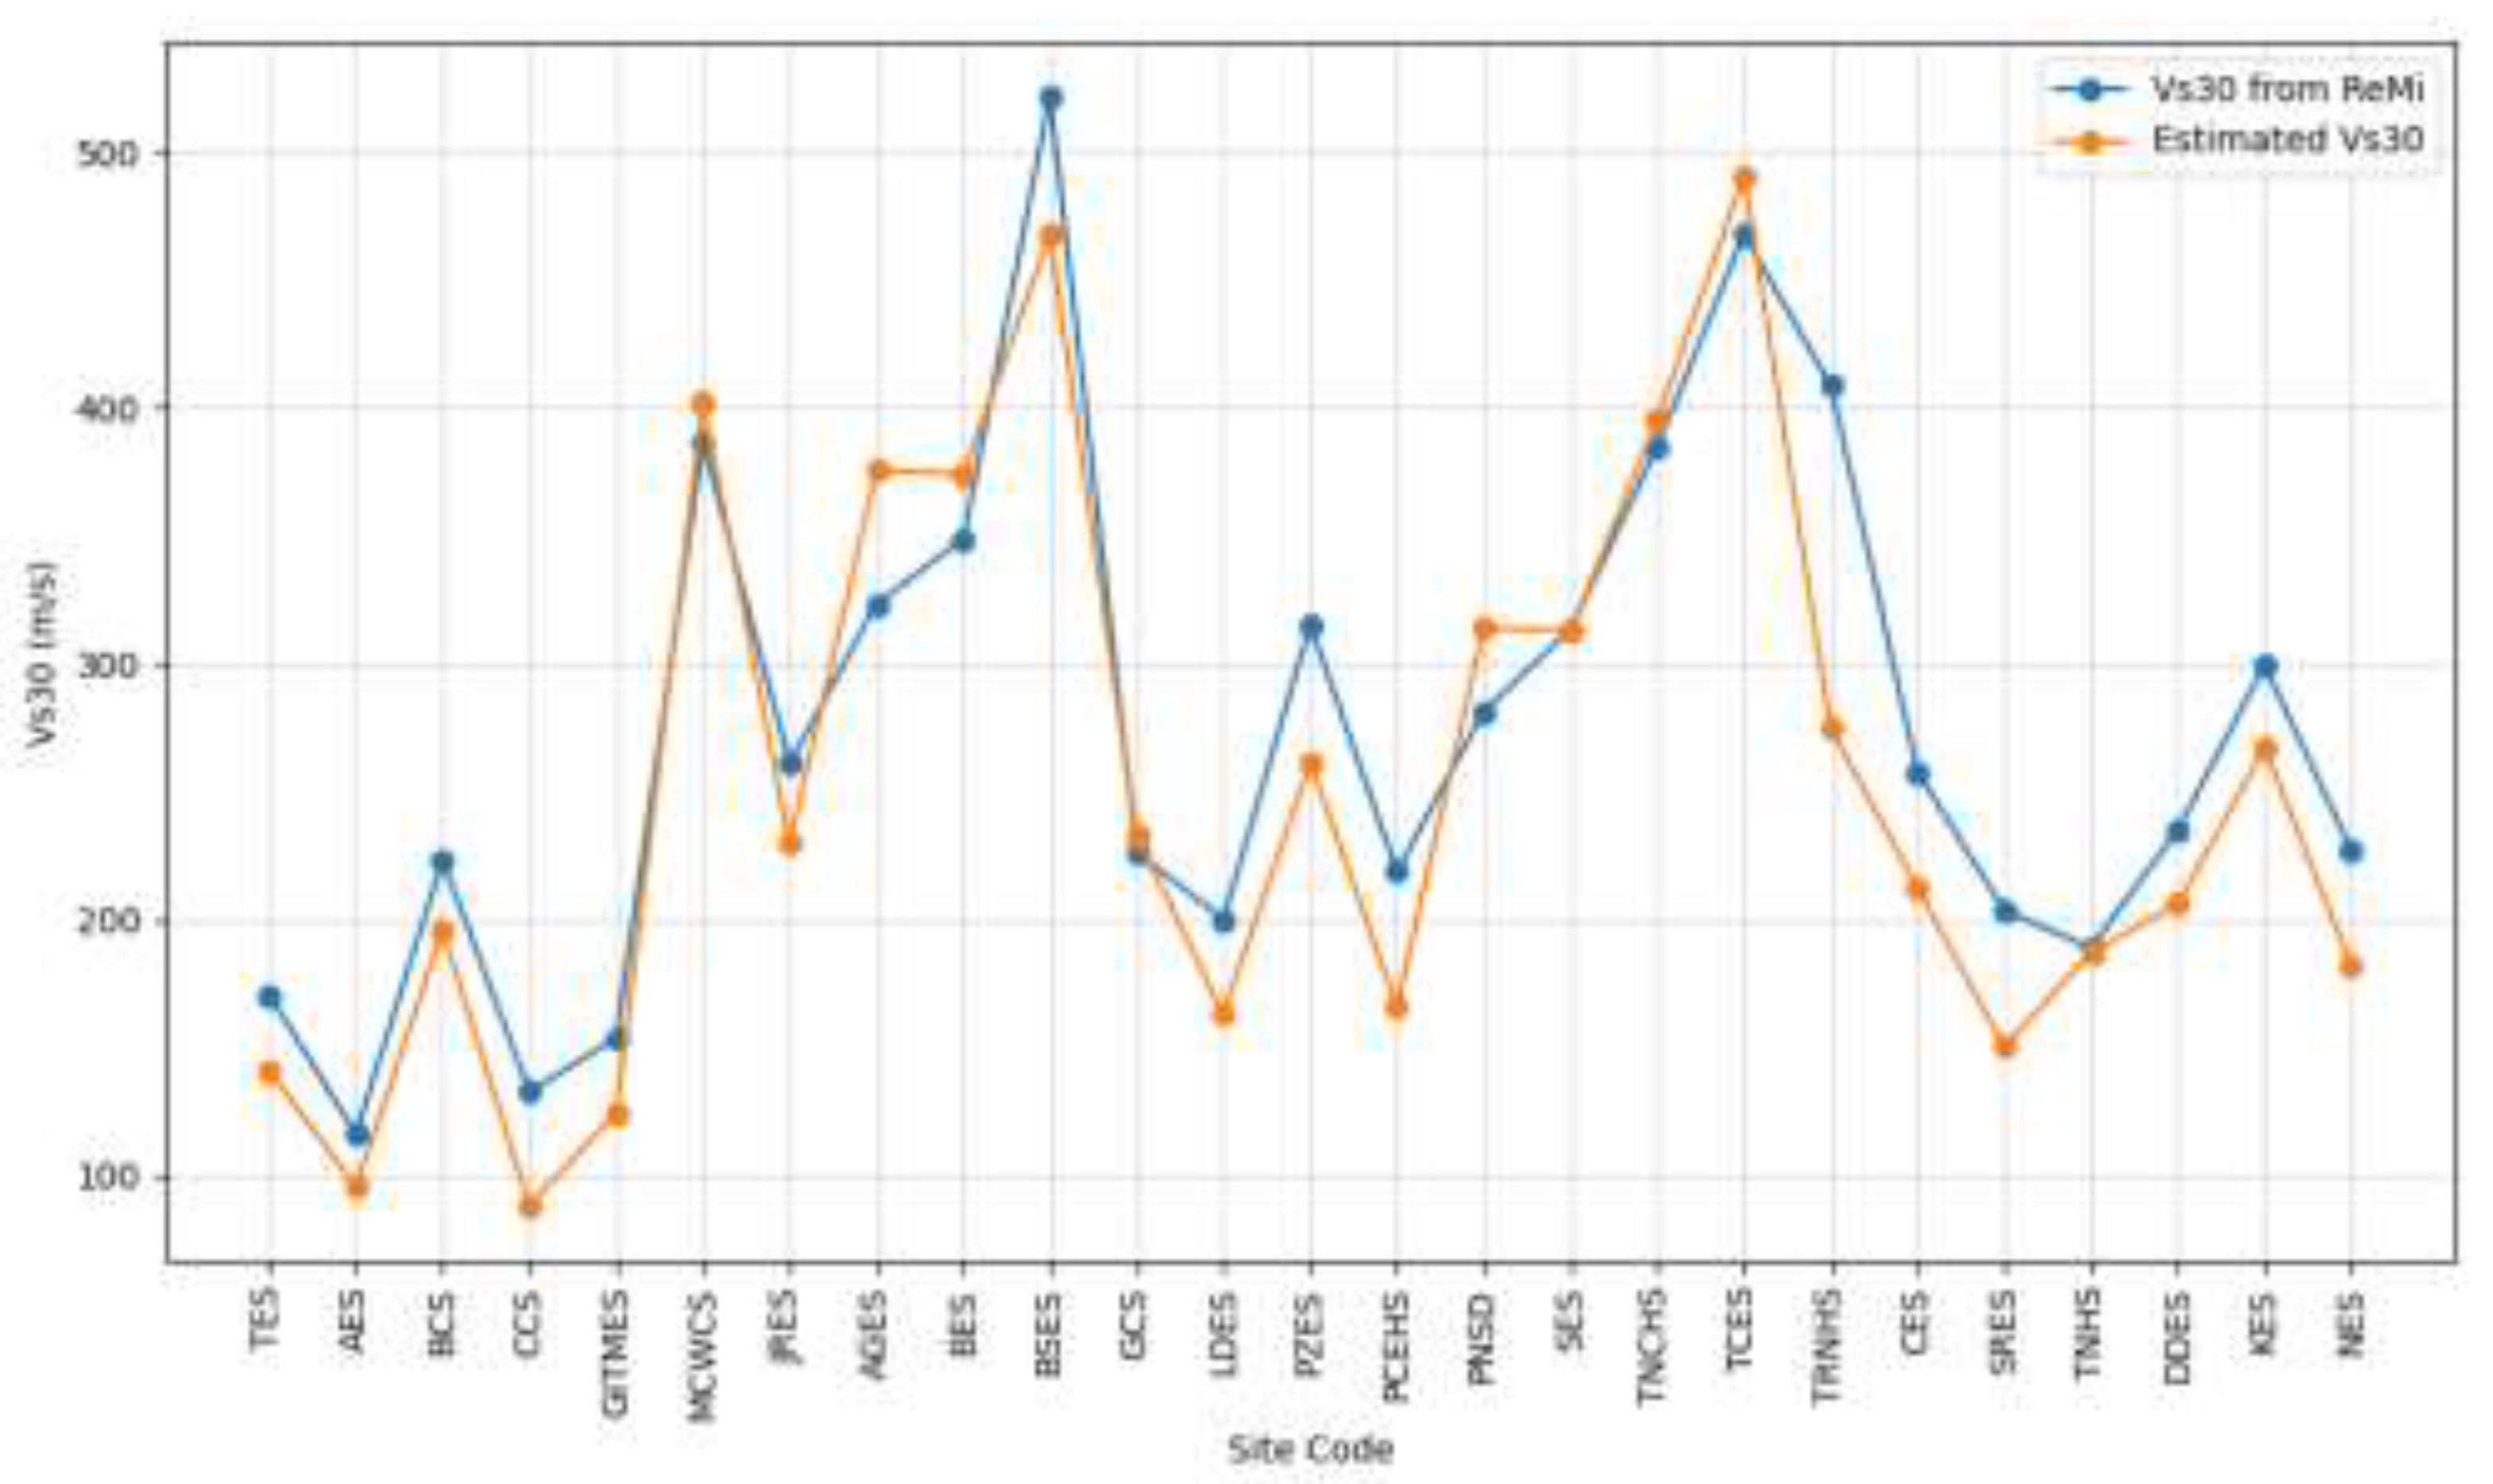
Figure 6.
Comparison of ReMi-derived Vs30 and estimated Vs30 for all site classes as well as the overall data for GMMA data.
Figure 6.
Comparison of ReMi-derived Vs30 and estimated Vs30 for all site classes as well as the overall data for GMMA data.
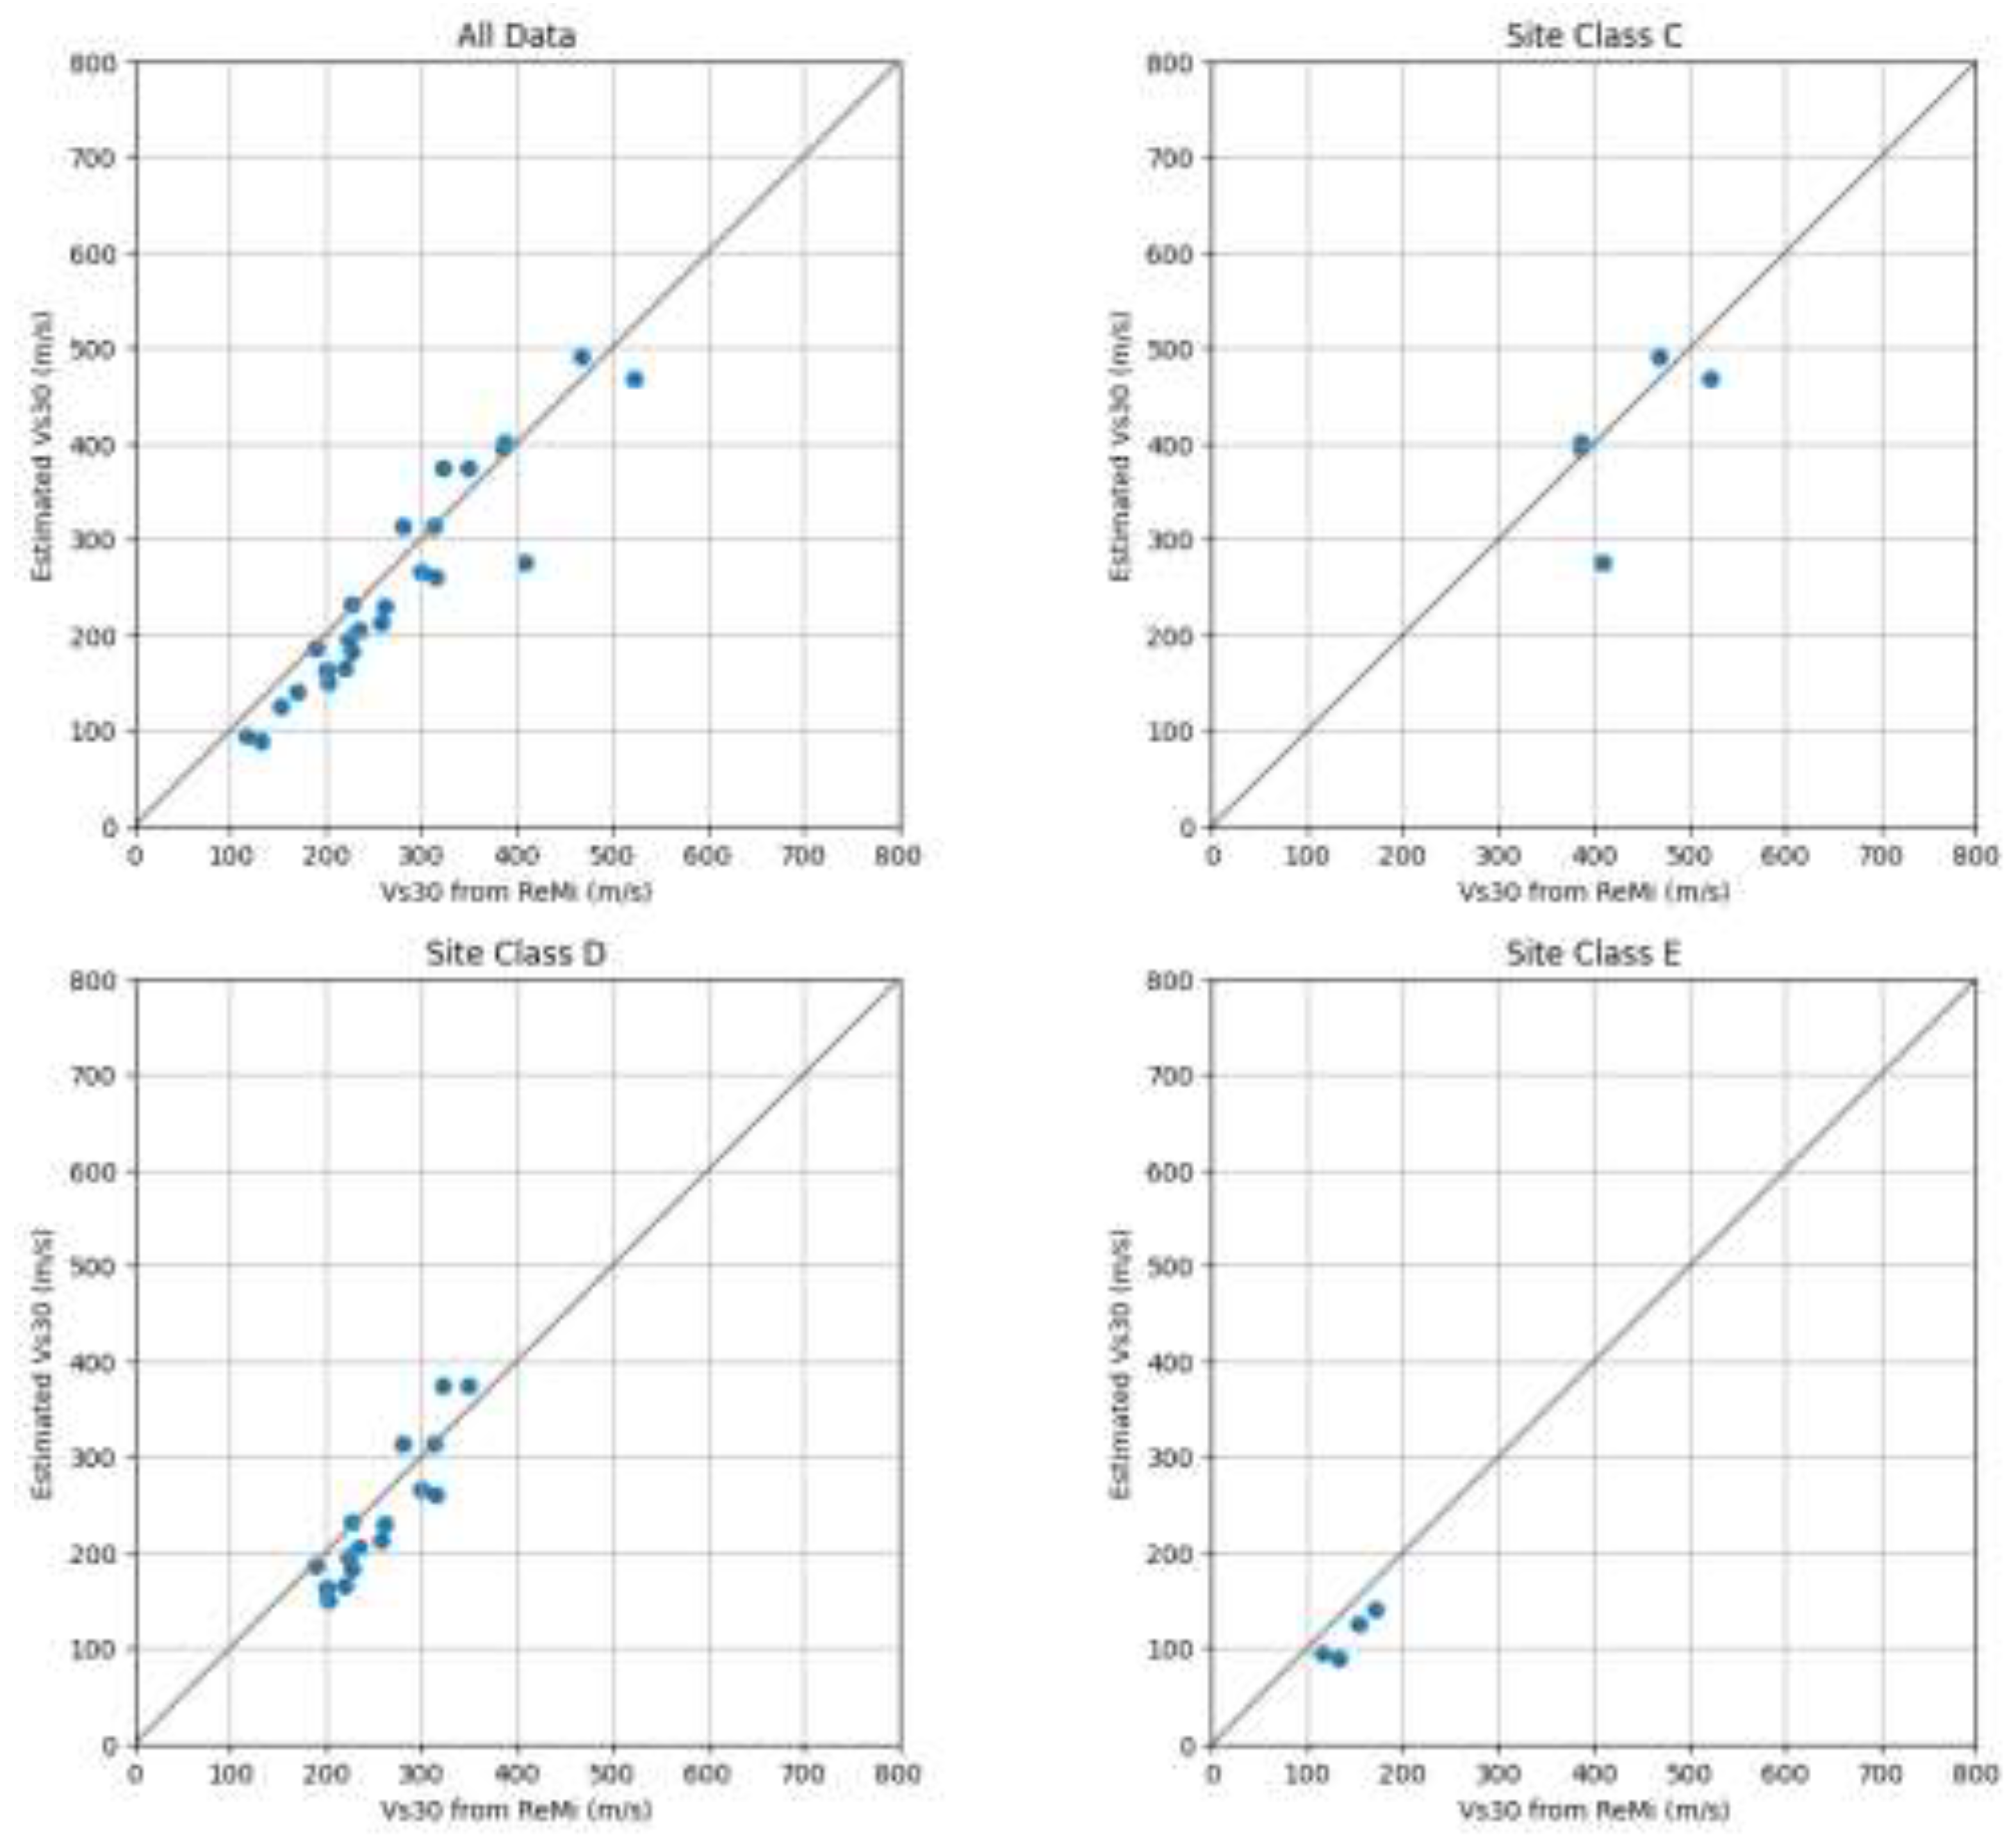
Figure 7.
Correlation between site period and estimated Vs30 of GMMA sites using power regression.
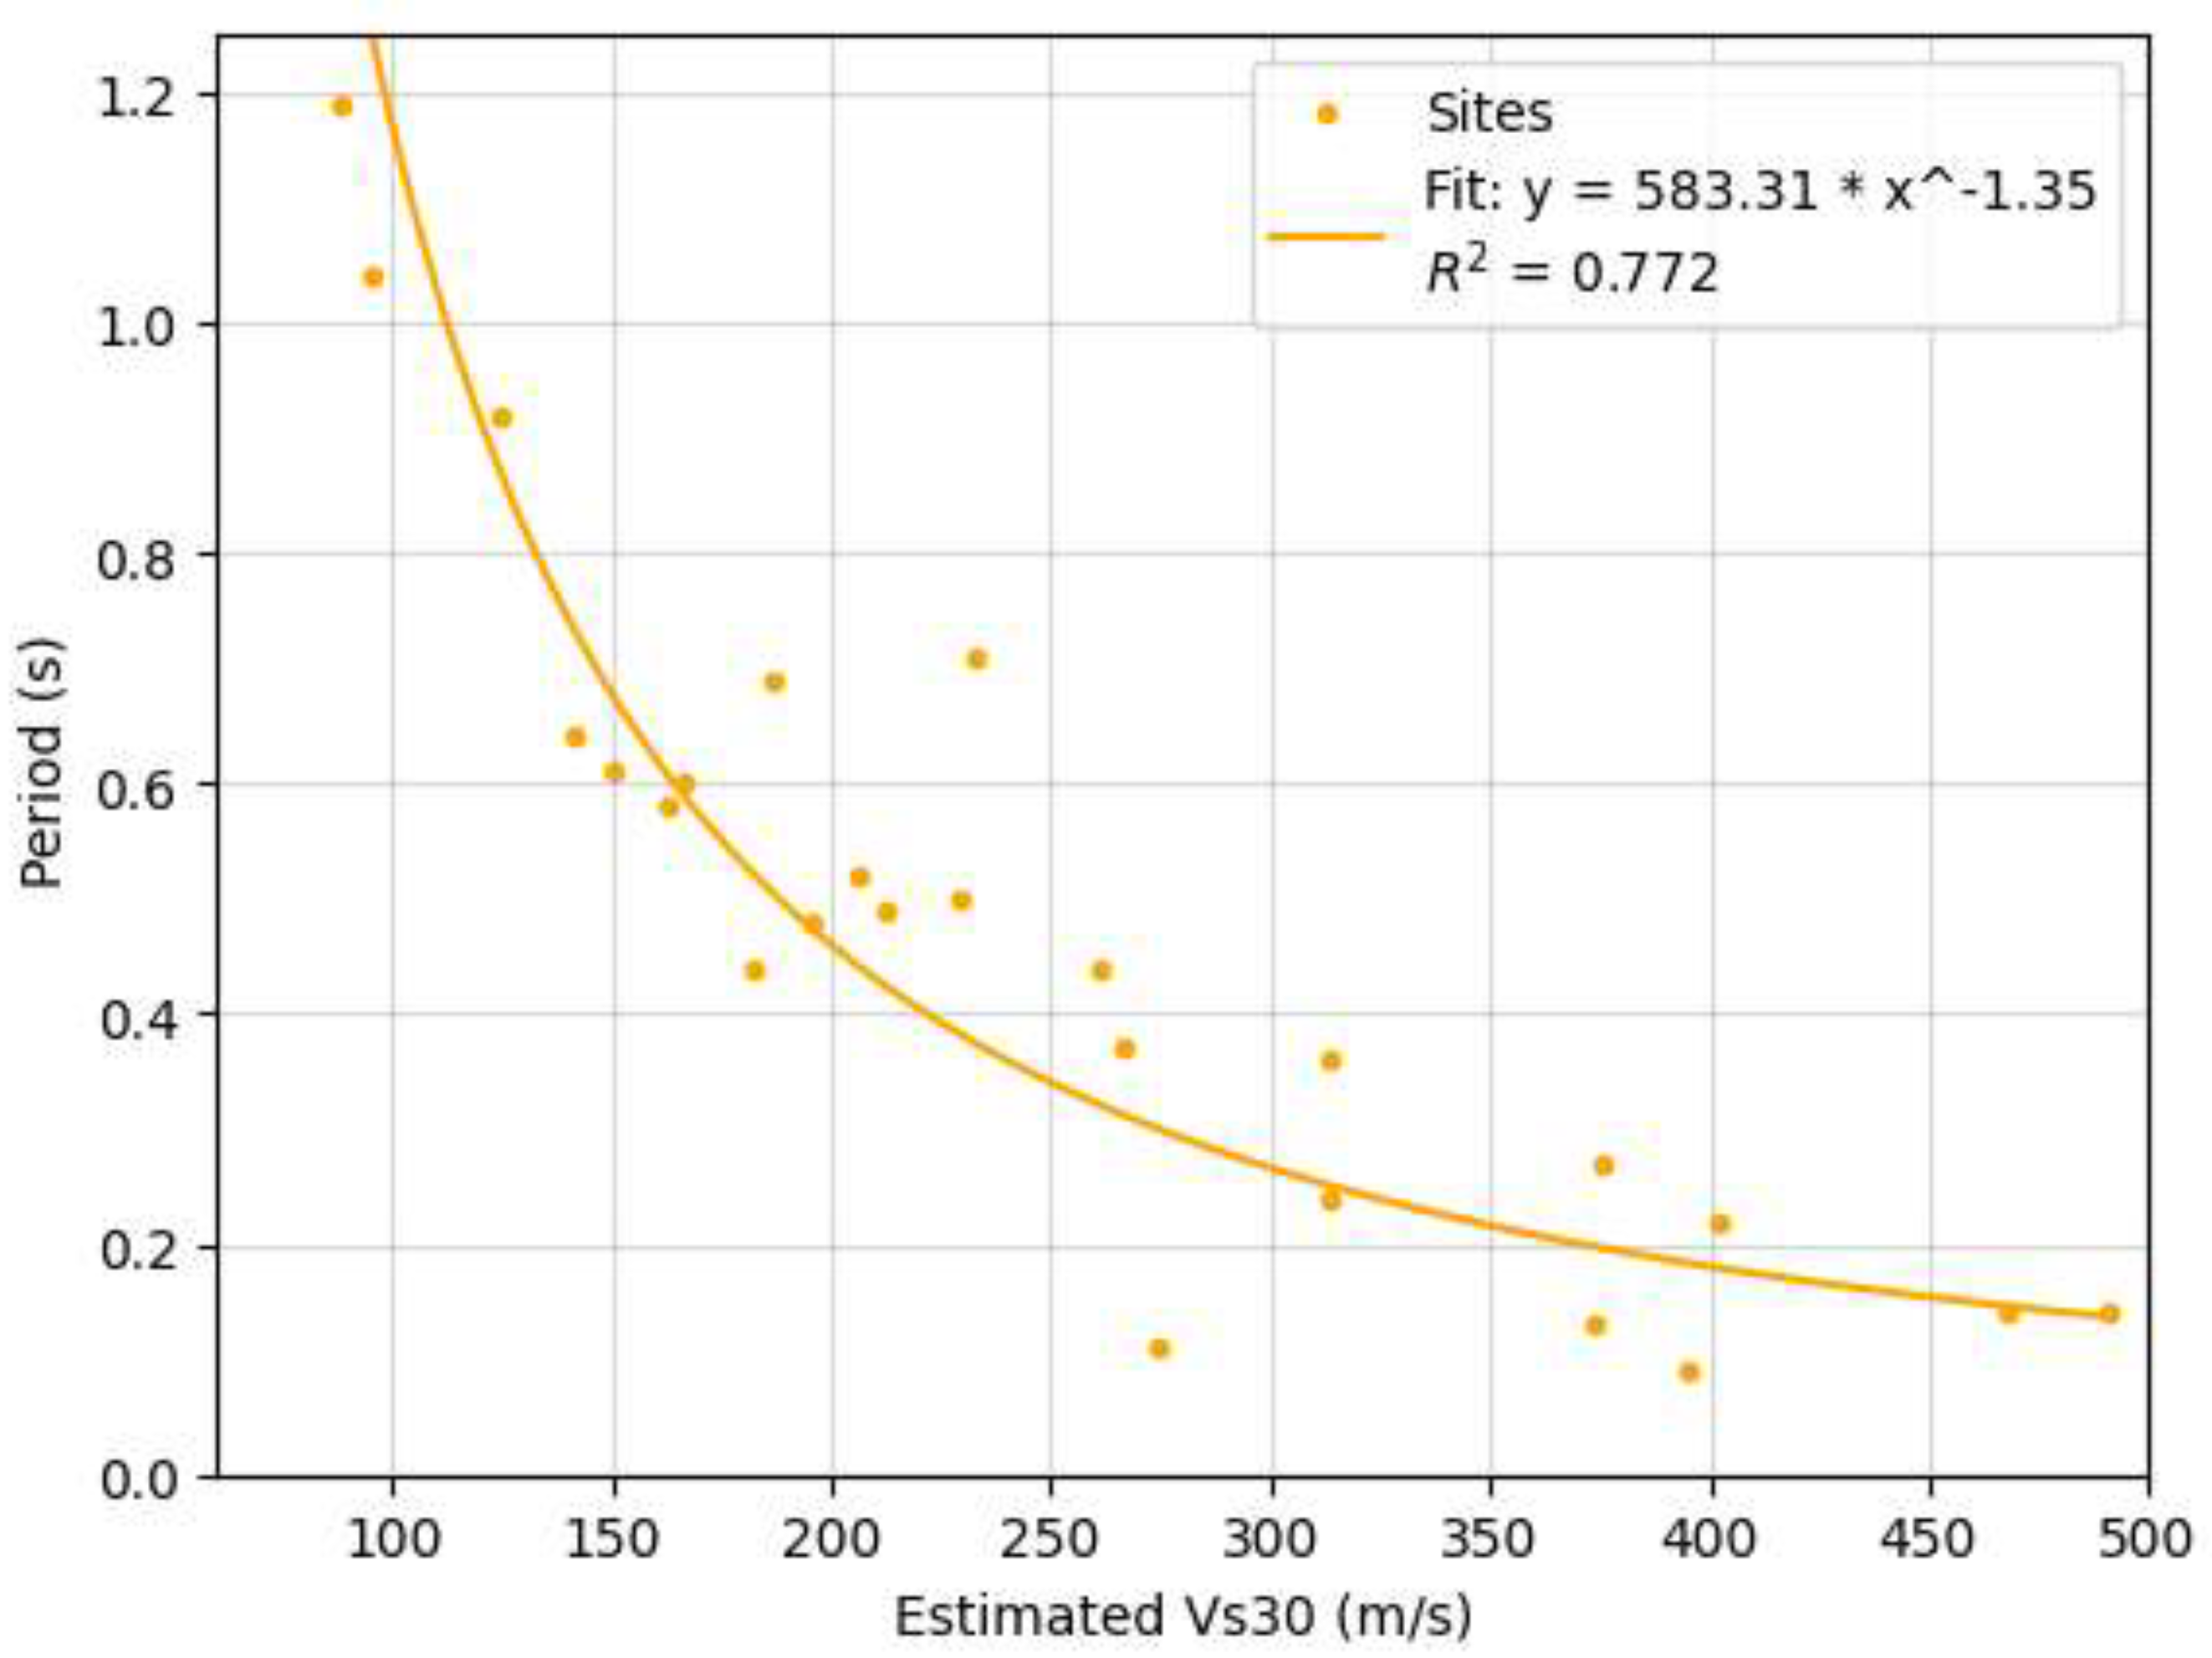
Figure 8.
Comparison between ReMi-derived Vs30 (in blue) and estimated Vs30 (in orange) of Leyte sites.
Figure 8.
Comparison between ReMi-derived Vs30 (in blue) and estimated Vs30 (in orange) of Leyte sites.
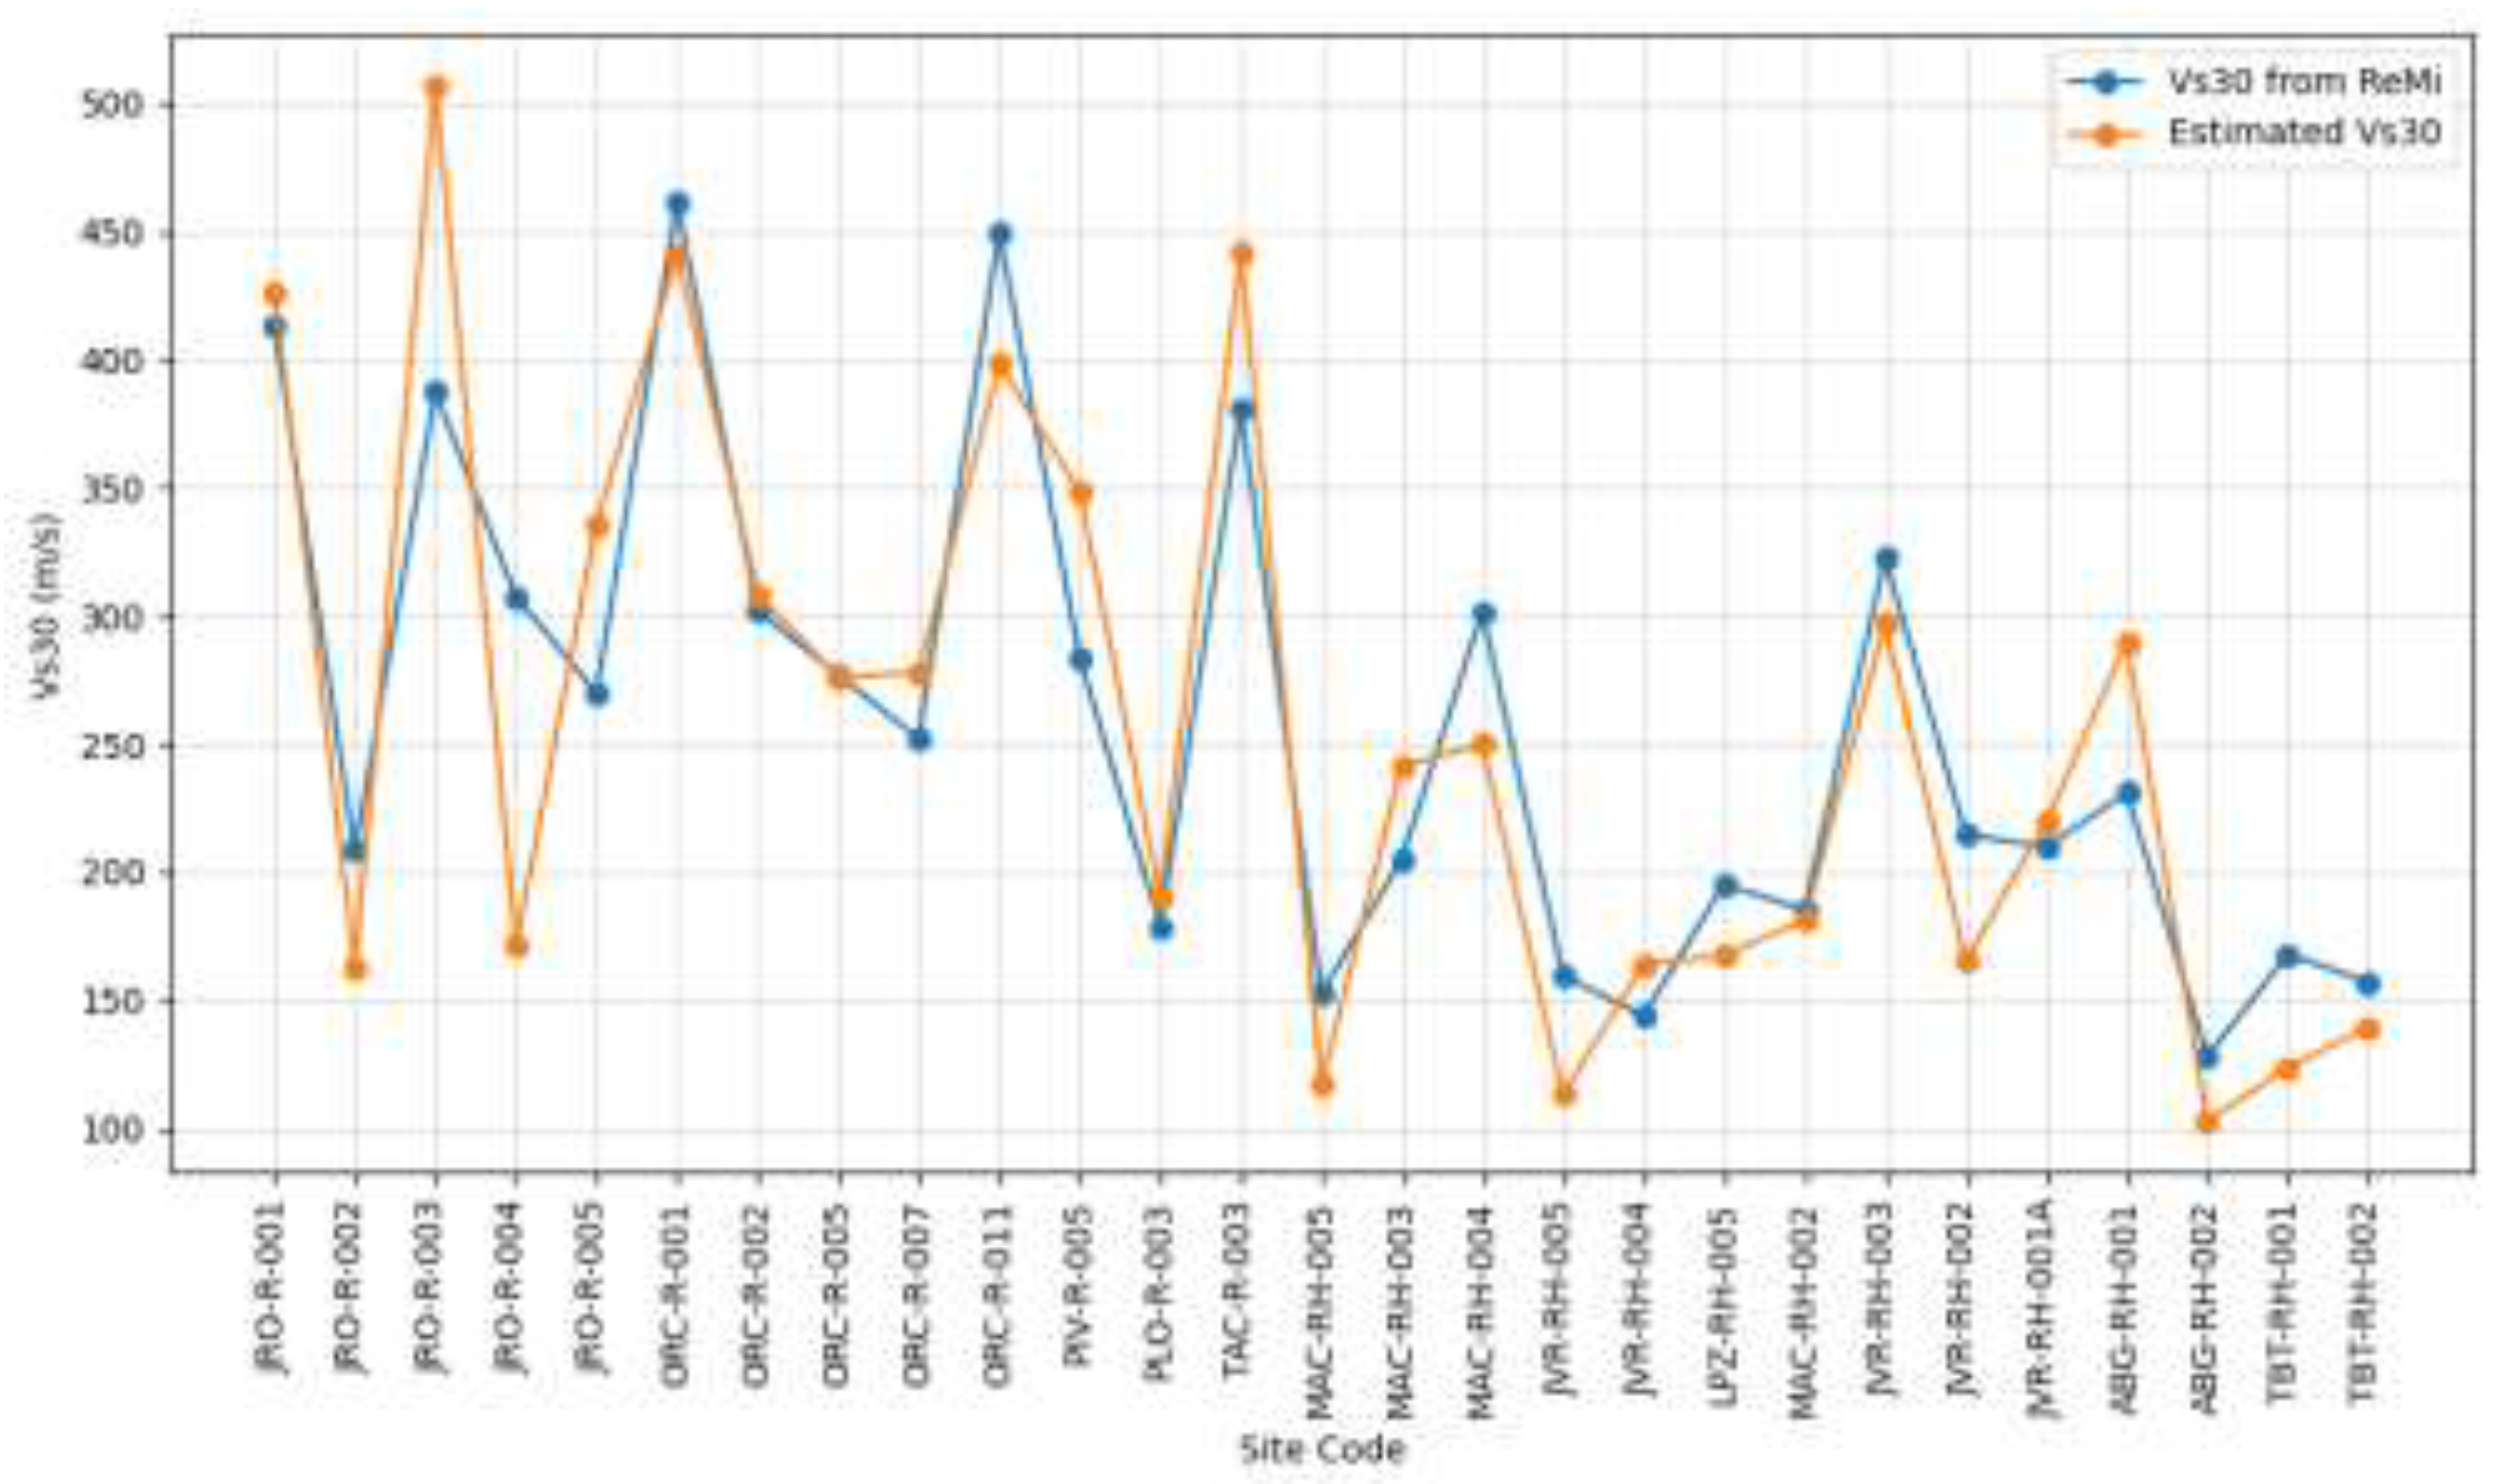
Figure 10.
Correlation between site period and estimated Vs30 of Leyte sites using power regression.
Figure 10.
Correlation between site period and estimated Vs30 of Leyte sites using power regression.
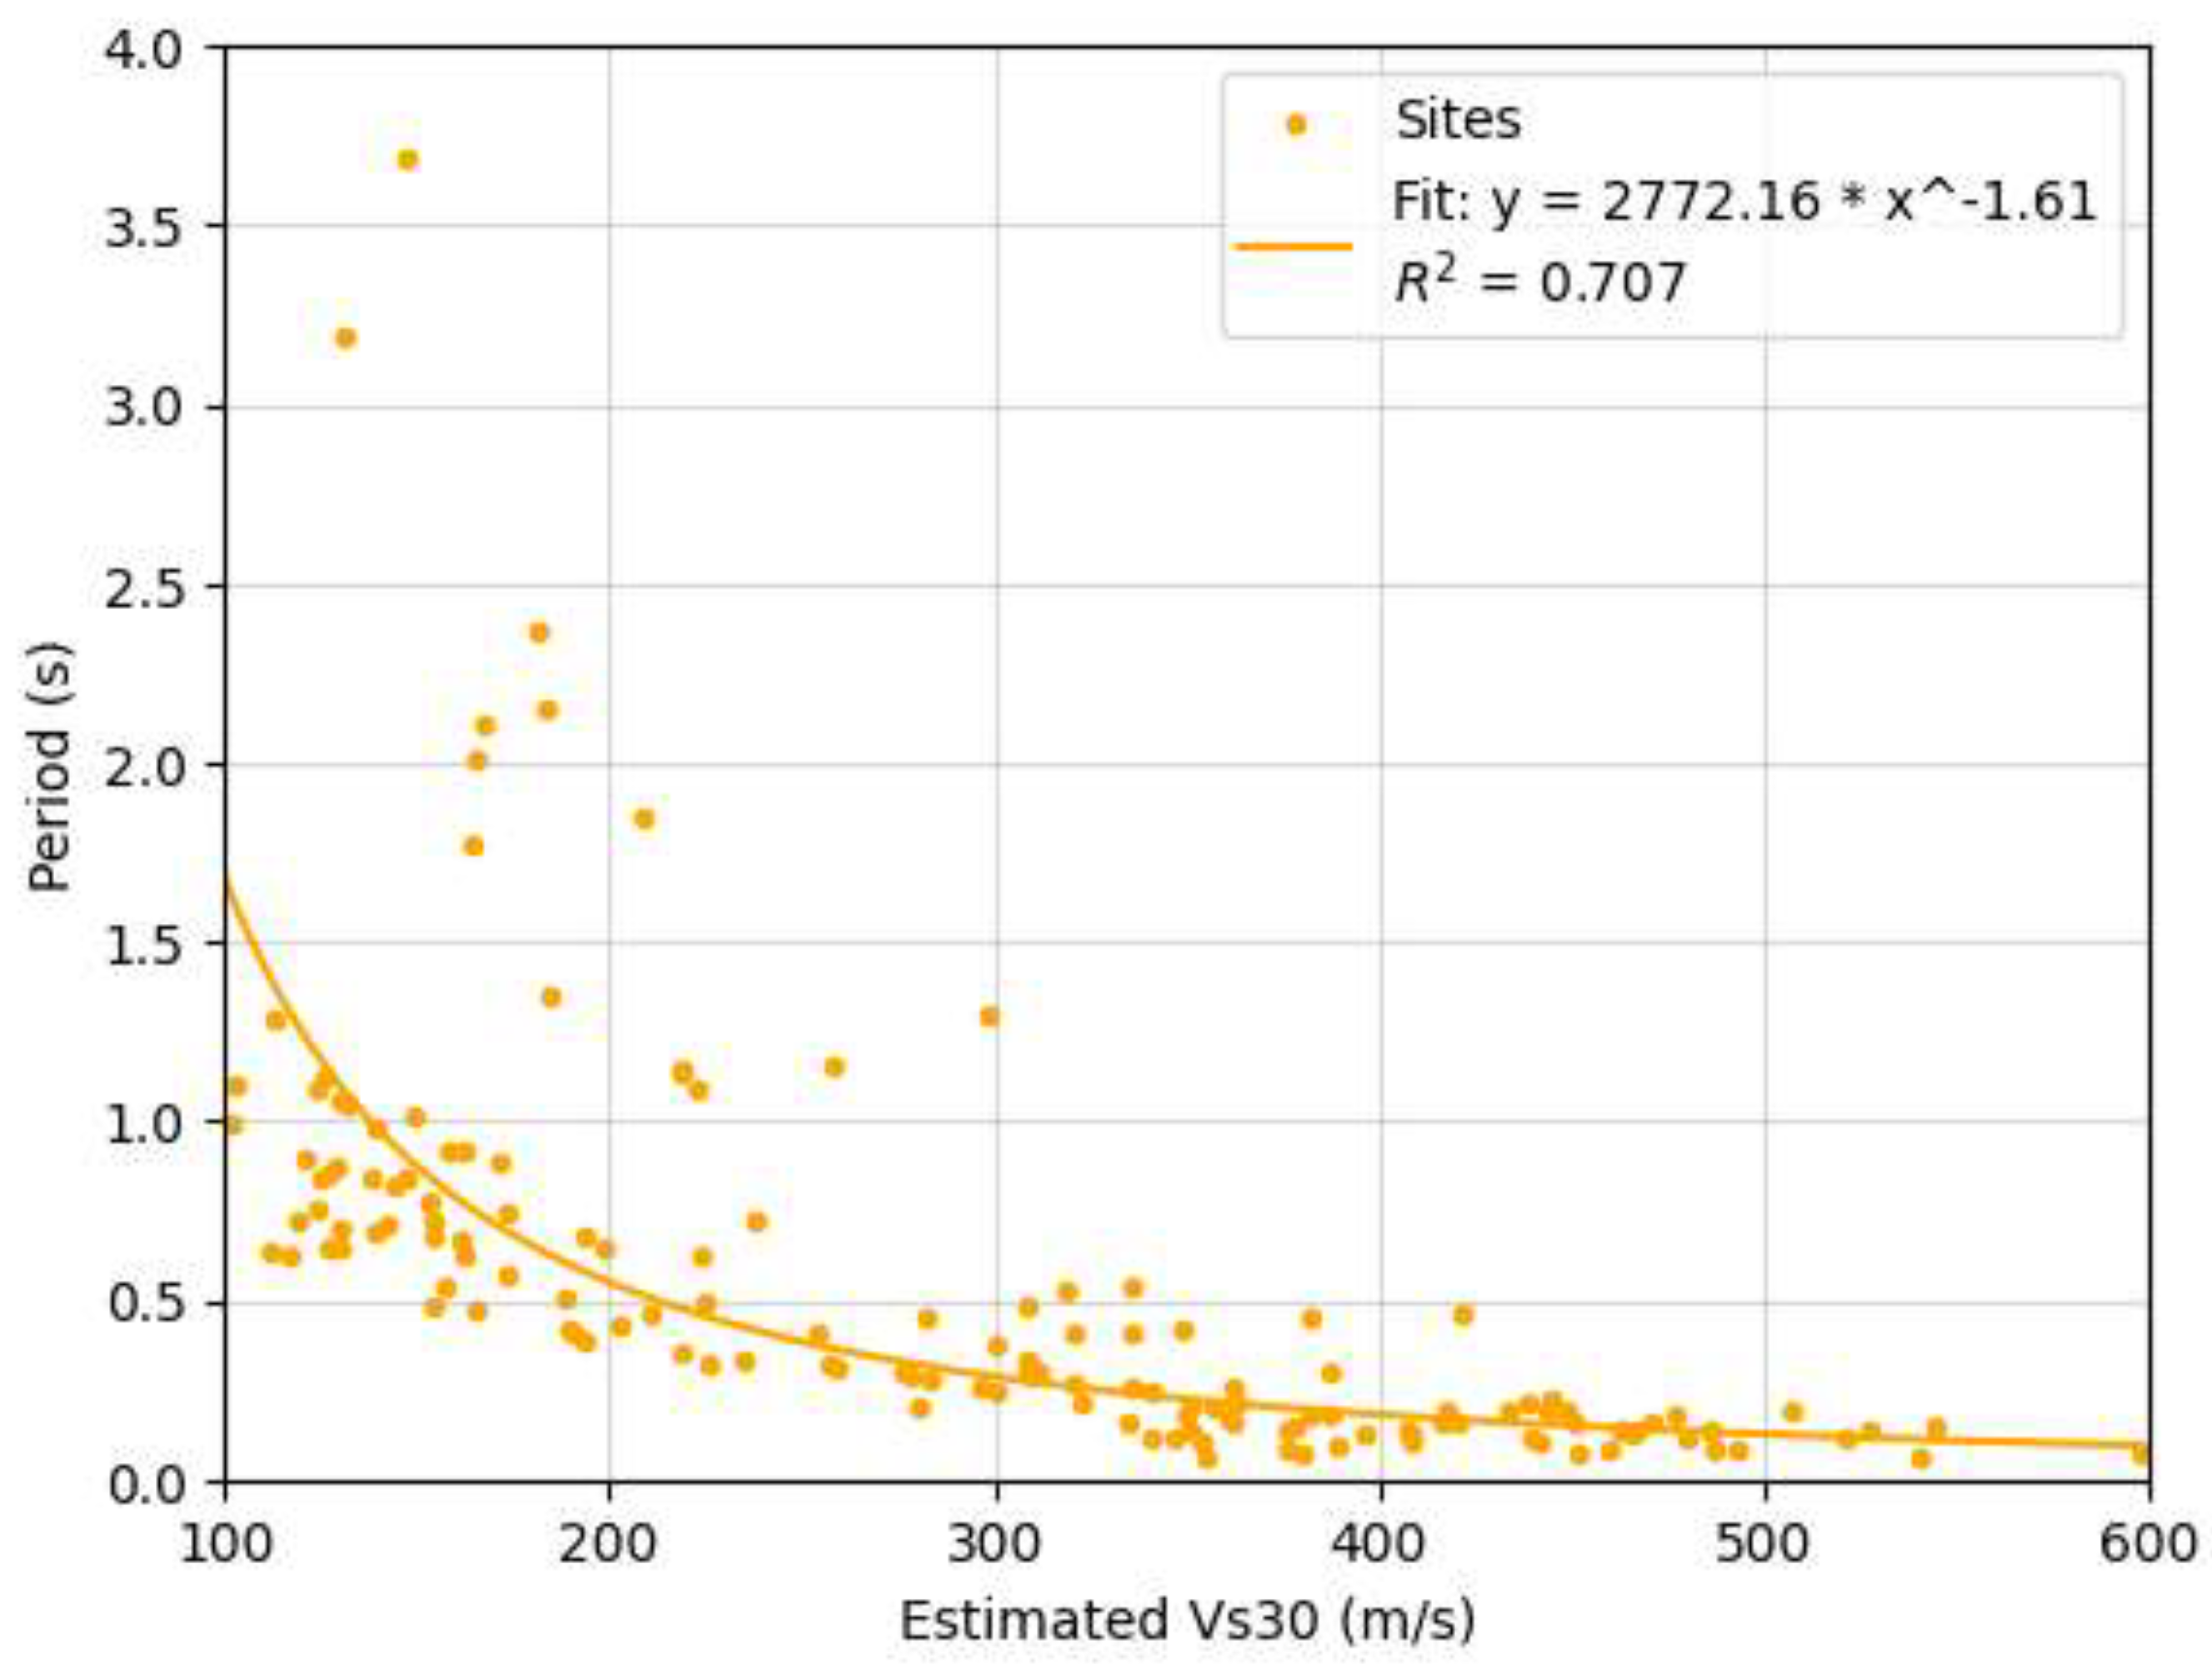
Table 1.
Model parameters applied for the selected site.
| Layer | Thickness (m) | S-Wave Velocity (ms-1) | Density (gcm-3) | Damping Ratio |
| 1 | 1 - 6 | 180 - 360 | 1.7586 - 1.9378 | 0.02331 - 0.0463 |
| 2 | 1 - 38 | 360 - 760 | 1.9378 - 2.1515 | 0.0110 - 0.0231 |
Table 5.
Description and corresponding Vs30 range of the NSCP Seismic Site Classification.
| Site Profile Type | Description | Range of Vs30 (m/s) |
| SA | Hard rock | > 1500 |
| SB | Rock | 760 - 1500 |
| SC | Very dense soil and soft rock | 360 - 760 |
| SD | Stiff soil profile | 180 - 360 |
| SE | Soft soil profile | < 180 |
| SF | Site-specific evaluation required |
Table 6.
Match Rate, R², r, and RMSE values for all site classes in GMMA.
| Site Class |
No. of Samples |
Match Rate (%) | R2 | r | RMSE |
| C | 5 | 80 | 0.376 | 0.614 | 59.517 |
| D | 16 | 68.75 | 0.835 | 0.914 | 28.411 |
| E | 4 | 100 | 0.920 | 0.920 | 8.402 |
| All | 25 | 76 | 0.885 | 0.941 | 37.584 |
Disclaimer/Publisher’s Note: The statements, opinions and data contained in all publications are solely those of the individual author(s) and contributor(s) and not of MDPI and/or the editor(s). MDPI and/or the editor(s) disclaim responsibility for any injury to people or property resulting from any ideas, methods, instructions or products referred to in the content. |
© 2025 by the authors. Licensee MDPI, Basel, Switzerland. This article is an open access article distributed under the terms and conditions of the Creative Commons Attribution (CC BY) license (http://creativecommons.org/licenses/by/4.0/).
Copyright: This open access article is published under a Creative Commons CC BY 4.0 license, which permit the free download, distribution, and reuse, provided that the author and preprint are cited in any reuse.


