
Submitted:
17 January 2025
Posted:
20 January 2025
You are already at the latest version
Abstract
This study examines the transformative potential of FinTech, particularly crowdfunding, in the context of traditional financial systems, even amid the current FinTech market downturn ('Winter'). We address a fundamental question: Does crowdfunding represent a viable alternative to conventional finance, or does it merely function as an extension of existing financial infrastructure? To investigate this relationship empirically, we developed a proprietary crowdfunding index and employed Diebold and Yilmaz (2012; 2014)'s Interconnectedness Index methodology to compare the spillover effects of crowdfunding and traditional financial systems with common economic factors such as interest rates, USD index, economic uncertainty, cryptocurrency (Bitcoin,) as well as commodities (gold and oil). Despite crowdfunding's remarkable growth trajectory over the past decade, our empirical evidence indicates that it has not yet emerged as a viable substitute for conventional financial mechanisms. These findings carry substantial implications for regulatory frameworks, industry stakeholders, and academic discourse, contributing to the broader understanding of FinTech's disruptive capacity within the financial ecosystem.
Keywords:
Crowdfunding
; Finance
; Spillovers
; Interconnectedness
; FinTech
; Volatility
1. Introduction
The contemporary financial system is undergoing a significant transformation driven by technological advancements and evolving financial needs. FinTech (financial technology) companies are emerging as disruptive forces, leveraging technology to offer innovative financial services. One key area of FinTech’s impact is crowdfunding, which allows individuals to bypass traditional gatekeepers and directly fund ventures or projects. Crowdfunding platforms democratize access to capital, particularly for startups and small businesses that might face challenges securing bank loans [2]. This not only fosters financial inclusion but also injects fresh ideas and competition into the market. However, regulatory frameworks need to adapt to ensure the stability and security of these new financial instruments.
Crowdfunding and FinTech, while both disrupting the financial landscape, hold distinct similarities and differences compared to conventional finance. On the similarity side, all three sectors share the core objective of financial intermediation: facilitating the flow of funds between those with capital and those seeking it [3]. Similar financial instruments like debt and equity exist across all three. Additionally, risk-reward structures remain a cornerstone, with investors seeking returns [2]. However, key differences lie in accessibility, scale, and regulations. Crowdfunding and FinTech offer greater accessibility, allowing individuals to participate beyond the limitations of traditional institutions [4]. They typically focus on smaller projects or startups compared to the vast sums handled by conventional banks. Finally, regulatory frameworks for FinTech and crowdfunding are still evolving to address potential risks and ensure consumer protection, while conventional finance operates within a well-established legal infrastructure. In essence, while all three sectors share the core function of financial intermediation, crowdfunding and FinTech offer a more accessible and potentially innovative alternative, albeit on a smaller scale and with evolving regulations, compared to the established framework of conventional finance.
Financial crises and negative supply shocks can significantly impact the conventional financial system and the emerging FinTech and crowdfunding landscape. Conventional financial institutions are particularly vulnerable during these periods. Crises expose underlying weaknesses in credit markets, leading to tighter lending and reduced credit availability [5]. This can cripple businesses and hinder economic growth. Additionally, negative supply shocks, like disruptions in resource availability, can trigger inflationary pressures, eroding the value of financial assets and potentially leading to bank runs [6]. FinTech and crowdfunding, on the other hand, might exhibit some resilience. Their decentralized nature and focus on smaller-scale financing could make them less susceptible to systemic risks plaguing traditional institutions [7]. However, concerns remain. FinTech firms may rely on traditional financial infrastructure for some operations, making them vulnerable to broader market disruptions [8]. Crowdfunding platforms could also experience decreased investor participation during economic downturns, hindering their ability to function as a reliable funding source [2]. The theoretical impact of financial crises and negative supply shocks on these new sectors remains complex.
The true nature of crowdfunding remains a topic of debate. Is it a revolutionary force democratizing finance, or simply an extension of the traditional system? Proponents see crowdfunding as a game-changer, empowering individuals to bypass the limitations of traditional institutions and participate in financing ventures [2]. This is supported by its potential to foster financial inclusion by offering access to capital for startups and underserved communities that struggle with securing bank loans [4]. Additionally, crowdfunding platforms often prioritize innovative ideas and social impact projects, potentially leading to a more diverse and socially responsible financial landscape [9]. However, critics argue that crowdfunding merely extends the reach of traditional finance by relying on similar investment principles and risk-reward structures [10]. Concerns also exist regarding information asymmetry, where entrepreneurs may lack the resources or transparency to fully inform investors [11].
Ultimately, the role of crowdfunding likely lies on a spectrum. It offers a valuable alternative funding source with distinct benefits, but regulatory frameworks and evolving practices will determine the extent to which it disrupts the traditional financial system.
In examining the current literature on crowdfunding and its resilience to economic downturns, researchers have taken diverse approaches. Most studies, except for Ahmed et al. [12], Torkanovskiy and Voinov [13], and Cordova et al. [14], have focused on how certain characteristics of crowdfunding impact its success. Ahmed et al. [12] reviewed 125 articles to explore the psychological resilience of entrepreneurship, focusing on the causes of stress and the coping mechanisms developed to mitigate it. Torkanovskiy and Voinov [13] analyzed two years’ worth of reward-based crowdfunding data and found no immediate and straightforward effect of COVID-19 and its associated lockdown on the crowdfunding sector. Cordova et al. [14] examined 1127 technology-related crowdfunding projects to assess the effect of a project’s funding goal and duration on its success.
The bulk of the research has focused on the effect of certain characteristics of crowdfunding on its success, which can be viewed as a source of resilience. Maehle [15] suggests that the strength of crowdfunding comes from its ability to attract individuals and investors with shared values and objectives. Bento et al. [16] examined the effect of a project’s characteristics on its success, particularly for sustainability crowdfunding projects which tend to attract like-minded investors. Calic and Mosakowski [17] found that the social aspect of a crowdfunding project enhances its success, contributing to its resilience. Similarly, according to Courtney et al. [18], social endorsements of crowdfunding projects help secure successful funding. Kocollari et al. [19] noted that social capital in its three aspects—bonding, linking, and bridging—can positively affect the number of backers of a crowdfunding project. Liang et al. [20] analyzed sustainability crowdfunding projects and found the effect of information description on the success of crowdfunding projects.
The literature reveals that while researchers have sought to investigate the resilience of crowdfunding from various angles, their scopes were often limited to certain characteristics of specific types of crowdfunding campaigns. This identified a need to examine crowdfunding holistically, which our unique index satisfies, allowing us to observe how it responds to a multitude of economic factors.
Hence, this research examines whether FinTech, specifically crowdfunding, provides enhanced resilience compared to traditional finance during periods of economic turbulence. We investigate whether these emerging financial technologies represent genuine alternatives or merely extensions of conventional financial systems, subject to identical vulnerabilities and market responses. To address this understudied domain, we constructed a novel crowdfunding index enabling comparative analysis of crowdfunding and traditional finance responses to economic factors. Employing [1]’s Interconnectedness Index methodology, we analyzed spillover patterns across our variable set. Our empirical evidence suggests that crowdfunding functions as a complementary rather than substitutive financial mechanism, indicating a future characterized by the coexistence of both traditional and alternative financing channels rather than the displacement of conventional systems.
For government regulators, this coexistence necessitates a balanced approach to regulation, where new financial technologies are encouraged, but within a framework that maintains the stability and integrity of the broader financial system. Regulators should focus on creating guidelines that allow for the safe integration of crowdfunding and emerging finance into the existing financial landscape, ensuring these platforms can operate effectively while protecting investors. For portfolio managers, the findings suggest that while emerging financial instruments like crowdfunding should be considered as part of a diversified investment strategy, they should not replace traditional assets. Instead, they should be used to complement conventional investments, offering opportunities for exposure to innovative sectors while managing the inherent risks through careful assessment and allocation.
2. Research Methodology
2.1. Data
This study utilizes data from highly reputable sources like Refinitv Eikon, the U.S. Department of Treasury, and the Federal Reserve System. We meticulously compiled data from these sources into a single sheet, ensuring consistent coverage periods and entry dates for all variables. The analysis focuses on the daily frequency variables, covering the period from May 10th, 2021, to February 27th, 2024 (see Table 1). In addition to these established data sources, we developed a unique crowdfunding and FinTech index. This innovative approach sets our research apart from previous studies that addressed similar questions.
This study developed a composite Crowdfunding Index (CINX) using price data from five distinct stocks. The index construction involved two steps. First, we normalized stock prices by dividing each stock’s current price by its base value and multiplying by 1000. This ensured equal contribution from all stocks, regardless of their price. Second, we aggregated these normalized values, divided by the sum of base values, and multiplied by 1000 to obtain the final index value. This represents a weighted average of stock performance relative to their base period, aligning with standard financial index construction practices.
Normalizing stock prices offers several advantages. It eliminates distortions caused by different price scales, allowing for a more accurate representation of overall market performance. By focusing on relative price changes, the index becomes more comparable and less sensitive to stock splits or dividends. This ultimately creates a more robust and informative index that better reflects market dynamics.
The CINX incorporates five publicly traded crowdfunding stocks: CrowdStrike Holding Inc (CRWD), Yiren Digital Ltd (YRD), Metalpha Technology Holding Ltd (MATH), WaterDrop Inc (WDH), and NetCapital (NTCP). While CRWD, YRD, and MATH focus on reward-based crowdfunding, WDH specializes in medical crowdfunding platforms focusing on healthcare and medical equipment, and NTCP is a leading player in crowdfunding, facilitating equity crowdfunding transactions.
To capture broader economic and market factors, the analysis includes additional variables:
- Commodities: GOLD (based on Handy-Harman gold price index) and OILW (based on WTI Cushing Crude Oil price) track daily gold and oil prices. Gold, a traditional safe haven asset, influences investment behavior across conventional and alternative financial markets [21]. Its role as a hedge against economic instability can impact crowdfunding ventures [22]. Similarly, oil prices, a key driver of global economic conditions [23], affect market sentiment and investor risk appetite. Both commodities can influence crowdfunding investment decisions.
- Cryptocurrency: BITC monitors the daily USD to Bitcoin exchange rate. Bitcoin, as a volatile cryptocurrency and potential alternative asset class, can impact investor behavior towards crowdfunding platforms, especially those focused on innovation [24]. Its inclusion provides insights into its relationship with traditional finance and crowdfunding [25].
- Economic Indicators: UEUS measures daily US Economic Policy uncertainty, USDX tracks the US Dollar Trade Weighted Index, and EQSP represents the S&P 500 composite index. The USDX measures the dollar’s value against a basket of major currencies. Its fluctuations affect foreign investment flows and the success of crowdfunding campaigns with global reach [26]. The USDX is crucial for assessing global financial stability [27]. Meanwhile, the UEUS captures market and economic sentiment, influencing investment decisions and market volatility [28]. High uncertainty may lead investors to seek more conservative investment options, impacting crowdfunding activity [29].
- Interest Rates: IN2Y tracks the daily market yield of the 2-year US Treasury security. Interest rates, set by central banks, significantly influence borrowing costs, investment returns, and overall economic activity [30]. These factors impact the attractiveness of crowdfunding versus traditional financing options for both businesses and investors [2].
2.2. Vector Auto Regression - VAR
To assess the inter-connectedness of all of these variables, we used the Inter-Connectedness Index of Diebold and Yilmaz that is based on Vector Auto-regression (VAR) analysis. VAR is a powerful tool in time series econometrics, particularly useful for analyzing dynamic relationships between multiple variables. It excels when studying the interrelated behavior of several time series variables. It captures the influence of past values of each variable on its own current value and the current values of other variables [31]. VAR is also ideal for investigating impulse responses, which trace the effects of a shock on one variable to all other variables within the model over time. This helps understand how different parts of the system respond to disturbances [32]. Unlike some econometric models with strong theoretical assumptions, VAR imposes minimal a priori restrictions. This makes it suitable for exploratory data analysis and uncovering potential relationships between variables without imposing a rigid theoretical framework.
Our decision to use the Interconnectedness Index is, in part, due to its ability to capture the dynamic interactions between variables, allowing for a more nuanced understanding of how they influence each other over time. This is particularly valuable when simpler models like single-equation regressions might miss these complex relationships. Additionally, VAR can accommodate a wide range of variables, including economic indicators, financial returns, or social indicators. This flexibility makes it a versatile tool for analyzing various datasets. It was equally important that VAR can be used to generate short-term forecasts for multiple variables simultaneously, considering the inter-dependencies within the system. This can be helpful for tasks like predicting future economic trends or market movements.
Another decision we had to contend with was whether to analyze volatility spillovers, or to calculate the return then analyze the return spillovers. Volatility spillovers measure the transmission of volatility fluctuations from one market to another. A shock or unexpected event causing high volatility in one market can influence the volatility of another market, even if the average returns (means) remain unaffected [1]. Volatility spillovers can amplify risk within a system. Increased volatility in one market can lead to heightened risk aversion in investors, potentially causing them to pull back from other markets as well [33]. Techniques like VAR analysis with GARCH (Generalized Autoregressive Conditional Heteroskedasticity) models are commonly used to estimate volatility spillovers. These models capture how past volatility in one market affects the current volatility of another.
Return spillovers, on the other hand, measure the transmission of average return movements from one market to another. When a positive or negative shock affects returns in one market, it can lead to similar movements in the returns of another market [34]. Return spillovers can influence portfolio diversification benefits. If markets with high return spillovers experience similar movements, diversification strategies aimed at mitigating risk might be less effective. Techniques like VAR, Granger causality tests, or correlation analysis are often used to assess return spillovers. These methods investigate whether past returns in one market can statistically predict future returns in another. Understanding the distinction between volatility and return spillovers is crucial for analyzing financial market inter-connectedness. Volatility spillovers highlight how unexpected events can transmit risk across markets, while return spillovers focus on the co-movement of average returns. Although both concepts play a vital role in financial risk management, we opted to calculate the return and analyze the return spillovers.
2.3. Estimation of the Model
We employed a VAR model to analyze the interconnectedness of our eight variables EQSP, CINX, GOLD, OILW, BITC, USDX, UEUS, and IN2Y. The analysis is structured into six main components: static spillover analysis, total dynamic spillover analysis, directional spillover analysis (FROM), directional spillover analysis (TO), and net directional spillover analysis (aggregate and pairwise). Each component provides insights into the transmission of shocks and interdependencies among the variables (see Equation (1)).
- Static Spillovers Analysis: The static spillovers analysis examines the contemporaneous relationships among the variables in the VAR model. It focuses on estimating the impact of shocks in one variable on others at the same time period. This analysis is conducted by estimating the contemporaneous elements of the VAR model’s coefficient matrix (see Equation (2)).
- Total Dynamic Spillovers Analysis: The total dynamic spillovers analysis investigates the cumulative impact of shocks in one variable on others over time. It involves analyzing the impulse response functions (IRFs) of the VAR model. IRFs illustrate how each variable responds to a one-unit shock in another variable over multiple time periods. To estimate the total dynamic spillovers, we compute the IRFs for each variable in response to shocks in all other variables. This allows us to assess the persistence and magnitude of spillover effects over time (see Equation (3)).
- Directional Spillovers Analysis (FROM): The directional spillovers analysis (FROM) assesses the directionality of spillover effects transmitted by each variable to others. It involves decomposing the variance of each variable into components attributable to shocks from other variables. By identifying the variables that contribute most to the variance of each variable, we can determine which variables exert the most influence on others in the system (See Equation (4)).
- Directional Spillovers Analysis (TO): Conversely, the directional spillovers analysis (TO) examines the directionality of spillover effects originating from each variable to others. This analysis is conducted by decomposing the variance of each variable into components attributable to its own shocks and those originating from other variables. We calculate the contribution of each variable to the total variance of all variables in the system, thereby identifying which variables act as major sources of spillovers (see Equation (5)).
- Net Directional Spillovers Analysis: The net directional spillovers analysis combines the insights from the directional spillovers analysis (FROM) and (TO) to determine the net direction of spillover effects between pairs of variables. Essentially, it is a difference between Equations (5) and (4). This analysis enables us to identify the predominant direction of influence between variables in the system. We calculate net directional spillovers by comparing the contributions of each variable to the total variance of others, considering both the outgoing and incoming spillover effects (see Equation (6)).
- Net Directional Spillovers Analysis (Pairwise): The net spillovers analysis pairwise examines the net impact of each variable on every other variable in the system, accounting for both the direct and indirect effects. This analysis provides a comprehensive understanding of the interdependence between pairs of variables. By quantifying the net spillover effects between each pair of variables, we can identify the key relationships driving the dynamics of the system and assess their significance (see Equation (7)).
The chosen analysis framework offers a comprehensive approach to understanding spillover dynamics. Impulse response analysis provides a visual representation of the initial shock’s impact and its decay over time, allowing for easy interpretation of static spillovers [35]. Variance decomposition offers a complementary quantitative measure of total spillovers, aiding in the assessment of their relative importance [36]. The Fractional Output Impulse Response (FOIR) analysis goes beyond total spillovers by disentangling the causal directions of these effects. This allows us to identify which variables are the primary sources of volatility transmission and which ones are more susceptible to external shocks [37].
The spillover index and pairwise spillover contributions further condense this information into concise measures of net directional and overall spillover effects, respectively [35,38]. By employing these combined methods, we gain a thorough understanding of the interconnectedness within the eight-variable system, encompassing both the static and dynamic dimensions of spillovers.
3. Discussion of Empirical Results
3.1. Preliminary Analysis
Table 2 presents the descriptive statistics of our variables, which are (all but IN2Y) calculated as the logarithmic differences of prices, representing returns. This preliminary analysis provides crucial insights into the statistical properties of our dataset.
The mean values across all variables (except for IN2Y = 3.02) are relatively small, ranging from -0.06 for UEUS to 0.03 for OILW. This suggests that, on average, most assets experienced minimal variability over the observed period. However, it is noteworthy that UEUS exhibited slightly negative average values, while OILW showed the highest positive average return.
The minimum and maximum values reveal substantial variability in returns across all assets. UEUS demonstrates the most extreme fluctuations, with a minimum value of -263.51% and a maximum of 227.90%. Conversely, USDX shows the least volatility, with values ranging from -2.10% to 1.52%.
Standard deviation (StD) values further corroborate these observations. UEUS exhibits the highest standard deviation (59.68), indicating significant volatility, while USDX has the lowest (0.45), suggesting relative stability.
Skewness measures indicate that most variables are negatively skewed, with values ranging from -0.61 (CINX) to 0.07 (UEUS). This implies that these assets generally experienced more extreme negative values than positive ones during the observed period.
Kurtosis values vary considerably across the variables. BITC and CINX show the highest kurtosis (4.33 and 4.35 respectively), indicating a higher probability of extreme values compared to a normal distribution. Conversely, IN2Y exhibits negative kurtosis (-1.33), suggesting a flatter distribution than normal.
The observation count (Obs) of 732 for all variables ensures a robust dataset for our analysis, covering a substantial time period and allowing for meaningful statistical inferences.
Hence, the varying statistical properties across different variables suggest potential diversification benefits but also hint at the complex interdependencies between them.
3.2. Static Spillovers
Table 3 provides valuable insights into the static spillover effects among the variables under study. This analysis allows us to understand the interconnectedness and directional influences within the system. The results suggest that all the variables (except for EQSP and USDX) are net receivers of shocks (negative values).
The interpretation of these results is as follows:
- Spillover Index: The total spillover index, which measures the overall contribution of spillovers of shocks across all variables, is 22.19%. This indicates a moderate level of interdependence among the variables in the system.
- Net Spillovers: The ’NET’ row reveals the net spillover effect for each variable. Positive values indicate net transmitters of shocks, while negative values denote net receivers. USDX (1.15) and EQSP (0.73) are the only net transmitters of shocks in the system. This suggests that these variables have a more significant influence on other variables than they receive in return. The US Dollar Index (USDX) being the largest net transmitter implies its central role in influencing other financial variables, which aligns with the dollar’s global importance. All other variables (GOLD, OILW, BITC, UEUS, CINX, IN2Y) are net receivers of shocks, with CINX (-0.56) and BITC (-0.43) being the largest net receivers. This implies that these variables are more susceptible to influences from other variables in the system than they are influential.
- Directional Spillovers: USDX (5.83) and EQSP (5.00) have the highest spillover effects on other variables, reinforcing their roles as key influencers in the system. Meanwhile, USDX (4.68) and EQSP (4.27) also receive significant spillovers from other variables, indicating a two-way interaction. UEUS (0.09) receives the least spillover from other variables, suggesting it is relatively isolated from the effects of other variables in the system.
- Own-Variable Effects: The diagonal elements represent the portion of forecast error variance explained by own shocks. UEUS (12.41) and OILW (11.50) have the highest own-variable effect, indicating they are largely driven by their own dynamics.
-
Pairwise Spillovers: Some notable pairwise spillovers include: GOLD to USDX (1.30) and vice versa (1.61), IN2Y to GOLD (1.28) and vice versa (1.11), EQSP to BITC (1.57) and vice versa (1.37), USDX to EQSP (1.46) and vice versa (1.48), IN2Y to USDX (1.12) and vice versa (1.69), CINX to EQSP (1.28) and vice versa (1.59).These results indicate a strong bidirectional relationship.EQSP’s impact on BITC (1.57) and CINX (1.59) suggests that equity markets have a notable influence on both cryptocurrency and the crowdfunding index.
These results imply a complex network of interactions among the variables under study, with the US Dollar and equity markets playing central roles in transmitting shocks. The cryptocurrency and crowdfunding markets appear more as receivers of shocks, suggesting they are more influenced by broader market dynamics than they are influential. This analysis provides crucial insights for understanding market dynamics, risk management, and portfolio diversification strategies in the context of traditional and emerging financial markets.
3.3. Total Dynamic Spillovers
Figure 1 illustrates the Total Dynamic Spillovers. The data exhibits a notable rise and fall pattern over this period, with significant short-term fluctuations throughout. The spillover effect reaches its peak around February 2023, with values exceeding 40. This is in stark contrast to the lowest point observed around March 2022, where values dip to approximately 20. After the early 2023 peak, there is a general downward trend, albeit with continued fluctuations. By end-2023, the spillover effect appears to have stabilized around 25.
This measure typically indicates the degree of interconnectedness or contagion in a system, often applied in financial or economic contexts. Higher values suggest greater spillover effects between different components of the system under study. The significant rise and fall over 2022-2023 could indicate a period of increased systemic risk or market turbulence, followed by a return to more normal conditions.
The significant changes in spillover effects from late 2022 to early 2023 coincide with the first year of the Russian-Ukrainian war, which began in February 2022. This conflict has had far-reaching consequences for the global economy, particularly in areas directly impacted by these countries’ economic roles. The sharp rise in spillover effects peaking around January 2023 likely reflects the intensifying economic repercussions of the war. As major exporters of wheat, corn, and sunflower oil, the disruption to Ukraine and Russia’s agricultural exports led to tightened global supplies. This supply shock propagated through various economic channels, affecting food prices, inflation, and broader economic indicators worldwide [39].
The surge in world food prices, as evidenced by the FAO Food Price Index reaching record highs in March 2022, aligns with the increasing spillover effects shown in the graph. The subsequent gradual decline in spillover effects through 2023 and into early 2024 may correspond to the partial stabilization and adaptation of global markets to the new geopolitical reality, as indicated by the receding food prices by January 2024 [40].
Ukraine, known as the "breadbasket of Europe," has historically been a major exporter of grains such as wheat, corn, and barley. The conflict has disrupted agricultural production in Ukraine, leading to decreased grain output and exports. According to the United States Department of Agriculture (USDA), Ukraine’s grain production has declined by approximately 30% since the outbreak of the conflict [41]. This reduction in supply has contributed to higher world food prices, as Ukraine’s exports play a crucial role in global grain markets. The Food and Agriculture Organization (FAO) reports a 15% increase in global food prices due to supply disruptions caused by the war [42]. The rise in food prices has had ripple effects on global inflation and has contributed to global inflationary pressures, with many countries experiencing a significant increase in the cost of living [43].
In the United States, the impact of war has been mixed. While the overall US economy has remained relatively strong, some economic indicators have shown signs of strain. Consumer prices have risen, driven in part by higher food and energy costs [44]. The Federal Reserve has responded by raising interest rates to combat inflation, potentially slowing economic growth in the future [45]. The war’s long-term economic effects on the US remain uncertain, but it has undoubtedly contributed to global food price inflation and heightened economic anxieties, influencing key economic indicators such as the Consumer Price Index (CPI) and the Producer Price Index (PPI).
The Federal Reserve has cited the impact of the Russo-Ukrainian war on food prices as a factor contributing to elevated inflation levels in its monetary policy decisions [46]. Overall, the conflict has underscored the interconnectedness of global food markets and geopolitical events, highlighting the need for effective risk management strategies in the face of such disruptions.
There is also the possibility that what is known as the FinTech Winter is responsible, in part, for the observed spike in volatility throughout this time period. The term "FinTech Winter" refers to a significant slowdown in financial technology (FinTech) investments and market activity, akin to the "Crypto Winter" experienced by the cryptocurrency market. This downturn was particularly evident in 2022 when FinTech startups faced reduced funding, lower valuations, and increased scrutiny from regulators. A confluence of factors, including rising interest rates, heightened market volatility, and a shift in investor sentiment towards profitability over growth, led to this contraction. As venture capital dried up, many FinTech firms were forced to cut costs, lay off employees, and pivot their business models to survive. This period of retrenchment stood in stark contrast to the explosive growth seen in previous years, characterized by aggressive expansion and high valuations based on future growth potential rather than current earnings [47,48].
One potential link between the FinTech winter and the inflation observed during that period lies in the dampening effect it had on financial innovation. FinTech companies are often at the forefront of developing new financial products and services that focus on efficiency and cost reduction. For instance, the rise of online lending platforms aimed to provide borrowers with more competitive interest rates compared to traditional banks [49]. Similarly, mobile payment solutions streamlined transactions, potentially lowering merchant fees [50]. However, the slowdown in FinTech innovation meant that these cost-saving benefits were not realized to the same extent, leading to higher operational costs for businesses that could be passed on to consumers in the form of higher prices [51,52]. Furthermore, the FinTech Winter might have impacted inflation through its effect on overall economic activity. FinTech startups often act as catalysts for economic growth by facilitating access to capital for small businesses and entrepreneurs [53]. With the decline in FinTech funding and investment, the ability of these businesses to secure financing and expand their operations could have been hampered. The investors’ pullback from FinTech and broader tech sectors shifted capital flows, contributing to broader economic uncertainty and volatility, which are known drivers of inflation [54].
3.4. Directional Spillovers
In assessing the connectedness of variables, we examine the direction and magnitude of spillovers. At any given time, a variable can transmit or receive volatility due to changes in its value. These spillovers indicate the variables’ mutual influence and associated risks. [1] posit that, in the context of volatility spillovers, transmission is preferable to reception. This implies that when a variable’s value changes, it is more favorable for that variable to induce volatility in others rather than absorb volatility from external sources. Such dynamics provide insights into the relative strength and influence of variables within interconnected systems. Our analysis focuses on the resilience and stability of markets facing shocks and sudden changes.
We compare directional spillovers between CINX (representing crowdfunding) and EQSP (representing traditional financial markets) to observe their responses to economic indicator changes. This comparison aims to determine if CINX and EQSP react similarly to economic shifts. If they do, we may infer that crowdfunding is an extension of the traditional financial system rather than a genuine alternative. Alternatively, if CINX exhibits greater resilience and stability, it could present as a viable alternative. Conversely, if EQSP displays superior resilience and stability, it may suggest that crowdfunding has yet to mature as a viable alternative and requires further development.
This analysis provides insights into the relative maturity and potential of crowdfunding compared to traditional financial markets in the face of economic volatility. By examining these directional spillovers, we can better understand the evolving landscape of financial markets and the role of alternative financing methods.
This Figure 2 illustrates the directional spillovers FROM other variables onto two distinct indices - the EQSP (S&P 500 equity index) and the CINX (crowdfunding index). Both indices exhibit similar overall patterns, characterized by a significant rise through 2022, followed by a sharp decline around early 2023.
We first consider the direction (FROM) in our directional return volatility spillover analysis, in which we examine the volume of volatility received by a variable from others when the value of said variable changes.
The EQSP shows more pronounced spillover effects and greater volatility compared to the CINX. Starting in end-2021, the S&P 500 spillover effect rises dramatically through 2022, reaching a peak in late 2022. It then experiences a sharp drop in early 2023, before continuing a gradual decline by early 2024. The CINX demonstrates a similar trend but with lower overall values and less volatility. Beginning low in the end-2021, it peaks by mid-2022. Following a sharp decline in late 2022, the crowdfunding index stabilizes for most of 2023 and early 2024, with a brief spike in mid-2023.
These patterns suggest that both equity markets and crowdfunding markets received increased interconnectedness or spillover effects in 2022, possibly due to broader economic factors such as inflation, interest rate changes, or global events. The simultaneous sharp decline in early 2023 might indicate a significant market event or policy change that affected both sectors. Notably, the crowdfunding market appears to stabilize more quickly after the 2023 decline, suggesting potentially different dynamics or resilience compared to the traditional stock market.
Comparing the "TO" spillovers (Figure 3) with the "From" spillovers (Figure 2) provides valuable insights into the dynamics of EQSP (S&P 500 equity index) and CINX (crowdfunding index). The "TO" spillovers generally show lower magnitudes compared to the "FROM" spillovers for both indices. This suggests that both EQSP and CINX have a weaker influence on other markets than they are influenced by them. The S&P 500 (EQSP) consistently demonstrates higher spillover effects in both directions, indicating its more significant role in market interconnectedness.
Both figures exhibit similar overall trends, with increases through 2022, peaks around late 2022 or early 2023, and subsequent declines. However, the "TO" spillovers display smoother trends, particularly during the rising phase, while the "FROM" spillovers appear more volatile, especially for EQSP.
The crowdfunding index (CINX) shows more pronounced fluctuations after the peak in both figures, suggesting it may be more sensitive to market changes or external factors. This could indicate that, while the crowdfunding market is becoming more integrated with other financial markets, it still exhibits unique characteristics and potentially different recovery dynamics compared to traditional equity markets.
Interestingly, the gap between EQSP and CINX appears smaller in the "TO" spillovers compared to the "FROM" spillovers. This might suggest that, while the S&P 500 has a stronger influence on other markets, its susceptibility to influences from other markets is more comparable to that of the crowdfunding index.
The net directional spillovers, as presented in Figure 4, quantify the difference between transmitted and received spillovers. A positive (negative) net spillover suggests that a variable contributes more (less) to system-wide volatility or information flow than it absorbs.
The results indicate that traditional markets, represented by the S&P 500 (EQSP) and the U.S. Dollar Index (USDX), exhibit more consistent spillover effects compared to emerging markets such as cryptocurrencies (BTC) and crowdfunding (CINX). This pattern aligns with the findings of [1], who documented the persistent nature of spillovers in established financial markets.
Notably, the S&P 500 transitions from a strong transmitter (up to early 2023) to a receiver (in the second quarter of 2023, and after mid-2024). This shift may reflect changing market sentiments or economic outlooks, consistent with the time-varying nature of spillovers observed by [55]. Concurrently, the 2-Year Interest Rate (IN2Y) maintains a mild but persistent receiver role until early 2023, turning into a transmitter in the second quarter of 2023. It then became a receiver for a short while until around December 2023 and has turned into a transmitter since then.
The commodity markets, represented by gold (GOLD) and oil (OILW), demonstrate distinct behaviors. Gold alternates between transmitter (up to end-2021, and between late 2022 and late 2023) and receiver (other periods). Oil, while generally being a receiver, shows some transmission in late 2021 and after the third quarter of 2023, likely reflecting geopolitical tensions and supply concerns.
Emerging financial technologies, exemplified by Bitcoin (BTC) and the Crowdfunding Index (CINX), exhibit high volatility in their spillover effects. These assets frequently alternate between transmitter and receiver roles, with a tendency towards being receivers. This pattern suggests that while increasingly integrated, these markets remain more susceptible to external influences than traditional assets.
The US economic policy uncertainty index (UEUS) exhibits significant variability in its net spillover effects during the study period, reflecting its dynamic role in market interactions. It is mostly a net receiver of spillovers. However, it shifts to a mild net transmitter during the second half of 2023, suggesting an increased influence of policy uncertainty on other market variables. The observed pattern highlights the importance of considering policy uncertainty as both a potential driver of market dynamics and a reflection of broader economic conditions.
Lastly, we carried out a pairwise net directional spillover analysis in order to compare the responses of EQSP and CINX when they are paired with the same variable. Figure 5 shows us six sets of charts; each set has two charts: one analyzes the net spillovers when EQSP is paired with a variable representing an economic factor, while the other analyzes the spillovers when CINX is paired with the same variable. The idea is to be able to observe the return spillover transmission between a variable and each of EQSP and CINX over the same period of time. This way, we can see how similar or different EQSP and CINX are in the way they respond to economic factors. Each chart has a pair of variables, variable 1 and variable 2, both pinned on the Y axis while time is pinned on the X axis. Any positive values on the chart represent spillover transmissions from variable 1 to variable 2, while negative values represent spillover transmissions from variable 2 to variable 1.
Looking at the first set of charts, where the variable Gold is paired with each of EQSP and CINX, we clearly see a similar pattern of spillover transmissions. In both charts, prior to 2022, GOLD was transmitting spillovers to EQSP as well as CINX. Throughout 2022, both EQSP and CINX were transmitting spillovers to GOLD. However, over the course of 2023, Gold once again was transmitting spillovers to both, EQSP and CINX. When paired with GOLD, the results show that both EQSP and CINX have had similar responses. This tells us that when the price of gold fluctuates, traditional investments and crowdfunding investments are both impacted in the same way, and they respond as such.
In the second set of charts, where the variable OILW is paired with each EQSP and CINX, we see quite different interactions. In the first chart, up until the second half of 2023, EQSP was transmitting spillovers, while in the second half of 2023, OILW started transmitting spillovers to EQSP. The second chart shows a different pattern of spillovers between OILW and CINX, where OILW was transmitting spillovers to CINX in a spike-like manner, beginning in the last quarter of 2021 and lasting till the end of the first quarter of 2022. After that, the spike was reversed, and between the second and third quarters of 2022, CINX was transmitting spillovers to OILW. Afterwards, OILW resumed transmission of minimal values of spillovers to CINX. When paired with OILW, the results show that, while EQSP was an overall net transmitter, CINX was a net receiver of spillovers. This means that when oil prices fluctuate, traditional investments have more resilience and stability than crowdfunding investments, which were impacted by the fluctuations.
In the third set of charts, where the variable BITC is paired with each EQSP and CINX, we continue to observe different patterns of spillovers. The first chart shows that throughout the examined timeline, except for a brief period towards the middle of 2023, EQSP is transmitting steady levels of spillovers to BITC. This is contrary to the second chart, where we see the frequent fluctuation of relatively small values of spillovers being transmitted back and forth between BITC and CINX. When paired with BITC, the results show that while EQSP is an overall net transmitter, CINX was fluctuating albeit being a net receiver of spillovers. As such, when Bitcoin prices fluctuate, traditional investments show greater stability and resilience than crowdfunding investments, which were impacted by the changes and exhibited instability.
In the fourth set of charts, where the variable UEUS is paired with each EQSP and CINX, the divergent pattern of spillover transmissions persists. The first chart shows high frequency yet minimal value fluctuations in spillover transmission between EQSP and UEUS. The second chart, however, shows major and dominant spillovers from UEUS to CINX throughout the examined timeline, with the exception of a brief period towards the middle of 2023. When paired with UEUS, the results show that while EQSP has alternated between being transmitter and receiver in a cyclical fashion, CINX was overall a net receiver of spillovers. Therefore, when the uncertainty index fluctuates, traditional investments respond in a predictable manner, while crowdfunding investments are greatly impacted by such fluctuations.
The fifth set of charts, where the variable USDX is paired with each EQSP and CINX, shows a spillover pattern that is similar in direction yet different in magnitude. The first chart shows that, during the year 2022, EQSP was transmitting spillovers to USDX. Throughout 2023, however, although to a lesser degree, USDX was transmitting spillovers to EQSP. Similarly, during 2022, the second chart shows the CINX was transmitting spillovers to USDX, while in 2023 was receiving spillovers from it. When paired with USDX, the results show that both EQSP and CINX exhibited similar responses to changes in USDX. When the US Dollar Index fluctuates, traditional investment and crowdfunding investments both respond similarly, with the traditional investments’ response being more pronounced due to its larger size.
The sixth set of charts, where the variable IN2Y is paired with each EQSP and CINX, shows us once again how different their responses are. The first chart shows how, in 2022, EQSP was transmitting spillovers to IN2Y. To a much lesser degree, during 2023, EQSP received spillovers from IN2Y. On the contrary, the second chart shows that CINX was a receiver of spillovers from IN2Y over the span of the examined timeline, with the exception of a brief period in the middle of 2023. When paired with IN2Y, the results show that while EQSP was an overall net transmitter, CINX was an overall net receiver of spillovers. In other words, traditional investments seem to be more resilient to the fluctuations of interest rates than crowdfunding investments.
4. Conclusions
We set out to explore whether crowdfunding can be an alternative to conventional finance or merely an extension of it. An alternative must exhibit stability and greater resilience to external economic factors. Otherwise, it will remain an extension of the current system. To achieve our goal, we constructed a unique crowdfunding index (CINX), which sets our research apart from the very few that studied this area. We were able to show, through the interconnectedness index, that crowdfunding is not yet in a position to be an alternative to conventional finance.
First, our examination of directional spillovers (FROM) revealed parallel transmission patterns between EQSP and CINX, suggesting these instruments function as complementary rather than alternative investment vehicles. In contrast to Capital Asset Pricing Model (CAPM) predictions, the analysis of directional spillovers (TO) demonstrated that traditional investments exhibited heightened vulnerability to global events and economic shocks — an unexpected finding. However, subsequent analysis of net directional spillovers provided a counterintuitive result: traditional investments displayed greater stability compared to crowdfunding investments over the study period.
Finally, to examine how each asset responded to economic factors that commonly affect the economy, we carried out a net directional spillovers analysis - pairwise. As a result, we found that when the price of gold fluctuates, traditional investments and crowdfunding investments are impacted similarly. When the price of oil fluctuates, traditional investments are more resilient than crowdfunding investments. When bitcoin prices fluctuate, traditional investments show greater stability than crowdfunding investments. When the US Dollar Index or the Uncertainty Index fluctuates, traditional investments and crowdfunding investments are impacted similarly. When the interest rate fluctuates, traditional investments are more resilient than crowdfunding investments. After considering all of our findings, we conclude that crowdfunding, although it gained a massive foothold, is not poised to replace conventional finance; rather, the likely scenario is to coexist side by side with conventional finance for the foreseeable future. Overall, this research emphasizes the importance of a nuanced approach that recognizes the ongoing coexistence of conventional and emerging finance, ensuring both can thrive and contribute to the financial landscape.
This research holds substantial implications for various stakeholders. Industry players can utilize these insights to enhance their positioning within the broader financial landscape, aligning their strategies with the reality that conventional finance will continue to exert dominance. Academics can further develop these findings to explore the mutually beneficial roles of emerging and traditional finance. Policymakers, in turn, can leverage these results to formulate regulations that foster innovation while preserving the established financial system.
References
- Diebold, F.X.; Yilmaz, K. Better to give than to receive: Predictive directional measurement of volatility spillovers. International Journal of Forecasting 2012, 28, 57–66. [Google Scholar] [CrossRef]
- Mollick, E. The dynamics of crowdfunding. Administrative Science Quarterly 2014, 59, 1–60. [Google Scholar]
- Campello, M.C.; Graham, J.R.; Kramer, M.C. The digital revolution in finance. Review of Financial Studies 2020, 33, 280–344. [Google Scholar]
- Brozović, D.; Amić, D.; Jurinčić, Č. Crowdfunding as an alternative financing source for small and medium-sized enterprises. Economic Research and Policy 2017, 24, 545–558. [Google Scholar]
- Bernanke, B.S. The financial crisis and the effective conduct of monetary policy. Federal Reserve Bank of St. Louis Review 2009, 91, 279–304. [Google Scholar]
- Chen, S.; Collier, W.; Fattouh, B. How oil price shocks affect output growth in the MENA region. Economic Research Forum Working Paper Series 2012. [Google Scholar]
- Huang, D.; Xu, X. Fintech and financial inclusion in developing economies. China Economic Journal 2018, 11, 1–20. [Google Scholar] [CrossRef]
- Cong, Y.; Liu, X. Fintech, shadow banking, and financial stability in China. Journal of Financial Stability 2019, 43, 100621. [Google Scholar]
- Agrawal, A.; Catalini, C.; Goldfarb, A. The economics of crowdfunding. National Bureau of Economic Research 2014. [Google Scholar]
- Belleflamme, P.; Platteau, J.P.; Pregnon, P. Crowdfunding failures. Journal of Economic Behavior & Organization 2014, 108, 54–73. [Google Scholar]
- Cumming, D.; Wright, M.; Phan, P.H. Is information asymmetry a barrier to crowdfunding? In Proceedings of the ICIS 2009 Proceedings; 2009; pp. 1–17. [Google Scholar]
- Ahmed, A.; Ucbasaran, D.; Cacciotti, G.; Williams, T. Integrating psychological resilience, stress, and coping in entrepreneurship: A critical review and research agenda. Entrepreneurship Theory and Practice 2022, 46, 497–538. [Google Scholar] [CrossRef]
- Torkanovskiy, E.; Voinov, A. COVID-19 for crowdfunding: Catalyst or deterrent? Evidence from Russia. Indonesian Capital Market Review 2022, 14, 103–120. [Google Scholar] [CrossRef]
- Cordova, A.; Dolci, J.; Gianfrate, G. The determinants of crowdfunding success: Evidence from technology projects. In Proceedings of the Procedia - Social and Behavioral Sciences, Vol. 181; 2015; pp. 115–124. [Google Scholar]
- Maehle, N. Sustainable crowdfunding: insights from the project perspective. Baltic Journal of Management 2020, 15, 281–302. [Google Scholar] [CrossRef]
- Bento, N.; Gianfrate, G.; Thoni, M. Crowdfunding for sustainability ventures. Journal of Cleaner Production 2019, 237, 117751. [Google Scholar] [CrossRef]
- Calic, G.; Mosakowski, E. Kicking off social entrepreneurship: How a sustainability orientation influences crowdfunding success. Journal of Management Studies 2016, 53, 738–767. [Google Scholar] [CrossRef]
- Courtney, C.; Dutta, S.; Li, Y. Resolving information asymmetry: Signaling, endorsement, and crowdfunding success. Entrepreneurship Theory and Practice 2016, 41, 265–290. [Google Scholar] [CrossRef]
- Kocollari, U.; Pedrazzoli, A.; Cavicchioli, M.; Girardi, A. Too tied to fail: A multidimensional approach to social capital in crowdfunding campaigns. Evidences from Italian agri-food businesses. Journal of Small Business and Enterprise Development 2021, 29, 719–741. [Google Scholar] [CrossRef]
- Liang, X.; Hu, X.; Jiang, J. Research on the effects of information description on crowdfunding success within a sustainable economy–the perspective of information communication. Sustainability 2020, 12, 650. [Google Scholar] [CrossRef]
- Baur, D.G.; Lucey, B.M. Is Gold a Hedge or a Safe Haven? An Analysis of Stocks, Bonds and Gold. Financial Review 2010, 45, 217–229. [Google Scholar] [CrossRef]
- Baur, D.G.; Beckmann, J. Are gold and oil safe havens? A rolling window approach. Journal of Banking & Finance 2017, 83, 185–196. [Google Scholar]
- Hamilton, J.D. Understanding Crude Oil Prices. The Energy Journal 2009, 30, 179–206. [Google Scholar] [CrossRef]
- Corbet, S.; Lucey, B.; Urquhart, A. Cryptocurrencies as a new asset class? The Economic and Social Review 2018, 49, 519–543. [Google Scholar]
- Baur, D.G.; Hong, K.; Lee, A.D. Bitcoin: Medium of Exchange or Speculative Assets? Journal of International Financial Markets, Institutions and Money 2018, 54, 177–189. [Google Scholar] [CrossRef]
- Ahlers, R.; Dou, J.; Fratzscher, M.; Gaus, M. Exchange rate fluctuations and foreign direct investment. Journal of International Money and Finance 2014, 46, 1–22. [Google Scholar]
- Branson, W.H.; Henderson, D.W. The Specification and Influence of Asset Markets. In Handbook of International Economics; Jones, R.W.; Kenen, P.B., Eds.; Elsevier, 1985; pp. 749–805.
- Baker, S.R.; Bloom, N.; Davis, S.J. Measuring Economic Policy Uncertainty. The Quarterly Journal of Economics 2016, 131, 1593–1636. [Google Scholar] [CrossRef]
- Ahmad, N.; Guo, X.; Khan, S.U. Economic policy uncertainty, financial constraints and firm innovation. Research Policy 2018, 47, 1322–1336. [Google Scholar]
- Bernanke, B.S.; Blinder, A.S. The Federal Funds Rate and the Channels of Monetary Transmission. The American Economic Review 1992, 82, 901–921. [Google Scholar]
- Enders, W. Applied econometrics using R; Vol. 151, Harvard University Press, 2010.
- Lütkepohl, H. Handbook of econometrics; Vol. 6, Elsevier, 2005.
- Baur, D.G.; Beck, R.G. Estimating volatility spillovers in international equity markets: re-examining the empirical evidence. Journal of International Money and Finance 2006, 25, 1617–1637. [Google Scholar]
- King, M.; Wadhwani, S. Return and volatility spillovers between India and leading Asian and global equity markets: An empirical analysis. Journal of International Financial Management & Accounting 2013, 24, 182–202. [Google Scholar]
- Pesaran, M.H.; Shin, Y. Estimating Long Run Economic Relationships; Oxford University Press, 2006.
- Diebold, F.X.; Yoo, J.S. Impulse response analysis in spectral regression. Journal of Econometrics 1996, 72, 131–168. [Google Scholar]
- Bai, J.; Li, K. On generalized FEVDs. Econometrica 2014, 82, 1655–1694. [Google Scholar]
- Koop, G.; Pesaran, M.H.; Potter, S.M. Impulse response analysis in nonlinear multivariate models. Journal of Econometrics 1996, 72, 131–168. [Google Scholar] [CrossRef]
- BBC. Ukraine war: Why is there a global food crisis?, 2023.
- World Bank. Commodity Markets Price Update. Report, World Bank, 2023.
- United States Department of Agriculture. Grain Market Report, 2023.
- Food and Agriculture Organization. Food Outlook: Biannual Report on Global Food Markets, 2023.
- IMF. World Economic Outlook: War casts long shadow on global recovery. Report, International Monetary Fund (IMF), 2023.
- Bureau of Labor Statistics. Consumer Price Index Summary, 2023.
- Reuters. U.S. Federal Reserve raises rates for first time since 2018 to fight inflation, 2023.
- Federal Reserve. Monetary Policy Report to the Congress. Report, Federal Reserve, 2023.
- Kharpal, A. Fintech funding drops as economic slowdown bites, 2022.
- Clarke, S. The rise and fall of fintech: A cautionary tale, 2022.
- Gomber, P.; Howell, S.; Liu, Y. The fintech revolution: How disruptive technologies are transforming the consumer finance landscape; Oxford University Press, 2020.
- Chen, Y.; Gong, Y.; Li, S. Does mobile payment promote financial inclusion? Evidence from China. Journal of Economic Behavior & Organization 2020, 178, 152–169. [Google Scholar]
- Burgess, M. How fintech’s troubles could fuel inflation, 2022.
- Bensoussan, E. Inflation Could Lay Waste to Many Fintechs in 2022 Unless They Act Now. Forbes 2022. Accessed: 5 June 2024.
- Beck, T.; Demirguc-Kunt, A.; Klapper, L. Financial inclusion and development; Oxford University Press, 2020.
- Smith, J. Investors pull back from fintech as economic conditions worsen, 2022.
- Baruník, J.; Křehlík, T. Measuring the frequency dynamics of financial connectedness and systemic risk. Journal of Financial Econometrics 2018, 16, 271–296. [Google Scholar] [CrossRef]
Figure 1.
Total Dynamic Spillovers
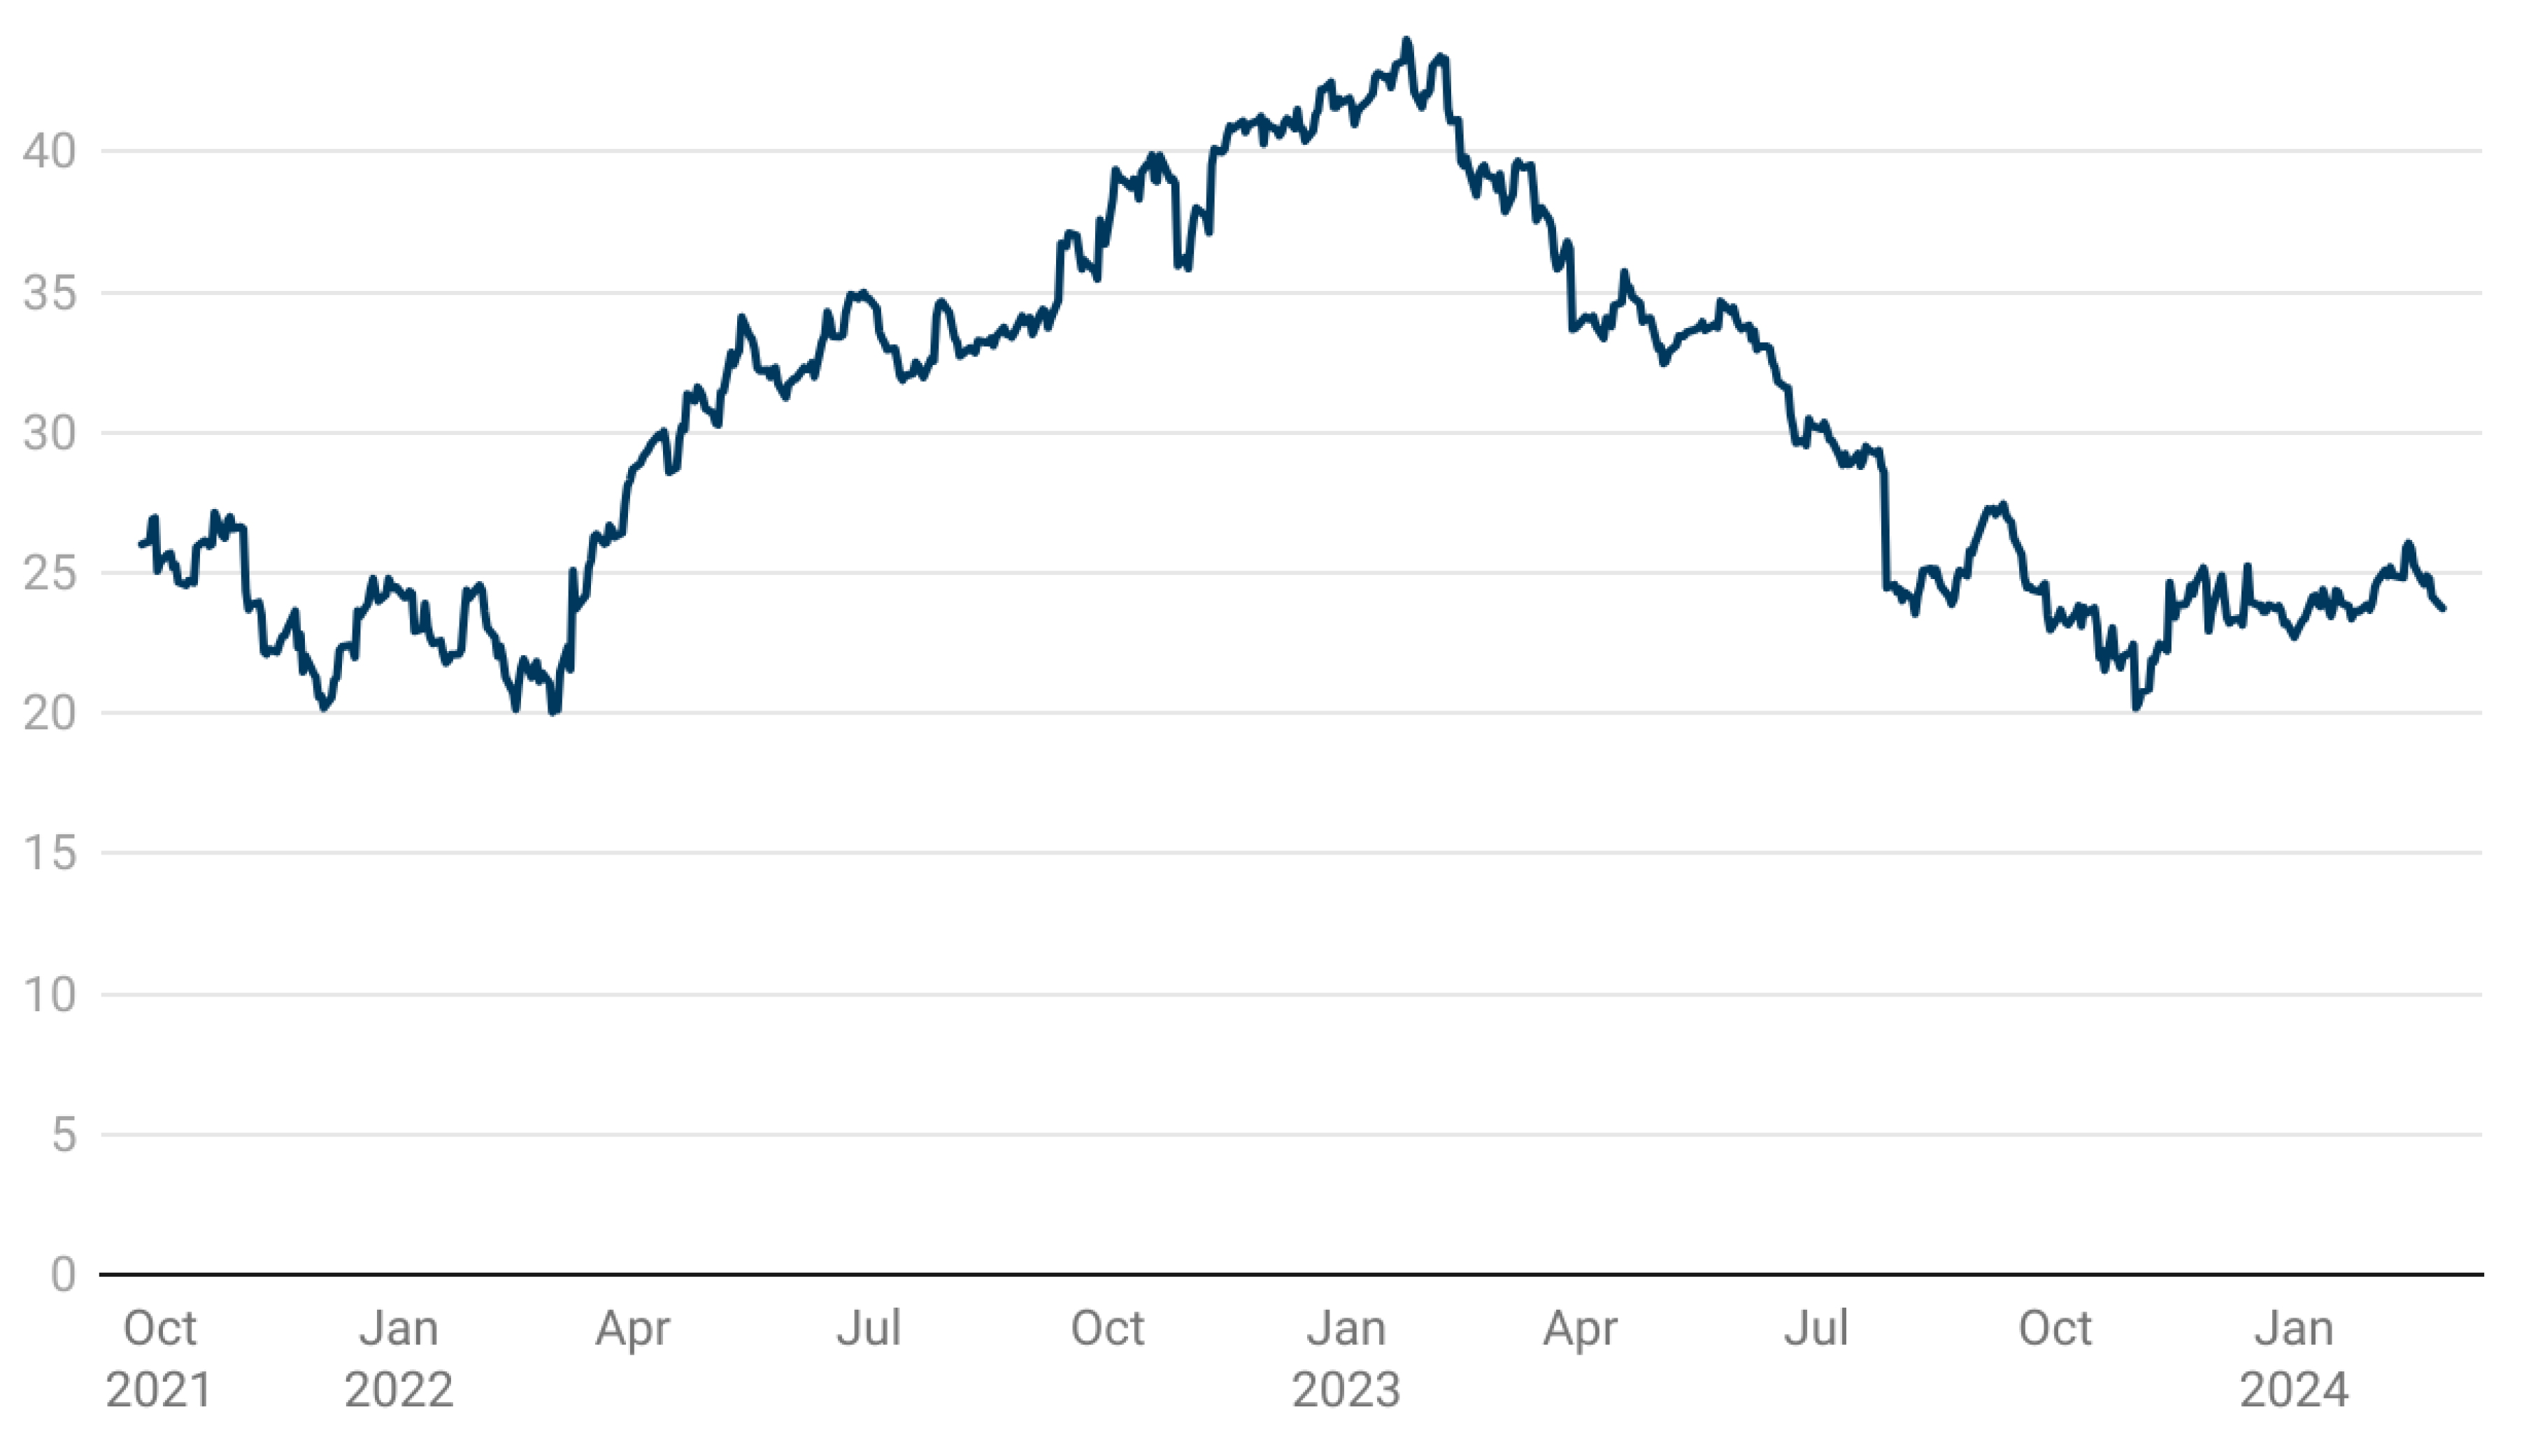
Figure 2.
Directional Spillovers - FROM
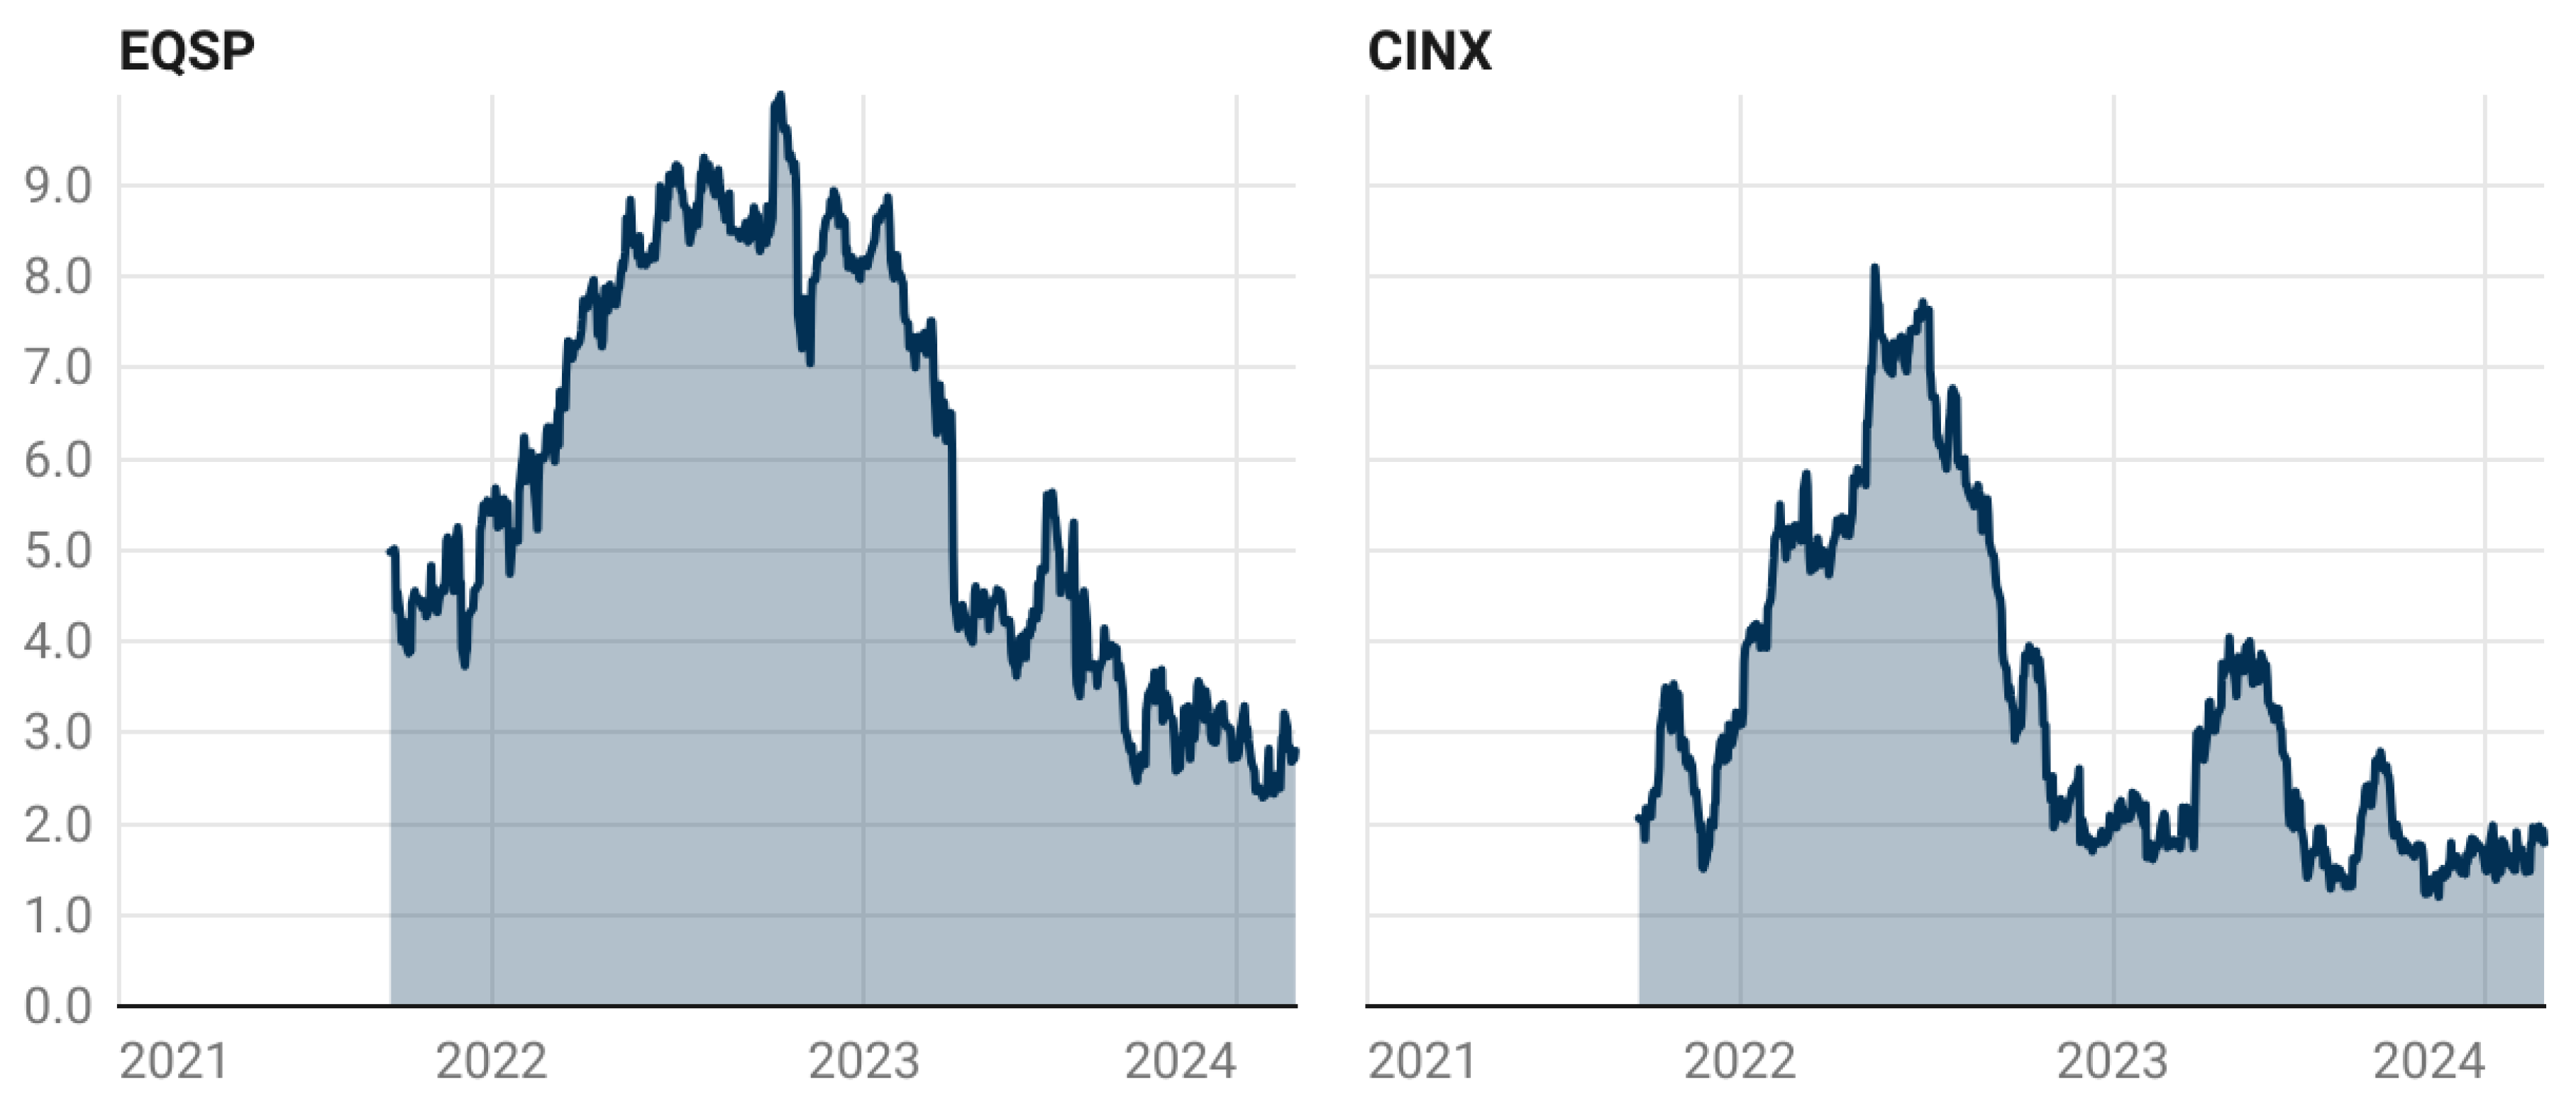
Figure 3.
Directional Spillovers - TO
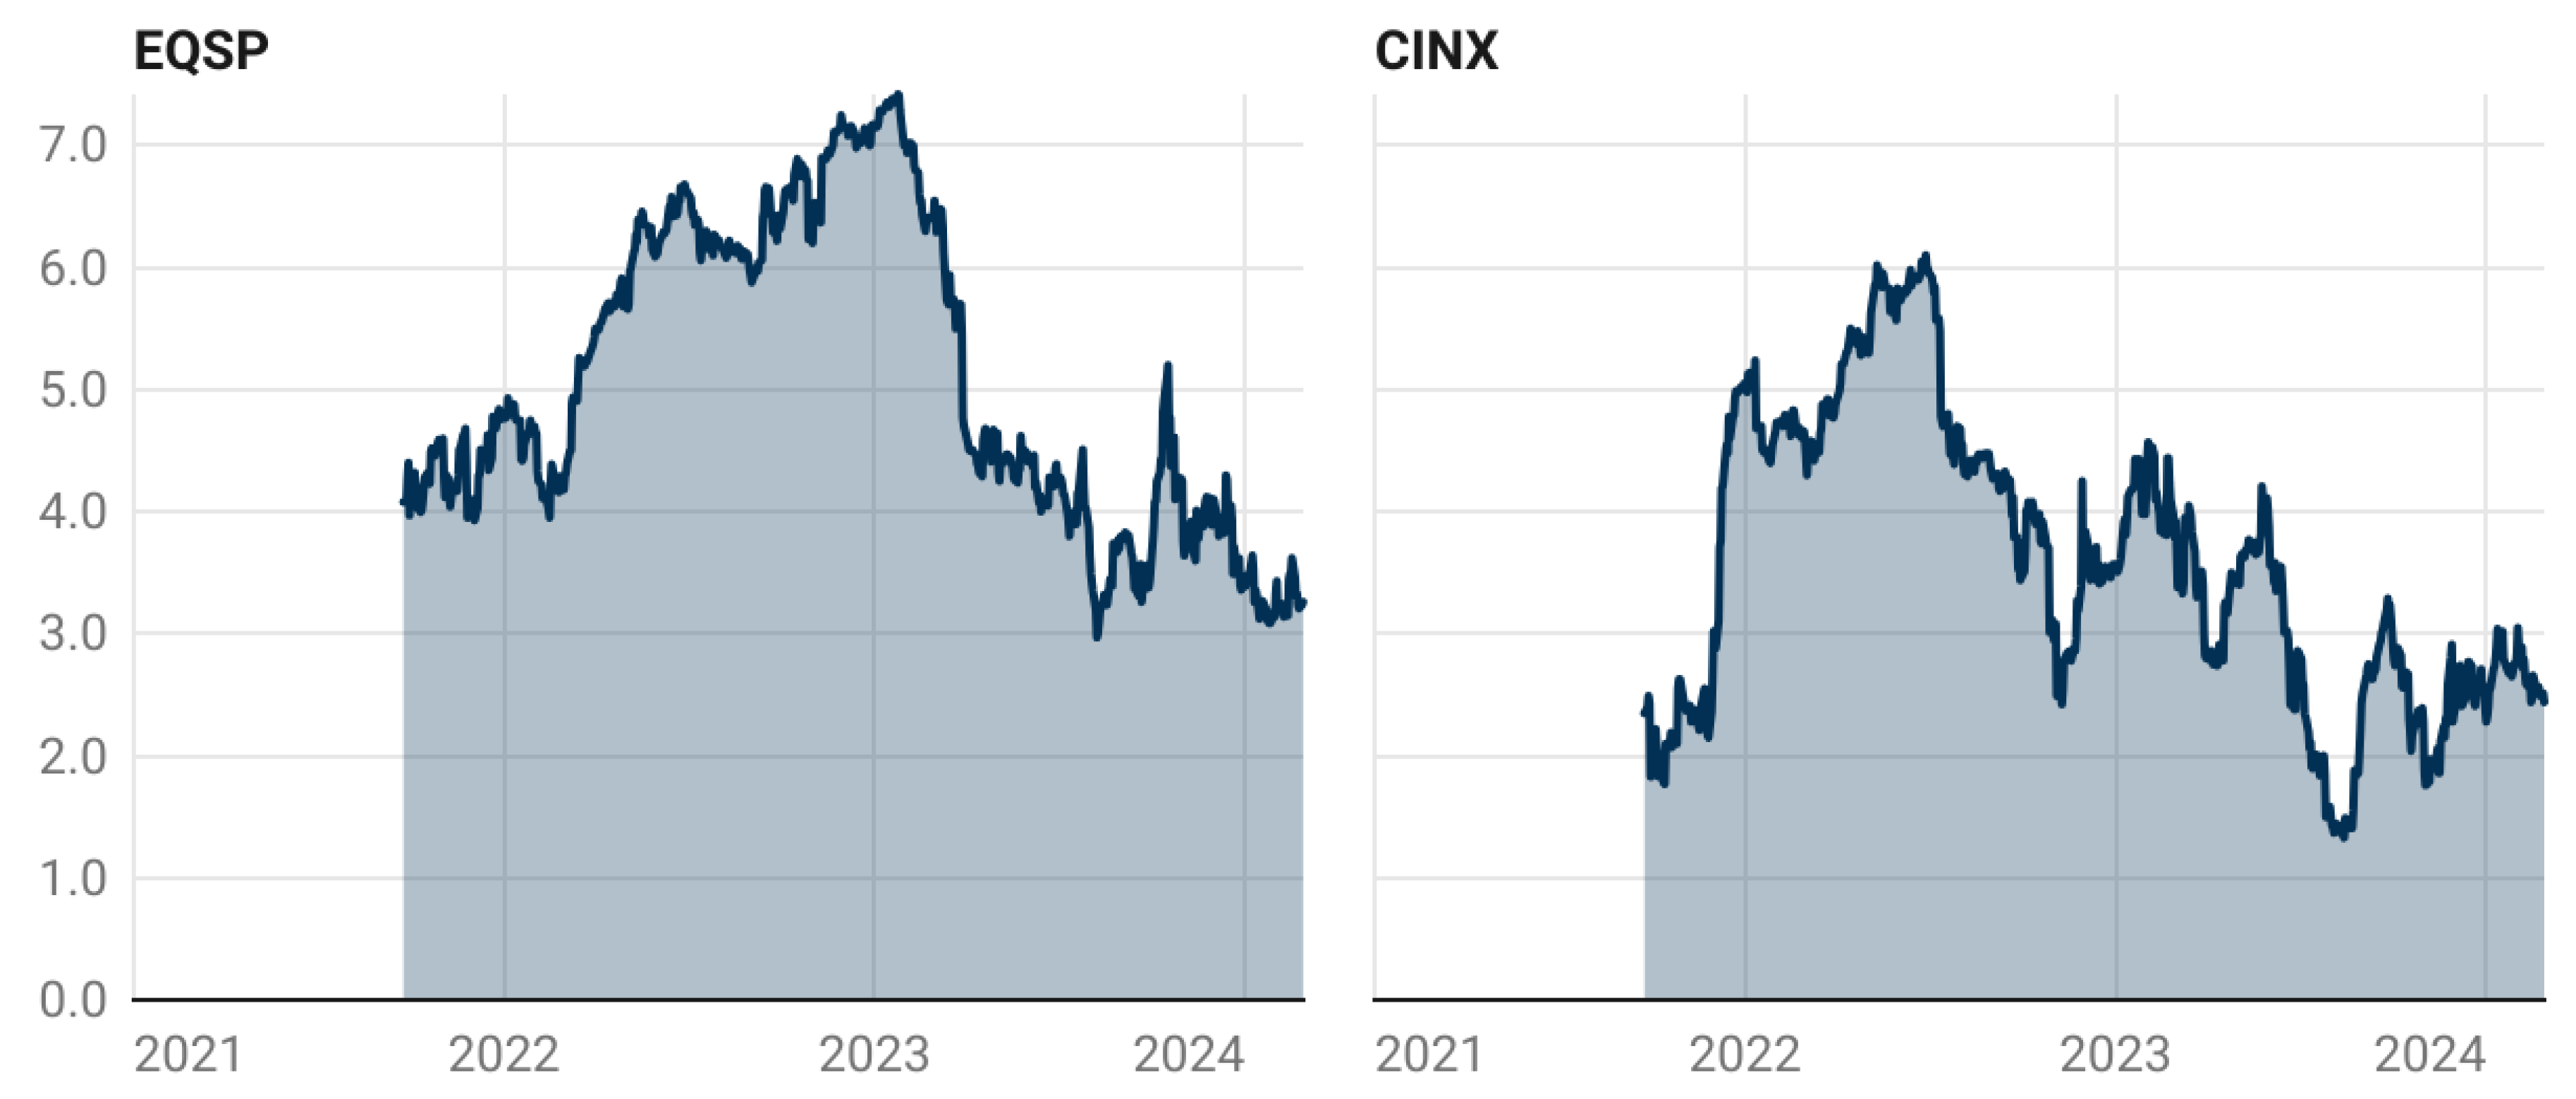
Figure 4.
Net Directional Spillovers
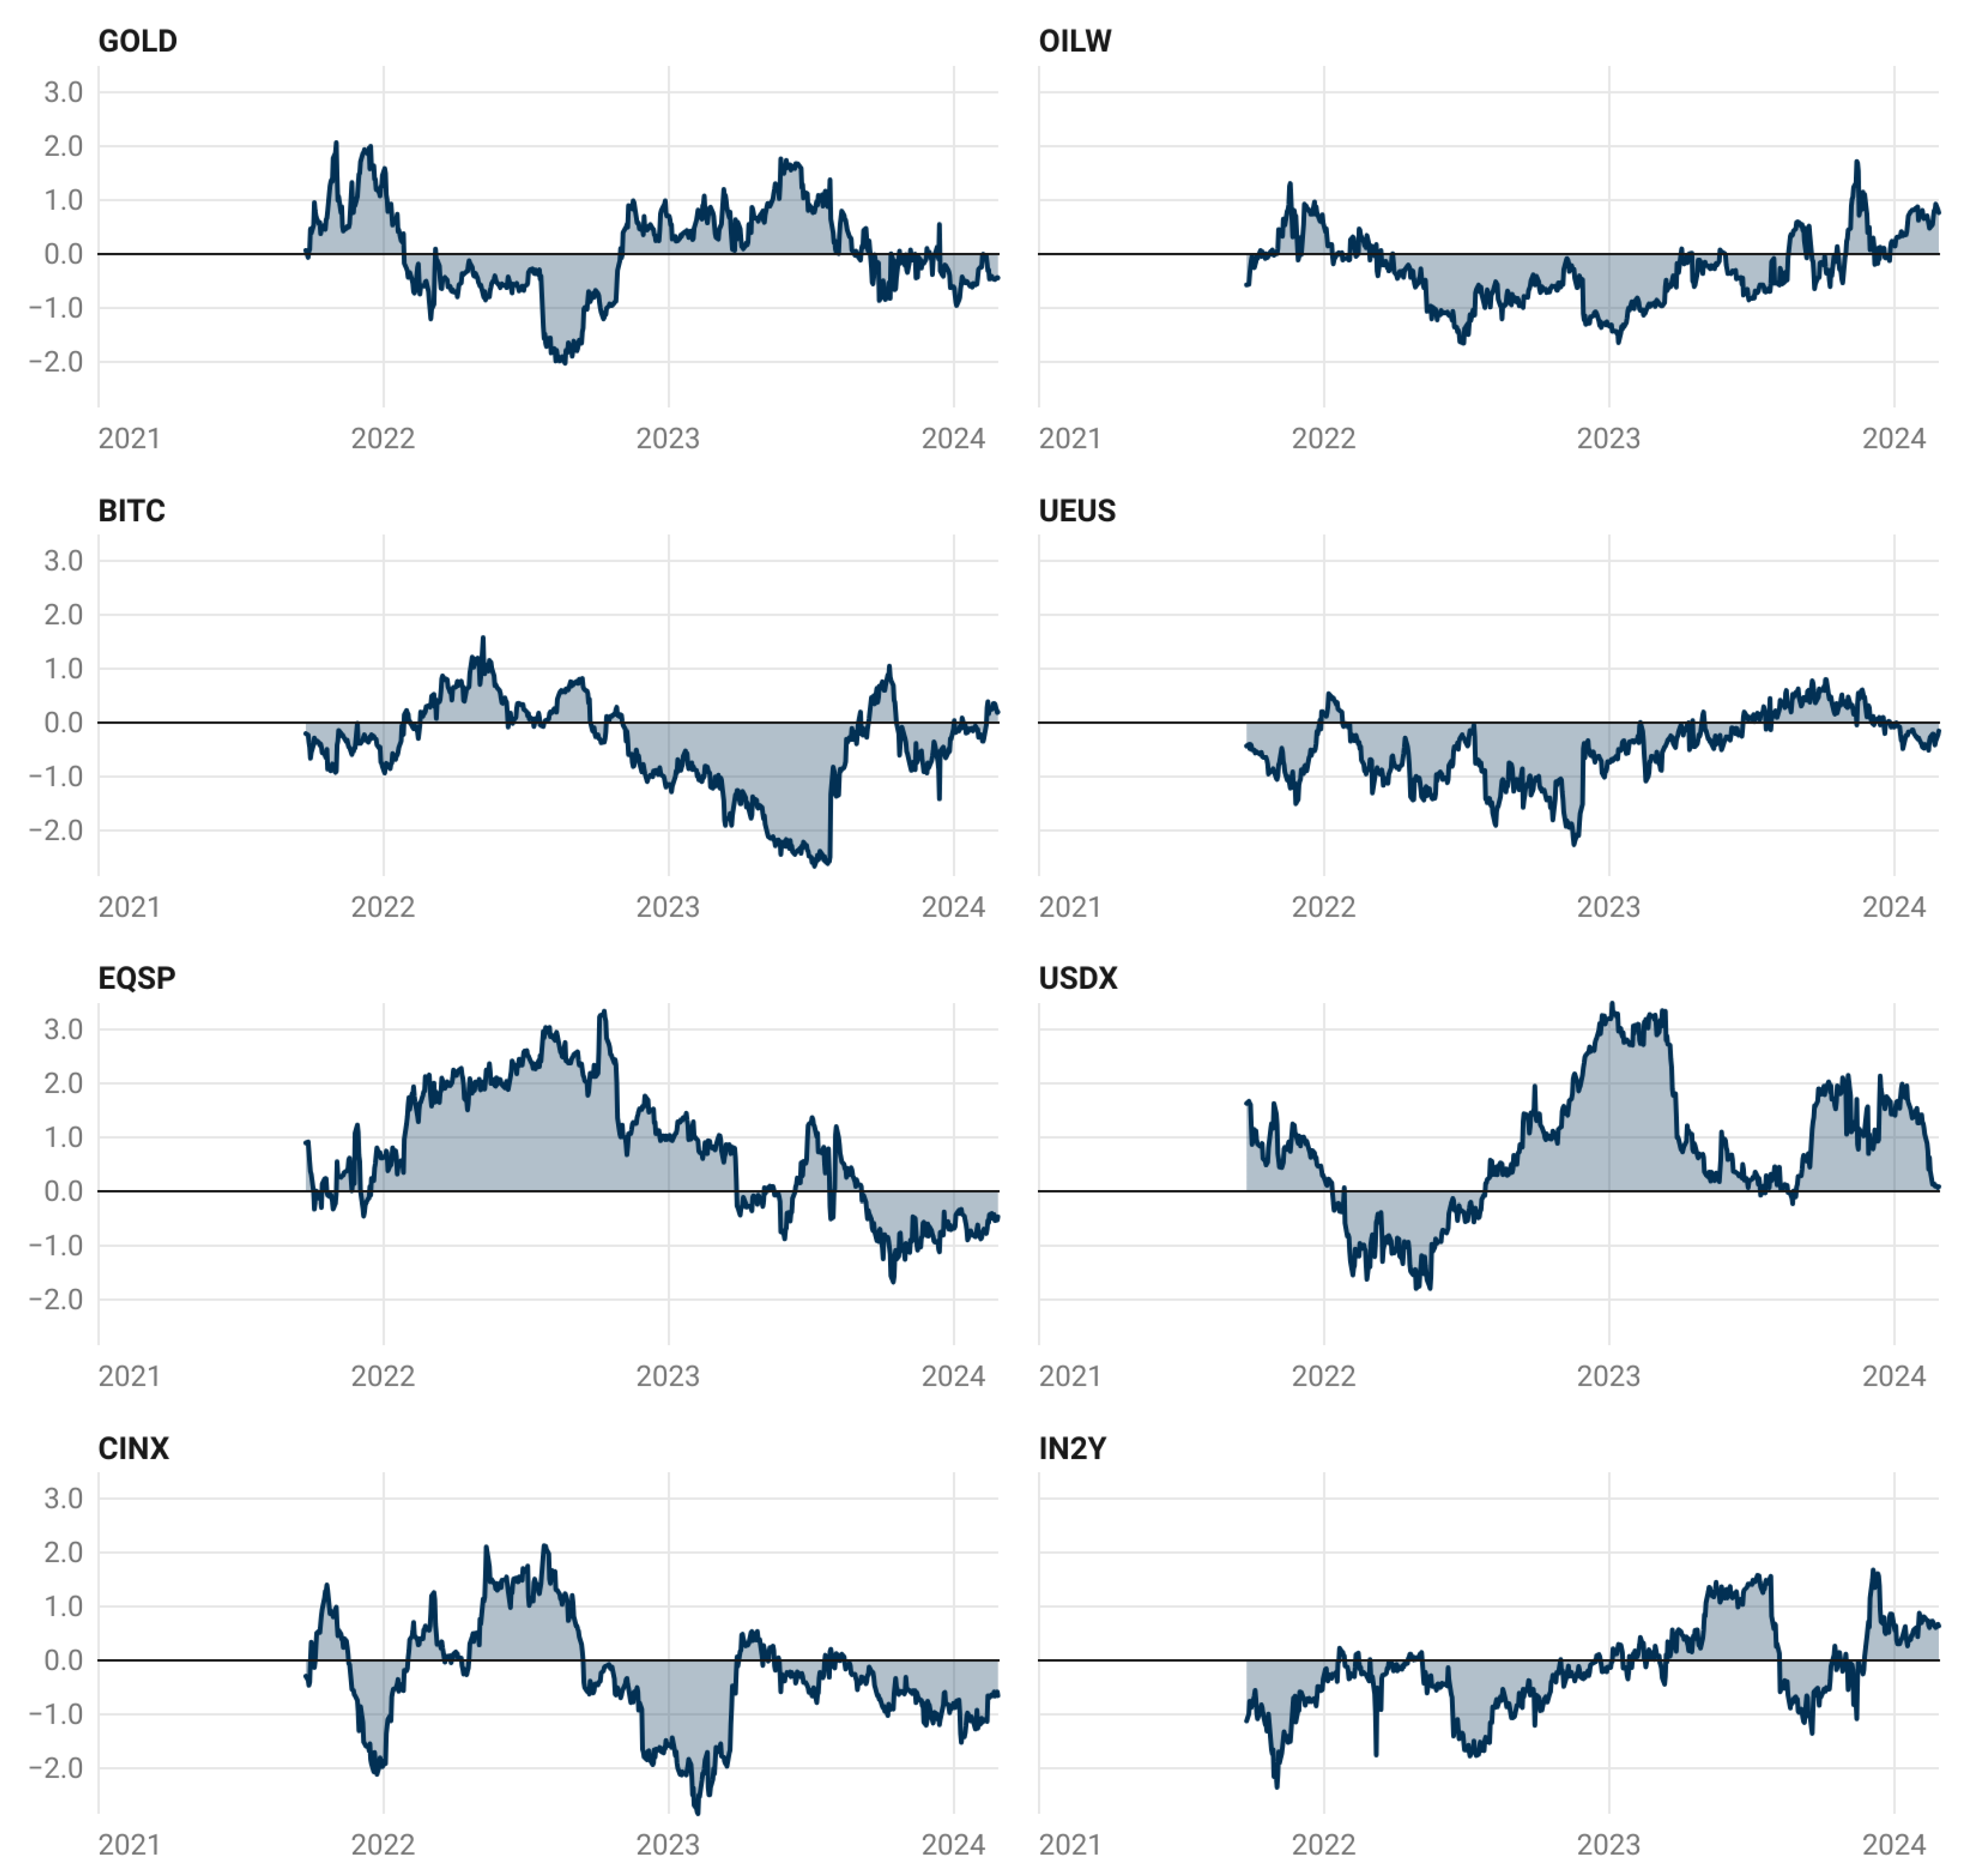
Figure 5.
Pairwise Net Directional Spillovers
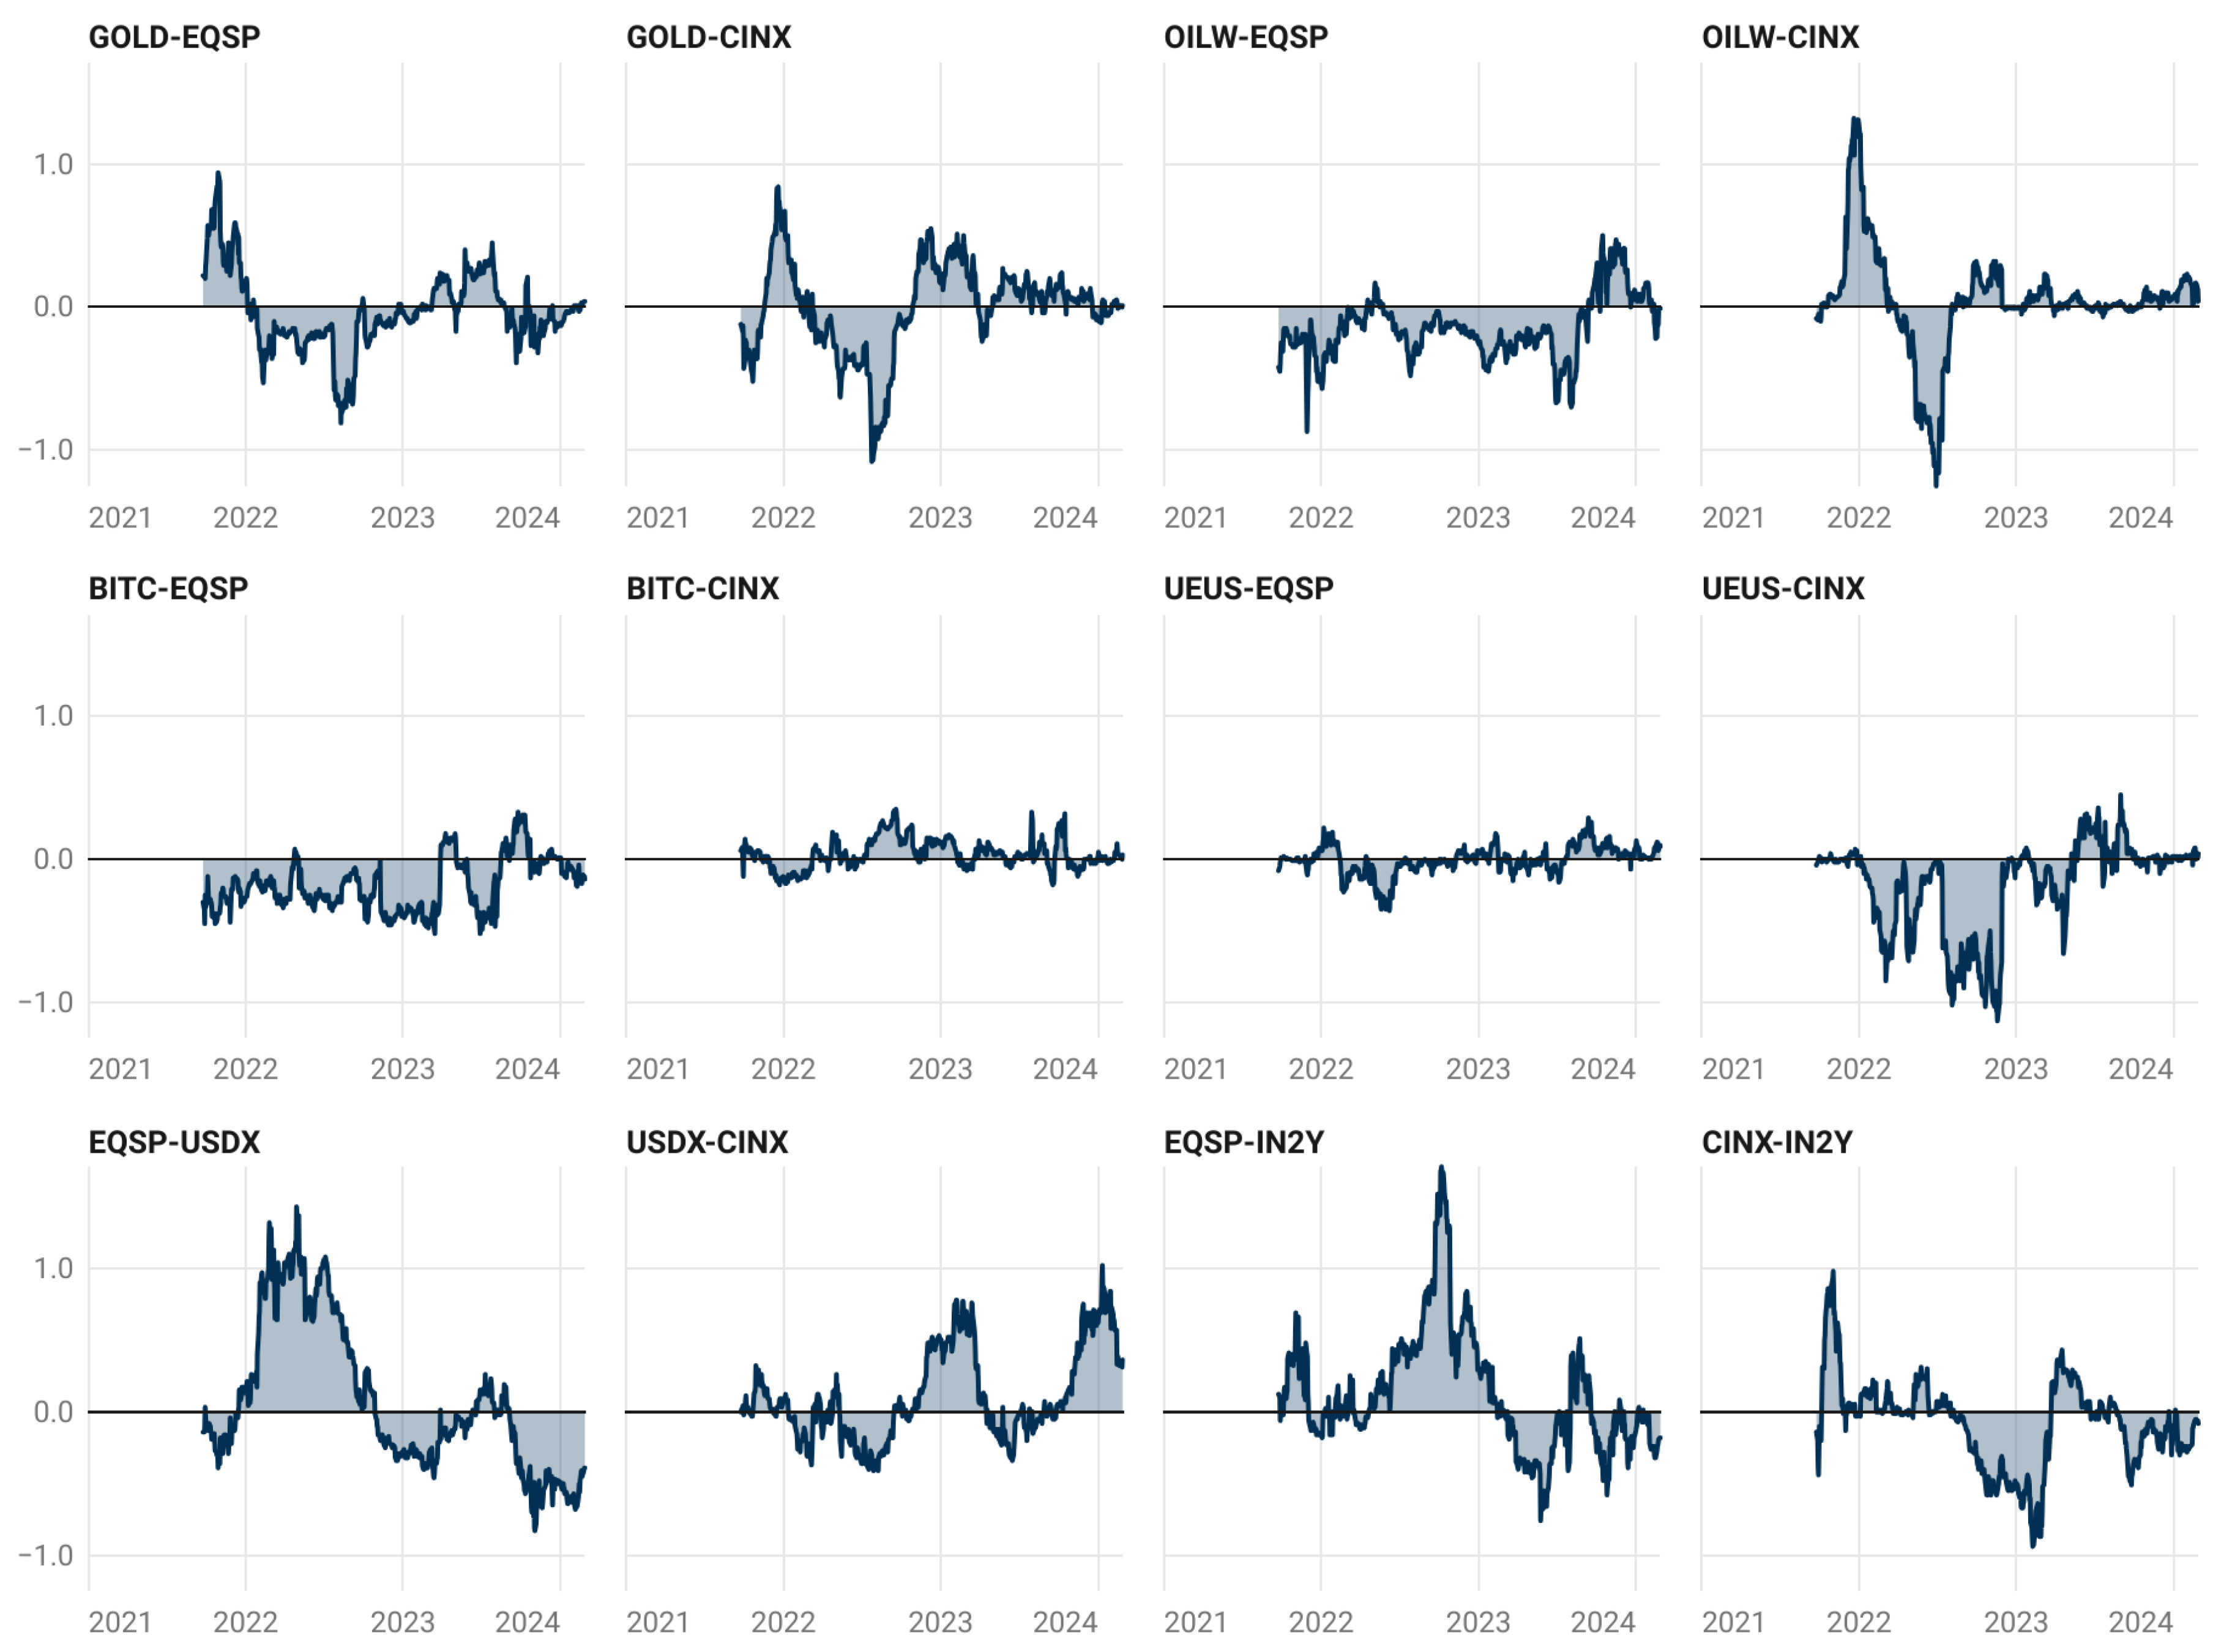

Table 1.
Description of variables
| Variable | Description | Source |
|---|---|---|
| GOLD | Handy-Harman gold price index | Refinitiv |
| OILW | WTI Cushing crude oil price (USD/BBL) | Refinitiv |
| BITC | USD to Bitcoin crypto exchange rate | Refinitiv |
| UEUS | US economic policy uncertainty index | Refinitiv |
| EQSP | S&P 500 composite equity index | Refinitiv |
| USDX | US dollar trade-weighted index | Refinitiv |
| IN2Y | Market yield of US Treasury Securities (2 years) | USDT |
| CINX | Crowdfunding index (based on 5 stocks) | User created |
Notes: USDT - U.S. Department of the Treasury
Table 2.
Descriptive Statistics
| Variable | GOLD | OILW | BITC | UEUS | EQSP | USDX | CINX | IN2Y |
|---|---|---|---|---|---|---|---|---|
| Mean | 0.01 | 0.03 | 0.00 | -0.06 | 0.02 | 0.02 | -0.01 | 3.02 |
| Min | -4.56 | -12.78 | -23.69 | -263.51 | -4.42 | -2.10 | -19.55 | 0.13 |
| Max | 3.78 | 8.21 | 18.05 | 227.90 | 5.40 | 1.52 | 10.20 | 5.19 |
| StD | 0.84 | 2.44 | 3.74 | 59.68 | 1.09 | 0.45 | 2.74 | 1.78 |
| Skew | -0.16 | -0.58 | -0.49 | 0.07 | -0.18 | -0.33 | -0.61 | -0.53 |
| Kurt | 2.31 | 2.09 | 4.33 | 1.23 | 1.86 | 1.46 | 4.35 | -1.33 |
| Obs | 732 | 732 | 732 | 732 | 732 | 732 | 732 | 732 |
Notes: GOLD represents Handy-Harman gold price index, OILW - WTI Cushing crude oil price (USD/BBL), BITC - USD to Bitcoin crypto exchange rate, UEUS - US economic policy uncertainty index, EQSP - S&P500 composite equity index, USDX - US dollar trade-weighted index, CINX - Crowdfunding price index (based on 5 stocks), IN2Y - Market yield of US Treasury Securities (2 years). All variables are converted into logarithmic returns x 100, except for IN2Y.
Table 3.
Static Spillovers
| Var | GOLD | OILW | BITC | UEUS | EQSP | USDX | CINX | IN2Y | FROM |
|---|---|---|---|---|---|---|---|---|---|
| GOLD | 9.15 | 0.35 | 0.02 | 0.01 | 0.06 | 1.61 | 0.02 | 1.28 | 3.35 |
| OILW | 0.41 | 11.50 | 0.06 | 0.00 | 0.24 | 0.21 | 0.06 | 0.02 | 1.00 |
| BITC | 0.07 | 0.05 | 9.37 | 0.02 | 1.57 | 0.61 | 0.67 | 0.14 | 3.13 |
| UEUS | 0.03 | 0.00 | 0.03 | 12.41 | 0.00 | 0.00 | 0.01 | 0.01 | 0.09 |
| EQSP | 0.03 | 0.09 | 1.37 | 0.00 | 8.23 | 1.46 | 1.28 | 0.04 | 4.27 |
| USDX | 1.30 | 0.15 | 0.51 | 0.00 | 1.48 | 7.82 | 0.12 | 1.12 | 4.68 |
| CINX | 0.09 | 0.04 | 0.69 | 0.02 | 1.59 | 0.25 | 9.78 | 0.04 | 2.72 |
| IN2Y | 1.11 | 0.05 | 0.02 | 0.01 | 0.06 | 1.69 | 0.00 | 9.55 | 2.95 |
| TO | 3.05 | 0.73 | 2.70 | 0.07 | 5.00 | 5.83 | 2.16 | 2.65 | 22.19 |
| NET | -0.30 | -0.27 | -0.43 | -0.02 | 0.73 | 1.15 | -0.56 | -0.30 |
Notes: GOLD represents Handy-Harman gold price index, OILW - WTI Cushing crude oil price (USD/BBL), BITC - USD to Bitcoin crypto exchange rate, UEUS - US economic policy uncertainty index, EQSP - S&P500 composite equity index, USDX - US dollar trade-weighted index, CINX - Crowdfunding price index (based on 5 stocks), IN2Y - Market yield of US Treasury Securities (2 years). All variables are converted into logarithmic returns x 100, except for IN2Y. FROM examines the directionality of spillover effects received by each variable from others. TO assesses the directionality of spillover effects transmitted by each variable to others. NET is the difference between TO and FROM.
Disclaimer/Publisher’s Note: The statements, opinions and data contained in all publications are solely those of the individual author(s) and contributor(s) and not of MDPI and/or the editor(s). MDPI and/or the editor(s) disclaim responsibility for any injury to people or property resulting from any ideas, methods, instructions or products referred to in the content. |
© 2025 by the authors. Licensee MDPI, Basel, Switzerland. This article is an open access article distributed under the terms and conditions of the Creative Commons Attribution (CC BY) license (http://creativecommons.org/licenses/by/4.0/).
Copyright: This open access article is published under a Creative Commons CC BY 4.0 license, which permit the free download, distribution, and reuse, provided that the author and preprint are cited in any reuse.


