
Submitted:
18 January 2025
Posted:
20 January 2025
You are already at the latest version
Abstract
In rats, normobaric hypoxia significantly reduced left ventricular (LV) inotropic function while right ventricular (RV) function was not impaired. In parallel, the animals developed pulmonary edema and inflammation. In the present study, we investigated whether cardiac function and pulmonary injury would aggravate after three and six days of hypoxia exposure, or whether cardiopulmonary reactions to prolonged hypoxia would become weaker due to hypoxic acclimatization.
Sixty-four female rats were exposed for 72 or 144 h to normoxia. They received a low-rate infusion (0.1 ml/h) with 0.9% NaCl solution. We evaluated indicators of the general condition, blood gas parameters and hemodynamic function of the rats. In addition, we performed histological and immunohistochemical analyses of the lung. Despite a significant increase in hemoglobin concen-tration, the LV function deteriorated with prolonged hypoxia. In contrast, the RV systolic pressure and contractility steadily increased by 6 days of hypoxia. The pulmonary edema and inflammation persisted and rather increased with prolonged hypoxia. Furthermore, elevated protein concentra-tion in the pleural fluid indicated capillary wall stress, which may have aggravated pulmonary edema. In conclusion, 6 days of hypoxia and NaCl infusion place significant stress on the cardi-opulmonary system of rats as is also reflected by 33% of premature deaths in this rat group.
Keywords:
prolonged normobaric hypoxia
; cardiac function
; left and right ventricular catheterization
; pulmonary edema
; pulmonary inflammation
; tumor necrosis factor α
; pleural fluid
1. Introduction
Exposure to a hypoxic environment or pathologic conditions causing a reduced or insufficient oxygen supply is a major challenge to the organism requiring a multitude of adaptational reactions to compensate for the oxygen deficiency. The cardiopulmonary system makes an important contribution to the hypoxia acclimatization. However, if the heart and lungs themselves are affected by the lack of oxygen, the range of compensatory responses is limited, which can further reduce the supply of oxygen to all organs and tissues.
An impaired energy metabolism is a direct consequence of oxygen deficiency. Tissues reduce their demand for oxygen when possible. Anaerobic energy production increases, but this is less efficient than aerobic energy generation and, even more importantly, is associated with development of metabolic acidosis. The hypoxic ventilatory response (HVR) is one of the earliest compensatory reactions to hypoxia. The alveolar and consequently, the arterial pO2 are improved by increased excretion of CO2. Hypoxic pulmonary vasoconstriction (HPV) contributes to the optimization of alveolar gas exchange. Hypoxia-induced activation of the sympathetic nervous system by oxygen-sensing mechanisms, such as carotid bodies [1] and the resulting release of various stress hormones increase cardiac output and thus, the circulatory component of oxygen supply to the organs [2,3]. Finally, a sustainable mechanism of adaptation to hypoxia is the improvement of the oxygen transport capacity of the blood by increased erythropoiesis [4].
The adaptable and advantageous reactions of the organism, however, carry the potential for the development of complications. The elevated hematocrit means an additional load to the cardiovascular system. This is attenuated by a reduction in plasma volume [3,5,6], which in turn, may reduce end-diastolic filling of the ventricles and limit the enhancement of cardiac output. Another typical and critical pathology of hypoxia is formation of pulmonary edema (PE). The specific form of hypoxic PE occurring at high-altitude is called high-altitude pulmonary edema (HAPE). Hypoxic PE is considered to be a hydrostatic edema caused by increased pulmonary capillary pressure. It results from enhanced and uneven HPV causing overperfusion and thus, increase in pulmonary capillary pressure in lung regions with weaker HPV [7]. Strong sympathetic activation or elevated plasma catecholamine levels can have pro-edematous effects even in normoxia [8,9] suggesting that sympathetic activation under hypoxic conditions may promote and aggravate formation of PE. If the pulmonary capillary pressure strongly increases approaching about 40 mmHg, capillary wall stress may result [10,11]. This damage to the alveolo-capillary barrier may cause fluid intrusion into the alveoli, a complication that can often be fatal.
1.1. Cardio-Circulatory and Pulmonary Reactions to Hypoxia in Humans and Animals
The human heart responds to acute hypoxia with an increase in cardiac output resulting from tachycardia accompanied by an unchanged stroke volume [12,13,14,15]. In addition, echocardiographic studies demonstrated an improved LV twist mechanics in humans at high altitude [15,16,17]. This improvement in cardiac function is supposed to result from sympathetic activation, which occurs in humans within 30 min of moderate hypoxia [18]. In addition, hypoxia induces vasodilation in systemic circulation [19,20]. The resulting decrease of the total peripheral resistance (TPR) contributes to the enhancement of cardiac output.
In contrast, numerous animal studies have demonstrated a deterioration in left ventricular (LV) function under hypoxic conditions. It is thought to result from reduced myocardial oxygen consumption and anaerobic metabolism [21]. More specifically, mitochondrial respiration and ATP synthesis are compromised in hypoxic LV myocytes [22,23]. In addition, hypoxia impaired LV mechanical function, specifically, the twist of the apical myocardium, as was shown in pigs under acute myocardial ischemia. As a consequence, pressure and contractility of the LV as well as stroke volume (SV) and ejection fraction (EF) are reduced [24]. Heart rate (HR), aortic blood flow, and TPR decreased in acute hypoxia [25]. This was also confirmed in our previous studies on rats, as they showed that only a few hours of exposure to normobaric hypoxia with 10% O2 significantly reduced LV systolic pressure (LVSP) and contractility (LV dP/dt max). After 24 h of hypoxia, LVSP and LV dP/dt max decreased to about 80% and 65% of normoxic values, respectively [26]. Despite an only mild reduction in HR by about 10%, the cardiac output was significantly reduced to about 60% of the normoxic value [27] indicating a marked reduction in stroke volume. With longer hypoxic exposure (72 h), LV function did not recover, which may be explained by nitrosative stress and apoptosis of the myocardial cells [28]. Contrary to the LV, maximal pressure and contractility of the right ventricle (RV) did not decrease but rather increased slightly by 3 days of hypoxia even though nitrosative stress and apoptosis were also present in the RV [26,28]. These hemodynamic changes were paralleled by inflammation and formation of PE [27,29]. The PE appeared after about 6 h of hypoxia and increased steadily until 72 h of hypoxia exposure [26,27,29]. After 3-7 days of hypoxia, we observed regression of PE, blood congestion and inflammation in the lungs of rats while mRNA of collagen type I and III gradually increased in this period [30].
The present study was performed to investigate the cardiopulmonary changes during a prolonged but still subchronic exposure to hypoxia. For this reason, we compared the effects of three-day and six-day exposure to hypoxia on heart and lungs of rats. We hypothesize that hypoxia acclimatization occurs and is detectable by a gradual increase in hemoglobin concentration (cHb) and hematocrit (Hct) in the blood. Consequently, we would expect that hypoxia tolerance of the rats is improved or at least maintained. Hence, we assume that LV and RV functions remain largely stable between the end of the 3rd and 6th day of hypoxia. Pulmonary edema and inflammation are expected to recede during this period
2. Materials and Methods
2.1. Animal Model
The experiments were performed on 64 female Sprague-Dawley rats supplied by Charles River (Sulzfeld, Germany). The body weight of the animals was 240 ± 1.9 g corresponding to an age of about 10-12 weeks. All animal protocols were approved by the state agency (Landesdirektion Sachsen, number and date of approval: TVV 46/18; 17 December 2018). The experiments were conducted in accordance with the Guide for the Care and Use of Laboratory Animals published by the National Institutes of Health and with the “European Convention for the Protection of Vertebrate Animals used for Experimental and other Scientific Purposes” (Council of Europe No 123, Strasbourg 1985).
2.2. Study Protocol
All animals received an intravenous infusion with 0.9 % NaCl solution at a rate of 0.1 ml h-1 over the total experimental time. Infusions were administered with automatic pumps (Infors AG, Basel, Switzerland) via an infusion catheter (Vygon, Aachen, Germany), which was inserted into the left jugular vein. The animals were divided at random into two cohorts to be exposed to normoxia (N) or normobaric hypoxia (H). Each cohort was subdivided into two groups. One group of each cohort remained 72 hours in normoxia (72N, n = 14) or hypoxia (72H, n = 18), the other group was exposed to the respective condition over 144 hours (144N, n = 8; 144H, n = 24). Normoxic animals were kept under room air condition. The animals in the hypoxic cohort were placed into a hypoxic chamber sized 65 x 105 x 50 cm. The gas mixture in the chamber contained 10% oxygen in nitrogen. A special equipment prevented penetration of ambient air during manipulations on the animals, thus keeping the oxygen concentration in the chamber stable at 10 ± 0.5%. Exposure to hypoxic environment started immediately after insertion of the infusion catheter. Throughout the duration of the experiment, the animals were awake and moved freely with access to tap water and rat chow diet (Altromin C100, Altromin GmbH, Lage, Germany).
2.3. Hemodynamic Measurements
About 40 min before the end of the exposure time, the animals were anesthetized with thiopental (Trapanal® 80 mg kg 1, i.p.). When the anesthesia had reached a sufficient depth, the animals were weighed and then placed onto a heated plate to avoid cooling during the hemodynamic measurement. First, the animals were tracheotomized, and a polyethylene cannula was placed in the trachea. Then, the right ventricle (RV) was catheterized with Millar® (Millar Instruments, Houston, TX) ultraminiature catheter pressure transducers. For catheterization of the left ventricle (LV) and recording of pressure-volume loops, we inserted a pressure-volume Millar catheter (Millar Instruments, Houston, USA) into the left ventricle via the right carotid artery. The catheter was connected to a signal amplifier system (MPVS Ultra, Millar Instruments, Houston, USA). For data acquisition and analysis, we used the Power Lab 16/35 and Lab Chart Pro Software (Lab Chart 8) from ADInstruments (sales department FMI Föhr Medical Instruments GmbH, Seeheim, Germany). Parallel conductance was corrected by injection of 0.1 ml of 0.9% NaCl solution and calibration of stroke volume by the thermodilution method. The following variables were measured in RV and LV: LVSP, RVSP, HR, LV and RV dP/dt max and dP/dt min as measures of ventricular contractility and relaxation, respectively. From LV catheterization, we determined SV, EF, SW, edP and edV. After withdrawal of the LV catheter tip into the aorta, DAP was measured to calculate mean aortic pressure (MAP). Cardiac output was measured by thermodilution using a thermosensitive 1.5F microprobe and a Cardiomax II computer (Columbus Instruments, Columbus, OH). From this measurement, we calculated CI as body mass-related cardiac output and TPR as the quotient of MAP and CI. Hypoxic animals remained in hypoxia until completion of hemodynamic measurements:
2.4. Sampling of Materials
After the hemodynamic measurements, the animals were sacrificed by drawing blood from the abdominal aorta. From a small sample of aortic blood, oximetry and blood gas assessment were performed using a blood gas analyzer ABL800 BASIC (Radiometer Medical ApS, Brønshøj, Denmark). For measurement of blood glucose concentration, we used the blood glucose monitor BGStar (AgaMatrix, Inc., Salem, NH, USA). Then, the thoracic wall was opened and pleural fluid (PF) was collected. We ligated the right main bronchus and performed a bronchoalveolar lavage (BAL) of the left lung. The recovered BAL fluid was frozen and stored at −80 °C for further analyses. The left lung was discarded thereafter. The intact right lung and the heart were excised and weighed. The cardiac apex and pieces from the right lung were fixated in formalin for histological analysis. In addition, we took a piece of the middle lobe of the right lung for determination of wet-to-dry weight (W/D) ratio.
Finally, we weighed the feed residues to determine the total feed consumption of the animals. The total water uptake over the experimental time was recorded from the majority of the animals.
2.5. Lung Histology
The formalin-fixated tissue samples of the right lung were embedded in paraffin, sliced, and stained with hematoxylin–eosin. Two independent investigators (S.D. and J.K.) who were blinded to the treatment group evaluated PE and congestion in the lungs. For a detailed quantification of PE, the complete histological section of a lung was assessed. First, the width of the alveolar septa and the definition of alveolar spaces were evaluated in each area of the section to determine PE severity (expressed as PE score). PE scores ranged from 0 (absent) to 1 (mild: alveolar septa slightly thickened, alveolar space well defined), 2 (moderate: thickness of alveolar septa about double the normal width, alveolar space narrowed but still defined), and 3 (severe: alveolar spaces hardly determinable and/or alveolar edema). Second, the PE index (PEI) was calculated by cumulating the products of the PE score and the proportionate area of each part of the histological preparation.
2.6. Immunohistochemistry
Immunohistochemistry was used to detect tumor necrosis factor (TNF) α as a marker of inflammation in the lung. Specimens from the right lung, fixed with 4% formalin, were embedded in paraffin, and 2 µm slices were cut. After mounting on microscopic slides, the samples were dewaxed and rehydrated. The dewaxed and rehydrated specimens were cooked in 0.01 M citrate buffer (pH = 6) and then blocked with bovine serum albumin (BSA) to saturate unspecific bindings. The specimens were treated with rabbit monoclonal anti-TNFα primary antibody (1:100, Sigma-Aldrich, Taufkirchen, Germany) overnight at 4 °C. Then, they were washed again in Tris-buffer, and the appropriate goat anti-rabbit secondary antibody (1:200, Sigma-Aldrich, Taufkirchen, Germany) labeled with horseradish peroxidase (HRP) was applied for 1 h. After a further washing step, a peroxidase reaction was carried out using the red chromogen 3-amino-9-ethylcarbazole (AEC, Enzo, Lörrach, Germany) according to the manufacturer’s instructions. Cell nuclei were counterstained with hemalum. All specimens were investigated microscopically using the Axioimager M1 microscope from Zeiss (Carl Zeiss, Jena, Germany). As TNFα is mainly located in the bronchial and peribronchial regions, photographs were taken from these regions using an AxioCam MRc 5 camera and Zen Blue 3.1 software (Carl Zeiss, Jena, Germany) at 20× magnification. At least 8 pictures per animal were evaluated by a blinded observer (S.D.). The program ImageJ [31] was used for measurements of the TNFα-positive area (in µm2) in the pictures. The expression of TNFα is given as the TNFα-positive area related to the bronchial surface area of the specimen (in percent).
2.7. Lung Wet-to-Dry Weight Ratio
Lung tissue samples were weighed immediately after preparation (wet weight, W) and after drying in an oven at 75 °C for 48 h (dry weight, D). The W/D ratio served as a surrogate parameter of fluid accumulation in the lung and, thus, as an indicator of pulmonary blood congestion and edema.
2.8. Protein Concentration in Serum, BAL Fluid and Pleural Fluid
Total protein concentration in serum and BAL was determined using the BCA protein assay from Pierce (Thermo Fisher Scientific, Dreieich, Germany) according to the manufacturer's instructions. For BAL fluid analysis the undiluted supernatant of the first lavage was used. Pleural fluid (PF) and serum (S) were diluted with PBS at a ratio of 1:200. A standard curve was generated with bovine serum albumin (25µg/ml to 2000µg/ml) and measured together with the unknown samples at 562nm. A twofold determination was performed using the spectrophotometer Synergy HTX form BioTek (now Agilent, Waldbronn, Germany). The protein concentrations [P] in the fluids are given in g/L. The concentration ratio [P] PF/[P] S was calculated for each individual animal and is given in %.
2.9. Statistical Analysis
Statistical analyses were carried out with the software package SigmaPlot Version 14.0 (Systat Software GmbH, Erkrath, Germany) for Windows. We used Analysis of Variance (ANOVA) procedures to compare the groups for significant differences. At first, a Shapiro-Wilk test of normality was performed. In case of normal distribution, we used a One Way ANOVA with a post-hoc test according to Fisher’s LSD method. If the data were not normally distributed, a Kruskal-Wallis ANOVA on ranks with a post-hoc test according to Dunn’s method was applied. Both post-hoc tests are multiple comparison procedures comparing all possible pairwise mean differences. P values < 0.05 were considered significant.
3. Results
3.1. General Outcome
The hypoxic animals did not tolerate the experiment as well as normoxic animals. From all the rats in normoxic conditions (72 h normoxia, 72N; 144 h normoxia, 144N), only one died prematurely from an injury to the carotid artery during LV catheterization. In the hypoxic cohort (72 h hypoxia, 72H; 144 h hypoxia, 144H), 17 rats (72H n = 4; 144H n = 13) showed signs of LV decompensation and acute right ventricular failure (aRVF) at necropsy with the most prominent features being a huge and dilated RV, a purple patchy lung, massive blood pooling into the inferior caval vein, and a huge, dark purple liver. More than half of these animals (72H n = 2; 144H n = 8) died in thiopental anesthesia before or at the beginning of the hemodynamic measurements. None of the normoxic animals showed signs of LV decompensation and aRVF or died with these signs.
The daily water intake of normoxic rats was with 31.0 ± 3.2 ml/d significantly higher than in hypoxic animals (72H 14.4 ± 3.5 ml/d, p = 0.009; 144H 19.7 ± 2.0 ml/d, p = 0.036). Food intake was also significantly reduced in hypoxic animals by about 50% of normoxic rats (Figure 1). Consistently, normoxic rats largely maintained their body weight (BW) (ΔBW -2.4 ± 1.6% of baseline). In contrast, hypoxic rats showed a significant loss in BW by 11.7 ± 1.1 % in three days (p < 0.001 compared to 72N) and even by 16.8 ± 0.8 % in 6 days of hypoxia (p < 0.001 compared to 144N and to 72H; Figure 1).
3.2. Blood Analysis
In hypoxic animals, the arterial oxygen saturation (SaO2) and partial pressure of oxygen (paO2) were reduced compared to normoxic rats, but the difference only became significant after 6 days of hypoxia (p < 0.001 and p = 0.015, respectively). Hypoxemia was accompanied by development of acidosis. Arterial pH decreased to 7.32 after 3 days, but dropped even further by 6 days of hypoxia (7.15, p < 0.001 compared to the related normoxic group (Figure 2). The arterial partial pressure of carbon dioxide (paCO2) was markedly reduced in the 72H group (33.3 mmHg) but re-increased to normal values after 6 days of hypoxia (40.7 mmHg, p > 0.05). Lactate and glucose concentration increased slightly but not significantly in the hypoxic groups, particularly in the 144H group. Moreover, hypoxic animals showed a significant increase in K+ and Na+ concentrations after 3 days of hypoxia (p = 0.005 and 0.01, respectively), which partly receded by day 6 of hypoxia (Table 1). Hemoglobin concentration (cHb) and hematocrit (Hct) increased gradually until the 6th day of hypoxia (p < 0.001 compared to the 144N group) indicating progressive adaption to hypoxia (Figure 3).
3.3. Hemodynamic Measurements and Heart Weight
Hemodynamic results are presented in Figure 4 and Table 2. As expected, LVSP was significantly reduced after 3 days of hypoxia (p = 0.001 compared to 72N). By the 6th day, it re-increased to almost normal levels (p = 0.22 compared to 72H). LV dP/dt max, diastolic aortic pressure (DAP), mean aortic pressure (MAP), LV end-diastolic volume (edV), SV, EF and stroke work (SW) showed a similar trend, but the differences were mostly not significant. In contrast, LV end-diastolic pressure (edP) increased mildly in the 72H group, but increased massively to about three-fold values in the 144H group (p < 0.001 compared to 144N). Of note, LVSP and LV edV were also reduced in the 144N group. LV relaxation (dP/dt min) decreased slightly, but not significantly, under hypoxia. HR decreased significantly after 3 days and even further after 6 days of hypoxia (p < 0.05 compared to the time-corresponding normoxic group). Consequently, cardiac index (CI) gradually decreased under hypoxic conditions and was significantly diminished in the 144H group (p = 0.042 compared to 144N). TPR remained stable over the first 3 days of hypoxia, but then increased markedly by almost 50% (p = 0.001 compared to 72N).
In contrast to LV, SP and dP/dt max in the RV slightly increased under hypoxia, and this trend was even stronger after 6 days of hypoxia. At this time, RVSP was significantly higher than in the time-corresponding normoxic control (p = 0.005). Relative heart weight (HW/BW) increased slightly but not significantly in hypoxic rats indicating that no significant hypertrophy had developed in the heart. Of note, heart weight (HW) was in the 144N group about 10% lower than in the 72N group.
3.4. Pulmonary Injury
Lung histology revealed the existence of a mild interstitial edema in the lungs. Even normoxic rats were not completely free from signs of PE, but PE became more severe under hypoxic conditions. The pulmonary edema index (PEI) increased over time also in normoxia, but even more in hypoxia (Figure 5). However, the PEI differences among the groups were not significant. Relative lung weight (LuW/BW), which can be considered as an indicator of blood congestion and/or edema in the lungs, progressively increased with advancing duration of hypoxia and reached about 140% of normoxic values after 144 h (p = 0.003, s. Figure 6). The pulmonary wet-to-dry weight (W/D) ratios ranged between 4.9 and 5.6 without significant differences between the groups (data not shown) confirming that the edema was mainly confined to the interstitium and did not enter the alveoli. During the formation of PE, fluid filtration into the pleural space can serve as a drainage route. In hypoxic animals, the amount of pleural fluid (PF) was almost twice as high as in normoxic animals, even if the inter-individual variation was large (Figure 6). PF, which is normally low in protein, contained a relatively high amount of protein, in particular in the 72H group with more than 30 g/ml (Table 3). A protein concentration in PF > 30 g/ml or a PF-to-serum protein concentration ratio ([P] PF/ [P] S) > 0.5 as achieved in the 144H group indicates exudation, which can result from damage to the capillary walls [32,33]. In contrast, the bronchoalveolar lavage fluid (BALF) protein concentration was low and in a similar range in all groups, confirming that the edema had not entered the alveoli. Immunohistochemical analyses demonstrated that the hypoxic PE was accompanied by inflammation, which was preferably localized in the peribronchial regions. The expression of TNFα as a potent pro-inflammatory cytokine reached in the 144H group about twice the expression in the normoxic groups (p < 0.001 vs. 144H; Figure 7). In the 144N group, TNFα remained at the level of the 72N group.
4. Discussion
4.1. Effects of Prolonged Hypoxia on the General Condition of the Animals
The present data clearly show that acclimatization to hypoxia is verified by a significant increase in Hct and cHb after 3 days and even more after 6 days of hypoxia exposure. Despite this compensatory reaction, the general condition of the hypoxic animals was poor and deteriorated with longer exposure to hypoxia. The observed body weight loss and reduced food and water intake are typical reactions to hypoxia [34,35,36]. Oxygenation of the arterial blood significantly decreased after 6 days of hypoxia and led to a mainly metabolic acidosis that was associated with an increase in extracellular K+ concentration. Under hypoxic conditions, cells switch from oxidative to glycolytic metabolism in order to meet the limited oxygen supply and, even more importantly, to prevent excessive mitochondrial generation of reactive oxygen species (ROS) [37]. Hypoxia-inducible factors (HIFs) trigger this metabolic switch via several mechanisms [38,39,40]. Increased glycolysis is associated with reduced ATP production and increased lactate production resulting in metabolic acidosis [38,41]. Moreover, a decrease in arterial pO2 leads to an increase in plasma K+ concentration [42]. Acidosis has a synergistic effect on extracellular K+ concentration [43]. A reduced activity of the Na+/K+ ATPase has been discussed as one of the main mediators of this arterial K+ increase [44,45]. Hypoxia exerts a depressant effect on the action potential (AP) of the heart resulting in a depolarization of resting membrane potential, shortening of AP duration, decrease in AP amplitude and a reduced recovery of excitability. These effects are aggravated by elevated plasma K+ concentration [46,47] and may further impair the already limited cardiac function in hypoxia.
4.2. Effects of Prolonged Hypoxia on the LV Function
After 6 days of hypoxia, the function of the LV appears to be improved compared to 72 hours of hypoxia exposure. LVSP, LV dP/dtmax, MAP and DAP have re-increased almost to the values of the 72N group. HR and CI, however, further decreased by 6 days of hypoxia suggesting that the improved pressure and contractility values may not indicate a real recovery of LV function. This is confirmed by the continued low values of SV and EF. The massive increase in LV edP along with the re-increased LV edV point towards blood congestion in the pulmonary circulation as can be suggested from the significantly elevated relative lung weight. RVSP is, after 6 days of hypoxia, significantly higher than in the related normoxic group. At the same time, TPR has risen to approximately 150% compared to the 72H group. According to Frank-Starling’s law, the enlarged end-diastolic filling improves the contractility of the LV and enables the LV to counter the increased arterial resistance. However, the mildly improved contractility cannot fully compensate for the load on the LV from increased filling due to elevated RVSP on the one hand, and impeded discharge due to elevated TPR on the other hand. As HR continues to fall, CI is also declining to about 75% of normoxic values. Last but not least, the large number of premature deaths among the hypoxic animals is a clear indication of the severe stress on the LV caused by prolonged hypoxia. We suggest that this hypoxic stress in combination with narcosis has caused a decompensation of the LV in some animals with a subsequent massive backlog into the lungs and into the RV ultimately leading to the aRVF found at necropsy.
The heart is absolutely dependent on aerobic energy production. Reduced oxygen supply to the myocardium, particularly to the LV, compromises mitochondrial respiration, ATP synthesis and myocardial energetics [22,23,48,49]. To maintain ATP production, the hypoxic heart switches from the preferred fatty acid oxidation to the less oxygen consuming glucose oxidation [50,51]. Further adaptations to hypoxia, mainly mediated through hypoxia-inducible factor (HIF)-1α, lead to increased glycolysis. A study in dogs under progressive hypoxemia demonstrated that the reduction in LV oxygen consumption was accompanied by signs of anaerobic metabolism and a decrease in LV contractility [21]. Hypoxia impairs mitochondrial oxidative phosphorylation by modifying the activity of the cytochrome chain. This leads to a reduction in ATP synthesis and increased formation of ROS, while antioxidant defense systems are decreased [52]. The impaired myocardial oxygenation leads to oxidative and nitrosative stress and further damage to the heart. In a recent study, we demonstrated a significant increase in markers of nitrosative stress, ATP deficiency, and apoptosis in the hearts of hypoxic rats, which were associated with a pronounced depression in LV contractile function and cardiac output [28]. These findings suggest that oxidative/nitrosative stress, apoptosis, and a reduced myocardial energy state are significant contributors to the LV dysfunction in rats under hypoxic conditions. In addition, both hypoxia and oxidative stress impair pancreatic β-cell function via several molecular mechanisms resulting in a decreased insulin secretion [53,54]. Moreover, oxidative stress can reduce the expression of the insulin-sensitive glucose transporter GLUT-4, thus reducing cellular glucose uptake [53]. The increased blood glucose concentration observed in the present study indicates that an impaired glucose uptake may have contributed to the poor general condition and LV dysfunction of the hypoxic rats. Finally, acidosis and the increased plasma K+ concentration may have affected the excitability of the myocardial cells [47,55] and thus, contributed to the LV depression and to the significant bradycardia in hypoxic rats. However, not only the LV is affected by prolonged hypoxia. The total peripheral resistance, which was almost on normoxic level after 3 days of hypoxia, increased significantly after 6 days of hypoxia exposure. A recent study in humans demonstrated that increased α-adrenergic signaling in chronic hypoxia led to an impaired endothelial-dependent dilation in resistance arteries [56]. This is in line with previous results in rats during short-term exposure to hypoxia. While 24 h of hypoxia alone had no clear effect on TPR, application of NE increased it and α-adrenergic blockade with prazosin decreased TPR [26]. The elevated TPR observed in the 144H group of the present study may provide an explanation for the mild increase in LVSP in this group. In this context, we would assume that the lower LVSP in the 144N group could be a result of the reduced TPR of these animals. The decreased HR and CI of the 144H animals suggest that the pump function of the hypoxic LV is really impaired, and the elevated TPR has contributed to this dysfunction.
4.3. Effects of Prolonged Hypoxia on the RV Function and the Lungs
In contrast to the LV, RV function was not reduced under prolonged hypoxia but even mildly improved. Of note, markers of nitrosative stress, ATP deficiency and apoptosis were increased in the RV after 72 h of hypoxia to about the same extent as in the LV [28]. We assume that these injuries have almost no measurable impact on RV function, as the work of the RV is about 5-6 times lower than that of the LV. The compromised LV pump function causes a backlog into the pulmonary vascular bed. The RV overcomes this increased afterload by generating a higher systolic pressure, but the compromised ability of the LV to forward the blood from the pulmonary circulation promotes blood congestion in the lungs and formation of a hydrostatic edema.
The pathogenesis of the most typical form of hypoxia-induced PE, the high-altitude PE (HAPE), is based on elevated pulmonary capillary pressure due to an uneven distribution in hypoxic pulmonary vasoconstriction [7]. A mismatch in the pump function of RV and LV may further increase the hydrostatic pressure in pulmonary capillaries. Moreover, formation of HAPE is accompanied by inflammatory processes [57,58], which are considered not to be the cause of HAPE but to maintain and aggravate the edema [59]. Our results confirm this view by demonstrating that PE and the expression of the proinflammatory cytokine TNFα develop at least partly independently of each other. While the PEI remains relatively stable between three and six days of hypoxia, TNFα expression further increases during this period indicating persistent inflammation. The elevated pulmonary capillary pressure, which is enhanced by the pumping mismatch between RV and LV, may cause capillary wall stress [10,11]. This is reflected in the high protein concentration of the pleural fluid (PF). Normally, PF is a transudate, which means, it only contains little protein. A high protein concentration in PF (more than 50% of the serum protein concentration) as observed in the present study, points toward a damage to the capillary walls [32,33]. The concomitant inflammation additionally aggravates the injury, thus impeding resolution of the edema. However, the fluid had not yet entered the alveoli, as confirmed by histology and the low protein concentration in the BAL fluid.
Fluid filtration into the pleural space is an important mechanism for draining excess fluid in the pulmonary interstitium [60,61]. Increased formation of PF might have limited the aggravation of PE. This may explain why the PE was mainly confined to the pulmonary interstitium and did not invade alveoli as reflected in the histological image and in the W/D ratios below 6 in all groups [62]. However, transudation into the pleural space is a limited counter mechanism as indicated by the unabated persistence of PE and the significantly increased relative lung weight after 6 days of hypoxia. The PE is supposed to impede the alveolar gas exchange. Consequently, the metabolic acidosis cannot be effectively compensated for by increased ventilation or may even be aggravated by a respiratory component.
Another counter mechanism to reduce the fluid load to the lungs under hypoxic conditions is the reduction of plasma volume. A reduced plasma volume means a reduced load for the heart, thus improving oxygen delivery to the tissues and organs. Both humans and rats increase their urine excretion upon exposure to hypoxia [5,6,63]. Moreover, we observed that the hypoxic rats drank significantly less than the normoxic ones. Decreased fluid intake additionally contributed to the reduction of plasma volume, thus counteracting the formation of PE. The animals in the 72H group showed an elevated protein concentration in serum indicating a relative hypovolemia. In contrast, the serum protein concentration in animals with 144 h of experiment duration was significantly lower suggesting that the fluid management in these animals might have been impaired, probably due to the prolonged NaCl infusion. From humans it has been reported that people developing high altitude diseases presented an increase in total body water accompanied by a reduction in total water loss [64]. In a previous rat study, we had observed that PE and inflammation regressed by seven days of hypoxia exposure. However, these animals did not receive infusion [30]. A relative fluid overload due to prolonged infusion over 6 days would impede the resolution of PE in these animals and might explain the PE persistence, particularly in the hypoxic ones.
4.4. Limitations of the Study
Our experimental equipment did not allow for measurement of urine excretion, which is a major limitation to this study as it would indicate possible impairments in the fluid balance. Future studies should include metabolic cages allowing determination of the urine excretion rate in addition to the measurement of fluid intake. Those studies might be supplemented by measurements of hormones involved in the regulation of fluid balance, such as the renin-angiotensin system, which is known to be activated under hypoxia [65].
Further, echocardiographic examinations would provide a more detailed assessment of cardiac function in normoxia and hypoxia as well. In particular, it would allow measuring of the LV myocardial twist to detect contractile impairments that cannot be assessed in terms of pressures and volumes in the cardiac ventricles.
5. Conclusions and Future Prospects
Despite detectable signs of hypoxic acclimatization such as increased cHb, sustained hypoxia induced a further reduction in LV function. Although LV systolic pressure and contractility suggest an apparent improvement, HR, diastolic parameters such as LV edP, and cardiac output indicate that LV function deteriorated with increasing duration of exposure to hypoxia. As RV function was not reduced by hypoxia, a pumping mismatch between the ventricles resulted that may have maintained and aggravated PE. The additional inflammation in the lungs may finally have led to capillary wall stress as suggested by a protein-rich PF. These findings have implications for humans in hypoxic situations such as travelers to high altitude or patients suffering from generalized hypoxia suggesting that hypoxia-induced cardiopulmonary malfunction requires rapid termination of the hypoxic condition.
Future studies investigating the myocardial injuries induced by hypoxia on a cellular level have to be done. These analyses should focus on markers of oxidative and nitrosative stress and of impaired energy metabolism as well as on markers of apoptosis in both ventricles of animals exposed to hypoxia over six days. Such damage to the myocardial cells is assumed to be the main reason for the depression of the LV in hypoxia. In addition, similar markers should be detected in the lungs of these animals to explain the hypoxia-induced pulmonary injury in more detail.
Author Contributions
Conceptualization, A.S. and B.R.; methodology, C.B., S.D., J.K., C.R., A.S., and B.R.; formal analysis, C.B., S.D., J.K., C.R., A.S., and B.R.; investigation, C.B., S.D., J.K., C.R., B.R., and A.S.; writing—original draft preparation, B.R., C.B., S.D., and A.S.; writing—review and editing, B.R., C.R. and A.S.; visualization, B.R., C.B., S.D.; supervision, A.S. and B.R. All authors have read and agreed to the published version of this manuscript.
Funding
This research received no external funding.
Institutional Review Board Statement
The study was conducted in accordance with the Declaration of Helsinki, and approved by the state agency (Landesdirektion Sachsen, number and date of approval: TVV 46/18; 17 December 2018).
Informed Consent Statement
Not applicable as the study did not involve humans.
Data Availability Statement
Data are available on request from the corresponding author.
Acknowledgments
We gratefully appreciate the provision of the blood gas analyzer ABL800 BASIC by the Medical Experimental Center of the Leipzig University. We acknowledge support from the German Research Foundation (DPG) and Leipzig University within the program of open access publishing.
Conflicts of Interest
The authors declare no conflict of interest.
References
- Weir, E.K.; Archer, S.L. The mechanism of acute hypoxic pulmonary vasoconstriction: the tale of two channels. FASEB J. 1995, 9, 183-189. [CrossRef]
- Xie, A.; Skatrud, J.B.; Puleo, D.S.; Morgan, B.J. Exposure to hypoxia produces long-lasting sympathetic activation in humans. J. Appl. Physiol. 2001, 91, 1555-1562. [CrossRef]
- Williams, A.M; Levine, B.D.; Stembridge, M. A change of heart: Mechanisms of cardiac adaptation to acute and chronic hypoxia. J. Physiol. 2022, 600, 4089-4104. [CrossRef]
- Watts, D.; Gaete, D.; Rodriguez, D.; Hoogewijs, D.; Rauner, M.; Sormendi, S.; Wielockx, B. Hypoxia Pathway Proteins are Master Regulators of Erythropoiesis. Int. J. Mol. Sci. 2020, 21, 8131. [CrossRef]
- Hildebrandt, W.; Ottenbacher, A.; Schuster, M.; Swenson, E.R.; Bärtsch, P. Diuretic effect of hypoxia, hypocapnia, and hyperpnea in humans: relation to hormones and O(2) chemosensitivity. J. Appl. Physiol. 2000, 88, 599-610. [CrossRef]
- Haditsch, B.; Roessler, A.; Krisper, P.; Frisch, H.; Hinghofer-Szalkay, H.G.; Goswami, N. Volume regulation and renal function at high altitude across gender. PLoS One 2015, 10, e0118730. [CrossRef]
- Bärtsch, P.; Mairbäurl, H.; Maggiorini, M.; Swenson, E.R. Physiological aspects of high-altitude pulmonary edema. J. Appl. Physiol. 2005, 98, 1101-1110. [CrossRef]
- Rassler, B.; Reissig, C.; Briest, W.; Tannapfel, A.; Zimmer H.G. Catecholamine-induced pulmonary edema and pleural effusion in rats--alpha- and beta-adrenergic effects. Respir. Physiol. Neurobiol. 2003, 135, 25-37. [CrossRef]
- Šedý. J.; Zicha, J.; Kunes, J.; Jendelová, P.; Syková, E. Mechanisms of neurogenic pulmonary edema development. Physiol. Res. 2008, 57, 499-506. [CrossRef]
- West, J.B.; Mathieu-Costello, O. Structure, strength, failure, and remodeling of the pulmonary blood-gas barrier. Annu. Rev. Physiol. 1999, 61, 543-572. [CrossRef]
- West, J.B. Invited review: pulmonary capillary stress failure. J. Appl. Physiol. 2000, 89, 2483-2489. [CrossRef]
- Talbot, N.P.; Balanos, G.M.; Dorrington, K.L.; Robbins, P.A. Two temporal components within the human pulmonary vascular response to approximately 2 h of isocapnic hypoxia. J. Appl. Physiol. 2005, 98, 1125-1139. [CrossRef]
- Bärtsch, P.; Gibbs, J.S. Effect of altitude on the heart and the lungs. Circulation 2007, 116, 2191-2202. [CrossRef]
- Yan, B.; Hu, Y.; Ji, H.; Bao, D. The effect of acute hypoxia on left ventricular function during exercise. Eur. J. Appl. Physiol. 2007, 100, 261-265. [CrossRef]
- Maufrais, C.; Rupp, T.; Bouzat, P.; Doucende, G.; Verges, S.; Nottin, S.; Walther, G. Heart mechanics at high altitude: 6 days on the top of Europe. Eur. Heart J. Cardiovasc. Imaging 2017, 18, 1369-1377. [CrossRef]
- Stembridge, M,; Ainslie, P.N.; Hughes, M.G.; Stöhr, E.J.; Cotter, J.D.; Nio, A.Q.; Shave, R. Ventricular structure, function, and mechanics at high altitude: chronic remodeling in Sherpa vs. short-term lowlander adaptation. J. Appl. Physiol. 2014, 117, 334-343. [CrossRef]
- Osculati, G.; Revera, M.; Branzi, G.; Faini, A.; Malfatto, G.; Bilo, G.; Giuliano, A.; Gregorini, F.; Ciambellotti, F.; Lombardi, C.; Agostoni, P.; Mancia, G.; Parati, G. Effects of hypobaric hypoxia exposure at high altitude on left ventricular twist in healthy subjects: data from HIGHCARE study on Mount Everest. Eur. Heart J. Cardiovasc. Imaging 2016, 17, 635-643. [CrossRef]
- Leuenberger, U.; Gleeson, K.; Wroblewski, K.; Prophet, S.; Zelis, R.; Zwillich, C.; Sinoway, L. Norepinephrine clearance is increased during acute hypoxemia in humans. Am. J. Physiol. 1991, 261, H1659-1664. [CrossRef]
- Kulandavelu, S.; Balkan, W.; Hare, J.M. Regulation of oxygen delivery to the body via hypoxic vasodilation. Proc. Natl. Acad. Sci. U S A 2015, 112, 6254-6255. [CrossRef]
- Dinenno, F.A. Skeletal muscle vasodilation during systemic hypoxia in humans. J. Appl. Physiol. 2016, 120, 216-225. [CrossRef]
- Walley, K.R.; Becker, C.J.; Hogan, R.A.; Teplinsky, K.; Wood, L.D. Progressive hypoxemia limits left ventricular oxygen consumption and contractility. Circ. Res. 1988, 63, 849-859. [CrossRef]
- Holloway, C.; Cochlin, L.; Codreanu, I.; Bloch, E.; Fatemian, M.; Szmigielski, C.; Atherton, H.; Heather, L.; Francis, J.; Neubauer, S.; Robbins, P.; Montgomery, H.; Clarke, K. Normobaric hypoxia impairs human cardiac energetics. FASEB J. 2011, 25, 3130-3135. [CrossRef]
- Ashmore, T.; Fernandez, B.O.; Branco-Price, C.; West, J.A.; Cowburn, A.S.; Heather, L.C.; Griffin, J.L.; Johnson, R.S.; Feelisch, M.; Murray, A.J. Dietary nitrate increases arginine availability and protects mitochondrial complex I and energetics in the hypoxic rat heart. J. Physiol. 2014, 592, 4715-4731. [CrossRef]
- Zhou, W.; Benharash, P.; Ho, J.; Ko, Y.; Patel, N.A.; Mahajan, A. Left ventricular twist and untwist rate provide reliable measures of ventricular function in myocardial ischemia and a wide range of hemodynamic states. Physiol. Rep. 2013, 1, e00110. [CrossRef]
- Kuwahira, I.; Heisler, N.; Piiper, J.; Gonzalez, N.C. Effect of chronic hypoxia on hemodynamics, organ blood flow and O2 supply in rats. Respir. Physiol. 1993, 92, 227-238. [CrossRef]
- Bölter, C.; Gabriel, P.; Appelt, P.; Salameh, A.; Schierle, K.; Rassler, B. Effects of Adrenergic Agonists and Antagonists on Cardiopulmonary Function During Normobaric Hypoxia in Rat. Front. Physiol. 2019, 10, 860. [CrossRef]
- Kowalleck, U.; Ahmed, M.A.A.; Koedel, J.; Schierle, K.; Salameh, A.; Rassler, B. Relaxin does not prevent development of hypoxia-induced pulmonary edema in rats. Pflugers Arch. 2022, 474, 1053-1067. [CrossRef]
- Neubert, E.; Rassler, B.; Hoschke, A.; Raffort, C.; Salameh, A. Effects of Normobaric Hypoxia and Adrenergic Blockade over 72 h on Cardiac Function in Rats. Int. J. Mol. Sci. 2023, 24, 11417. [CrossRef]
- Riha, I.; Salameh, A.; Hoschke, A.; Raffort, C.; Koedel, J., Rassler, B. Hypoxia-Induced Pulmonary Injury-Adrenergic Blockade Attenuates Nitrosative Stress, and Proinflammatory Cytokines but Not Pulmonary Edema. J. Cardiovasc. Dev. Dis. 2024, 11, 195. [CrossRef]
- Rassler, B.; Marx, G.; Reissig, C.; Rohling, M.A.; Tannapfel, A.; Wenger, R.H.; Zimmer, H.G. Time course of hypoxia-induced lung injury in rats. Respir. Physiol. Neurobiol. 2007, 159, 45-54. [CrossRef]
- Abramoff, M.D.; Magalhaes, P.J.; Ram, S.J. Image processing with ImageJ. Biophotonics Int. 2004, 11, 36-42.
- Light, R.W.; Macgregor, M.I.; Luchsinger, P.C.; Ball, W.C. Jr. Pleural effusions: the diagnostic separation of transudates and exudates. Ann. Intern. Med. 1972, 77, 507-513. [CrossRef]
- Ferreiro, L.; Toubes, M.E.; Suárez-Antelo, J.; Rodríguez-Núñez, N.; Valdés, L. Clinical overview of the physiology and pathophysiology of pleural fluid movement: a narrative review. ERJ Open Res. 2024, 10, 00050-2024. [CrossRef]
- Jones, R.M.; Terhaard, C.; Zullo, J.; Tenney, S.M. Mechanism of reduced water intake in rats at high altitude. Am. J. Physiol. 1981, 240, R187-191. [CrossRef]
- Rose, M.S.; Houston, C.S.; Fulco, C.S.; Coates, G.; Sutton, J.R.; Cymerman, A. Operation Everest. II: Nutrition and body composition. J. Appl. Physiol. 1988, 65, 2545-2551. [CrossRef]
- Westerterp, K.R.; Meijer, E.P.; Rubbens, M.; Robach, P.; Richalet, J.P. Operation Everest III: energy and water balance. Pflugers Arch. 2000, 439, 483-488. [CrossRef]
- Semenza, G.L. Hypoxia-inducible factors in physiology and medicine. Cell 2012, 148, 399-408. [CrossRef]
- Semenza, G.L. Oxygen sensing, homeostasis, and disease. N. Engl. J. Med. 2011, 365, 537-547. [CrossRef]
- Goda N, Kanai M. Hypoxia-inducible factors and their roles in energy metabolism. Int J Hematol. 2012 May;95(5):457-63. [CrossRef]
- Flood, D.; Lee, E.S.; Taylor, C.T. Intracellular energy production and distribution in hypoxia. J. Biol. Chem. 2023, 299, 105103. [CrossRef]
- Swenson, E.R. The many acid-base manifestations and consequences of hypoxia. Curr. Opin. Physiol. 2019, 7, 72-81. [CrossRef]
- Paterson, D.J.; Estavillo, J.A.; Nye, P.C. The effect of hypoxia on plasma potassium concentration and the excitation of arterial chemoreceptors in the cat. Q. J. Exp. Physiol. 1988, 73, 623-625. [CrossRef]
- Adrogué, H.J.; Madias, N.E. Changes in plasma potassium concentration during acute acid-base disturbances. Am. J. Med. 1981, 71, 456-467. [CrossRef]
- Blank, W.F. Jr.; Kirshner, H.S. The kinetics of extracellular potassium changes during hypoxia and anoxia in the cat cerebral cortex. Brain Res. 1977, 123, 113-124. [CrossRef]
- Aronson, P.S.; Giebisch, G. Effects of pH on potassium: new explanations for old observations. J. Am. Soc. Nephrol. 2011, 22, 1981-1989. [CrossRef]
- Kodama, I.; Wilde, A.; Janse, M.J.; Durrer, D.; Yamada, K. Combined effects of hypoxia, hyperkalemia and acidosis on membrane action potential and excitability of guinea-pig ventricular muscle. J. Mol. Cell Cardiol. 1984, 16, 247-259. [CrossRef]
- Weiss, J.N.; Qu, Z.; Shivkumar, K. Electrophysiology of Hypokalemia and Hyperkalemia. Circ. Arrhythm. Electrophysiol. 2017, 10, e004667. [CrossRef]
- Rumsey, W.L.; Abbott, B.; Bertelsen, D.; Mallamaci, M.; Hagan, K.; Nelson, D.; Erecinska, M. Adaptation to hypoxia alters energy metabolism in rat heart. Am. J. Physiol. 1999, 276, H71-80. [CrossRef]
- Heather, L.C.; Cole, M.A.; Tan, J.J.; Ambrose, L.J.; Pope, S.; Abd-Jamil, A.H.; Carter, E.E.; Dodd, M.S.; Yeoh, K.K.; Schofield, C.J.; Clarke, K. Metabolic adaptation to chronic hypoxia in cardiac mitochondria. Basic Res. Cardiol. 2012, 107, 268. [CrossRef]
- Essop, M.F.; Razeghi, P.; McLeod, C.; Young, M.E.; Taegtmeyer, H.; Sack, M.N. Hypoxia-induced decrease of UCP3 gene expression in rat heart parallels metabolic gene switching but fails to affect mitochondrial respiratory coupling. Biochem. Biophys. Res. Commun. 2004, 314, 561-564. [CrossRef]
- Su, Z.; Liu, Y.; Zhang, H. Adaptive Cardiac Metabolism Under Chronic Hypoxia: Mechanism and Clinical Implications. Front. Cell. Dev. Biol. 2021, 9, 625524. [CrossRef]
- Coimbra-Costa, D.; Alva, N.; Duran, M.; Carbonell, T.; Rama, R. Oxidative stress and apoptosis after acute respiratory hypoxia and reoxygenation in rat brain. Redox Biol. 2017, 12, 216-225. [CrossRef]
- Yaribeygi, H.; Sathyapalan, T.; Atkin, S.L.; Sahebkar, A. Molecular Mechanisms Linking Oxidative Stress and Diabetes Mellitus. Oxid. Med. Cell Longev. 2020, 2020, 8609213. [CrossRef]
- Tsuyama, T.; Sato, Y.; Yoshizawa, T.; Matsuoka, T.; Yamagata, K. Hypoxia causes pancreatic ?-cell dysfunction and impairs insulin secretion by activating the transcriptional repressor BHLHE40. EMBO Rep. 2023, 24, e56227. [CrossRef]
- Nisbet, A.M.; Burton, F.L.; Walker, N.L.; Craig, M.A.; Cheng, H.; Hancox, J.C.; Orchard, C.H.; Smith, G.L. Acidosis slows electrical conduction through the atrio-ventricular node. Front. Physiol. 2014, 5, 233. [CrossRef]
- Tymko, M.M.; Lawley, J.S.; Ainslie, P.N.; Hansen, A.B.; Hofstaetter, F., Rainer, S.; Amin, S.; Moralez, G.; Gasho, C.; Vizcardo-Galindo, G.; Bermudez, D.; Villafuerte, F.C.; Hearon, C.M. Jr. Global Reach 2018 Heightened ?-Adrenergic Signaling Impairs Endothelial Function During Chronic Exposure to Hypobaric Hypoxia. Circ. Res. 2020, 127, e1-e13. [CrossRef]
- Kubo, K.; Hanaoka, M.; Hayano, T.; Miyahara, T.; Hachiya, T.; Hayasaka, M.; Koizumi, T.; Fujimoto, K.; Kobayashi, T.; Honda, T. Inflammatory cytokines in BAL fluid and pulmonary hemodynamics in high-altitude pulmonary edema. Respir. Physiol. 1998, 111, 301-310. [CrossRef]
- Madjdpour, C.; Jewell, U.R.; Kneller, S.; Ziegler, U.; Schwendener, R.; Booy, C.; Kläusli, L.; Pasch, T.; Schimmer, R.C.; Beck-Schimmer, B. Decreased alveolar oxygen induces lung inflammation. Am. J. Physiol. Lung Cell. Mol. Physiol. 2003, 284, L360-367. [CrossRef]
- Swenson, E.R.; Maggiorini, M.; Mongovin, S.; Gibbs, J.S.; Greve, I.; Mairbäurl, H.; Bärtsch, P. Pathogenesis of high-altitude pulmonary edema: inflammation is not an etiologic factor. JAMA 2002, 287, 2228-2235. [CrossRef]
- Wiener-Kronish, J.P.; Broaddus, V.C.; Albertine, K.H.; Gropper, M.A.; Matthay, M.A.; Staub, N.C. Relationship of pleural effusions to increased permeability pulmonary edema in anesthetized sheep. J. Clin. Invest. 1988, 82, 1422-1429. [CrossRef]
- Broaddus, V.C.; Wiener-Kronish, J.P.; Staub, N.C. Clearance of lung edema into the pleural space of volume-loaded anesthetized sheep. J. Appl. Physiol. 1990, 68, 2623-2630. [CrossRef]
- Negrini, D.; Passi, A.; de Luca, G.; Miserocchi, G. Pulmonary interstitial pressure and proteoglycans during development of pulmonary edema. Am. J. Physiol. 1996, 270, H2000-2007. [CrossRef]
- Jain, S.; Wilke, W.L.; Tucker, A. Age-dependent effects of chronic hypoxia on renin-angiotensin and urinary excretions. J. Appl. Physiol. 1990, 69, 141-146. [CrossRef]
- Westerterp, K.R.; Robach, P.; Wouters, L.; Richalet, J.P. Water balance and acute mountain sickness before and after arrival at high altitude of 4,350 m. J. Appl. Physiol. 1996, 80, 1968-1972. [CrossRef]
- Kong, W.; Liao, Y.; Zhao, L.; Hall, N.; Zhou, H.; Liu, R.; Persson, P.B.; Lai, E. Kidney Renin Release under Hypoxia and Its Potential Link with Nitric Oxide: A Narrative Review. Biomedicines 2023, 11, 2984. [CrossRef]
Figure 1.
A: Change in body weight (BW) [g]; B: Daily food intake [g]. Data are given as means ± SEM. N,
normoxic groups; H, hypoxic groups. Significant differences between groups are indicated by asterisks: ** p <
0.01; *** p < 0.001.
Figure 1.
A: Change in body weight (BW) [g]; B: Daily food intake [g]. Data are given as means ± SEM. N,
normoxic groups; H, hypoxic groups. Significant differences between groups are indicated by asterisks: ** p <
0.01; *** p < 0.001.
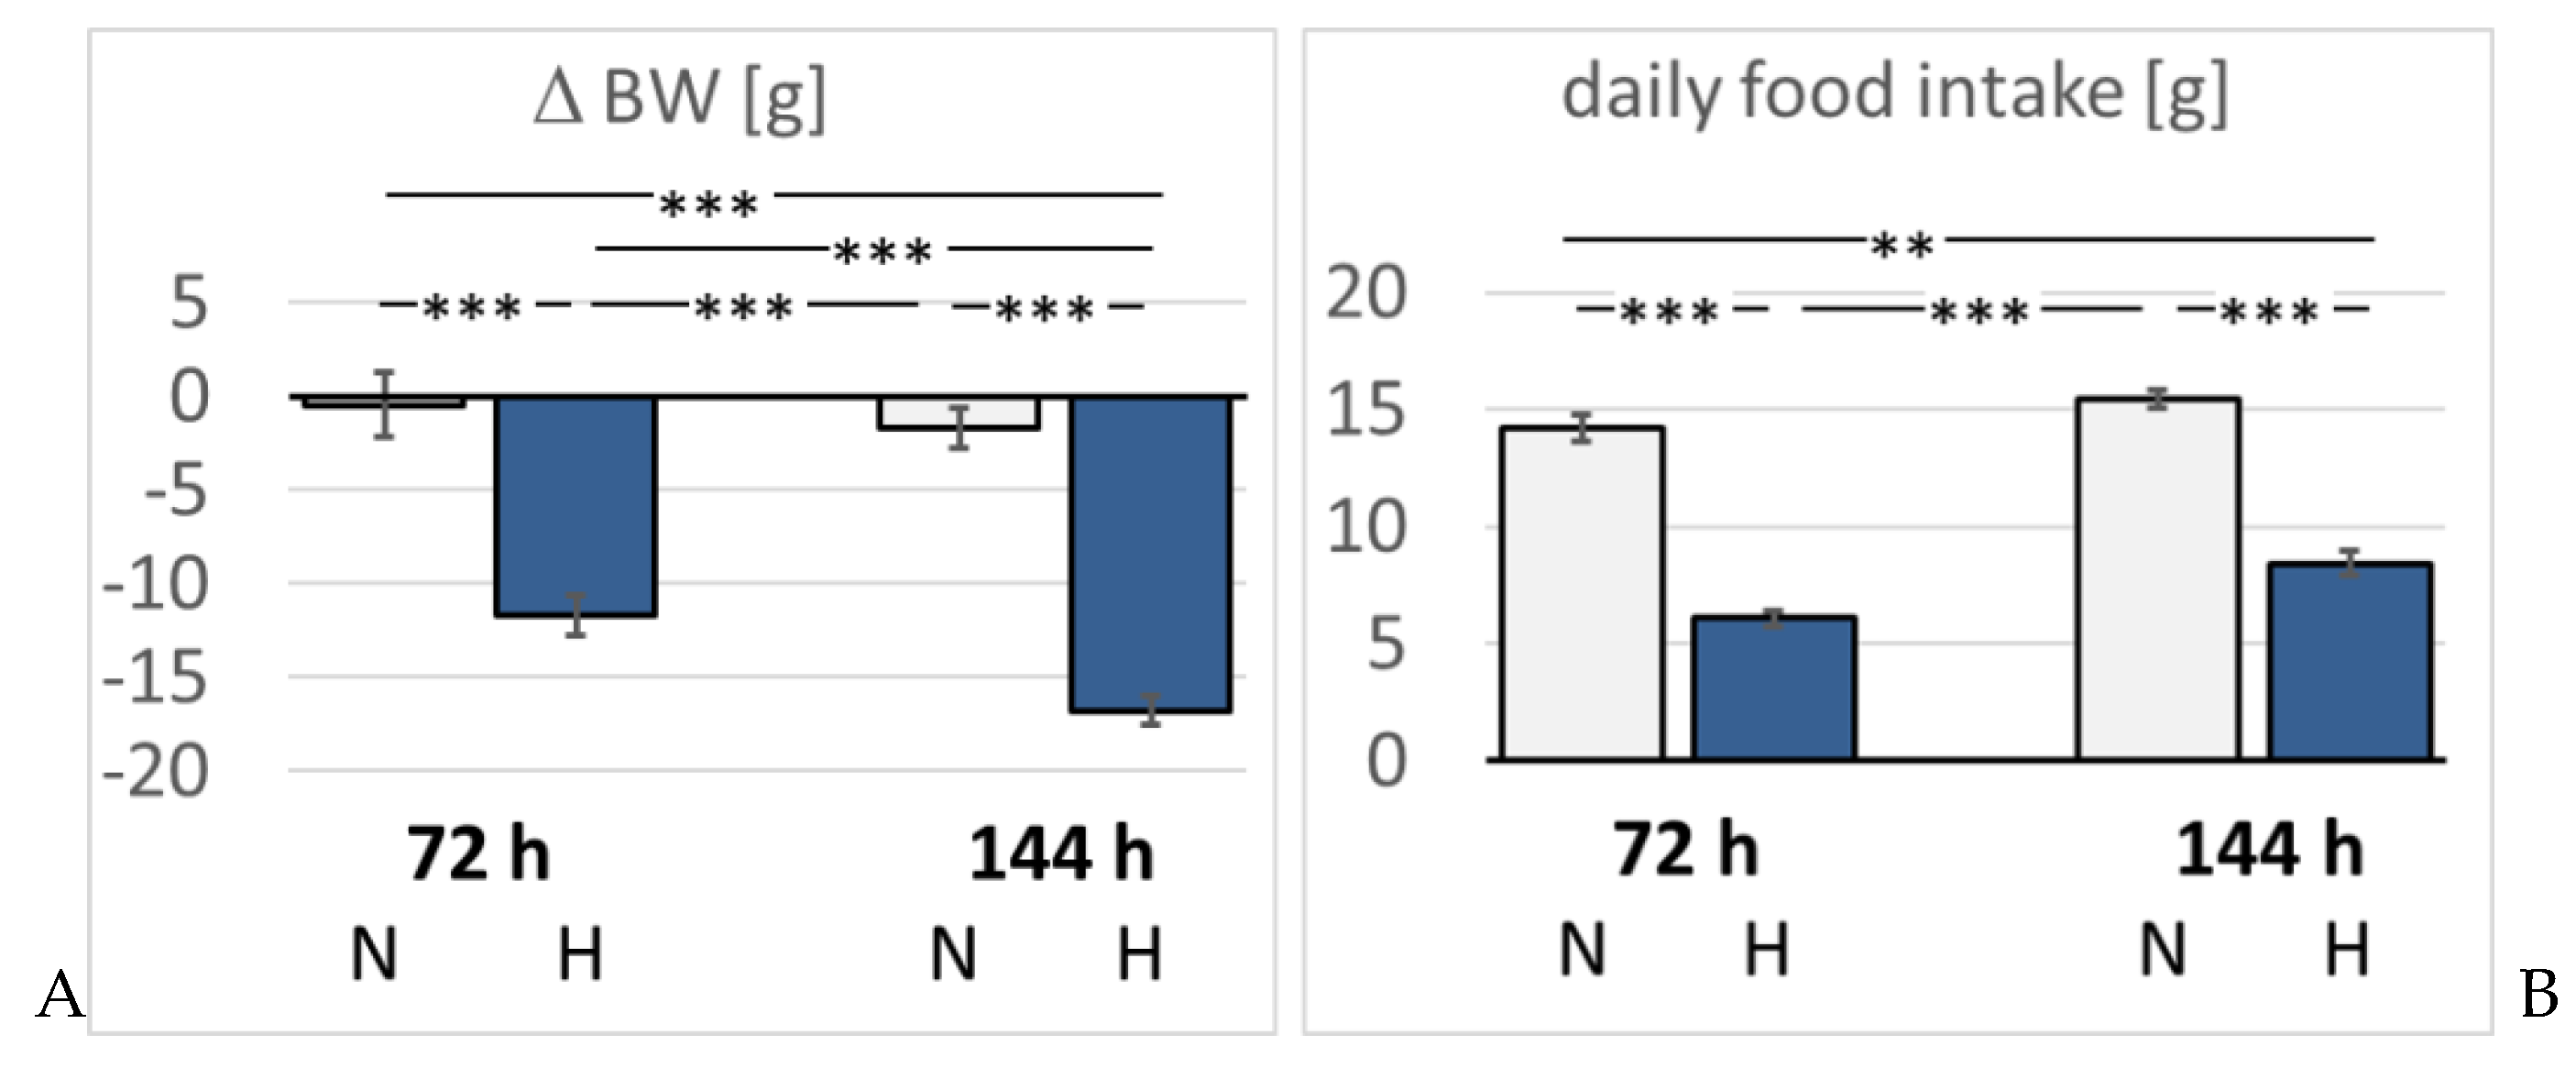
Figure 2.
A: Partial pressure of oxygen (pO2) [mmHg]; B: Arterial oxygen saturation (SaO2) [%]. C: pH. Data are given as means ± SEM. N, normoxic groups; H, hypoxic groups. Significant differences between groups are indicated by asterisks: * p < 0.05; *** p < 0.001.
Figure 2.
A: Partial pressure of oxygen (pO2) [mmHg]; B: Arterial oxygen saturation (SaO2) [%]. C: pH. Data are given as means ± SEM. N, normoxic groups; H, hypoxic groups. Significant differences between groups are indicated by asterisks: * p < 0.05; *** p < 0.001.
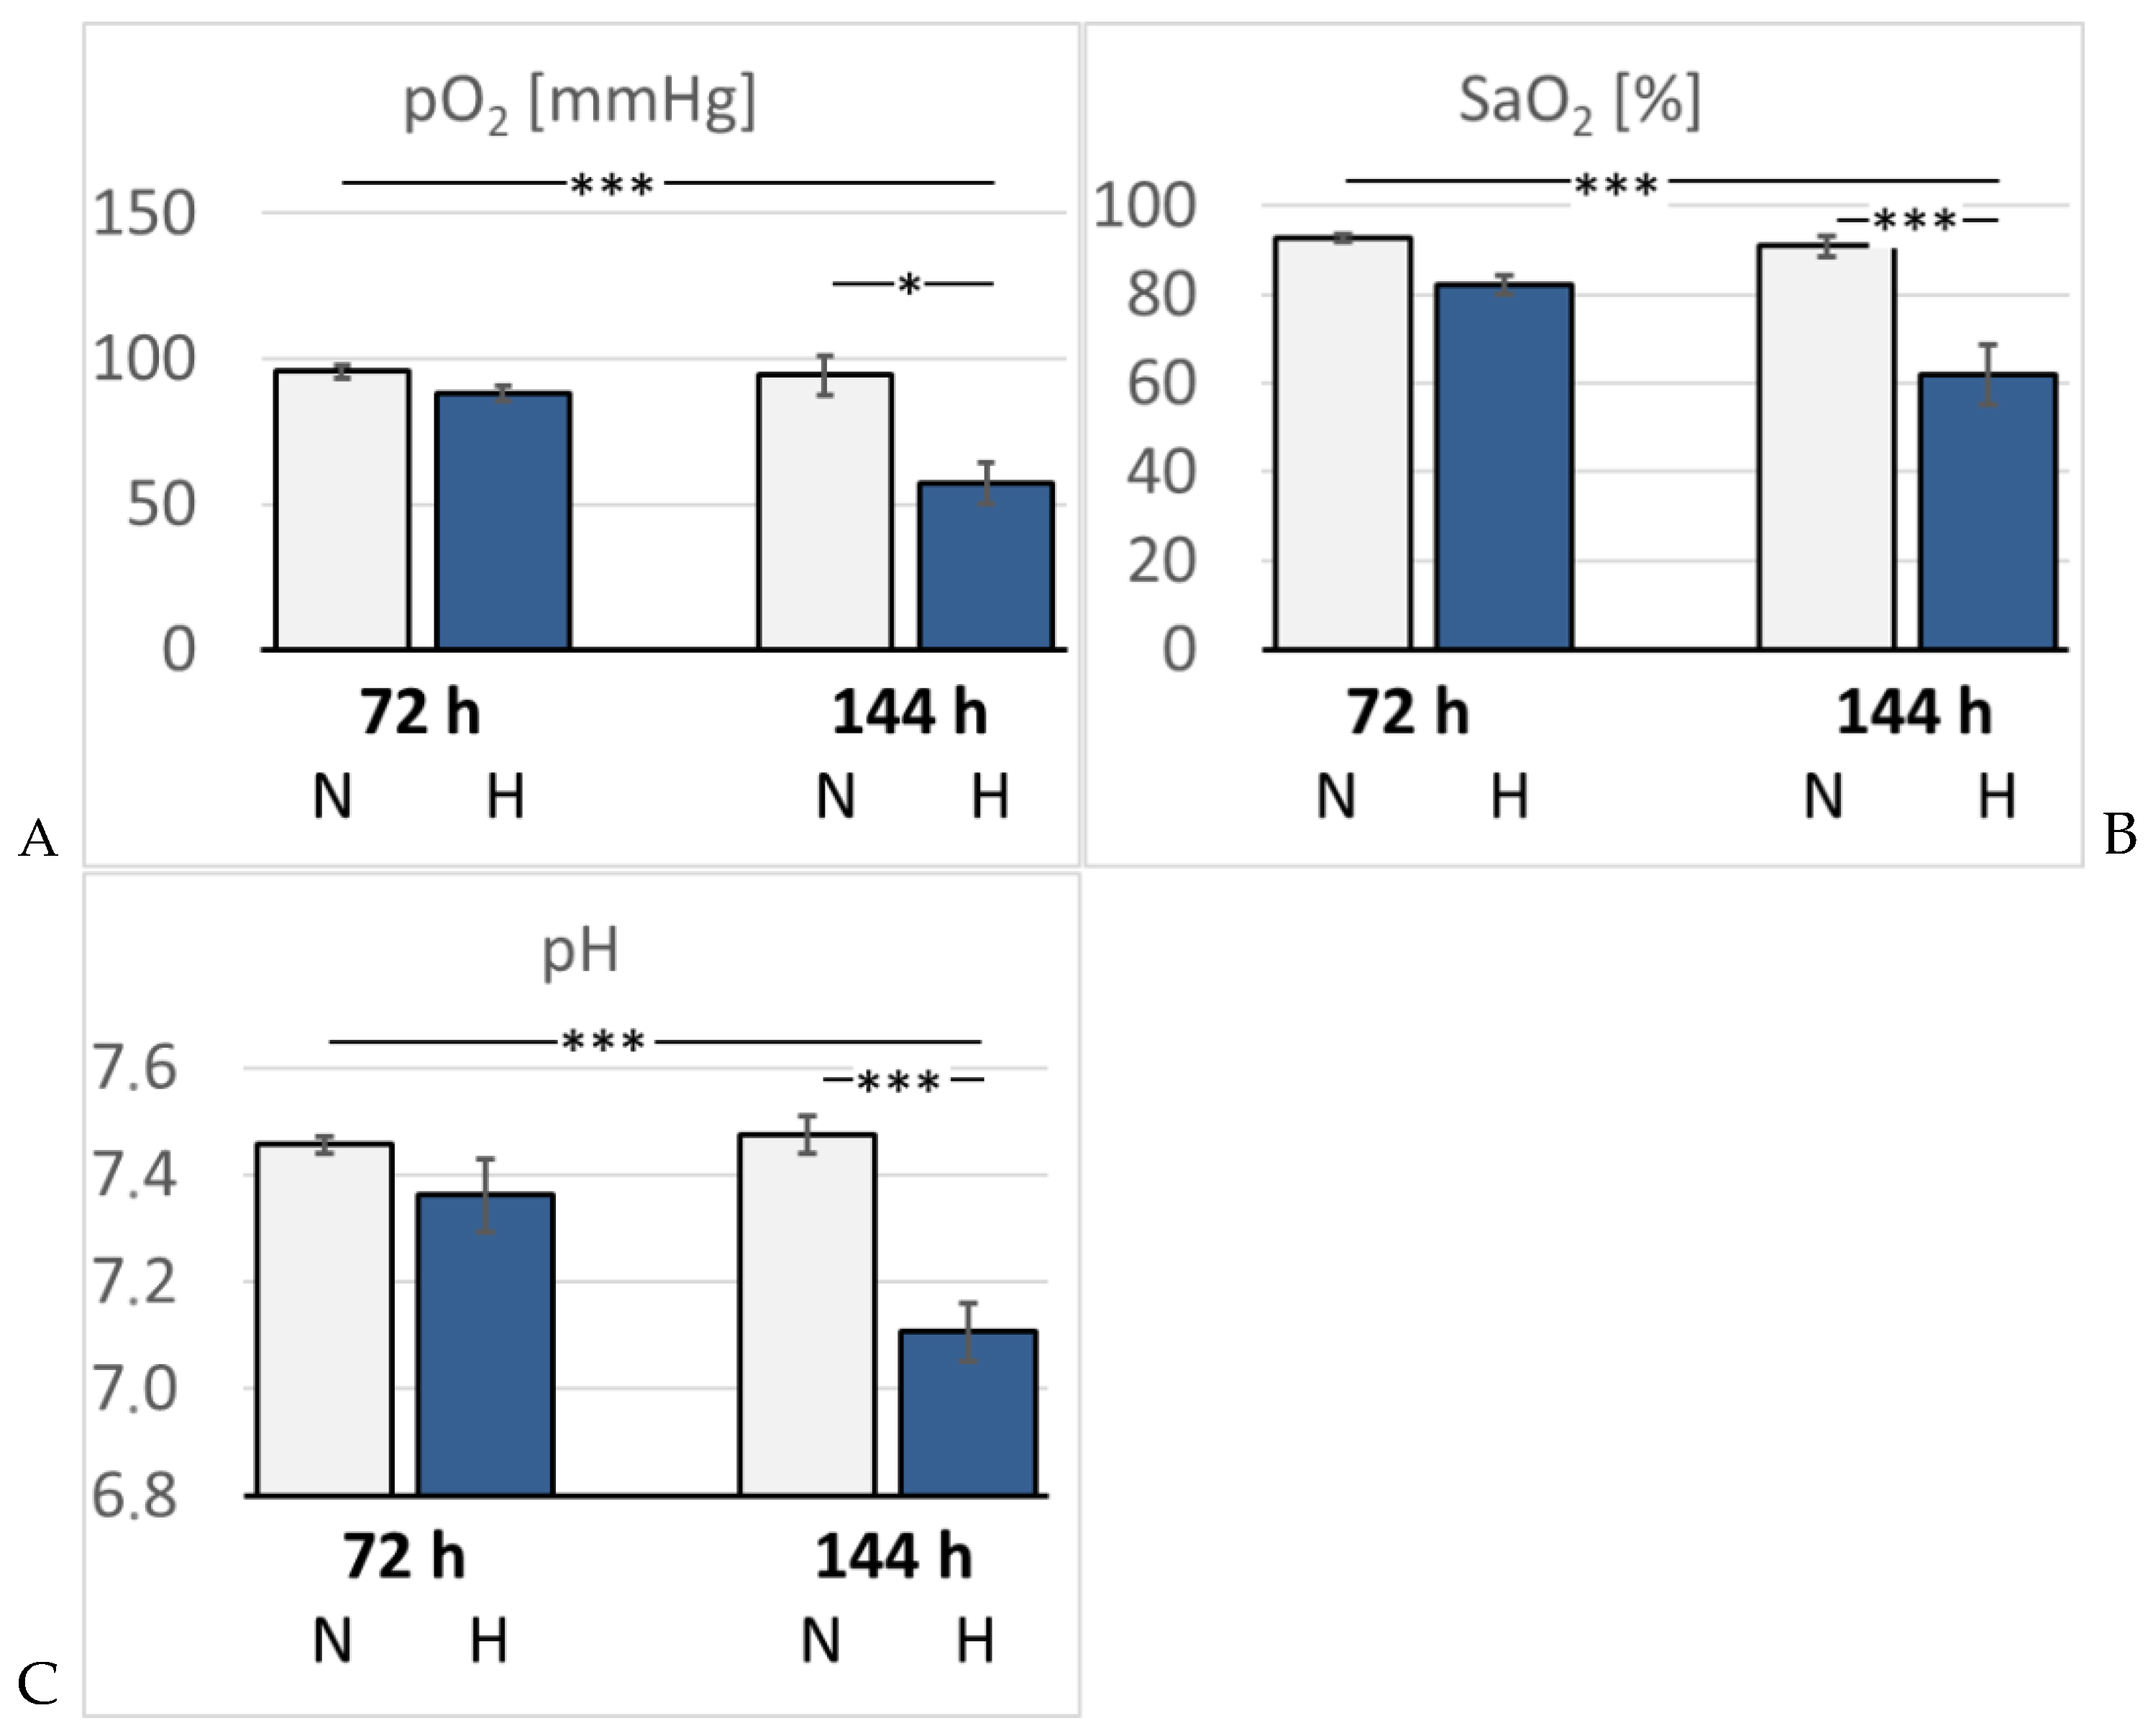
Figure 3.
A: Concentration of hemoglobin (cHb) [g/dL]; B: Hematocrit (Hct) [%]. Data are given as means ± SEM. N, normoxic groups; H, hypoxic groups. Significant differences between groups are indicated by asterisks: ** p < 0.01; *** p < 0.001.
Figure 3.
A: Concentration of hemoglobin (cHb) [g/dL]; B: Hematocrit (Hct) [%]. Data are given as means ± SEM. N, normoxic groups; H, hypoxic groups. Significant differences between groups are indicated by asterisks: ** p < 0.01; *** p < 0.001.
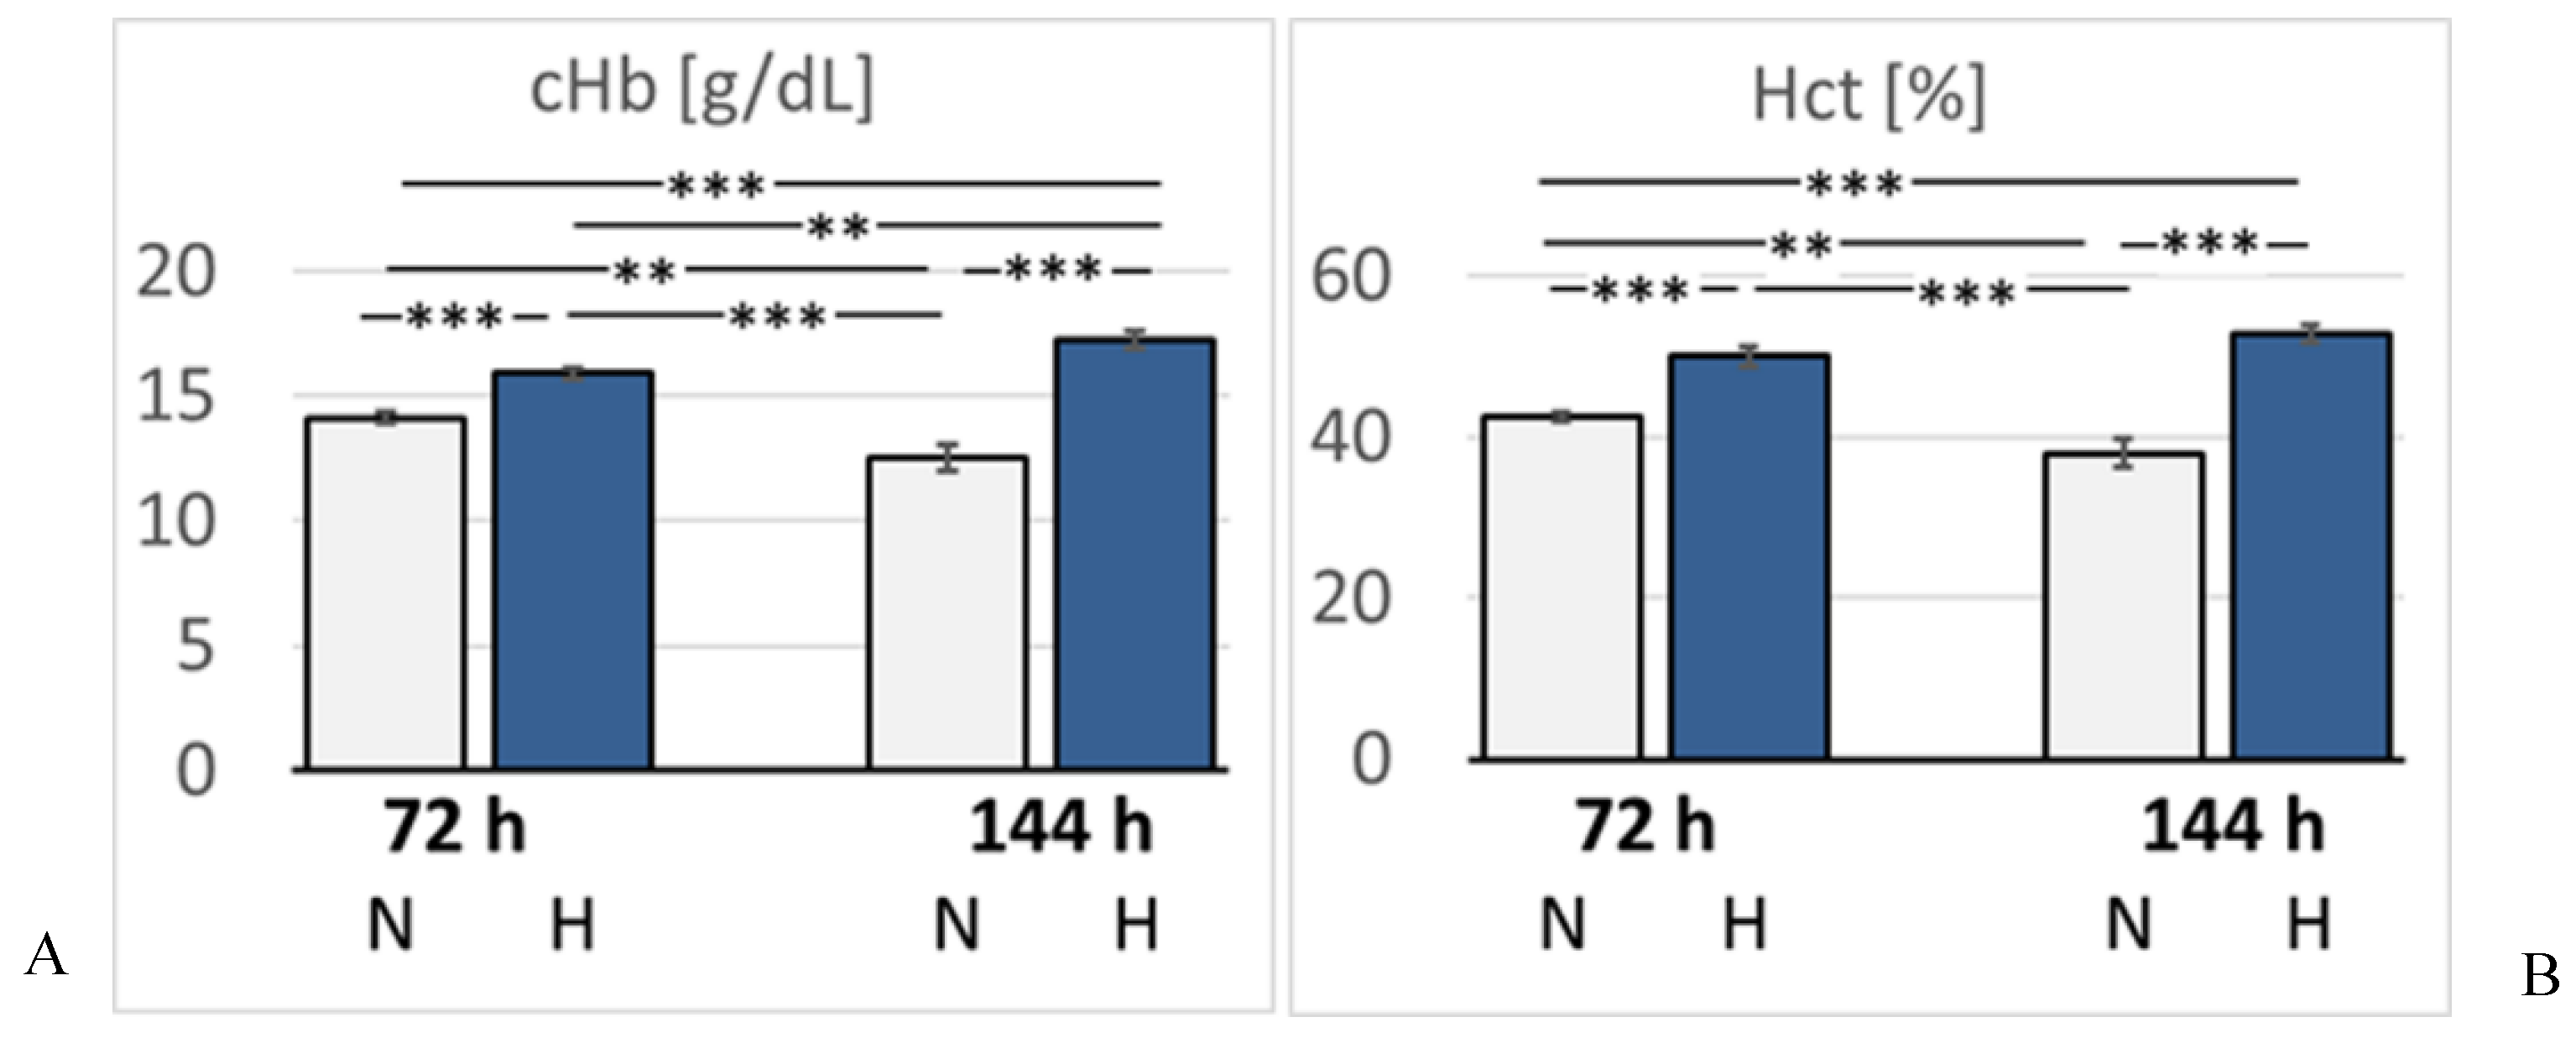
Figure 4.
A: Left ventricular systolic pressure (LVSP) [mmHg]; B: Right ventricular systolic pressure (RVSP) [mmHg]; C: Left ventricular enddiastolic pressure (LV edP) [mmHg]; D: Heart rate (HR) [min–1]; E: Cardiac index (CI) [ml min–1 kg–1]; F: Total peripheral resistance (TPR) [mmHg min kg ml–1]. Data are given as means ± SEM. N, normoxic groups; H, hypoxic groups. Significant differences between groups are indicated by asterisks: * p < 0.05; ** p < 0.01; *** p < 0.001 .
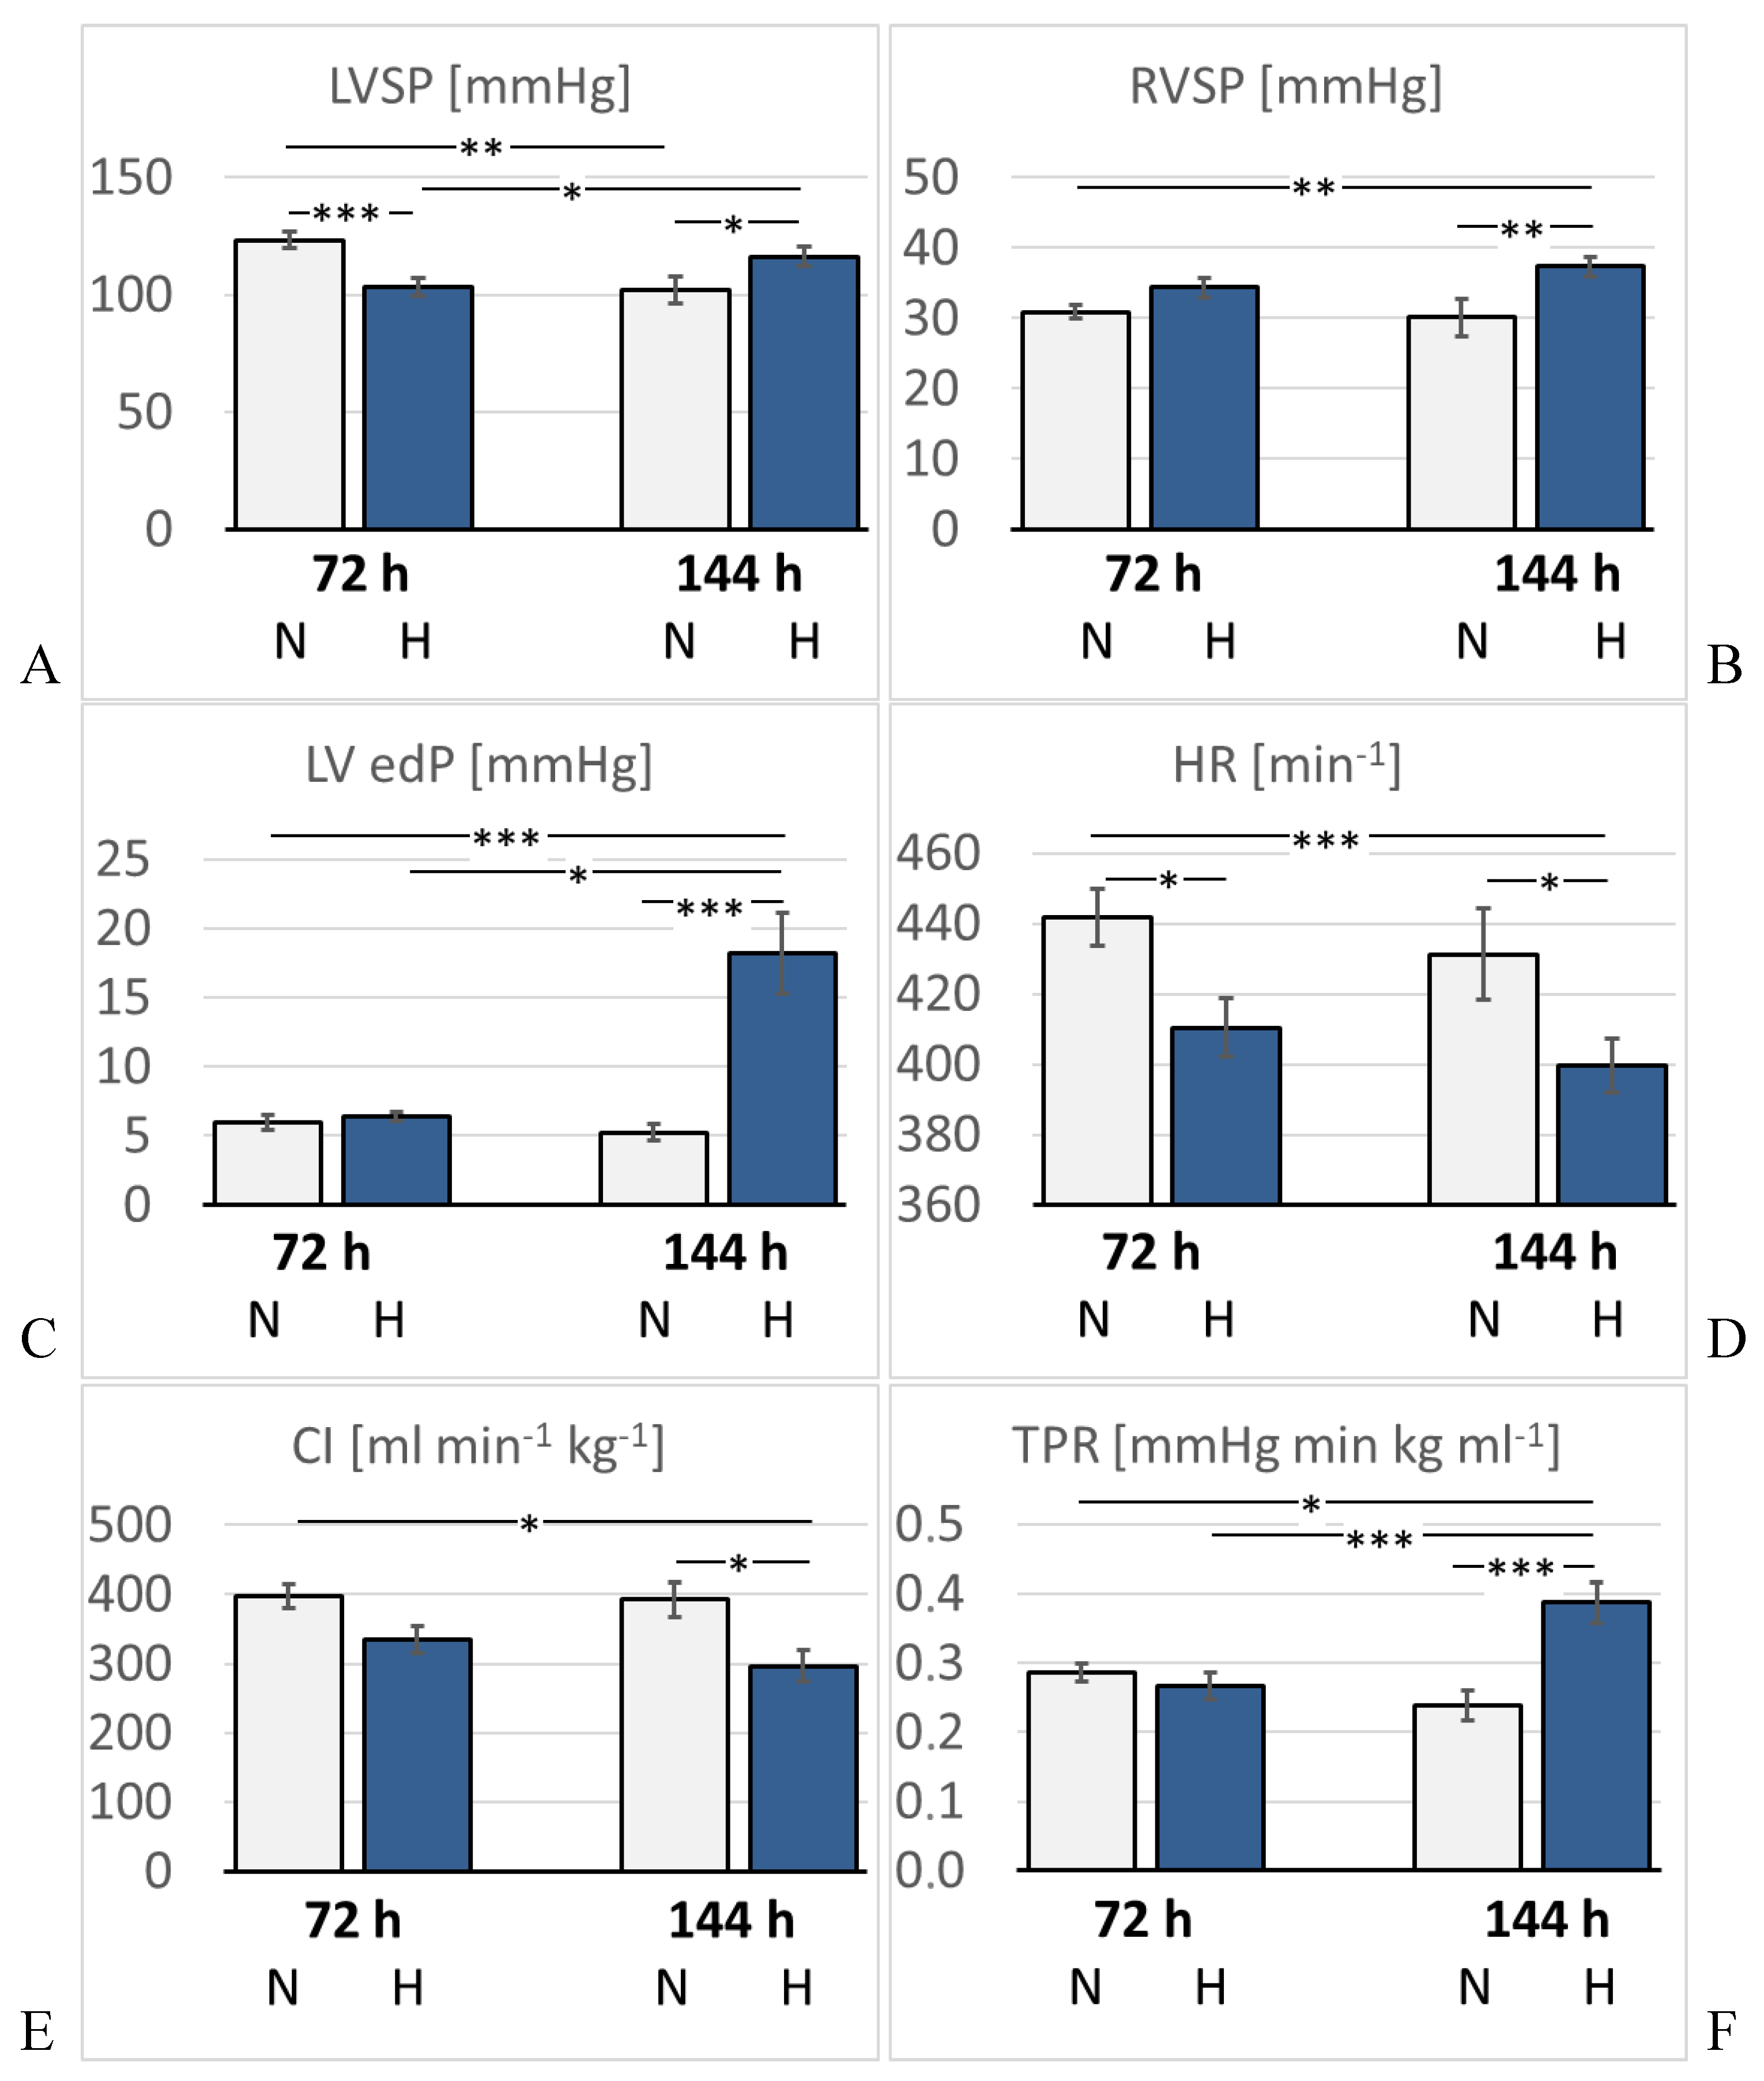
Figure 5.
Pulmonary edema. Representative histological images from: A: 72N; B: 72H; C: 144N; D: 144H; E: Pulmonary edema index (PEI) expressed in arbitrary units. Data are given as means ± SEM. N, normoxic groups; H, hypoxic groups.
Figure 5.
Pulmonary edema. Representative histological images from: A: 72N; B: 72H; C: 144N; D: 144H; E: Pulmonary edema index (PEI) expressed in arbitrary units. Data are given as means ± SEM. N, normoxic groups; H, hypoxic groups.
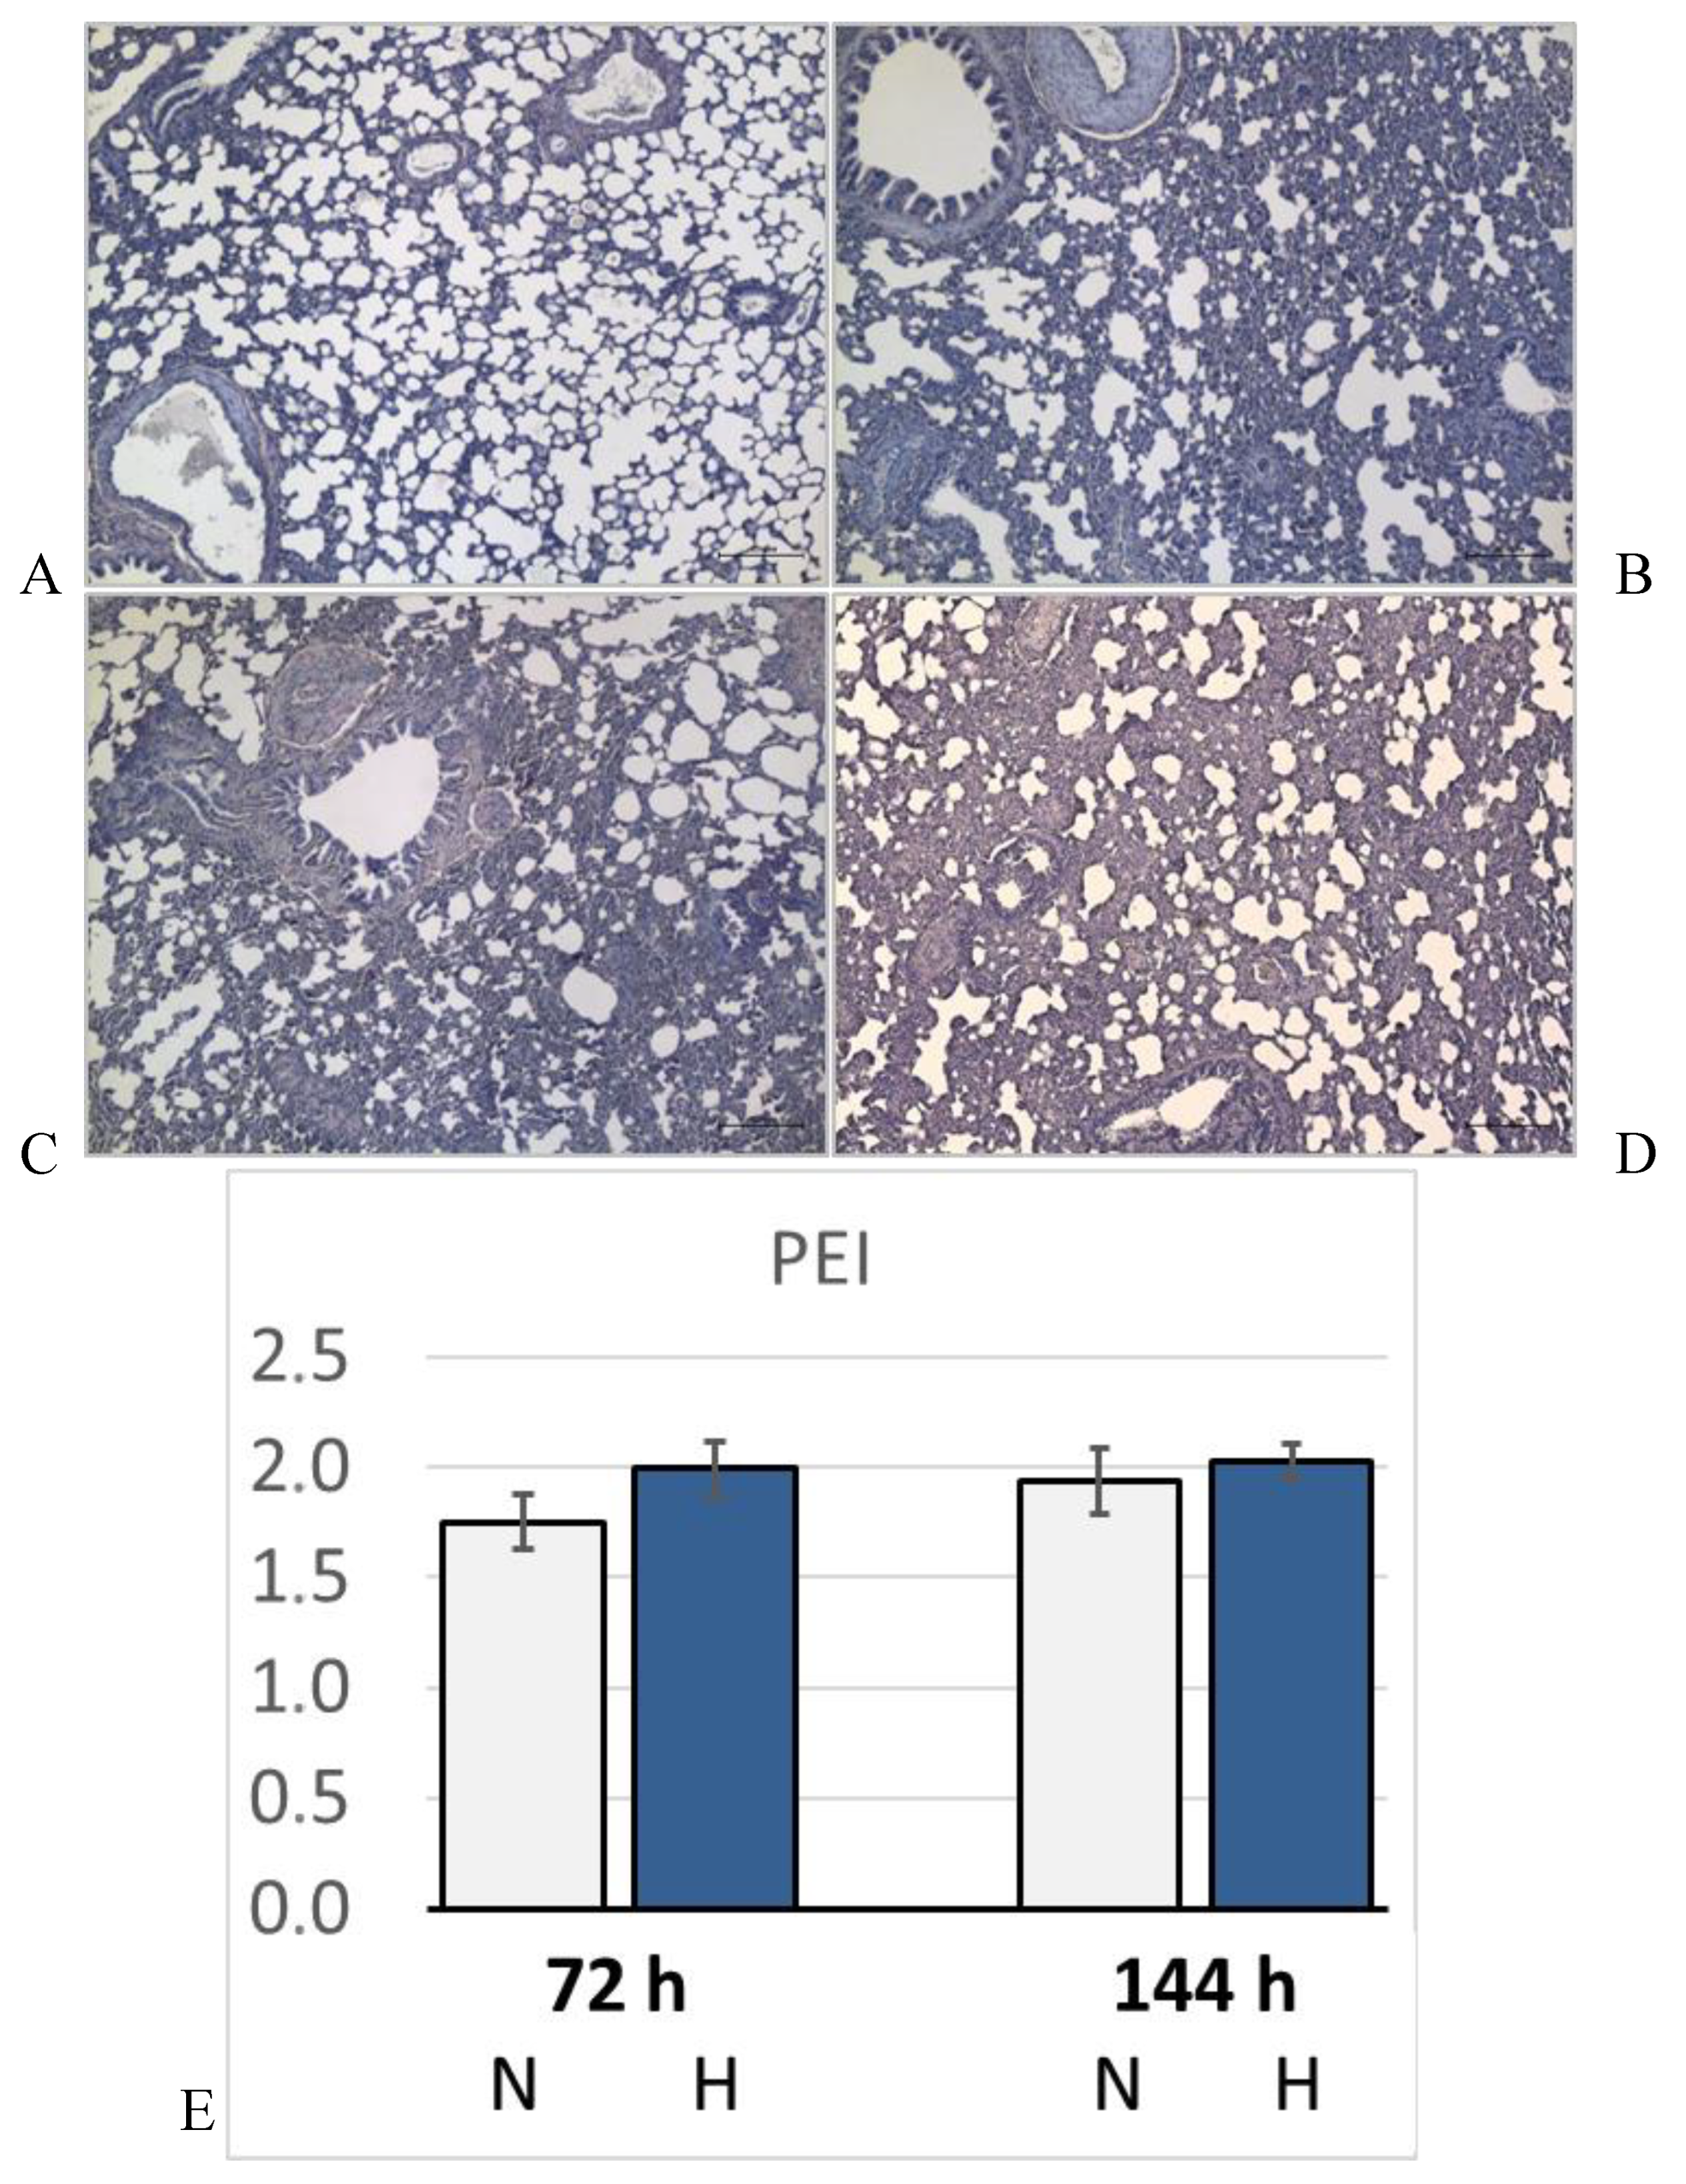
Figure 6.
A: Lung weight/body weight (LuW/BW) [mg/g]; B: Pleural fluid volume [ml]. Data are given as means ± SEM. N, normoxic groups; H, hypoxic groups. Significant differences between groups are indicated by asterisks: * p < 0.05; ** p < 0.01.
Figure 6.
A: Lung weight/body weight (LuW/BW) [mg/g]; B: Pleural fluid volume [ml]. Data are given as means ± SEM. N, normoxic groups; H, hypoxic groups. Significant differences between groups are indicated by asterisks: * p < 0.05; ** p < 0.01.
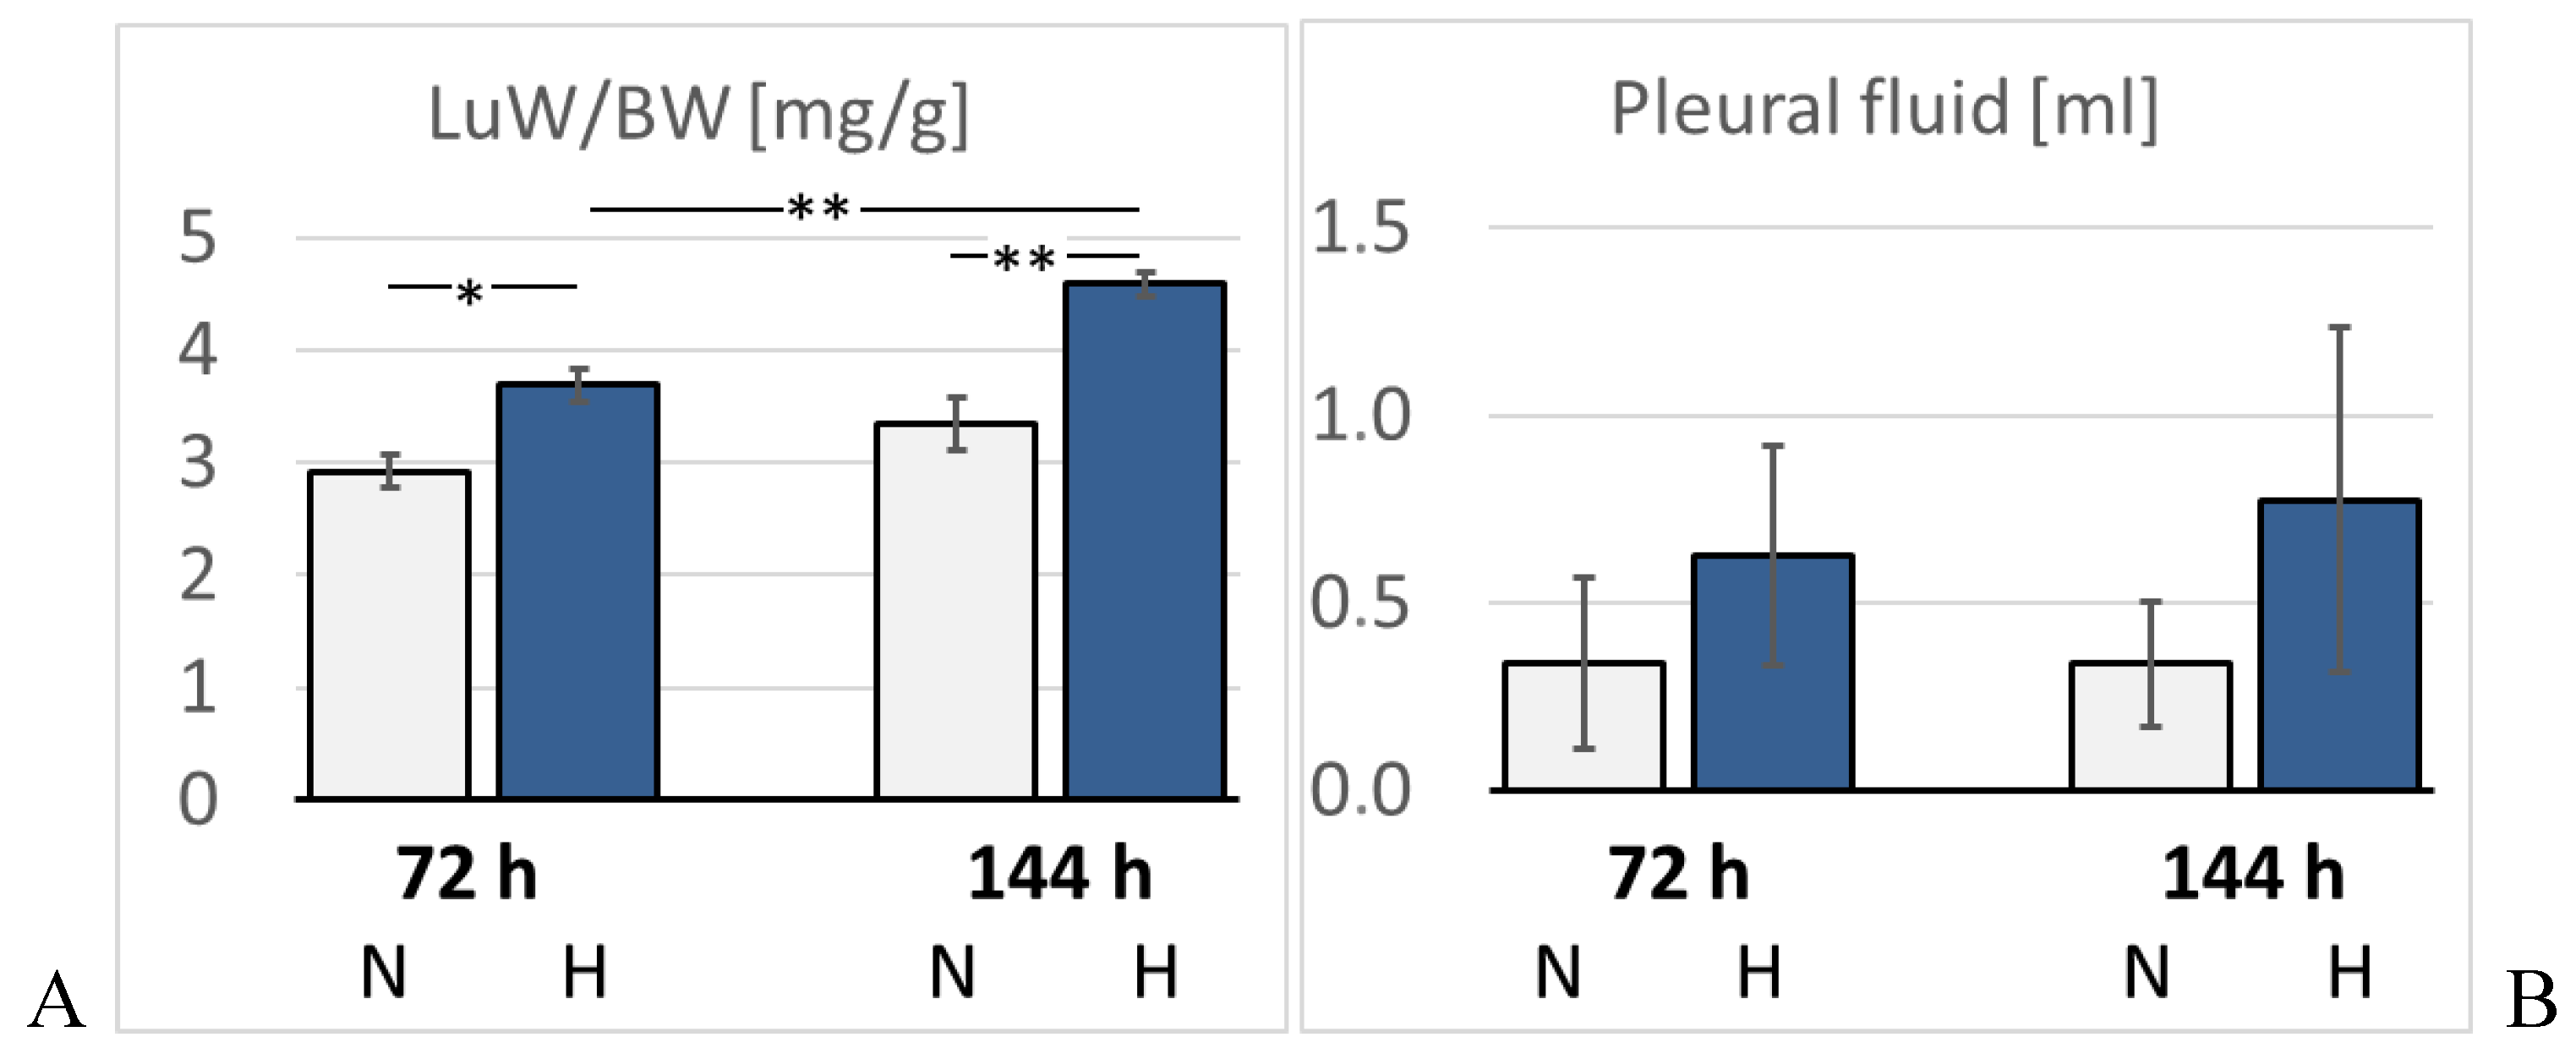
Figure 7.
Tumor necrosis factor alpha (TNFα) in the lung. Representative immunohistological images from: A: 72N; B: 72H; C: 144N; D: 144H; E: abundance of TNFα in the groups expressed as a percentage of positive area related to the bronchial surface area of the specimen [%]. Data are given as means ± SEM. N, normoxic groups; H, hypoxic groups. Significant differences between groups are indicated by asterisks: *** p < 0.001 .
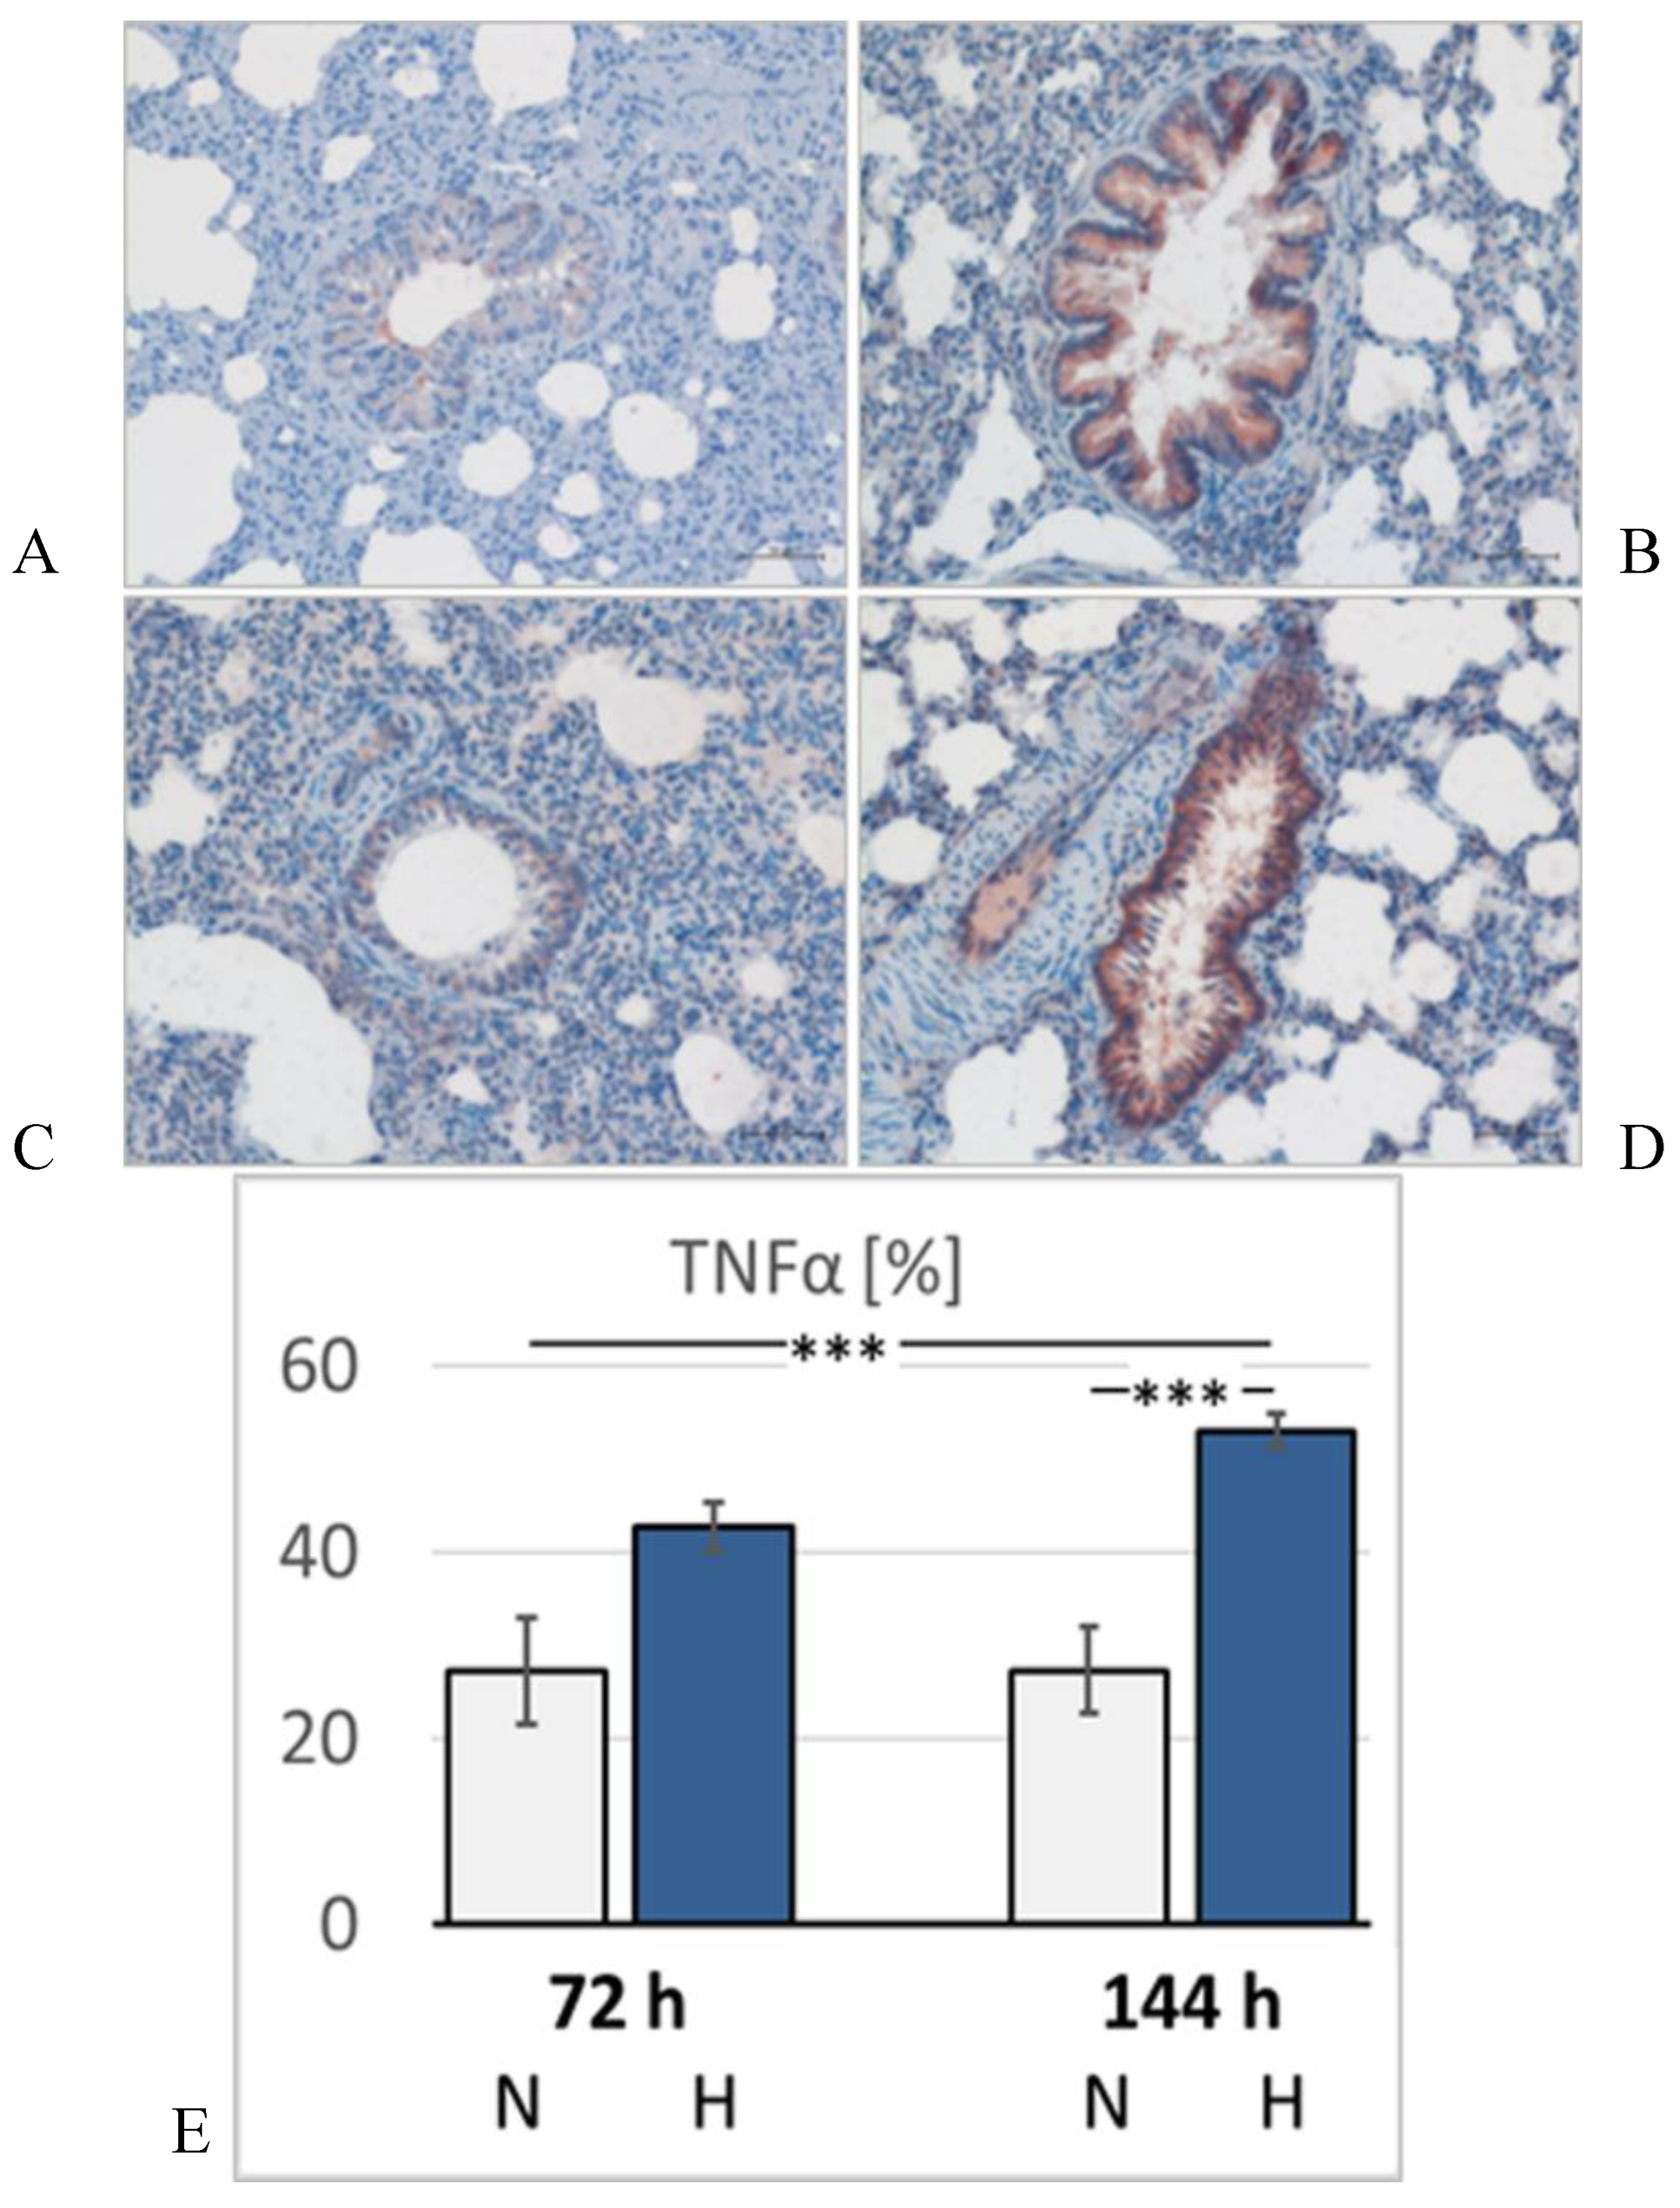

Table 1.
Blood analysis data.
| 72N | 72H | 144N | 144H | |
|---|---|---|---|---|
| paCO2 [mmHg] | 38.1 (34.3; 41.2) | 33.3 (27.0; 38.3) | 38.2 (33.2; 44.0) | 40.7 (36.2; 54.0) |
| Lac [mmol/L] | 0.9 (0.3; 1.6) | 3.0 (1.7; 5.8) | 2.4 (1.2; 3.9) | 1.9 (1.5; 6.7) |
| Glu [mmol/L] | 8.6 (7.8; 12.8) | 11.2 (8.6; 13.6) | 10.2 (10.0; 10.3) | 11.8 (10.0; 19.2) |
| K+ [mmol/L] | 3.5 (3.3; 3.7) | 4.8 (4.3; 5.4) ** | 3.5 (3.3; 3.8) # | 4.1 (3.7; 5.0) |
| Na+ [mmol/L] | 132 (126; 136) | 142 (139; 146) ** | 133 (120; 135) # | 136 (128; 139) |
All values have been measured in arterial blood: paCO2, partial pressure of CO2, Lac, lactate concentration, Glu,
glucose concentration, K+, K+ concentration, Na+, Na+ concentration. Data are given as median (25th; 75th
percentile). Significance marks: significant vs. time-corresponding N: ** p < 0.01; significant vs. 72H: # p < 0.05.
Table 2.
Hemodynamic data and heart weight.
| 72N | 72H | 144N | 144H | |
|---|---|---|---|---|
| LV dP/dt max [mmHg/s] | 10419 ± 622 | 8365 ± 569 | 9315 ± 992 | 10108 ± 609 |
| LV dP/dt min [mmHg/s] | -11896 ± 468 | -10176 ± 614 | -10570 ± 1091 | -10154 ± 716 |
| DAP [mmHg] | 98.4 ± 3.9 | 79.8 ± 3.4 ** | 80.9 ± 5.7 + | 91.9 ± 3.9 # |
| MAP [mmHg] | 109.6 ± 3.6 | 91.4 ± 3.6 ** | 91.4 ± 5.6 + | 100.8 ± 5.0 |
| LV edV [ml] | 311.0 ± 9.8 | 279.6 ± 9.7 | 274.6 ± 21.3 | 312.0 ± 15.5 |
| SV [µl] | 217.2 (203.8; 229.1) | 166.2 (158.6; 214.6) | 201.3 (193.6; 234.0) | 172.0 (141.4; 238.1) |
| EF [%] | 62.8 (59.9; 64.3) | 52.0 (43.1; 63.9) | 61.2 (57.7; 71.8) | 50.6 (41.0; 67.0) |
| SW [mmHg µl] | 18512 ± 2174 | 12852 ± 1513 | 15929 ± 985 | 15228 ± 2666 |
| RV dP/dt max [mmHg/s] | 2307 ± 183 | 2458 ± 192 | 2456 ± 274 | 2620 ± 160 |
| RV dP/dt min [mmHg/s] | -2098 ± 174 | -1928 ± 137 | -1986 ± 195 | -2341 ± 157 |
| HW/BW [mg/g] | 3.20 (3.06; 3.38) | 3.41 (3.13; 3.91) | 2.78 (2.69; 2.98) ## | 3.37 (3.10; 3.58) ** |
LV/RV dP/dt max, left/right ventricular maximal velocity of increase in pressure [mmHg/s]; LV/RV dP/dt min, left/right ventricular maximal velocity of decrease in pressure [mmHg/s]; DAP, diastolic aortic pressure [mmHg]; MAP, mean aortic pressure [mmHg]; SV, stroke volume [µl]; EF, ejection fraction [%]; SW, stroke work [mmHg µl]; HW/BW, heart weight/body weight [mg/g]. Data are given as mean ± SEM if normally distributed, otherwise as median (25th; 75th percentile). Significance marks: significant vs. time-corresponding N: ** p < 0.01; significant vs. 72H: # p < 0.05, ## p < 0.01; significant vs. 72N: + p < 0.05.
Table 3.
Protein concentrations.
| 72N | 72H | 144N | 144H | |
|---|---|---|---|---|
| [P] S | 54.7 (0.47; 0.88) | 61.6 (55.8; 76.8) | 42.7 (32.5; 50.4) ## | 49.2 (40.2; 60.1) # |
| [P] BALF | 0.58 (46.9; 63.8) | 0.35 (0.30; 0.54) | 0.75 (0.65; 0.84) | 0.67 (0.46; 0.82) |
| [P] PF | 18.7 ± 3.8 | 31.0 ± 4.7 | 20.5 ± 5.6 | 28.5 ± 2.8 |
| [P] PF/ [P] S | 0.29 ± 0.05 | 0.43 ± 0.06 | 0.47 ± 0.13 | 0.63 ± 0.04 ++ |
[P], protein concentration in: S, serum; BALF, bronchoalveolar lavage fluid, PF pleural fluid. Data are given as mean ± SEM if normally distributed, otherwise as median (25th; 75th percentile). Significance marks: significant vs. 72H: # p < 0.05; ## p < 0.01; significant vs. 72N: ++ p < 0.01.
Disclaimer/Publisher’s Note: The statements, opinions and data contained in all publications are solely those of the individual author(s) and contributor(s) and not of MDPI and/or the editor(s). MDPI and/or the editor(s) disclaim responsibility for any injury to people or property resulting from any ideas, methods, instructions or products referred to in the content. |
© 2025 by the authors. Licensee MDPI, Basel, Switzerland. This article is an open access article distributed under the terms and conditions of the Creative Commons Attribution (CC BY) license (http://creativecommons.org/licenses/by/4.0/).
Copyright: This open access article is published under a Creative Commons CC BY 4.0 license, which permit the free download, distribution, and reuse, provided that the author and preprint are cited in any reuse.


