
Submitted:
17 January 2025
Posted:
17 January 2025
You are already at the latest version
Abstract
Febrile diseases such as typhoid fever, malaria, tuberculosis, and HIV/AIDS present diagnostic challenges in Low- and Middle-Income Countries (LMICs). Misdiagnosis leads to delayed treatment, higher healthcare costs, and increased mortality. This study proposes a data-driven diagnostic framework leveraging explainable artificial intelligence (XAI) and machine learning (ML) to enhance diagnostic accuracy and usability in resource-limited settings. To develop and evaluate a diagnostic system combining ML algorithms and XAI techniques for accurate and interpretable detection of febrile diseases, focusing on usability in clinical settings. A dataset of 3,914 patient records from secondary and tertiary hospitals was used to train and validate predictive models. Random Forest, Extreme Gradient Boost, and Multi-Layer Perceptron algorithms were employed, with hyperparameter tuning for optimization. XAI frameworks, including Large Language Models and Local Interpretable Model-agnostic Explanations, were integrated to enhance interpretability. A mobile-based platform was developed for real-time diagnostic use. The ML models demonstrated high diagnostic accuracy across multiple febrile diseases. Integrating XAI frameworks provided intuitive visualizations and textual explanations, enabling clinicians to understand the reasoning behind predictions better. The mobile-based implementation facilitated real-time decision-making, particularly in resource-constrained environments. The study highlights the potential of combining ML algorithms with explainable AI to improve diagnostic accuracy and usability in LMICs. While the system demonstrated effectiveness, limitations such as excluding pediatric data and certain febrile diseases were noted. Future research will expand the dataset, include additional diseases, and optimize system deployment to enhance adoption. This work establishes a foundation for transparent, AI-driven diagnostic tools in resource-poor settings.
Keywords:
data-driven
; intelligent diagnostics
; explainable AI
; febrile diseases
; machine learning
; ChatGPT
1. Introduction
In tropical and Low- and Middle-Income countries (LMICs), febrile diseases characterized by fever and frequently accompanied by other systemic symptoms present significant diagnostic and treatment challenges. Malaria, typhoid fever, urinary tract infections, Human immunodeficiency virus (HIV)/acquired immunodeficiency syndrome (AIDS), respiratory tract infections, and tuberculosis are among the illnesses that greatly increase morbidity and mortality, particularly in LMICs. These febrile diseases often present overlapping symptoms which results in misdiagnosis and suboptimal treatments, which prolongs illness, raises healthcare expenses, and in extreme situations, can lead to death [1,2,3]. This emphasizes the need for trustworthy and interpretable diagnostic tools to aid healthcare professionals in making timely and efficient decisions.
The Advancements in Artificial intelligence (AI) and machine learning (ML) have transformed the healthcare sector by providing data-driven insights into disease management, diagnosis, and treatment [4,5]. These technologies use massive datasets to find relationships and patterns that conventional diagnostic techniques might miss [6]. In healthcare diagnostics, data-driven approaches are becoming increasingly significant because they offer improved efficiency and precision such as in medical diagnosis [7,8,9], personalized medicine, and healthcare analytics [10,11,12]. They rely on medical data collection, processing, and analysis to identify trends, aid clinical decision-making, and enhance patient outcomes [13]. ML techniques such as unsupervised, supervised, and reinforcement learning can be applied to develop medical diagnostic systems. However, while ML models like Random Forest (RF), Extreme Gradient Boost (XGBoost), and Multi-Layer Perceptron (MLP) algorithms have demonstrated impressive predictive capabilities, they are often criticized for their “black-box” nature [14,15,16]. This “black-box” nature hinders their acceptance in crucial healthcare applications where transparency is essential by making it difficult for clinicians to comprehend the reasoning behind their predictions [17]. Explainable AI (XAI) has addressed this gap by enhancing the interpretability of making ML models without sacrificing their predictive capabilities [18]. Frameworks like Large Language Models (LLMs) and Local Interpretable Model-agnostic Explanations (LIME) offer visual representations and textual outputs that make model decisions easy to understand especially by non-experts [19,20]. Combining these frameworks allows diagnostic models to provide valuable insight, clarifying complex algorithm decisions and fostering professional trust. This strategy is important for febrile diseases, where early diagnosis and medical attention are essential for favorable patient outcomes.
The main aim of this study is to develop a data-driven, intelligent methodology for building explainable and accurate diagnostic models for febrile diseases, integrating ML algorithms with interpretability frameworks to enhance clinical decision-making and promote transparency in AI-driven healthcare systems. The study employs a data-driven approach, leveraging a rich dataset of patient records and symptoms to develop an explainable disease diagnostic model tailored for febrile diseases. ML algorithms like Random Forest, XGBoost, and Multi-Layer Perceptron can provide the basis for precise disease prediction, optimizing their performance through extensive hyperparameter tuning and validation techniques, and XAI techniques such as LIME can ensure that the predictions are transparent and give clinicians confidence they need to comprehend and trust the system. Large Language Models, such as ChatGPT can offer explanations in natural language, improving interpretability and making the diagnostic process easier for patients and medical professionals to understand. This study’s significant contributions are:
In this study, section 2 presents the methodology, which includes dataset description, preprocessing, and model development, integration of XAI, system implementation, and model performance metrics. Section 3 discusses the results, which include an analysis of the models' performance and the explainability of ChatGPT and LIME. Section 4 concludes the study, presenting the innovative aspect of the system as well as limitations and areas for further research.
2. Methodology
2.1. Enhanced Diagnostic Framework
The components of the enhanced diagnostic framework and their interrelationships are structured with the components comprising medical experts from which patient data were collected, data Preprocessing, diagnostic system, model evaluation, healthcare provider, the patient, the mobile device, and the cloud storage, as illustrated in Figure 1. The Android-based mobile device serves as the interface between healthcare providers and the diagnostic system. Through the app's user-friendly interface, the healthcare provider interacts directly with the system to enter personal data, patient history, and examination results, including temperature, blood pressure, respiratory rate, height, weight, and patient symptoms. The decision filter correctly groups patient vitals and symptoms for diagnostic decisions, simulating the reasoning of a knowledgeable doctor. The diagnosis and recommended treatment component gives medical professionals the patient's diagnosis based on the diagnostic system, which includes the RF diagnosis, LIME interpretation, additional GPT engine explanations, and suggested treatment. Diagnostic results, patient data, model data, and other system records are stored in the cloud. The medical experts are skilled doctors with experience in tropical fevers from secondary and tertiary hospitals who gathered information from patients with fevers during clinic days.
2.2. Dataset Description and Preprocessing
The dataset used in the work was obtained from a study funded by the New Frontiers in Research Fund (NFRF) to develop a system to help frontline health workers make early differential diagnoses of tropical diseases. The dataset contains 4870 patient records comprising patient symptoms, risk factors, demographic data, suspected diagnoses, further investigation, and confirmed diagnoses [21].
Following the data collection, data exploration was required to examine the size, features, types of data, and structure of the dataset. According to the dataset, 225 patient records were obtained during the dry season, 40 during harmattan, and 4605 during the rainy season. There were 2175 male and 2695 female patients in the dataset, according to the descriptive statistics in Table 1. The data exploration also displayed the number of patients in the dataset who were nursing mothers and those who were pregnant in the first, second, and third trimesters, along with the corresponding months. Table 2 presents the number of suspected and confirmed diagnoses as well as the symptoms in the dataset.
A five-point rating system was used to describe the patient's symptoms (1=absent; 2=mild; 3=moderate; 4=severe; 5=very severe), and a six-point rating system to describe the diagnoses (1=absent; 2=very low; 3=low; 4=moderate; 5=high; 6=very high) and the sample patient dataset is shown in Figure 2. Because patients under the age of five (5) were unable to adequately express certain symptoms and the data collection tool did not account for certain symptoms of patients under the age of five, records of these patients were eliminated from the data during the preprocessing stage. Additionally, the doctor's suspected diagnosis columns were eliminated from the dataset, leaving only the symptoms and verified diagnoses following additional research. Additionally, the symptoms of the haemorrhagic fevers (dengue, yellow, and Lassa fever) were eliminated because these illnesses were not taken into account in this study. As shown in Figure 3, the dataset was cleaned up and reduced to 3914 records with 32 symptoms and 8 confirmed diagnoses while Table 3 lists the symptoms and diseases along with their abbreviations.
To further reduce the number of confirmed diseases to the six diseases that were included in the scope of this study, upper respiratory tract infections (URTI), and lower respiratory tract infections (LRTI), as well as upper urinary tract infections (UPUTI) and lower urinary tract infections (LWUTI), were combined into respiratory tract infections (RTI) and urinary tract infections (UTI), respectively. Max operation also known as max function was applied to combine the two sets of severity levels into a single value. The max operation combines severity scales, emphasizing the highest severity recorded across multiple metrics, by taking the maximum value from two or more related measurements. Given that and are the severity levels of upper and lower urinary tract infections respectively, the Max Operation can be expressed as:
where represents the first input to the max operation while represents the second input to the max operation, the max function returns the maximum value between and . This process guarantees that the worst-case scenario from the two columns is appropriately represented by the combined severity level. The Max Operation is a dependable method of combining severity scales when the objective is to identify the most severe medical condition. Figure 4 displays the dataset following the application of the Max Operation.
Figure 5 illustrates the results of the disease severity Absent (1) was mapped to binary 0 using custom mapping, and very-low to very-severe (2 to 6) to binary 1. A lambda function mapping the disease severity to 0 and 1 is employed, with . By mapping the diseases, the dataset was prepared and the disease severity was represented in a straightforward, binary format for efficient training of machine learning models.
2.3. Data Preprocessing and Oversampling
Three machine learning algorithms were taken into consideration in this study: MLP, RF, XGBOOST, and random forest which was the model with the highest performance, was used to develop the diagnostic system. Using multiple decision trees, the RF model leveraged the power of ensemble learning to provide reliable diagnoses. By combining the diagnoses from all trees and using multiple symptoms as input features, this RF model enhances the diagnostic outcomes of febrile diseases. RF uses patient data, including symptoms and diseases, to construct numerous decision trees on identical nodes. Then, it combines the decisions from these decision trees to arrive at a solution that is the average of all the decision trees [22]. XGBoost was chosen due to its advanced gradient boosting implementation and ensemble technique, which makes it a portable, flexible, and efficient option for disease diagnosis. XGBoost builds classification trees sequentially, training the subsequent tree with the residuals from the previous tree. As its basis, XGBoost uses gradient-boosted decision trees and regularization techniques to enhance model generalization. In a stepwise fashion, weak learners are progressively added to the group, with each member concentrating on fixing the mistakes of the others. During training, it minimizes a predetermined loss function using the gradient descent optimization technique [22,23]. MLP was also chosen due to its capacity to model intricate relationships, learn from high-dimensional datasets, and handle a variety of data types, making it a useful tool for disease diagnosis [24]. When paired with the right interpretability and training strategies, MLPs can provide accurate and useful information for medical diagnosis. This feedforward artificial neural network consists of three layers: an output layer, one or more hidden layers, and an input layer. To ensure robust evaluation, an 80/20 ratio was used to divide the dataset on febrile disease into training and testing subsets. The models were trained using the training set, which made up 80% of the dataset, and the testing set, which made up the remaining 20%, was used to assess generalization. To optimize the model's performance, hyperparameter tuning was carried out using Grid search cross-validation (GridSearchCV) with 5-fold cross-validation (CV=5). For cross-validation, the training data is split into five equal subsets or folds. The model was trained on four-folds, and testing was done on the last fold. This procedure was carried out five times, each time using a different fold as the test set to ensure that every observation in the training data was used for validation. Cross-validation is a helpful method for assessing the model's resilience and reducing the possibility of overfitting. Finding the best hyperparameters is also aided by averaging the performance across all folds. The hyperparameters for each model were adjusted using GridSearchCV in order to determine which combination produced the best results. Hyperparameter tuning is used to optimize the model's performance by controlling how it learns from the data, and it has a significant impact on the model's accuracy and efficiency. For Random Forest (RF), max_depth, which specifies the maximum depth of each tree, was set to [None, 10, 20], and n_estimators, which determines the number of trees in the forest, was tested with values [100, 200, 300]. For the Multi-layer Perceptron (MLP), three hyperparameters were adjusted: the activation function (which transforms input data in the neural network) with ['relu', 'tanh', 'logistic'), the regularization term alpha with [0.0001, 0.001, 0.01], and the hidden_layer_sizes (number of neurons in each layer) with [(100,), (50, 50), (50, 25, 10)]. Finally, for XGBoost, [100, 200, 30] and [3, 5, 7] were used to adjust the n_estimators and max_depth parameters
2.4. Integration of Explainable AI
Interpretability was provided locally through the use of LIME, which approximated the model's behaviour around a specific diagnosis using a simpler model. LIME helps healthcare professionals understand why a model diagnoses a disease for a specific patient based on their symptoms, which is very useful when diagnosing diseases where patient cases may differ significantly from one another. This localized explanation aids in identifying any irregularities or errors in the diagnosis, thereby increasing the diagnostic model's accuracy and dependability. LIME offers versatility and broad applicability in a range of diagnostic scenarios because it is model-agnostic and works with a variety of machine-learning models [25,26]. GPT uses its powerful natural language processing capabilities to analyze and understand complex medical data, significantly improving the diagnosis of febrile diseases [27,28]. By offering comprehensive explanations for its recommendations, it enhances the effectiveness of disease diagnosis when paired with an ML model, ultimately improving patient outcomes. It makes use of the transformer architecture, which is the fundamental model in natural language processing because of its effectiveness in handling sequential data. With the help of the ML models' predicted labels and probabilities, GPT produces explanations that are comprehensible to humans. The GPT receives a structured prompt with the patient's symptoms and the likelihood of each disease based on the results of an ML model. GPT produces an explanation for every predicted disease by combining medical knowledge with its probability score and related symptoms.
2.5. System Implementation
Visual Studio Code (VS Code), PythonAnywhere, and Google Colaboratory (Google Colab) were used in the system's implementation. VS Code is a robust, lightweight, and open-source source code editor that supports numerous extensions and speeds up the coding process. PythonAnywhere is an integrated development environment (IDE) and online web hosting service based on the Python programming language. Google Colab is an online tool that offers free access to a Graphical Processing Unit (GPU) and Tensor Processing Unit (TPU) for creating ML and deep learning models. This cloud-based infrastructure provides powerful processing resources for training and testing complex machine learning models, including Random Forest, XGBoost, and MLP, at no cost. Figma was used to build the system's UI/UX design because it offers a robust, team-based platform for creating logical and visually appealing user interfaces. To make sure the app's design was user-friendly for patients and healthcare professionals, developers and designers could easily collaborate thanks to its real-time collaboration features. Flet was chosen for mobile app development because it provides an easy-to-use framework for creating interactive desktop, mobile, and web applications with Python. Because of its simplicity of use and seamless integration with other Python libraries, such as Random Forest for machine learning, LIME for explainability, and GPT for natural language processing, it was the best choice. MySQL is a popular relational database management system that is well-known for being scalable and open-source. The laws governing the privacy of medical data make it suitable for handling sensitive health data. MySQL facilitates smooth data transfer between the models and the database by integrating with the Python backend and running GPT, LIME, and RF with ease.
2.6. Model Performance Metrics
The performance of the ML models was assessed using Recall, Precision, and F1 Score because they ensure that the model's diagnoses are accurate and reliable.
Recall: Recall quantifies the ratio of accurately anticipated positive observations to all observations made during the actual class. It shows how well positive samples can be identified by the model. In medical screenings, for example, where missing a positive case (false negative) can be crucial, recall is crucial when the cost of false negatives is high.
Precision: This metric quantifies the ratio of accurately predicted positive observations to all predicted positive observations. It shows how accurate positive forecasts are. When the cost of false positives is high, accuracy is essential. For instance, a false positive in a medical diagnosis could result in needless treatments.
F1 Score: The F1 Score is calculated by taking the harmonic mean of recall and precision. It offers a balance between recall and precision, which is especially helpful for datasets that are unbalanced. When precision and recall must be balanced, the F1 Score can be helpful, particularly when there is an unequal distribution of classes.
3. Results and Discussion
Three algorithms were used in this study to demonstrate the capability to model the complex relationships in the dataset, and RF emerged as the best-performing model due to its balance between high predictive results and computational efficiency. While MLP displayed limitations in recall and F1 scores for specific diseases, suggesting possible limitations in handling imbalanced data within the dataset, XGBoost showed promising results but required intensive tuning. Across all models, Random Forest algorithm emerged as the best-performing model and achieved the highest diagnostic performance across most diseases with an f1-score of 88% for malaria, 60% for enteric fever, 51% for HIV and AIDS, 72% for urinary tract infection, 72% for respiratory tract infection, and 60% for tuberculosis followed by XGBoost (87%, 60%, 48%, 70%, 72%, and 65%) and the MLP (85%, 51%, 46%, 70%, 69%, 64%) model as presented in Table 4 and Figure 6.
A Model Interpretability Framework (MIF) was incorporated into the diagnostic system to address the vital need for explainability and transparency in disease diagnosis. The LIME framework and LLM (ChatGPT) were selected for their ability to provide intuitive visual and textual explanations of model decisions. By applying LIME to the Random Forest model, it became clear how particular symptoms influenced the diagnostic predictions. By applying LIME to the test subset and locally approximating the model with an interpretable substitute model, this study was able to identify important symptoms that influenced the model's diagnoses for particular instances, as illustrated in Figure 7, Figure 8 and Figure 9 for the three models. How much each symptom contributed to the final diagnosis is shown by the length of the bars. The diagnosis is moved into the positive class, which is the presence of disease, by the symptoms on the right, and into the negative class, which is the absence of a disease, by the symptoms on the left. This makes it possible for medical professionals to comprehend the logic behind predictions, and the system promotes adoption, builds trust, and facilitates well-informed decision-making.
Complex diagnostic outputs were translated into natural language using ChatGPT. Since the development environment was based on the Python platform, this was readily available. As seen in Table 5, the sample prompt uses the LIME model's list of diagnosed illnesses and patient symptoms along with how each contributed to the diagnosis. Prior to being sent as a request to the ChatGPT API, the generated prompt was assigned to a variable and transformed into JSON format. Figure 10 shows the results produced by the ChatGPT platform, where the diagnoses, important symptom contributions, and detrimental contributors are explained.
The minimum requirements for this basic app are an Android OS version 4.0 or higher, 4 GB of RAM (at least 2 GB), 8 GB of ROM, a portrait display layout, and an Internet connection. The healthcare worker can use the form in Figure 11 to create an account following a successful installation. Once an account has been created, the system administrator must confirm the healthcare worker's information before sending the password to the healthcare worker's email address so they can log in. Through Figure 12, the healthcare professional logs into the system using their email address and password.
The healthcare worker is shown a user-friendly dashboard in Figure 13 following a successful system login. The dashboard allows the healthcare professional to register new patients (Figure 14) and view the list of registered patients (Figure 15).The healthcare professional can either automatically navigate to the patient's dashboard (Figure 16) following a successful patient registration or search for and click on the patient's name from the patient list. The patient's dashboard allows them to view their past medical history as well as take and examine their history (Figure 17). As seen in Figure 18, the mobile app provides provisional diagnoses following a successful history taking and examination. It lists all probable diseases the patient may have along with a LIME chart and a ChatGPT explanation of the diagnoses.
Figure 11.
Healthcare Worker Signup.

Figure 12.
User Login.
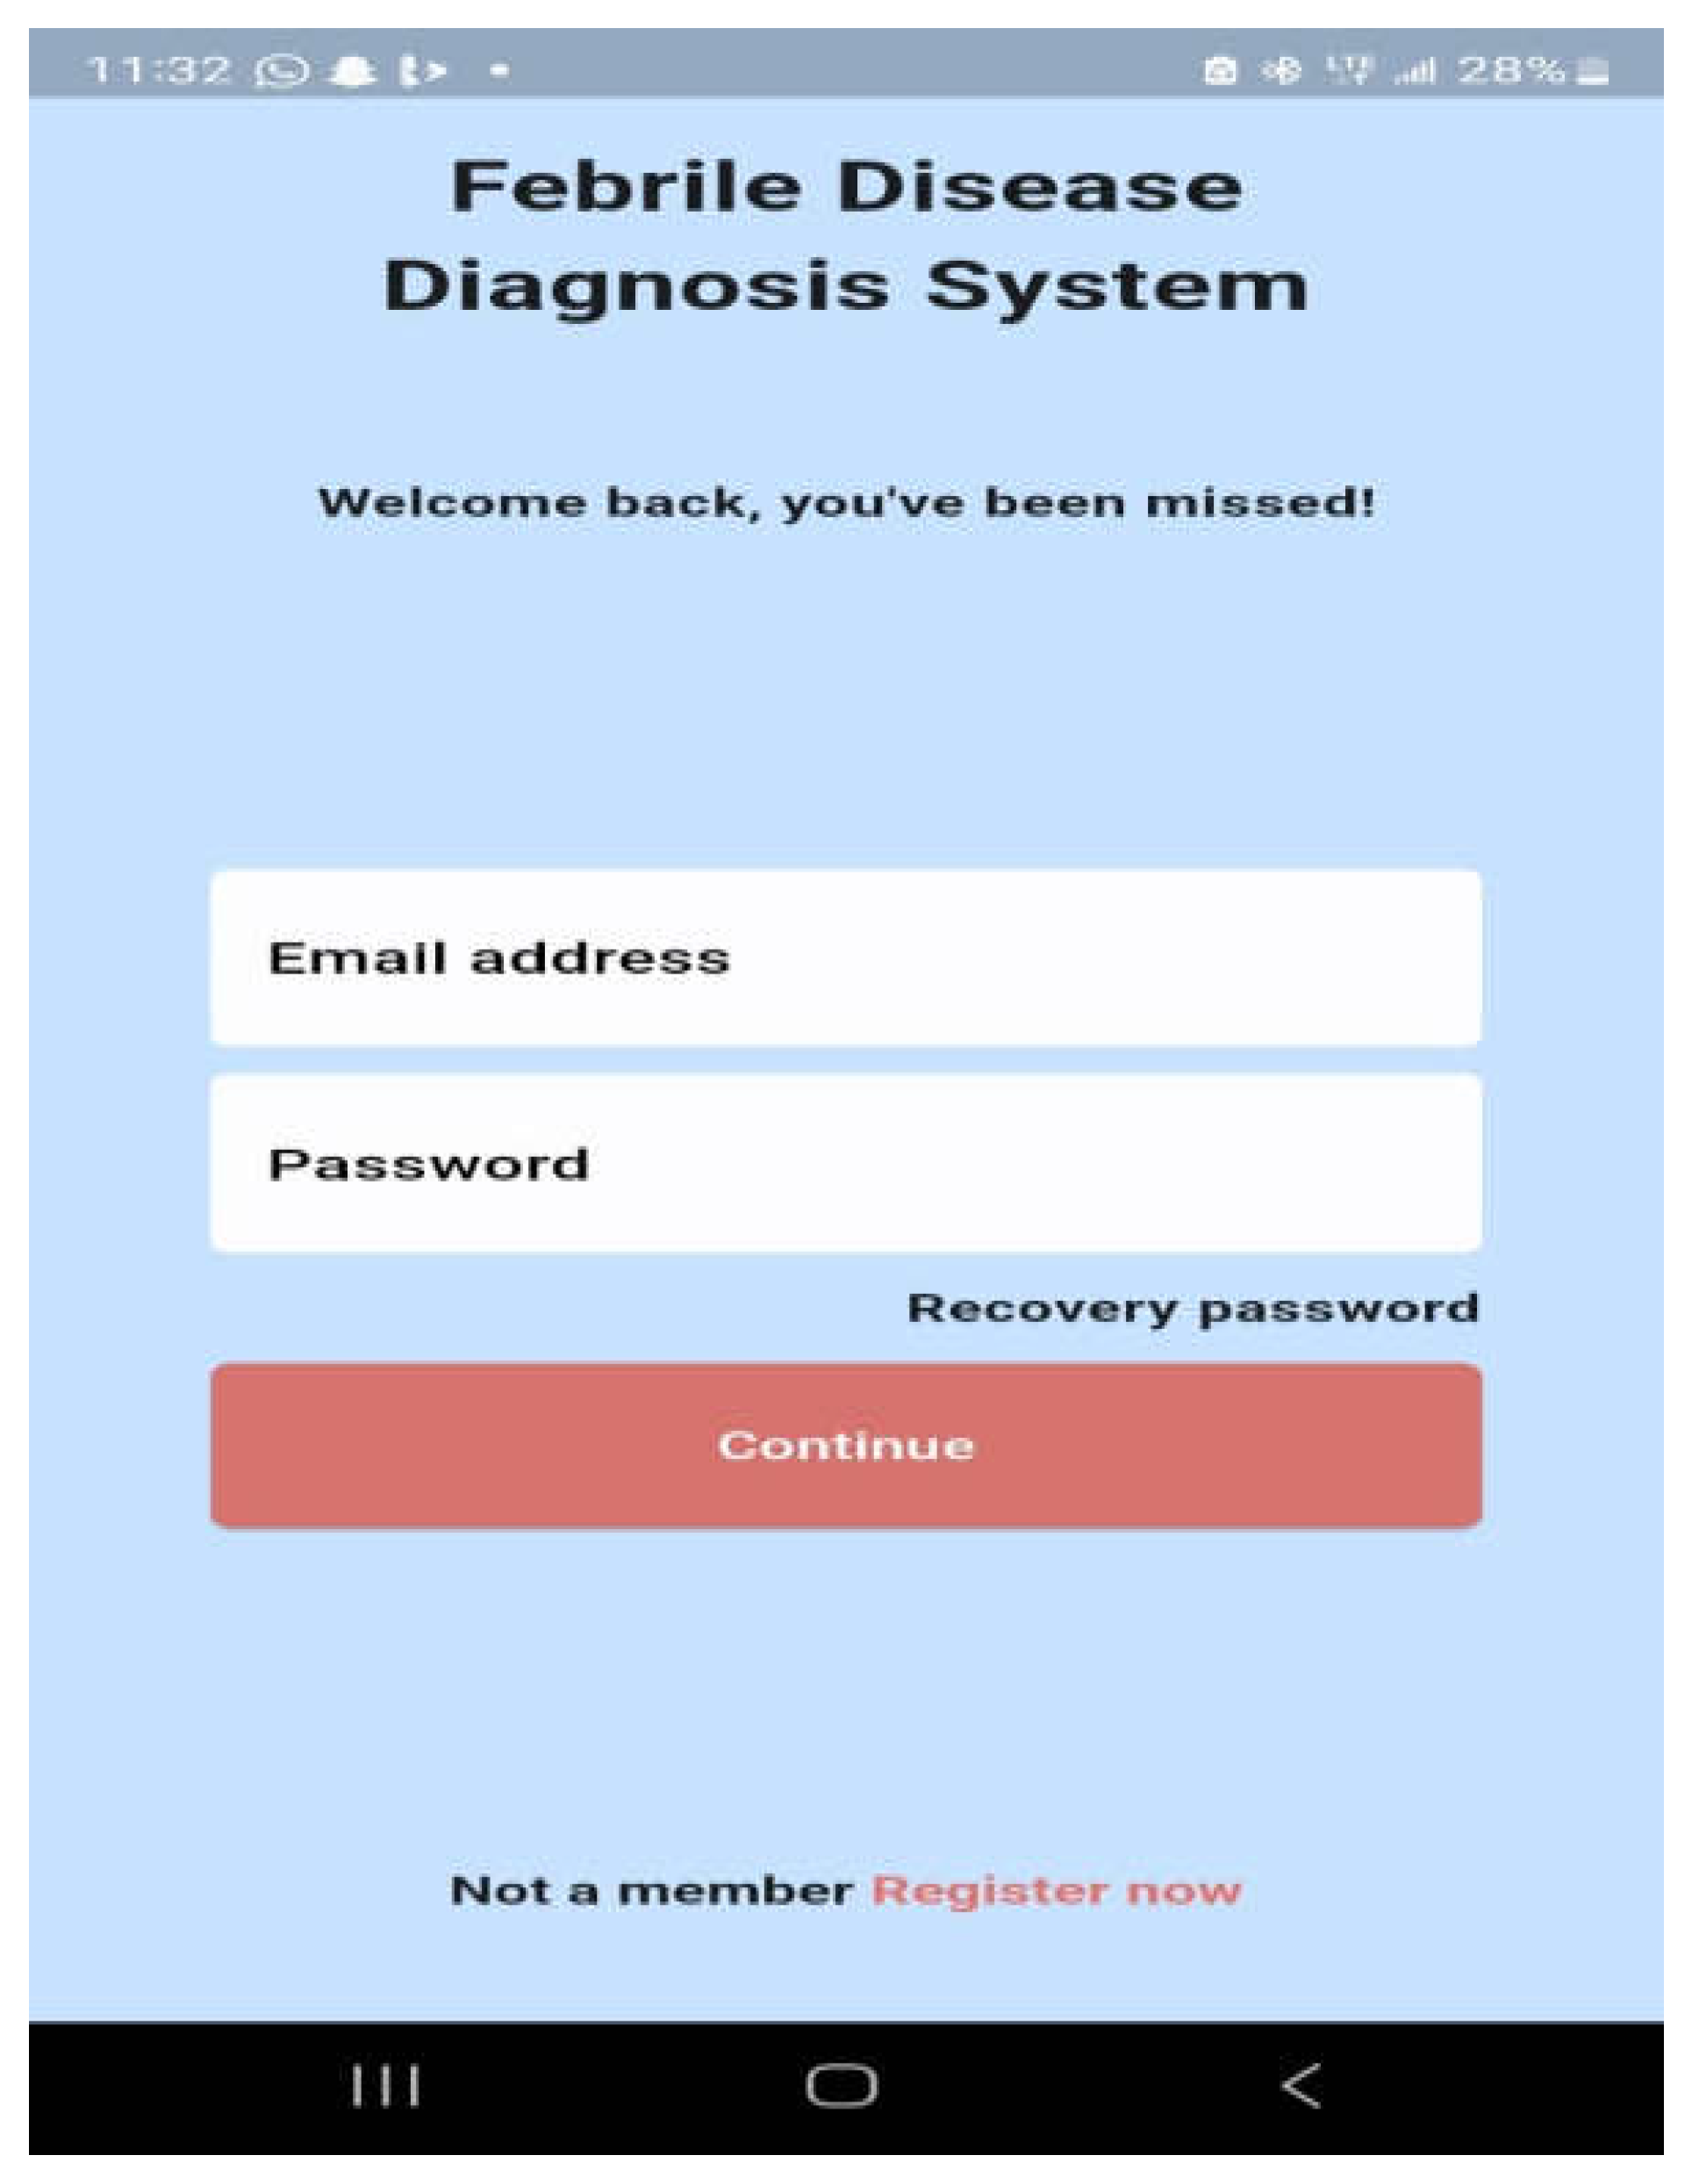
Figure 13.
Healthcare Dashboard.
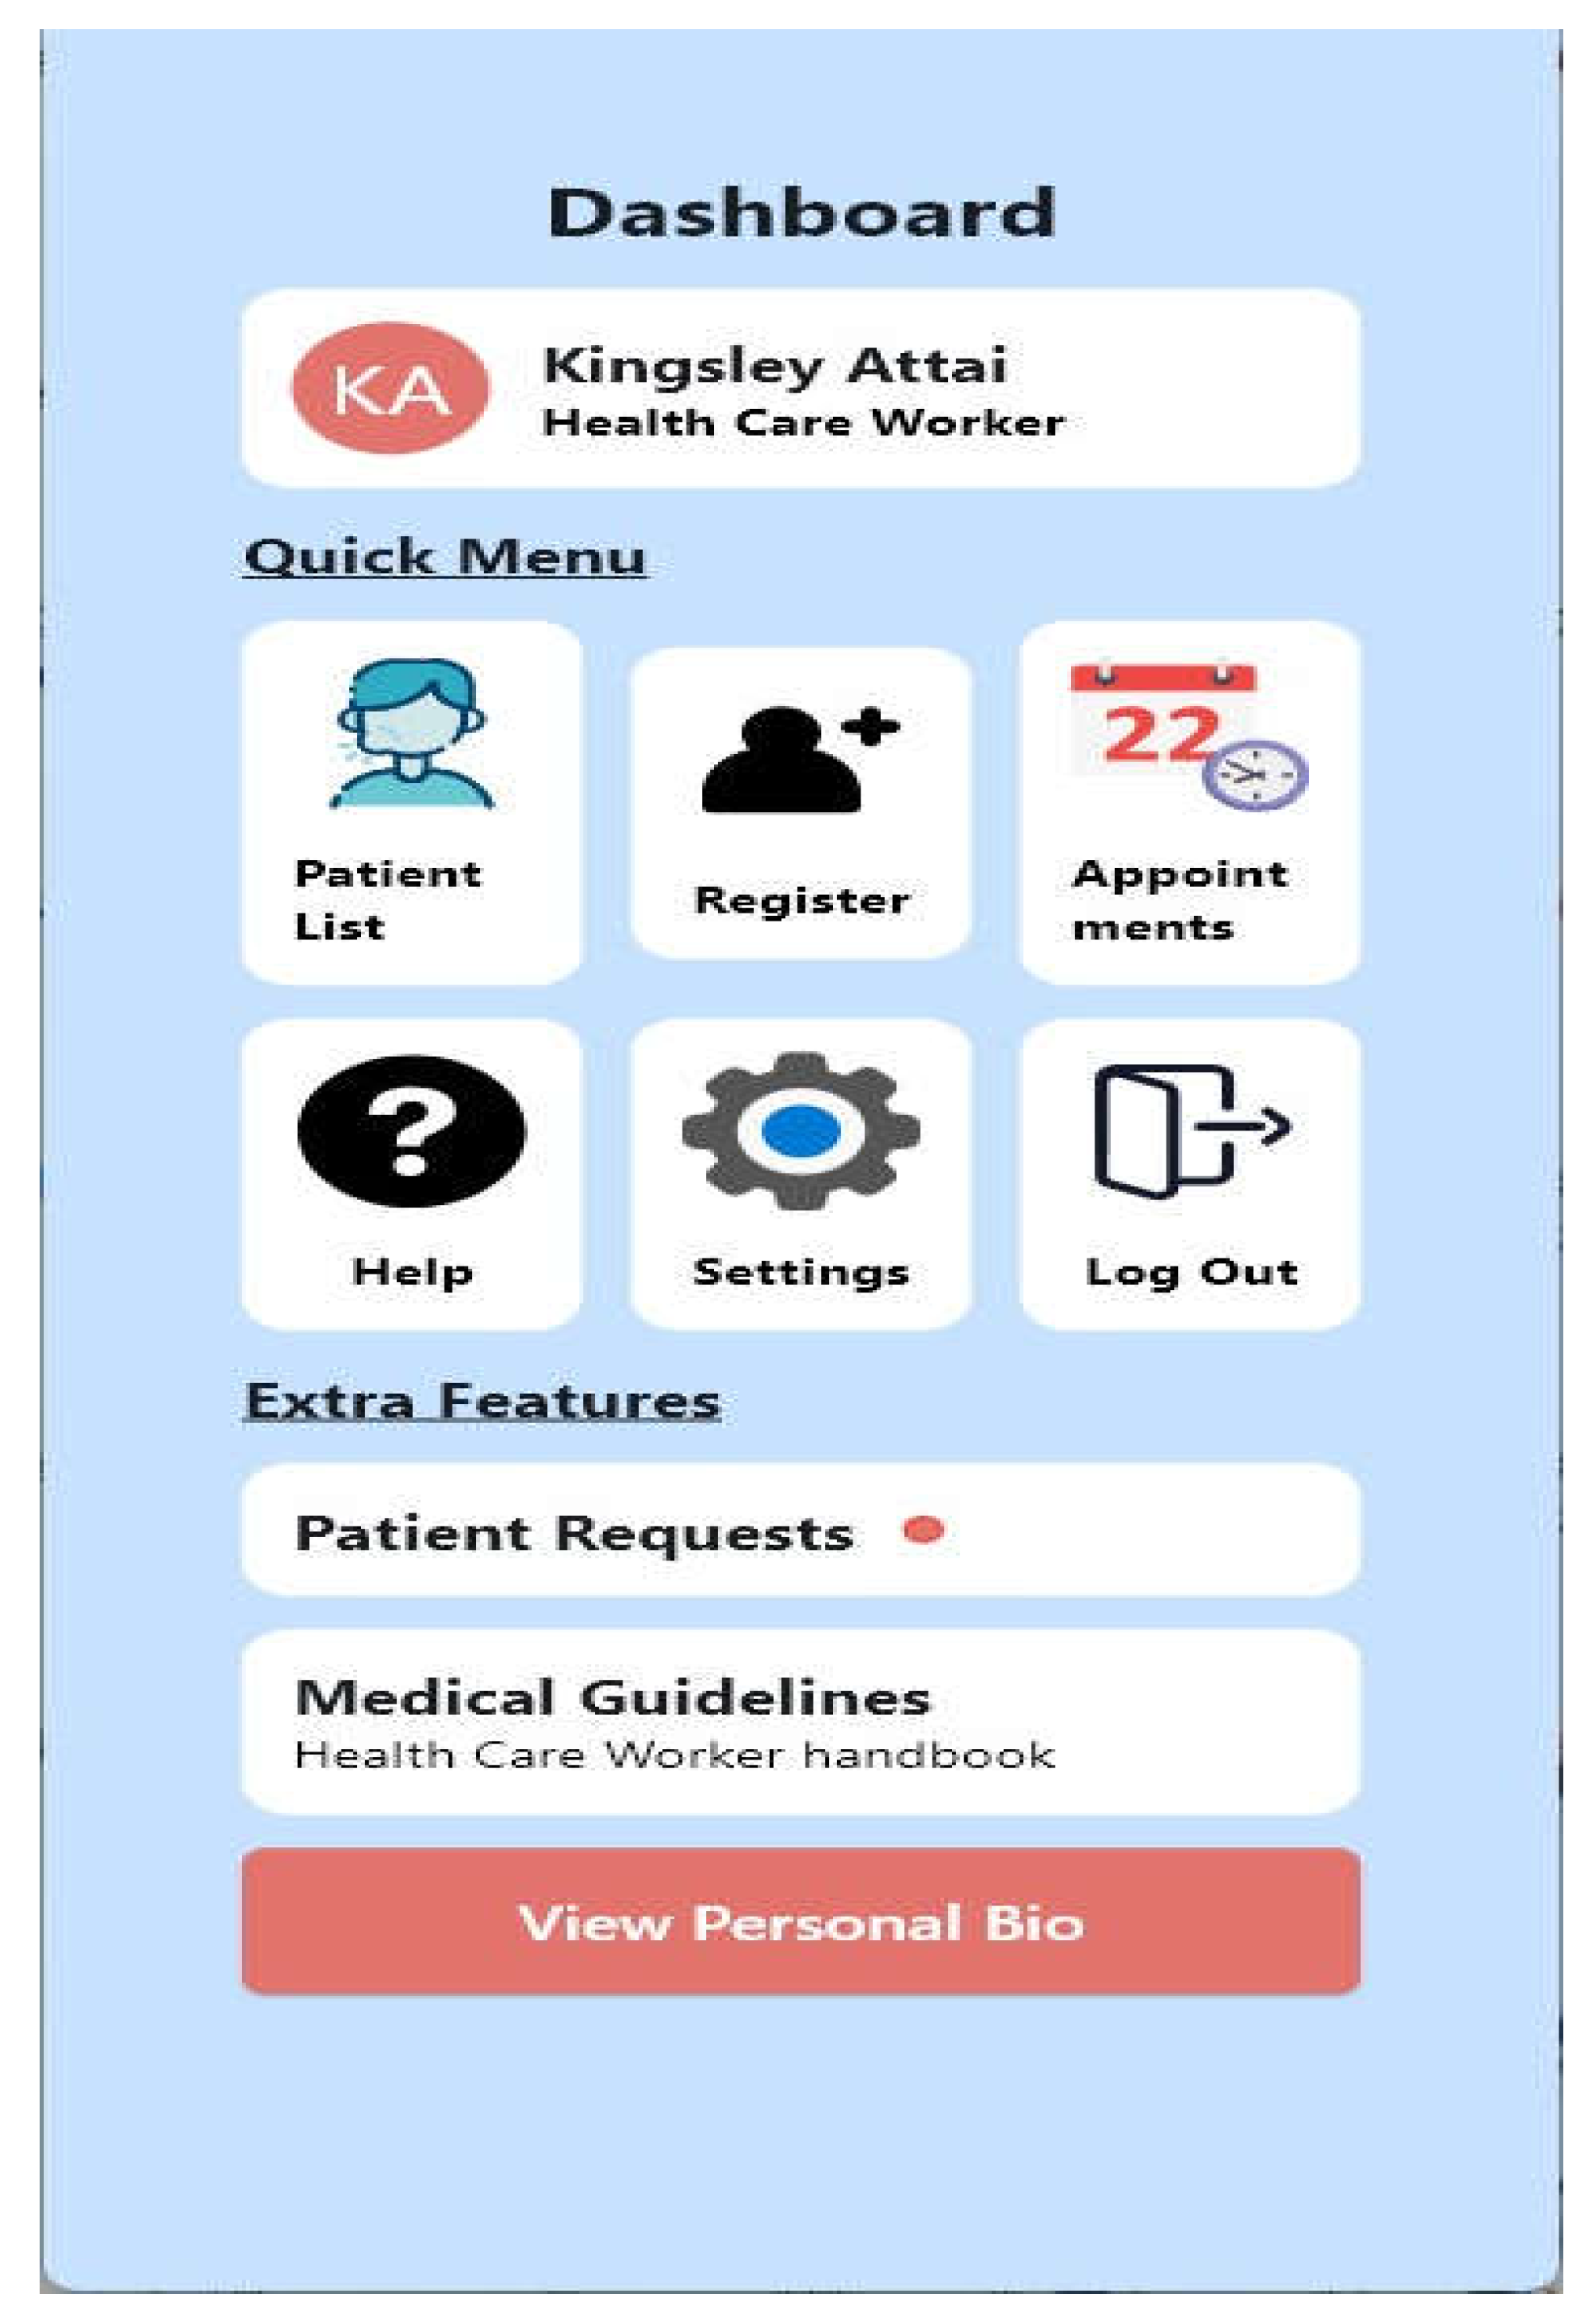
Figure 14.
Patient Registration Page.
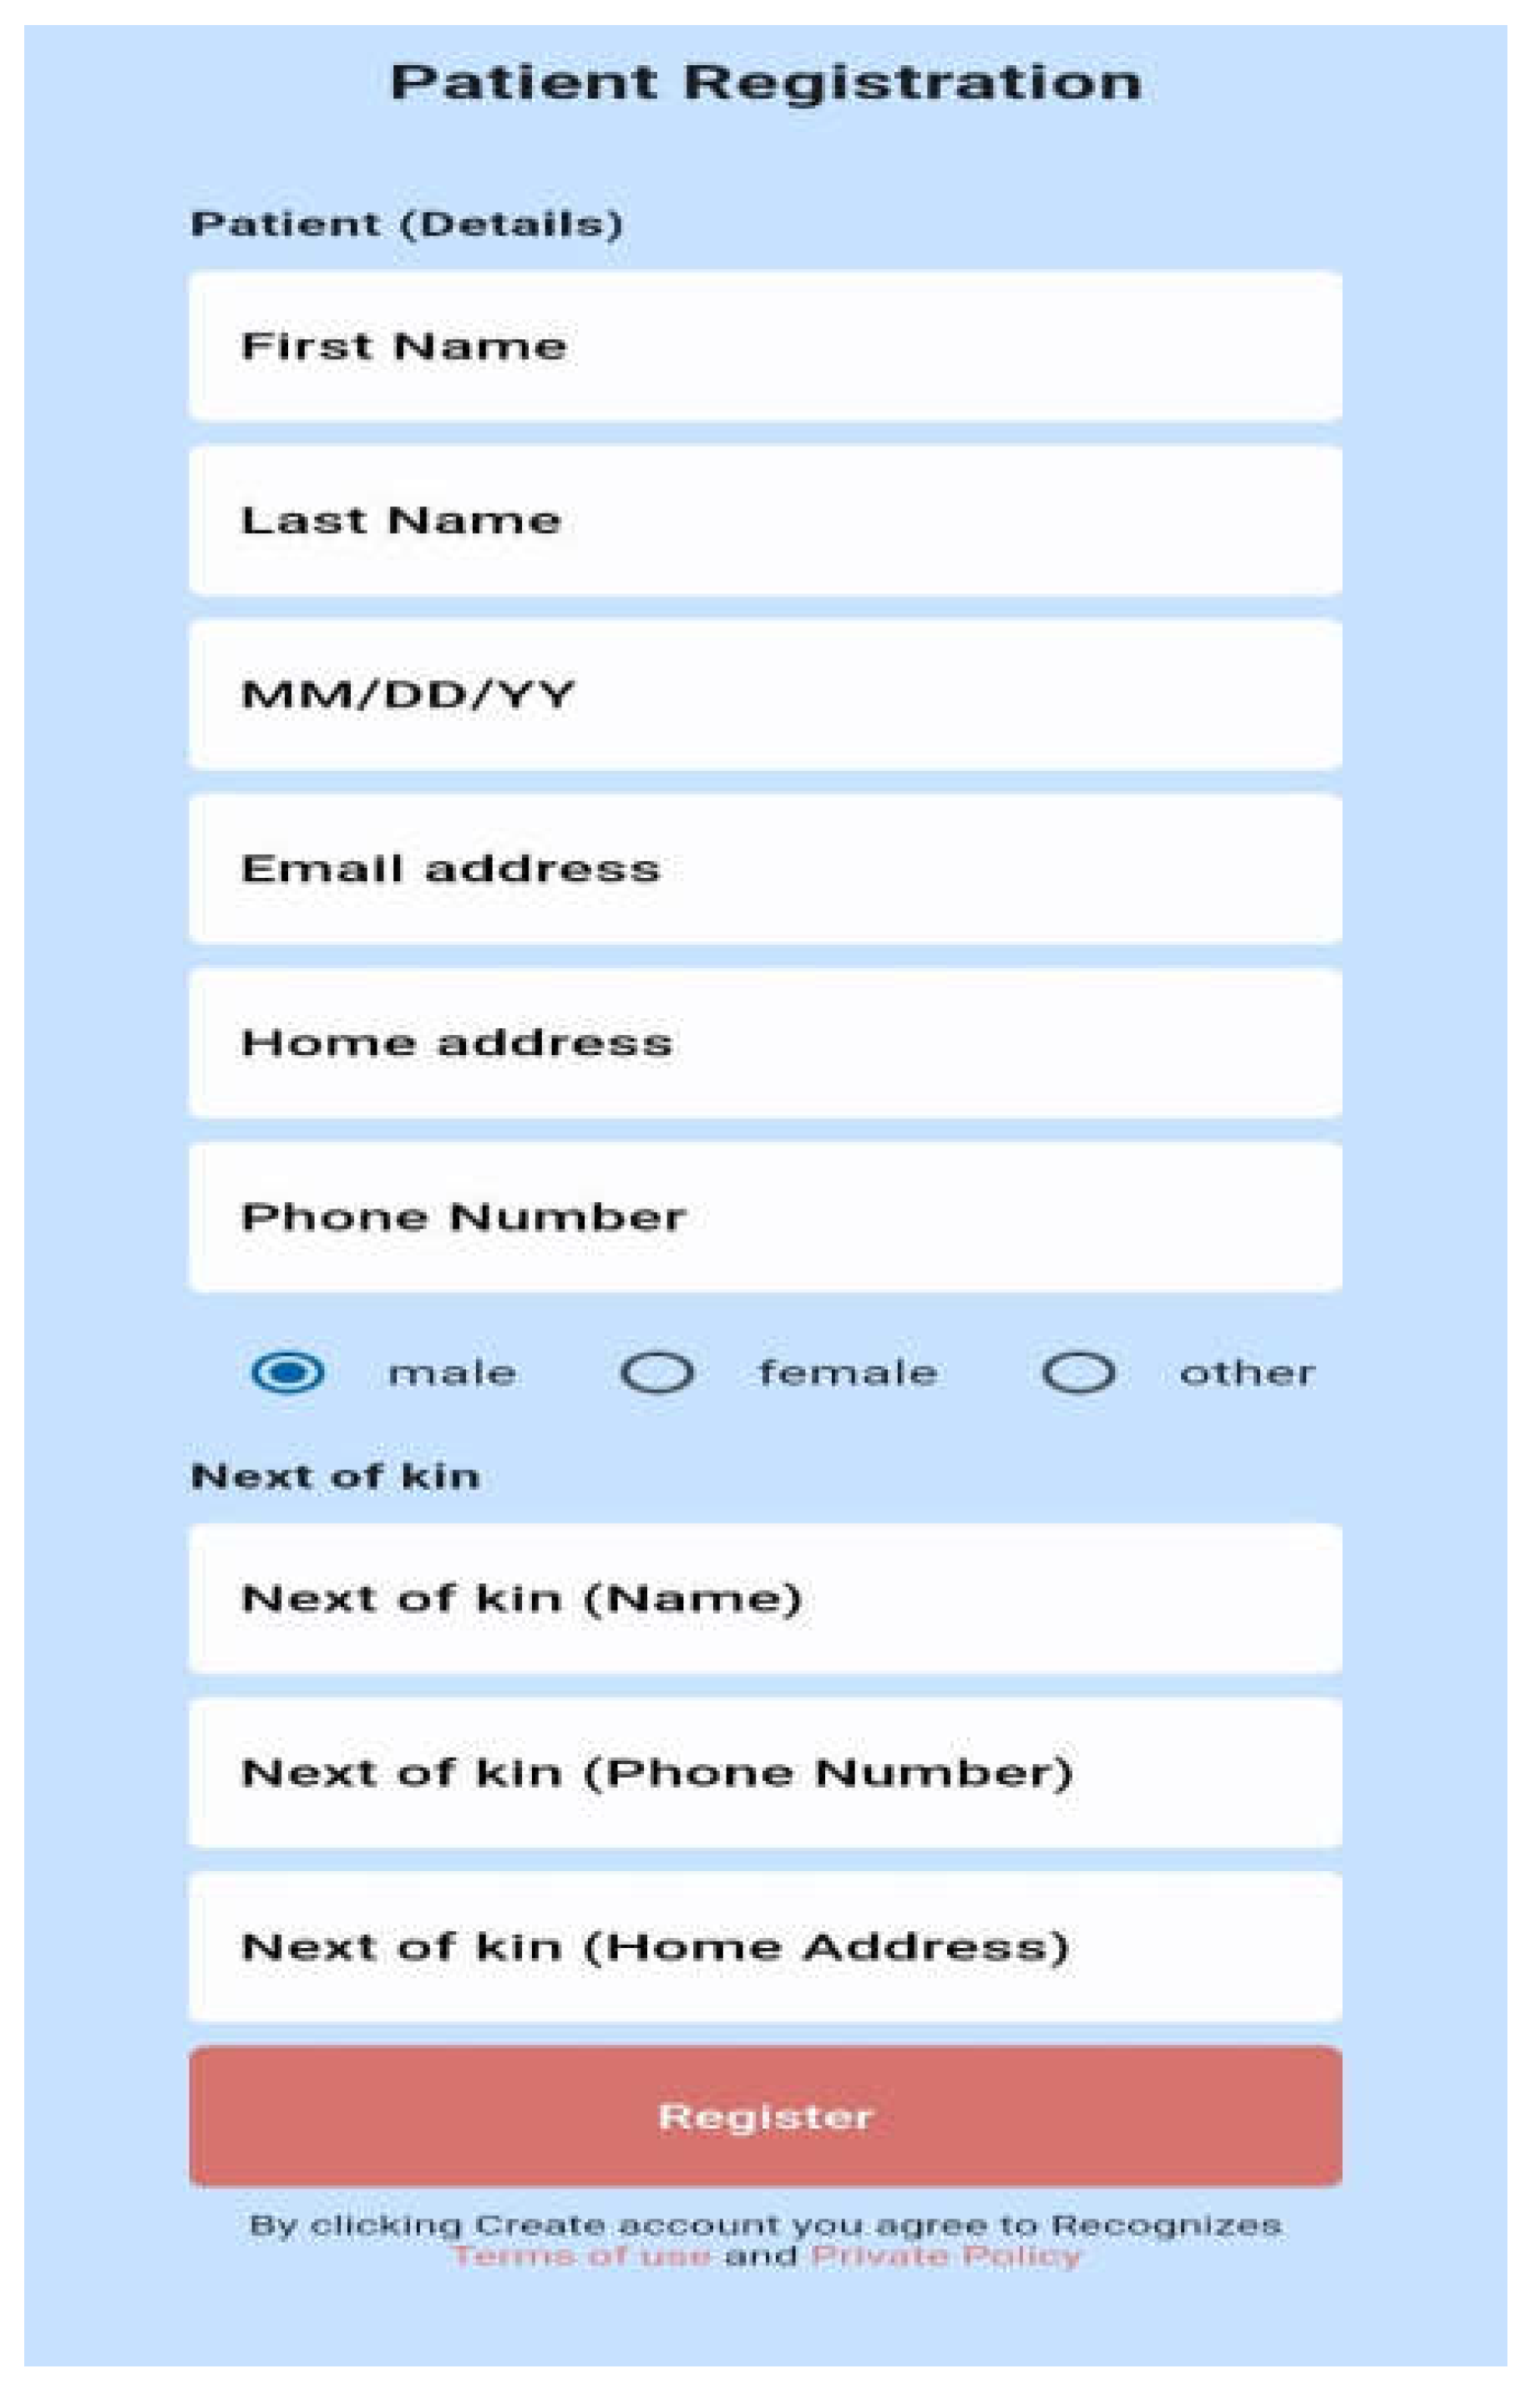
Figure 15.
Patient List.
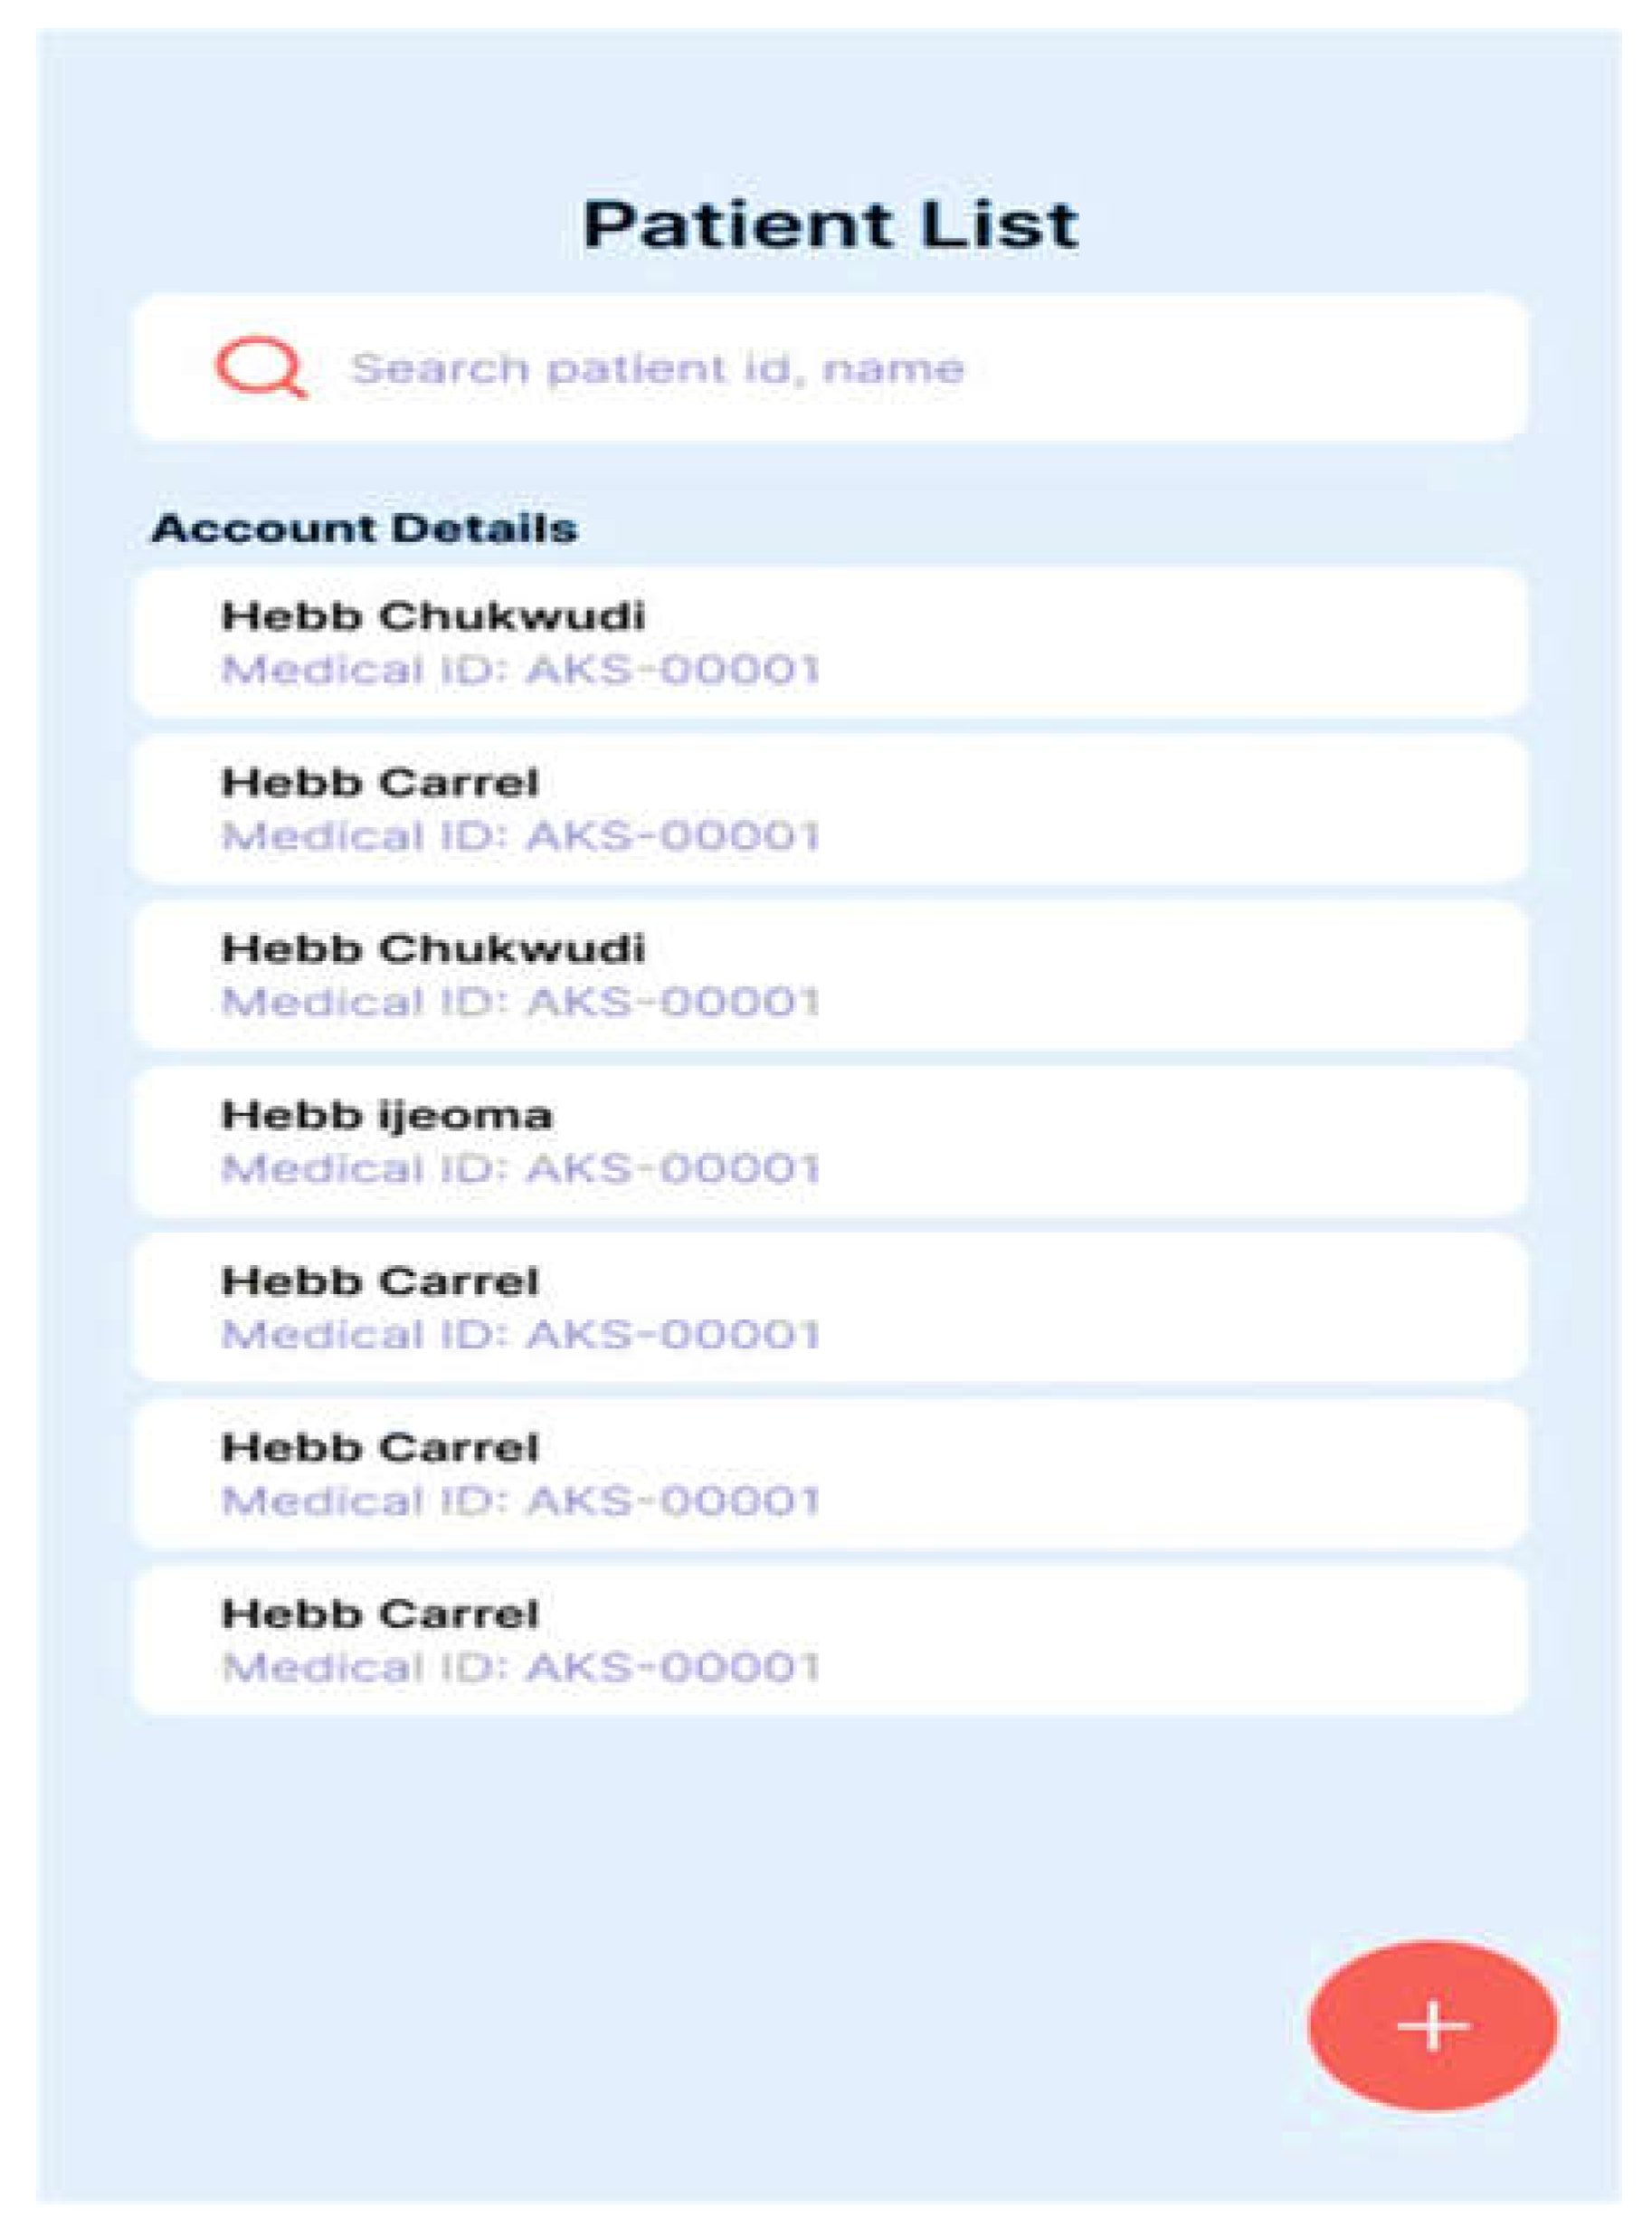
Figure 16.
Patient Dashboard.
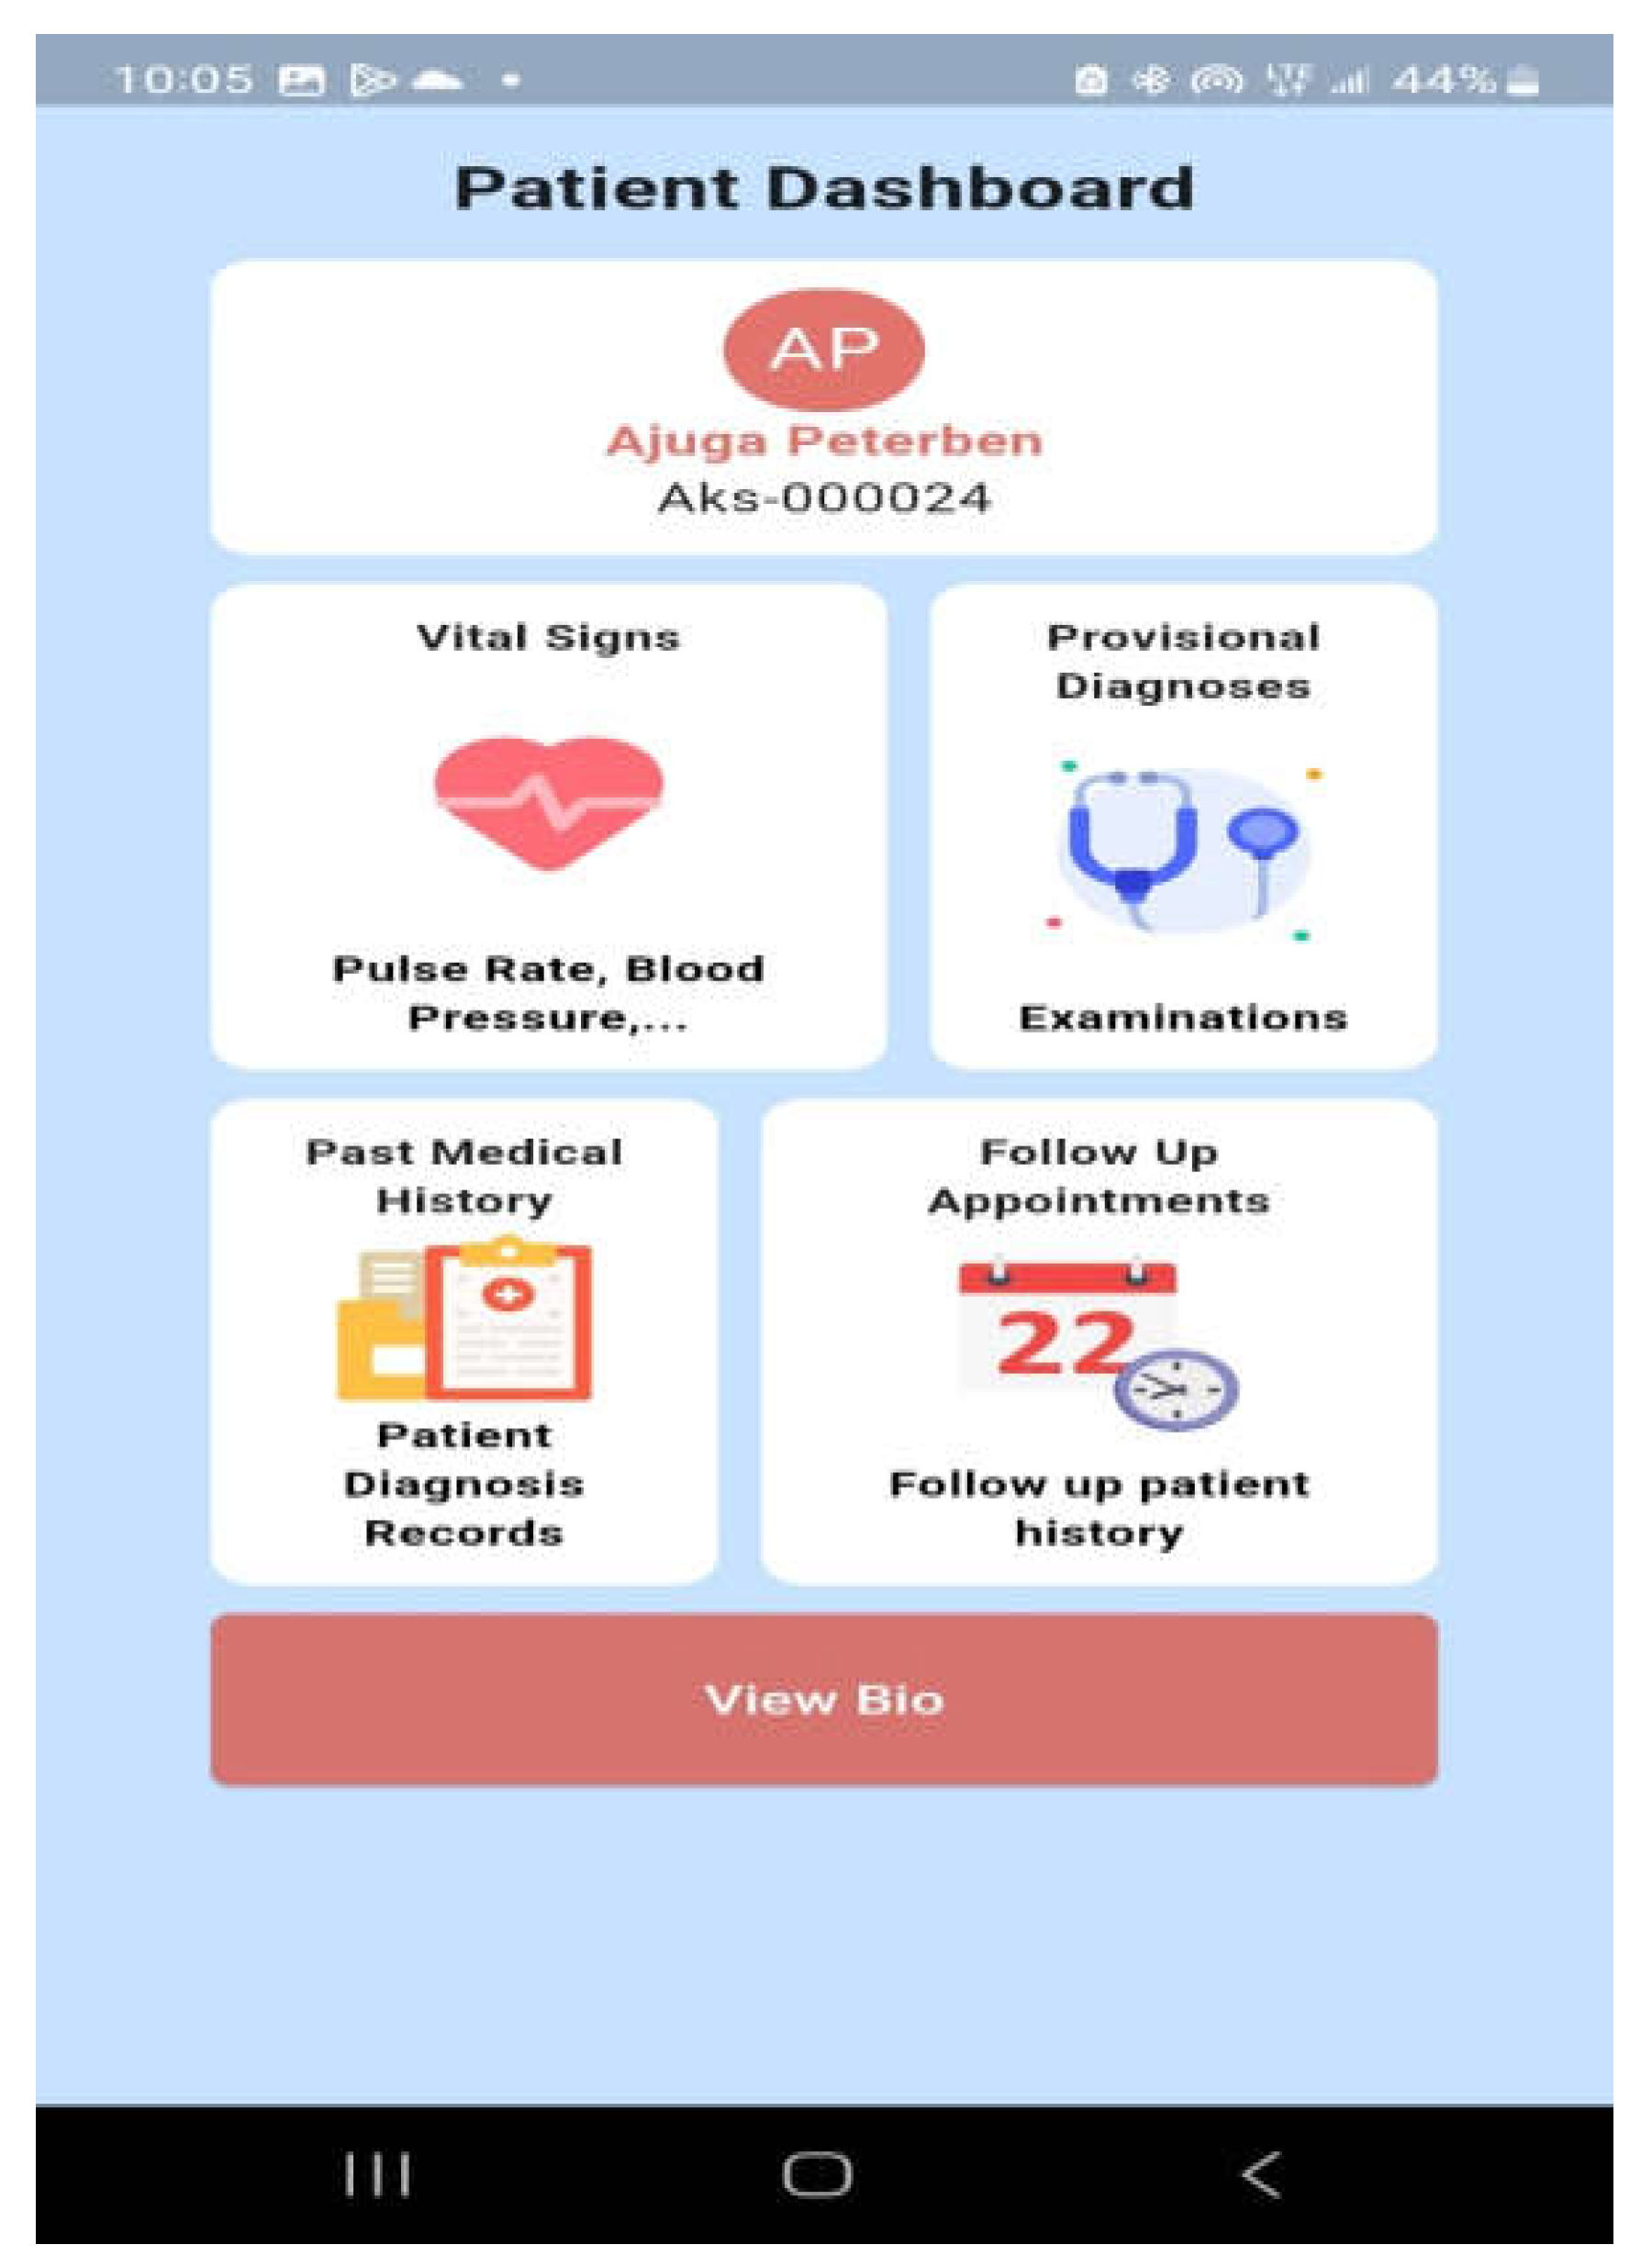
Figure 17.
History Taking and Examination.
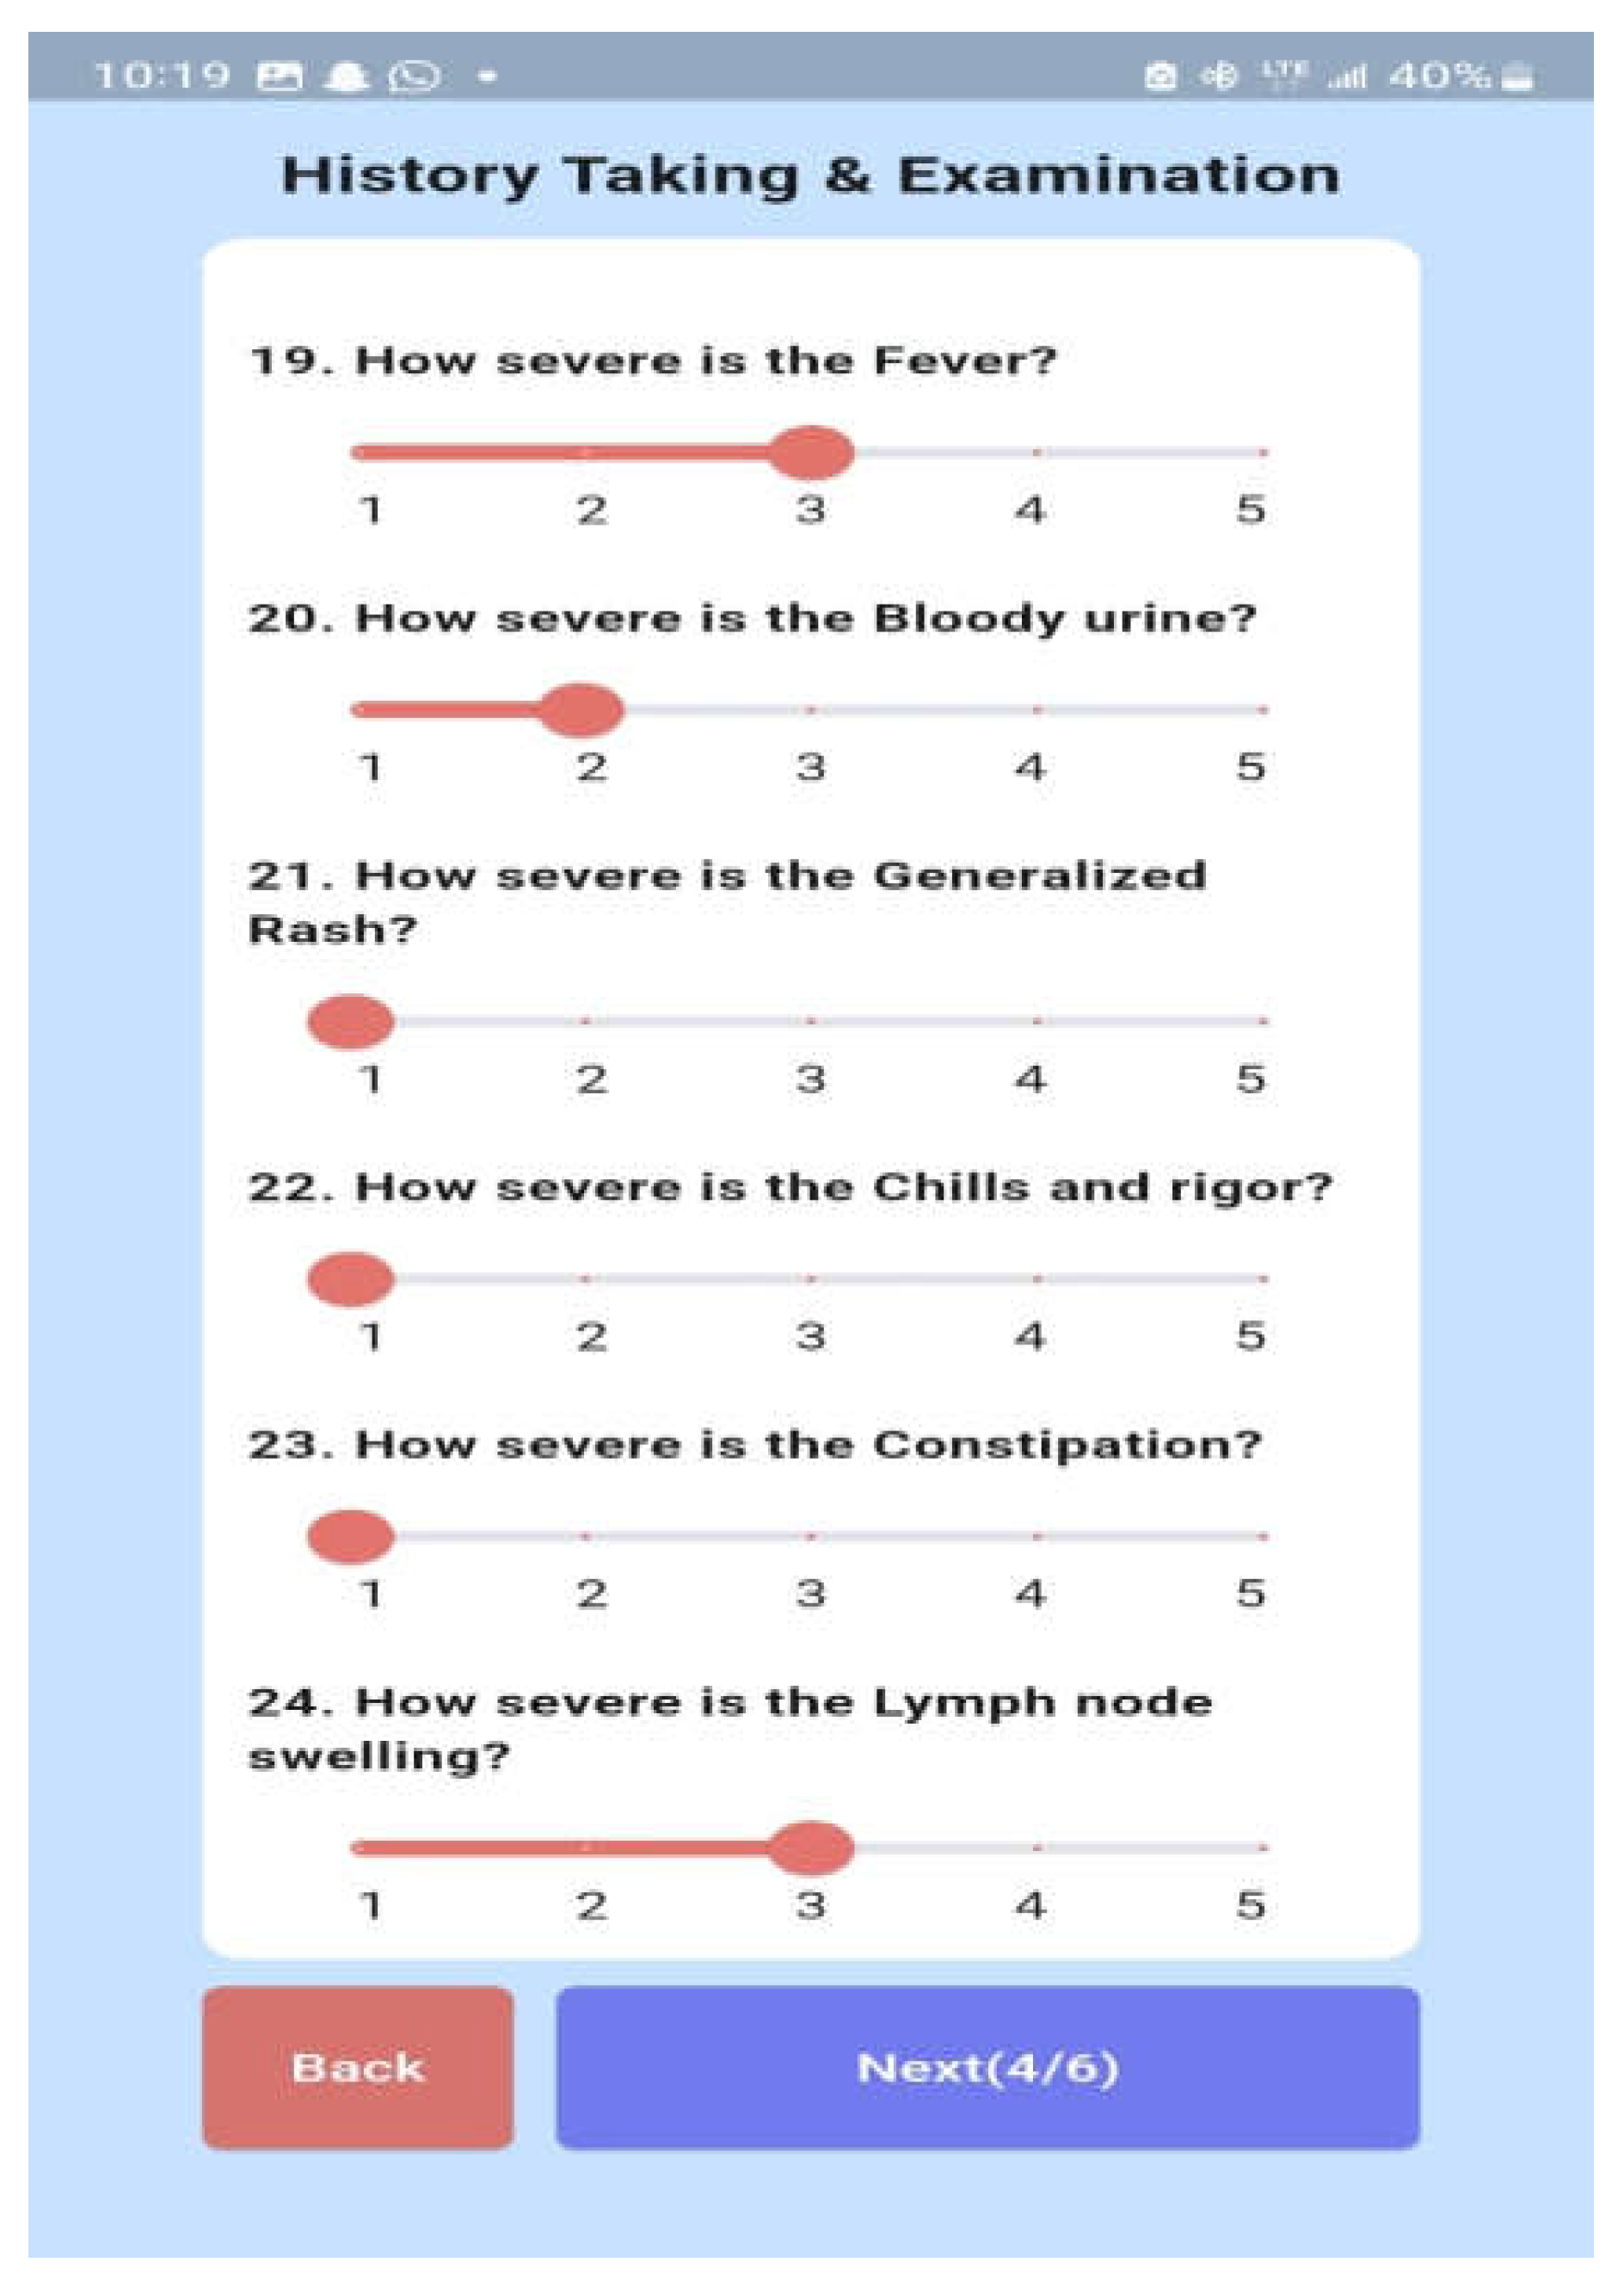
Figure 18.
Explainable Diagnosis Page.
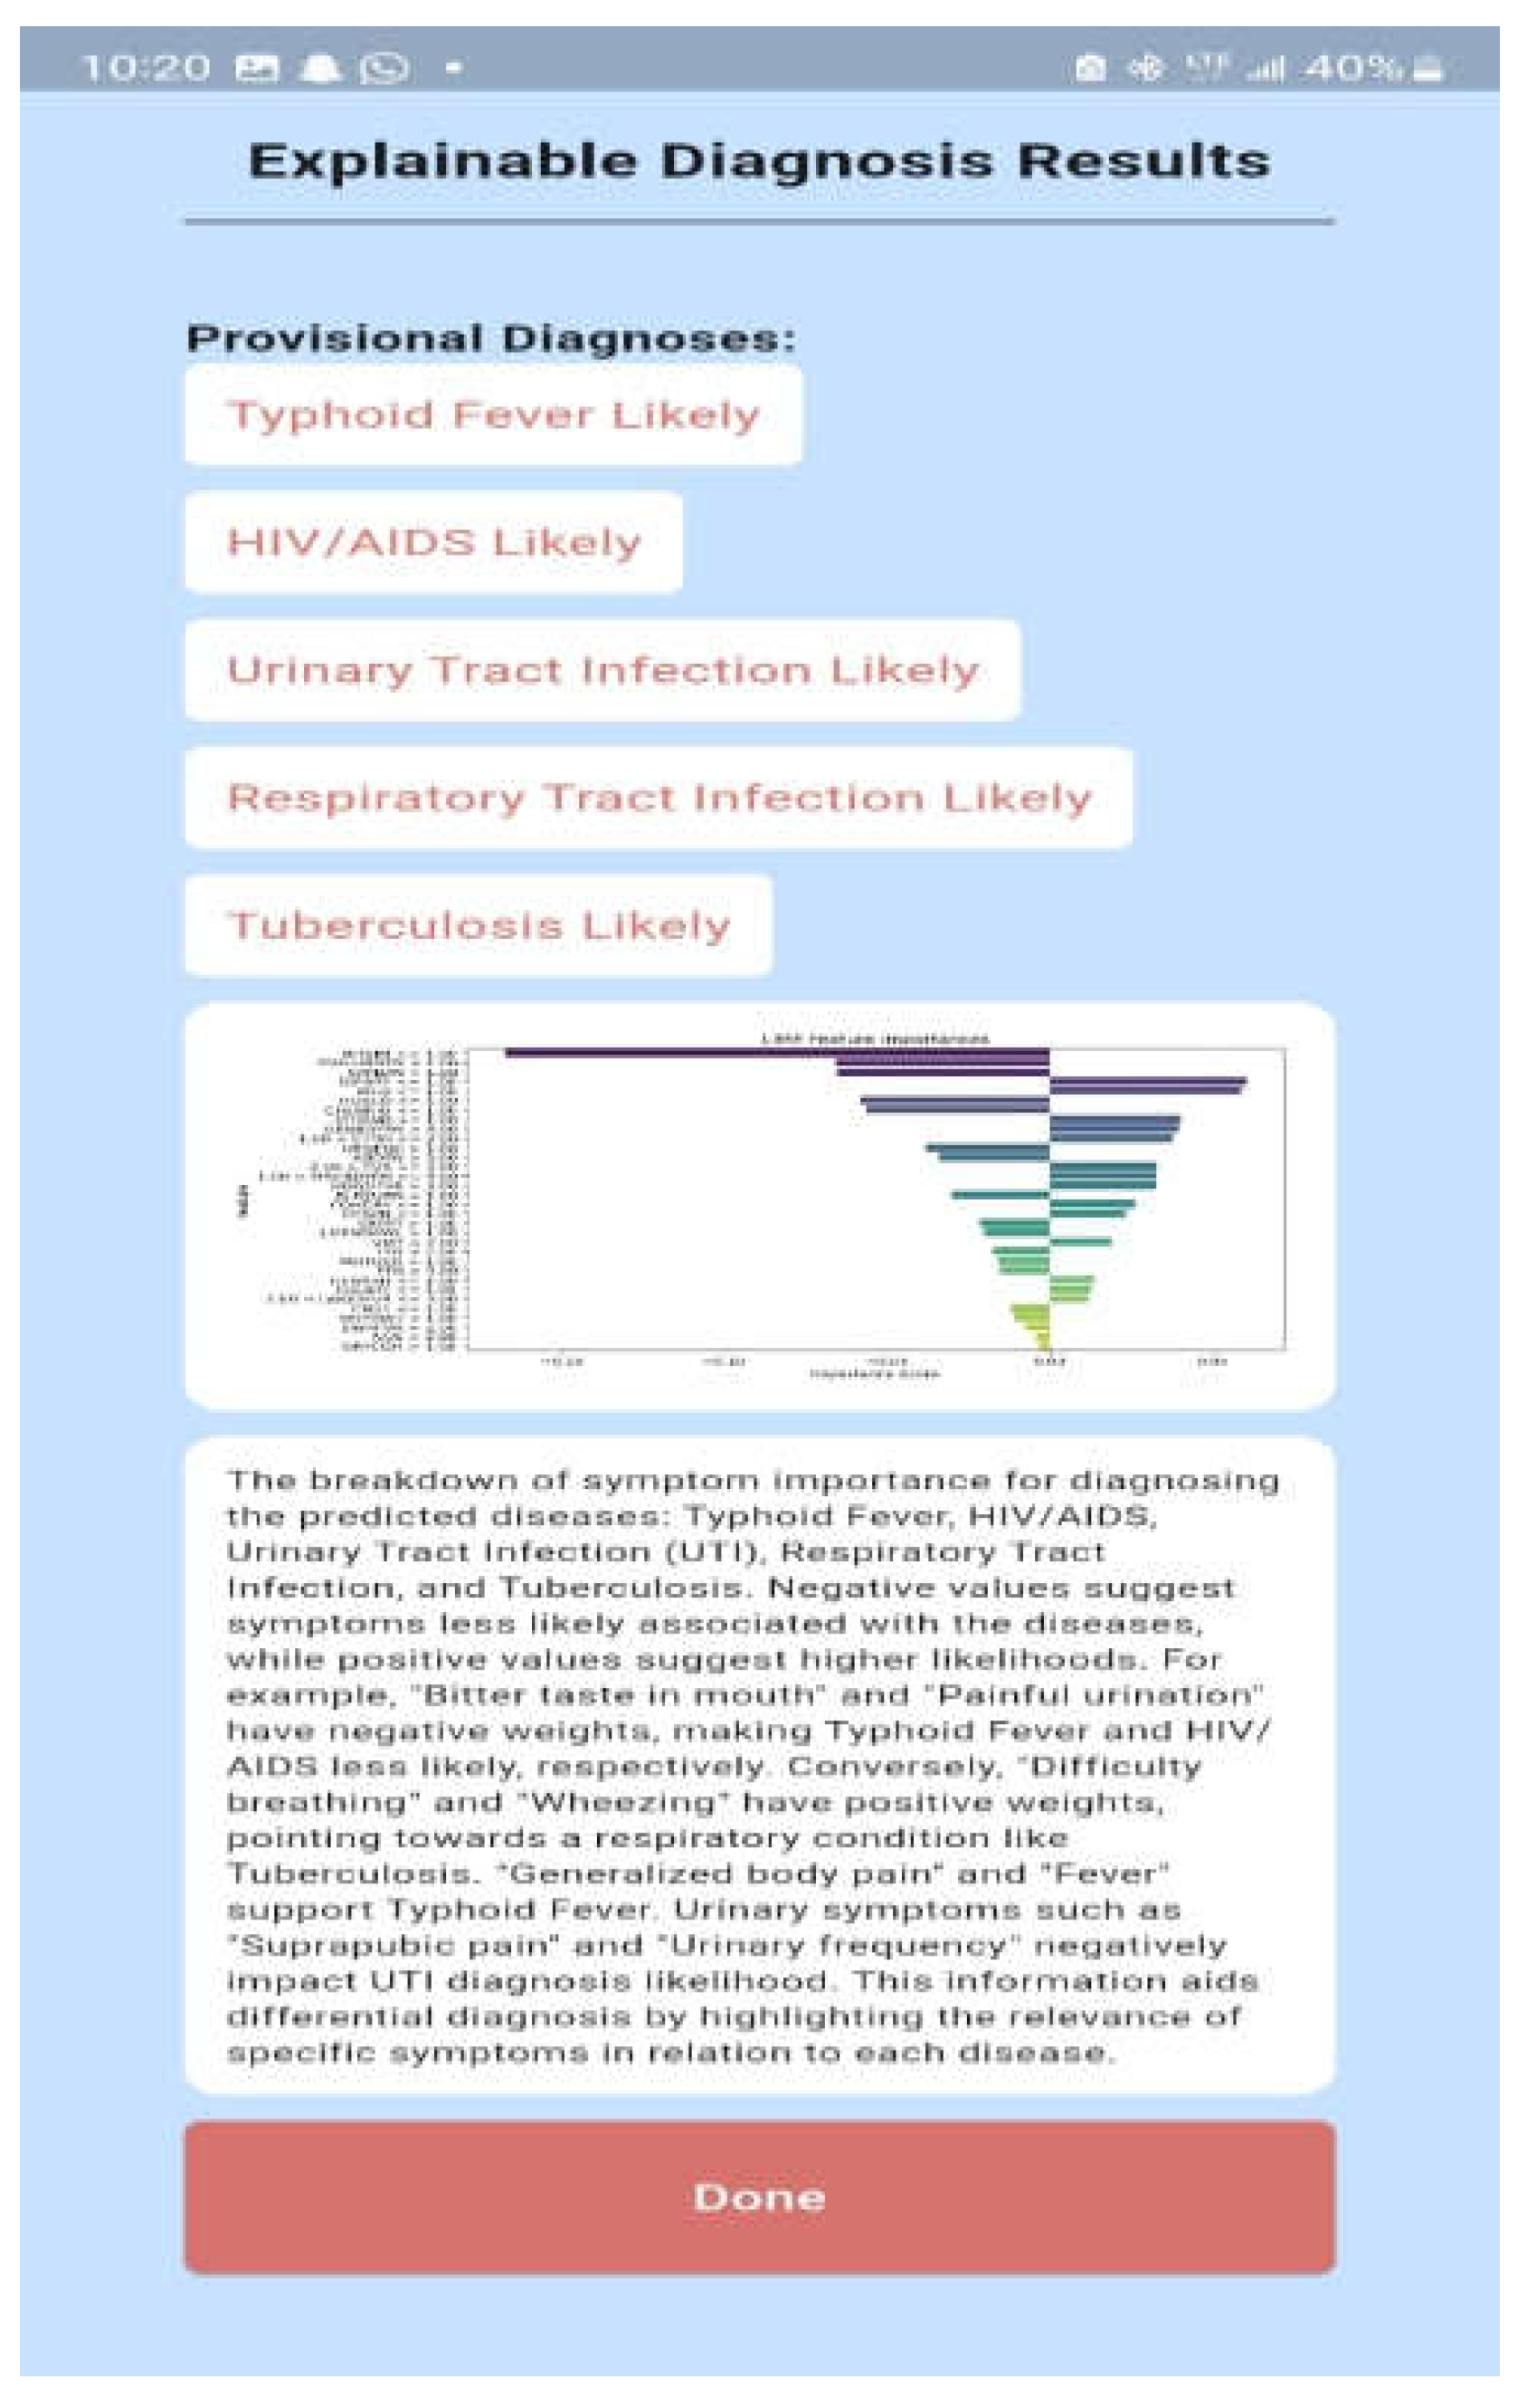
This is a dependable tool to aid healthcare workers in diagnosing febrile diseases while addressing the critical need for transparency in AI-driven healthcare solutions. With a good balance between interpretability and diagnostic performance, Random Forest was reliable and easily interpreted, showing a strong performance in diagnosing most of the febrile diseases, its moderate complexity makes it easier to integrate into mobile apps for real-time diagnoses. RF's interpretability through LIME makes it easier for healthcare professionals to understand the diagnoses and validate the system, crucial for real-world application in healthcare settings. The GPT model explanation is suitable for use in our system because of its context-based explanations of complex results. GPT, as a large language model, can generate relevant and contextually appropriate diagnostic information based on patient symptoms. In this case, the diagnoses for diseases like Typhoid Fever, HIV/AIDS, Urinary Tract Infection, Respiratory Tract Infection, and Tuberculosis are aligned with known medical presentations. The combination of symptom-specific input and advanced language processing allows the GPT model to interpret complex medical data, making it valuable for diagnosis in resource-scarce settings.
5. Conclusions
This study successfully developed a data-driven and explainable diagnostic model for febrile diseases, combining ML algorithms with XAI frameworks and LLMs. The model demonstrated strong predictive performance and addressed the critical issue of transparency in AI-driven healthcare. The RF, XGBoost, and MLP algorithms exhibited robust capabilities, with RF achieving the highest performance and interpretability metrics. Integration with XAI frameworks such as LIME and LLMs like ChatGPT provided textual and visual explanations, increasing trust and usability for healthcare providers. The system proved adaptable to multiple febrile diseases and showcased potential for broader application in diverse healthcare environments. The findings of this research highlight the clinical relevance of the diagnostic framework. Rigorous data preprocessing techniques ensured a clean and well-structured dataset, allowing for optimal ML model training. The system enhanced clinical decision-making by simulating expert reasoning, enabling timely and efficient diagnosis and treatment. The framework’s scalability and its potential for mobile deployment make it particularly suited for resource-limited settings. Additionally, the study emphasized the importance of transparency in AI tools, as the interpretability provided by XAI frameworks significantly improved user trust and system adoption. To maximize the system’s real-world impact, several recommendations are proposed. Healthcare providers in LMICs should consider piloting the model in clinical settings, supported by collaborations with public health agencies. Expanding the dataset to include diverse populations, especially pediatric patients under five years old, and broader disease categories, such as hemorrhagic fevers, will enhance the system’s applicability. Continuous training and updates using new patient data and advancements in AI are also crucial. Moreover, deploying the model on mobile platforms can increase accessibility for frontline healthcare workers, particularly in remote and underserved areas. Despite its strengths, the study faced certain limitations. The exclusion of pediatric populations under five years of age and diseases like hemorrhagic fevers restricted the dataset’s scope, reducing the model’s generalizability. While LIME and ChatGPT provided valuable explanations, further refinement is needed to mitigate potential biases or oversimplifications in their outputs. The resource-intensive nature of the model’s development and the need for extensive training of healthcare providers could also pose challenges to its adoption in LMICs. Additionally, long-term validation is necessary to confirm the model’s effectiveness and reliability in real-world scenarios. In conclusion, this study demonstrates the transformative potential of integrating explainable AI and ML methodologies to address diagnostic challenges in LMICs. By promoting transparency, scalability, and clinical relevance, the proposed system represents a significant step forward in improving healthcare delivery for febrile diseases. Addressing the identified limitations and expanding the system’s applicability will further enhance its impact on global health outcomes
Author Contributions
Conceptualization, F.-M.U., C.A., and K.A.; methodology, K. A., C.A., and F.-M.U.; validation, F.-M.U., K. A., and C.A. .; formal analysis, K. A.; data curation, K.A..; writing—original draft preparation, K. A., and C.A. and F.-M.U.; writing—review and editing, K. A., C. A., and F.-M.U. supervision, F.-M.U., and C. A. ; project administration, F.-M.U. funding acquisition, F.-M.U. All authors have read and agreed to the published version of the manuscript
Funding
Please add: This research was funded by the New Frontier Research Fund, grant number NFRFE-2019-01365 between April 2020 and March 2024.
Institutional Review Board Statement
Not applicable.
Informed Consent Statement
Not applicable.
Data Availability Statement
The raw data supporting the conclusions of this article will be made available by the authors on request.
Conflicts of Interest
The authors declare no conflict of interest
References
- Premaratna, R. Dealing with acute febrile illness in the resource-poor tropics. Trop. Med. Surg. 2013, 1, 1. [Google Scholar] [CrossRef]
- Butcher, L. Prognosis? Misdiagnosis! The High Price of Getting It Wrong. Manag. Care (Langhorne, Pa.) 2019, 28 (3), 32–36.
- Attai, K.; Amannejad, Y.; Vahdat Pour, M.; Obot, O.; Uzoka, F. M. A systematic review of applications of machine learning and other soft computing techniques for the diagnosis of tropical diseases. Trop. Med. Infect. Dis. 2022, 7(12), 398. [Google Scholar] [CrossRef]
- Bagam, N. Applications of Machine Learning in Healthcare Data Analysis. Int. J. Sci. Res. Comput. Sci. Eng. Inf. Technol. 2020. [CrossRef]
- Naveed, M. A. Transforming healthcare through artificial intelligence and machine learning. Pak. J. Health Sci. 2023, 01 (1). [CrossRef]
- Kupusinac, A.; Doroslovački, R. An Overview of the Algorithmic Diagnostics Methodology: A Big Data Approach. 2018 Zooming Innovation in Consumer Technologies Conference (ZINC) 2018, 104–105. [Google Scholar] [CrossRef]
- Wu, W.; Zhou, H. Data-driven diagnosis of cervical cancer with support vector machine-based approaches. IEEE Access 2017, 5, 25189–25195. [Google Scholar] [CrossRef]
- Gupta, D.; Kose, U.; Le Nguyen, B.; Bhattacharyya, S. Artificial Intelligence for Data-Driven Medical Diagnosis; De Gruyter: Berlin, Boston, 2021. [Google Scholar] [CrossRef]
- Jiang, S.; Wang, T.; Zhang, K. H. Data-driven decision-making for precision diagnosis of digestive diseases. Biomed. Eng. Online 2023, 22(1), 87. [Google Scholar] [CrossRef] [PubMed]
- Hu, J.; Perer, A.; Wang, F. Data-driven analytics for personalized healthcare. In Healthcare Information Management Systems: Cases, Strategies, and Solutions; Springer, 2016; pp 529–554. [CrossRef]
- Melnykova, N.; Shakhovska, N.; Gregus, M.; Melnykov, V.; Zakharchuk, M.; Vovk, O. Data-driven analytics for personalized medical decision-making. Mathematics 2020, 8(8), 1211. [Google Scholar] [CrossRef]
- Mendhe, D.; Dogra, A.; Nair, D. S.; Punitha, S.; Preetha, D. S.; Babu, G. T. AI-Enabled Data-Driven Approaches for Personalized Medicine and Healthcare Analytics. 2024 Ninth International Conference on Science Technology Engineering and Mathematics (ICONSTEM) 2024, 1–5. [Google Scholar] [CrossRef]
- Ivanović, M.; Autexier, S.; Kokkonidis, M. AI Approaches in Processing and Using Data in Personalized Medicine. Symposium on Advances in Databases and Information Systems 2022. [CrossRef]
- Ekanayake, I. U.; Meddage, D. P.; Rathnayake, U. S. A novel approach to explain the black-box nature of machine learning in compressive strength predictions of concrete using Shapley additive explanations (SHAP). Case Stud. Constr. Mater. 2022. [CrossRef]
- Kulaklıoğlu, D. Explainable AI: Enhancing Interpretability of Machine Learning Models. Hum.-Comput. Interact. 2024. [CrossRef]
- Alblooshi, M.; Alhajeri, H.; Almatrooshi, M.; Alaraj, M. Unlocking Transparency in Credit Scoring: Leveraging XGBoost with XAI for Informed Business Decision-Making. 2024 International Conference on Artificial Intelligence, Computer, Data Sciences and Applications (ACDSA), 2024, 1–6. [CrossRef]
- Quinn, T. P.; Jacobs, S.; Senadeera, M.; Le, V.; Coghlan, S. The Three Ghosts of Medical AI: Can the Black Box Present Deliver? Artificial Intelligence in Medicine, 2020. [CrossRef]
- Inukonda, J.; Rajasekhara Reddy Tetala, V.; Hallur, J. Explainable Artificial Intelligence (XAI) in Healthcare: Enhancing Transparency and Trust. International Journal For Multidisciplinary Research, 2024. [CrossRef]
- Huang, S.; Mamidanna, S.; Jangam, S.; Zhou, Y.; Gilpin, L. Can Large Language Models Explain Themselves? A Study of LLM-Generated Self-Explanations. ArXiv, 2023, abs/2310.11207. [CrossRef]
- Hsu, C.; Wu, I.; Liu, S. Decoding AI Complexity: SHAP Textual Explanations via LLM for Improved Model Transparency. 2024 International Conference on Consumer Electronics - Taiwan (ICCE-Taiwan), 2024, 197–198. [CrossRef]
- University of Uyo Teaching Hospital; Mount Royal University. NFRF Project Patient Dataset with Febrile Diseases [Data Set]. Zenodo, 2024. [CrossRef]
- Murphy, A.; Moore, C. Random Forest (Machine Learning). Radiopaedia.org, 2019. [CrossRef]
- Yadav, D. C.; Pal, S. Analysis of Heart Disease Using Parallel and Sequential Ensemble Methods With Feature Selection Techniques. International Journal of Big Data and Analytics in Healthcare, 2021. [CrossRef]
- Yu, H.; Samuels, D. C.; Zhao, Y.; Guo, Y. Architectures and Accuracy of Artificial Neural Network for Disease Classification from Omics Data. BMC Genomics, 2019, 20. [CrossRef]
- Ribeiro, M.; Singh, S.; Guestrin, C. “Why Should I Trust You?”: Explaining the Predictions of Any Classifier. Proceedings of the 22nd ACM SIGKDD International Conference on Knowledge Discovery and Data Mining, 2016. [CrossRef]
- Thakkar, P. Drug Classification Using Black-Box Models and Interpretability. International Journal for Research in Applied Science and Engineering Technology, 2021. [CrossRef]
- Sirriani, J.; Sezgin, E.; Claman, D. M.; Linwood, S. Medical Text Prediction and Suggestion Using Generative Pretrained Transformer Models with Dental Medical Notes. Methods of Information in Medicine, 2022, 61, 195–200. [Google Scholar] [CrossRef]
- Kumar, T.; Kait, R. ; Ankita; Rani, S. Possibilities and Pitfalls of Generative Pre-Trained Transformers in Healthcare. 2023 International Conference on Advanced Computing & Communication Technologies (ICACCTech), 2023, 37–44. [CrossRef]
Figure 1.
Enhanced Diagnostic Framework.
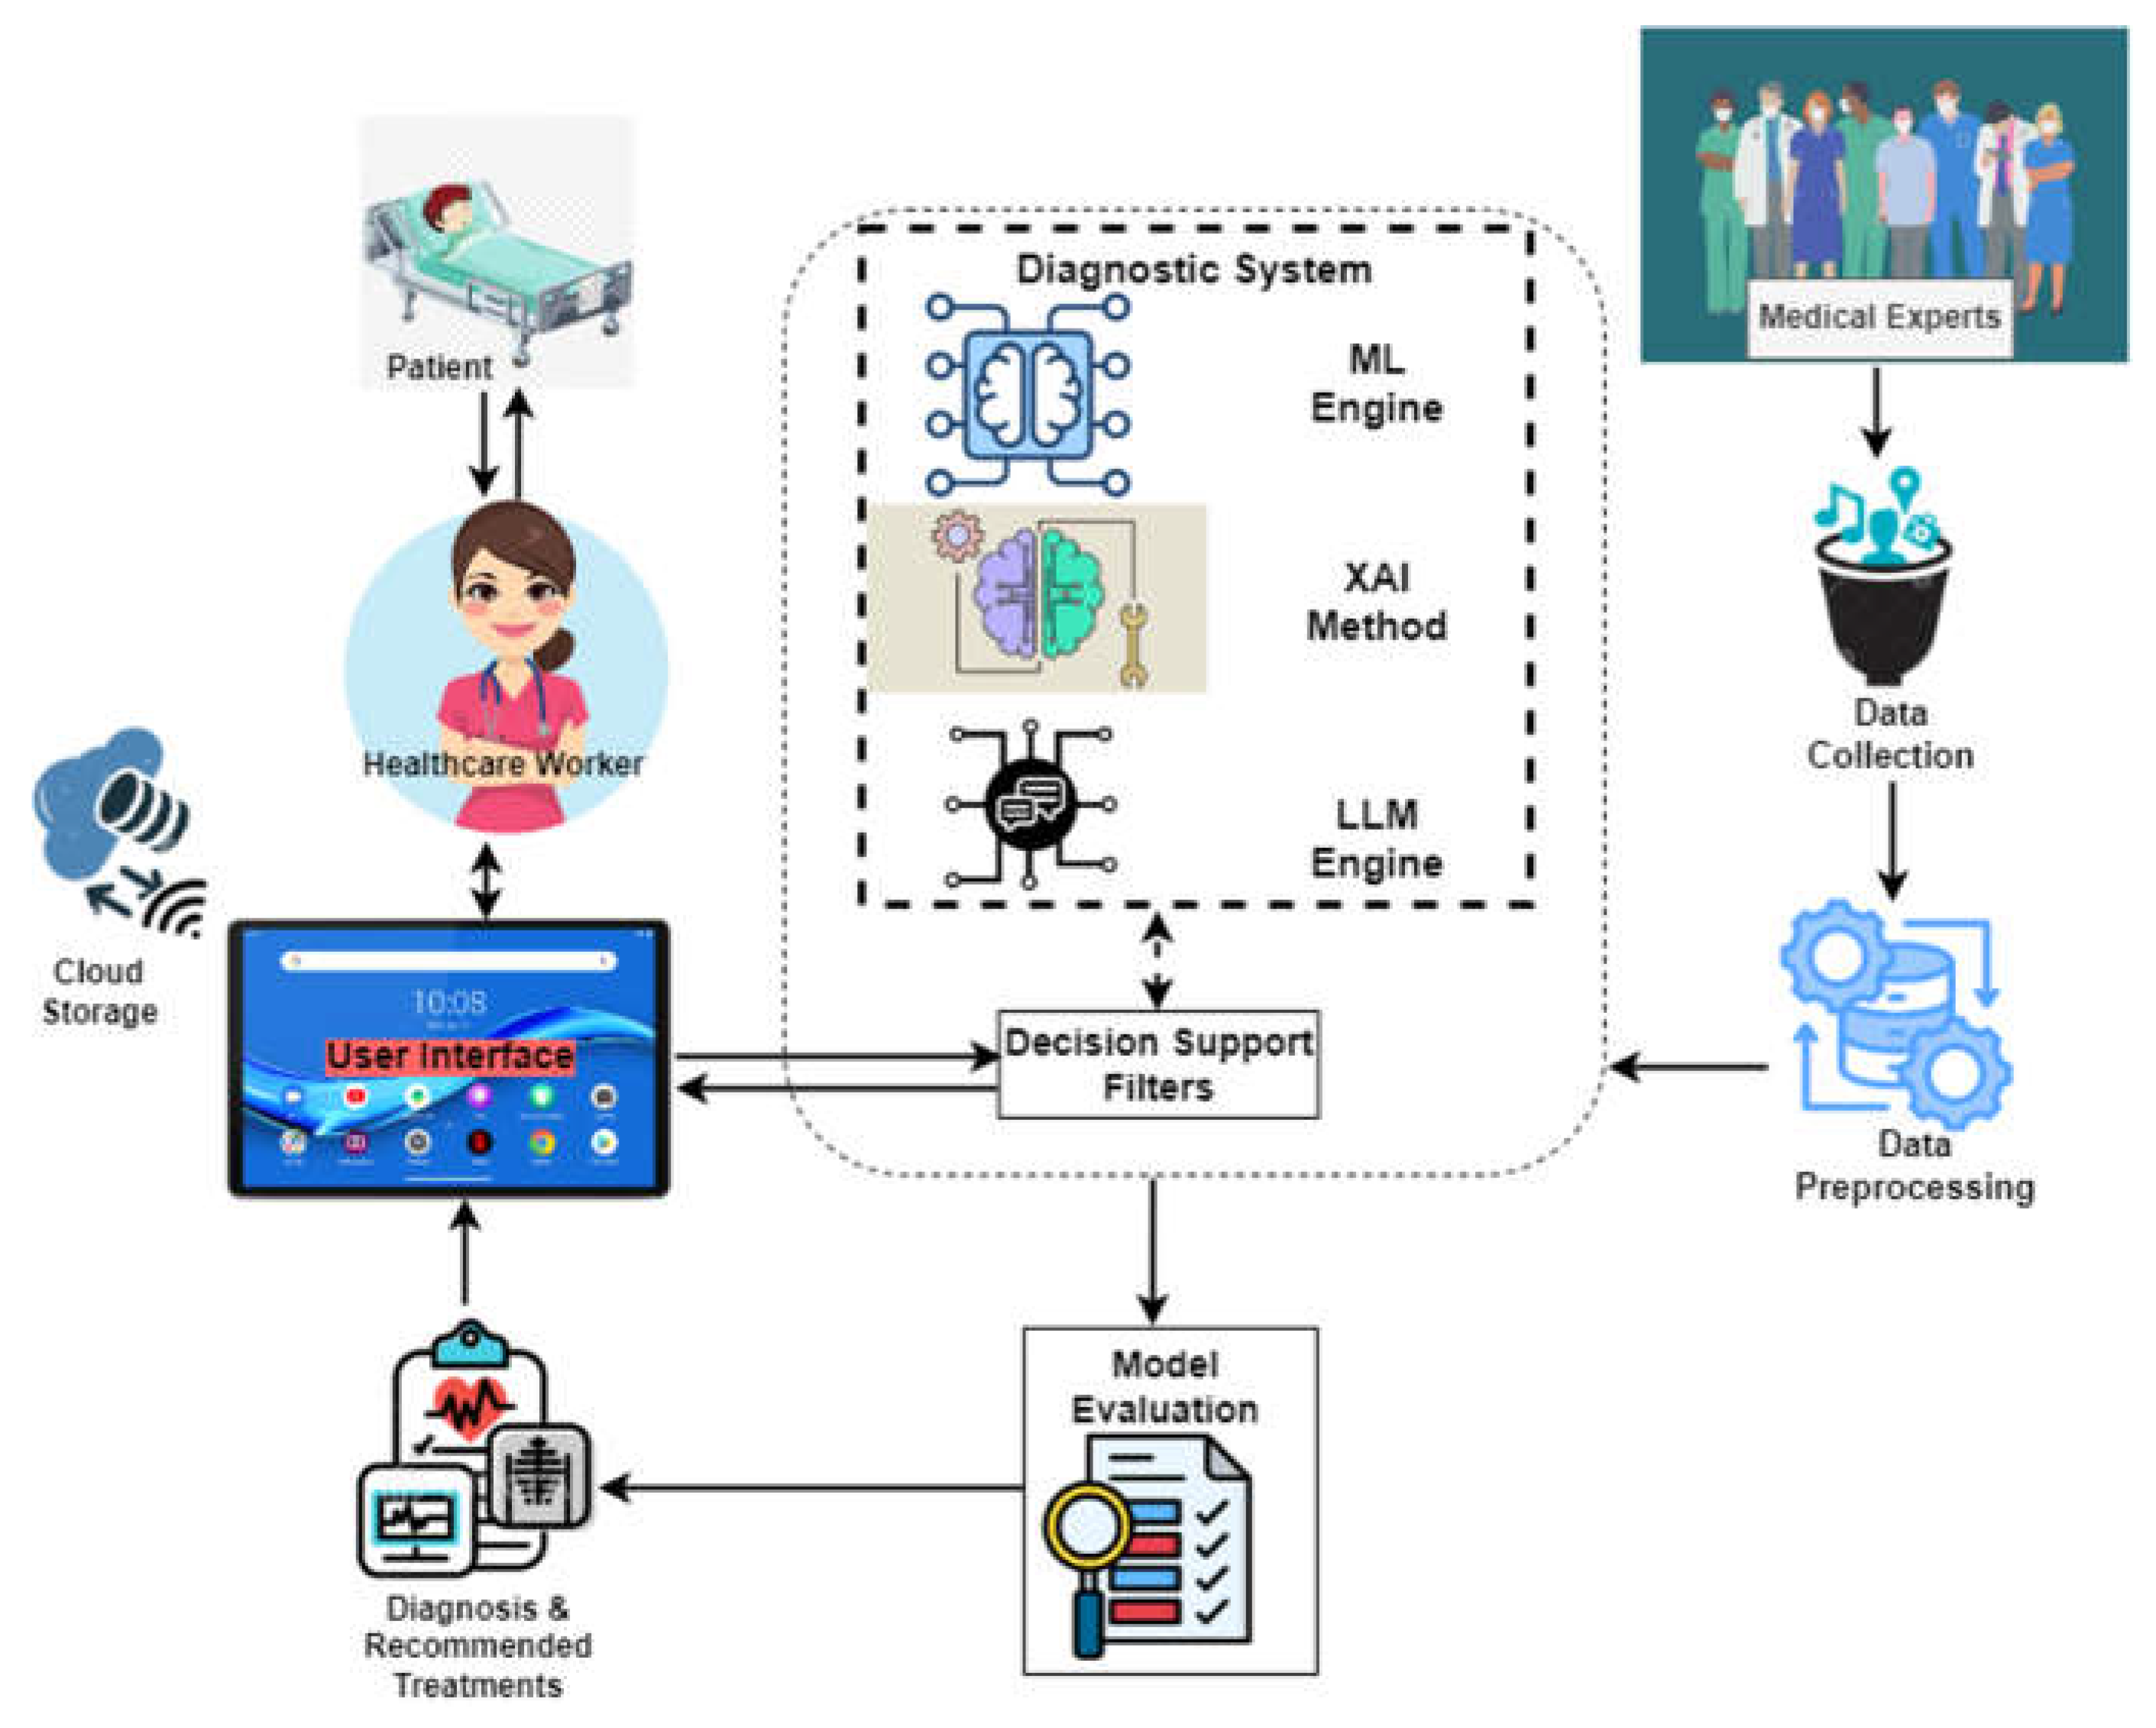
Figure 2.
The Sample Patient Dataset.
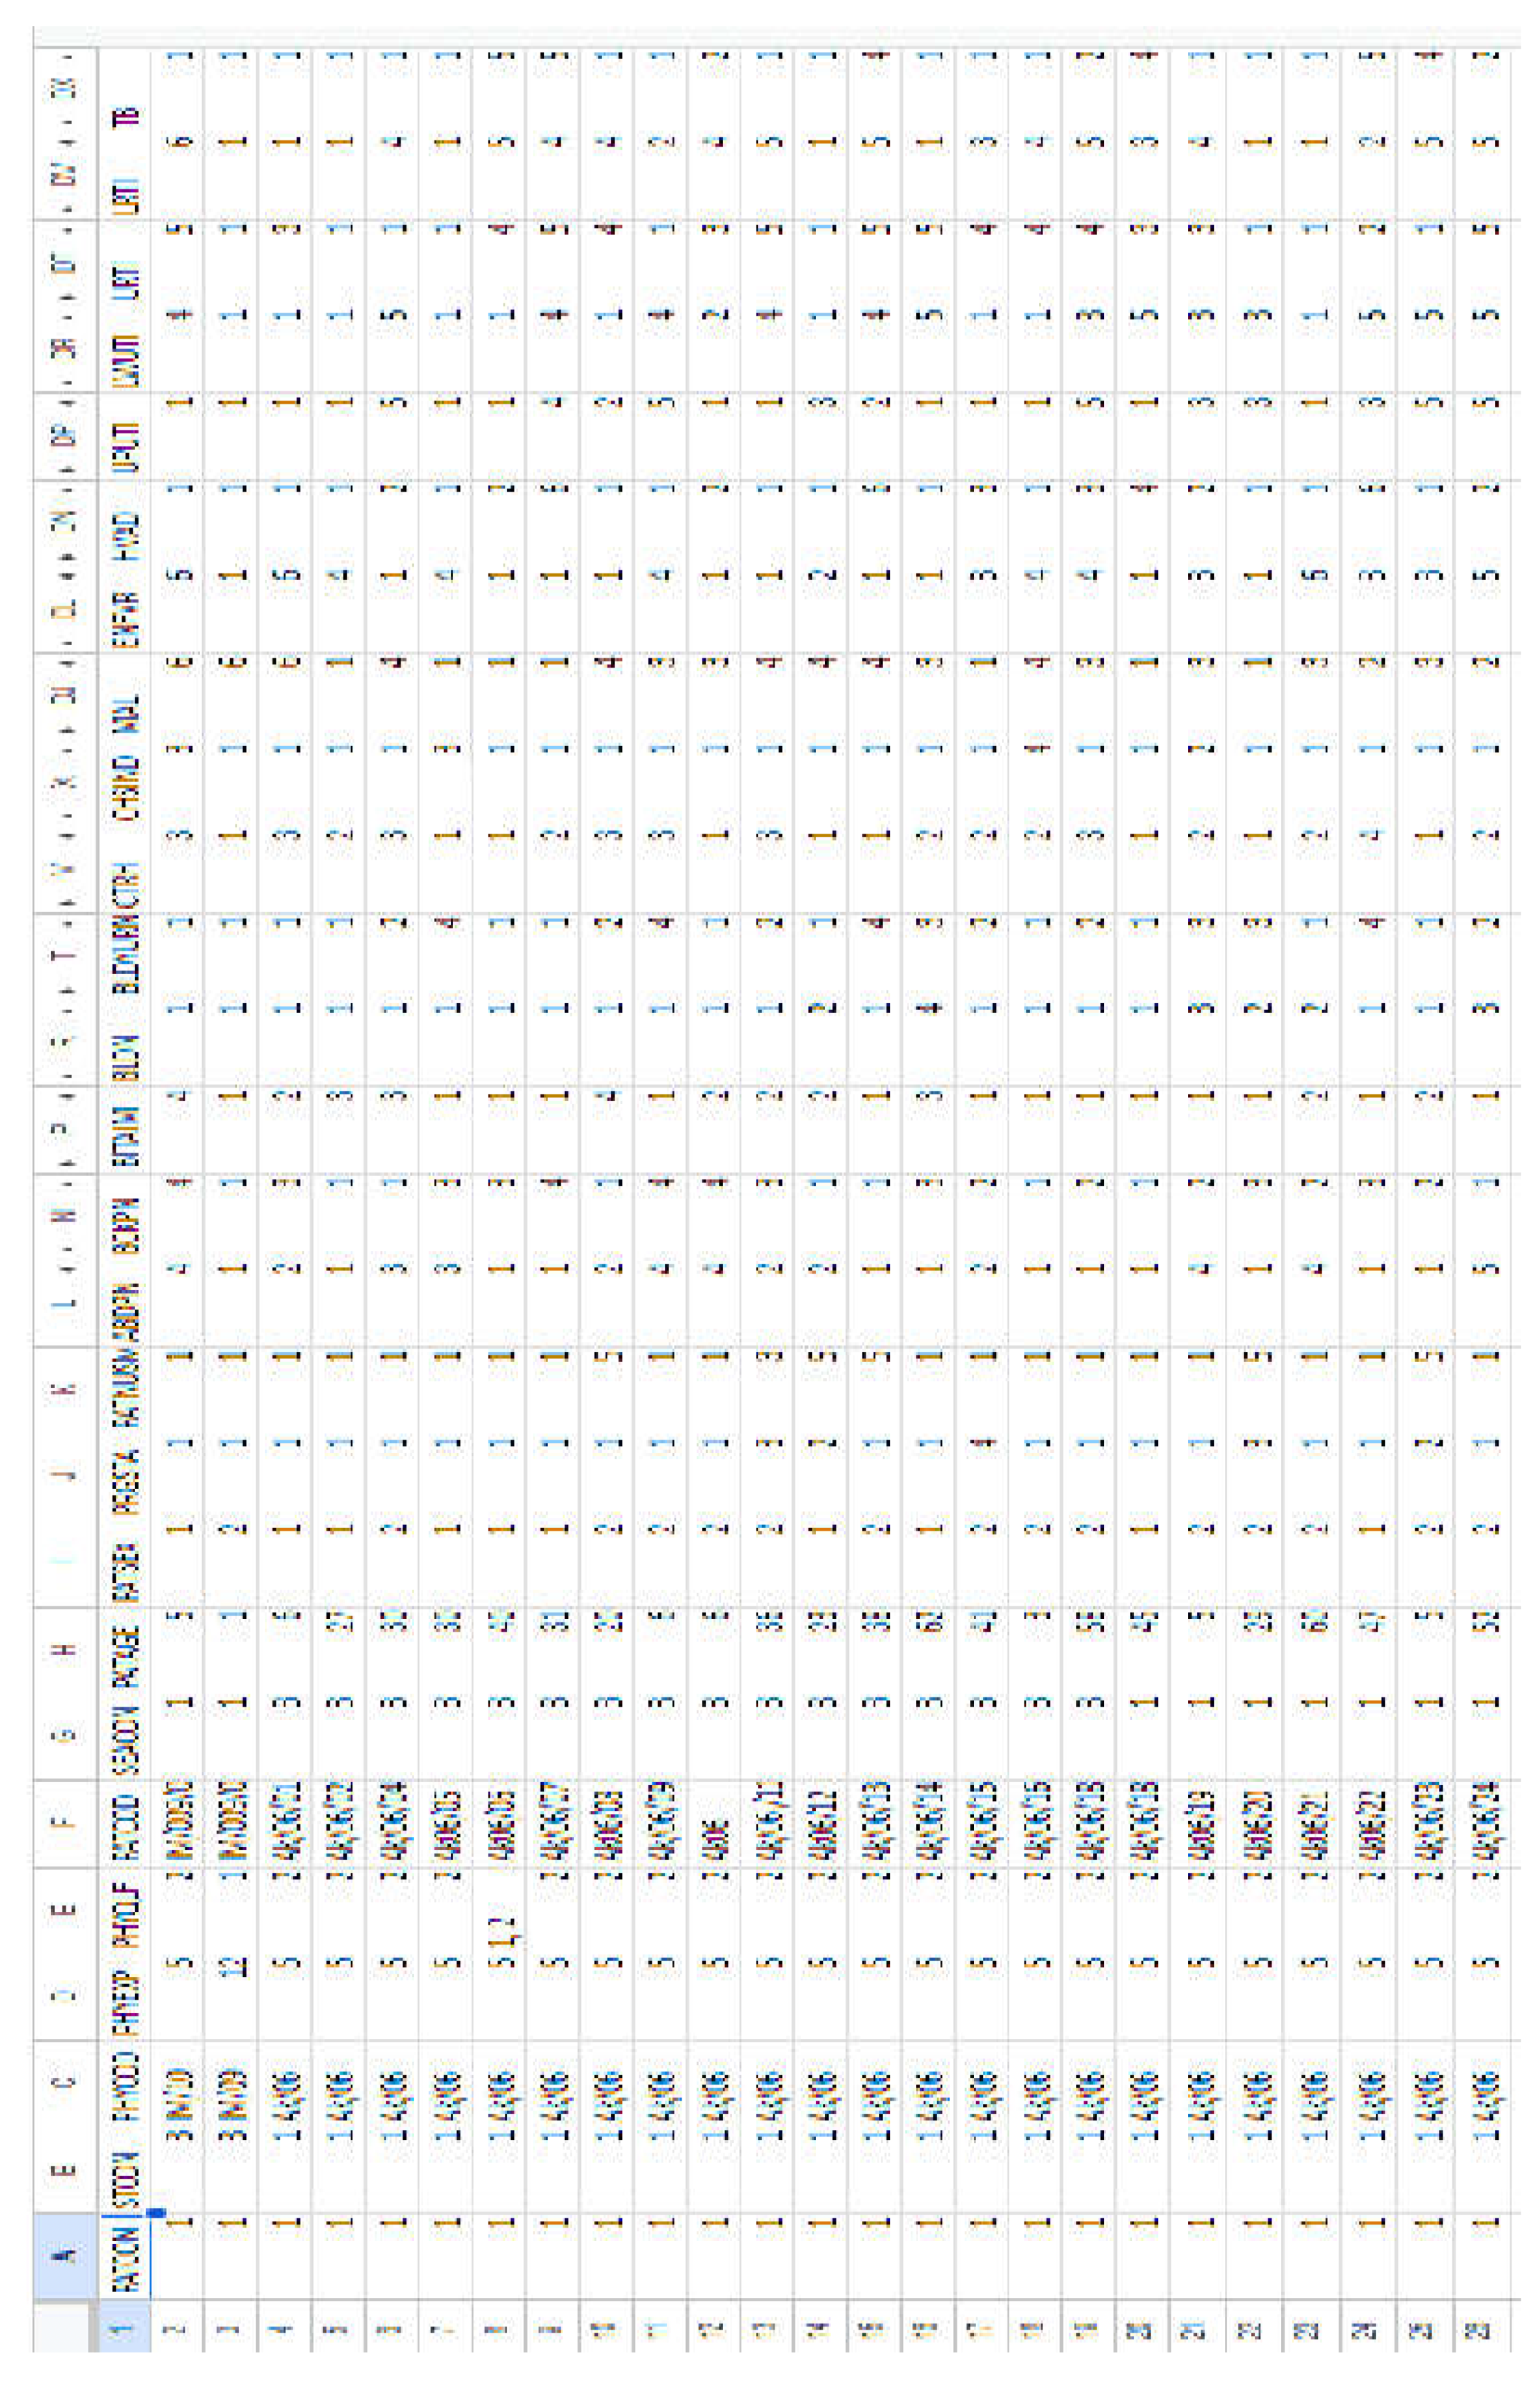
Figure 3.
Pre-processed Data.
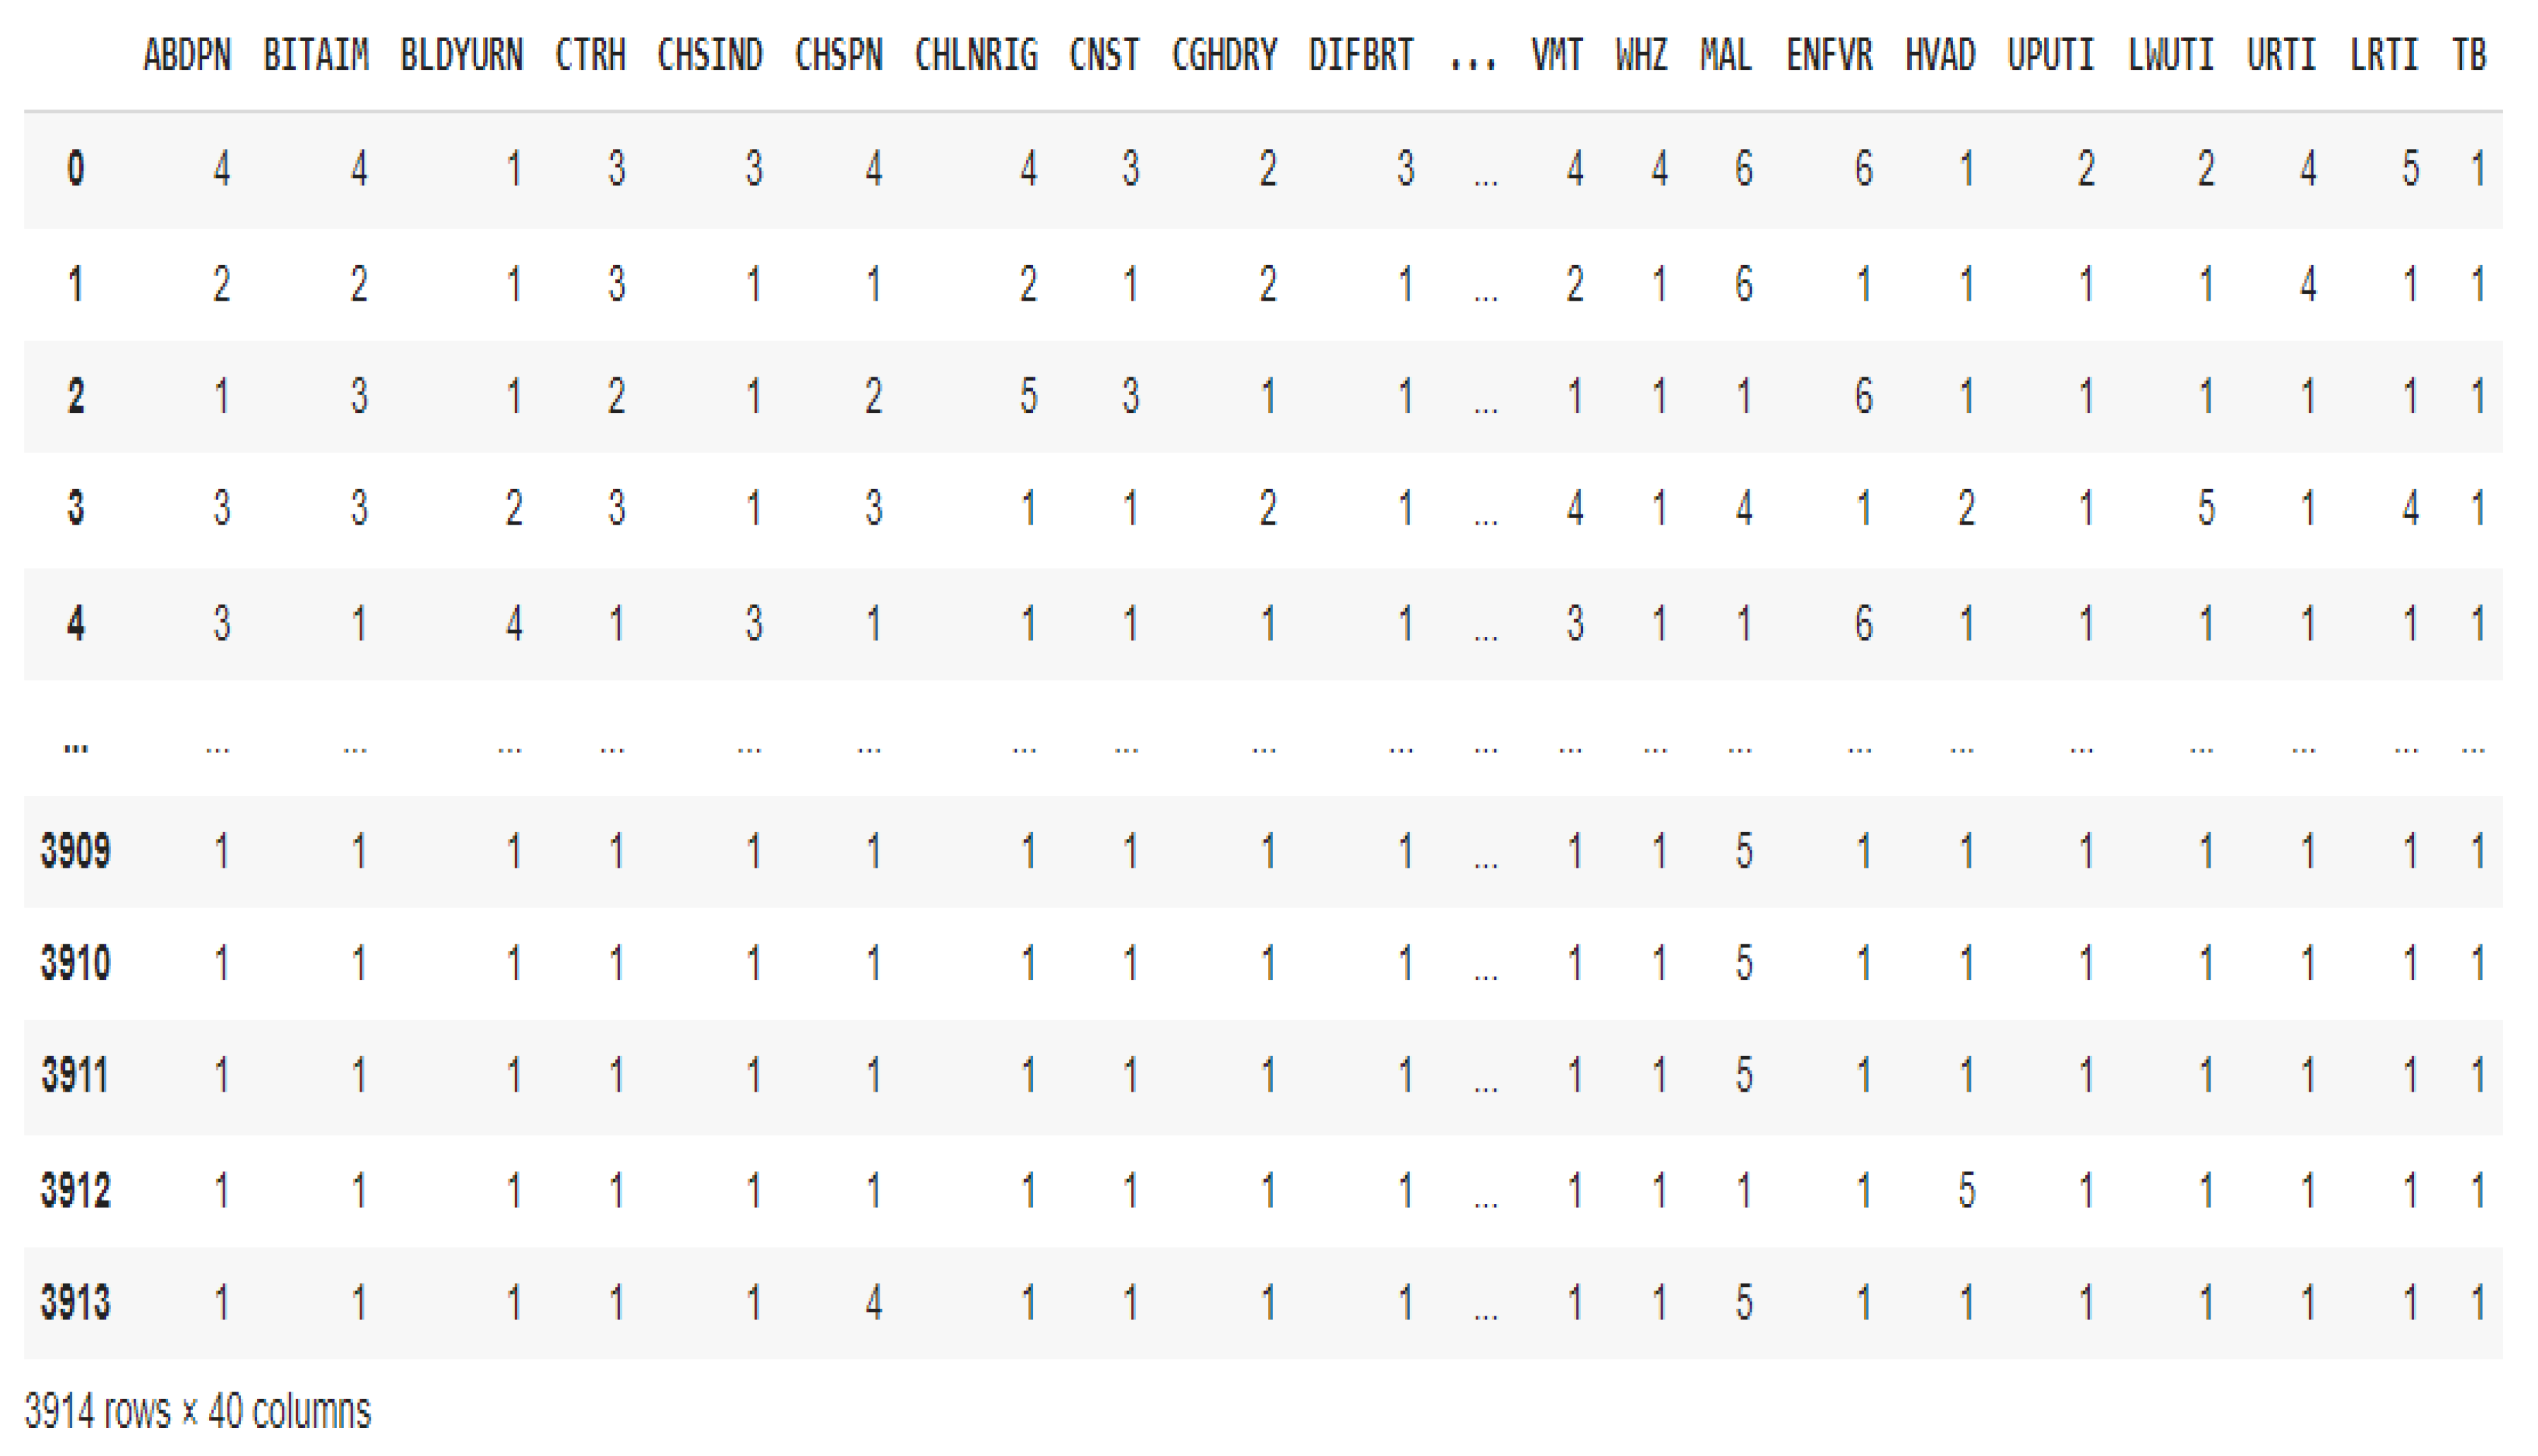
Figure 4.
Pre-processed dataset aftere max operation.
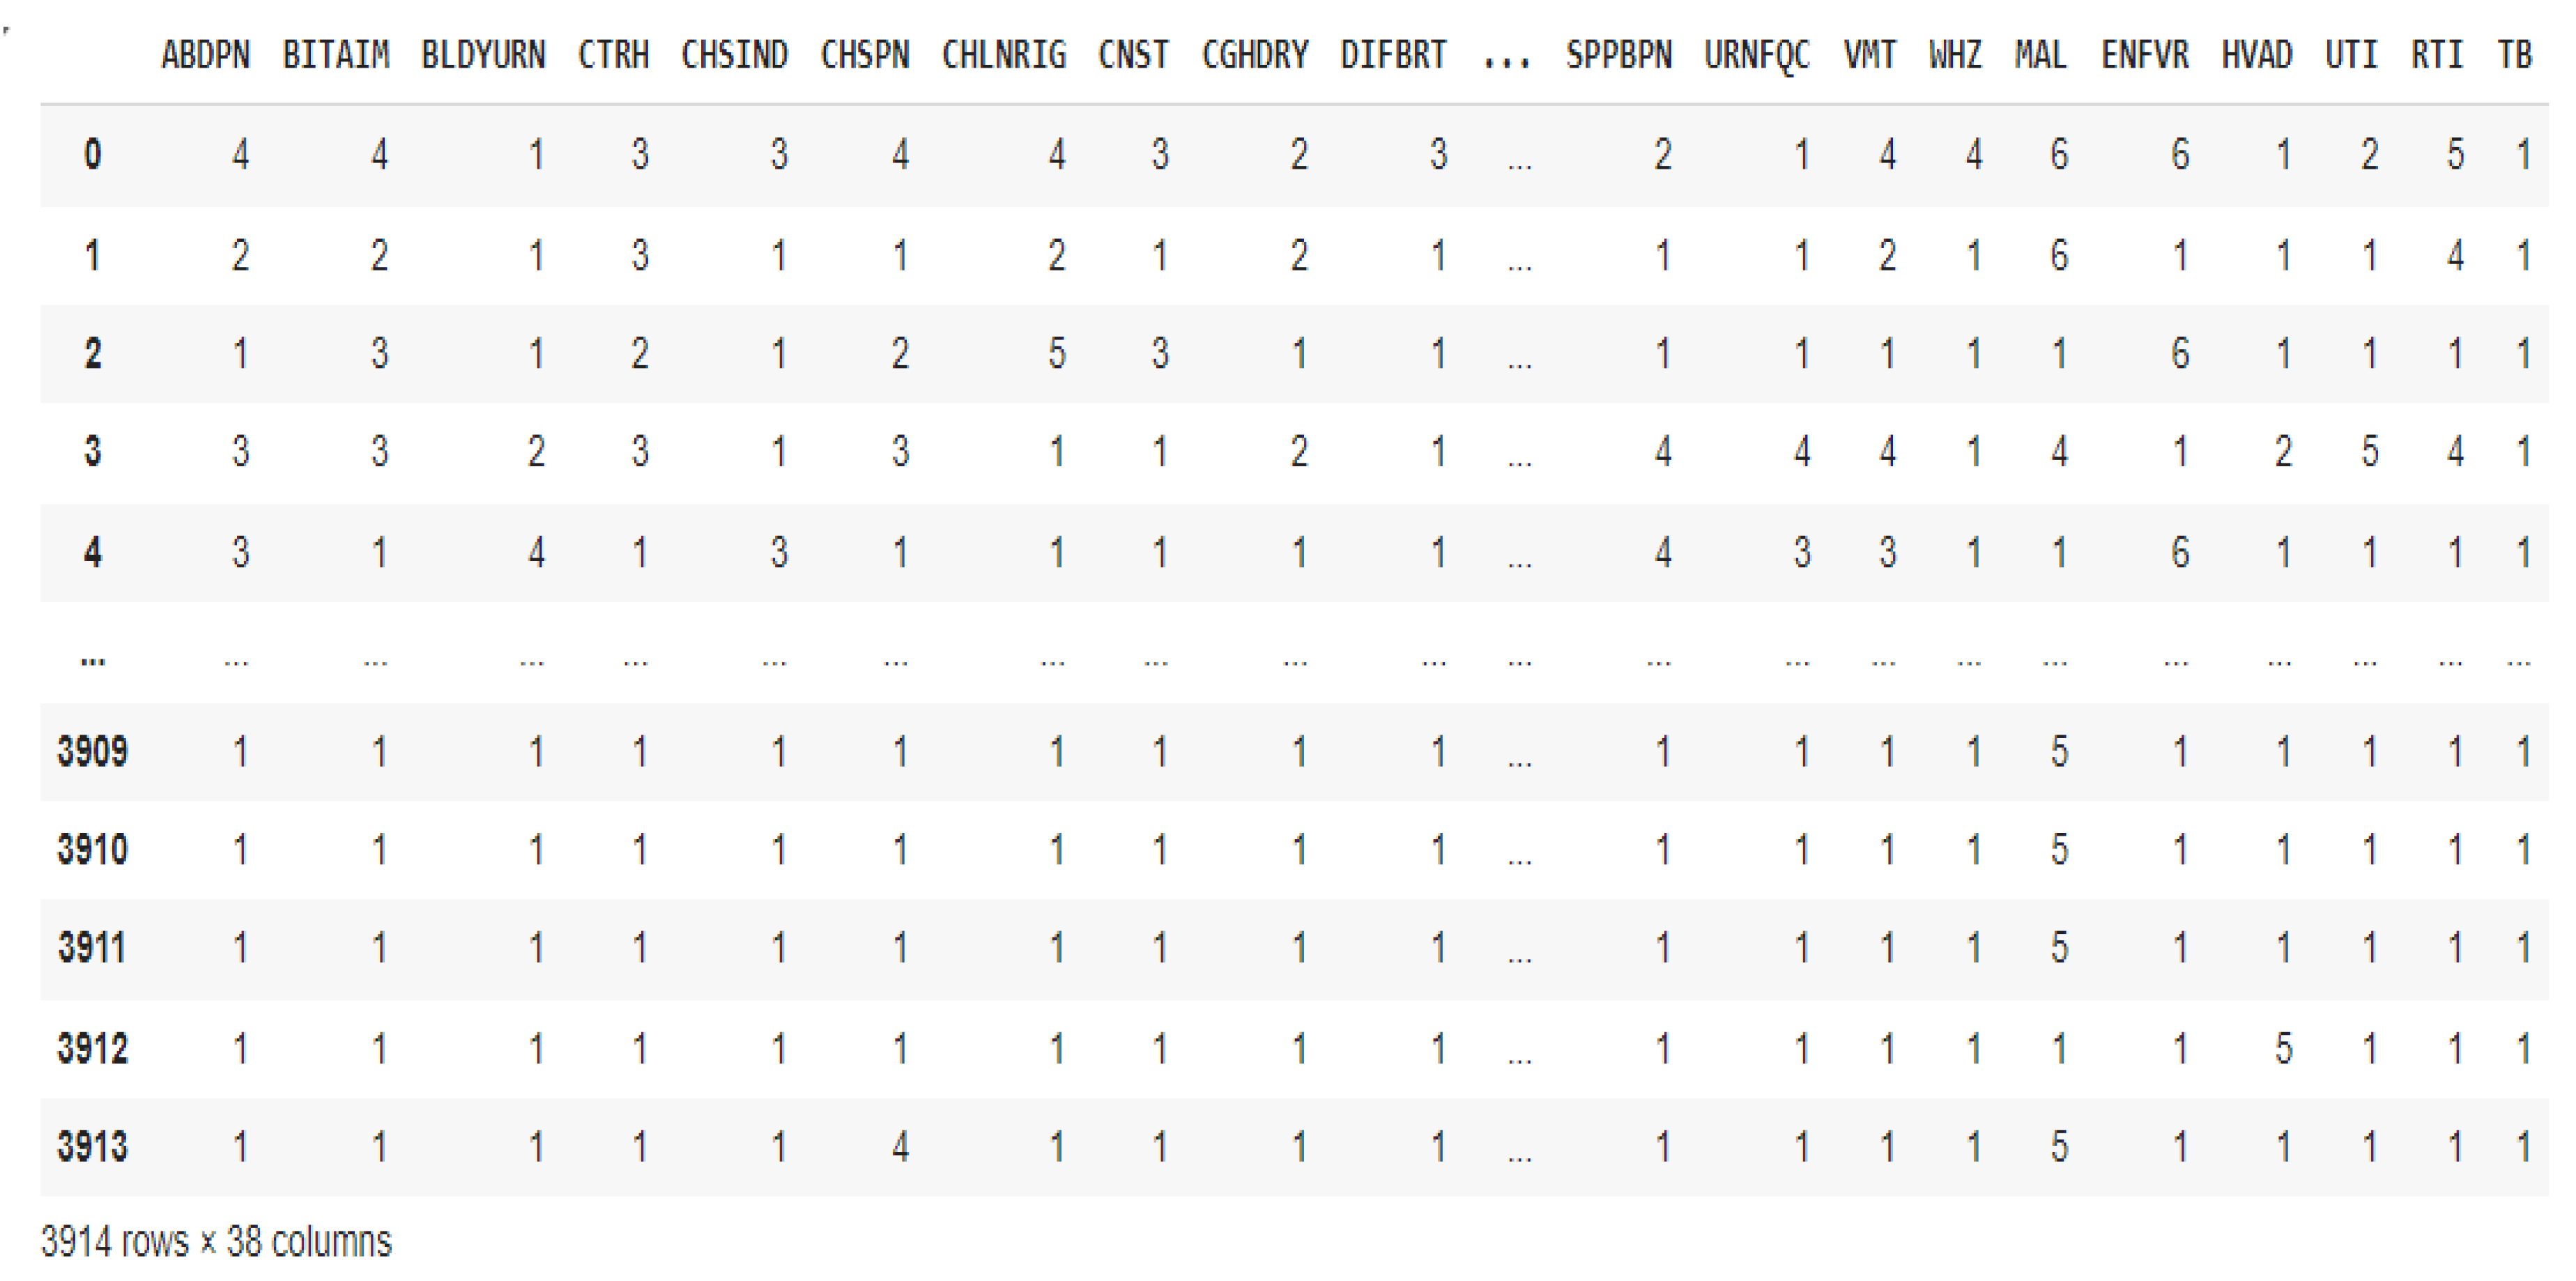
Figure 5.
Pre-processed dataset after custom mapping.
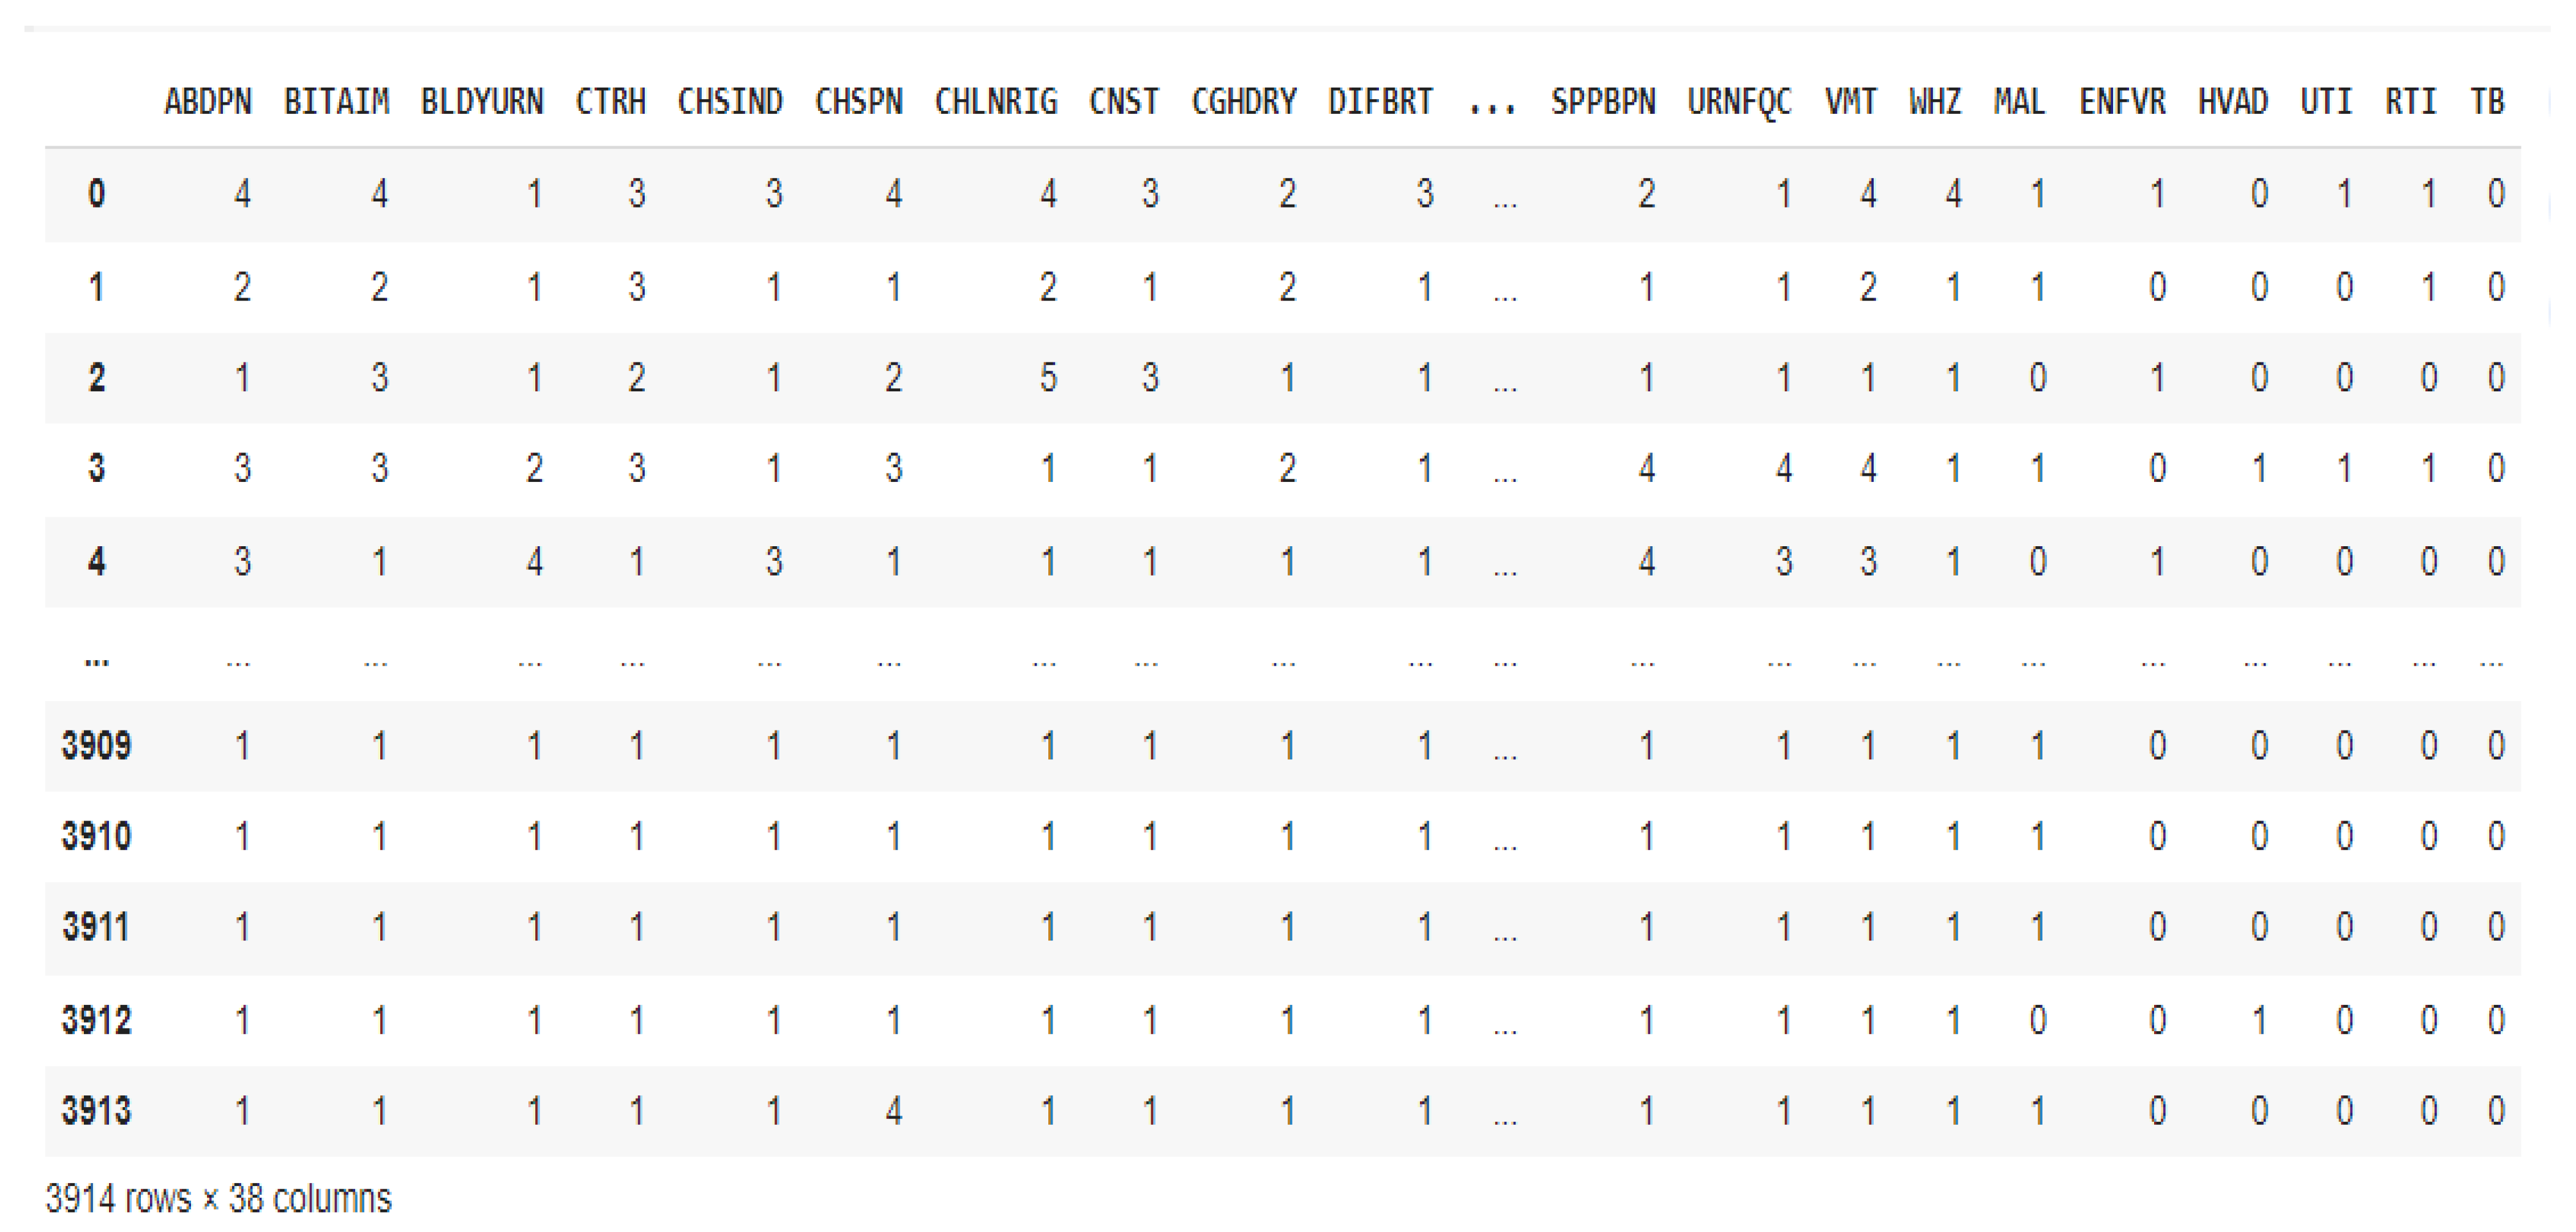
Figure 6.
Performance Evaluation of the ML Models.
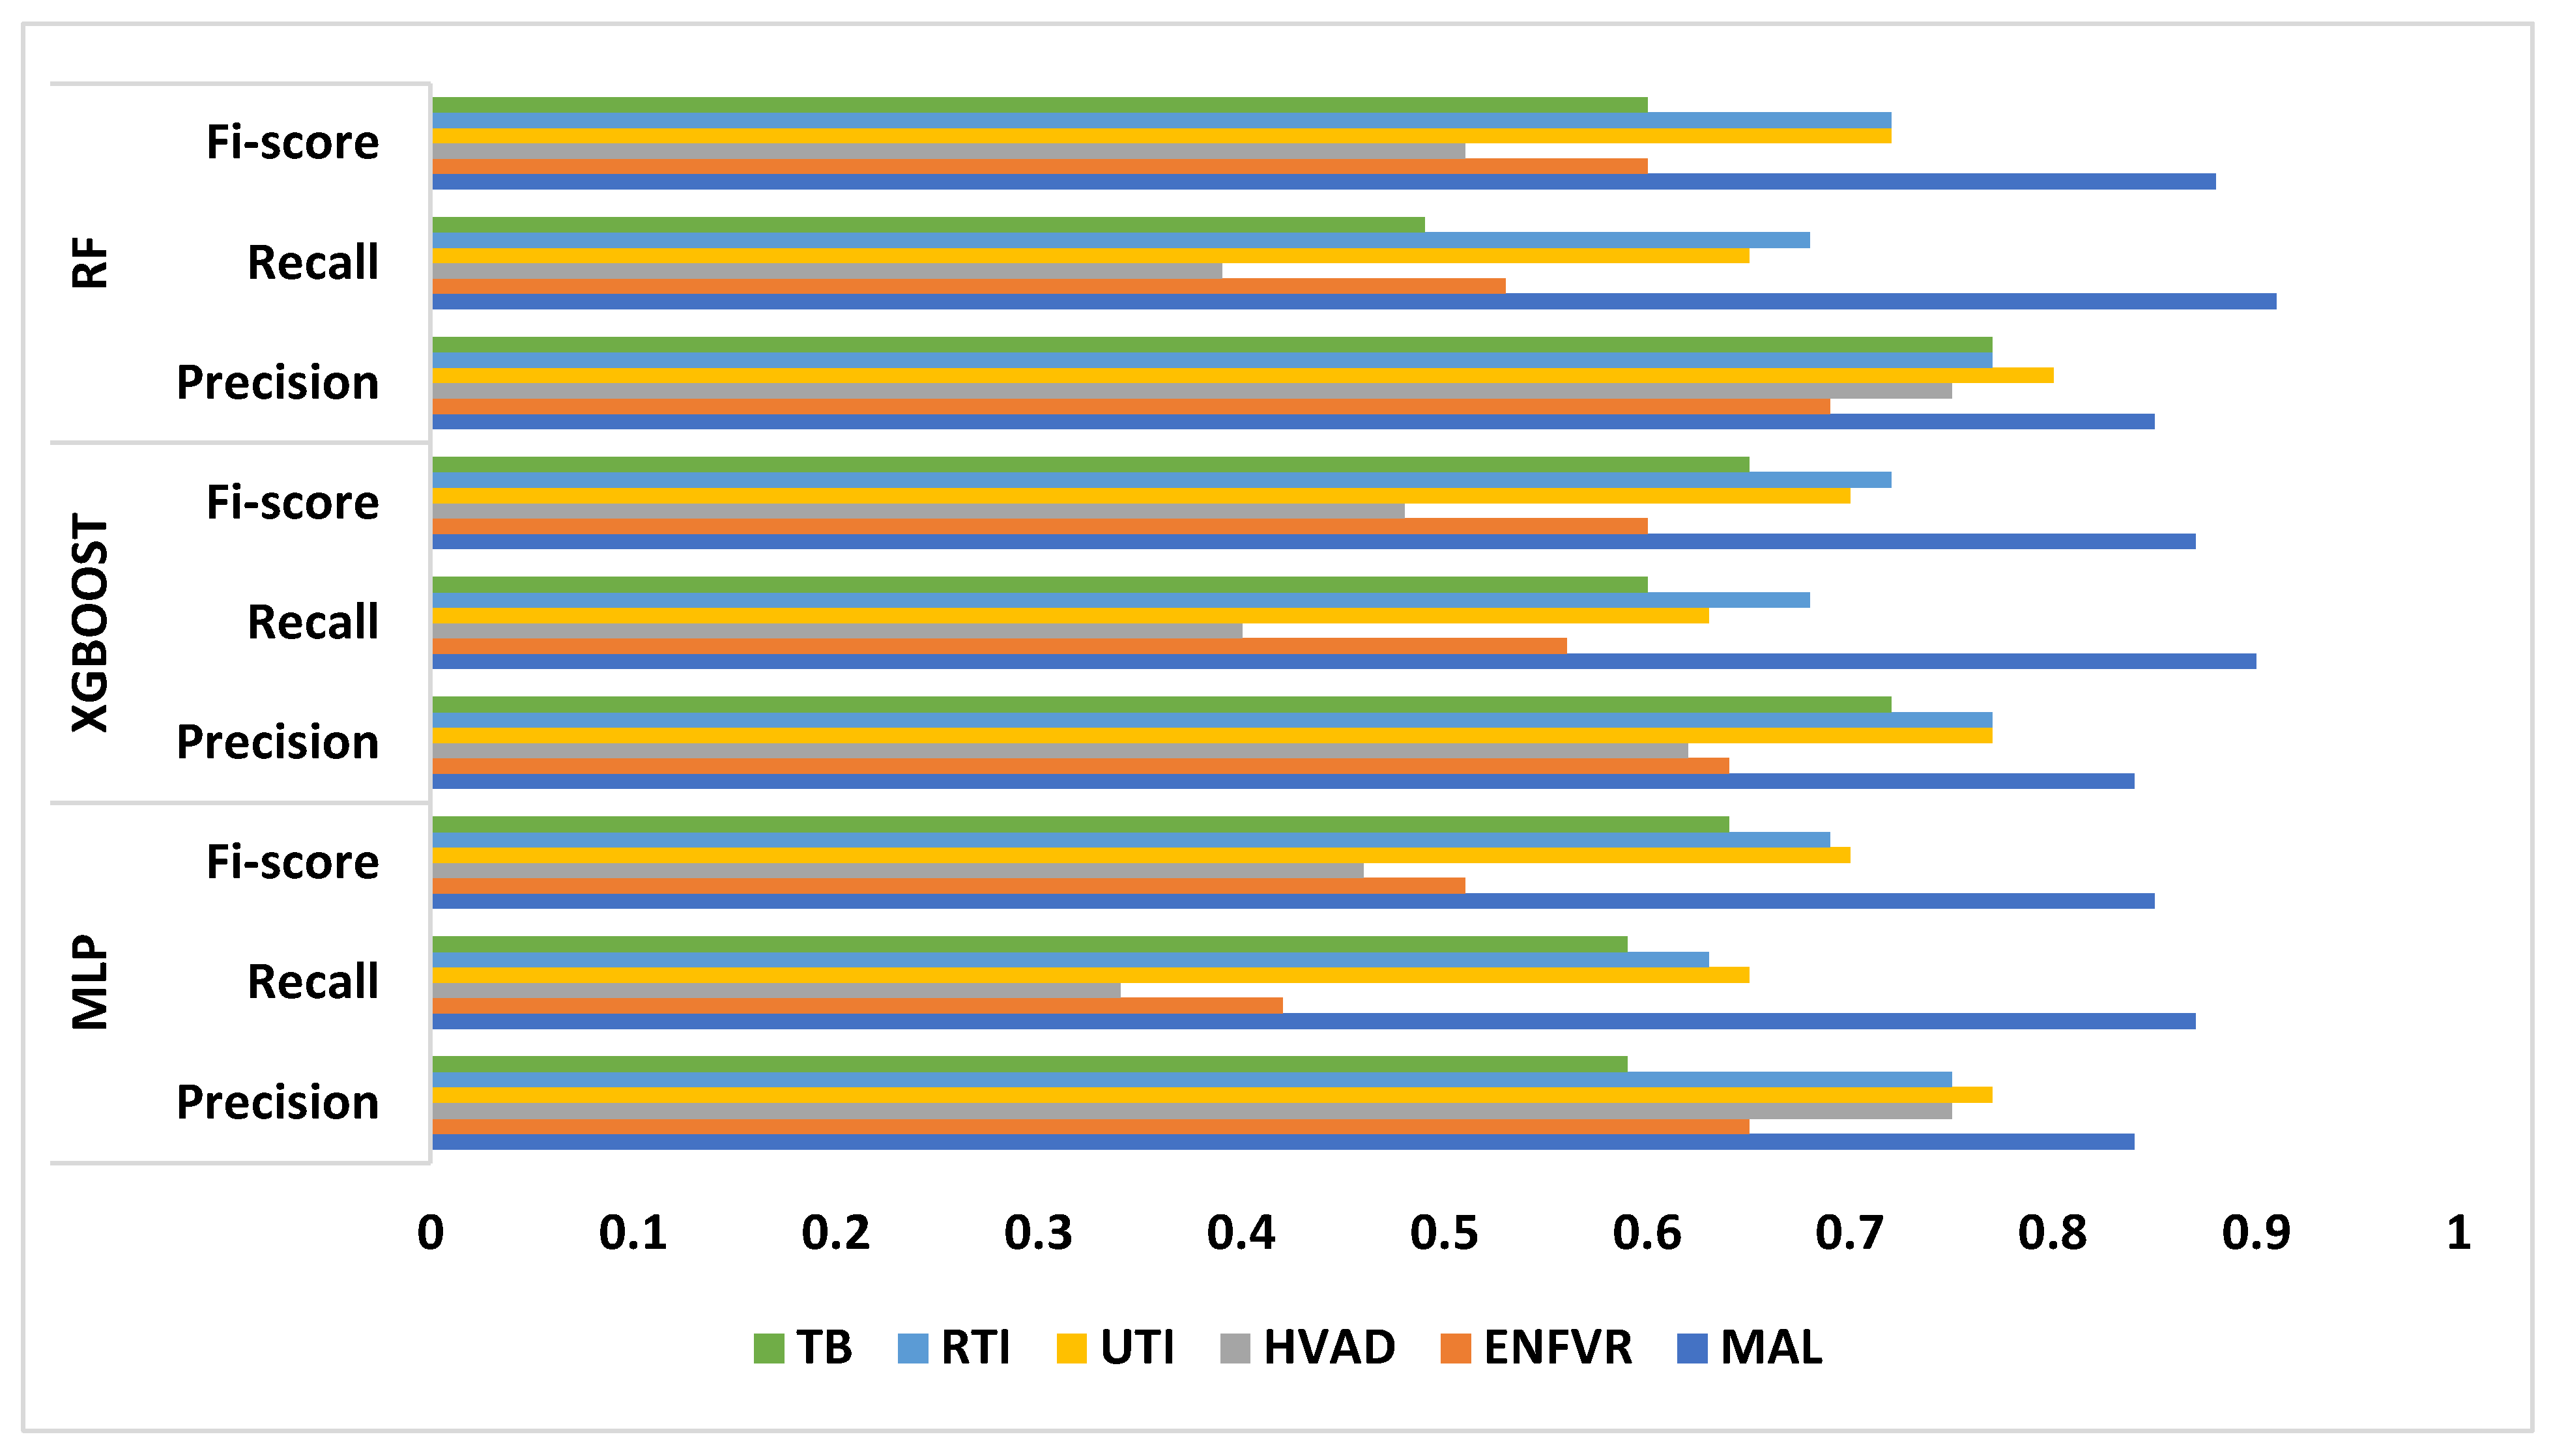
Figure 7.
MLP model LIME diagram.
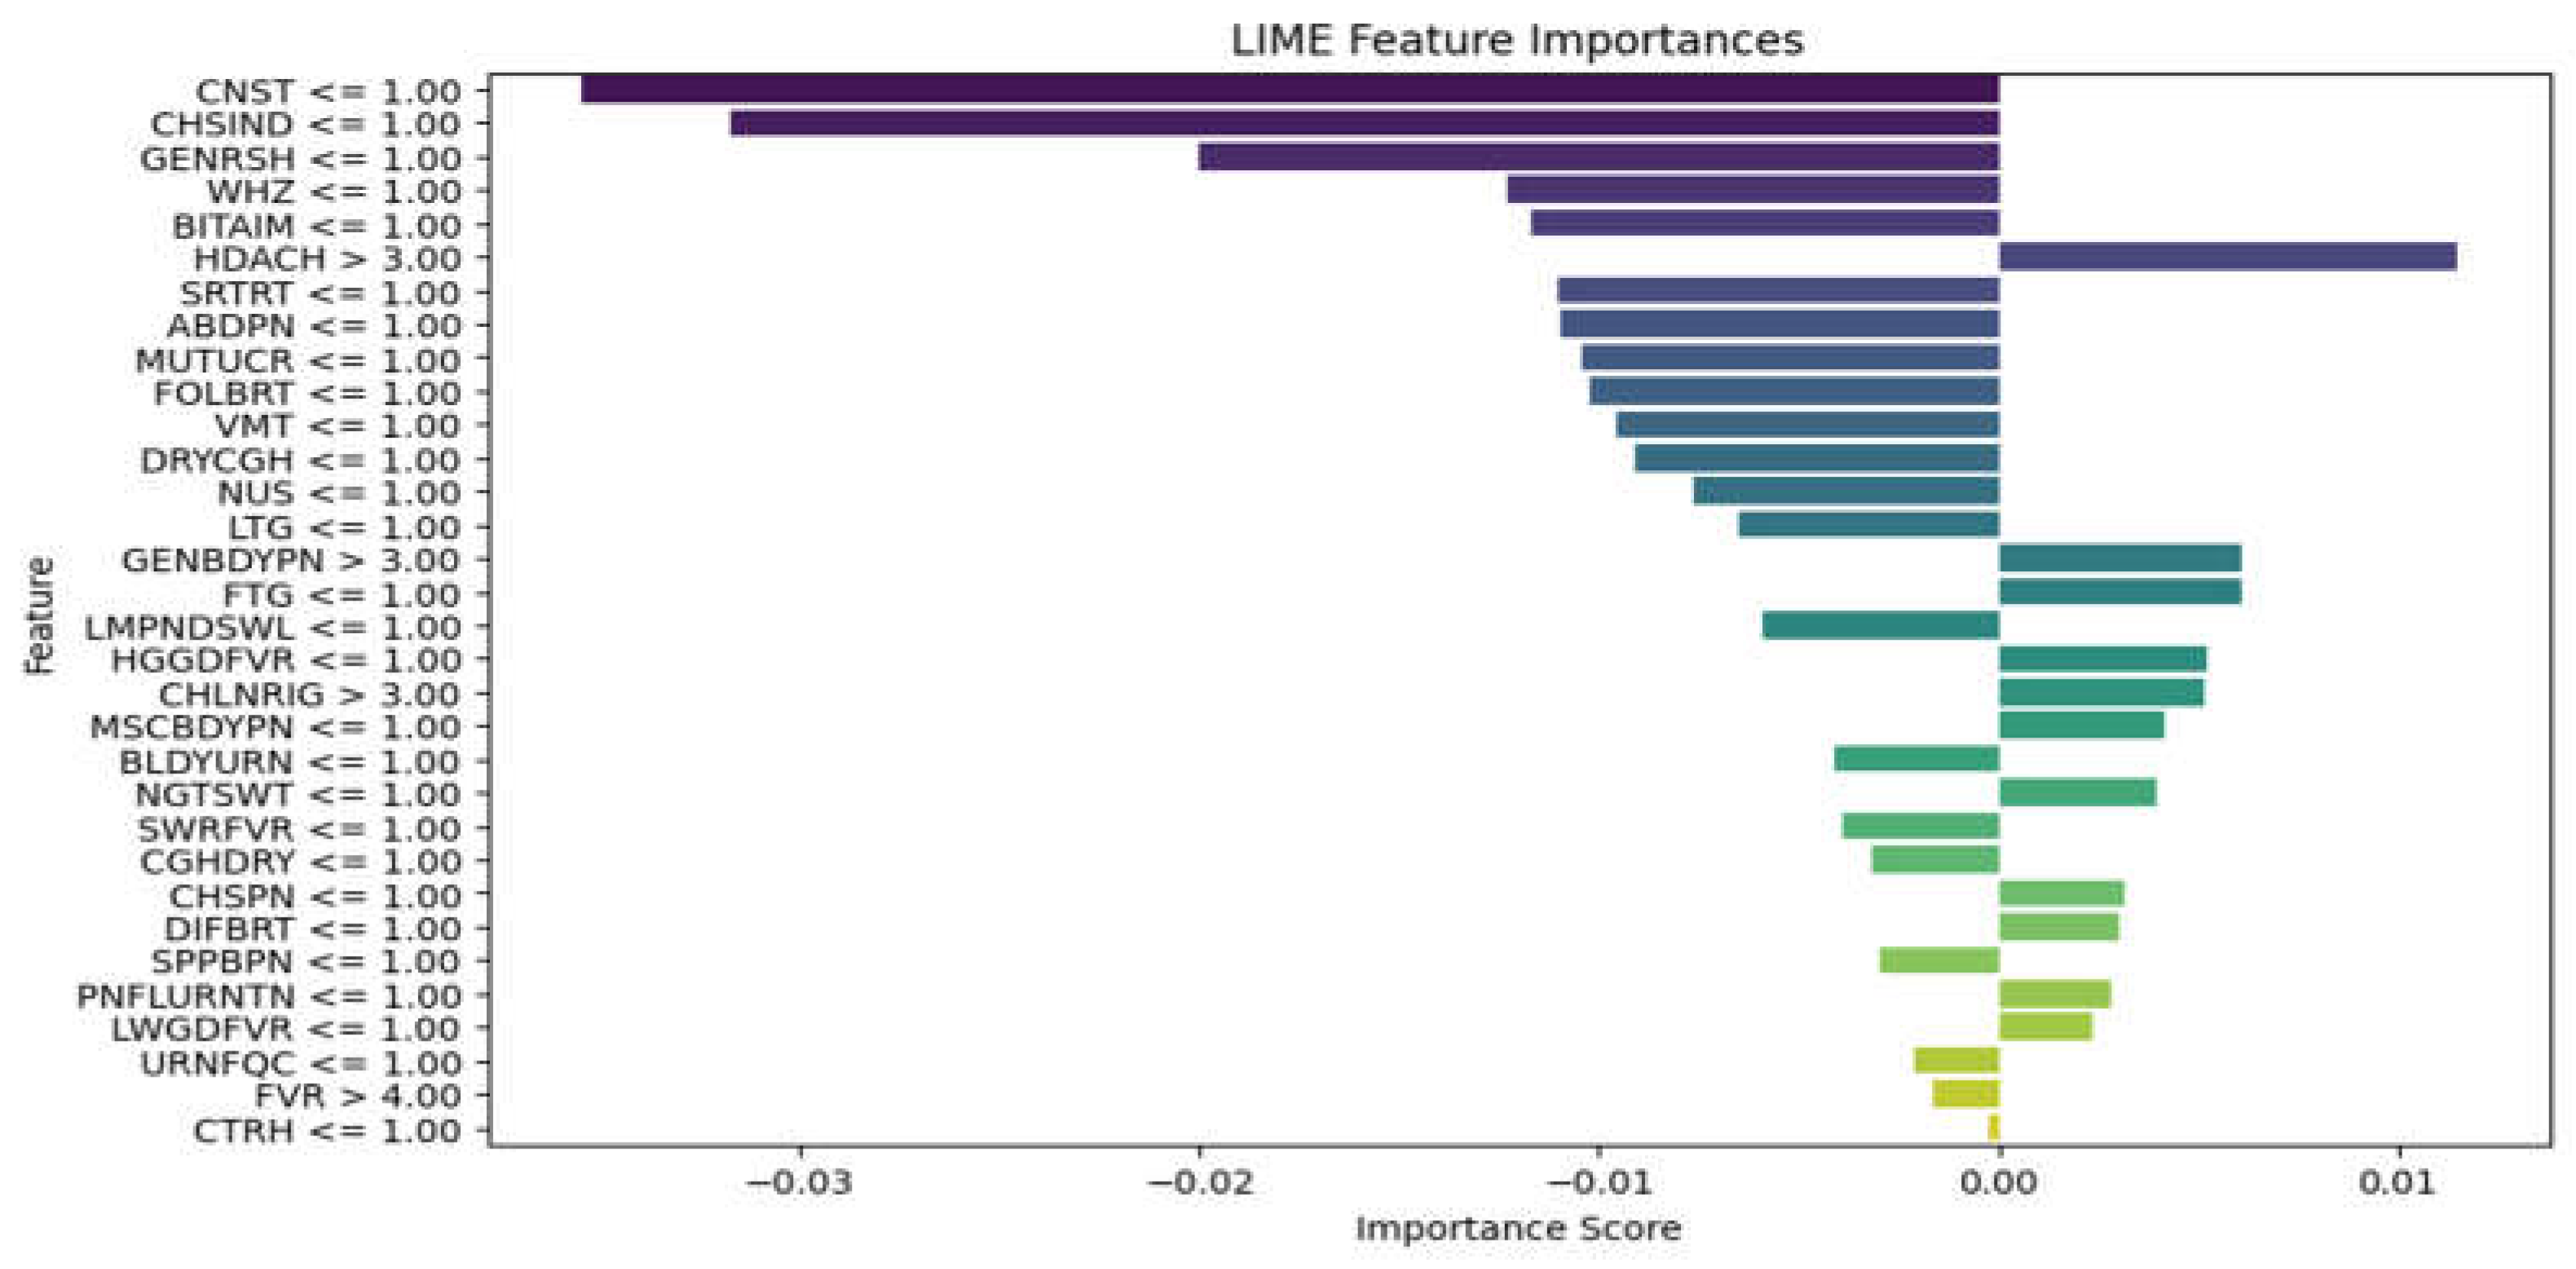
Figure 8.
XGBoost model LIME diagram.
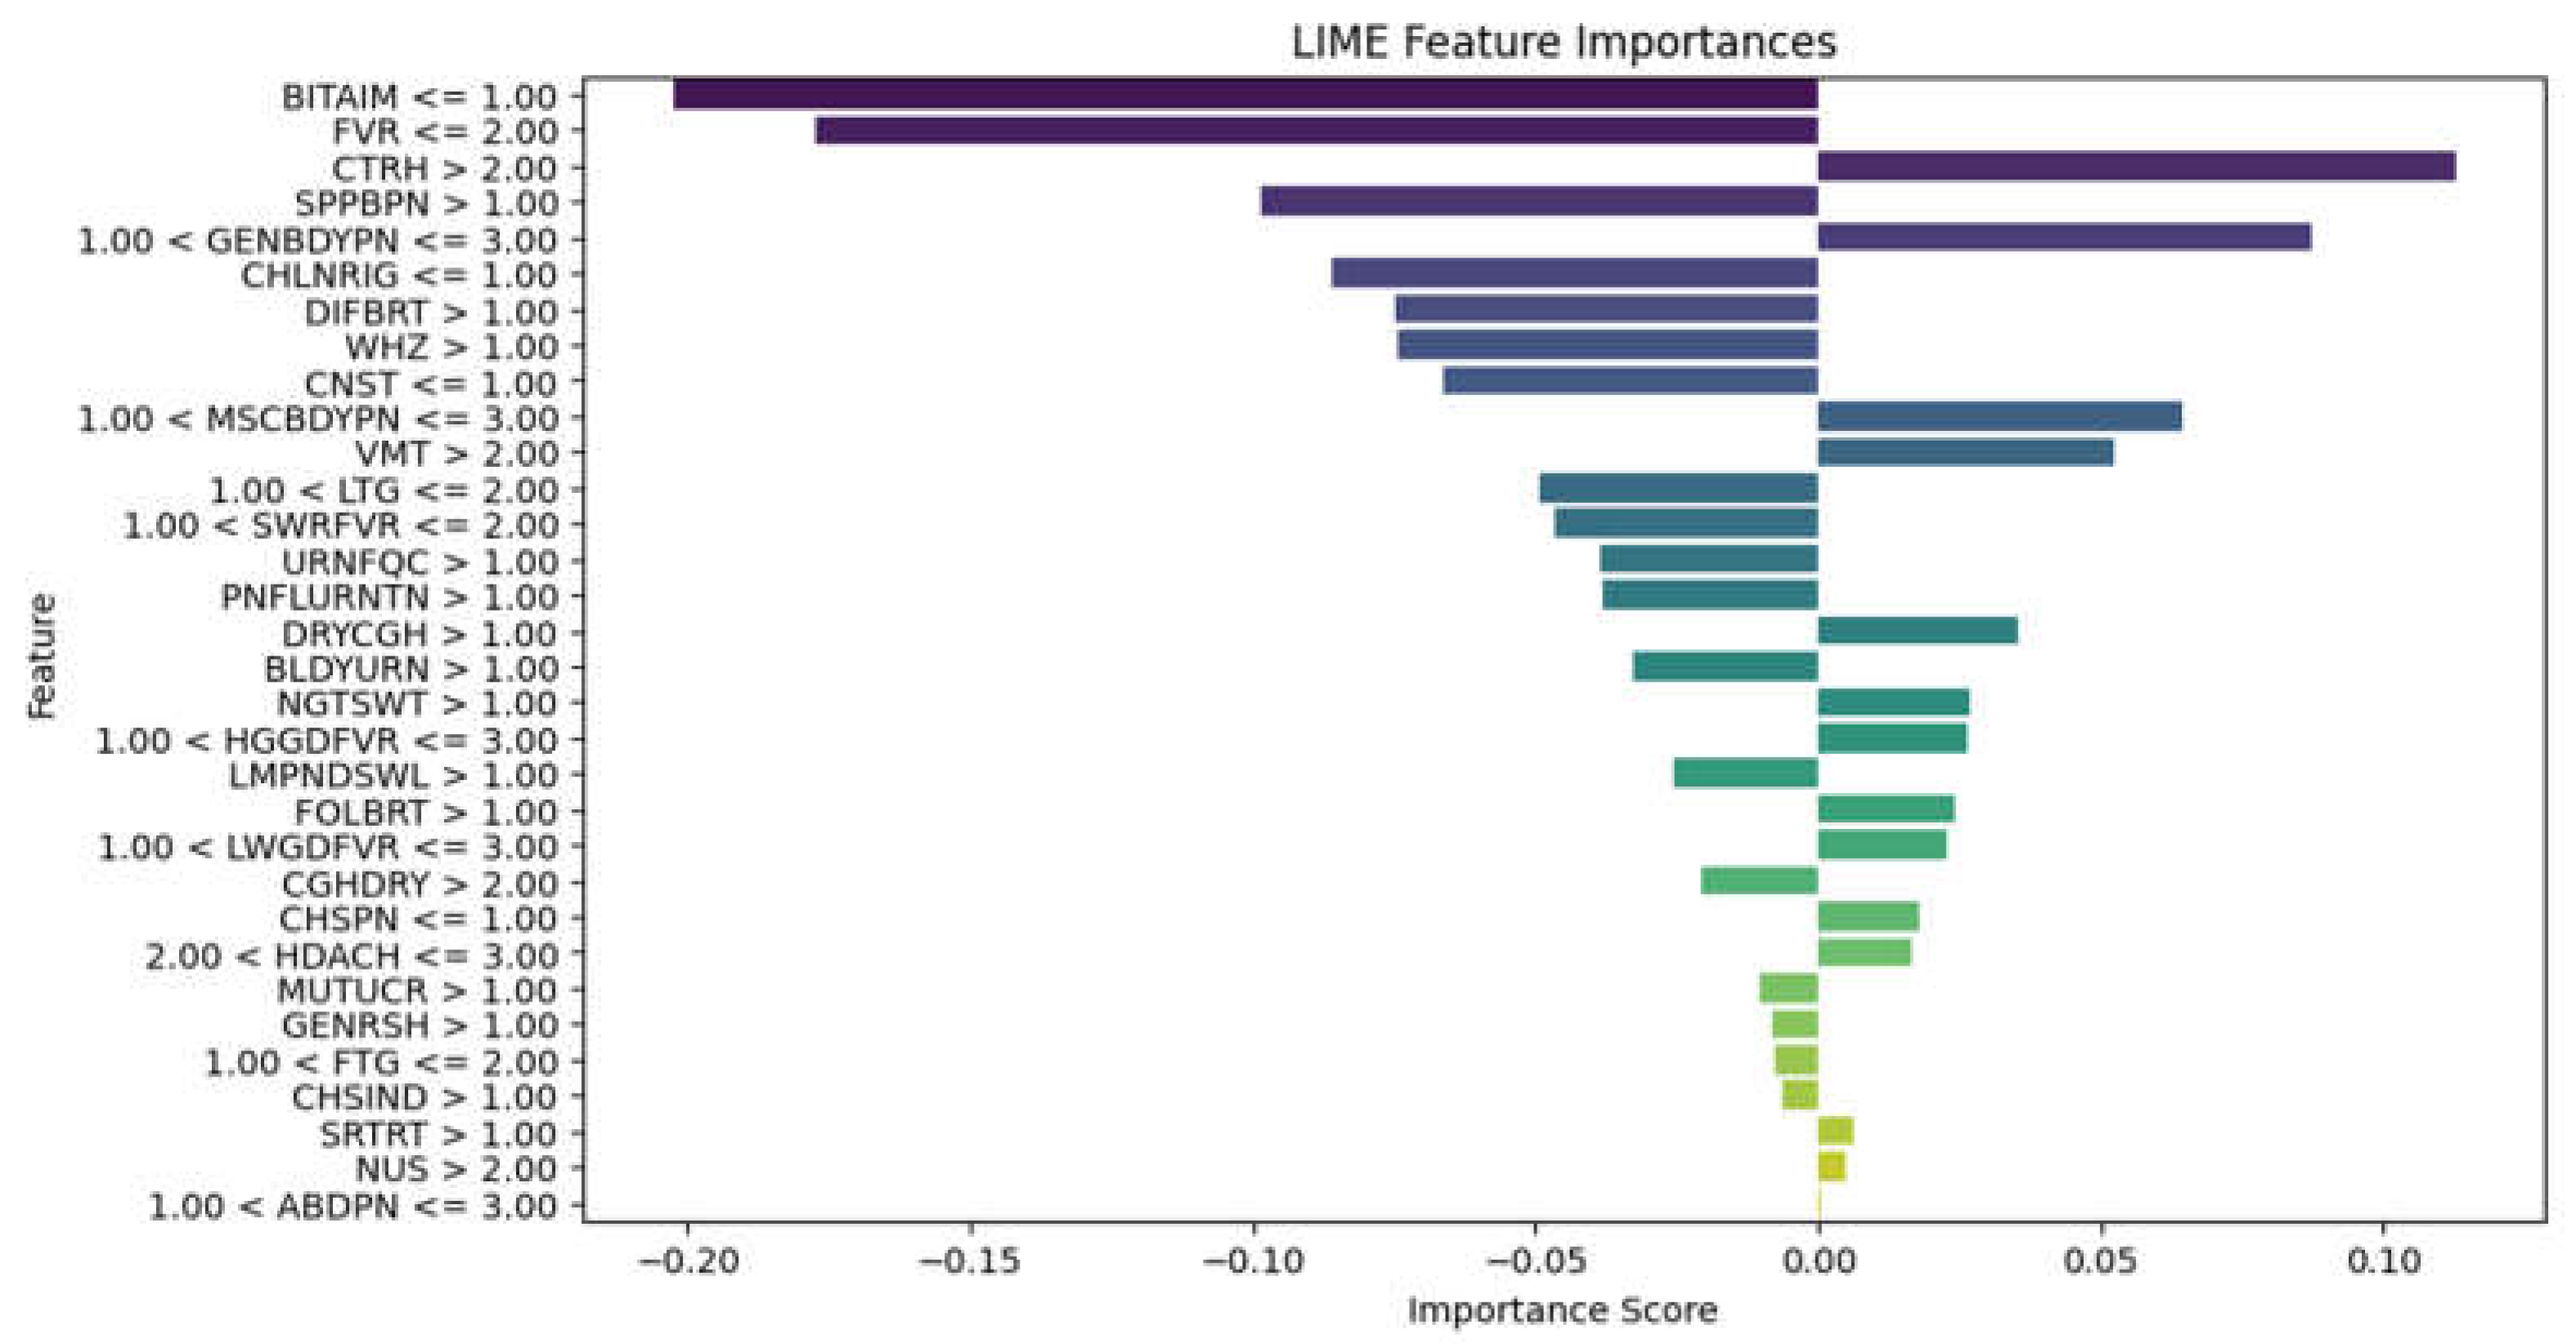
Figure 9.
RF model LIME diagram.
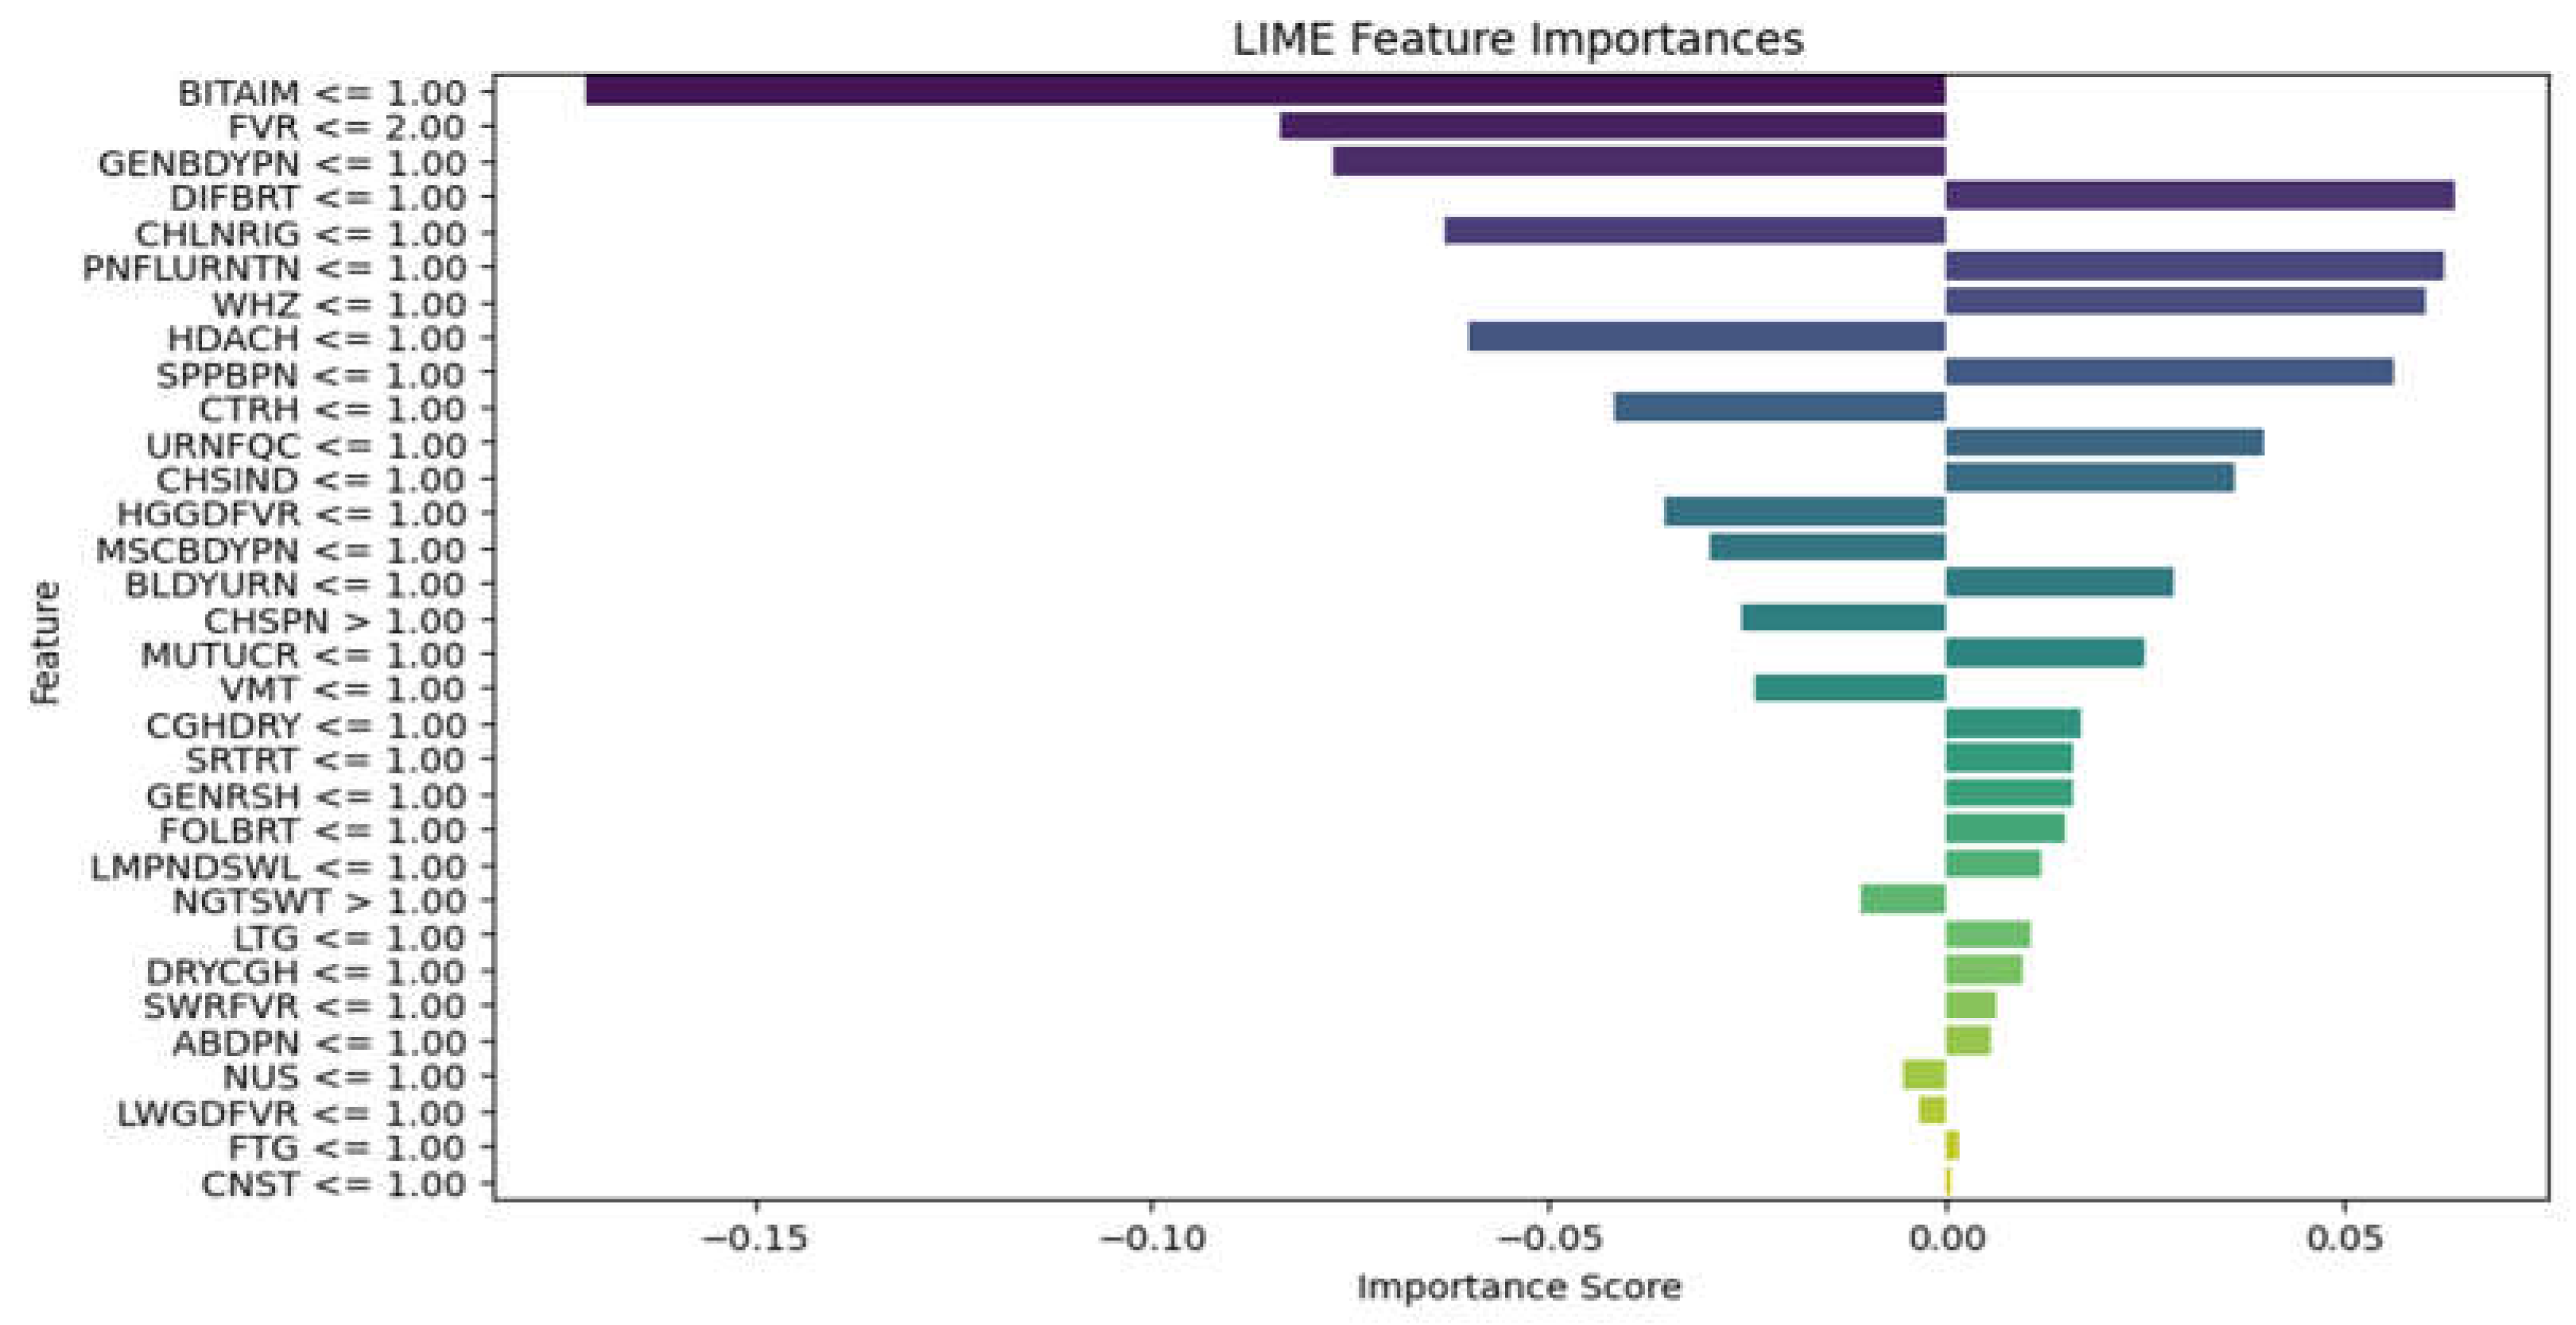
Figure 10.
ChatGPT Result.
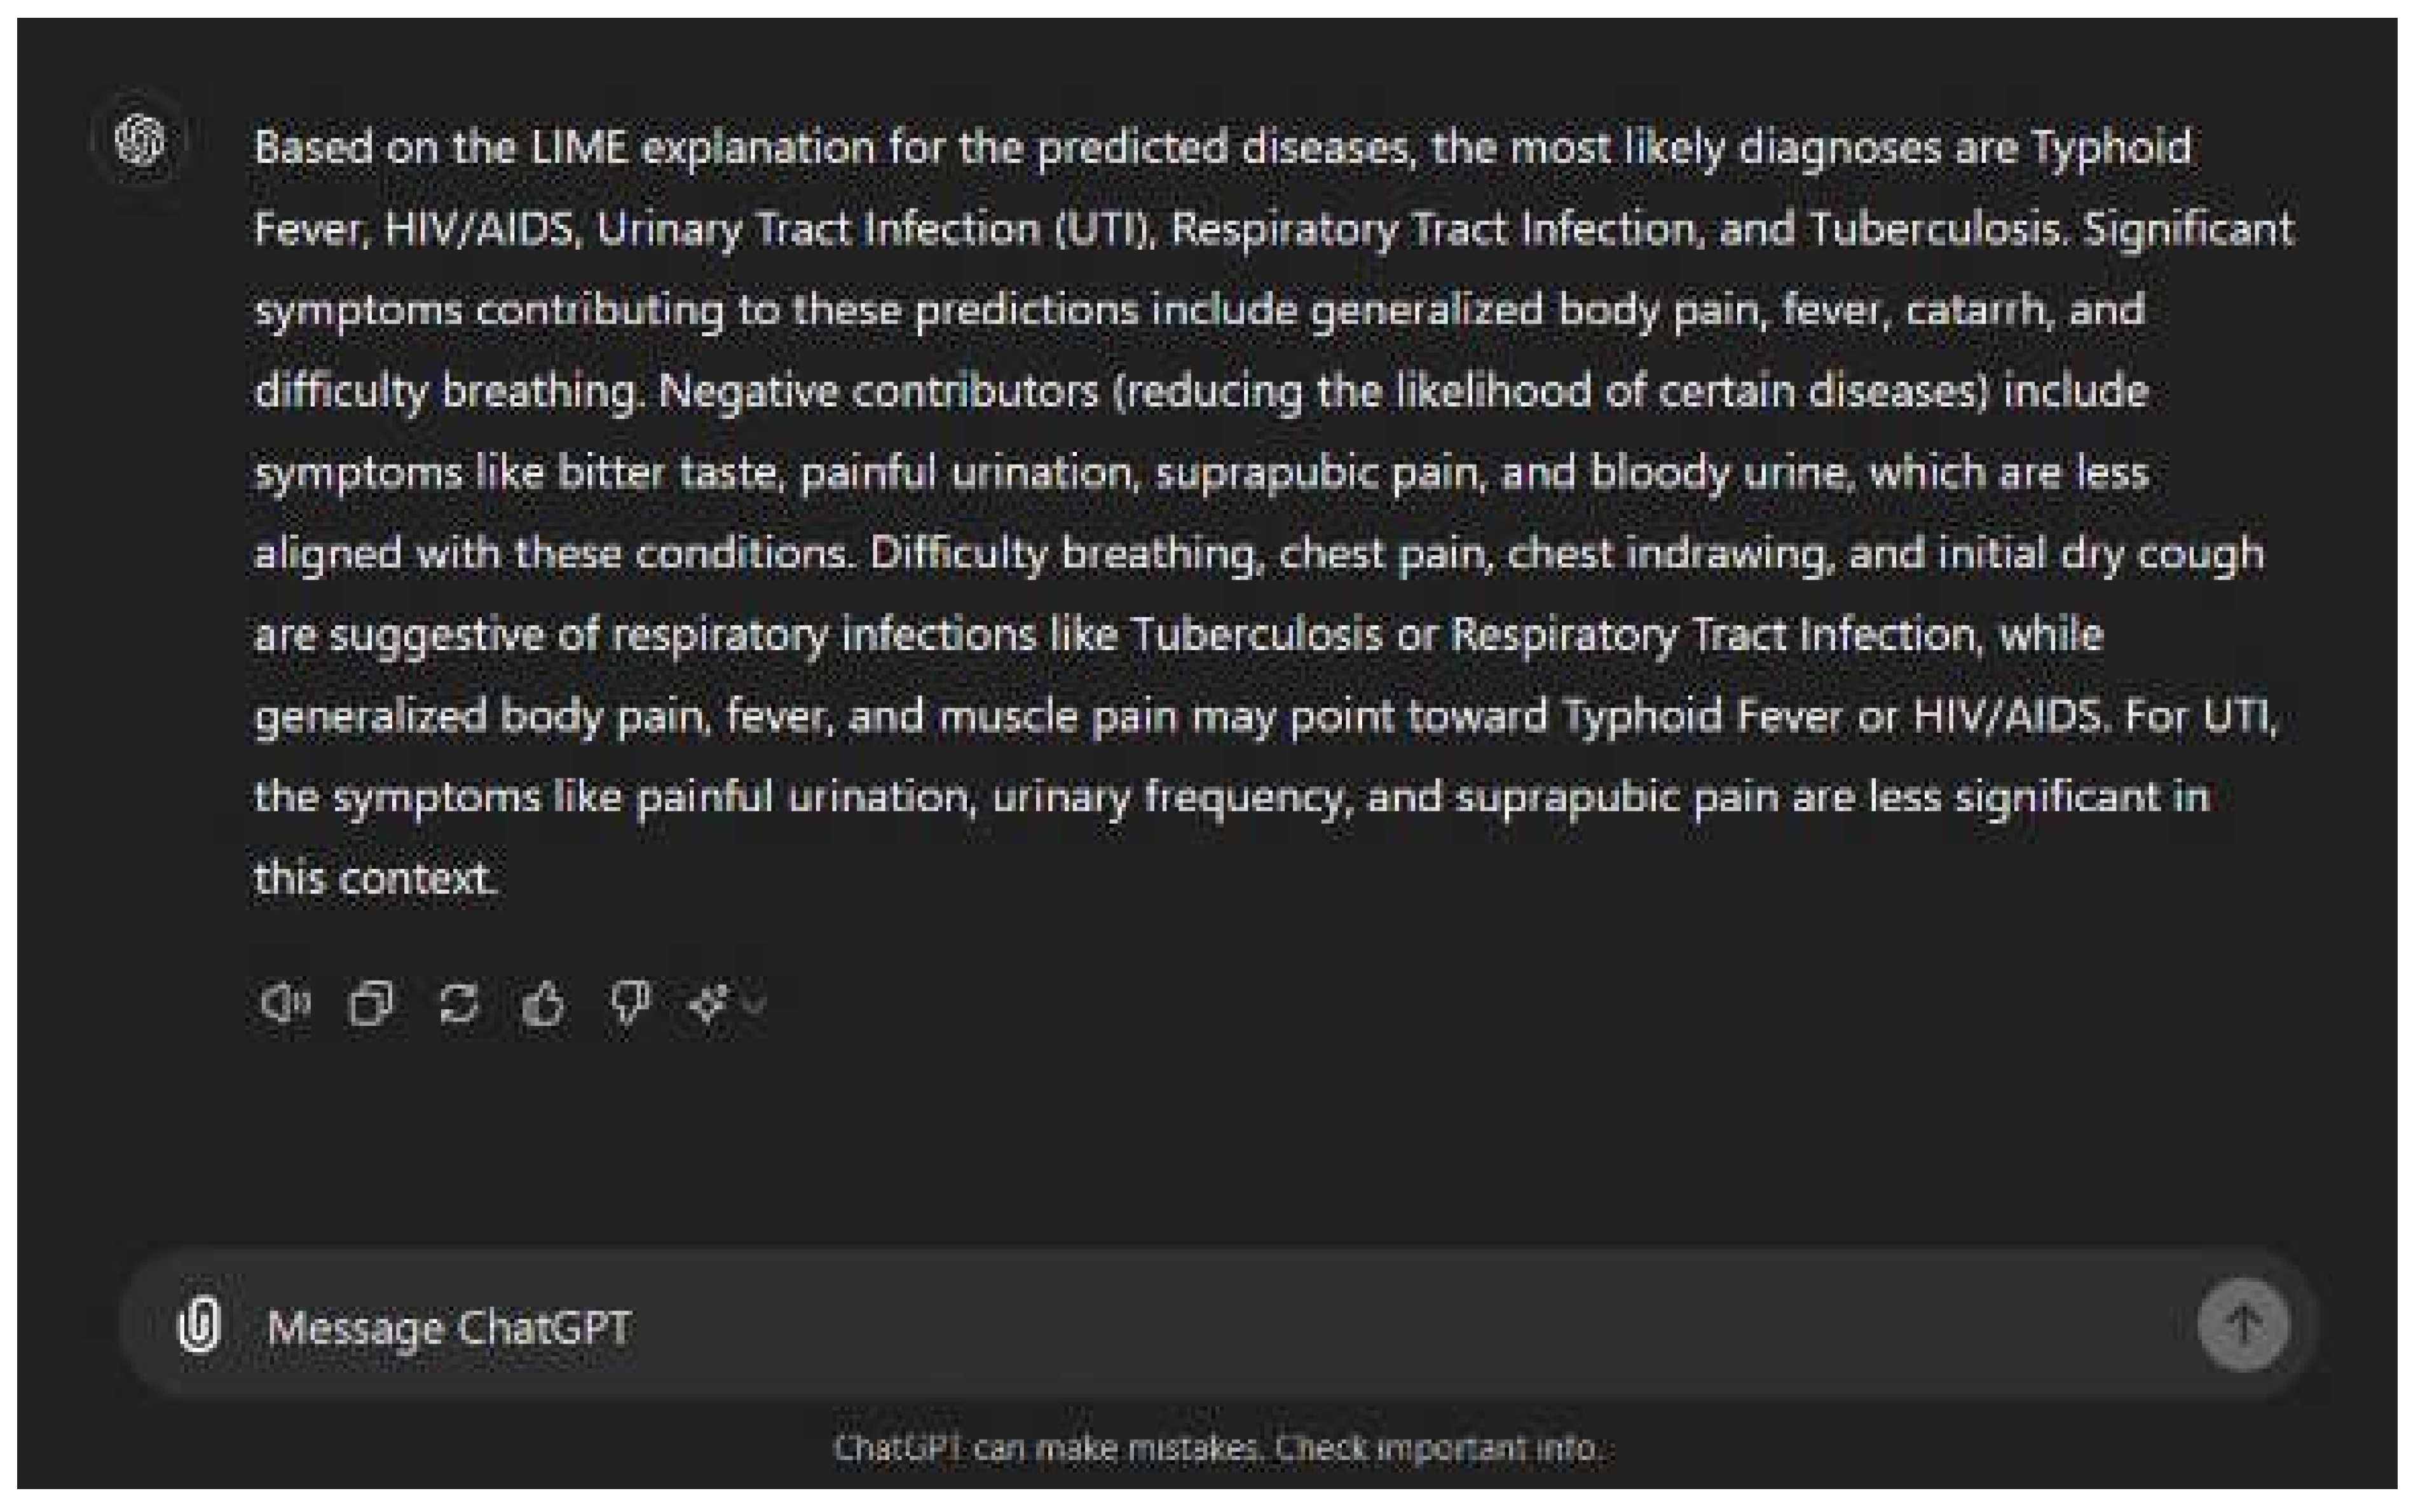
Figure 11.
Healthcare Worker Signup.

Figure 12.
User Login.
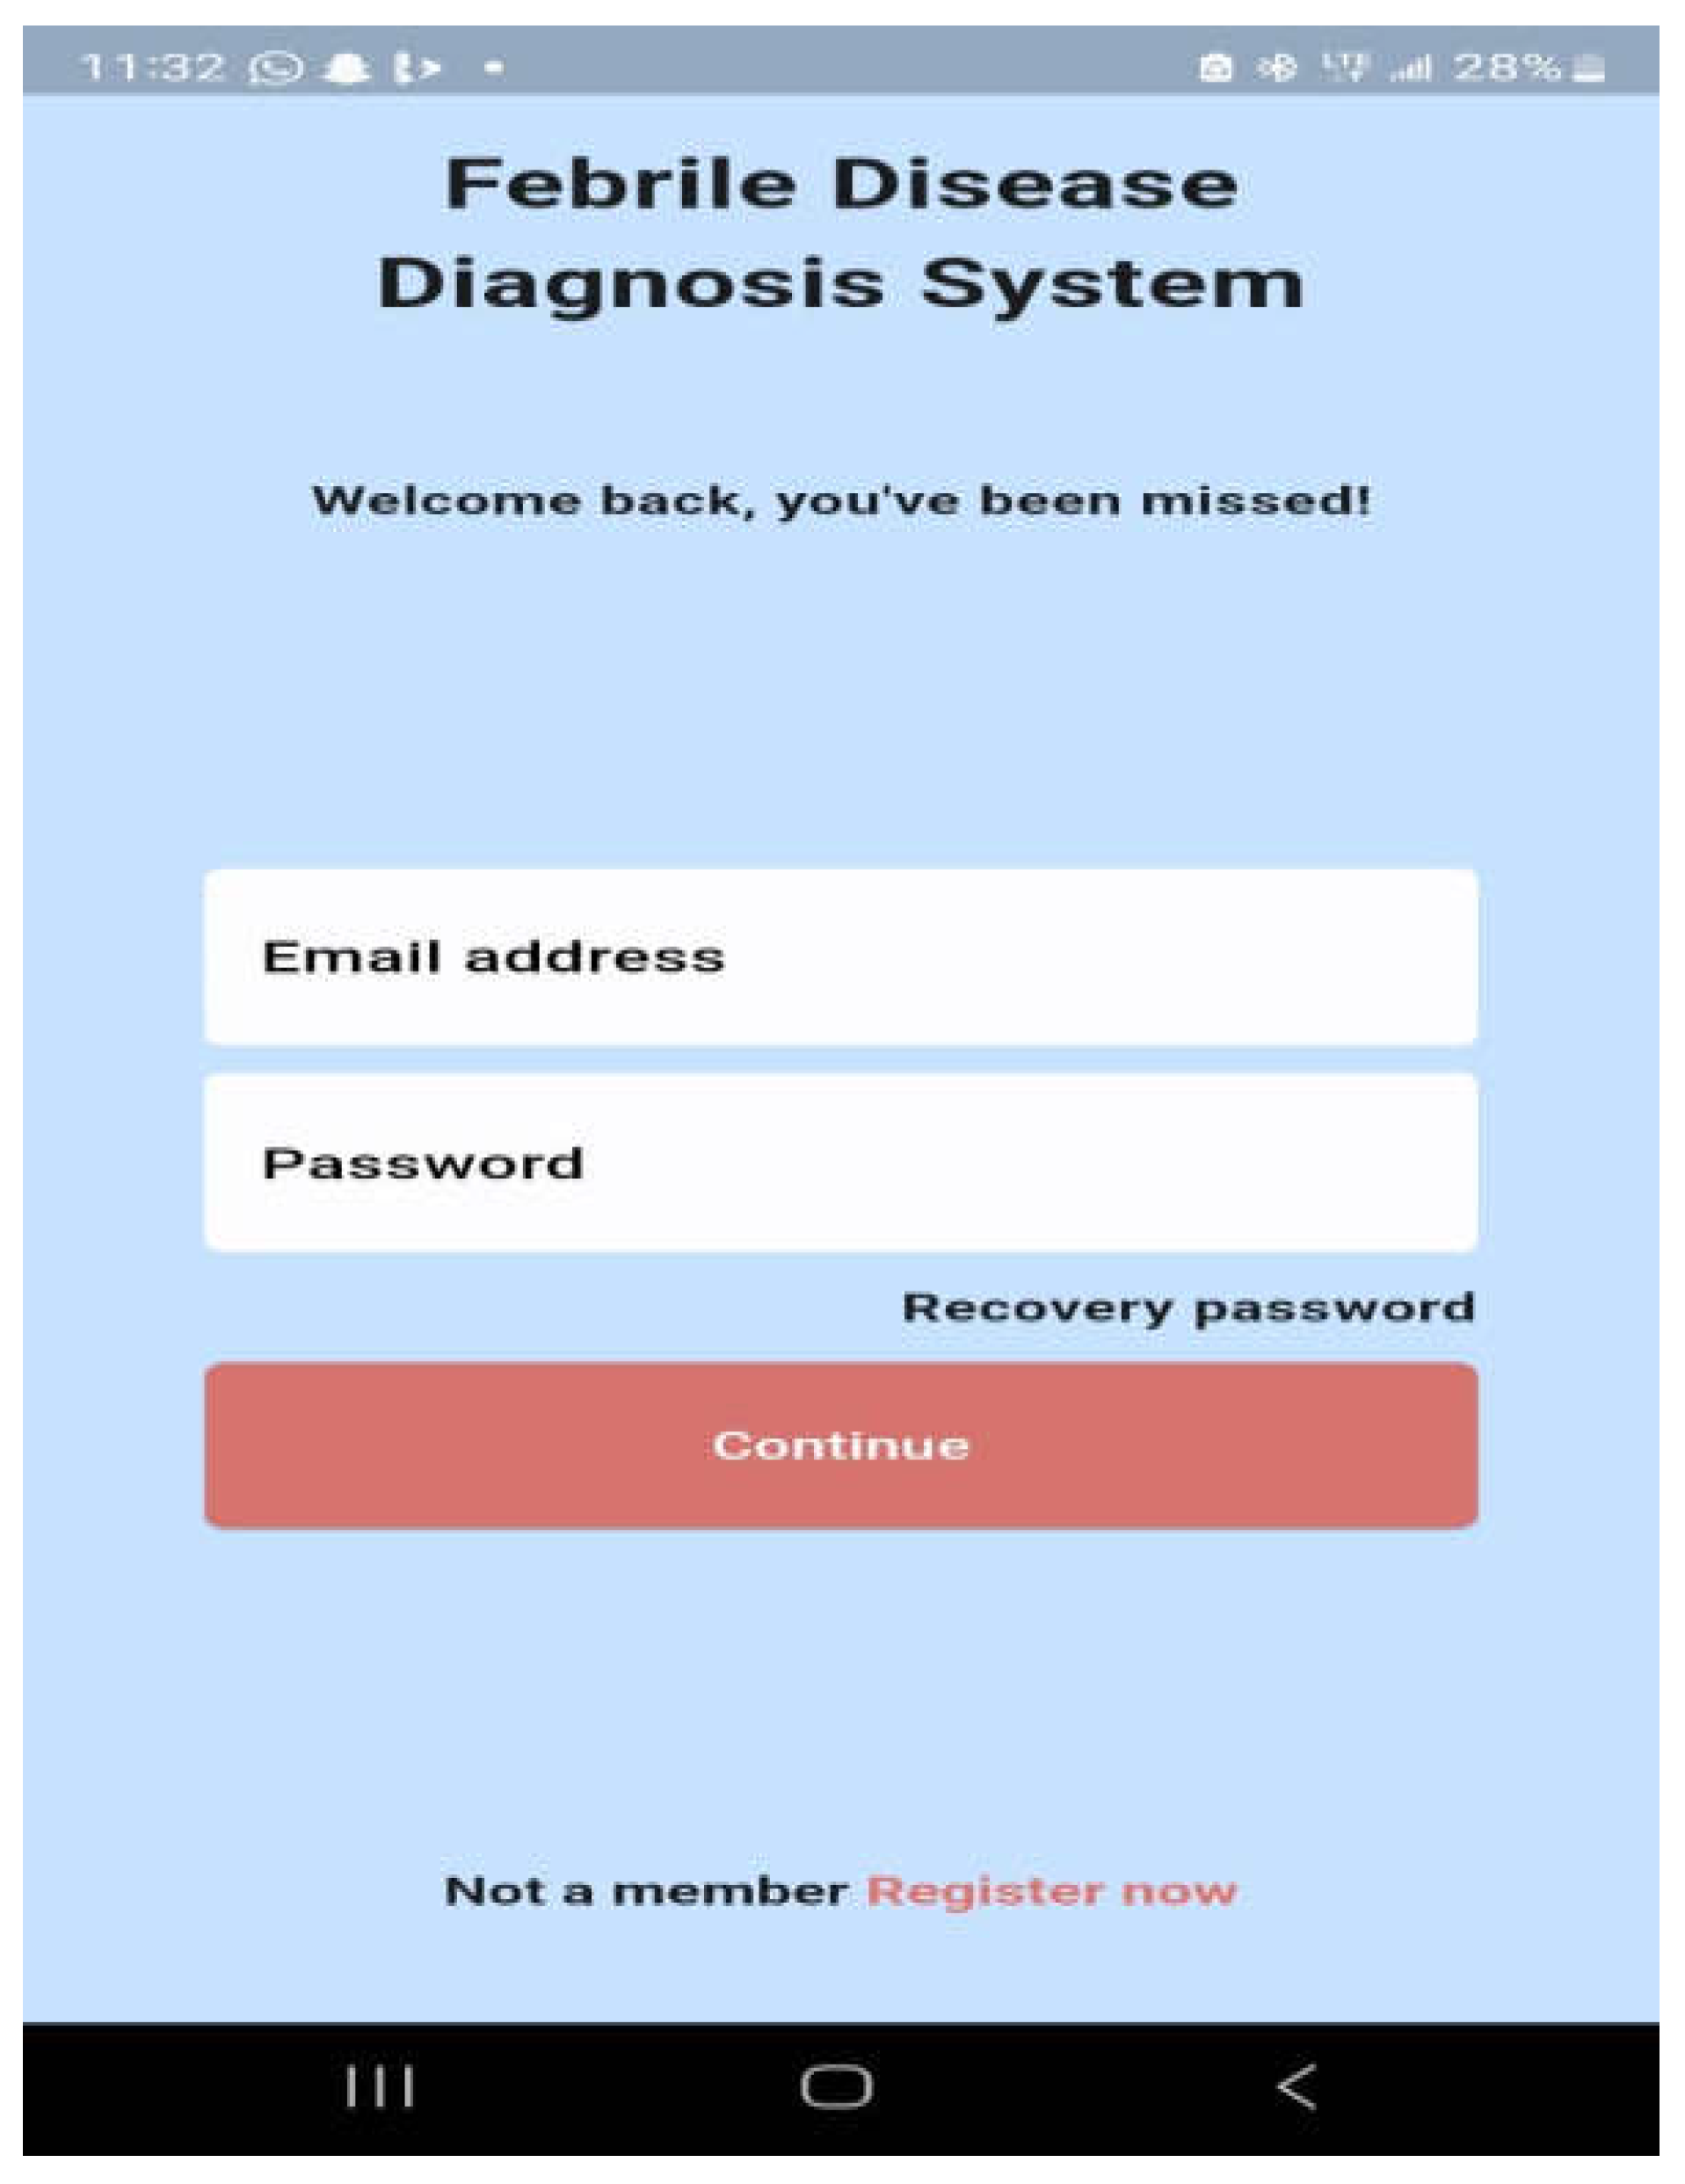

Table 1.
Descriptive statistics of male and female patients in the dataset.
| Age Range | Male | Female | Pregnant Women | No | Nursing Mothers | No |
| < 5years | 534 | 419 | 1st trimester | 139 | 0-3 months | 27 |
| 5 years to 12 years | 346 | 323 | 2nd trimester | 184 | 4-6 months | 35 |
| 13years to 19 years | 150 | 213 | 3rd trimester | 86 | 7-9 months | 28 |
| 20 years to 64 years | 1012 | 1605 | Over 9 months | 63 | ||
| 65 years and above | 133 | 135 | ||||
| Total | 2175 | 2695 | Total | 409 | Total | 153 |
Table 2.
Patient Symptoms and Diseases in the Dataset.
| SN | Symptom/Disease | Abbreviation | SN | Symptom/Disease | Abbreviation |
| 1 | Abdominal pains | ABDPN | 33 | Muscle and body pain | MSCBDYPN |
| 2 | Back pain | BCKPN | 34 | Mouth ulcer | MUTUCR |
| 3 | Bitter taste in mouth | BITAIM | 35 | Nausea | NUS |
| 4 | Bleeding | BLDN | 36 | Night sweats | NGTSWT |
| 5 | Bloody urine | BLDYURN | 37 | Pain behind the eyes | PNBHEYE |
| 6 | Catarrh | CTRH | 38 | Upper back pain (loin) | UPBCKPN |
| 7 | Chest indraw | CHSIND | 39 | Painful urination | PNFLURNTN |
| 8 | Chest pain | CHSPN | 40 | Peritonitis | PERTN |
| 9 | Chills and Rigors | CHLNRIG | 41 | Red eyes | REDEYE |
| 10 | Cloudy urine | CLDYURN | 42 | Red eyes, face, tongue | REDEYEFCTNG |
| 11 | Constipation | CNST | 43 | Sensitivity to light | SENLHT |
| 12 | Cough (initial dry) | CGHDRY | 44 | Shock | SHK |
| 13 | Diarrhea | DRH | 45 | Skin rash | SKNRSH |
| 14 | Difficulty breathing | DIFBRT | 46 | Sore throat | SRTRT |
| 15 | Dizziness | DIZ | 47 | Suprapubic pains | SPPBPN |
| 16 | Dry cough | DRYCGH | 48 | Urinary frequency | URNFQC |
| 17 | Fatigue | FTG | 49 | Vomiting | VMT |
| 18 | Fever | FVR | 50 | Wheezing | WHZ |
| 19 | High persistent fever | HGPSFVR | 51 | Malaria | MAL |
| 20 | High-grade fever | HGGDFVR | 52 | Typhoid fever | ENFVR |
| 21 | Stepwise rise fever | SWRFVR | 53 | HIV and AIDS | HVAD |
| 22 | Sudden onset fever | SUDONFVR | 54 | Upper urinary tract infection | UPUTI |
| 23 | Low-grade fever | LWGDFVR | 55 | Lower urinary tract infection | LWUTI |
| 24 | Foul breath | FOLBRT | 56 | Upper respiratory tract infection | URTI |
| 25 | Body itching | BDYICH | 57 | Lower respiratory tract infection | LRTI |
| 26 | Generalized body pain | GENBDYPN | 58 | Tuberculosis | TB |
| 27 | Generalized rashes | GENRSH | 59 | Lassa fever | LASFVR |
| 28 | Headaches | HDACH | 60 | Yellow fever | YELFVR |
| 29 | Intestinal bleeding and perforation | INTBLEPRF | 61 | Dengue fever | DENFVR |
| 30 | Joint swelling | JNTSWL | |||
| 31 | Lethargy | LTG | |||
| 32 | Lymph node swelling | LMPNDSWL |
Table 3.
Patient Symptoms and Diseases used in the Study.
| Symptom/Disease | Abbreviation | Symptom/Disease | Abbreviation | ||
| 1 | Abdominal pains | ABDPN | 20 | Headaches | HDACH |
| 2 | Bitter taste in Mouth | BITAIM | 21 | Lethargy | LTG |
| 3 | Bloody urine | BLDYURN | 22 | Lymph node swelling | LMPNDSWL |
| 4 | Catarrh | CTRH | 23 | Muscle and body pain | MSCBDYPN |
| 5 | Chest Indraw | CHSIND | 24 | Mouth ulcer | MUTUCR |
| 6 | Chest pain | CHSPN | 25 | Nausea | NUS |
| 7 | Chills and Rigors | CHLNRIG | 26 | Night sweats | NGTSWT |
| 8 | Constipation | CNST | 27 | Painful urination | PNFLURNTN |
| 9 | Cough (initial dry) | CGHDRY | 28 | Sore throat | SRTRT |
| 10 | Difficulty breathing | DIFBRT | 29 | Suprapubic pains | SPPBPN |
| 11 | Dry cough | DRYCGH | 30 | Urinary frequency | URNFQC |
| 12 | Fatigue | FTG | 31 | Vomiting | VMT |
| 13 | Fever | FVR | 32 | Wheezing | WHZ |
| 14 | High-grade fever | HGGDFVR | 33 | Malaria | MAL |
| 15 | Stepwise rise fever | SWRFVR | 34 | Typhoid fever | ENFVR |
| 16 | Low-grade fever | LWGDFVR | 35 | HIV and AIDS | HVAD |
| 17 | Foul breath | FOLBRT | 36 | Urinary tract infection | UTI |
| 18 | Generalized body pain | GENBDYPN | 37 | Respiratory tract infection | RTI |
| 19 | Generalized rashes | GENRSH | 38 | Tuberculosis | TB |
Table 4.
ML Diagnostic Models Performance.
| MAL | ENFVR | HVAD | UTI | RTI | TB | ||
| MLP | Precision | 0.84 | 0.65 | 0.75 | 0.77 | 0.75 | 0.59 |
| Recall | 0.87 | 0.42 | 0.34 | 0.65 | 0.63 | 0.59 | |
| Fi-score | 0.85 | 0.51 | 0.46 | 0.70 | 0.69 | 0.64 | |
| XGBOOST | Precision | 0.84 | 0.64 | 0.62 | 0.77 | 0.77 | 0.72 |
| Recall | 0.90 | 0.56 | 0.40 | 0.63 | 0.68 | 0.60 | |
| Fi-score | 0.87 | 0.60 | 0.48 | 0.70 | 0.72 | 0.65 | |
| RF | Precision | 0.85 | 0.69 | 0.75 | 0.80 | 0.77 | 0.77 |
| Recall | 0.91 | 0.53 | 0.39 | 0.65 | 0.68 | 0.49 | |
| Fi-score | 0.88 | 0.60 | 0.51 | 0.72 | 0.72 | 0.60 |
Table 5.
Sample prompt of ML and XAI results.
|
Explain the LIME results below (disease or diseases and significant symptoms) to a physician with not more than 300 words: Predictions ['Typhoid Fever Likely', 'HIV/AIDS Likely', 'Urinary Tract Infection Likely', 'Respiratory Tract Infection Likely', 'Tuberculosis Likely'] LIME Explanation; BITTER TASTE IN MOUTH <= 1.00; -0.16758919765052108 Painful Urination > 1.00; -0.06605868111597245 Suprapubic_Pain > 1.00; -0.06550467141471979 Difficulty Breathing <= 1.00; 0.06071678705925383 Wheezing <= 1.00; 0.0590462921972035 Headache <= 1.00; -0.05826547312462451 CHILLS AND RIGORS <= 1.00; -0.05630271637802242 CHEST INDRAW <= 1.00; 0.04070095788472542 Generalized Body Pain > 3.00; 0.03974979336103006 1.00 < CATARRH <= 2.00; 0.03816070620416529 Urinary_Frequency > 1.00; -0.03770207672685268 ABDOMINAL PAIN > 3.00; -0.033902377938511155 2.00 < Fever <= 3.00; 0.032999053123995245 1.00 < Muscle and Body Pain <= 3.00; 0.03295097711760973 HGGDFever > 3.00; 0.032768000129691194 BLOODY URINE > 1.00; -0.029955841393233477 Cough (Initial Dry) <= 1.00; 0.026364166193042264 CHEST PAIN <= 1.00; 0.02354889167461192 Sore_Throat > 1.00; -0.021402483028506374 Lymph Node Swelling > 1.00; -0.0202552321969518 Vomiting > 2.00; 0.019057721531348118 Lethargy > 2.00; -0.017371438160508137 Mouth Ulcer > 1.00; -0.015856144250446513 Fatigue > 3.00; -0.015122895567807396 Generalized Rash <= 1.00; 0.014081682731125898 Foul Breath <= 1.00; 0.01260963643914623 1.00 < LWGDFever <= 3.00; 0.012187835432654306 CONSTIPATION <= 1.00; -0.012145436356090885 Night Sweat > 1.00; -0.010556292961671602 SWRFever > 2.00; -0.007451681601225083 Nausea > 2.00; -0.00406587833157149 Dry Cough > 1.00; -0.003064108573649665 |
Disclaimer/Publisher’s Note: The statements, opinions and data contained in all publications are solely those of the individual author(s) and contributor(s) and not of MDPI and/or the editor(s). MDPI and/or the editor(s) disclaim responsibility for any injury to people or property resulting from any ideas, methods, instructions or products referred to in the content. |
© 2025 by the authors. Licensee MDPI, Basel, Switzerland. This article is an open access article distributed under the terms and conditions of the Creative Commons Attribution (CC BY) license (http://creativecommons.org/licenses/by/4.0/).
Copyright: This open access article is published under a Creative Commons CC BY 4.0 license, which permit the free download, distribution, and reuse, provided that the author and preprint are cited in any reuse.


