1. Introduction
Individuals suffering from cognitive fatigue experience slower and delayed reaction times as compared to rested state [
1]. In addition to personal effects of cognitive exhaustion [
2,
3,
4], cognitive fatigue has a significant impact on society with workplace and highway accidents and fatalities [
5,
6,
7]. Some studies have even shown that exhaustion can manifest in behavior similar to intoxication [
4,
8]. However, cognitive fatigue is not as apparent as intoxication and can be difficult to identify and quantify.
Over the past few decades functional magnetic resonance imaging (fMRI) has been used to image volumetric electrical activity in the brain under various stimuli and workloads to map functional regions and assess characteristics of cognitive fatigue [
9,
10]. While it has been foundational in understanding the role of fatigue on brain function, fMRI equipment is not portable. Recently, functional near-infrared spectroscopy (fNIRS) has been used to monitor brain activity by measuring changes in oxygenated and deoxygenated hemoglobin in reflection geometry. While fNIRS restricts the measures to the surface of the brain with penetration up to mere 10–30 mm [
11], the correlation with fMRI is clear [
11]. Relying on decades of fMRI research, fNIRS is emerging as a portable alternative to brain activity monitoring.
Full scalp fNIRS brain activity mapping is a promising technique for portable cognitive fatigue detection for drivers [
12], pilots [
13,
14], critical workers, or even to improve training or intervention [
15]. However, real-world full scalp measurements have limitations due to cumbersome hardware, optical losses from hair, and user adherence [
16,
17]. Furthermore, mapping of the entire brain may not be necessary for cognitive assessment; comparative studies have shown that most of the activities happens in the prefrontal cortex (PFC) [
18,
19,
20]. The PFC is responsible for working memory, mental imagery, and higher cognitive functions [
21,
22,
23]. In addition, the blood flow in the PFC is 20 to 30 % higher than the average brain flow, with activity levels up to 50% higher compared to other brain regions [
24]. Furthermore, the PFC is easily accessible for the vast majority of individuals in various occupational scenarios. These factors make PFC well suited for portable monitoring of brain activity using fNIRS for point-of-care assessment of cognitive fatigue.
Miniaturization brings advantages of availability and imperceptible sensing to fNIRS, which enable the possibility of unencumbered testing. However, miniaturized devices suffer from lower signal fidelity due to reduced signal conditioning, reduced functionality and sensor count, and additional error and noise from the unencumbered testing. Miniaturized counterparts will not match the precision and accuracy of the benchtop analog, but their shortcomings are overshadowed by their potential use cases and the promise that large data sets and AI will enable real-time diagnostics anywhere. Toward the development of portable and wearable fNIRS platform, we report the design and validation of a bandage-sized wireless system with high sensitivity, which can be adopted to various geometries. The firmware development is aimed at enabling flexible usage with resilience to overcome usage error and drift. The hardware design for fNIRS has been optimized for adoption to next generation conformable electronics. The presented system has been validated using occlusion, breath holding, and cognitive workload tests to demonstrate the potential of wearable fNIRS for future AI-driven algorithm development.
2. Materials and Methods
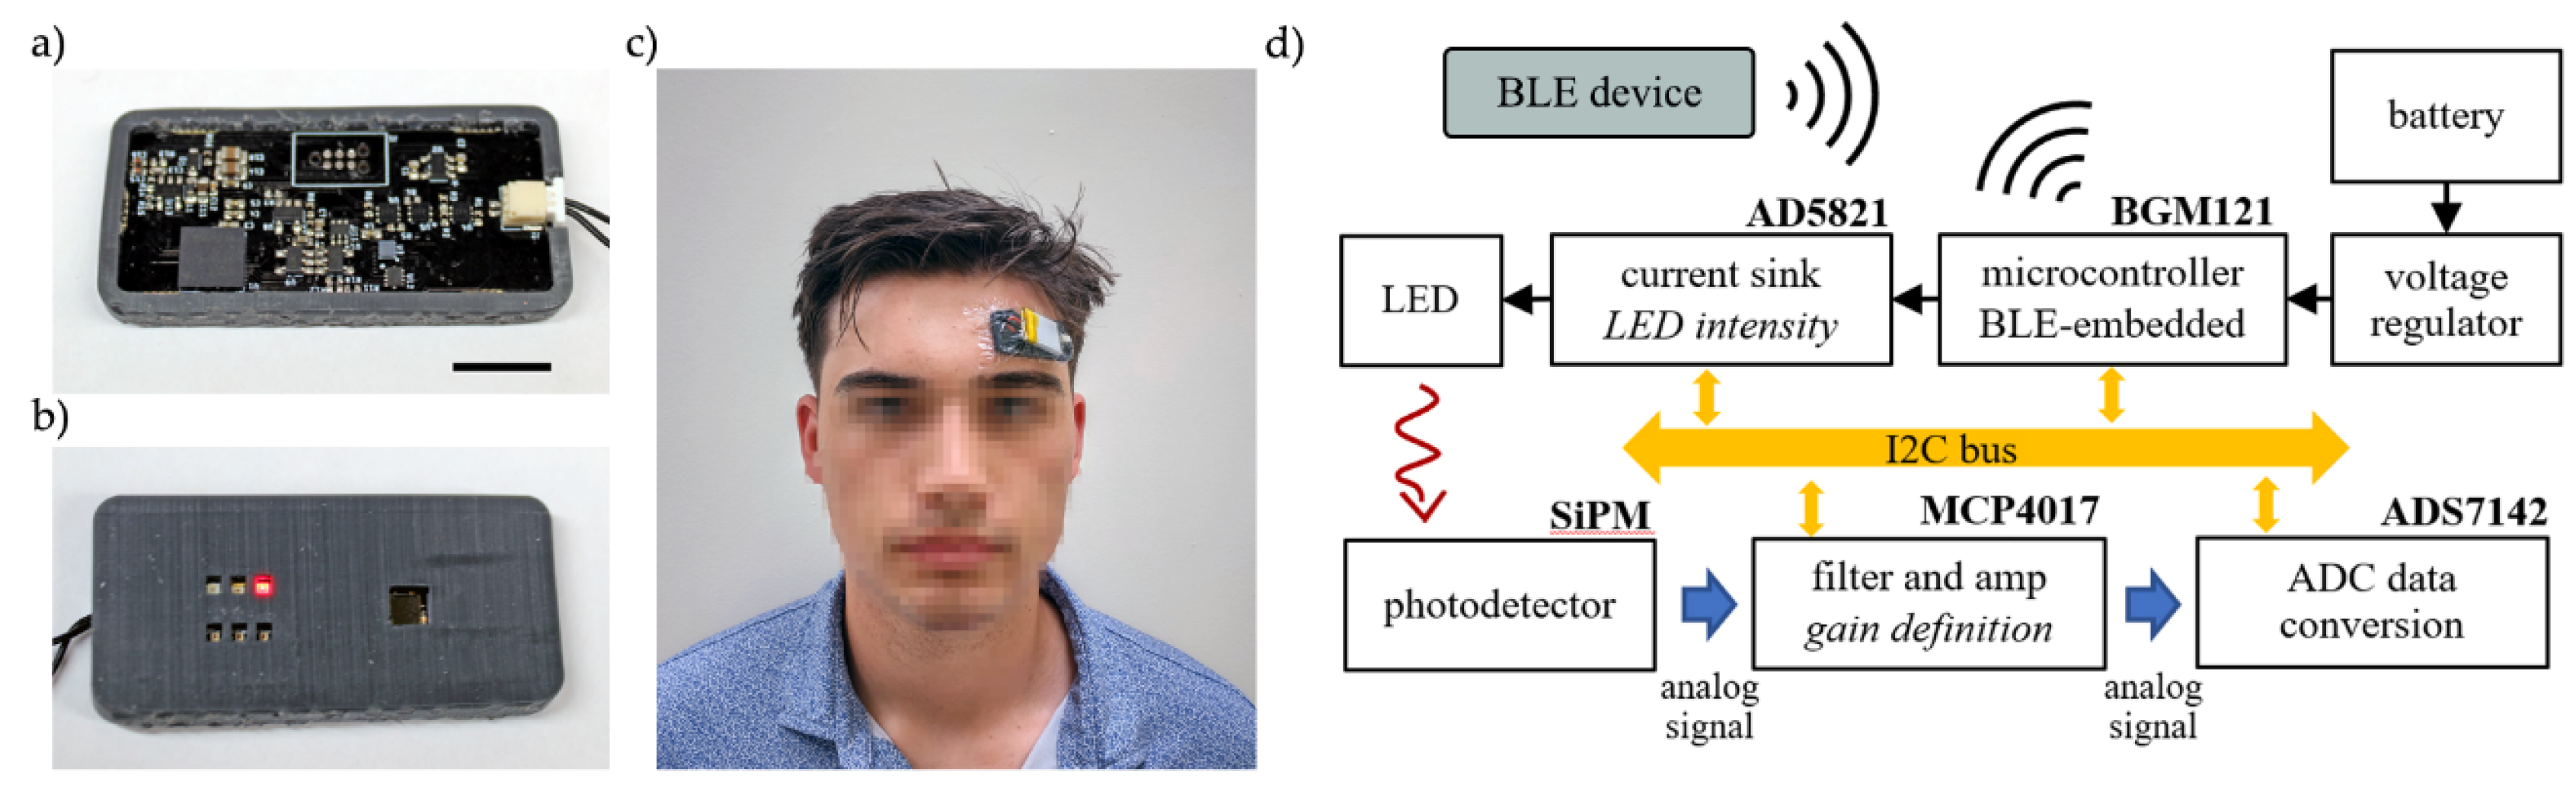
The wearable fNIRS sensor was designed as a 2-layer circuit board to place the photodetector and LEDs on the skin-facing side and the rest of the electronics on the other side, see
Figure 1. Commercial-off-the-shelf (COTS) LEDs and photodetector were used in this work, however we have previously demonstrated a method to realize flexible inorganic optical elements [
25], which can provide conformable optics in the 2-layer design. A flexible 3D-printed shroud is used to improve the interface between the planar circuit board and the curved forehead. In addition to increasing user comfort, the shroud blocks background light and improves signal quality. Shroud was printed using a 3D printer (Form3, Formlabs Inc., Somerville, MA, USA) using the Flexible 80A resin. The shroud is designed to match the height of the thickest optical component, which in our design are the LEDs. The entire completed device is coated with Parylene-C for biocompatibility [
26].
2.1. Hardware
The sensing platform is based on a commercially available 32-bit microcontroller (BGM121, Silicon Laboratories Inc., Ausitn, TX, USA) which controls the optode activation, LED intensity, signal gain, ADC readings, and BLE communication. Parameters for light source selection and intensity, gain levels, and sampling frequency are defined by auto-calibration routines or entered manually by the user through BLE protocol.
The platform contains multiple source-detector pairs to investigate oxygen changes with optode separation, to accommodate various device placement locations on the body and to provide resilience to variations in user’s placement of the device. LEDs were arranged in three banks at 20.2 mm, 17.7mm, and 15.2 mm source-detector distances, wavelength values of 655 nm (APT2012SRCPRV, Kingbright Inc., City of Industry, CA, USA) and 850 nm (15406085BA300, Würth Elektronik Inc., Waldenburg, Germany) were used in each bank. A Silicon Photomultiplier (SIPM) (MicroFC 30035, On Semi Inc., Scottsdale, AZ, USA) with an active area of 9 mm2 was used for the detection of the light signals.
The communication between the microcontroller and the peripheral devices is made over an I2C bus, the LED enabling is managed by using MOSFETs (NTLUD3A50PZ, On Semi Inc., Scottsdale, AZ, USA) controlled by GPIO ports from the microcontroller, the light intensity is defined by a DAC current driver (AD5821, Analog Devices Inc., Wilmington, MA, USA). Detection readings are transduced to voltage measurements over a 100Ω resistor in series with the photodetector. Prior to analog-to-digital conversion, the voltage signal passes through a buffer, a low-pass filter with 7kHz cut-off frequency, and a variable gain stage. Signal processing circuitry was implemented using low-noise op amps (MCP6001R, Microchip Inc., Chandler, AZ, USA). The filter stage was a second order Sallen-Key. Non-inverting configuration was used for the amplification; variable gain was achieved by utilizing a digital potentiometer (MCP4017, Microchip Inc., Chandler, AZ, USA) in the feedback loop. The microcontroller retrieves the photodetector measurement from the ADC (ADS7142, Texas Instruments Inc., Dallas, TX, USA) over the I2C bus and stores it in memory before timed Bluetooth Low Energy (BLE) transmission to the external device. Device block diagram is summarized in
Figure 1d.
The sensing platform was conceived to be compact and comfortable, reaching wearability requirements needed for a device that must be used for long periods of time. All the functionalities, including optode configuration, activation, data collection, conversion, and BLE transmission being processed in a 19 x 44 mm circuit board. The entire system can be fixed to the user’s forehead with medical film dressing (3M Tegaderm). The platform utilizes a lithium-ion 3.7V (nominal value) battery. A 500mAh battery can provide 50 hours of operation between charges under continuous operation with sampling rate of (10Hz). For a specific use case, continuous measurements may not be necessary, allowing the DeepSleep function significantly extend batter life.
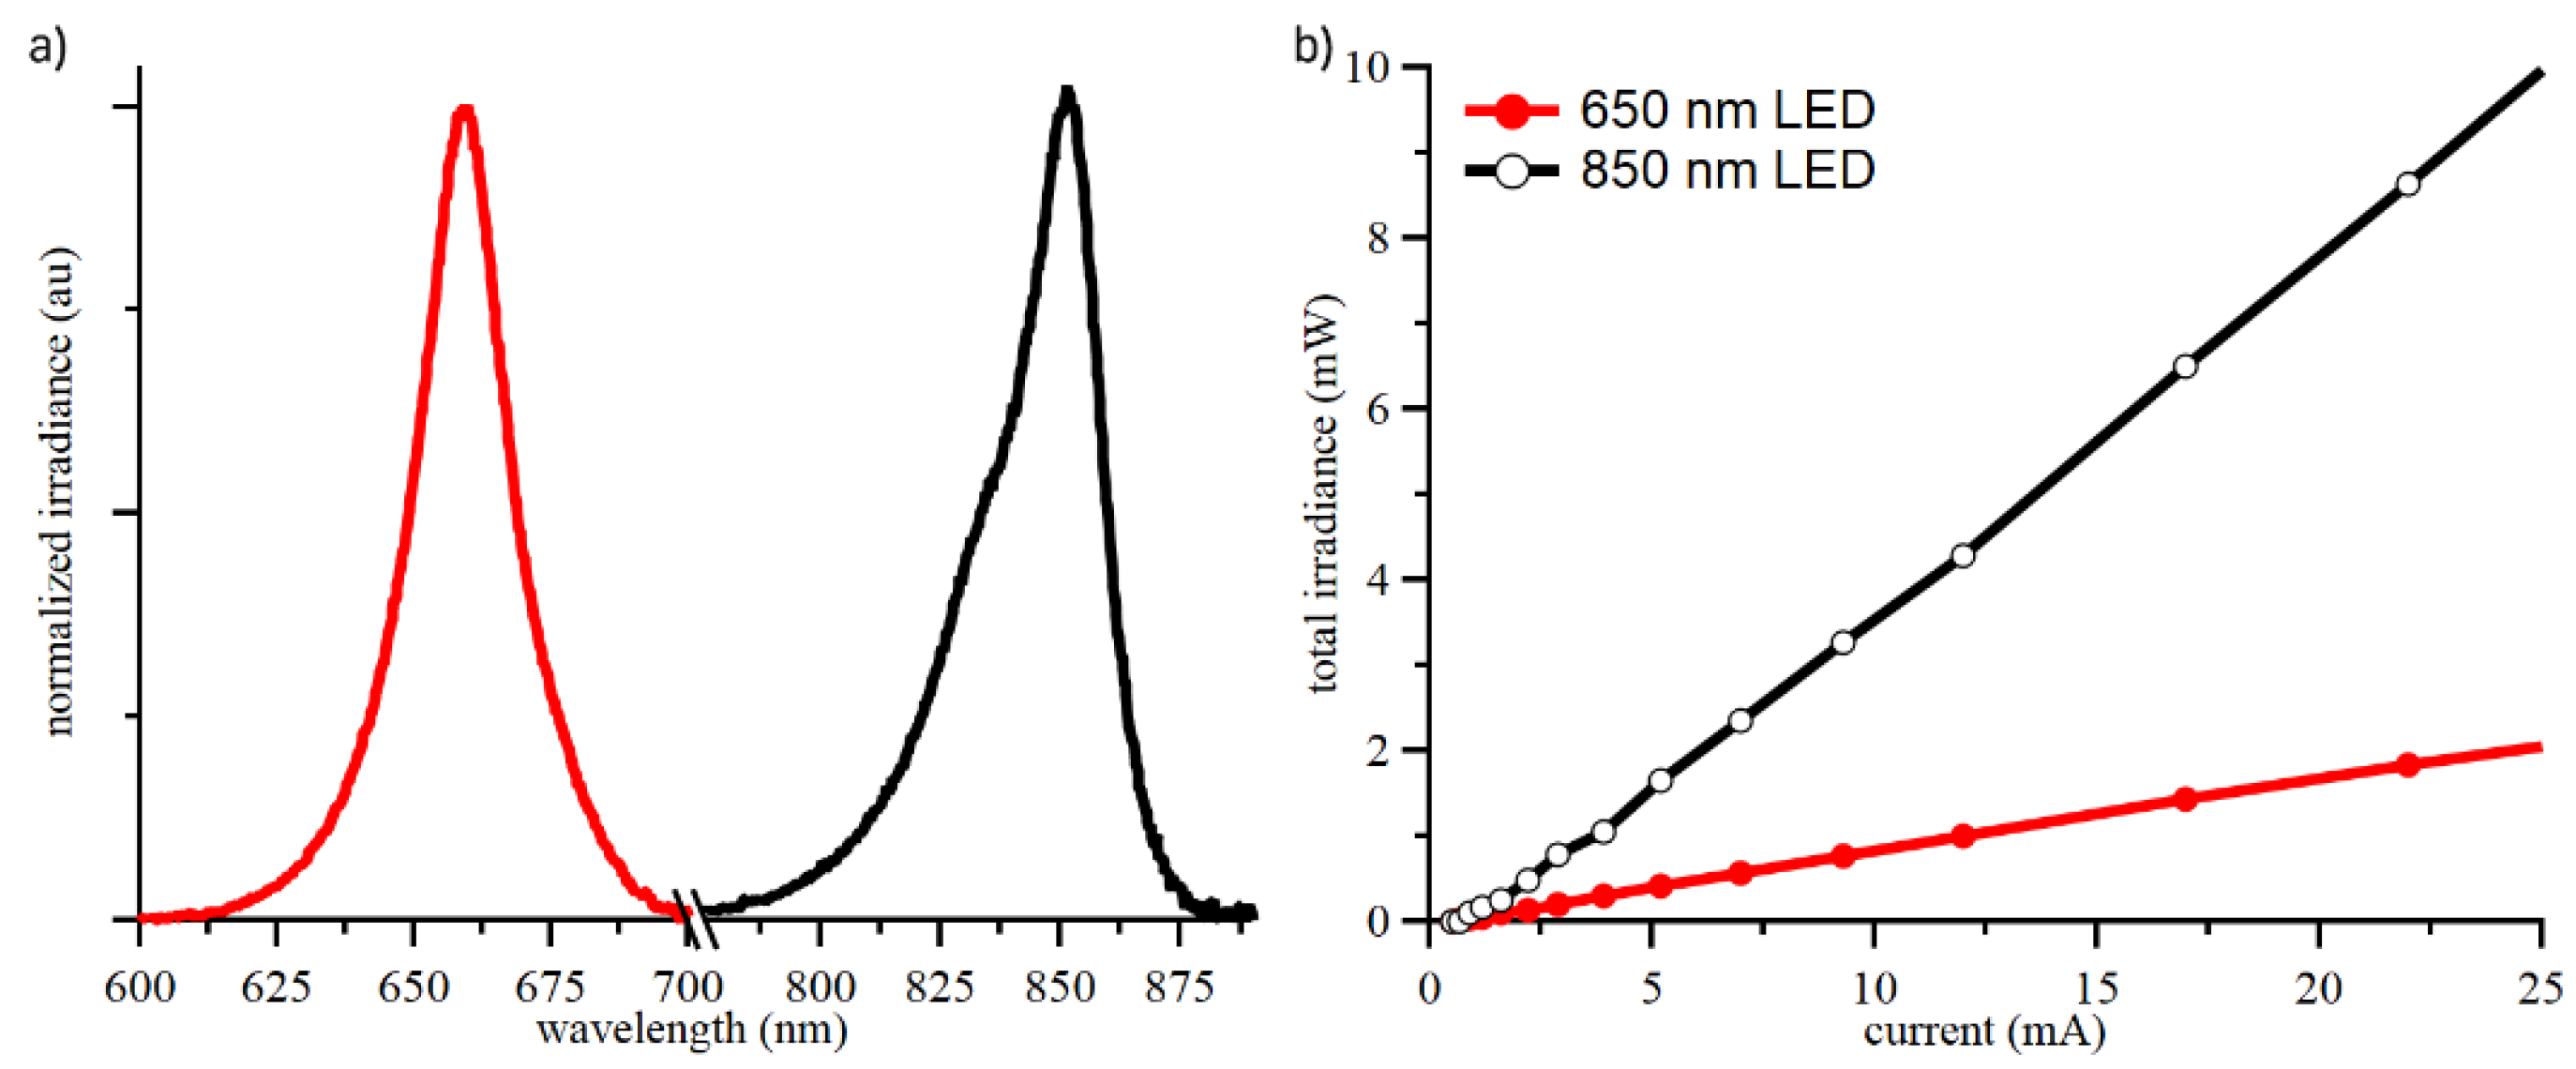
2.1.1. LED Characterization
The calculation of both oxy- and deoxy- hemoglobin changes requires readings at two different wavelengths, and the chosen values were 655 nm and 850 nm. LED spectral output and power were characterized using a spectrophotometer (LR1, Aseq Instruments Inc., Vancouver, Canada) and an integrating sphere (IS6, StellarNet Inc., Tampa, FL, USA) to determine safety limits for LED drive current based on IEC62471 (see Supplementary Information), shown in
Figure 2.
2.1.2. Optical System Optimization
Significant optical losses and signal corruption occur at the body-device interface. To improve blocking of ambient light, the photodetector was fitted with an optical filter (LEE 026 Bright Red). In addition, black silicone was applied around the sides of the photodetector and between the PCB and the shroud to reduce stray light from reaching the detector. In addition, polydimethylsiloxane (Sylgard 184 at 10:1 ratio cured at 80°C for 1 hour) was used to fill the empty spaces around the LEDs and photodetector and create direct contact to skin.
The effectiveness of the optical coupling was evaluated on the same device before and after fabrication. The coupling was evaluated on the wrist to reduce signal variation due to cortical hemodynamics. Measurements were collected at fixed hardware gain and variable LED drive current. From the collected 30-second time series, the AC and DC components of the hemodynamic response were extracted using MATLAB (MathWorks Inc., Natick, MA, USA) and normalized per total LED irradiance in mW. We term this value Coupling Factor (CF).
Effective coupling of light from the LEDs to the skin and the photodetector is critical to achieve high data fidelity and low power operation. The addition of clear compressible polymer to fill the air gaps between device-skin interface significantly improved the CF in our device, see
Table 1. The improvement in CF scales with optode separation and achieves an approximately 10× improvement at 20.2mm separation. CF improvement for 650 nm LED coupling is higher than 850 nm LED potentially due to the shallower penetration depth of the shorter wavelength. The difference in DC and AC coupling is attributed to the vasculature structure at the placement site. Consistent improvement in both CFs demonstrates that the polymer-capped optical package will achieve a lower power consumption, particularly with large optode separations.
2.2. Software and Interface
Firmware was developed to manage fNIRS signal acquisition with a BLE connection. The device initially enters idle state with BLE advertising when powered on. When a BLE connection is established, advertising stops, the measurements of light absorption start, and data are sent over a dedicated UUID. To control device parameters during operation, a second two-byte UUID was created to support user commands for sampling frequency, optode activation, light intensity, photodetector gain, and self-calibration routines, see Supplementary Information.
2.2.1. Optode Operation
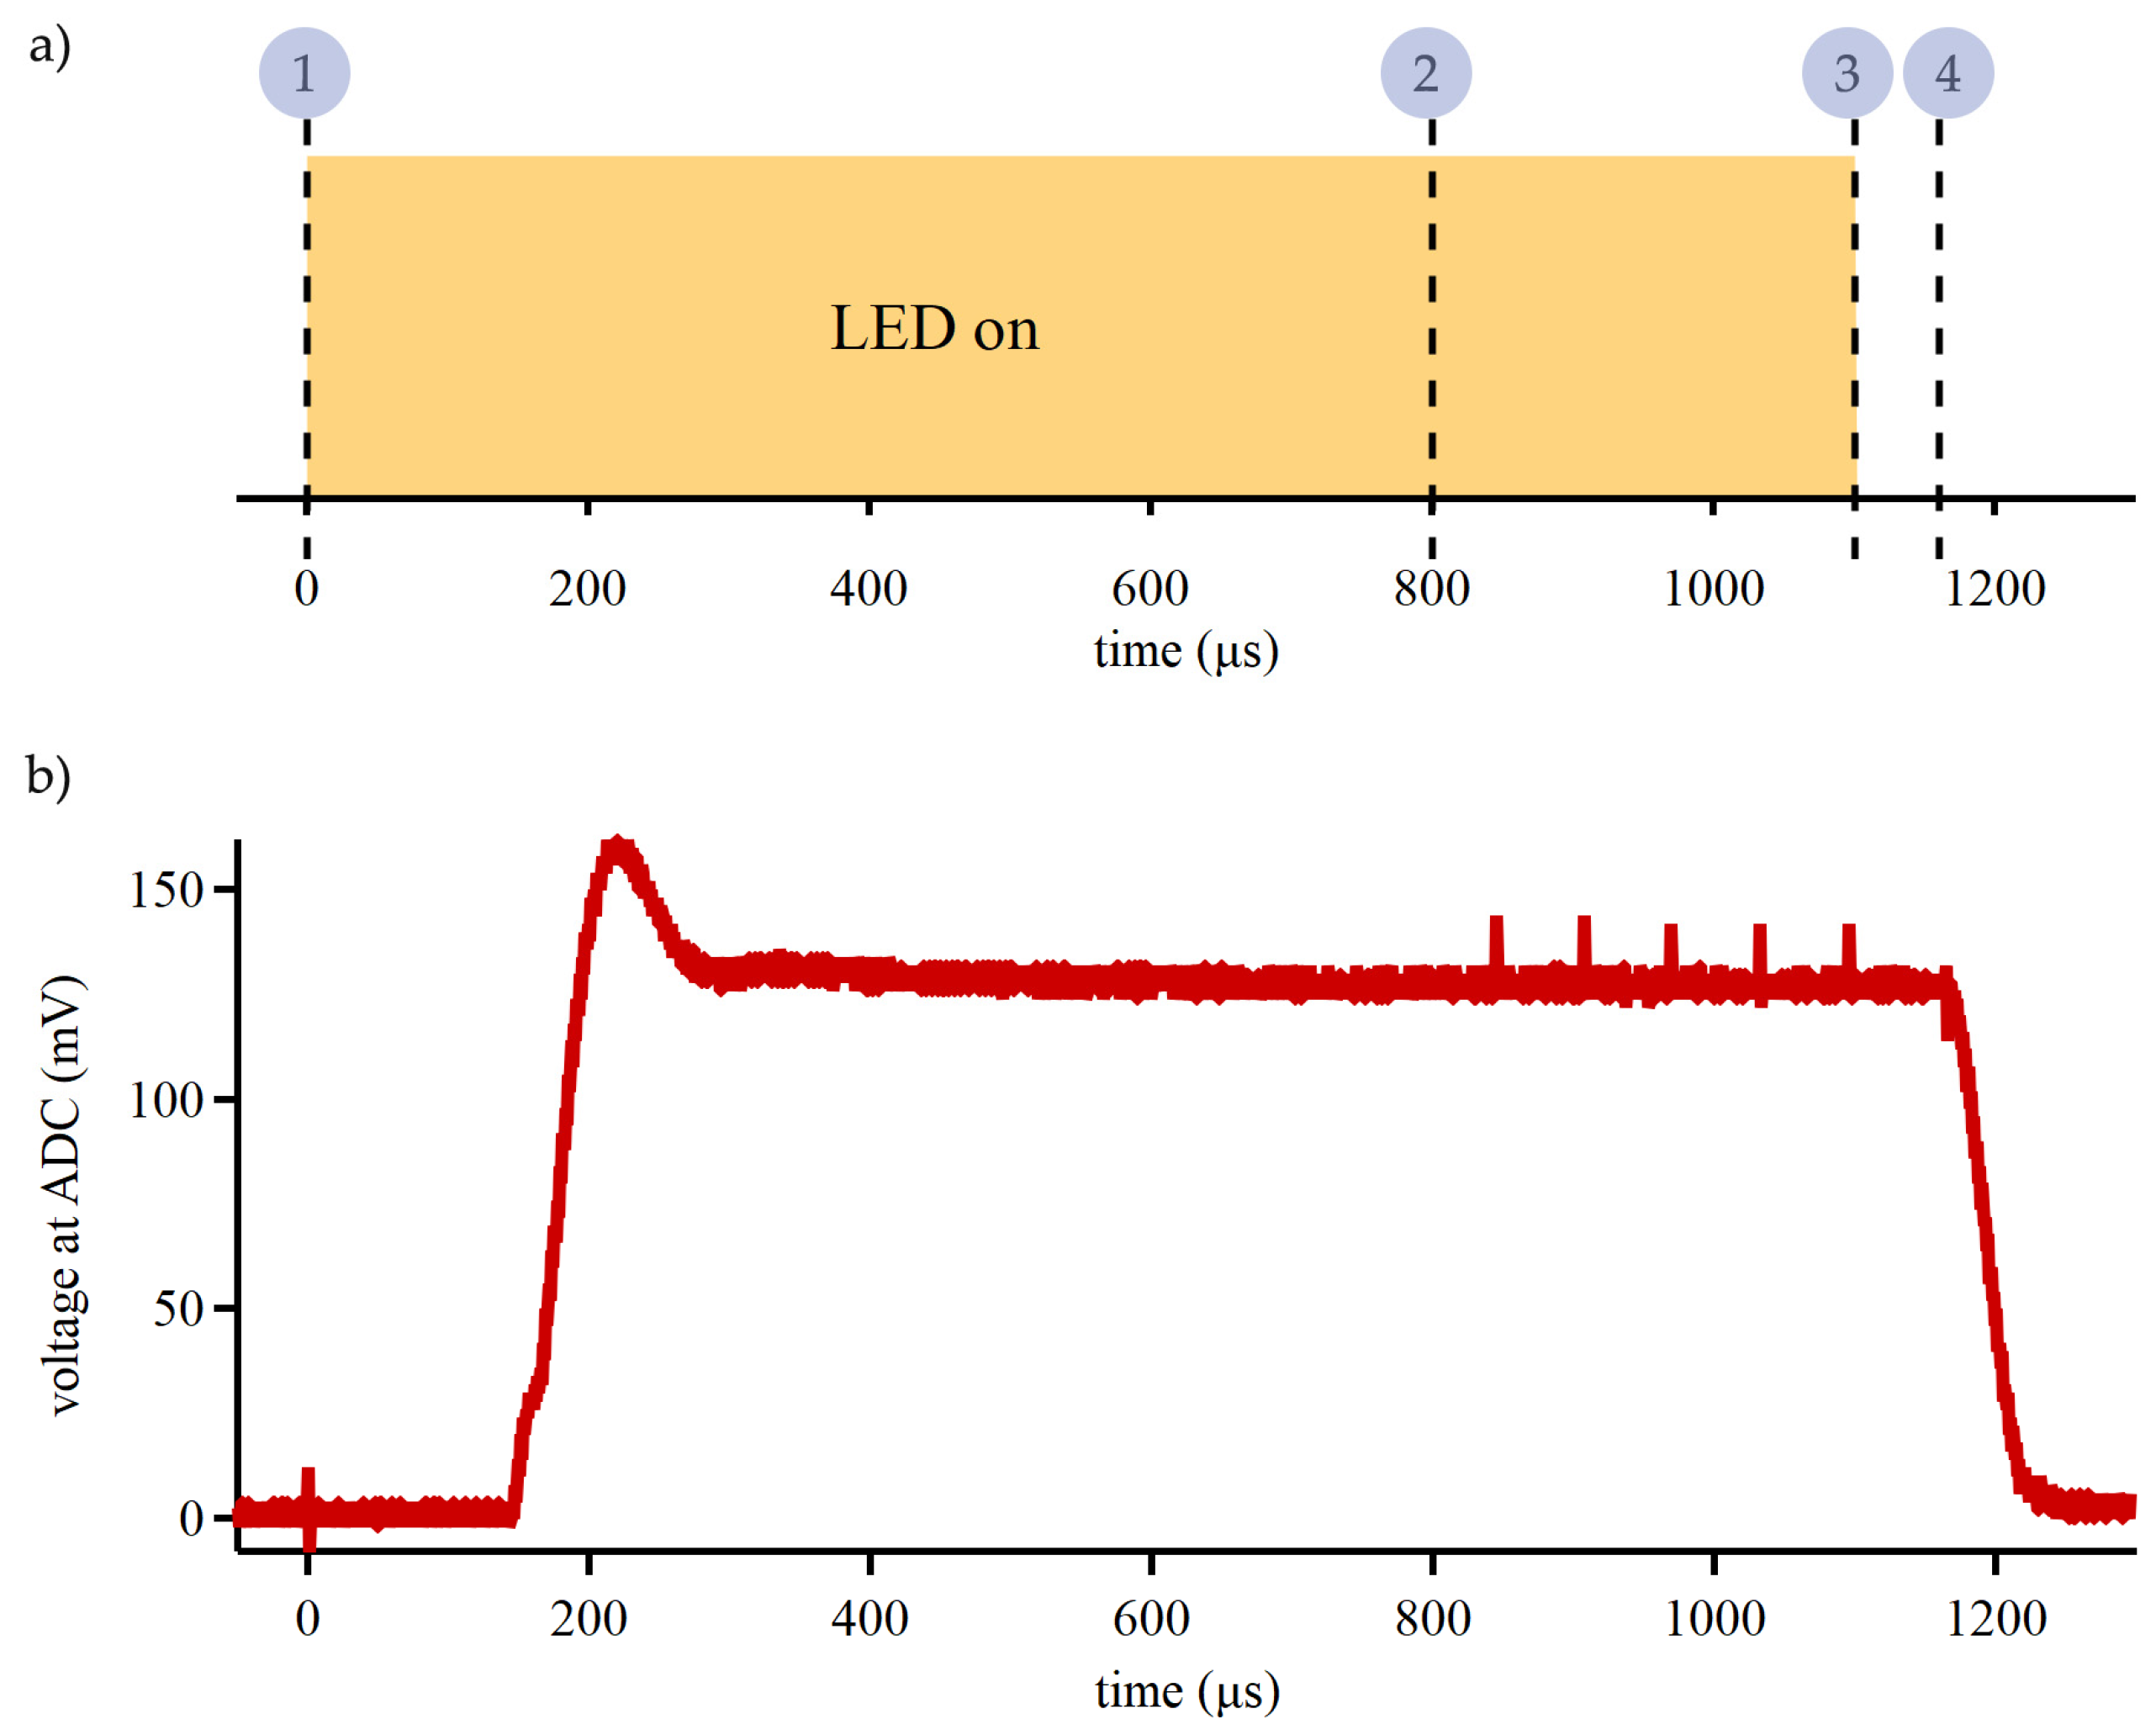
Accurate calculations of hemodynamic changes in our device require reliable optical measurements. High sensitivity photodetector (~10
6 A/W) is utilized in our design to minimize the LED drive current and to support large optode separation in future works. Timing of optical component activations was optimized to minimize power consumption and overcome the time constant of the system. Before signal acquisition starts and immediately after the previous LED deactivation, the value for the next LED drive current is written to the DAC register and the gain for signal processing circuit is set on the digital potentiometer. The sequence for signal acquisition is shown in
Figure 3a. ADC readings of the signal from the photodetector are requested 800 µs after the LED MOSFET is activated to allow for the stabilization of LED output, DAC output, and SiPM. After ADC readings, the current sink is disabled and MOSFET is switched OFF.
The stability and precision of optical signal transduction was evaluated by comparing 5 sequential readings taken at 16.67 kHz (60 µs apart). This assessment task was conducted with the device placed on a reflective phantom and running custom firmware routine. The results from 5 sequential readings were compared using a paired two-sided t-test with 1% significance level, see Supplementary Information for details. For ADC measurements initiated 800 µs after the current driver and MOSFET, there was no statistical difference between the sequential readings, which indicates that the optical system was at steady state. Period of ~1000 µs is the fastest reliable sampling time achievable with our device for a single optode pair. Optode signal stabilization is the main limitation to the sampling speed of our device; however, hemodynamic changes are significantly slower than the fundamental limit of our device.
2.2.2. Data Processing
All ADC data are filtered using an ideal 2 Hz lowpass filter prior to conversion to hemoglobin concentration. Changes in oxy- and deoxy- hemoglobin concentration, ΔC
HbO and ΔC
Hbb, were calculated from the measured intensity of the reflected light using the Modified Beer-Lambert Law (MBBL) [
27,
28,
29,
30]. Changes in concentration were calculated using:
where
d is the distance between the source and the detector, ε
HbOλi and ε
Hbλi are the extinction coefficient for both oxy- and deoxy- hemoglobin at each wavelengths,
OD is the optical density, and the
DPF is the differential pathlength factor, defined as [
27,
30,
31]:
where
μa,λi and
μ’s,λi are the absorption and reduced scattering coefficients for each wavelength
i, respectively. Coefficients used in calculations were taken from the literature [
32,
33] and are summarized in Supplementary Information.
Optical density changes, ΔODλi, are calculated in relation to a baseline, which enables calculations independent of the intensity emitted by the LEDs. Once the intensity is selected, an initial acquisition interval is used as a baseline and then the changes are taken as a ratio to the baseline. This approach also supports computational updates to overcome changes in the LED light intensity or ambient lighting for use in a dynamic environment. The ADC readings are sent over the BLE to a custom GUI interface and changes in concentration computations are conducted off-chip to reduce device power consumption and to visualize data in real time.
In addition to custom software for real-time data analysis, offline computation was carried out using the Homer3 toolbox available in MATLAB [
34]. For Homer3 data processing, the raw ADC data was imported and corrected for artifacts. First, motion artifacts were removed using hmrR_MotionArtifact routine with
tMotion = 0.5,
tMask = 1.0, STDEVthresh = 50, and
AMPthresh = 50. Afterwards, Correlation-Based Signal Improvement (CBSI), Principal Component Analysis (PCA), Savitz-Golay (SG), and Wavelet filtering were applied to improve the quality of the hemoglobin concentration changes data. SG correction was used with
p = 0.99 and
FrameSize_sec = 10. Motion wavelet correction was used with
IQR = 1.5.
2.3. Human Subject Testing
Testing was divided into two phases: validation and two human subject experiments. For fundamental validation, an occlusion test was performed with the sensor on the wrist and a sphygmomanometer cuff placed around the upper arm. A 5-minute interval of seated rest prior to occlusion was collected to establish a baseline. The cuff was inflated to 200 mmHg, above the systolic pressure, to induce arterial occlusion [
35,
36]. In the second validation test, the sensor was placed on the prefrontal cortex while the participant was instructed to hold their breath to record hemodynamic changes at different optode distances [
37]. The participant performed two 30-second breath-holding intervals, preceded by a relaxed inhale (to avoid hyperventilation) with a 60-second resting period between intervals [
38,
39]. The sensor configuration settings for both validation tests—occlusion and breath holding—were determined using the autocalibration function. This process defined the LED intensity current values and amplification gain for signal detection, with the resulting values provided in Table TS2 of the supplementary material. All measurements were collected at 10Hz. Changes in hemoglobin concentration were filtered using a 5-second moving mean.
To assess the capabilities of the developed sensor to measure cognitive activity, participants were recruited to perform arithmetic operations with the sensor placed on the left prefrontal cortex. For this study participants performed a series of three-digit and two-digit additions, similar to other fNIRS study [
40]. Our work, utilized a block protocol design to induce a cyclic pattern of mental effort, alternating mental math with rest, and alternating the mental math difficulty (three-digit and two-digit). For the duration of the testing, the participants remained seated and followed the prompts on a computer monitor. Before and after mental activities, long resting periods were used to collect the baseline and the recovery. Each mental activity task was a 2-minute block of arithmetic, followed by a 2-minute block of rest. The study was conducted in two groups. The first group of 5 participants had 10 minutes of rest before and after the arithmetic tasks, with 5 cycles of three-digit and two-digit additions. The second group of 5 participants had 20 minutes of rest before and 30 minutes of rest after the arithmetic tasks, with 3 cycles of additions. The entire testing protocol was developed on a custom graphical interface in MATLAB for exact timing and to remove user distractions. During the long resting periods, participants watched relaxing videos, and during the 2-minute blocks of rests, a countdown timer was displayed on the screen. Additional details of the study are in the Supplementary Information. During the study, research staff supervised the participants and annotated their performance and behavior.
On-body evaluation of the fNIRS devices was performed in compliance with an IRB-approved protocol (FIU 22-0506). Subjects gave written informed consent before participating in the study.
3. Results
3.1. Device Validation Studies
The developed wearable device was initially assessed for tissue oxygenation measurements in an arterial occlusion test. During arterial occlusion the blood flow in and out of the appendage is impeded, and the supply of oxygen is consumed. In the process, the oxyhemoglobin concentration decreases and deoxyhemoglobin increases. After the release of the occlusion, hemoglobin levels should return to baseline levels. Real-time measurements of arterial occlusion with our device demonstrate the expected physiological response (
Figure 4a), which is consistent with similar PPG and NIRS studies [
41,
42,
43,
44]. During arterial occlusion, optical density change was bigger for the channel with larger optode separation, but there were no other significant differences between the three channels.
The second validation test was performed with the sensor applied to the left prefrontal cortex. During a breath-holding exercise (
Figure 4b), the oxygenated hemoglobin concentration in the brain drops during the initial 5-10 seconds, followed by a recovery in oxygenation that goes above the baseline and returns to baseline levels after the breath-holding is over. This observation is consistent with diving response and cerebral autoregulation to maintain brain oxygenation [
39,
45]. There were no substantial differences between the three channels. Signals measured with our device from the prefrontal cortex contain the PPG waveform, which could be used in future studies to improve brain oxygenation detection [
46,
47]. Nevertheless, our device detected the initial event of decreased cerebral oxygenation in real-time without advanced algorithms.
3.2. Real-time Assessment of Cognitive Activity in Group 1
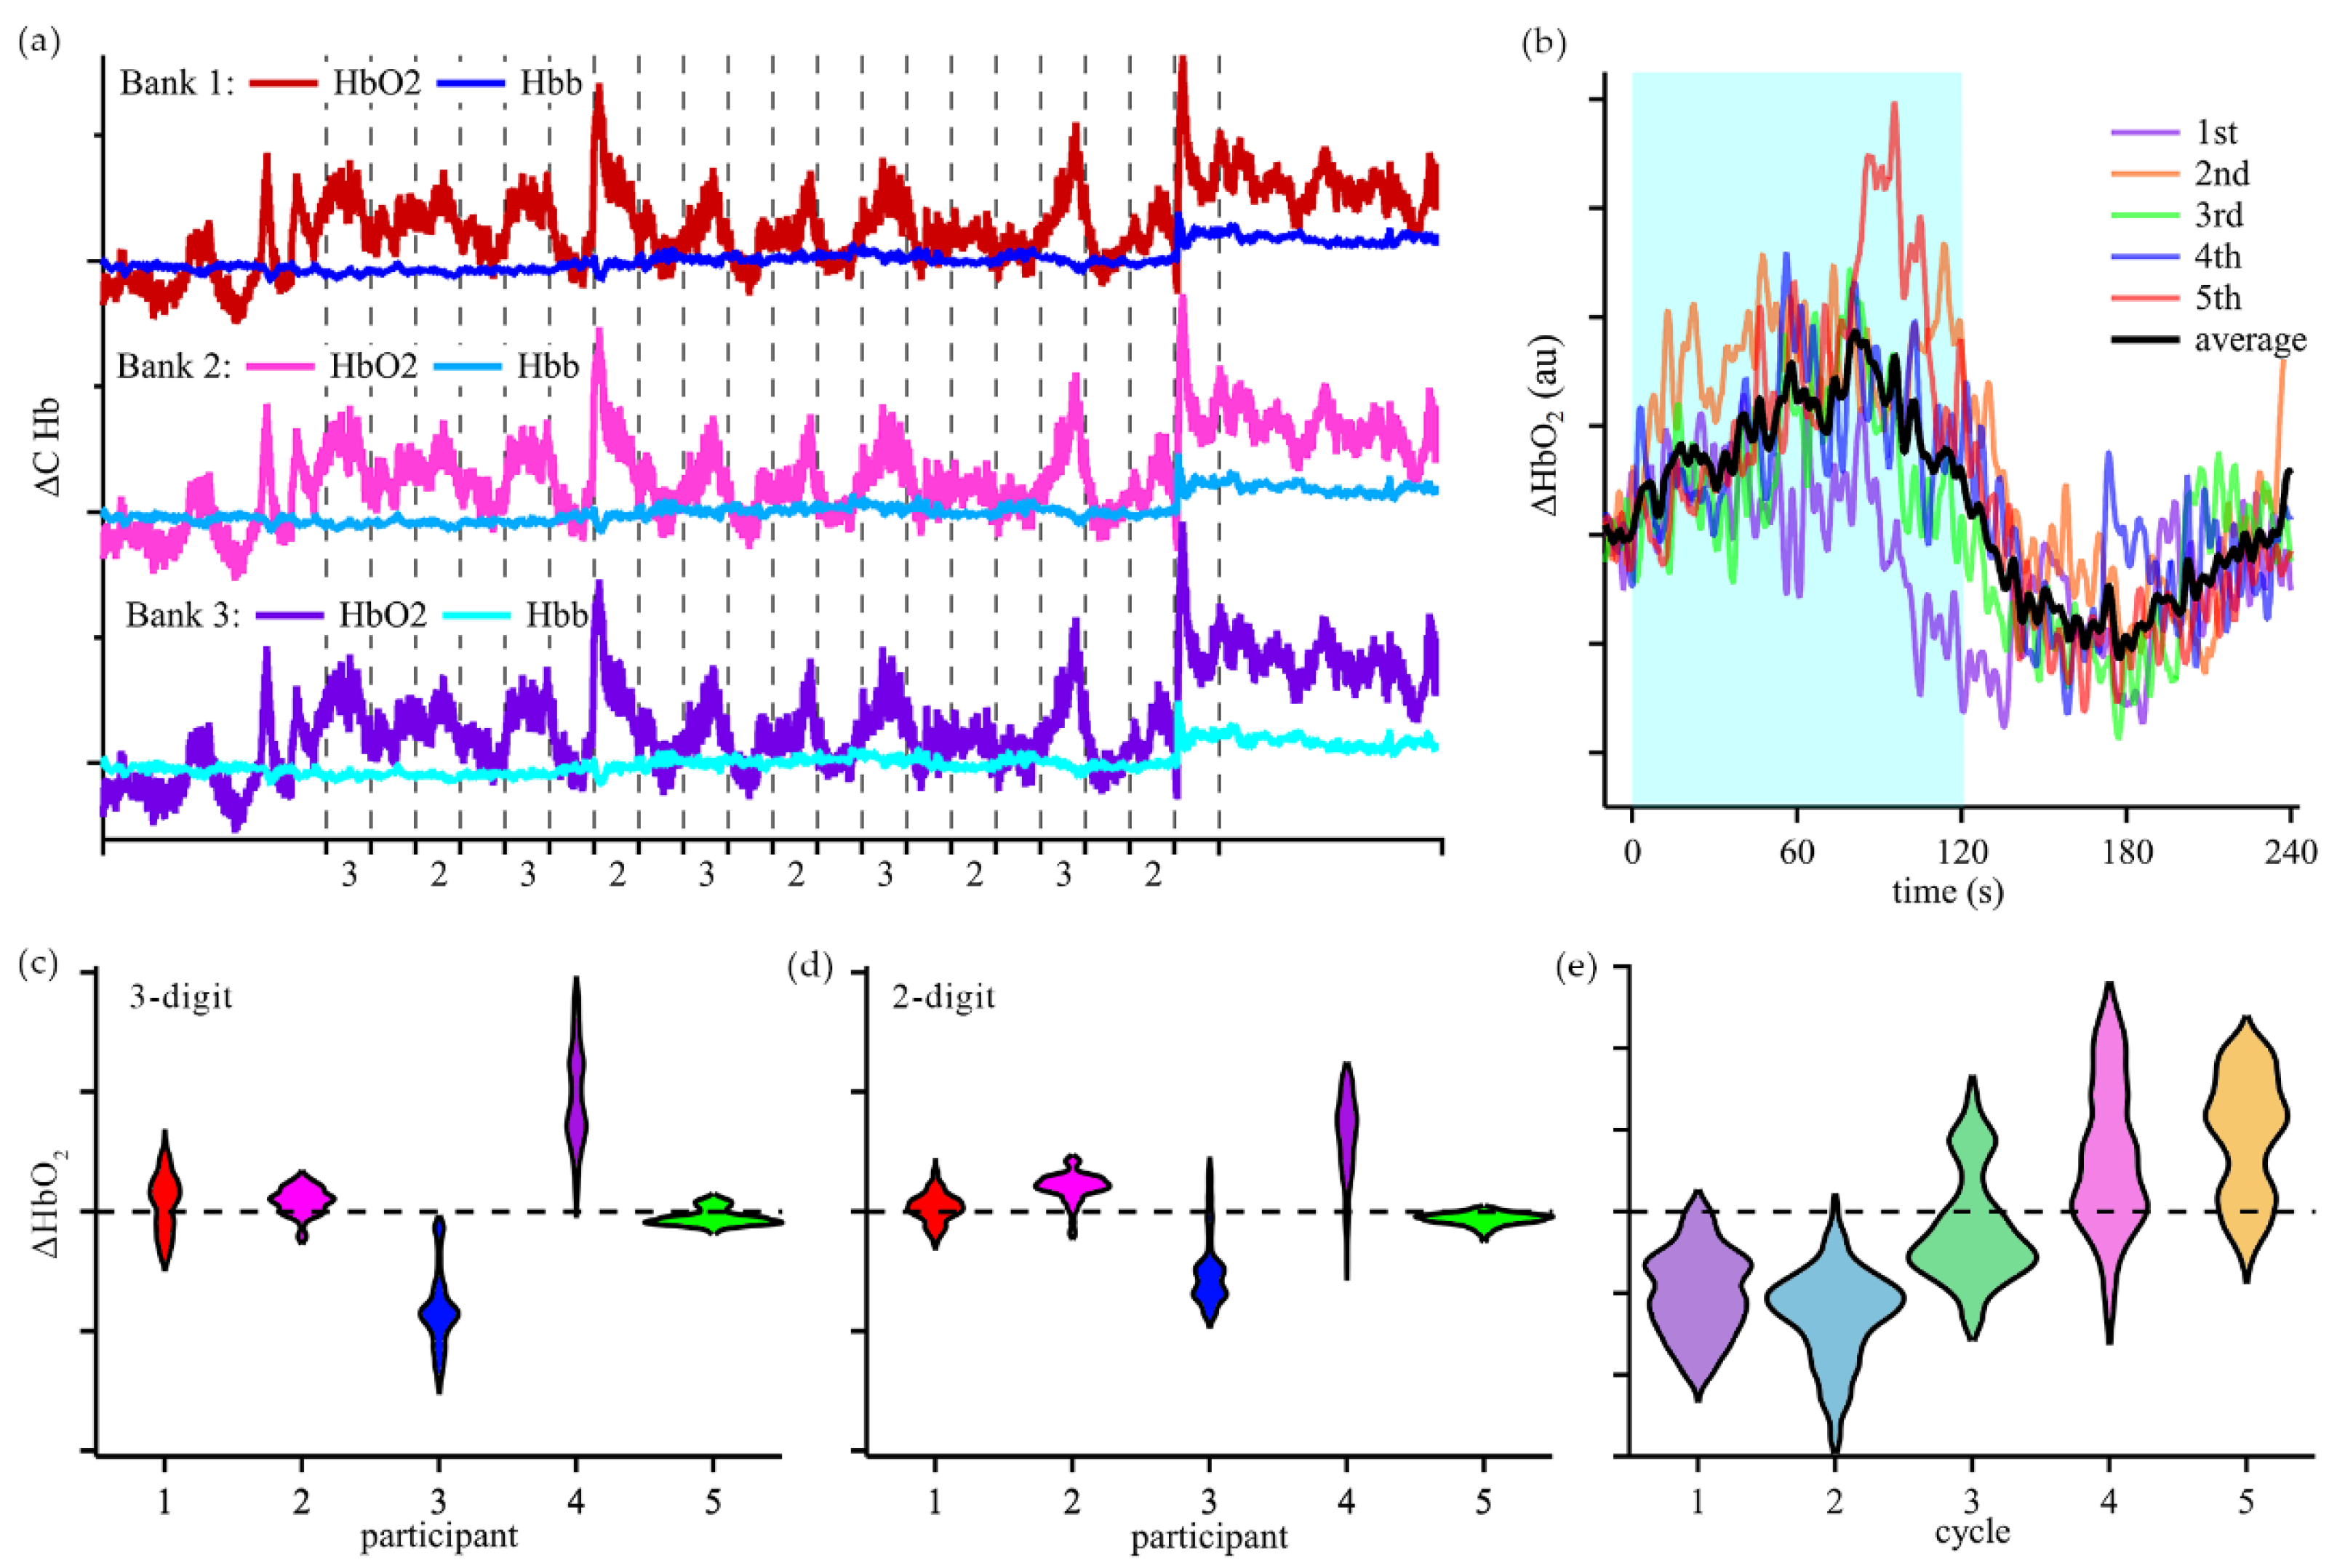
Once the validation tests were concluded, changes in cerebral oxygenation during cognitive activities were assessed as participants were asked to perform arithmetic calculations with our device placed on the FP1 region. Typical time-domain response and calculated changes in hemoglobin concentrations of participants in Group 1 are shown in
Figure 5. Group 1 was analyzed by evaluating the changes in oxygenated hemoglobin concentration during the arithmetic tasks in reference to the end of previous resting period. Violin plots of concentration changes were created to visualize the average behavior over the 5 cycles of 3-digit and 2-digit math (
Figure 3c-d). A unique trend was observed for participant 5, where the response to arithmetic task changed over the course of the experiment (
Figure 3e).
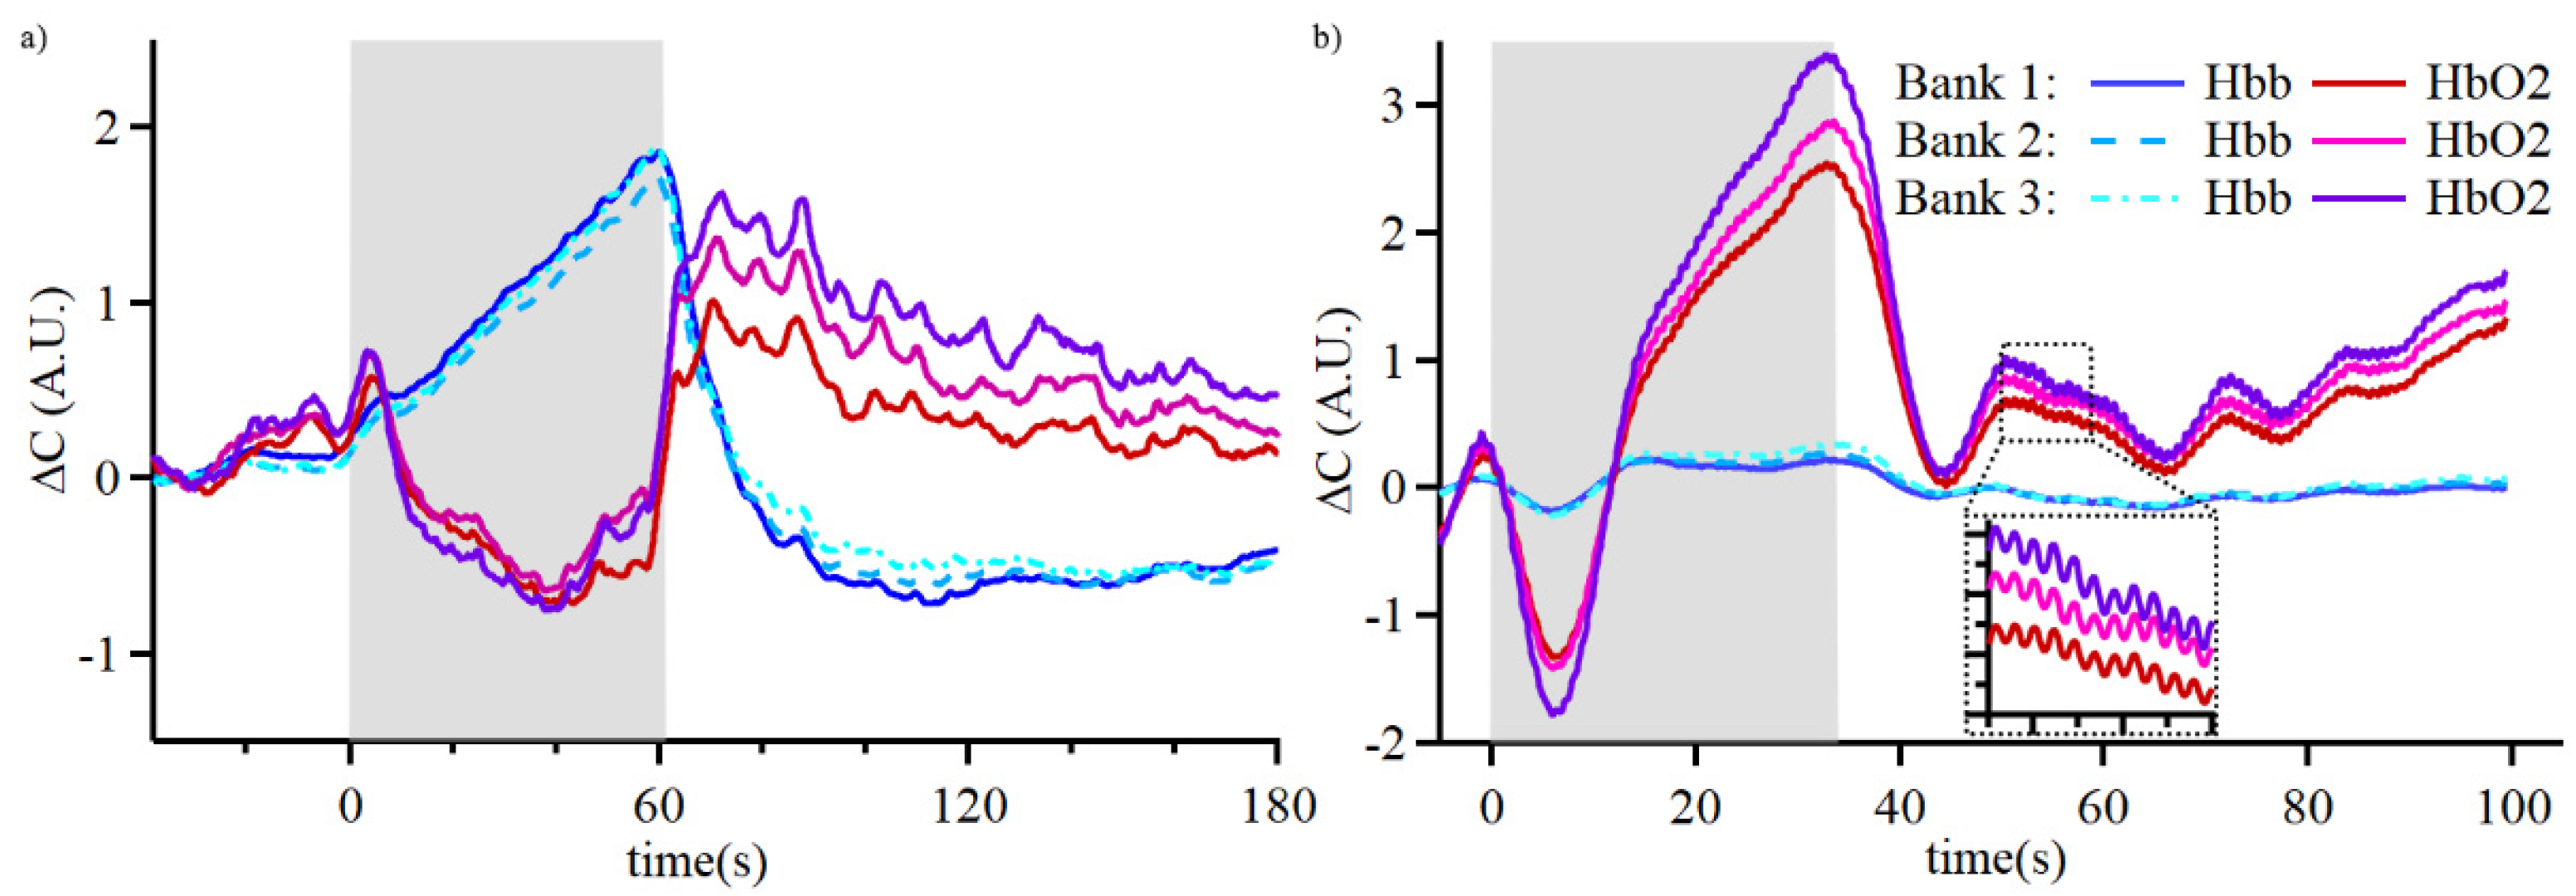
3.3. Frequency Domain Assessment of Cognitive Activity in Group 2
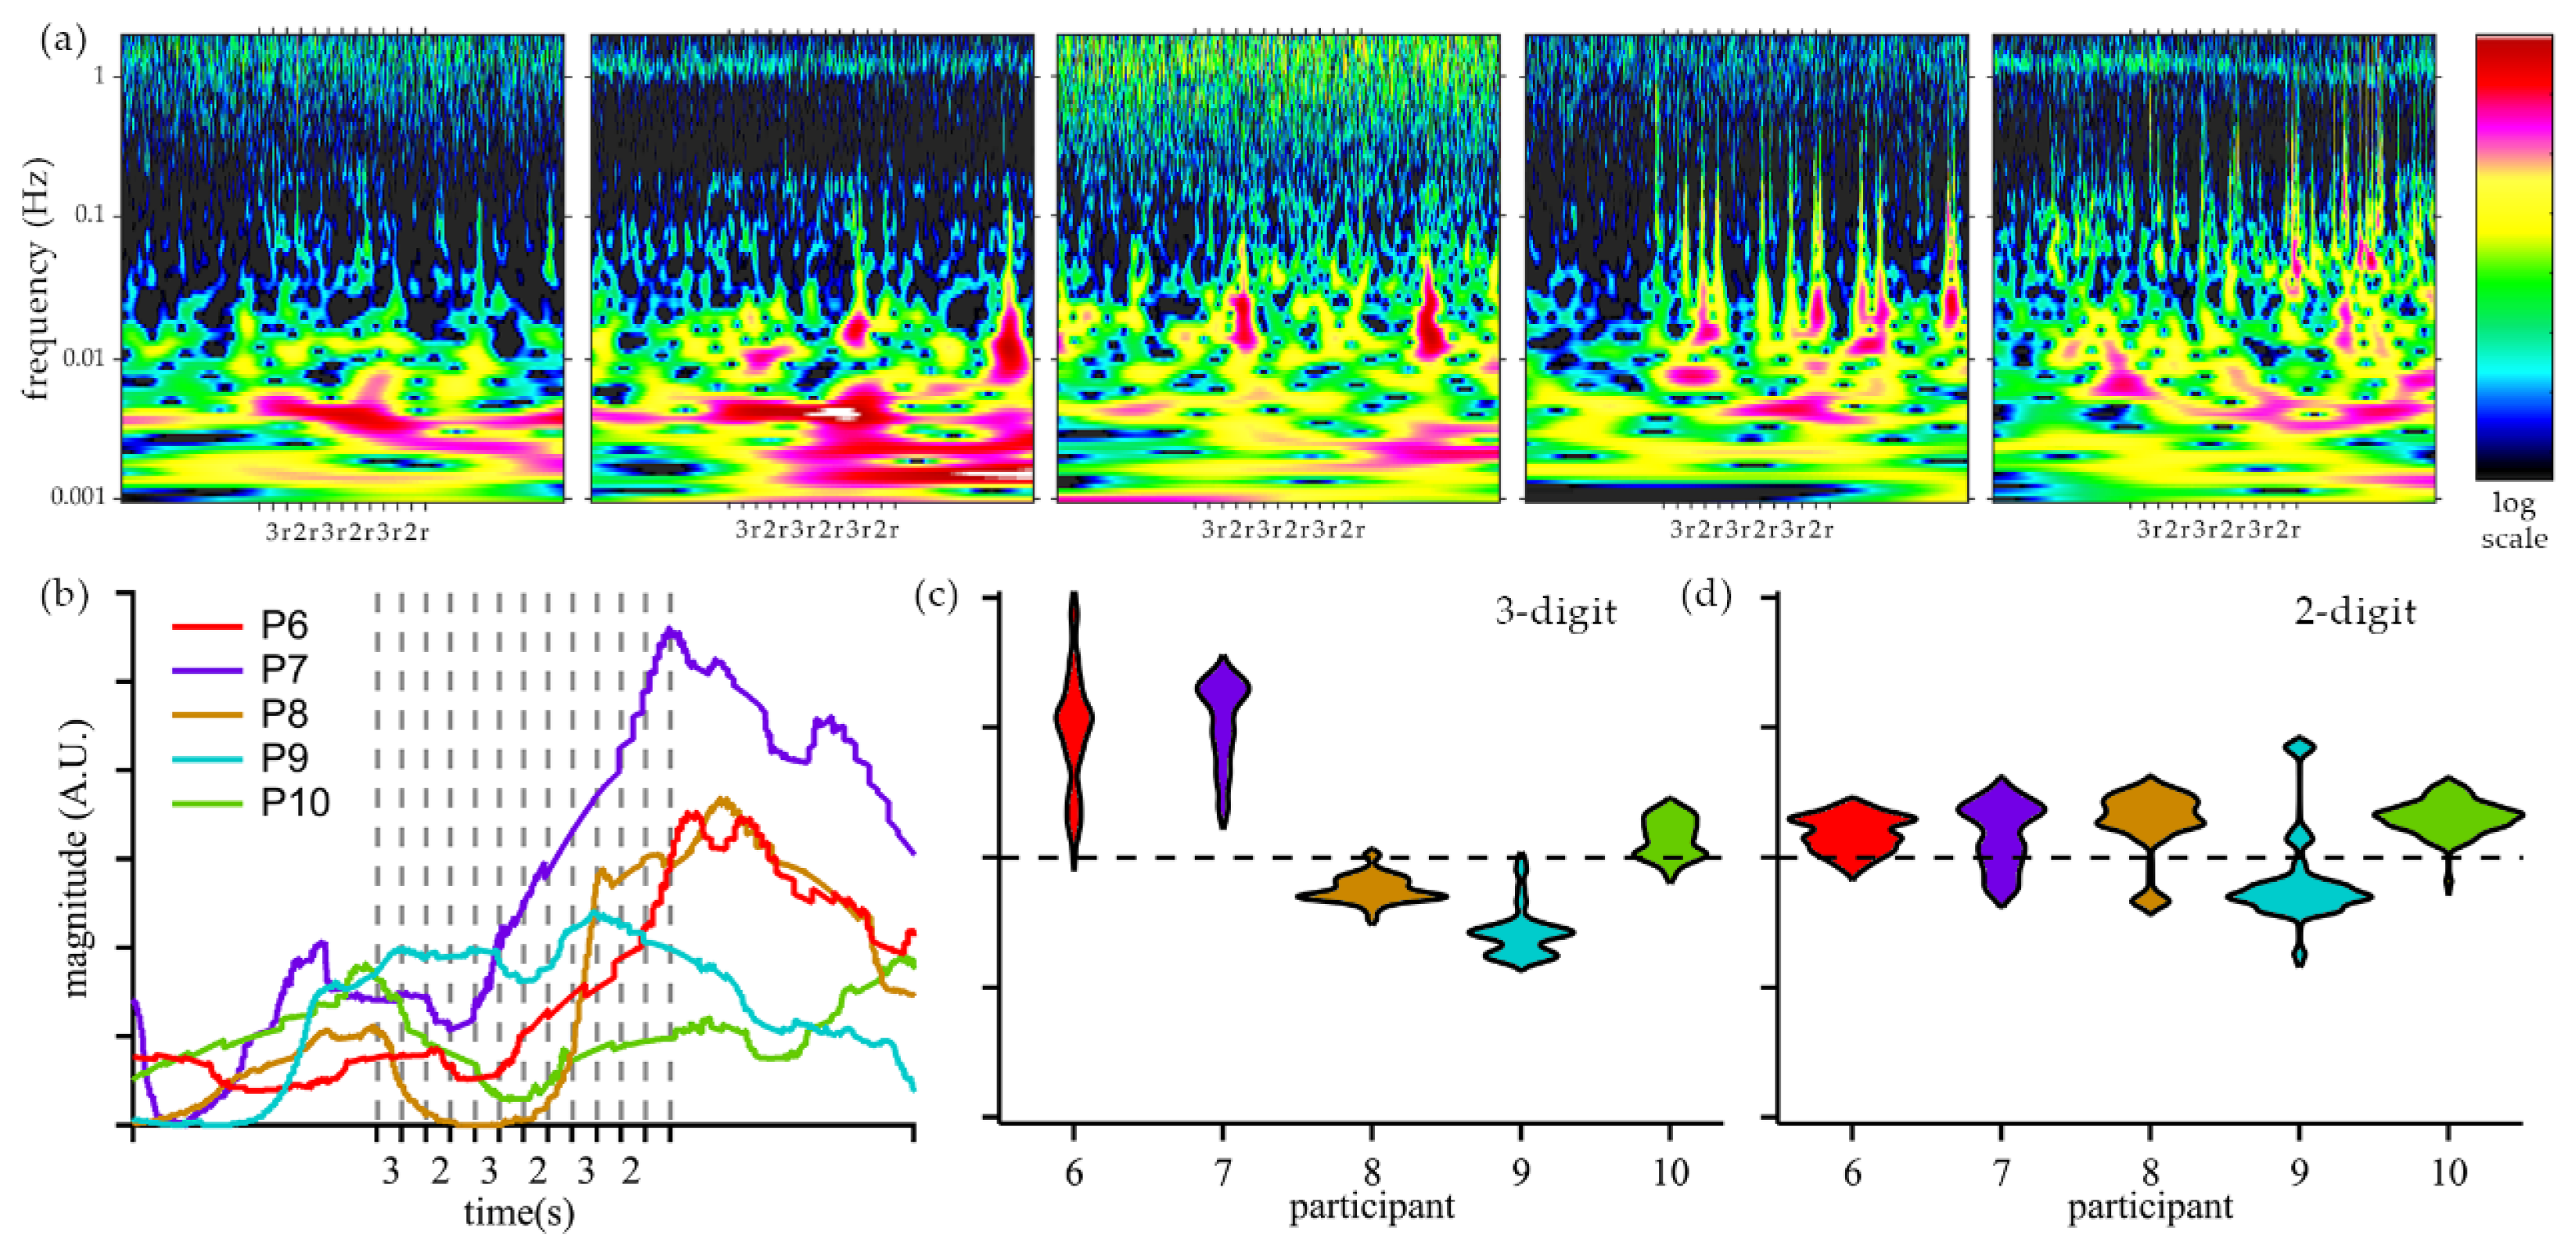
Raw sensor data was processed in Homer to reduce signal artifacts. Changes in oxyhemoglobin were analyzed using wavelet transform to obtain time-frequency responses for Group 2 participants (
Figure 6a). Frequency components of interest were analyzed across the entire population of Group 2 and plotted using the Synchrosqueezed transform, which improves the resolution of temporal changes [
48]. An increased activity in very low frequency (VLF) [
49] of ~2.2 mHz was observed for participants 6, 7, and 8 after the first cycle of arithmetic tasks, see
Figure 6b. Increased activity at 2.2 mHz was not observed for participants 9 and 10. In addition, Group 2 results were analyzed using the time-domain technique applied to Group 1, see
Figure 6c-d.
4. Discussion
During mental activity an increase in cerebral oxygenation is expected based on prior fMRI and fNIRS studies [
41,
42,
43,
44]. While most of the participants in Group 1 study exhibited an increase in oxygenation during the arithmetic tasks, the trend was not universal. Time-domain data from the participants can be classified in two sets based on the oxyhemoglobin concentration, see
Figure 5b. In one set, the oxyhemoglobin level increased during arithmetic calculations (participants 1, 2, and 4). In the other set, the oxyhemoglobin concentration decreased during arithmetic tasks (participant 3). In both sets the changes in cerebral oxygenation for 3-digit calculations were bigger than for 2-digit calculations. Notably, participant 5 displayed characteristics of the second set for the first 2 cycles of 3-digit and 2-digit calculations, and then displayed characteristics of the first set for cycles 4 and 5. This participant provided verbal answers to the arithmetic questions and demonstrated mostly correct answers and effort throughout the testing period. Based on the oxygenated hemoglobin changes during the cognitive tasks and observations, we speculate that the change in the response is indicative of change from effort to fatigue during the cognitive tasks. These results demonstrate the potential to monitor cognitive activity without significant post processing, which is critical for edge computing.
The assessment of mental activity is inherently limited by the reliance on self-reporting or observed behavior. In Group 1 study, some participants did not provide verbal answers to arithmetic problems, which limits the ability to correlate observed signals to the level of cognitive effort. One participant discontinued the arithmetic tasks midway through the study due to stress caused by the calculations; their incomplete data was excluded from the analysis. To promote recruitment and adherence, the participants were only encouraged to answer questions aloud. During Group 1 study, the frequency of yawning increased in cycles 3 and 4 (see Supplementary Information), which increased signal artifacts and may affect the cerebral oxygenation. To minimize the effects of yawning, the Group 2 protocol was limited to 3 cycles of arithmetic tasks and included an extended rest period for frequency analysis.
Frequency analysis of Group 2 participants revealed significant contributions from frequencies below 40 mHz. Specifically, for participants 6 and 7, the magnitude of VLF components increased during the cognitive tasks and persisted into the long resting period. For participants 6, 7, and 8, synchrosqueezed analysis showed an increase of 2.2 mHz component after the initial cycle of arithmetic tasks and a decrease during the long resting period, which is consistent with cognitive fatigue and recovery. Signals observed in the Very Low Frequency (VLF) range [
50,
51], are sensitive to mental workload [
49,
52] and are not affected by other physiological signals, such as Mayer waves, cardiac and respiratory signals [
49]. While our study block design has a frequency component around 2.1 mHz (8-minute period), it would be low in amplitude and does not match the observed contributions, which last into the long resting period.
Frequency analysis of participants 9 and 10 revealed spikes, which became more frequent with testing and correlated with the observed yawning. The idea of yawning as a brain oxygenation recovery has been disputed [
53,
54,
55]. However, it is possible that yawning increases heart rate, which could expel a higher volume of CO
2 and increase oxygenation [
56]. The effects of yawning on cognitive activity or fatigue are not incorporated in our study.
Frequency analysis of Group 2 separates the participants into two sets based on the VLF hemodynamic response: participants 6, 7, and 8 and participants 9 and 10. In addition, Group 2 participants were classified using the time-domain analysis of 3-digit and 2-digit arithmetic tasks, similarly to Group 1 study, see
Figure 6c-d. Participants 6 and 7 exhibited an increase in oxygenated hemoglobin during arithmetic tasks and a bigger response to 3-digit tasks, as compared to 2-digit. Participant 9 exhibited a decrease in oxygenated hemoglobin with a more pronounced change for the more difficult task. The response of participants 8 and 10 did not match to a behavior observed in Group 1. The agreement between time-domain and frequency-domain classification of participants engaged in the study demonstrates the potential of the developed system to measure cognitive activity. As our validation of cognitive effort and fatigue by participants is limited by oral responses during testing, it is possible that our device measures brain activity related to speech. Nevertheless, this work demonstrates the capabilities of the developed miniaturized device to capture hemodynamic changes correlated with cognitive activities.
The aim of our work is to advance portable sensors toward wearable and comfortable systems to enable medical monitoring during the activities of daily life. The developed device builds on the previous advances of portable fNIRS made by reducing the complexity of the devices. Earlier developments on fNIRS have used flexible circuitry for wearable probe boards with optical components connected to main control board, which requires additional cables and hardware for data processing, affecting mobility and the comfort level [
43,
57,
58,
59]. More recent compact designs utilize microcontrollers, FPGAs, and SoC components, yet still have multiple parts connected via flexible cables [
60,
61], reducing comfort and practicality. Flexible and portable design has been demonstrated, but lacked cognitive activity recognition and suffered from short battery life [
62]. Our device enables more than 50 hours of hemodynamic recordings for unrestricted cognitive activity monitoring.
Table 1 summarizes the development of fNIRS devices toward portable sensing.
Table 1.
Comparison of portable fNIRS device studies and their demonstrated uses.
Table 1.
Comparison of portable fNIRS device studies and their demonstrated uses.
| System Architecture |
Intended Usage |
Demonstrated |
Wearability |
Ref. |
Probe Board / Control box / PC computer
2 Channels |
Bedside hemodynamic motoring in neonatal patients. |
Brain oxygenation and blood volume measurements on neonatal patients. |
Not wearable and not wireless. For bedside assessment in clinics. |
[27] |
Probe Board / Conv. board / FPGA processing
48 Channels configurable |
Hemodynamic monitoring, and brain mapping |
No use cases. Conceptual discussion. |
Not wearable, connected to external FPGA development board. |
[58] |
Flexible probe board / ARM microprocessor main board
48 Channels |
Hemodynamic monitoring, brain mapping. |
Breath holding |
Not wearable.
Probe board potentially uncomfortable, multiple parts connected by cable. |
[63] |
Headband sensor pad / PC computer processing unit
16 Channels |
Hemodynamic monitoring, brain mapping, cognitive action recognition |
Mental workload assessment measures, n-back test and UAV flight simulators
(24 participants) |
Not wearable. Mobility affected, multiple parts, including a PC connected with cables. |
[59] |
Headband sensor pad / Intel SoC control unit
16 Channels |
Hemodynamic monitoring, brain mapping |
Breath holding |
Not wearable, multiple parts, design not compact, very large probe board, multiple cables to connect the modules. |
[43] |
Flexible Probe board / FPGA controlled system / Wireless data transmission
18 Channels |
Hemodynamic monitoring, brain mapping |
Brain mapping under workload stimuli.
(12 participants) |
Not wearable, comfort issues. Probe circuit, battery, and control unit on a wide headband. |
[60] |
Flex Probe / AFE module / Processor + BLE module
6 Channels |
Hemodynamic monitoring, brain mapping |
Hyperventilation, breath holding, and motor tasks.
(1 participant) |
Not wearable, comfort issues.
Multiple parts attached to a headband. |
[61] |
Flexible circuit / onboard probing / BLE /
Nordic SoC nRF52832
4 Channels |
Hemodynamic monitoring, brain oxygenation tracking on neonatal patients |
Oxygenation measurements (SpO2) on subjects in a 2 mo to 15 y old range. |
Wearability, flexible, and compact.
Short battery life of 1 hr. |
[62] |
HEGduino / probing and processing boards / MAX86141 processor / BLE
1 Channel |
Hemodynamic monitoring |
Hemoglobin changes obtained under multiple tasks performance. |
Not wearable, comfort issues, multiple parts arranged in a huge headband. |
[64] |
MAX86141 processor / probing and processing boards / BLE
2 Channels |
Hemodynamic monitoring |
Real-world recording of non-social and social prospective memory tasks. |
Not wearable. Multiple cables around the body connecting different modules affect comfort. |
[65] |
Silicon Labs SoC integrated to the probes and data-conversion components
3 Channels |
Hemodynamic monitoring |
Occlusion, breath holding, and mental workload recognition. (10 participants) |
Wearable, single part device, fixed with medical tape, comfortable, mobility compatible, capable of multi-day readings. |
This
work |
5. Conclusion and Future Work
In this work, we presented the design and development of an efficient, compact, wireless, wearable, and portable NIRS device for cognitive brain activity monitoring. The functionality of the system was demonstrated in arterial occlusion, breath-holding, and with arithmetic cognitive task experiments. Classification of cognitive activities performed during the experiment was demonstrated in time- and frequency-domains for real-time and offline analysis. The design process of this fNIRS system targets monitoring of brain activity in unrestricted and unsupervised daily life environments. Future work aims to translate our device architecture to a conformable circuit board system to further improve the user comfort and increase optode separation for deeper probing of the cerebral cortex.
Supplementary Materials
The following supporting information can be downloaded at the website of this paper posted on Preprints.org, 1.Control UUID; ; 2. LED Safety Assessment; 3. Statistical Analysis Of Readings; 4. Optical Constants; 5. Validation Tests Setup; 6. Current Consumption and Battery Life; 7. Arithmetic Study Design; 8. Group 1 and 2 Results; Figure S1: Structure of the control UUID; Figure S2: Self-calibration routine for the fNIRS device. The device enters calibration mode when the command 0x1000 is sent over BLE. The self-calibration example was acquired with the sensor applied to a participant’s wrist, photoplethysmography oscillations are visible in the signal after calibration; Figure S3: Assembly diagram of the LED on the PCB surface with the shroud around it, the opening area for the light is a 2mm x 1mm rectangular aperture. h is the height of the light emission point, which is 0.25mm for the 650nm LED, and 0.28 mm for the 850nm one; Figure S4: Distribution of the reading results for 5 sampling per measurement; Figure S5: Battery current consumption over time on standby; Figure S6: Battery current consumption over time when the sensor is connected and running measurements; FigureS7: Block protocol design for Group 1 and 2; Figure S8: Overall hemoglobin changes for all the 5 participants in Group 1. Participants 1, 3, and 5 results show an overall oxygenation decrease. These three participants happened to be the ones with higher number of yawns during the test performance; Figure S9: Yawns observed during the 3-digit computation tests, which caused short-time duration peaks caused by motion artifacts. Peaks appear in both oxy or deoxygenated hemoglobin changes; Figure S10: Yawns observed during the 2-digit computation tests; Figure S11: Group 2A results for oxy and deoxyhemoglobin concentration changes during 3-digits and 2-digits mental math tasks. Participants 6 and 7 got the most consistent results of oxygenation increase; Figure S12: Group 2B results for oxy and deoxyhemoglobin concentration changes during 3-digits and 2-digits mental math tasks. No oxygenation increase is observed during the mental tasks performance. Slower responses on oxygenation providing may indicate mental fatigue; Table S1: Optical constants applied to the hemoglobin concentration changes; Table S2: Validation tests settings (Occlusion and breath holding); References [
33,
66,
67,
68,
69,
70,
71] are cited in the Supplementary Materials.
Author Contributions
Conceptualization, V.P., M.V., J.D., and A.B.,; methodology, V.P., J.D., and M.V.; software, T.S., V.P., M.V., and J.W.; validation, M.V. and V.P.; formal analysis, M.V. and V.P.; investigation, M.V.; resources, V.P. and A.B.; data curation, V.P. and M.V.; writing—original draft preparation, M.V. and V.P..; writing—review and editing, M.V., V.P. and A.B.; visualization, M.V. and V.P.; supervision, V.P.; project administration, V.P. and A.B.; funding acquisition, V.P. and A.B. All authors have read and agreed to the published version of the manuscript.
Funding
This research was funded by the National Science Foundation, grant number IIS 2037728 and NERC for ASSIST grant number EEC 1160483 and by the National Institute of Health (NIH) National Cancer Institute (NCI) under grant 1R01CA297854-01.
Institutional Review Board Statement
The study was conducted in accordance with the Declaration of Helsinki, and approved by the Institutional Review Board of Florida International University (FIU 22-0506).
Informed Consent Statement
Informed consent was obtained from all subjects involved in the study.
Data Availability Statement
The raw data supporting the conclusions of this article will be made available by the authors upon reasonable request.
Acknowledgments
The authors would like to thank Dr. Godavarty at Florida International University for fruitful fNIRS discussions.
Conflicts of Interest
The authors declare no conflict of interest.
References
- Panel on Research, M. Driver, H., Committee on National, S., Board on Human-Systems, I., Division of, B., Social, S., Education, *!!! REPLACE !!!*, Transportation Research, B., National Academies of Sciences, E., In Commercial Motor Vehicle Driver Fatigue, Long-Term Health, Eds.; ; Statistical Approaches to Understanding Driver Fatigue Factors in Motor Carrier, S.; National Academies Press (US): Washington (DC), 2016. [Google Scholar]
- Nelson, A.; Gavelin, H.M.; Boraxbekk, C.-J.; Eskilsson, T.; Josefsson, M.; Slunga Järvholm, L.; Neely, A.S. Subjective cognitive complaints in patients with stress-related exhaustion disorder: a cross sectional study. BMC Psychology 2021, 9, 84. [Google Scholar] [CrossRef] [PubMed]
- McMorris, T.; Barwood, M.; Hale, B.J.; Dicks, M.; Corbett, J. Cognitive fatigue effects on physical performance: A systematic review and meta-analysis. Physiology & behavior 2018, 188, 103–107. [Google Scholar] [CrossRef]
- Kunasegaran, K.; Ismail, A.M.H.; Ramasamy, S.; Gnanou, J.V.; Caszo, B.A.; Chen, P.L. Understanding mental fatigue and its detection: a comparative analysis of assessments and tools. PeerJ 2023, 11, e15744. [Google Scholar] [CrossRef]
- Overview of motor vehicle traffic crashes in 2022 (Traffic Safety Facts Research Note. Report No. DOT HS 813 560); National Highway Traffic Safety Administration. : 2024.
- Léger, D.; Pepin, E.; Caetano, G. The Economic Burden of Sleepy Driving. Sleep Medicine Clinics 2019, 14, 423–429. [Google Scholar] [CrossRef] [PubMed]
- Cunningham, T.R.; Guerin, R.J.; Ferguson, J.; Cavallari, J. Work-related fatigue: A hazard for workers experiencing disproportionate occupational risks. Am J Ind Med 2022, 65, 913–925. [Google Scholar] [CrossRef]
- Williamson, A.M.; Feyer, A.M. Moderate sleep deprivation produces impairments in cognitive and motor performance equivalent to legally prescribed levels of alcohol intoxication. Occup Environ Med 2000, 57, 649–655. [Google Scholar] [CrossRef]
- Basim, A.; Christelle, L.; Esther, C.; Ngoc Jade, T. Using structural and functional MRI as a neuroimaging technique to investigate chronic fatigue syndrome/myalgic encephalopathy: a systematic review. BMJ Open 2020, 10, e031672. [Google Scholar] [CrossRef]
- Salihu, A.T.; Hill, K.D.; Jaberzadeh, S. Neural mechanisms underlying state mental fatigue: a systematic review and activation likelihood estimation meta-analysis. Rev. Neurosci. 2022, 33, 889–917. [Google Scholar] [CrossRef]
- Biggs, J.; Myers, J.; Kufel, J.; Ozer, E.; Craske, S.; Sou, A.; Ramsdale, C.; Williamson, K.; Price, R.; White, S. A natively flexible 32-bit Arm microprocessor. Nature 2021, 595, 532–536. [Google Scholar] [CrossRef] [PubMed]
- Liu, R.; Reimer, B.; Song, S.; Mehler, B.; Solovey, E. Unsupervised fNIRS feature extraction with CAE and ESN autoencoder for driver cognitive load classification. J. Neural Eng. 2021, 18, 036002. [Google Scholar] [CrossRef]
- Verdière, K.J.; Roy, R.N.; Dehais, F. Detecting Pilot’s Engagement Using fNIRS Connectivity Features in an Automated vs. Manual Landing Scenario. 2018, 12. [Google Scholar] [CrossRef]
- Mark, J.A.; Kraft, A.E.; Ziegler, M.D.; Ayaz, H. Neuroadaptive Training via fNIRS in Flight Simulators. 2022, 3. [CrossRef]
- Ehlis, A.C.; Barth, B.; Hudak, J.; Storchak, H.; Weber, L.; Kimmig, A.C.S.; Kreifelts, B.; Dresler, T.; Fallgatter, A.J. Near-Infrared Spectroscopy as a New Tool for Neurofeedback Training: Applications in Psychiatry and Methodological Considerations. Japanese Psychological Research 2018, 60, 225–241. [Google Scholar] [CrossRef]
- Khan, B.; Wildey, C.; Francis, R.; Tian, F.; Delgado, M.R.; Liu, H.; Macfarlane, D.; Alexandrakis, G. Improving optical contact for functional near-infrared brain spectroscopy and imaging with brush optodes. Biomed Opt Express 2012, 3, 878–898. [Google Scholar] [CrossRef]
- Kwasa, J.; Peterson, H.M.; Karrobi, K.; Jones, L.; Parker, T.; Nickerson, N.; Wood, S. Demographic reporting and phenotypic exclusion in fNIRS. Front Neurosci 2023, 17, 1086208. [Google Scholar] [CrossRef] [PubMed]
- Rypma, B.; D’Esposito, M. The roles of prefrontal brain regions in components of working memory: effects of memory load and individual differences. Proceedings of the National Academy of Sciences 1999, 96, 6558–6563. [Google Scholar] [CrossRef] [PubMed]
- Wylie, G.R.; Yao, B.; Genova, H.M.; Chen, M.H.; DeLuca, J. Using functional connectivity changes associated with cognitive fatigue to delineate a fatigue network. Sci. Rep. 2020, 10, 21927. [Google Scholar] [CrossRef] [PubMed]
- Skau, S.; Helenius, O.; Sundberg, K.; Bunketorp-Käll, L.; Kuhn, H.G. Proactive cognitive control, mathematical cognition and functional activity in the frontal and parietal cortex in primary school children: An fNIRS study. Trends Neurosci Educ 2022, 28, 100180. [Google Scholar] [CrossRef]
- Frith, C.; Dolan, R. The role of the prefrontal cortex in higher cognitive functions. Cognitive Brain Research 1996, 5, 175–181. [Google Scholar] [CrossRef]
- Roland, P.E.; Zilles, K. Structural divisions and functional fields in the human cerebral cortex1Published on the World Wide Web on 20 February 1998.1. Brain Research Reviews 1998, 26, 87–105. [Google Scholar] [CrossRef] [PubMed]
- Raut, R.V.; Snyder, A.Z.; Raichle, M.E. Hierarchical dynamics as a macroscopic organizing principle of the human brain. Proceedings of the National Academy of Sciences 2020, 117, 20890–20897. [Google Scholar] [CrossRef]
- Lassen, N.A.; Ingvar, D.H.; Skinhøj, E. Brain Function and Blood Flow. Scientific American 1978, 239, 62–71. [Google Scholar] [CrossRef]
- Pozdin, V.A.; Yokus, M.A.; Sotory, P.; Wisniewski, N.; Bozkurt, A.; Daniele, M.A. Low-cost flexible inorganic optical devices for flexible sensors. In Proceedings of the 2017 Ieee Sensors; 2017; pp. 1–3. [Google Scholar]
- Lee, D.S.; Kim, S.J.; Kwon, E.B.; Park, C.W.; Jun, S.; Choi, B.; Kim, S.W.J.B.o.M.S. Comparison of in vivo biocompatibilities between parylene-C and polydimethylsiloxane for implantable microelectronic devices. 2013, 36, 1127-1132.
- Bozkurt, A.; Rosen, A.; Rosen, H.; Onaral, B. A portable near infrared spectroscopy system for bedside monitoring of newborn brain. BioMedical Engineering OnLine 2005, 4, 29. [Google Scholar] [CrossRef]
- Bozkurt, A.; Onaral, B. Safety assessment of near infrared light emitting diodes for diffuse optical measurements. Biomedical engineering online 2004, 3, 1–10. [Google Scholar] [CrossRef]
- Chen, C.; Wen, Y.; Cui, S.; Qi, X.; Liu, Z.; Zhou, L.; Chen, M.; Zhao, J.; Wang, G. A multichannel fNIRS system for prefrontal mental task classification with dual-level excitation and deep forest algorithm. Journal of Sensors 2020, 2020, 1–10. [Google Scholar] [CrossRef]
- Kaile, K.; Fernandez, C.; Godavarty, A. Development of a smartphone-based optical device to measure hemoglobin concentration changes for remote monitoring of wounds. Biosensors 2021, 11, 165. [Google Scholar] [CrossRef]
- Songkakul, T.P. Wearable & wireless electrochemical systems for continuous correlated biochemical monitoring. Ph.D., North Carolina State University, United States -- North Carolina, 2022.
- van der Zee, P.; Essenpreis, M.; Delpy, D.T. Optical properties of brain tissue. SPIE Proceedings 1993, 1888, 454–465. [Google Scholar] [CrossRef]
- Cope, M. The development of a near infrared spectroscopy system and its application for non invasive monitoring of cerebral blood and tissue oxygenation in the newborn infants; University of London, University College London (United Kingdom): 1991.
- Huppert, T.J.; Diamond, S.G.; Franceschini, M.A.; Boas, D.A. HomER: a review of time-series analysis methods for near-infrared spectroscopy of the brain. Applied Optics 2009, 48, D280. [Google Scholar] [CrossRef] [PubMed]
- Dennis, J.J.; Wiggins, C.C.; Smith, J.R.; Isautier, J.M.J.; Johnson, B.D.; Joyner, M.J.; Cross, T.J. Measurement of muscle blood flow and O2 uptake via near-infrared spectroscopy using a novel occlusion protocol. Scientific Reports 2021, 11. [Google Scholar] [CrossRef] [PubMed]
- Didier, K.D.; Hammer, S.M.; Alexander, A.M.; Caldwell, J.T.; Sutterfield, S.L.; Smith, J.R.; Ade, C.J.; Barstow, T.J. Microvascular blood flow during vascular occlusion tests assessed by diffuse correlation spectroscopy. Experimental Physiology 2020, 105, 201–210. [Google Scholar] [CrossRef]
- Molinari, F.; Liboni, W.; Grippi, G.; Negri, E. Relationship between oxygen supply and cerebral blood flow assessed by transcranial Doppler and near—infrared spectroscopy in healthy subjects during breath—holding. Journal of NeuroEngineering and Rehabilitation 2006, 3, 16. [Google Scholar] [CrossRef]
- Quiroga, A.; Novi, S.; Martins, G.; Bortoletto, L.F.; Avelar, W.; Guillaumon, A.T.; Li, L.M.; Cendes, F.; Mesquita, R.C. Quantification of the Tissue Oxygenation Delay Induced by Breath-Holding in Patients with Carotid Atherosclerosis. Metabolites 2022, 12, 1156. [Google Scholar] [CrossRef]
- Bouten, J.; Bourgois, J.G.; Boone, J. Hold your breath: peripheral and cerebral oxygenation during dry static apnea. European journal of applied physiology 2020, 120, 2213–2222. [Google Scholar] [CrossRef]
- Molina-Rodríguez, S.; Mirete-Fructuoso, M.; Martínez, L.M.; Ibañez-Ballesteros, J. Frequency-domain analysis of fNIRS fluctuations induced by rhythmic mental arithmetic. Psychophysiology 2022, 59, e14063. [Google Scholar] [CrossRef] [PubMed]
- Stratonnikov, A.A.; Loschenov, V.B. Evaluation of blood oxygen saturation in vivo from diffuse reflectance spectra. Journal of biomedical optics 2001, 6, 457–467. [Google Scholar] [CrossRef]
- Li, Z.; Baker, W.B.; Parthasarathy, A.B.; Ko, T.S.; Wang, D.; Schenkel, S.; Durduran, T.; Li, G.; Yodh, A.G. Calibration of diffuse correlation spectroscopy blood flow index with venous-occlusion diffuse optical spectroscopy in skeletal muscle. Journal of Biomedical Optics 2015, 20, 125005. [Google Scholar] [CrossRef] [PubMed]
- Saikia, M.J.; Besio, W.G.; Mankodiya, K. WearLight: toward a wearable, configurable functional nir spectroscopy system for noninvasive neuroimaging. IEEE Transactions on Biomedical Circuits and Systems 2018, 13, 91–102. [Google Scholar] [CrossRef] [PubMed]
- Jones, S.; Chiesa, S.T.; Chaturvedi, N.; Hughes, A.D. Recent developments in near-infrared spectroscopy (NIRS) for the assessment of local skeletal muscle microvascular function and capacity to utilise oxygen. Artery research 2016, 16, 25–33. [Google Scholar] [CrossRef]
- Molinari, F.; Liboni, W.; Grippi, G.; Negri, E. Relationship between oxygen supply and cerebral blood flow assessed by transcranial Doppler and near–infrared spectroscopy in healthy subjects during breath–holding. Journal of neuroengineering and rehabilitation 2006, 3, 1–13. [Google Scholar] [CrossRef] [PubMed]
- Cross, T.J.; Kavanagh, J.J.; Breskovic, T.; Johnson, B.D.; Dujic, Z. Dynamic cerebral autoregulation is acutely impaired during maximal apnoea in trained divers. PloS one 2014, 9, e87598. [Google Scholar] [CrossRef] [PubMed]
- Khan, S.S.; Kumar, S.; Jan, B.; Somappa, L.; Malik, S. An Embedded Auto-Calibrated Offset Current Compensation Technique for PPG/fNIRS System. arXiv preprint arXiv:2307.07414, arXiv:2307.07414 2023.
- Iatsenko, D.; McClintock, P.V.E.; Stefanovska, A. Linear and synchrosqueezed time–frequency representations revisited: Overview, standards of use, resolution, reconstruction, concentration, and algorithms. Digital Signal Processing 2015, 42, 1–26. [Google Scholar] [CrossRef]
- Reddy, P.; Izzetoglu, M.; Shewokis, P.A.; Sangobowale, M.; Diaz-Arrastia, R.; Izzetoglu, K. Evaluation of fNIRS signal components elicited by cognitive and hypercapnic stimuli. Scientific Reports 2021, 11. [Google Scholar] [CrossRef]
- Aletti, F.; Re, R.; Pace, V.; Contini, D.; Molteni, E.; Cerutti, S.; Maria Bianchi, A.; Torricelli, A.; Spinelli, L.; Cubeddu, R.; et al. Deep and surface hemodynamic signal from functional time resolved transcranial near infrared spectroscopy compared to skin flowmotion. Computers in Biology and Medicine 2012, 42, 282–289. [Google Scholar] [CrossRef] [PubMed]
- Pinti, P.; Scholkmann, F.; Hamilton, A.; Burgess, P.; Tachtsidis, I. Current status and issues regarding pre-processing of fNIRS neuroimaging data: an investigation of diverse signal filtering methods within a general linear model framework. Frontiers in human neuroscience 2019, 12, 505. [Google Scholar] [CrossRef]
- Reddy, P.; Izzetoglu, K.; Shewokis, P.A. Wavelet-Based Analysis of fNIRS Measures Enable Assessment of Workload. Springer International Publishing: 2022; pp. 173-182.
- Guggisberg, A.G.; Mathis, J.; Schnider, A.; Hess, C.W. Why do we yawn? Neuroscience & Biobehavioral Reviews 2010, 34, 1267–1276. [Google Scholar] [CrossRef]
- Gupta, S.; Mittal, S. Yawning and its physiological significance. International journal of applied and basic medical research 2013, 3, 11–15. [Google Scholar] [CrossRef]
- Provine, R.R.; Tate, B.C.; Geldmacher, L.L. Yawning: No effect of 3–5% CO2, 100% O2, and exercise. Behavioral and Neural Biology 1987, 48, 382–393. [Google Scholar] [CrossRef]
- Corey, T.P.; Shoup-Knox, M.L.; Gordis, E.B.; Gallup, G.G. Changes in Physiology before, during, and after Yawning. Frontiers in Evolutionary Neuroscience 2012, 3. [Google Scholar] [CrossRef]
- Agro, D.; Adamo, G.; Pinto, M.; Canicattı, R.; Tomasino, A.; Parisi, A.; Stivala, S.; Curcio, L.; Giordano, A.; Giaconia, C. Design of a portable (CW) fNIRS embedded system. Contributed Talk 64 Development of a family of cost-optimized prefactored high-order compact schemes for low-speed aeroacoustics, Ivan Spisso, Aldo Rona and Sergio Pirozzoli.................... 65. [CrossRef]
- Giaconia, G.C.; Greco, G.; Mistretta, L.; Rizzo, R. Exploring FPGA-based lock-in techniques for brain monitoring applications. Electronics 2017, 6, 18. [Google Scholar] [CrossRef]
- Ayaz, H.; Shewokis, P.A.; Bunce, S.; Izzetoglu, K.; Willems, B.; Onaral, B. Optical brain monitoring for operator training and mental workload assessment. NeuroImage 2012, 59, 36–47. [Google Scholar] [CrossRef] [PubMed]
- Chen, C.; Ma, Z.; Liu, Z.; Zhou, L.; Wang, G.; Li, Y.; Zhao, J. An Energy-Efficient Wearable Functional Near-infrared Spectroscopy System Employing Dual-level Adaptive Sampling Technique. IEEE Transactions on Biomedical Circuits and Systems 2022, 16, 119–128. [Google Scholar] [CrossRef] [PubMed]
- Wu, K.-C.; Tamborini, D.; Renna, M.; Peruch, A.; Huang, Y.; Martin, A.; Kaya, K.; Starkweather, Z.; Zavriyev, A.I.; Carp, S.A. Open-source FlexNIRS: a low-cost, wireless and wearable cerebral health tracker. NeuroImage 2022, 256, 119216. [Google Scholar] [CrossRef] [PubMed]
- Rwei, A.Y.; Lu, W.; Wu, C.; Human, K.; Suen, E.; Franklin, D.; Fabiani, M.; Gratton, G.; Xie, Z.; Deng, Y. A wireless, skin-interfaced biosensor for cerebral hemodynamic monitoring in pediatric care. Proceedings of the national academy of sciences 2020, 117, 31674–31684. [Google Scholar] [CrossRef]
- Agrò, D.; Canicattì, R.; Pinto, M.; Morsellino, G.; Tomasino, A.; Adamo, G.; Curcio, L.; Parisi, A.; Stivala, S.; Galioto, N. Design and implementation of a portable fNIRS embedded system. Applications in Electronics Pervading Industry, Environment and Society: APPLEPIES 2014 2016, 43-50.
- Xu, S.; Zeng, X.; Yin, F.; Zhang, C. Validating the reproducibility of a low-cost single-channel fNIRS device across hierarchical cognitive tasks. Frontiers in Neuroscience 2024, 18. [Google Scholar] [CrossRef] [PubMed]
- Miao, T.; Lin, Z.; Xie, F.; Xie, L. Development of a Wearable fNIRS Sensor System to Assess Brain Activities on Cognitive Tasks. In Proceedings of the 2023 IEEE 18th Conference on Industrial Electronics and Applications (ICIEA); 2023; pp. 107–110. [Google Scholar]
- Commission, I. Photobiological safety of lamps and lamp systems. IEC Geneva 2006, 62471. [Google Scholar] [CrossRef]
- Rajpoot, H.C. HCR’s Theory of Polygon (proposed by harish chandra rajpoot) solid angle subtended by any polygonal plane at any point in the space. Int. J. Math. Phys. Sci. Res 2014, 2, 28–56. [Google Scholar]
- Augusteyn, R.C.; Nankivil, D.; Mohamed, A.; Maceo, B.; Pierre, F.; Parel, J.-M. Human ocular biometry. Experimental Eye Research 2012, 102, 70–75. [Google Scholar] [CrossRef]
- Protection, I.C.o.N.-I.R. ICNIRP guidelines on limits of exposure to incoherent visible and infrared radiation. Health Physics 2013, 105, 74–96. [Google Scholar] [CrossRef]
- Kourkoumelis, N.; Tzaphlidou, M. Eye Safety Related to Near Infrared Radiation Exposure to Biometric Devices. The Scientific World Journal 2011, 11, 902610. [Google Scholar] [CrossRef]
- Van der Zee, P.; Essenpreis, M.; Delpy, D.T. Optical properties of brain tissue. In Proceedings of the Photon Migration and Imaging in Random Media and Tissues; 1993; pp. 454–465. [Google Scholar]
|
Disclaimer/Publisher’s Note: The statements, opinions and data contained in all publications are solely those of the individual author(s) and contributor(s) and not of MDPI and/or the editor(s). MDPI and/or the editor(s) disclaim responsibility for any injury to people or property resulting from any ideas, methods, instructions or products referred to in the content. |
© 2025 by the authors. Licensee MDPI, Basel, Switzerland. This article is an open access article distributed under the terms and conditions of the Creative Commons Attribution (CC BY) license (http://creativecommons.org/licenses/by/4.0/).