
Submitted:
16 January 2025
Posted:
17 January 2025
You are already at the latest version
Abstract
The study evaluates the implementation of check dams as nature-based solutions to address soil erosion, improve sediment quality, and enhance water retention in the Urku Huayku ravine, located on the Ilaló volcano in Ecuador. Weekly water and sediment samples were analysed from 2021 to 2023 to measure critical parameters such as pH, electrical conductivity, nutrient concentrations, and organic matter content. Macroinvertebrates were also collected to assess biodiversity changes, using indices like the Andean Biotic Index (ABI) and the Shannon Diversity Index. Results show significant improvements: water quality remained neutral (average pH 7.06), while sediment organic matter increased substantially from 0.2% in 2021 to 3.2% in 2023. Additionally, biodiversity improved, with a 355.6% increase in macroinvertebrate abundance. Statistical tests confirmed the positive impact of check dams on sediment and water quality. The study also identified potential areas for additional check dam installations using QGIS analysis, emphasising steep slopes as ideal locations. This work demonstrates the effectiveness of check dams in restoring degraded ecosystems and highlights their role in climate change mitigation through enhanced sediment carbon storage and improved biodiversity. Further research is recommended to optimise dam placement and explore additional biodiversity indicators.
Keywords:
nature-based solutions
; check dams
; soil erosion
; water and sediment quality
; macroinvertebrates biodiversity
; restoring degraded ecosystems
1. Introduction
The Ilaló volcano is undergoing aggressive anthropogenic intervention processes. Human activities such as expanding the urban frontier, aggressive tourism, inadequate agricultural practices, deforestation, and climate change effects are degrading this ecosystem and accelerating soil erosion. Water zones are deteriorated, and water storage capacity is low. Soil erosion is considered one of the most severe environmental crises worldwide today [1] due to increased human activities [2].
Soil erosion is a complex process caused by several factors, such as rainfall, soil type, topography, vegetation, and land use practices [3]. The predominant soil type on the Ilaló volcano is "cangahua." Cangahuas are rocks of pyroclastic materials typically covered by recent volcanic ash [4]. This soil is highly prone to rainfall-induced erosion. Rain-induced erosion is one of Ecuador's leading causes of soil degradation and has significant implications for the conservation and management of water and soil resources [3].
The main effect of soil erosion is the reduction of agricultural productivity. Eroded soil has a low water infiltration rate, which affects its water retention capacity. The water deficit also reduces the amount of nutrients, organic matter, and soil biota. The unproductivity of soils threatens food security and causes significant economic losses to families, who are generally vulnerable [5]. Additionally, the water deficit affects river and riparian ecosystems, thus reducing ecosystem services. The effects directly impact water resources, leading to increasingly arid landscapes.
The water resource recovery and restoration strategies to combat soil erosion can vary. In recent years, nature-based solutions (NbS), such as green infrastructure, have been applied to simulate natural processes [6]. NbS is an exciting approach because it aims to implement measures that are not harmful to the functioning of nature. NbS emulate the functioning of nature and accelerates the natural restoration process. Examples of NbS include bio-intensive afforestation, water harvesting, terrace construction, retention channels and check dams. These measures aim to prevent and control erosion, promote soil conservation and protect natural resources [7].
Check dams are small structures built across channels to control water flow and sediment transport. They serve multiple purposes: flood mitigation, sediment retention, and water resource enhancement. Check dams are versatile tools for managing water resources, controlling floods, and reducing sediment transport. Their design and effectiveness depend on local environmental conditions and ongoing maintenance efforts to adapt to changing landscapes.
Since 2021, several check dams have been installed in the Urku Huayku ravine on the Ilaló volcano as an alternative for hydrological recovery. Dams are effective structures for soil and water conservation because they reduce the erosive power of water, store and retain sediments (a source of nutrients), and become biodiversity hotspots [8]. Check dams are green infrastructures that effectively reduce soil and water loss, and they are promoted and constructed in various locations [9]. Green infrastructure is a measure promoted by Ecuadorian public policy as an adaptation to climate change [10].
Figure 1 shows the three check dams installed in the Urku Huayku ravine:
This work aimed to generate a time series of water and sediment quality and quantity data, measured at the three check dams built in the Urku Huayku ravine from 2021 to 2023, to evaluate the functionality of these green infrastructures. Evaluation criteria will be the ability to increase the amount of water and improve ecosystems' favourable conditions. Water and sediment samples were collected, and several parameters were measured. Samples of macroinvertebrates were collected to evaluate the fluvial biodiversity. A temporal statistical comparison was then performed using the free software RStudio. The variation of each parameter over time allowed us to assess the effectiveness of the check dams. Additionally, the free software QGIS was used to identify other feasible points in the ravine where more dams could be placed to prevent soil erosion in those areas of the Ilaló volcano.
2. Materials and Methods
The research paradigm of this project is quantitative since statistics were used to analyse the data. This quantitative data involved measuring physical, chemical, and biological parameters at the site, and the data was analysed using concepts and measurable variables.
The study area is in the Urku Huayku ravine, situated south of the Ilaló volcano in the Valley of Los Chillos, and belongs to the San Francisco de Baños community. The check dams were placed between the coordinates 787,789.744 – 9,967,995.403 and 787,292.841 – 9,970,760.506 (UTM WGS84 17S), as indicated in Figure 2. Urku Huayku Microbasin. This ravine has a central channel length of 4.085 km and an area of 2.497 km², with a maximum elevation of 3,186.867 meters above sea level and a minimum elevation of 2,522.478 meters above sea level. The three check dams are installed in the upper part of the ravine.
In Figure 2, the delimitation of the Urku Huayku micro basin is shown:
Water and sediment samples were taken weekly from the Urku Huayku ravine. Water samples were collected in plastic containers of 500-700 mL. In contrast, sediment samples were taken at various depths (surface, medium, and deep), with approximately 0.5 kg of sediment collected at each check dam. Physical measurements such as flow and depth were taken in each zone where the dams are installed. Water and soil sampling followed the recommendations of [11] and [12].
2.1. Installation of the Check Dams
The materials for check dams include stone-on-stone (dry masonry), stone with cement (hydraulic masonry), wooden dams, and dams with sandbags [13]. Applying the same concept as traditional dams, the check dams in this study use biodegradable and nature-assimilable materials. These materials include bamboo (Guadua angustifolia), soil, and small stones (rocky materials) as a timber resource. The design and implementation of check dams follow a prior hydrological analysis, where pre-feasibility and feasibility studies were conducted [14]. The installation of check dams is both economically and environmentally viable.
2.2. Methodology for Water Analysis
Water samples from each check dam were analysed weekly between May and June 2023 at the environmental laboratory (Universidad de las Fuerzas Armadas ESPE). The parameters analysed in each sample to determine water quality were sulfates, phosphates, nitrates, suspended solids (SS), total dissolved solids (TDS), pH, and electrical conductivity (EC). The flow was measured at the site. The results were compared with the water quality criteria of Ministerial Agreement No. 097A [15] (environmental norm of Ecuador).
Table 1 details the methods used to obtain each parameter.
2.3. Methodology for Sediment Analysis
Sediment samples were analysed in the soil mechanics laboratory (Universidad de las Fuerzas Armadas ESPE). For the analysis, sediment samples were taken from three depths (surface, medium, and deep) at the location of each dam, allowing for a more detailed analysis and a more accurate understanding of the sediment composition at different levels.
Table 2 details the methods used to obtain each parameter.
2.4. Methodology for Bioindicators
The analysis of macroinvertebrates in the Urku Huayku ravine was conducted with researchers from the Regional Amazonian University Ikiam. A Surber net with a 250 μm mesh opening was used. A combined sample of nine subsamples was collected at each check dam, covering a total area of 1 m². The collection procedure involves placing a net against the current in the waterbed. The net remains static, while objects that contribute to diversity (such as logs, stones, and leaf litter) are cleaned, and the top layer of the substrate is stirred up to a depth of 5 cm. In the laboratory, the macroinvertebrates are identified and counted using a stereoscope. Biodiversity is determined using biological indices that provide a numerical value representing the characteristics of all species present in an area based on their resistance or sensitivity to pollution. The index used was the following:
Biological Monitoring Working Party (BMWP): The BMWP index was initially developed for European rivers but applied in multiple countries worldwide, including England, Colombia, Chile, and the Iberian Peninsula [16]. To use this index, macroinvertebrates are classified at the family level, and each organism is assigned a corresponding value based on its tolerance to pollution. Highly susceptible families receive a score of 10, while more resistant families are given a score of 1. Therefore, the more excellent the resistance to pollution, the lower the BMWP score. At the end of the process, the values of all identified families are summed, and their presence is weighted.
Andean Biological Party (ABI): The ABI index is an adaptation of the BMWP-R [17,18], designed explicitly for rivers located at altitudes above 2,000 meters in the high Andean regions of Ecuador and Peru. Its application process remains the same: various scores are assigned to macroinvertebrate families in a given location to calculate a definitive value that reflects the ecosystem's overall health.
Shannon Diversity Index: Diversity analyses the interaction between the number of species present and their abundance within a community. Diversity indices are calculated using the statistical software [19].
2.5. Methodology for Statistical Data Processing
The RStudio software was used to perform statistical processing of the data obtained in the laboratory for water (flow rate) and sediment analysis (percentage of organic matter), creating a time series that provided insights into how the check dams would function in the future. The percentage of organic matter is the variable that allows us to verify the quality of the sediment to maintain aquatic life. If we assume that the variances of the two groups (flow rate before and after the installation of the check dams) are equal, we will apply the Student's t-test (also known as a two-sample t-test with equal variances). This test compares the means of two independent samples when the assumption of equal variances holds. In hydrology, it is expected to assume that the variance of streamflow remains stable (i.e., homogeneous) across different periods, especially in statistical analyses that seek to maintain a stationary framework for hydrological data [20]. Flow measurements were carried out before installing the check dams in 2021 [14], and measurements after installing the dams in 2023 [21].
2.6. Methodology for Determining the Location of New Check Dams
The terrain of the Urku Huayku ravine was simulated using the QGIS software, highlighting strategic points where new dams could be placed to perform the same function as the existing ones and better counteract erosion in this sector. QGIS provided general parameters of the Urku Huayku ravine. The watershed was generated from contour lines taken at the site, and the hypsometric curve was created to characterise the channel, along with the altimetric frequency histogram to show the steep slopes. QGIS software can analyse spatial data using spatial databases and other OGR-compatible formats. Currently, QGIS offers tools for vector analysis, raster analysis, sampling, geoprocessing, geometry, and database management.
3. Results
Before installing the check dams, measurements in the water were made and are presented in the following table [22]:

Table 3.
Measurements in the water before installing the check dams.
| Samples | P003 | P005 | P006 | P007 |
|---|---|---|---|---|
| pH | 6.9 | 7.6 | 7.3 | 7.2 |
| EC (µS/cm) | 0.12 | 0.12 | 0.12 | 0.12 |
| TDS (ppm) | 93 | 89 | 92 | 110 |
3.1. Water Analysis Results
The measurements carried out in the water were compared with the water quality criteria for preserving aquatic and wildlife life established in Ecuadorian regulations [15]. Of the 16 pH results obtained, check dam 1 averaged 7.05, check dam 2 had an average of 7.08, and check dam 3 showed an average pH of 6.86. The range of Ecuadorian water quality criteria for preserving aquatic and wildlife is 6,5-9 of pH (Table 2 of Ministerial Agreement No. 097A). The water in the three check dams was characterised as neutral, with values close to 7 on the pH scale. The results are within the acceptable quality criteria.
The average EC result was 128.17 µS/cm for check dam 1, 126.66 µS/cm for check dam 2, and 123.81 µS/cm for check dam 3. These values fall within a normal range for natural waters. There are no criteria for CE in the Ecuadorian environmental norm. Studies indicate that a conductivity range of 150 to 500 µS/cm for streams and rivers supporting good mixed fisheries is often optimal [23]. Values outside this range can suggest that water quality may not be suitable for certain fish and macroinvertebrate species.
The nitrate concentration is low (averaging 2.5 mg L−1). This parameter is below the quality criterion (15 mg L−1). A maximum concentration of 50 mg/L is a critical threshold for protecting aquatic ecosystems. Concentrations above this level can negatively impact biodiversity and ecosystem health due to increased nutrient loading, which can cause eutrophication [24].
There are no criteria for sulphates in the Ecuadorian environmental norm. The results after laboratory analysis were meager, averaging 3 mg L⁻¹. The British Columbia Ministry of Environment has established guidelines suggesting that sulfate concentrations should ideally be kept below 100 mg/L to protect freshwater aquatic life. However, higher levels may be tolerated depending on water hardness [25].
There are no criteria for phosphate in the Ecuadorian environmental norm. The U.S. Environmental Protection Agency (EPA) recommends that total phosphorus concentrations in freshwater should not exceed 0.1 mg/L for streams that do not discharge into reservoirs [26]. In this research, these values exceeded the recommended level, averaging 3.5 mg L⁻¹. However, no eutrophication processes have been observed in the check dams since the water is not kept in a reservoir.
The laboratory results for SS and TDS are within an acceptable range. Compared to historical TDS values, which averaged 96 mg/L. High-suspended solids can impair aquatic organisms by reducing light penetration, affecting photosynthesis in aquatic plants and phytoplankton. This can decrease oxygen levels as organic matter decomposes, negatively impacting fish and invertebrate populations. Maintaining low levels of suspended solids (generally below 30-35 mg/L) and TDS (ideally below 1,000 mg/L) is crucial for preserving aquatic life and preventing negative ecological impacts [27,28].
In comparison with historical data, an average flow rate of 4.43 L/s was recorded in 2021, and during the sampling period in 2023, the average flow rate measured in situ over the 16 weeks was 5.79 L/s. The results of the Two-sample t-test comparing the mean streamflow before and after the installation of the check dams suggest a statistically significant increase in the mean streamflow. The t-statistic is -1.8431 with 18 degrees of freedom, and the p-value is 0.04092, less than the commonly used significance level of 0.05. This indicates that we can reject the null hypothesis in favour of the alternative hypothesis, which posits that the mean streamflow after the check dam installation is more significant than before. The increase in the flow rate in the micro-basin was substantial, demonstrating the effective functioning of the check dam in increasing the water volume.
3.2. Sediments Analysis Results
If we consider sediments' newly retained soils, Ecuadorian regulations establish that soil pH in good condition should be between 6 and 8. The results obtained from the check dams are in the range of 5.1 to 6.5. Most plants thrive in soil with a pH between 6.0 and 7.5. A pH of 6.5 is often considered ideal as it allows optimal nutrient availability and microbial activity, essential for plant growth [29].
Water passing through the sediment carries away essential nutrients like calcium and magnesium. In return, acidic elements like aluminium and iron are incorporated. The use of fertilisers containing ammonium or urea compounds accelerates soil acidification. Additionally, the decomposition of organic matter also contributes to increased acidity [30]. Another reason for the moderate acidity is the presence of iron sulphate in the micro-basin. The pH of this compound has values below 7, and when mixed with the soil, it acidifies it.
Electrical conductivity is affected by various soil factors, such as moisture, porosity level, texture, and organic matter content [31]. All the results obtained are below 200 µS cm⁻¹, interpreted as sediments with negligible salinity effects.
The organic matter results obtained through the calcination method range from 1% to 5%. In 2021, a soil sample was taken from the Urku Huayku micro-basin, and upon analysis, the average percentage of organic matter was 0.2% [14], indicating the low amount found in volcanic soils. The Two-sample t-test results show a statistically significant increase in the percentage of organic matter in the sediments of the ecological dams after their installation. The t-statistic is -4.7389, with a p-value of 0.0003967, indicating that the difference in means is highly significant. The confidence interval confirms that the increase in organic matter is substantial. Before the installation, the mean organic matter concentration was 0.1925%, increasing to 3.2000% after installation. This significant rise suggests that installing check dams positively impacted organic matter accumulation in the sediments, improving soil quality.
3.3. Biological Analysis Results
In the samples taken before the check dams were installed, a total of 81 individuals were found, belonging to 2 classes (Malacostraca and Insecta), distributed across six families (Hyallelidae, Elmidae, Philosciidae, Tipulidae, Hydropsychidae, and Chyronomidae). The Shannon index was used to identify the biodiversity present in the area based on the macroinvertebrate families. The upper area had a higher presence of macroinvertebrate families, with a Shannon index of 0.8759, compared to the lower area, which had a score of 0.7354, indicating greater diversity. The ABI and BMWP indices found that water quality was critical in the samples from both regions, as they fell within the range of polluted waters. Therefore, it can be said that the ecosystem in the study area was deteriorated and altered.
In the samples taken after the installation of the check dams, 369 individuals were found, belonging to five classes (Insecta, Malacostraca, Gastropoda, Oligochaeta, and Crustacea) and distributed across nine families (Hyallelidae, Elmidae, Philosciidae, Planorbidae, Tubificidae, Tipulidae, Hydropsychidae, Libellulidae, and Chyronomidae).
Check dam 3, located in the lower area, had the highest score for macroinvertebrate families, with a Shannon index of 1.3, surpassing check dam 2 with 1.24 and check dam 1 with 0.48. This means that check dam 3 presented greater diversity. This is due to the stream's flow and climatic factors that altered the flow on the sampling day. The ABI and BMWP indices found that the water quality remained critical in the samples from the three check dams, although biodiversity had increased significantly.
It is observed that after the check dams were installed, the number of identified individuals grew from 81 to 369, representing a 355.6% increase. New families of macroinvertebrates with higher scores are expected to continue to appear. Consequently, the water quality index will improve, proving the ecosystem is recovering.
3.4. Results of New Areas for Check Dam Installation
After modelling the Urku Huayku micro-basin using the free QGIS software, it was segmented into sections, as shown in Figure 3. Sections of the Urku Huayku micro-basin. Each section's elevations and horizontal distances were identified to calculate the slope percentage.
The segments 7, 8, 9, and 13 present the steepest slopes, with values of 28%, 31%, 29%, and 26%, respectively, as shown in Table 4.
4. Discussion
Check dams help reduce a flood’s peak flow and total volume in the basin and increase the flood duration [29]; however, with this work, we analyse another parameter contributing to the soil, water and biodiversity quality. The implementation of check dams proved to be an effective method for recovering soil and water in a degraded watershed, as they control the erosive process and intercept sediments that stabilise eroded slopes. Additionally, this intervention results in a reduction of the slope and regulation of water flow.
Check dams have been shown to effectively trap sediment, especially in areas with low vegetation coverage. In one study, the construction of check dams reduced sediment load by 12%, while vegetation restoration reduced 20.7% in runoff and 53.2% in sediment load [32]. The accumulated sediments behind the dam serve as carbon storage, contributing to climate change mitigation. Furthermore, they create areas with higher nutrient richness, improving water quality, and generate flat surfaces due to sediment compaction, which are more resistant to erosion since the particles are more cohesive and less prone to being carried away by wind or water.
Check dams are versatile tools for managing water resources, controlling floods, and reducing sediment transport. Their design and effectiveness depend on local environmental conditions and ongoing maintenance efforts to adapt to changing landscapes. They help manage torrents in mountainous regions, reducing erosion. By capturing runoff, they contribute to groundwater recharge and improve water availability for agricultural use. In areas prone to soil erosion, check dams play a crucial role in stabilising slopes and maintaining soil health [33].
In this work, we chose macroinvertebrates like bioindicators. Check dams can significantly affect macroinvertebrate communities in river ecosystems, influencing their diversity, abundance, and overall ecological dynamics. Check dams significantly reduce sediment loads in rivers, which can alter habitats for aquatic organisms. Trapping sediments creates new habitats for various species but may also lead to the loss of natural sediment transport processes that many aquatic species rely on for spawning and feeding [34,35]. Check dams increase water retention in surrounding areas, enhancing moisture levels. This can promote the growth of vegetation, which supports terrestrial biodiversity by providing habitat and food sources for various organisms [36,37]. While check dams can create localised wetlands that support diverse plant and animal life, they may also disrupt the migration patterns of fish and other aquatic organisms. The alteration of flow regimes can affect breeding cycles and habitat availability for these species [35,38].
While check dams provide immediate benefits regarding sediment control and water retention, their long-term impacts on biodiversity require careful monitoring. Over time, sediment accumulation behind dams may alter local ecosystems in ways detrimental to certain species [34]. The next step is to select another bioindicator of biodiversity, like spiders, that can provide information on the food chain and biodiversity. Spiders are dominant predators in terrestrial food webs and excellent bioindicators of habitat quality. Previous studies have estimated that, globally, spiders consume between 400 and 800 million metric tons of insects per year [39], more significantly than insectivorous birds [40]. Preliminary samples have already been taken at the check dams.
While check dams can enhance certain aspects of fluvial biodiversity through habitat creation and improved ecosystem services, they may also pose challenges by disrupting natural processes essential for sustaining diverse aquatic communities. Ongoing research is necessary to understand these dynamics fully and inform sustainable management practices.
5. Conclusions
Due to soil erosion and human activities, the Ilaló volcano exhibits apparent deterioration of its slopes and water zones. This phenomenon promotes the exposure of cangahua, a type of volcanic soil characterised by low fertility.
The analysed water samples had an average pH of 7.06, indicating that the water flowing through the micro-basin is neutral. The average electrical conductivity was 126.23 μS cm⁻¹, meaning it is water with low salinity. The average flow rate obtained from the 16-week analysis from April to July 2023 was 5.79 L/s, higher than the value recorded in 2021 at the time of dam installation. Phosphates were the only parameter above the limits allowed by Ecuadorian regulations.
From the installation of the dams in 2021 until 2023, it has been estimated that check dam 1 has accumulated approximately 6.19 m³ of sediment, check dam 2 around 5.8 m³, and check dam 3 about 4.88 m³.
The analysed sediment samples had an average pH of 5.9, indicating that these sediments are moderately acidic. The average electrical conductivity value is 91 μS cm⁻¹, which has negligible salinity effects. The apparent density determined that the sediment is loamy mainly, as it is primarily composed of sand, silt, and a smaller amount of clay. The average real density was 2.26 g/cm³, close to most soils' typical density. The deeper samples present higher density values due to sediment compaction. Regarding the organic matter, the average was 3.2%, which, although low, reflects the positive impact of the dams, as, before their installation in 2021, the organic matter percentage was 0.2%.
The biological quality analysis indicated that 81 individuals were identified in 2021; in 2023, this number increased to 369, representing a 355.6% increase.
It has been verified that both the quantity and quality of water and sediments, as well as biological quality, have improved after the implementation of the dams. Although the quality cannot yet be classified as optimal, it is observed that over time, the properties influencing quality are experiencing significant increases.
The optimal area for installing new dams is between elevations 2959 to 2807 and 2737 to 2729, as these areas have steeper slopes and a higher concentration of tributary streams.
Guadua cane containment dams have been demonstrated to be effective, economical, and ecological structures that control soil erosion and preserve water resources.
References
- Tian, P.; Zhu, Z.; Yue, Q.; He, Y.; Zhang, Z.; Hao, F.; et al. Soil erosion assessment by RUSLE with improved P factor and its validation : Case study on mountainous and hilly areas of Hubei. Int Soil Water Conserv Res. 2021, 9. [Google Scholar] [CrossRef]
- Chuenchum, P.; Xu, M.; Tang, W. Estimation of soil erosion and sediment yield in the lancang-mekong river using the modified revised universal soil loss equation and GIS techniques. Water 2020, 12, 135. [Google Scholar] [CrossRef]
- Delgado, D.; Sadaoui, M.; Ludwig, W.; Méndez, W. Spatio-temporal assessment of rainfall erosivity in Ecuador based on RUSLE using satellite-based high frequency GPM-IMERG precipitation data. Catena 2022, 219, 106597. [Google Scholar] [CrossRef]
- Hidrobo, J.; Da Costa, M.; Prat, C.; Trujillo, G.; Moreno, J.; Ortega, C.A. Sistemas de producción en áreas con cangahua habilitada en la Sierra Norte de Ecuador Production systems in areas with reclaimed cangahua soils in the Northern Highlands of Ecuador. Siembra 2015, 2, 116–127. [Google Scholar] [CrossRef]
- Matthews, F.; Panagos, P.; Verstraeten, G. Simulating event-scale rainfall erosivity across European climatic regions. Catena 2022, 213, 106157. [Google Scholar] [CrossRef]
- World Bank. A Catalogue of Nature-Based Solutions for Urban Resilience. A Catalogue of Nature-Based Solutions for Urban Resilience; World Bank Group: Washington, DC, 2021. [Google Scholar] [CrossRef]
- Sun, P.; Wu, Y. Dynamic Modeling Framework of Sediment Trapped by Check-Dam Networks: A Case Study of a Typical Watershed on the Chinese Loess Plateau. Engineering 2023, 27, 209–221. [Google Scholar] [CrossRef]
- Luan, J.; Miao, P.; Tian, X.; Li, X.; Ma, N.; Xu, Z.; et al. Separating the impact of check dams on runoff from climate and vegetation changes. J Hydrol. 2022, 614, 128565. [Google Scholar] [CrossRef]
- Qin, X.; Zhu, H.; Ren, Y.; Cao, Z.; Wang, X.; Zhao, Z.; et al. Erosion intensity and check dam size affect the horizontal and vertical distribution of soil particles, carbon and nitrogen: Evidence from China’s Loess Plateau. Catena 2022, 217, 106451. [Google Scholar] [CrossRef]
- MAATE. Plan Nacional de Adaptación al Cambio Climático del Ecuador (2022 - 2027). Quito, Ecuador: Ministerio del Ambiente, Agua y Transición Ecológica (MAATE); 2023. Available online: https://www.ambiente.gob.ec/wp-content/uploads/downloads/2023/02/PNA_Plan-Nacional-de-Adaptacion_2023_2027.pdf.
- Carrera Villacrés, D. Salinidad en suelos y aguas superficiales y subterráneas de la cuenca evaporítica de Río Verde-Matehuala, San Luis Potosí. Colegio de postgraduados. 2011. Available online: http://www.biblio.colpos.mx:8080/jspui/handle/10521/476.
- Lizcano Toledo, Rodolfo Olivera Viciedo D. Muestreo de Suelos, Técnicas de Laboratorio e Interpretación de Análisis de Suelos. SENA SN de, A.; editor. Neiva: Centro de Formación Agroindustrial La Angostura Servicio Nacional de Aprendizaje (SENA); 2019.
- Valdebenito, G.; Hormazábal, M.; Álvarez, A. Obras de recuperación y conservación de suelo. Inst Investig Agropecu. 2020, 17. Available online: http://200.54.45.229/bitstream/handle/20.500.11944/147888/Info Obras recuperación FIA.pdf?sequence=1&isAllowed=y.
- Hurtado Bolaños, W.; Jiménez Álvarez, P. Morfometría, Hidrología e Hidrometría de la cuenca Urcuhuaycu y propuesta de recuperación. Hurtado. Trabajo de Titulación. ESPE. Universidad de las Fuerzas Armadas ESPE. 2021. Available online: https://repositorio.espe.edu.ec/xmlui/bitstream/handle/21000/26077/T-ESPE-044816.pdf?sequence=1&isAllowed=y.
- MAATE. Acuerdo Ministerial No. 097-A. 2015. Available online: http://huella-ecologica.ambiente.gob.ec/files/AM_140_Incentivos_Ambientales.pdf.
- Roldán-Pérez, G. Macroinvertebrates as bioindicators of water quality: Four decades of development in Colombia and Latin America. Rev la Acad Colomb Ciencias Exactas, Fis y Nat. 2016, 40, 254–274. [Google Scholar] [CrossRef]
- Ríos-Touma, B.; Acosta, R.; Prat, N. The Andean biotic index (ABI): Revised tolerance to pollution values for macroinvertebrate families and index performance evaluation. Rev Biol Trop. 2014, 62, 249–273. [Google Scholar] [CrossRef]
- Coayla-Peñaloza, P.; Cheneaux-Díaz, A.; Moreno-Salazar, C.; Cruz-Remache, C.; Colque-Rondón, E.; Damborenea, C. Benthic macroinvertebrate communities and water quality assessment in high Andean wetlands Callali-Oscollo, Arequipa-Cusco, Peru. Revista mexicana de biodiversidad 2023, 94, 0–13. [Google Scholar] [CrossRef]
- Urdanigo, J.; Díaz, M.; Tay-Hing, C.; Sánchez, C.; Yong, R.; Armijo, K.; et al. Diversidad de macroinvertebrados acuáticos en quebradas con diferente cobertura ribereña en del bosque Protector Murocomba, cantón Valencia, Ecuador. Rev Biol Trop. 2019, 67, 861–878. Available online: https://revistas.ucr.ac.cr/index.php/rbt/article/view/35190.
- Dang, C.; Zhang, H.; Zhi, T.; Zhang, J.; Ding, H.; Zhang, H.; et al. A statistical approach for reconstructing natural streamflow series based on streamflow variation identification. Hydrol Res. 2021, 52, 1100–1115. [Google Scholar] [CrossRef]
- Brito Nazareno, M.; Criollo Sandoval, A. Cantidad y calidad de las aguas y sedimentos históricos generados en la operación y mantenimiento de los diques instalados en la quebrada Urku Huayku del volcán Ilaló como una solución basada en la naturaleza. Universidad de las Fuerzas Armadas ESPE. 2023. Available online: https://repositorio.espe.edu.ec/bitstream/21000/36904/3/T-ESPE-058175.pdf.
- Hurtado de Barrera, J. Guía para la comprensión holística de la ciencia. Tercera. Guía para la comprensión holística de la ciencia. Tercera. Caracas; 2010. Available online: https://es.calameo.com/books/00441616639f9029c29f4.
- EPA U.S. Environmental Protection Agency. 5.9 Conductivity. Available online: https://archive.epa.gov/water/archive/web/html/vms59.html.
- Nordin, R.N.; Pommen, L.W. Water Quality Guidelines for Nitrogen (Nitrate, Nitrite, and Ammonia) - Overview Report Update. Water Steward Div Minist Environ Prov Br Columbia, Canada. 2009. Available online: https://www2.gov.bc.ca/assets/gov/environment/air-land-water/water/waterquality/wqgs-wqos/approved-wqgs/nitrogen-overview.pdf%0Ahttp://a100.gov.bc.ca/pub/eirs/finishDownloadDocument.do?subdocumentId=9021.
- Meays, C.; Nordin, R. Ambient Water Quality Guidelines For Sulphate Technical Appendix. Ministry of Environment, Province of British Columbia, Canada: 2013 pp. 1–55.
- Litke, D.W. Review of Phosphorus Control Measures in the United States and Their Effects on Water Quality. Water-Resources Investig Rep 99-4007. 1999. Available online: http://www.msue.msu.edu/waterqual/WQWEB/ReviewPUSGS.pdf.
- Swietlik, W. Developing water quality criteria for suspended and bedded sediments (SABS) Pontetial Approaches. 2003. Available online: https://archive.epa.gov/epa/sites/production/files/2015-10/documents/sediment-report.pdf.
- Boyd, C.E. Water Quality Standards: Total suspended solids. Glob Aquac Advocate. 2001, 70–71. Available online: https://www.globalseafood.org/advocate/water-quality-standards-total-suspended-solids/.
- Msimbira, L.A.; Smith, D.L. The Roles of Plant Growth Promoting Microbes in Enhancing Plant Tolerance to Acidity and Alkalinity Stresses. Front Sustain Food Syst. 2020, 4, 564220. [Google Scholar] [CrossRef]
- Mickelbart, M.V.; Stanton, K.M. Lowering soil pH for horticulture crops. Purdue Ext. 2008, 2, 4–7. Available online: www.ag.purdue.edu/HLA.
- Carrera Villacrés, D.; Guevara García, P.; Gualichicomin Juiña, G. Caracterización físico-química desde el punto de vista agrícola de los suelos en la zona de riego del proyecto multipropósito Chone. 2017, 71–80.
- Shi, H.; Huang, Y.; Feng, D. Numerical investigation on the role of check dams with bottom outlets in debris flow mobility by 2D SPH. Sci Rep. 2022, 12, 1–17. [Google Scholar] [CrossRef]
- Lucas-Borja, M.E.; Piton, G.; Yu, Y.; Castillo, C.; Antonio Zema, D. Check dams worldwide: Objectives, functions, effectiveness and undesired effects. Catena 2021, 204, 105390. [Google Scholar] [CrossRef]
- Zhang, Z.; Chai, J.; Li, Z.; Chen, L.; Yu, K.; Yang, Z.; et al. Effect of Check Dam on Sediment Load Under Vegetation Restoration in the Hekou-Longmen Region of the Yellow River. Front Environ Sci. 2022, 9, 1–12. [Google Scholar] [CrossRef]
- Fang, N.; Zeng, Y.; Ran, L.; Wang, Z.; Lu, X.; Wang, Z.; et al. Substantial role of check dams in sediment trapping and carbon sequestration on the Chinese Loess Plateau. Commun Earth Environ. 2023, 4, 1–10. [Google Scholar] [CrossRef]
- Hartman, B.D.; Bookhagen, B.; Chadwick, O.A. The effects of check dams and other erosion control structures on the restoration of Andean bofedal ecosystems. Restor Ecol. 2016, 24, 761–772. [Google Scholar] [CrossRef]
- Gao, Y.; Zhang, X.; Zhang, X.; Li, D.; Yang, M.; Rongxiang, H.; et al. Building check dams systems to achieve water resource efficiency: Modelling to maximize water and ecosystem conservation benefits. Hydrol Res. 2020, 51, 1409–1436. [Google Scholar] [CrossRef]
- Zhao, B.; Xin, T.; Li, P.; Ma, F.; Gao, B.; Fan, R. Regulation of Flood Dynamics by a Check Dam System in a Typical Ecological Construction Watershed on the Loess Plateau, China. Water 2023, 15, 2000. [Google Scholar] [CrossRef]
- Nyffeler, M.; Birkhofer, K. An estimated 400–800 million tons of prey are annually killed by the global spider community. Sci Nat 2017, 104, 1–12. [Google Scholar] [CrossRef] [PubMed]
- Nyffeler, M.; Şekercioğlu, Ç.H.; Whelan, C.J. Insectivorous birds consume an estimated 400–500 million tons of prey annually. Sci Nat 2018, 105, 1–13. [Google Scholar] [CrossRef]
Figure 1.
Check dams in Urku Huayku ravine: (a) Check dam 1; (b) Check dam 2; (c) Check dam 3.
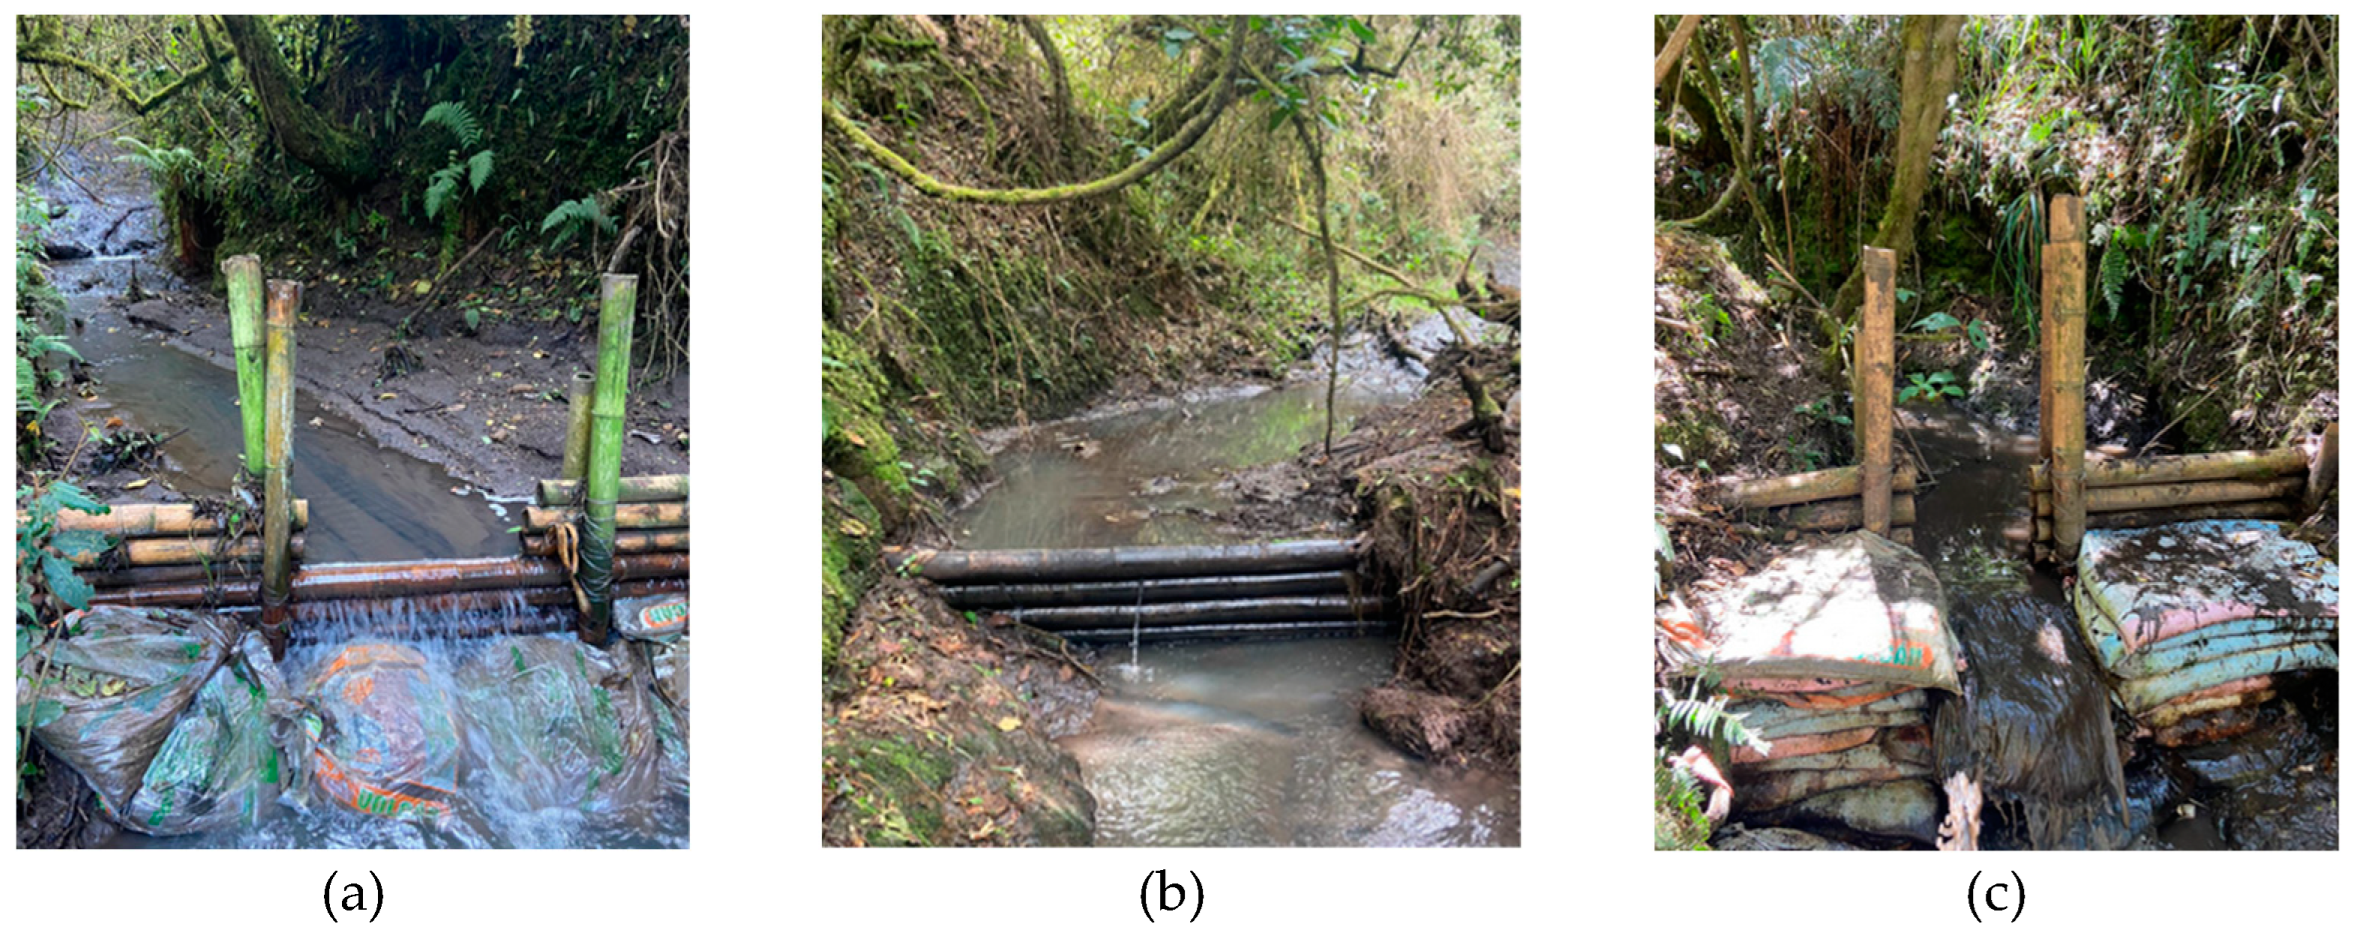
Figure 2.
Urku Huayku Microbasin.
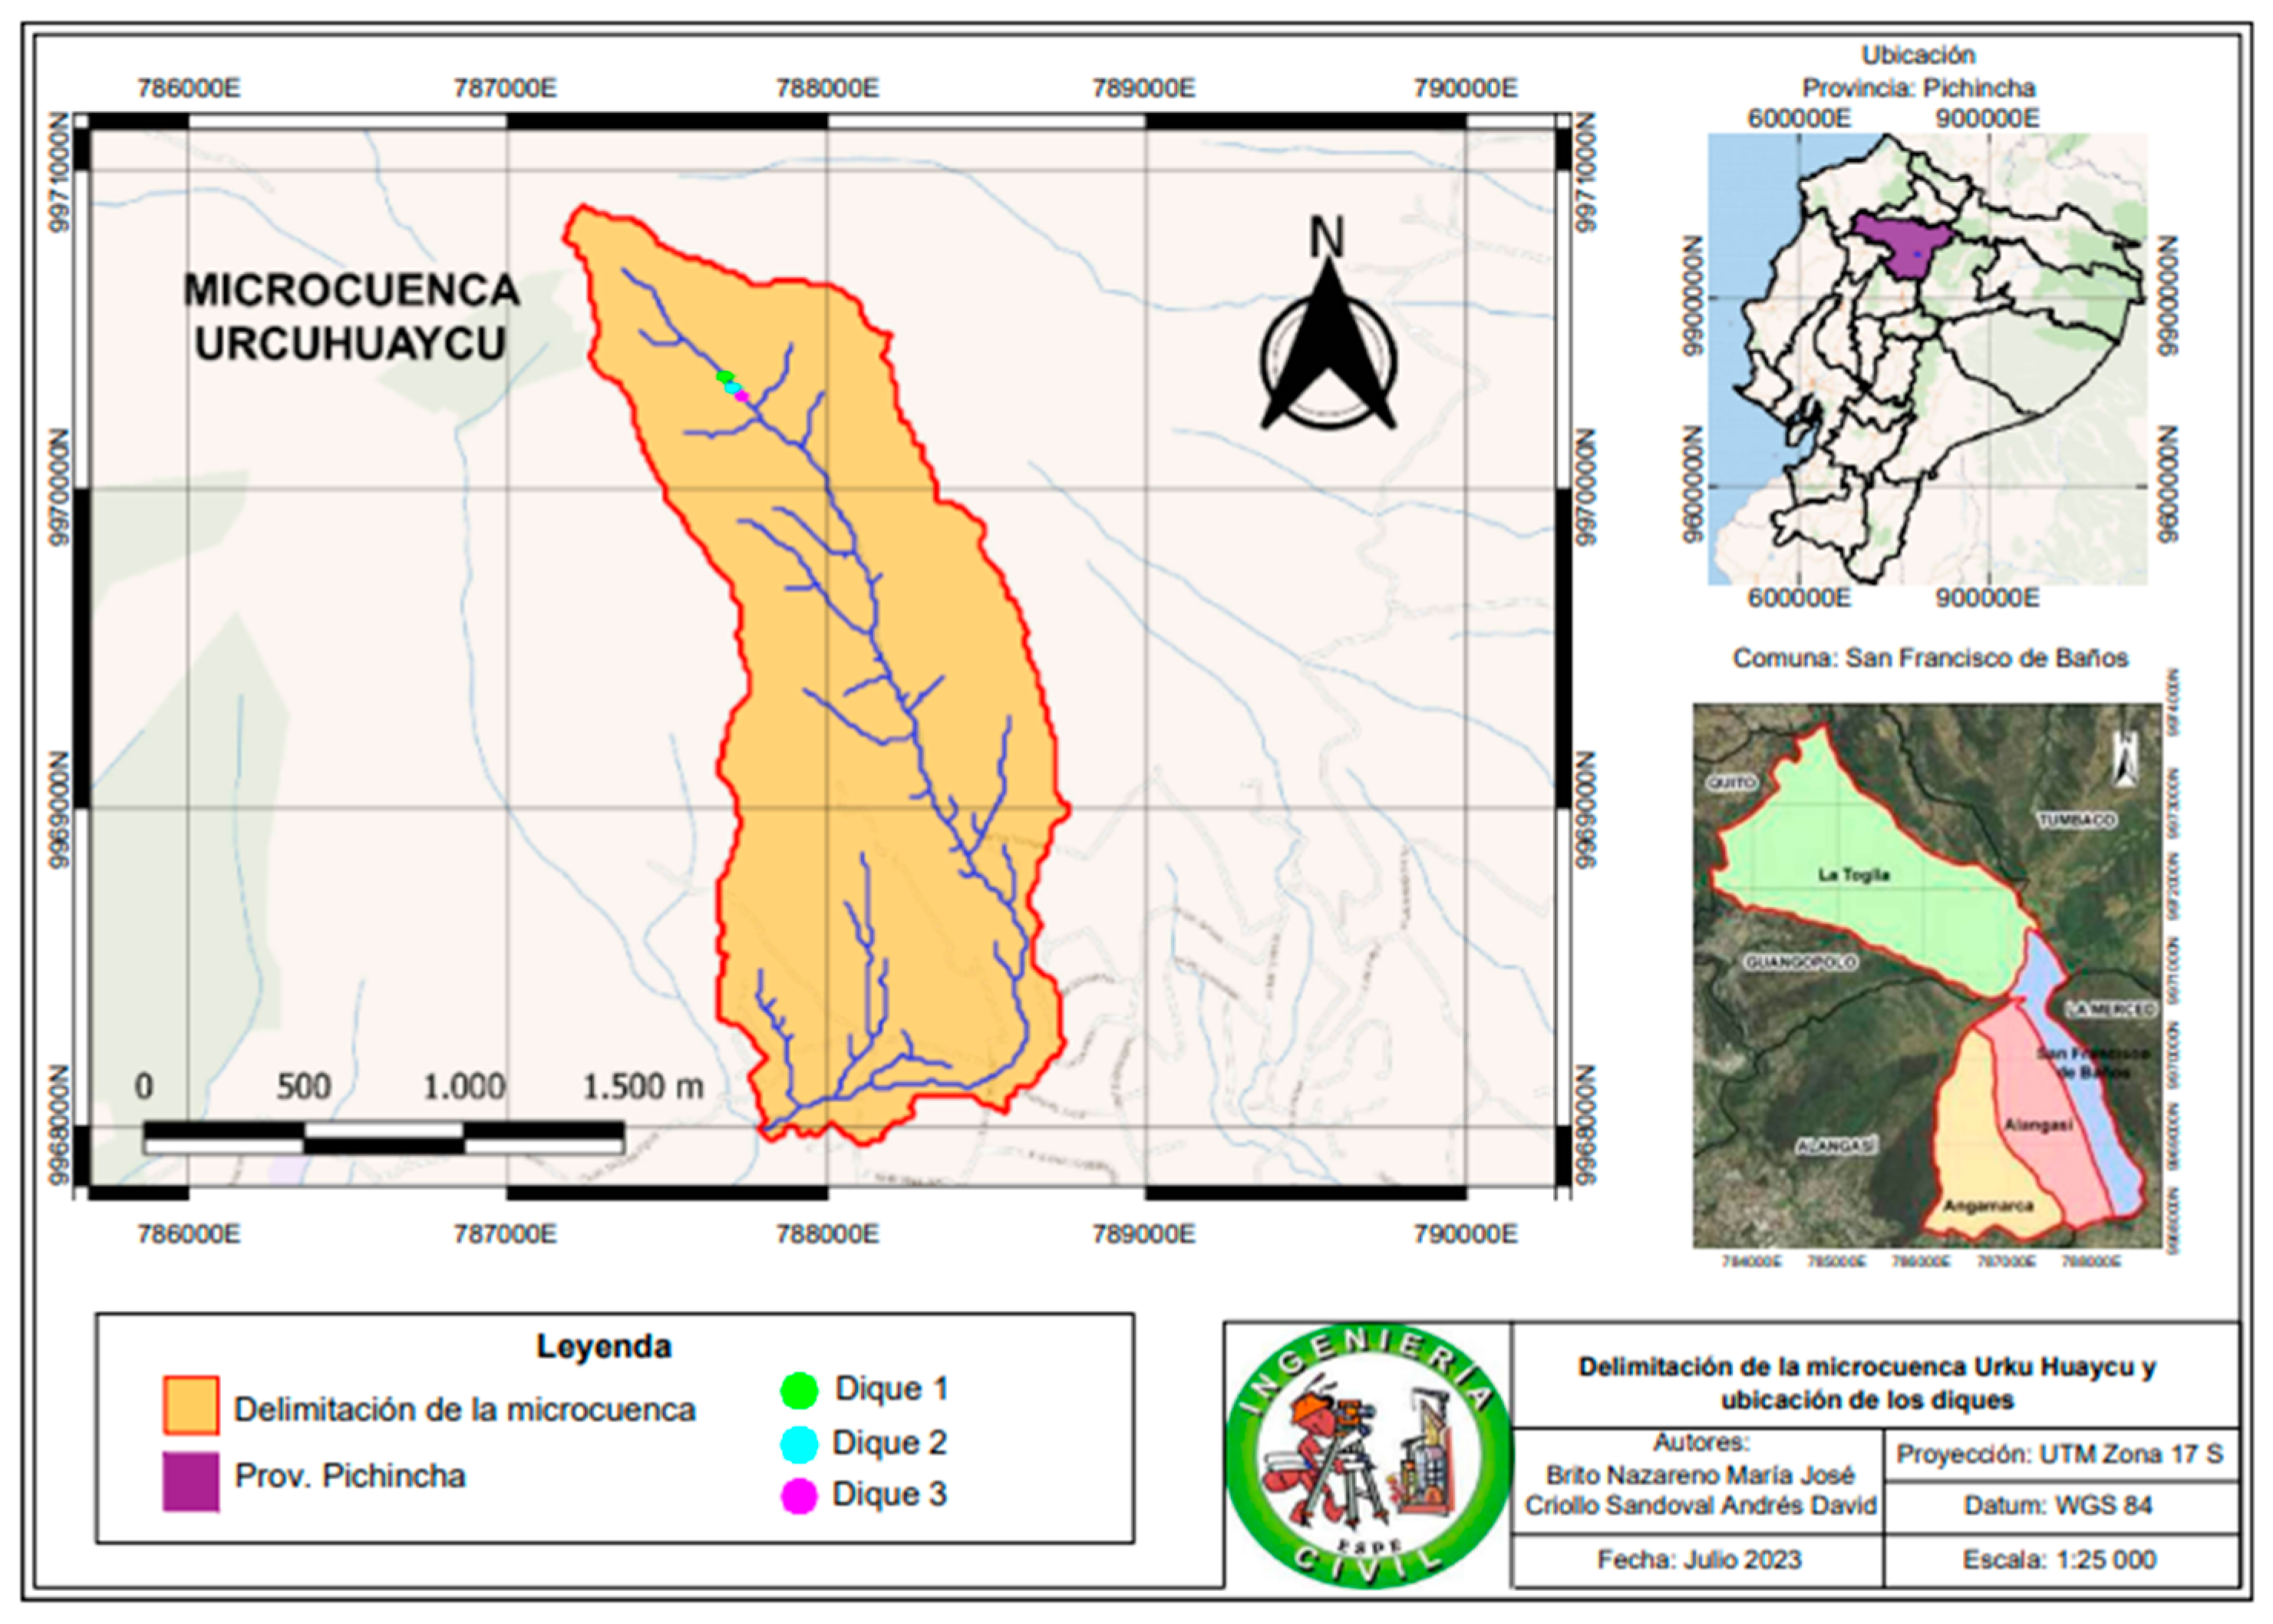
Figure 3.
Sections of the Urku Huayku micro-basin.
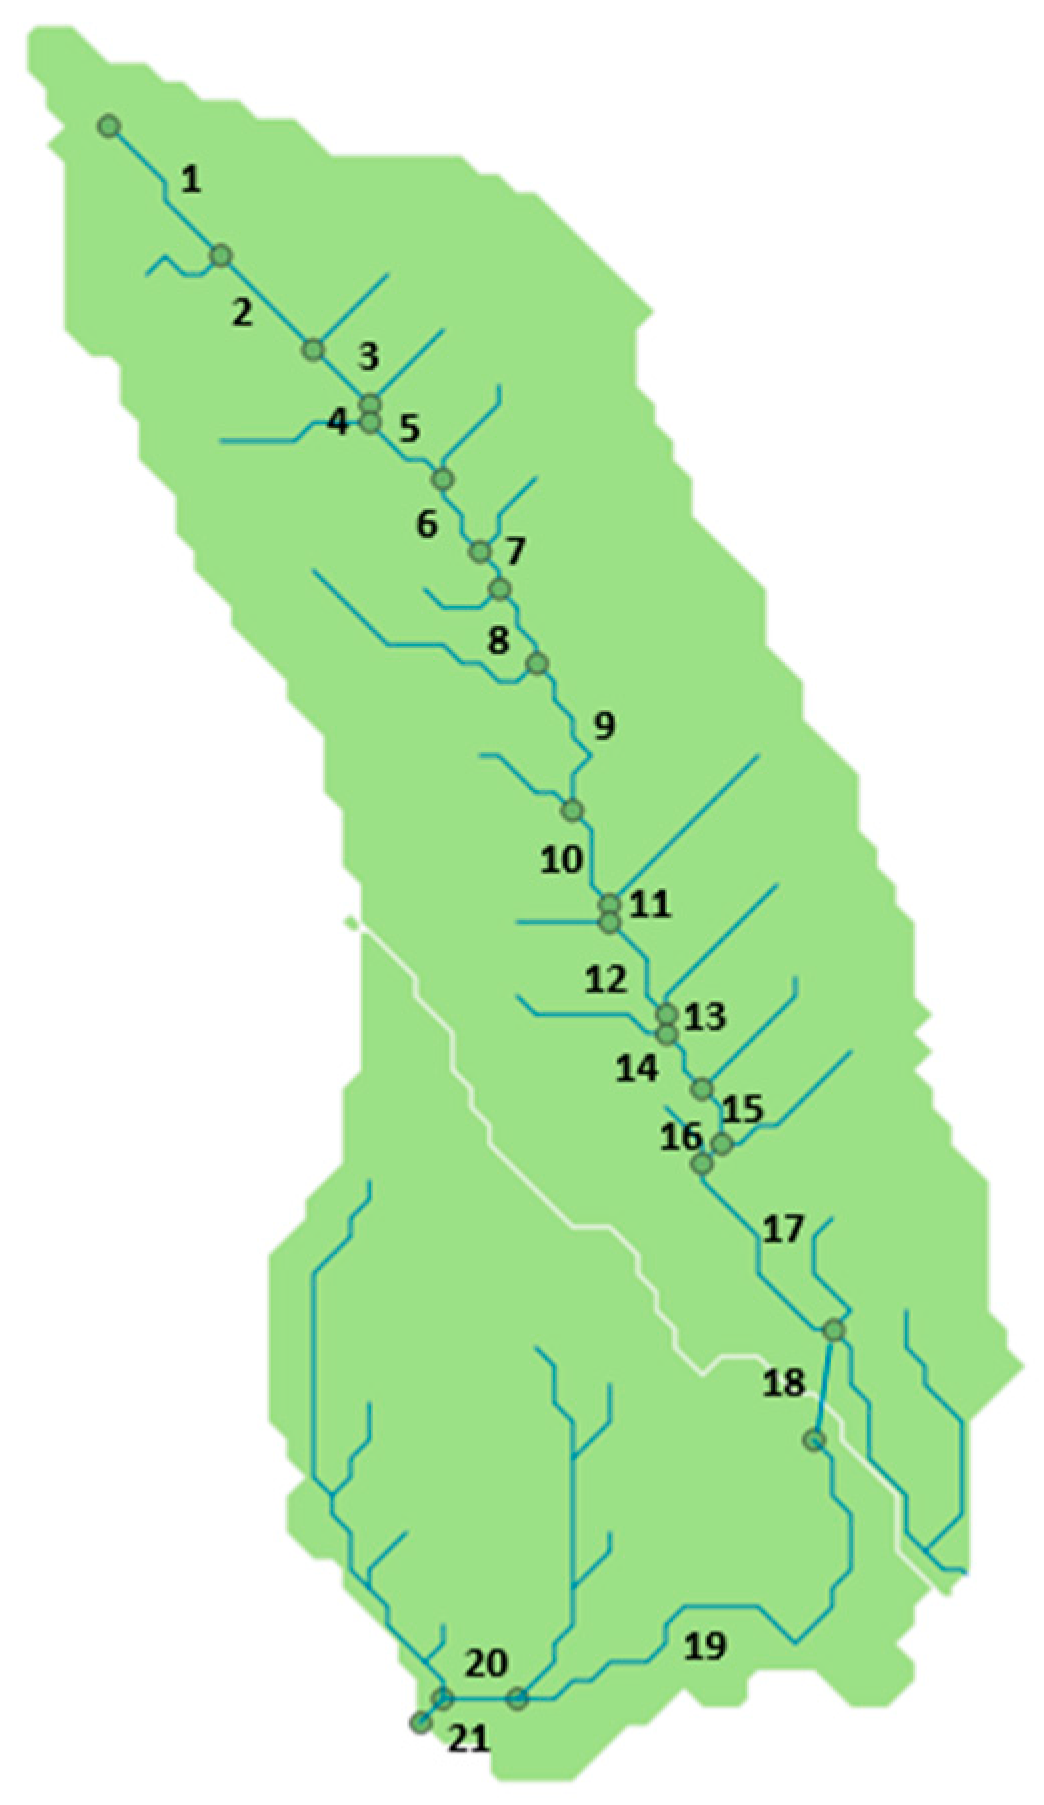
Table 1.
Methodology for water quality and quantity analysis.
| Parameter | Methodology |
|---|---|
| Sulfates, phosphates, nitrates, and suspended solids | It is measured with the Hach 5000 spectrophotometer using Hach SulfaVer, PhosVer, and NitraVer reagents. |
| pH analysis | It is measured with the Hach HQ40D portable multimeter. |
| Electrical conductivity and total dissolved solids | It is measured with a TDS meter, which provides the EC concentration in µS/cm and the TDS in parts per million (ppm). |
| Flow measurement and calculation | Volumetric method |
Table 2.
Methodology for sediment quality analysis.
| Parameter | Methodology |
|---|---|
| pH and electrical conductivity | They are conducted according to the method proposed in the "Manual of Chemical Soil Analysis," with a soil-water ratio 1:2.5. |
| Organic matter | Schulte & Hopkins’ (1996) combustion method. |
| Density | Soil particle density was analysed using the gravimetric method with a pycnometer based on ASTM C 128 – 01 standard. |
Table 4.
Methodology for sediment quality analysis.
| Section | Initial elevation (AMSL) | Final elevation (AMSL) | Horizontal length (m) | Slope (%) |
|---|---|---|---|---|
| 7 | 2959 | 2938 | 74 | 28 |
| 8 | 2938 | 2892 | 149 | 31 |
| 9 | 2892 | 2807 | 297 | 29 |
| 10 | 2737 | 2729 | 31 | 26 |
Retention dams are structures designed to capture sediments found upstream. These trapped sediments accumulate behind the dam, decreasing the channel's slope.
Disclaimer/Publisher’s Note: The statements, opinions and data contained in all publications are solely those of the individual author(s) and contributor(s) and not of MDPI and/or the editor(s). MDPI and/or the editor(s) disclaim responsibility for any injury to people or property resulting from any ideas, methods, instructions or products referred to in the content. |
© 2025 by the authors. Licensee MDPI, Basel, Switzerland. This article is an open access article distributed under the terms and conditions of the Creative Commons Attribution (CC BY) license (http://creativecommons.org/licenses/by/4.0/).
Copyright: This open access article is published under a Creative Commons CC BY 4.0 license, which permit the free download, distribution, and reuse, provided that the author and preprint are cited in any reuse.


