Submitted:
14 January 2025
Posted:
15 January 2025
You are already at the latest version
Abstract
Automated decision-making systems are becoming more prevalent across a range of fields. For example, they are used across the finance industry to decide whether customers are entitled to loans, and in medicine to support clinical decisions. With decisions that substantially impact individual lives, users will often want explanations of why these decisions were made. Indeed, current and in-progress legal frameworks have begun to require these. For example, GDPR entitles users to explanations about decisions made by these automated systems. Similarly, the Algorithmic Accountability Act would require companies to conduct impact assessments for bias, effectiveness and other factors. One way of producing such explanations for the decisions of machine learning models is to ask the question “What must I change in the input to change the output of a model”. This is known as a counterfactual explanation. Our methodology begins by fitting simple models to the variation of the output caused by the change of one input feature. We then score each of these models using user-tuneable scoring functions. By selecting the best possible change and then repeating, we chain together these simple models into sequential counterfactuals. Our method is modular, which means that it is inherently extensible. Each component of out methodology can be easily modified to make it more useful for specific situations. We examine how well our methodology performs on multiple data formats: images and tabular data. We compare our framework to other methodologies. We demonstrate that our method can, in some cases, produce more interpretative counterfactuals that change fewer features than some existing methodologies. Finally, we make a Python implementation of our code available so that it can be used by the machine learning community.
Keywords:
1. Introduction
1.1. Our Approach
2. Background
2.1. Counterfactuals
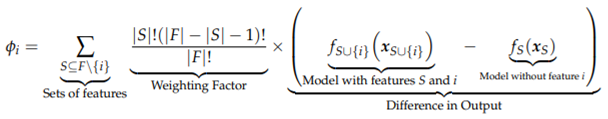
2.2. SHAP Values
2.3. LIME
2.3.1. Existing Methodologies for Generating Counterfactuals
Model Specific Explanations
Counterfactuals as an Optimisation Problem
Sequential Counterfactuals
Similar Work
2.3.2. Other Methodologies We Evaluate Our Methodology Against
2.3.3. Practical Uses of Counterfactual Explanations
2.4. Relation to Adversarial Machine Learning
3. Methods
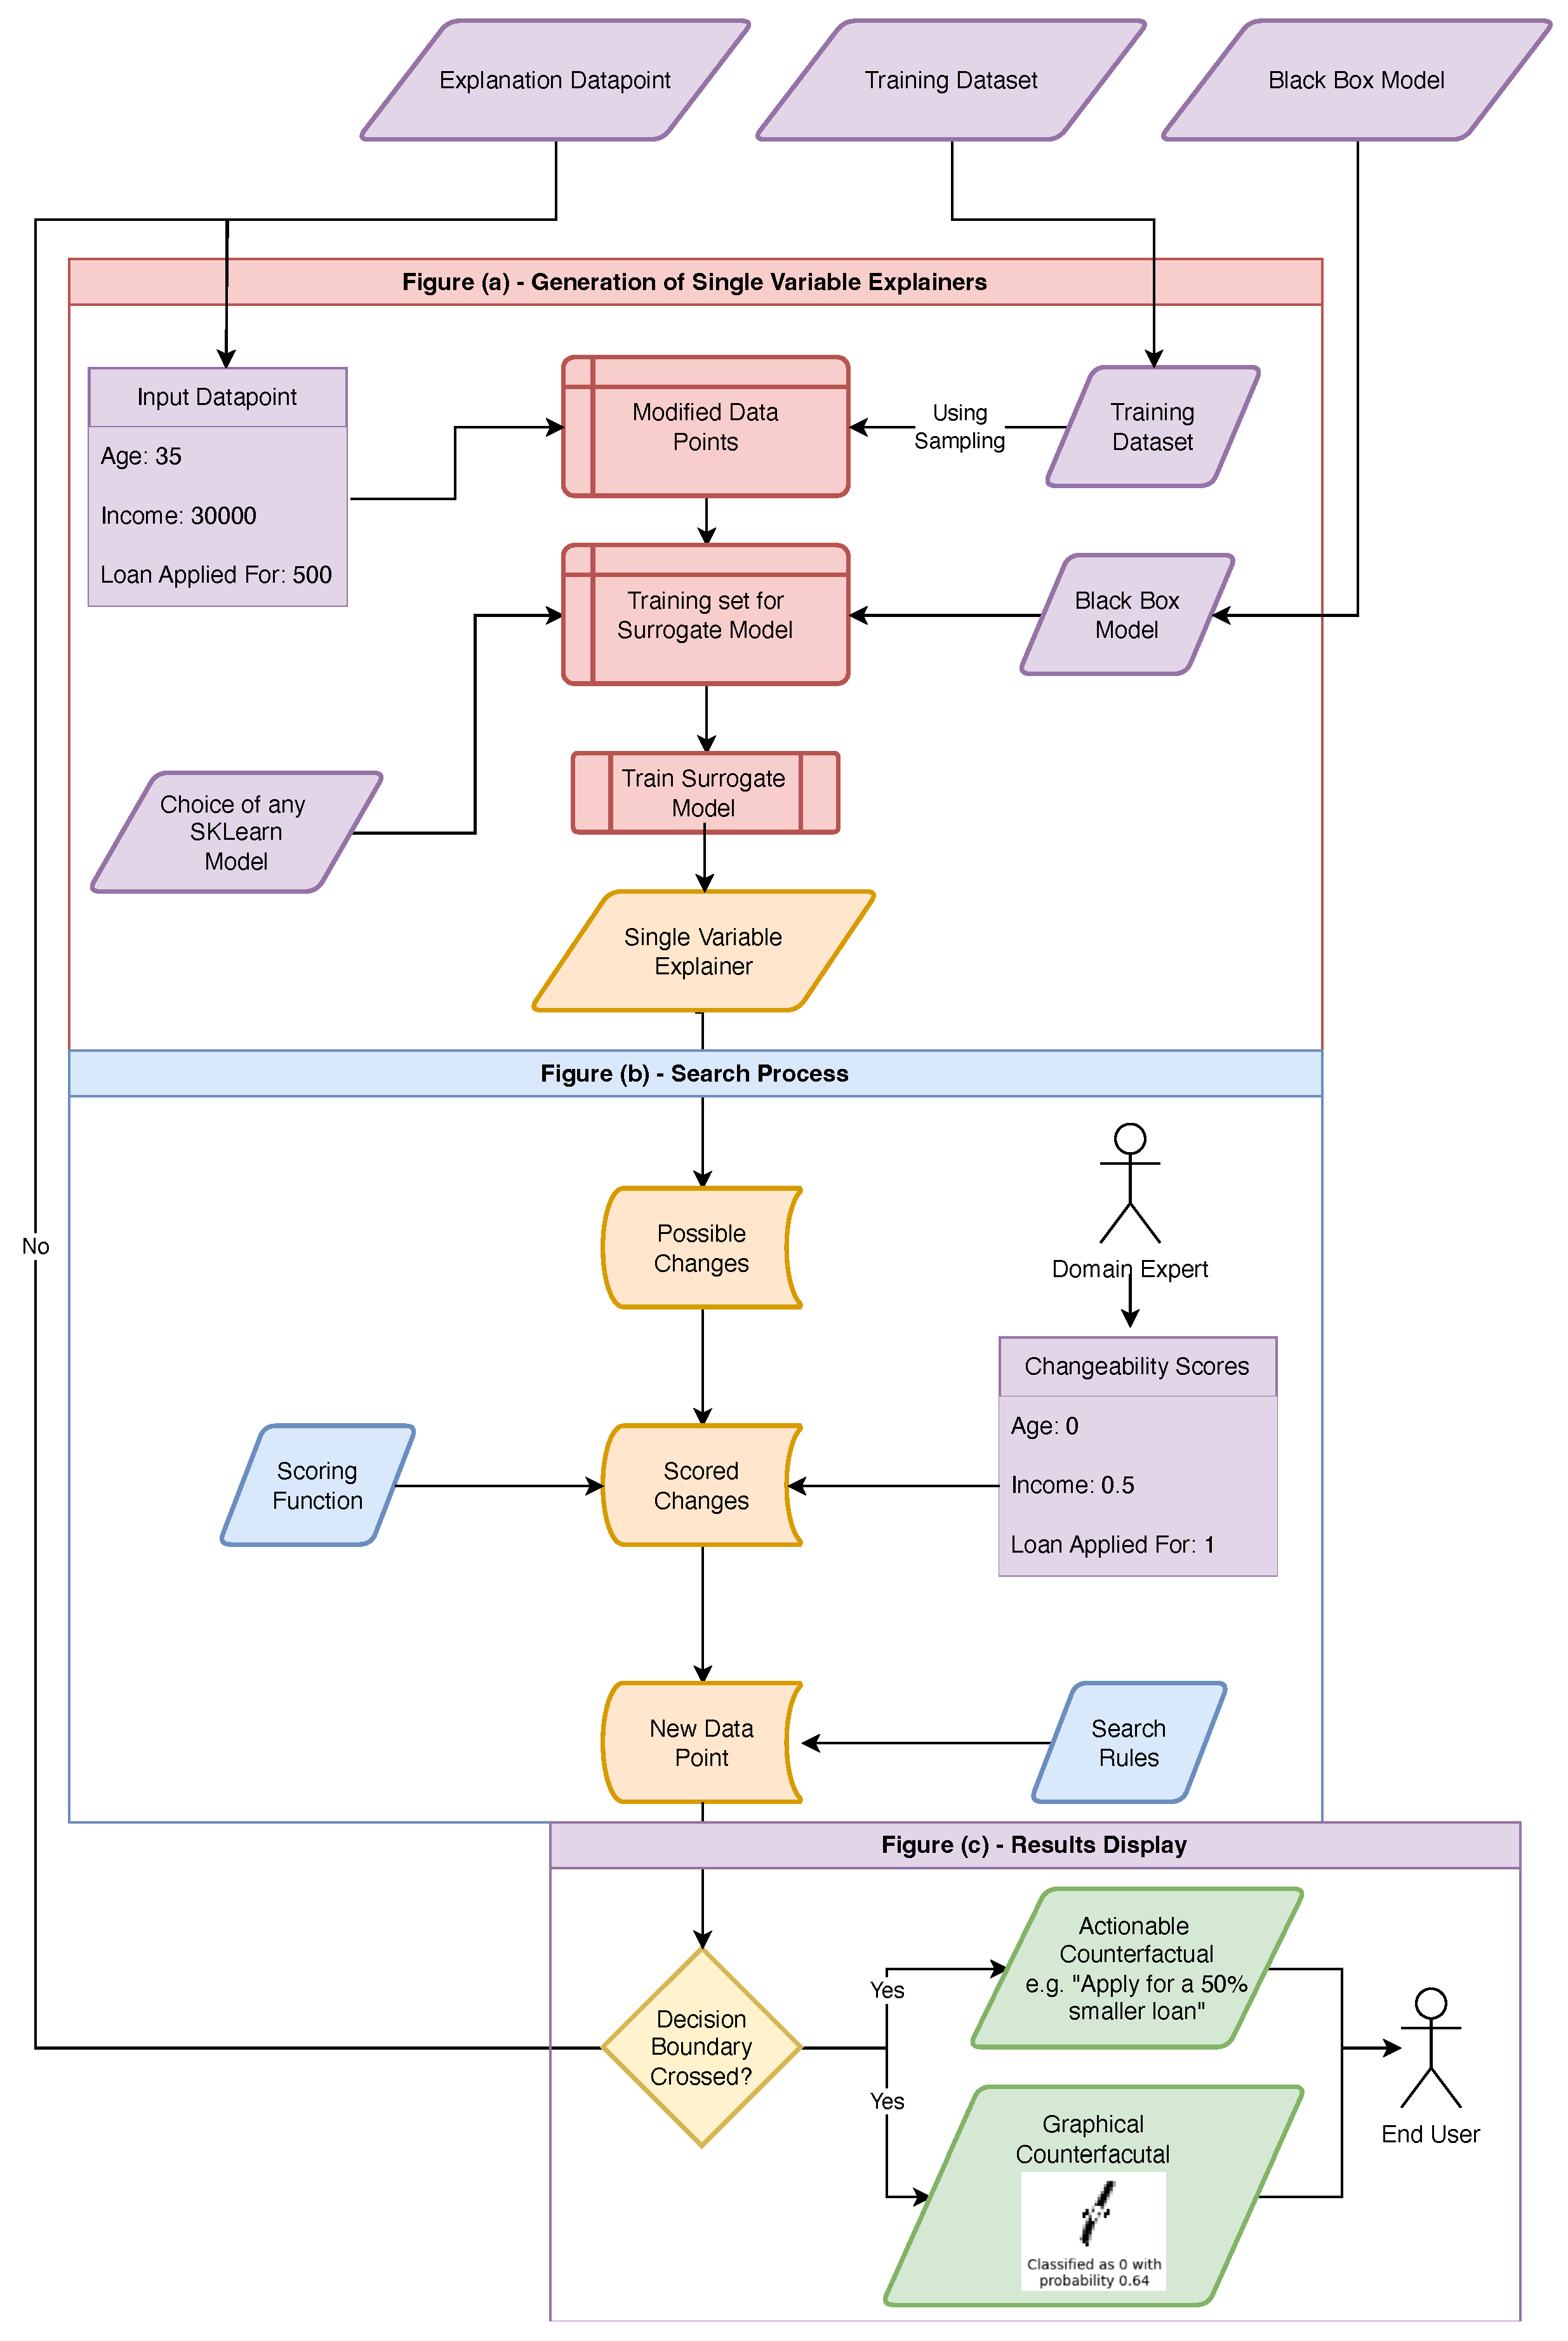
3.1. Methodology for Generating Counterfactuals
-
Fit simple, surrogate models to the effect of changing each input feature in the underling model, keeping all other features the same.
- We might for example, fit linear models to the local effect of changing each pixel of an image, or the effect of each input feature to a system that makes decisions about whether applicants are entitled to loans.
- Consider the example where we have an individual with an income of £30k, applying for a loan of £1k. We will imagine this individual has a debt-to-income ratio of 10% and they are denied a loan by the hypothetical system (with a class probability of 0.9).
-
For each of these models,
- (a)
-
Select the `feature value’ that they predict will maximise the “score”.
- This may, for example, be reducing the size of the loan they are applying for by £250.
- (b)
-
In the initial data-point, replace this feature with this new value.
- We now have a new data-point - an applicant with an income £30k, applying for a loan of £750k with a debt-to-income ratio of 10%
-
If any of these new data-points change the model prediction (possibly plus some additional threshold), this is the counterfactual.
- Suppose running this original classifier now accepted the applicant the loan, with a class probability of 0.6. We can take this new data-point as counterfactual and return it, in a human-readable-format to the user.
-
Otherwise, select the best scoring one of these new data-points and repeat the process from here.
- If instead, the system still denied the use the loan, but this time with a class probability of 0.6, we take this new hypothetical point and repeat the process from here.
- Note: we would in fact do this for all allowed input data-points and pick the one which maximised some score.
-
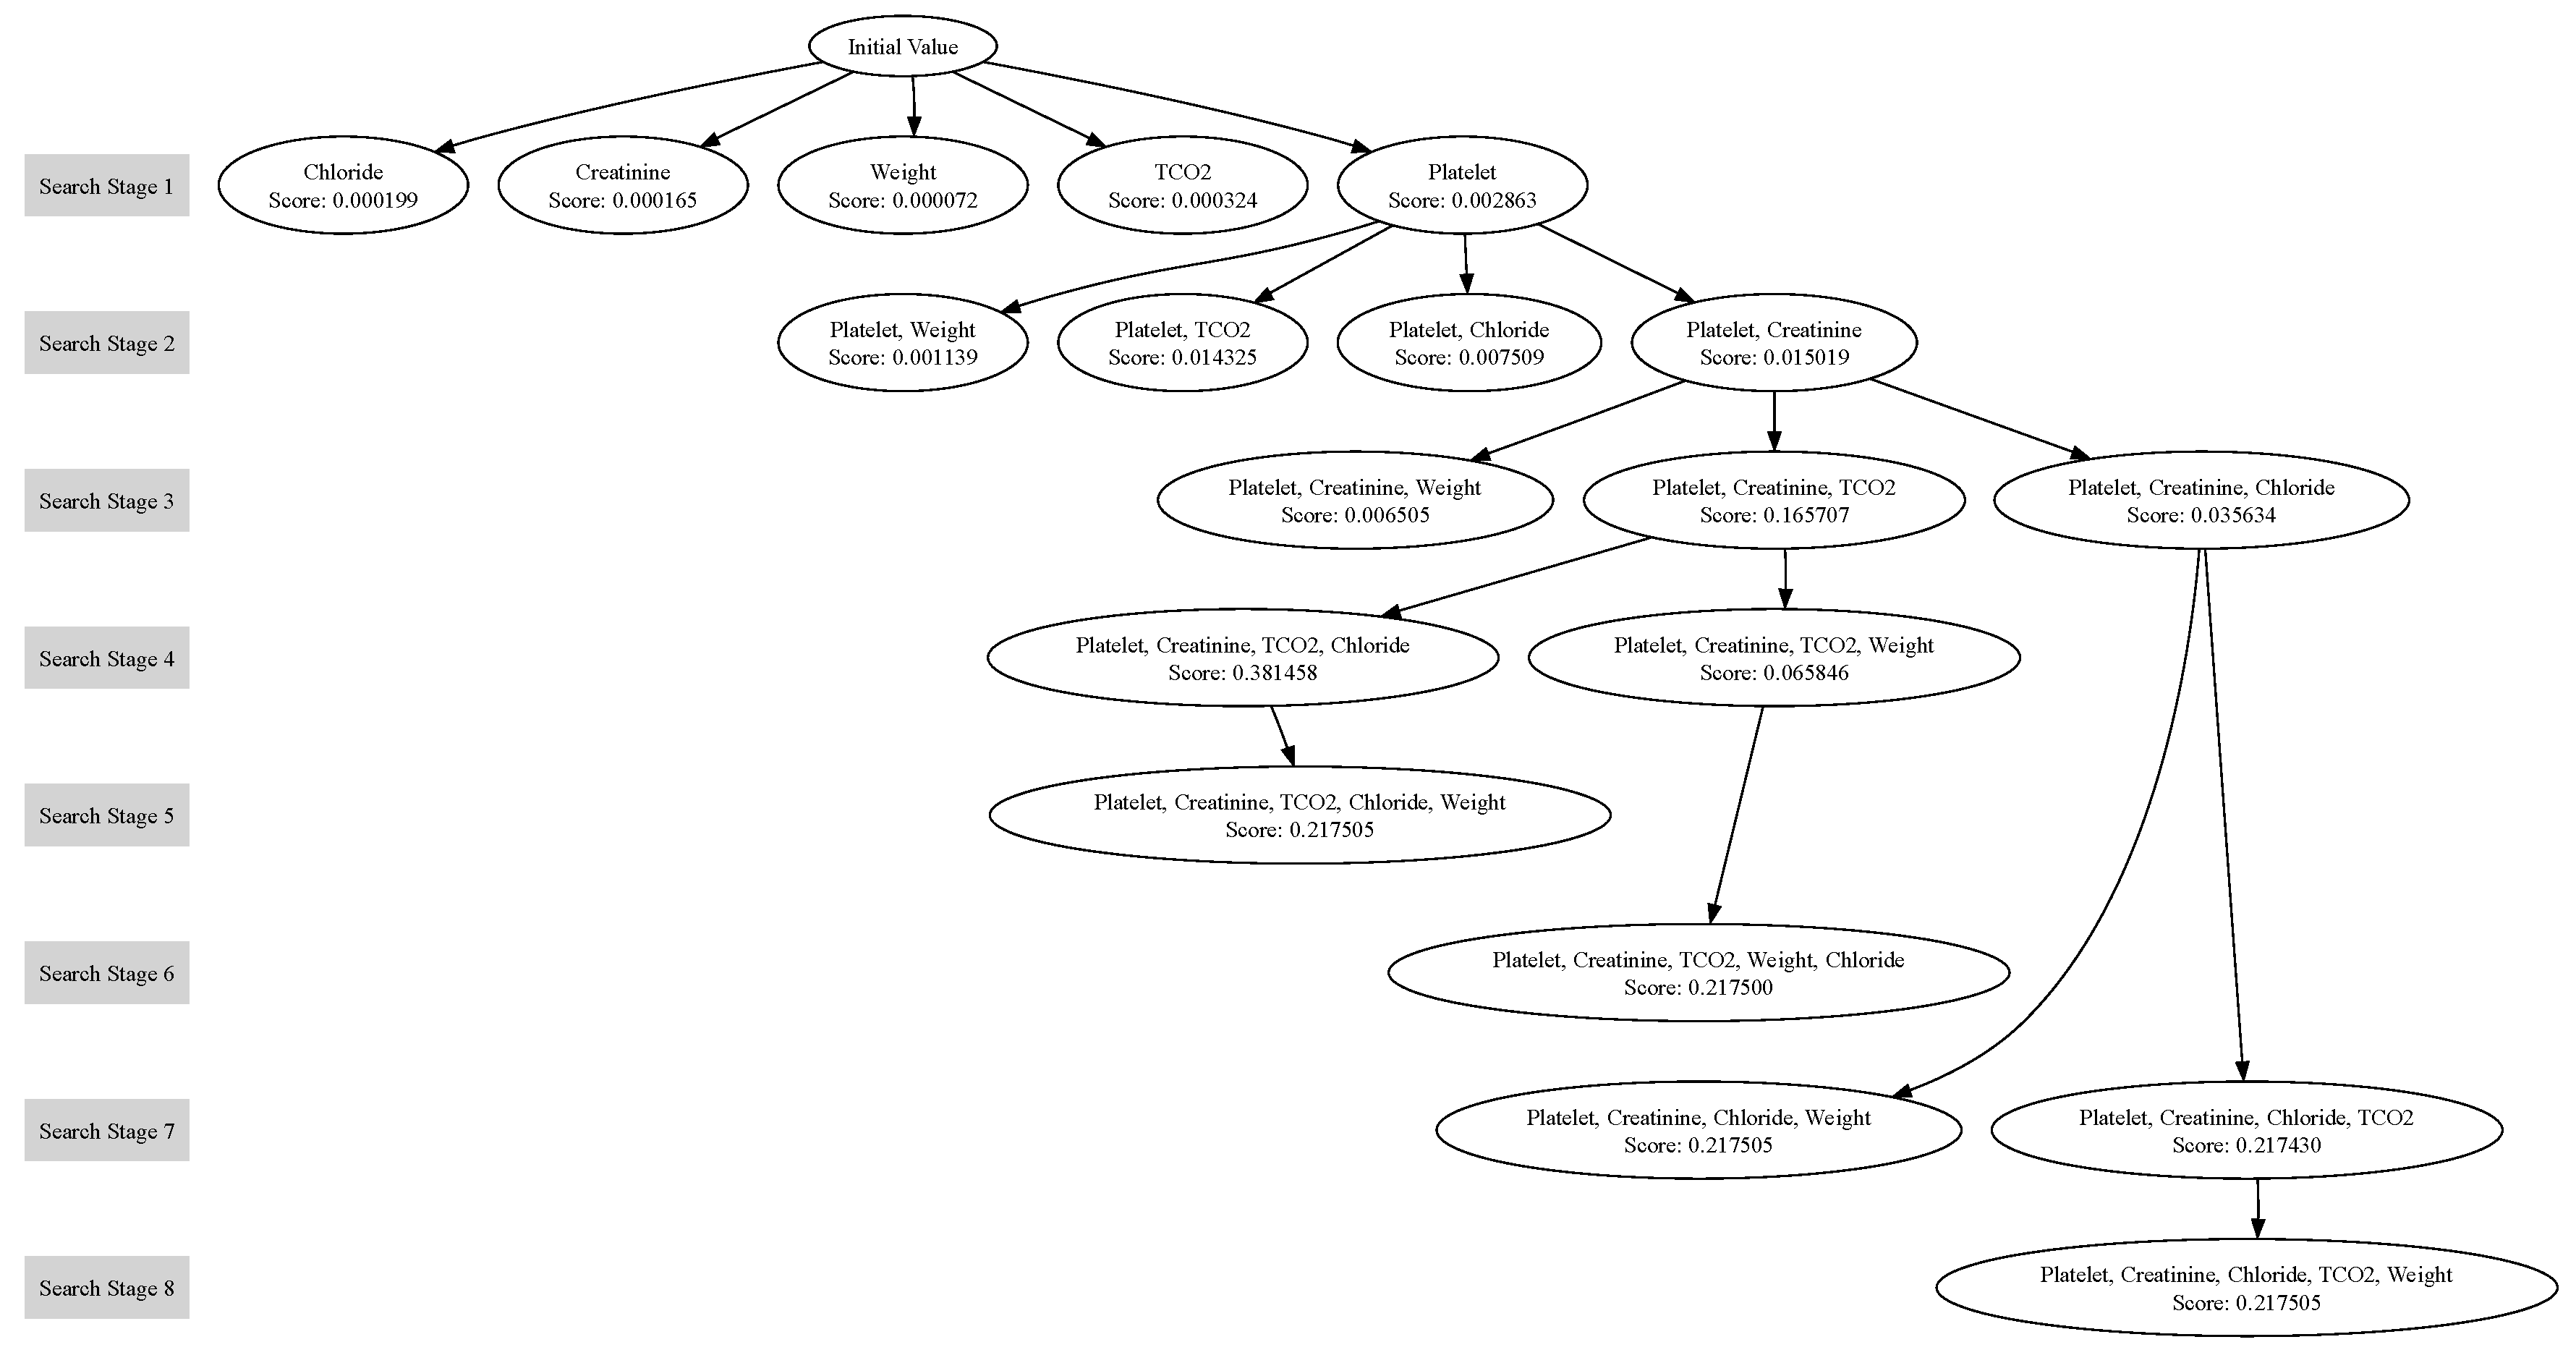
If we have run out of variables to change - or reached the maximum search depth - then return to previous unexplored branches and search from there.We can think of the change to single variable as being a node on a graph, connected to points it shares “all but one feature value” with. In this sense, our search process is akin to a depth-first-search on this graph. This is visualised in Figure 3
- Repeat the previous step until either a counterfactual has been found, or all notes of the graph have been searched.
3.1.1. Surrogate Models
3.1.2. Scoring Rules
3.1.3. Benefits
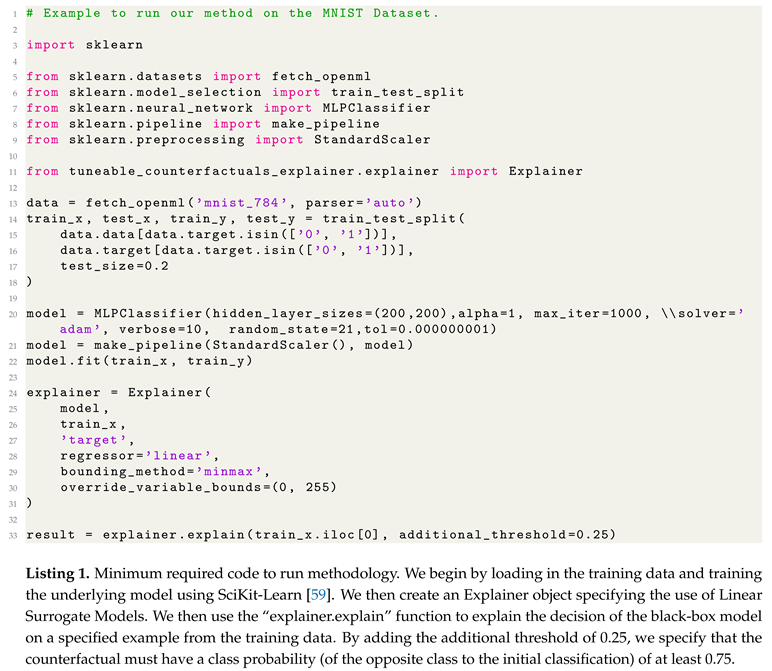
3.2. Technical Implementation
3.3. Evaluation Methodology
3.3.1. Evaluation Metrics
3.3.2. Evaluation Data-Sets
Financial Data-Set
MIMIC
MNIST
3.3.3. Training the Underlying Models
4. Results and Discussion
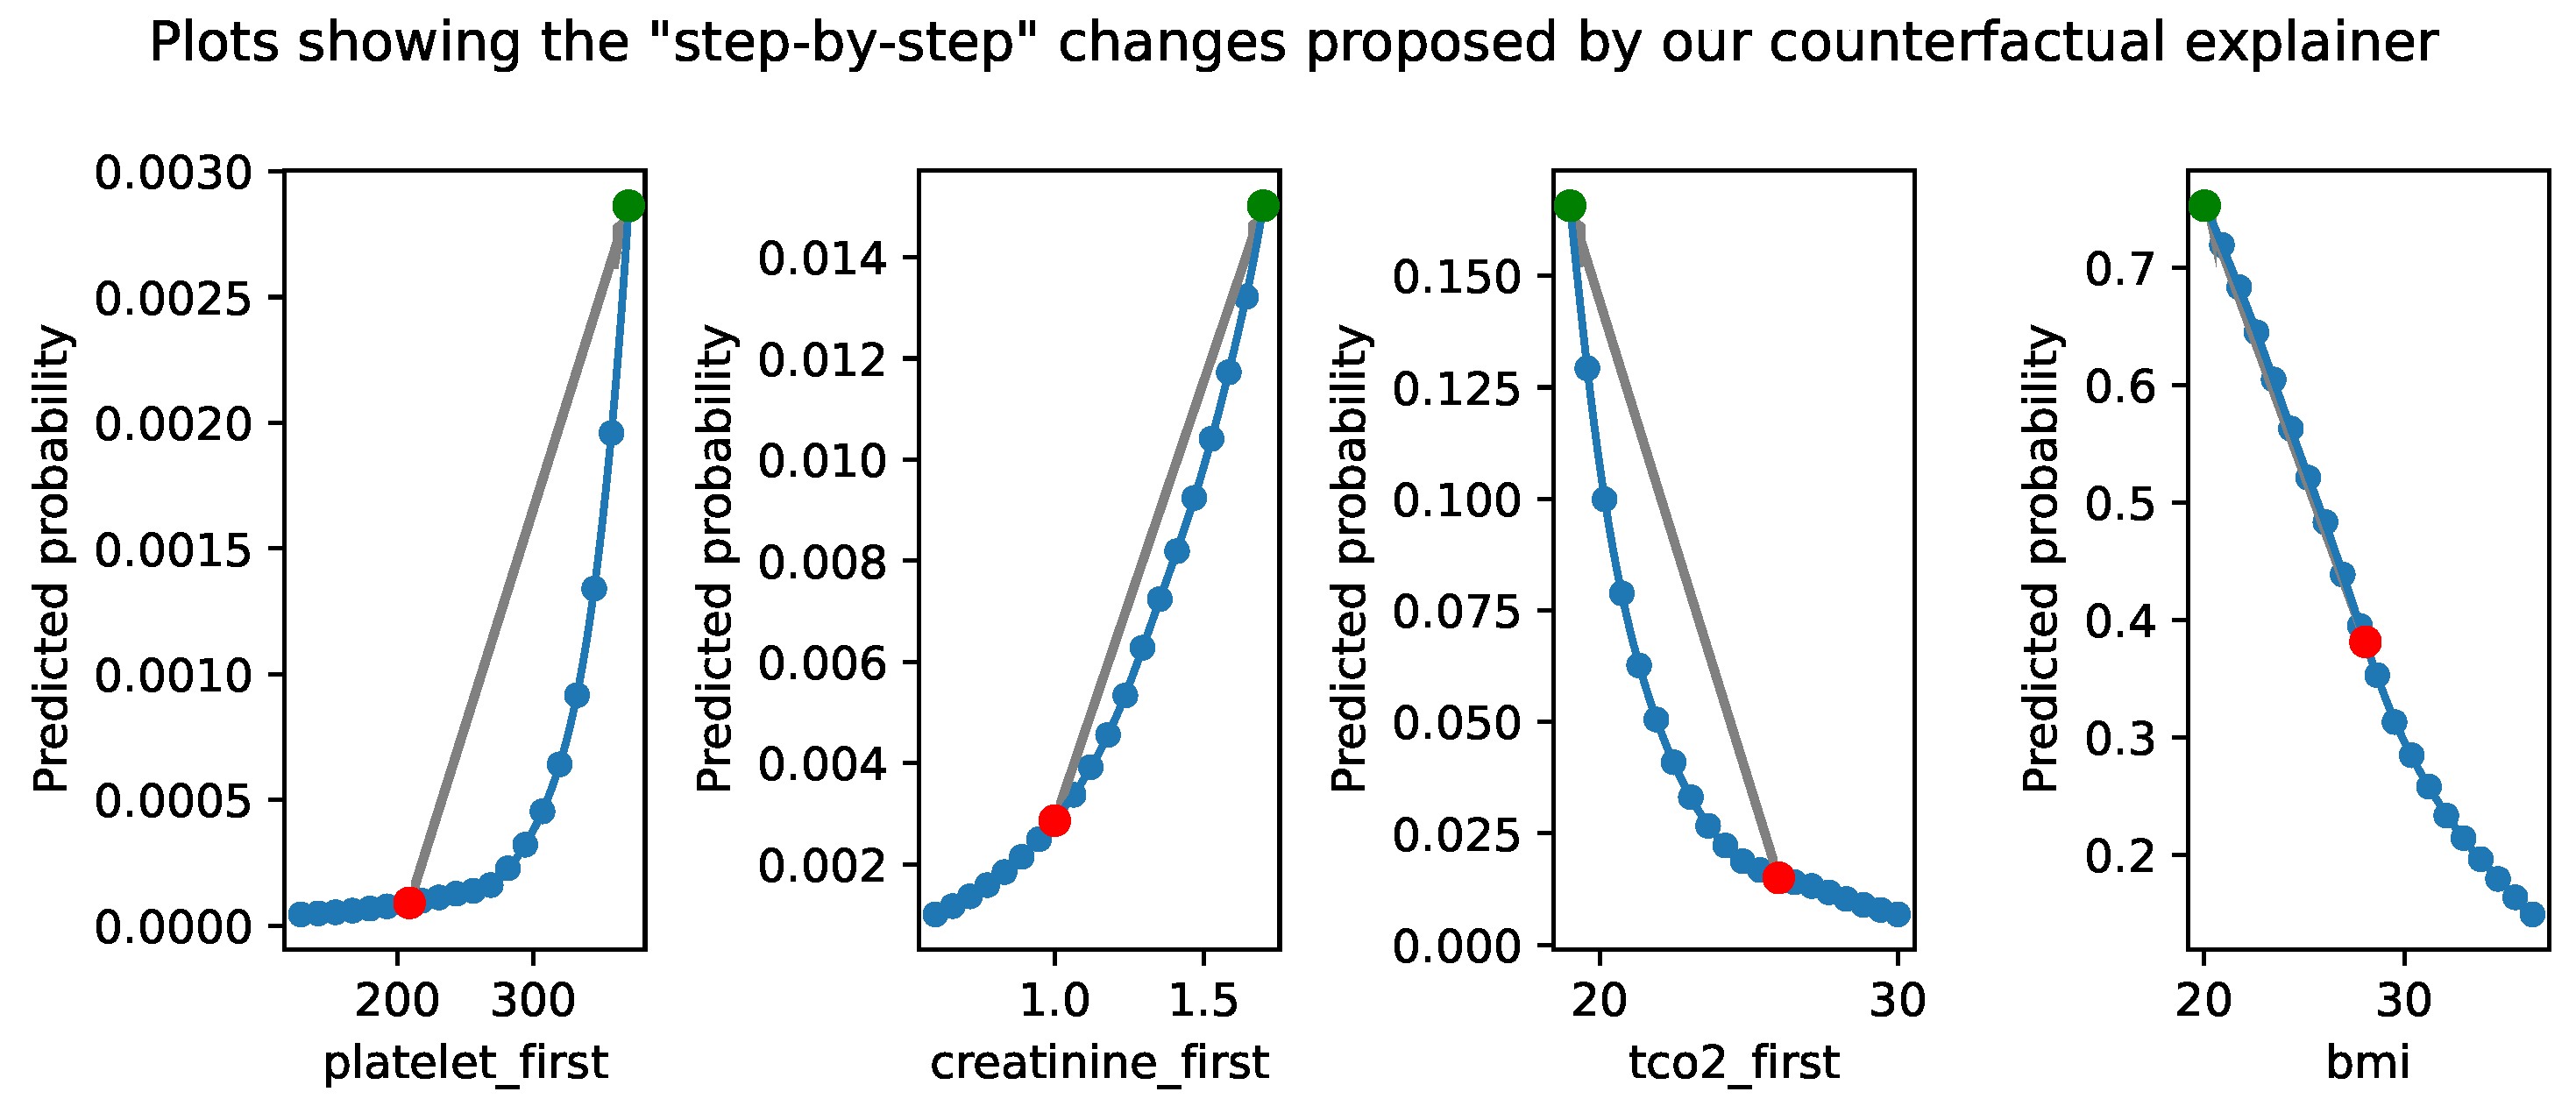
4.1. Medical Data-Set
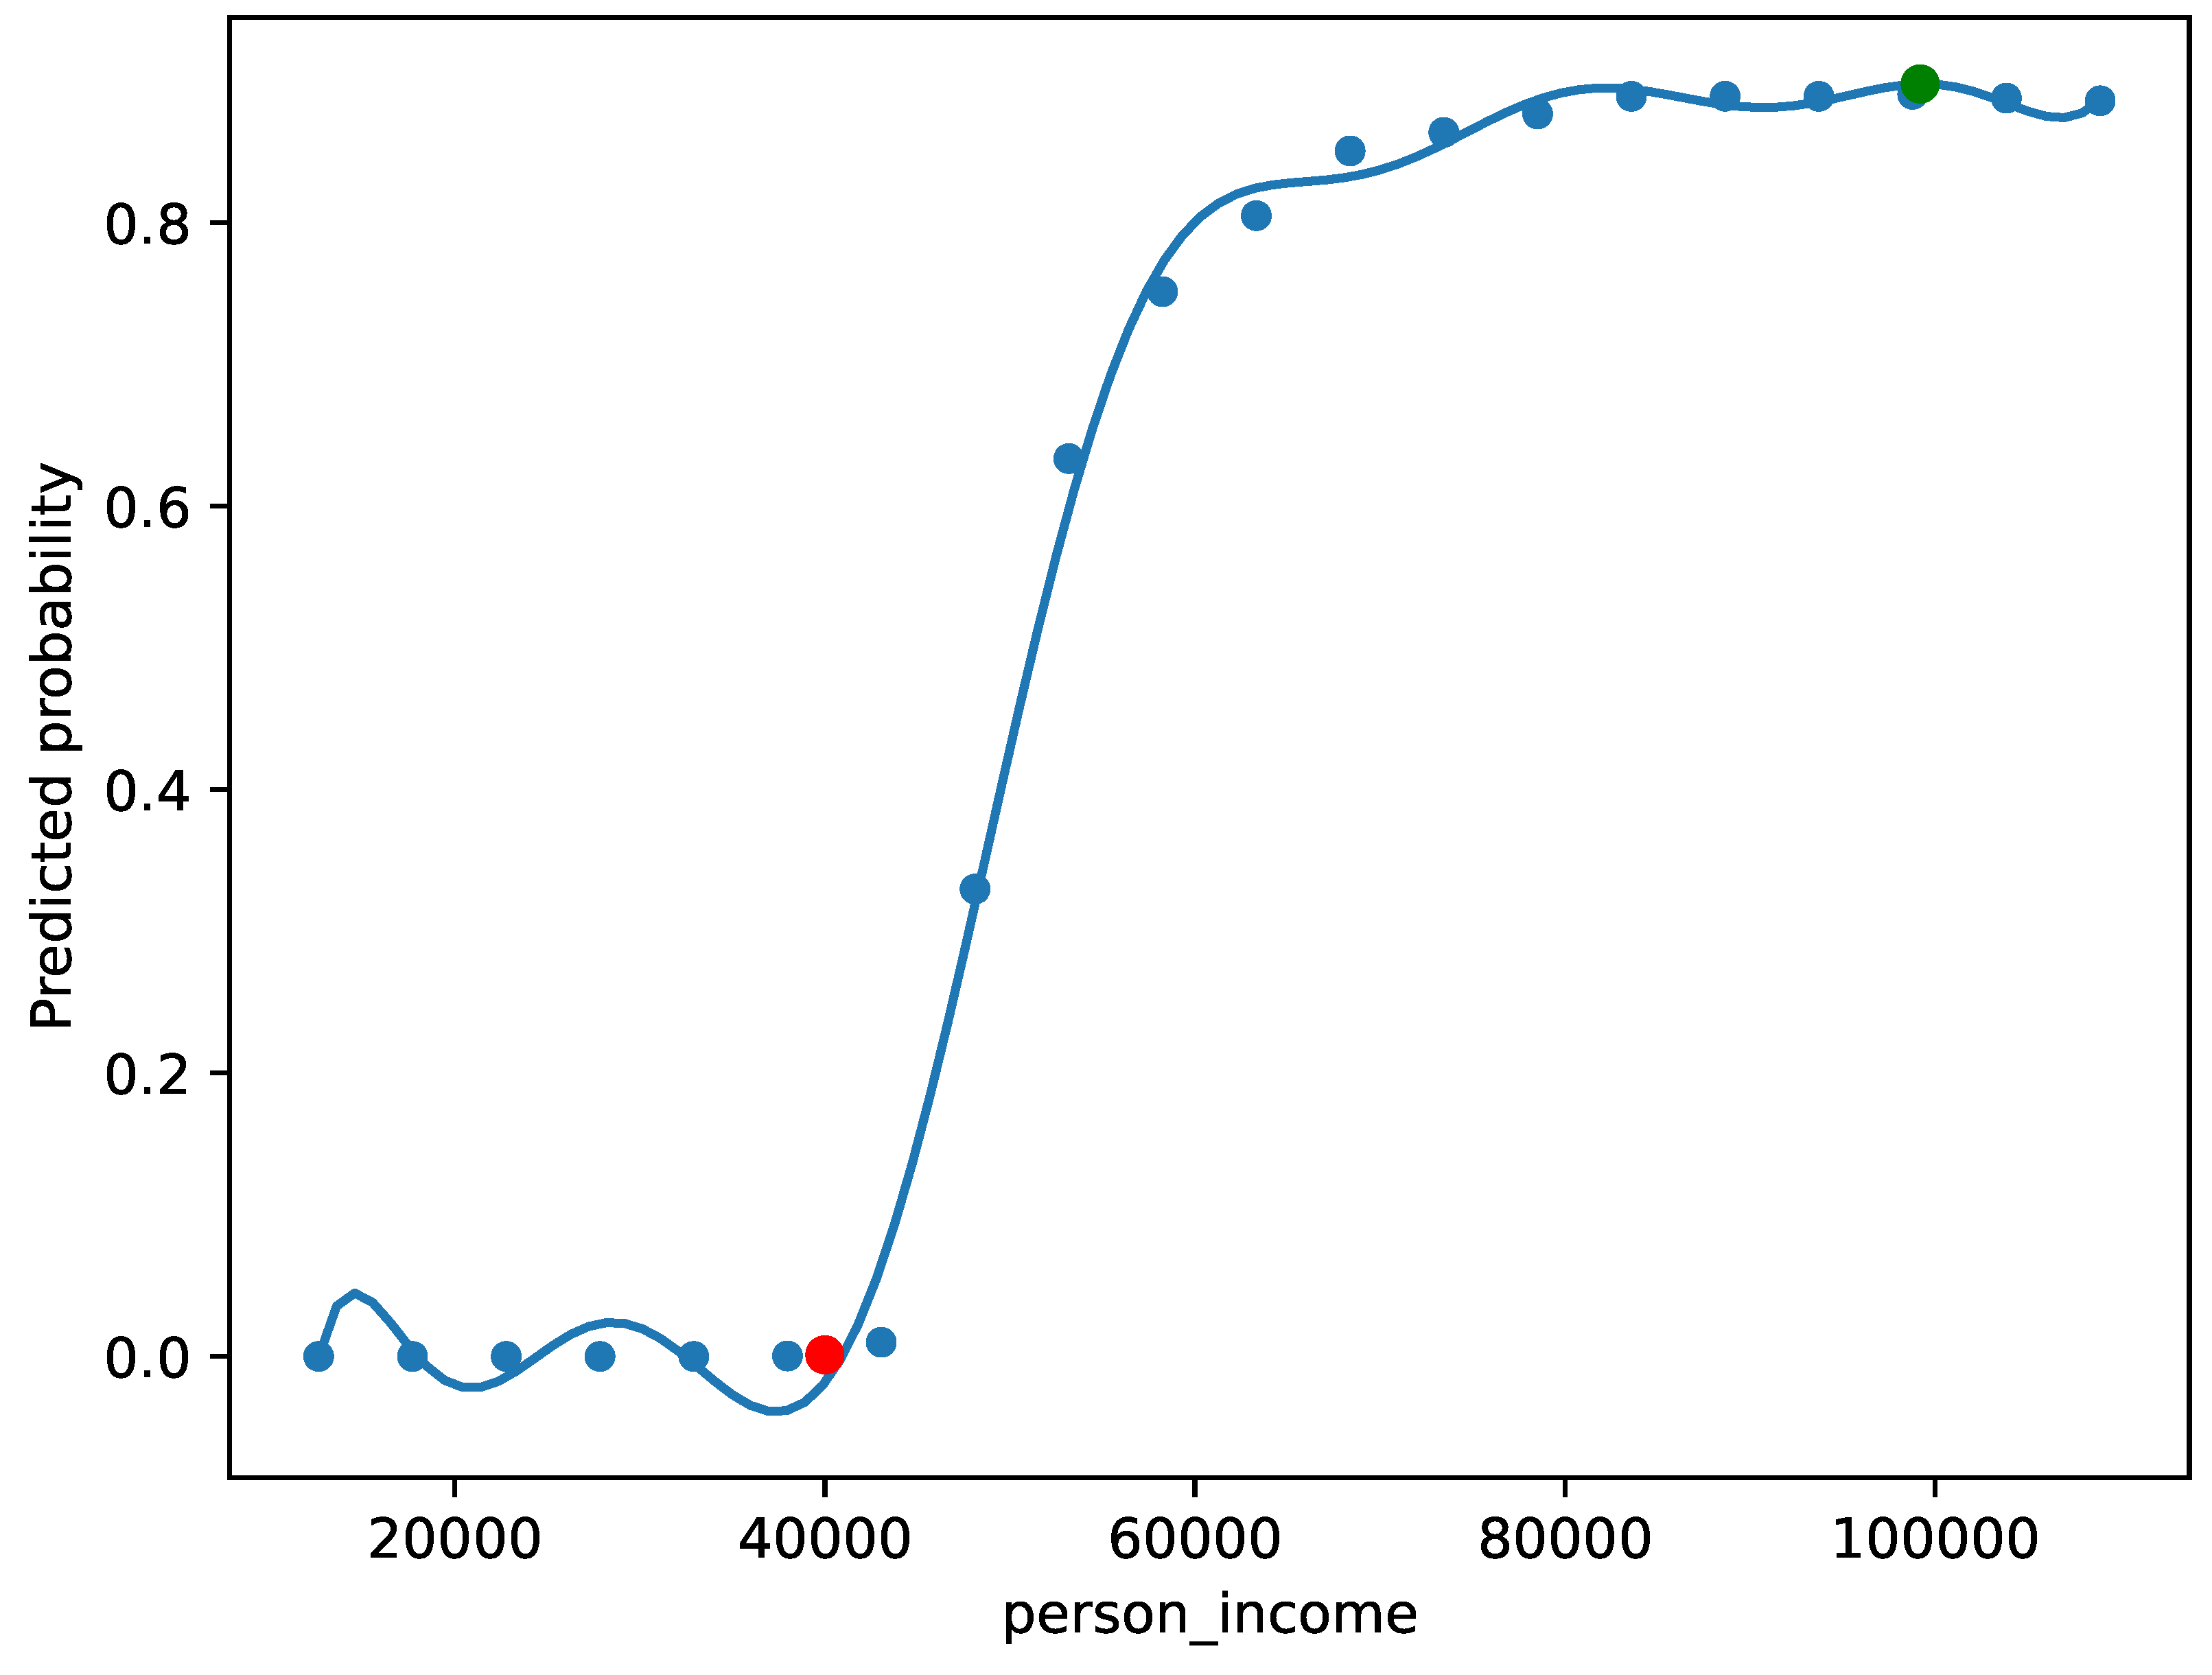
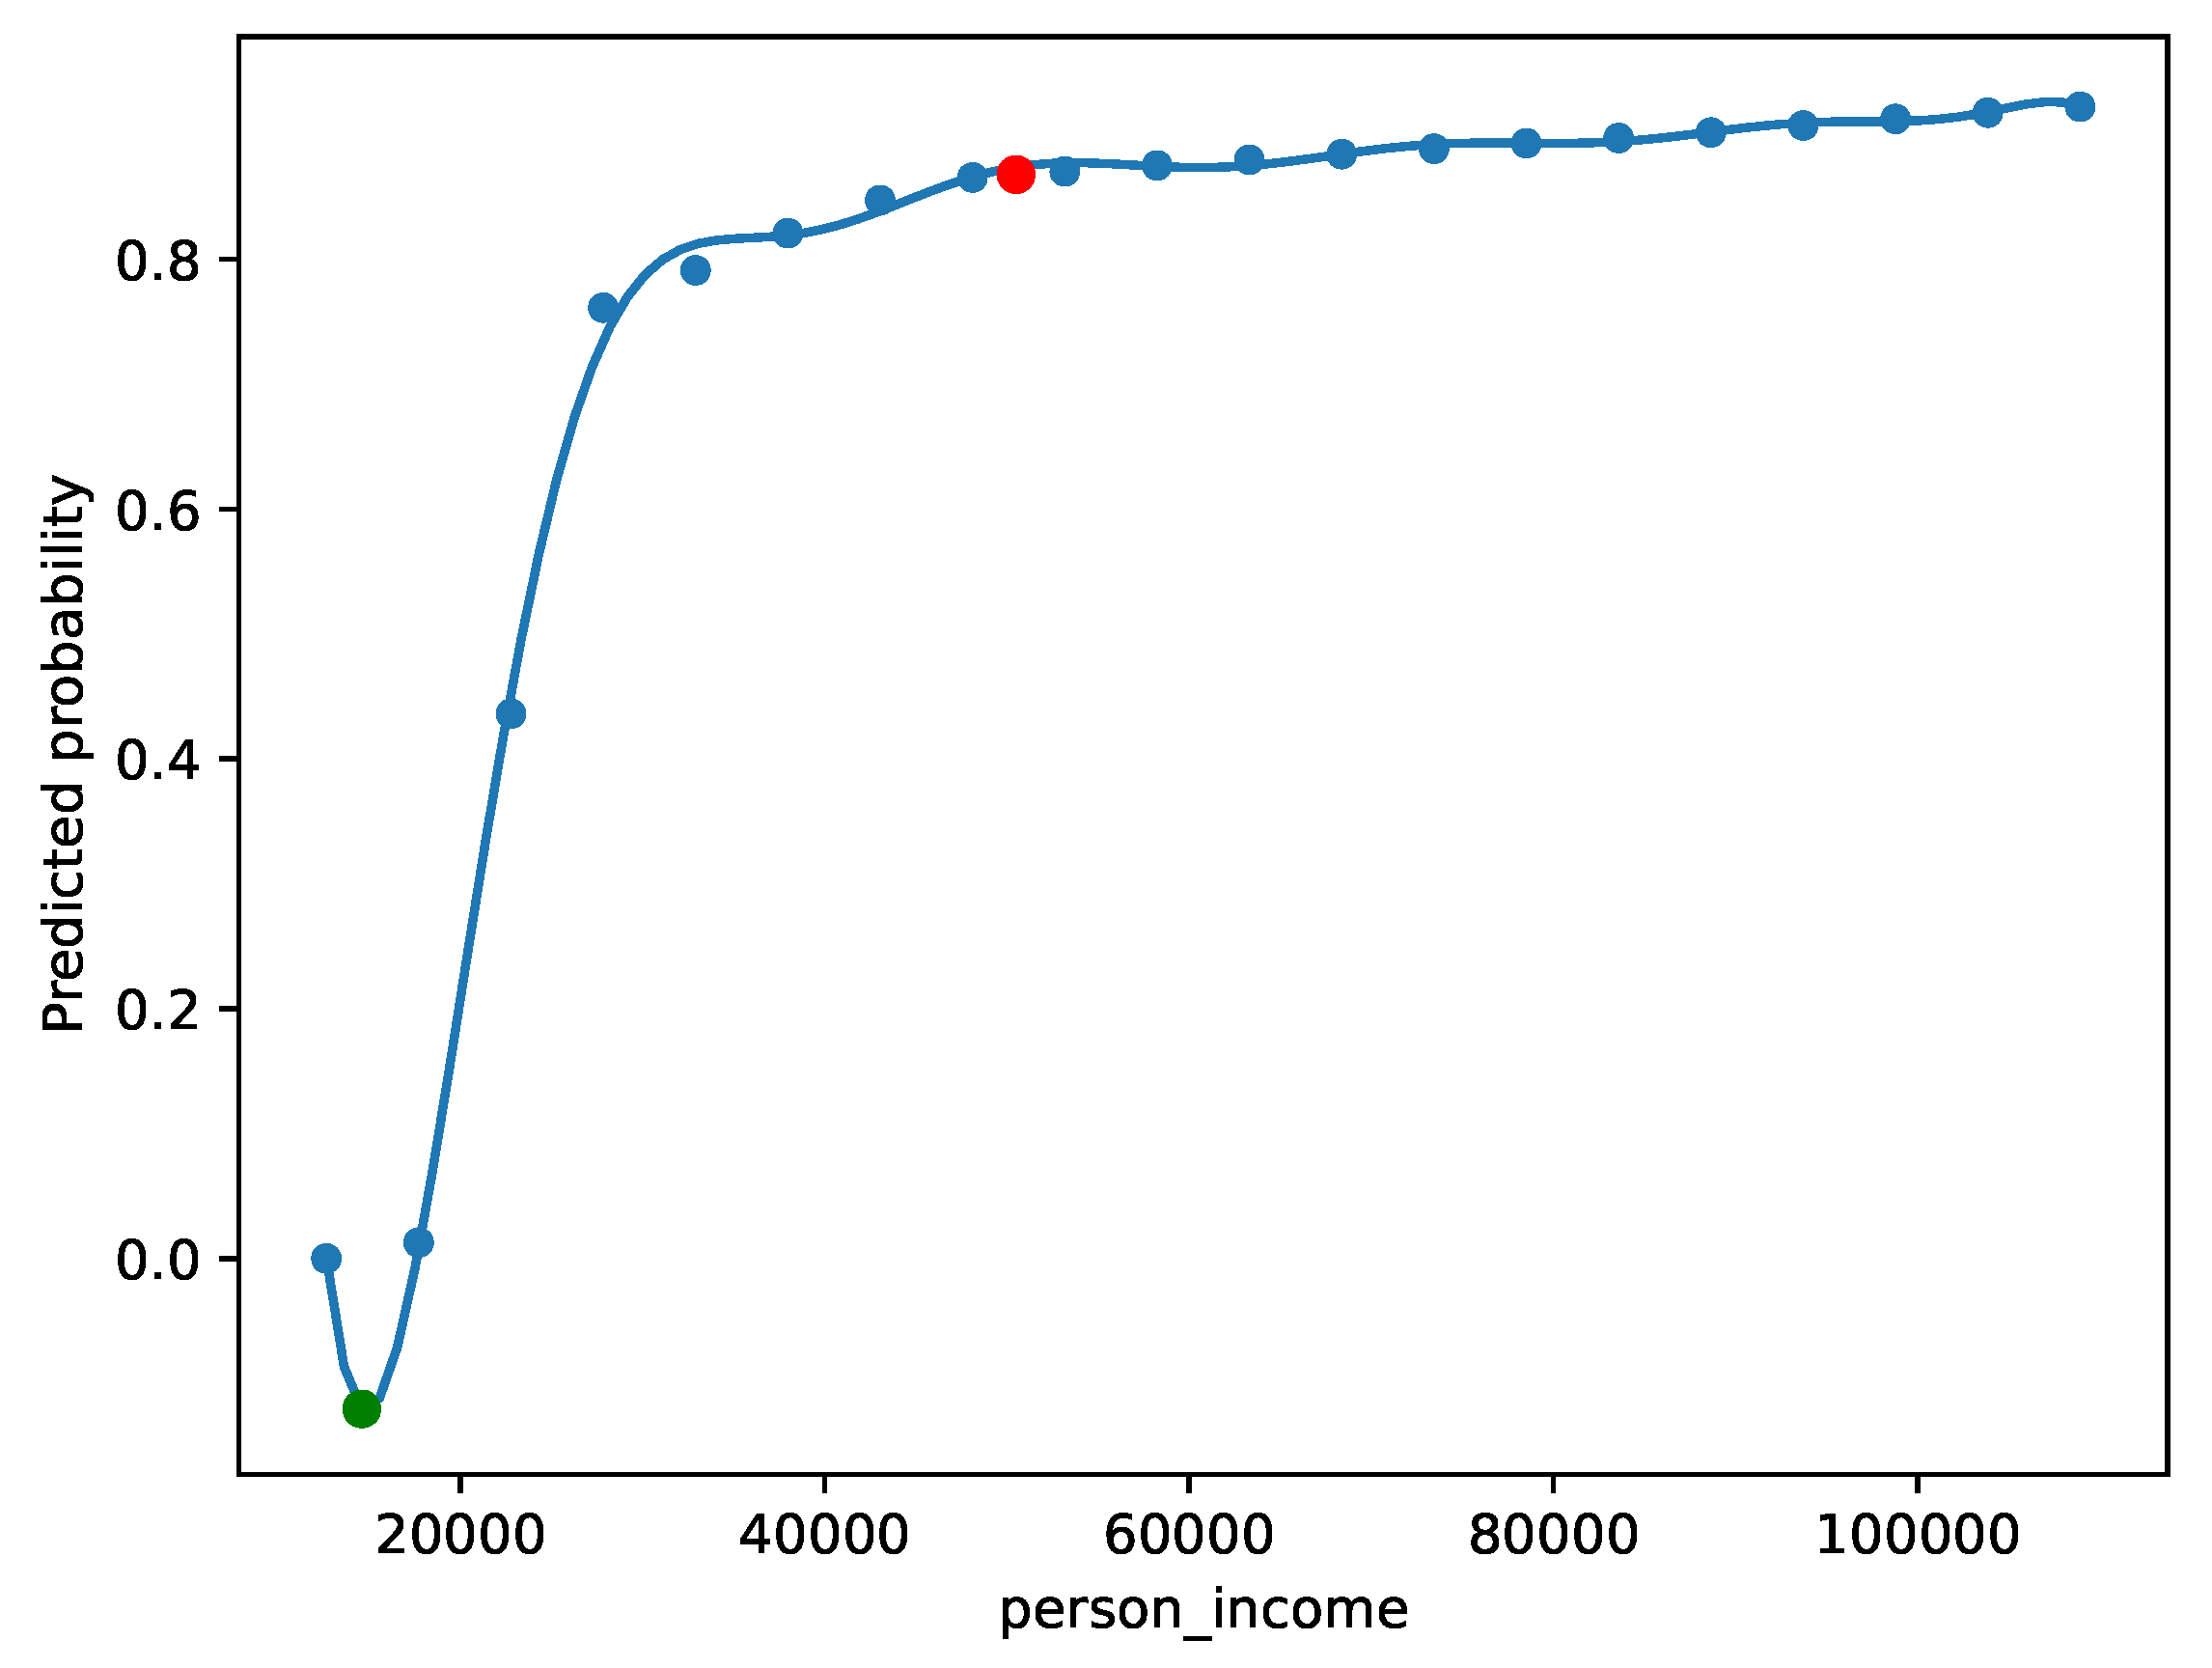
4.2. Financial Data-Set
4.2.1. Qualitative Evaluation and Complex Narratives

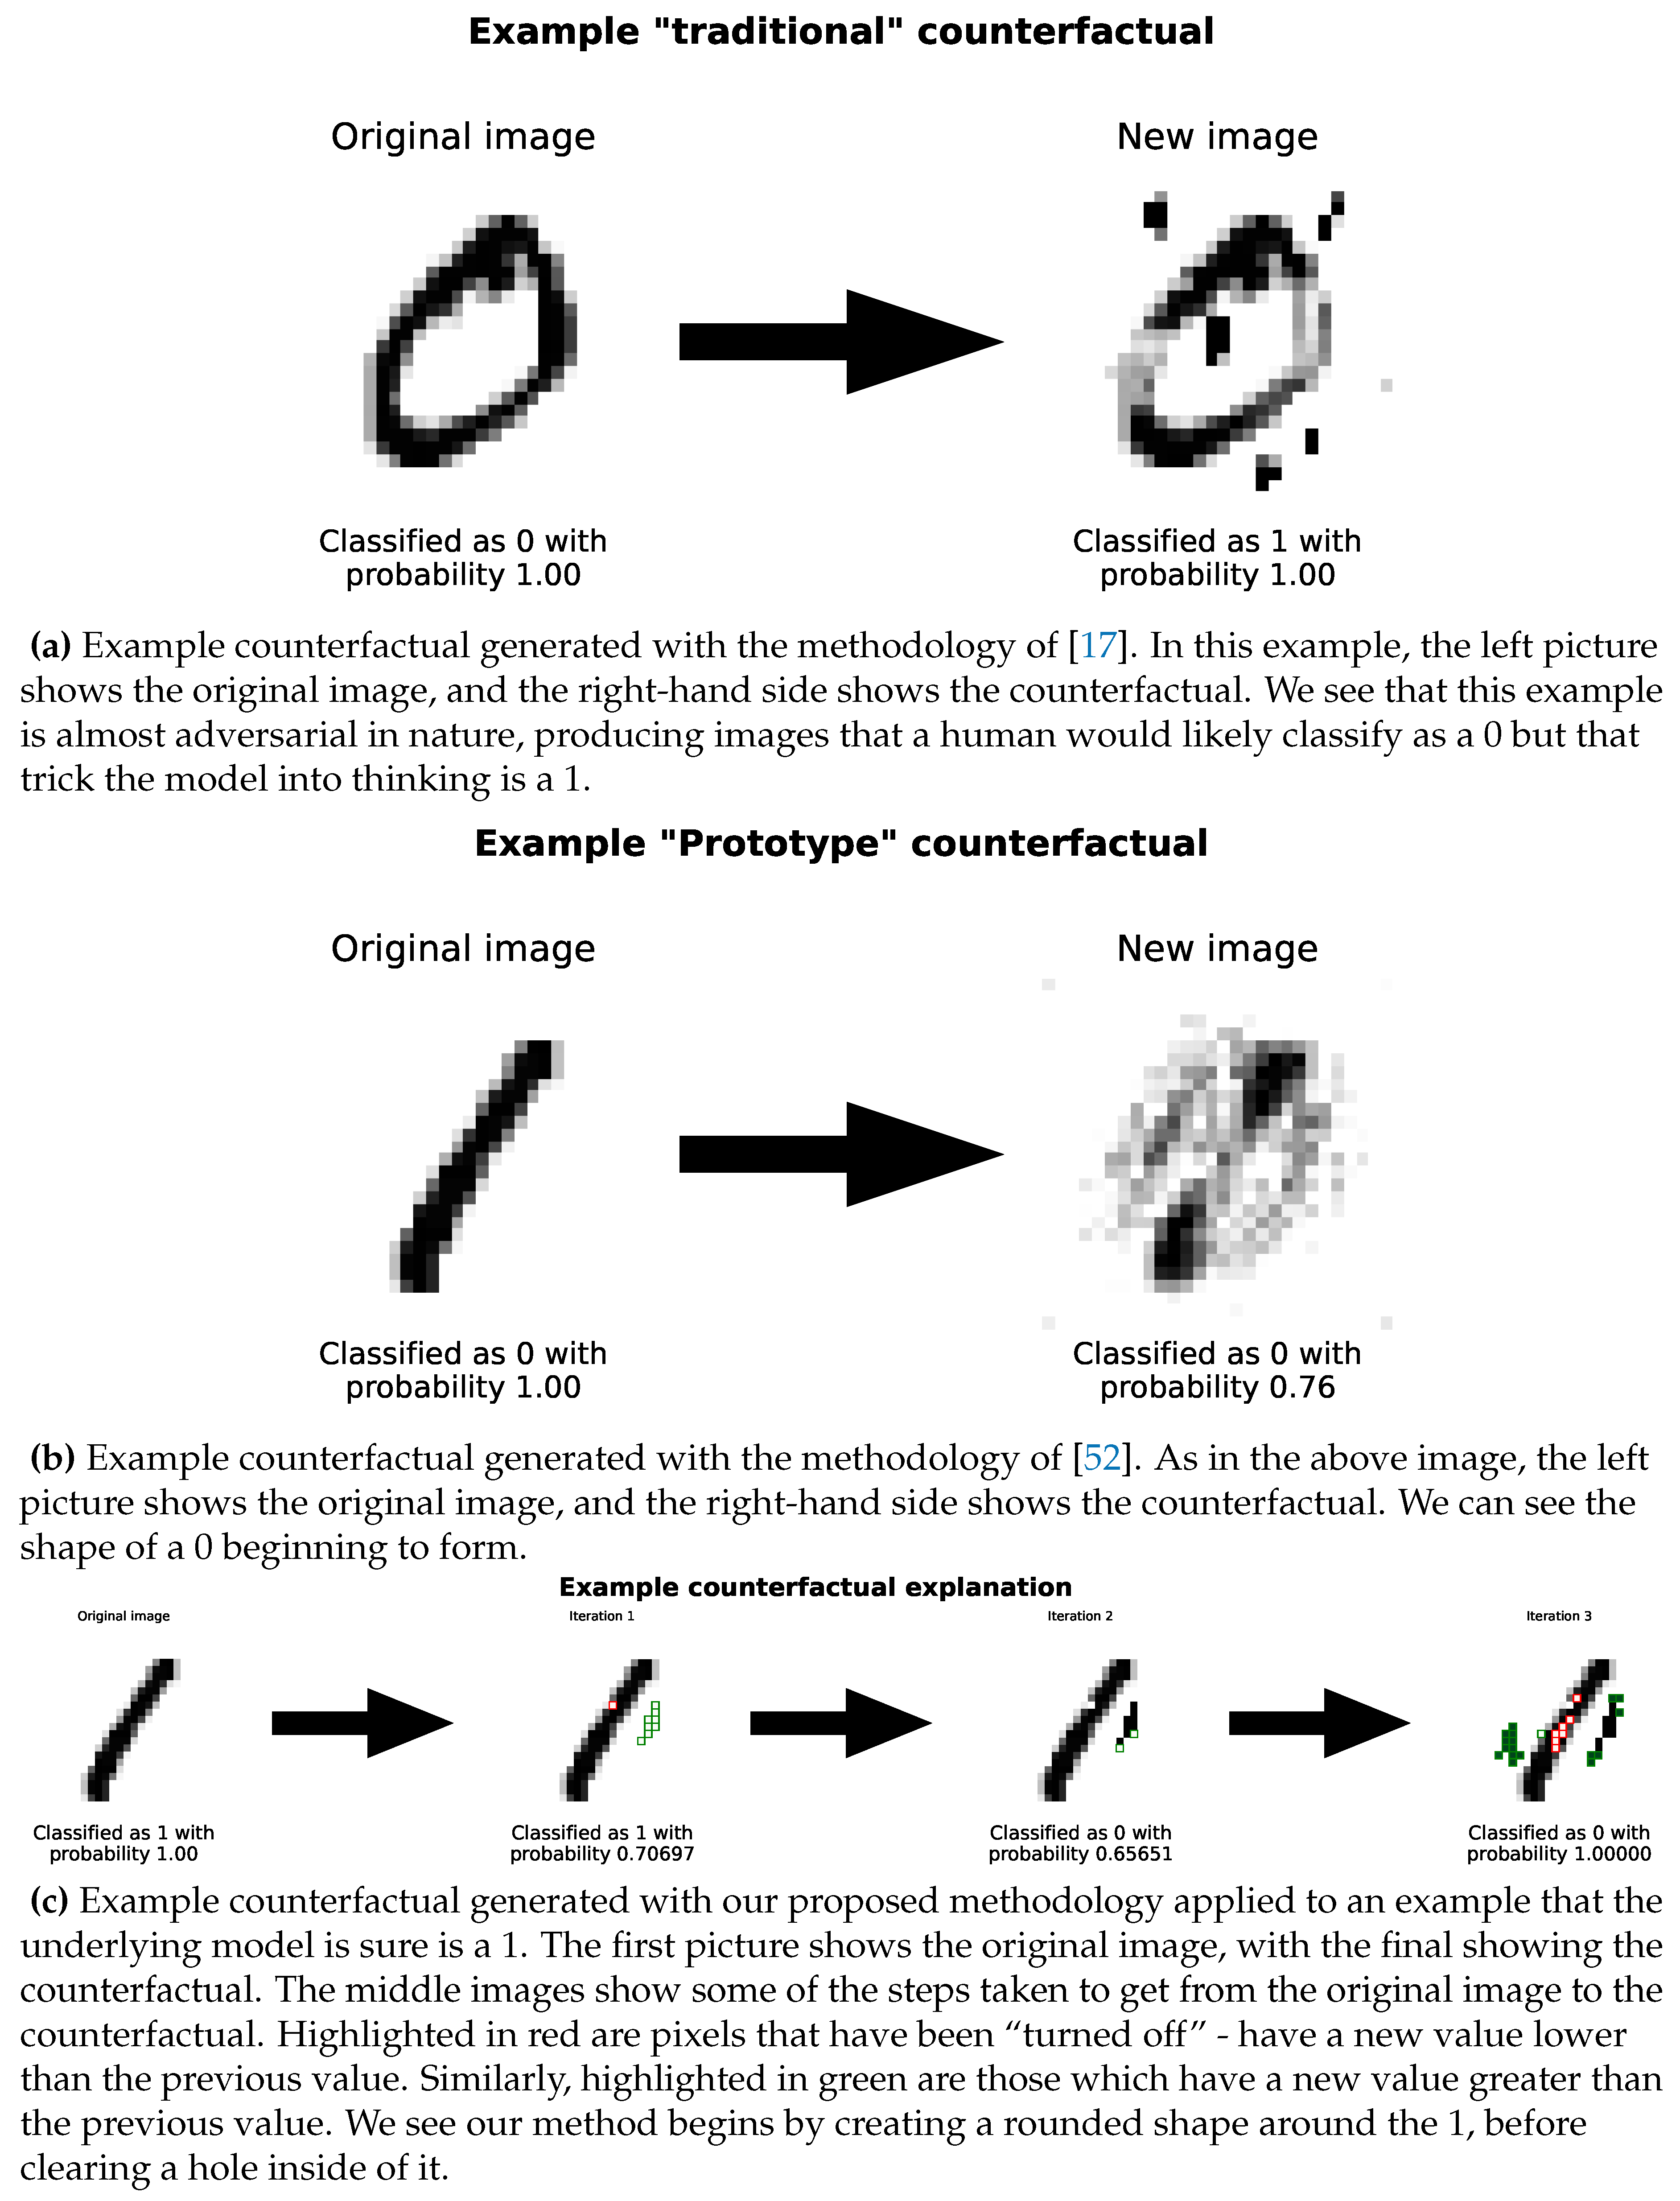
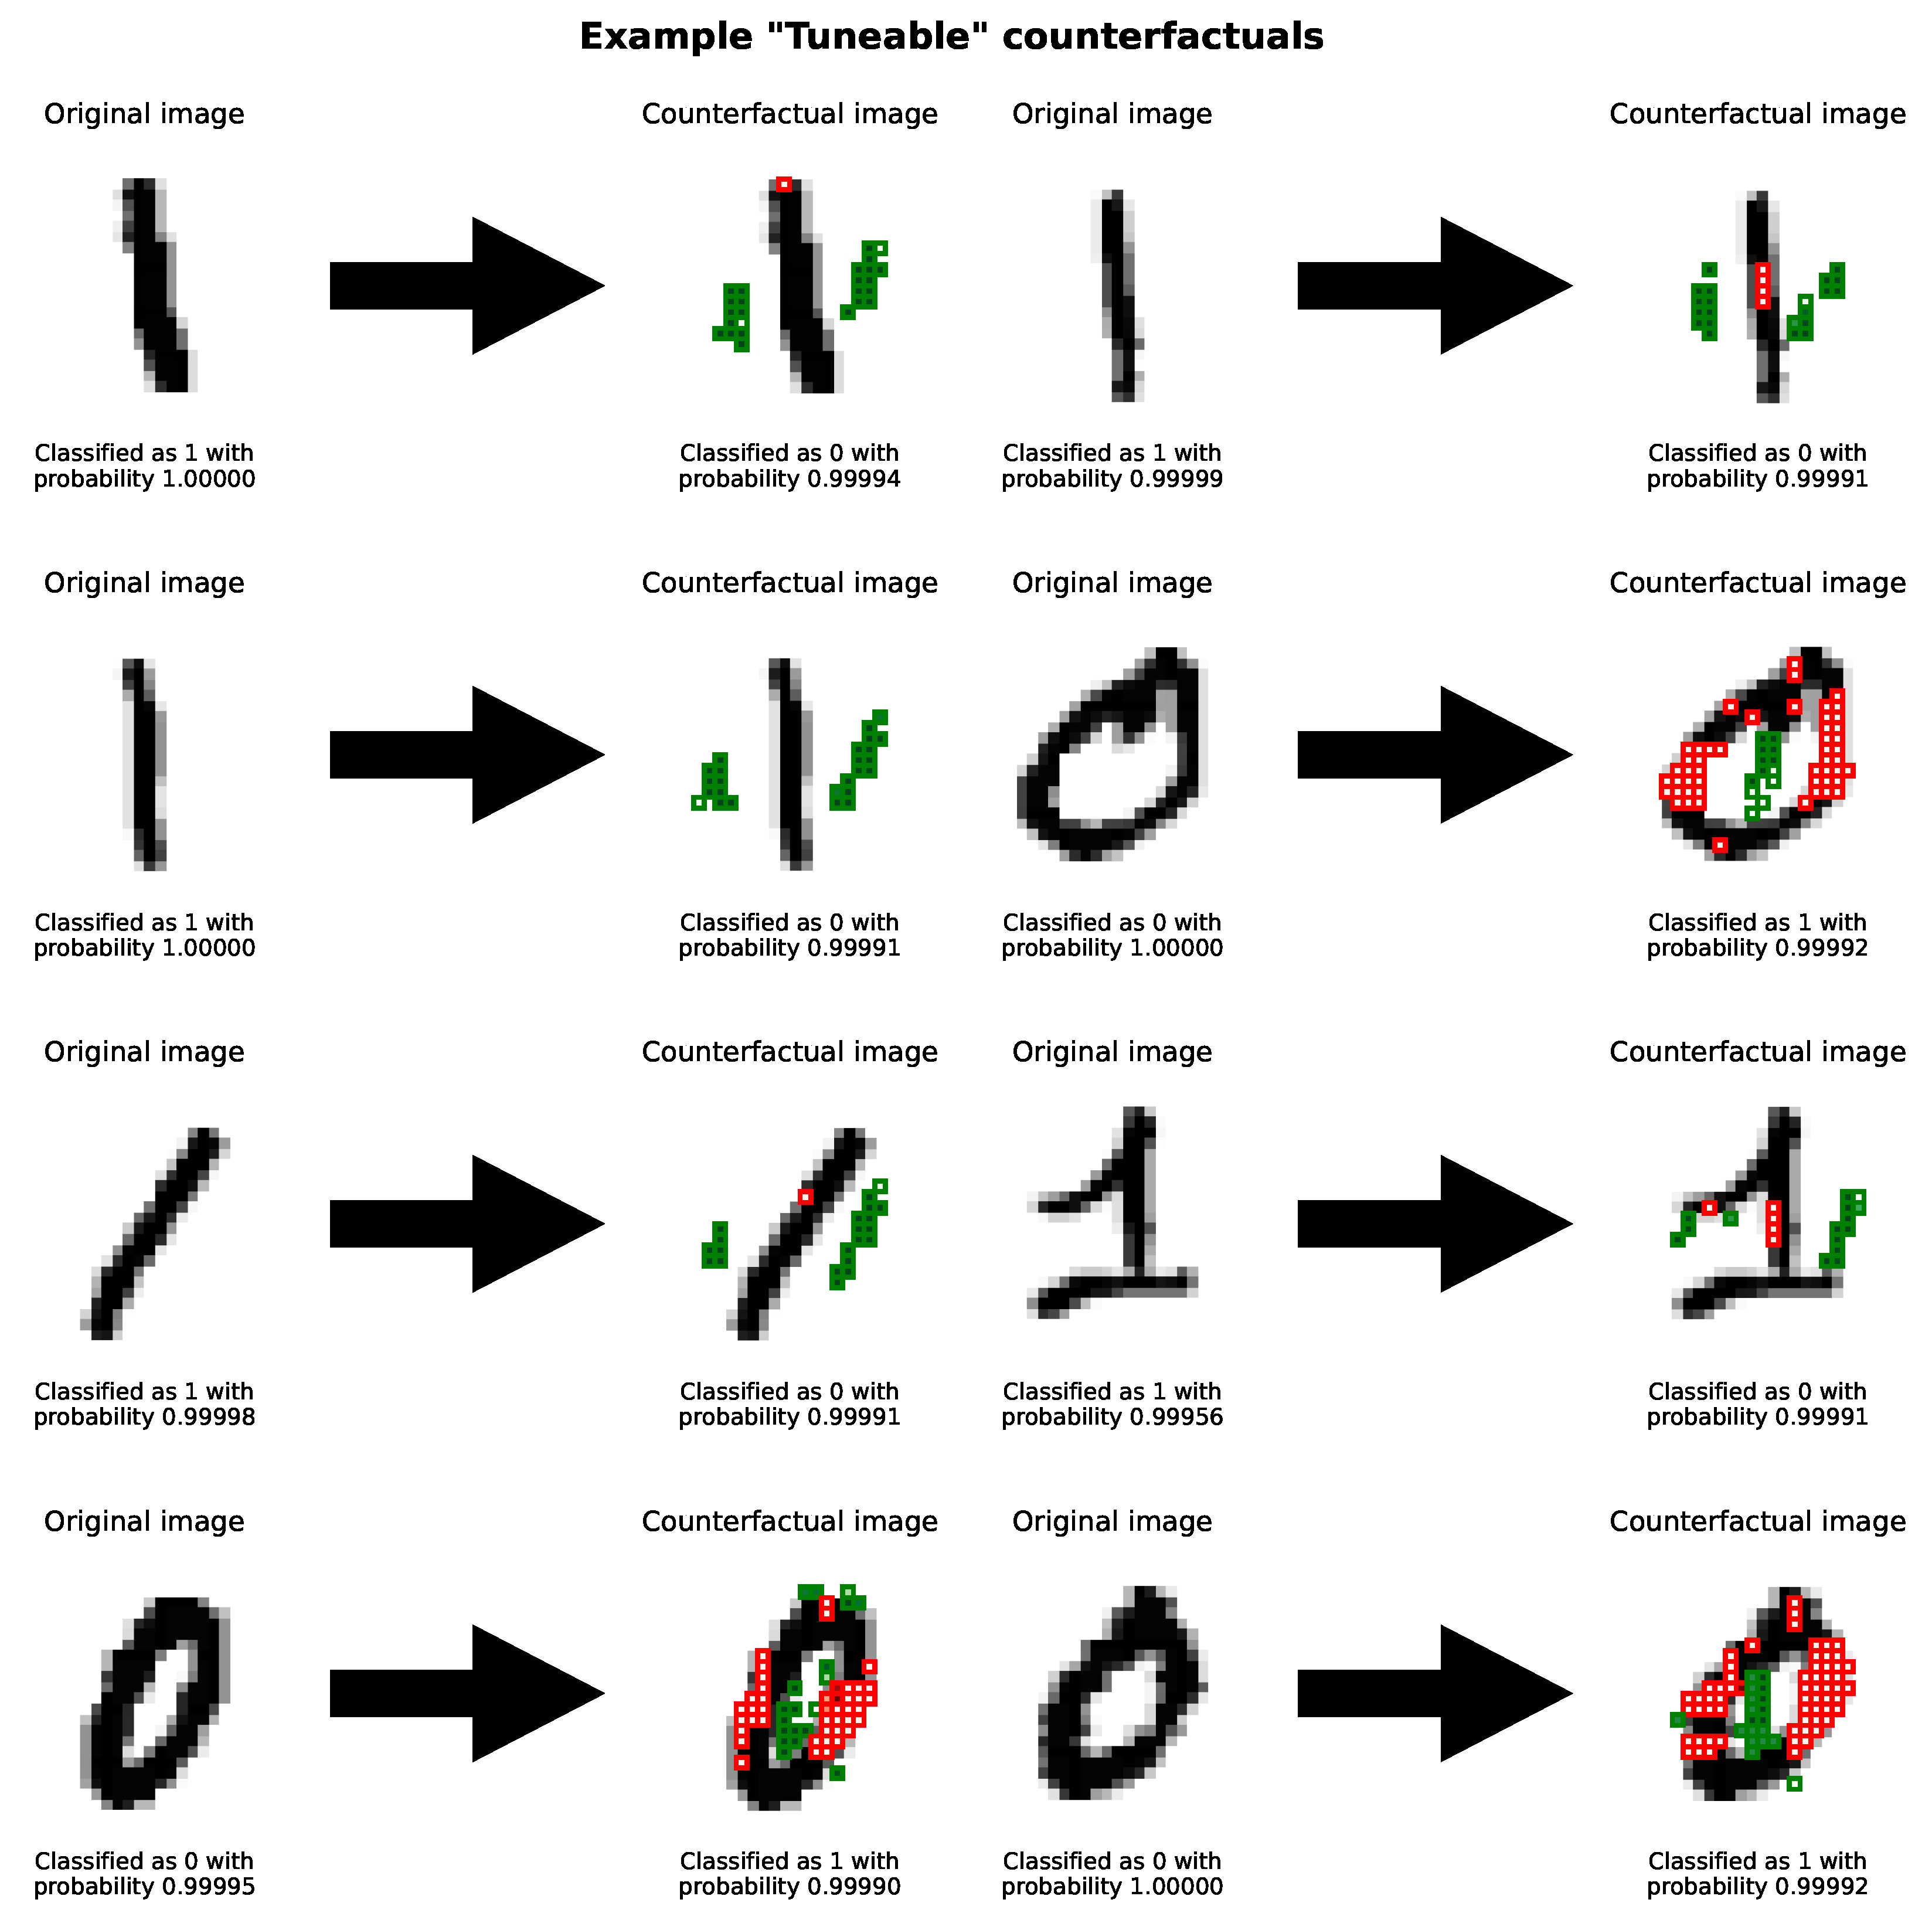
4.3. Image Dataset
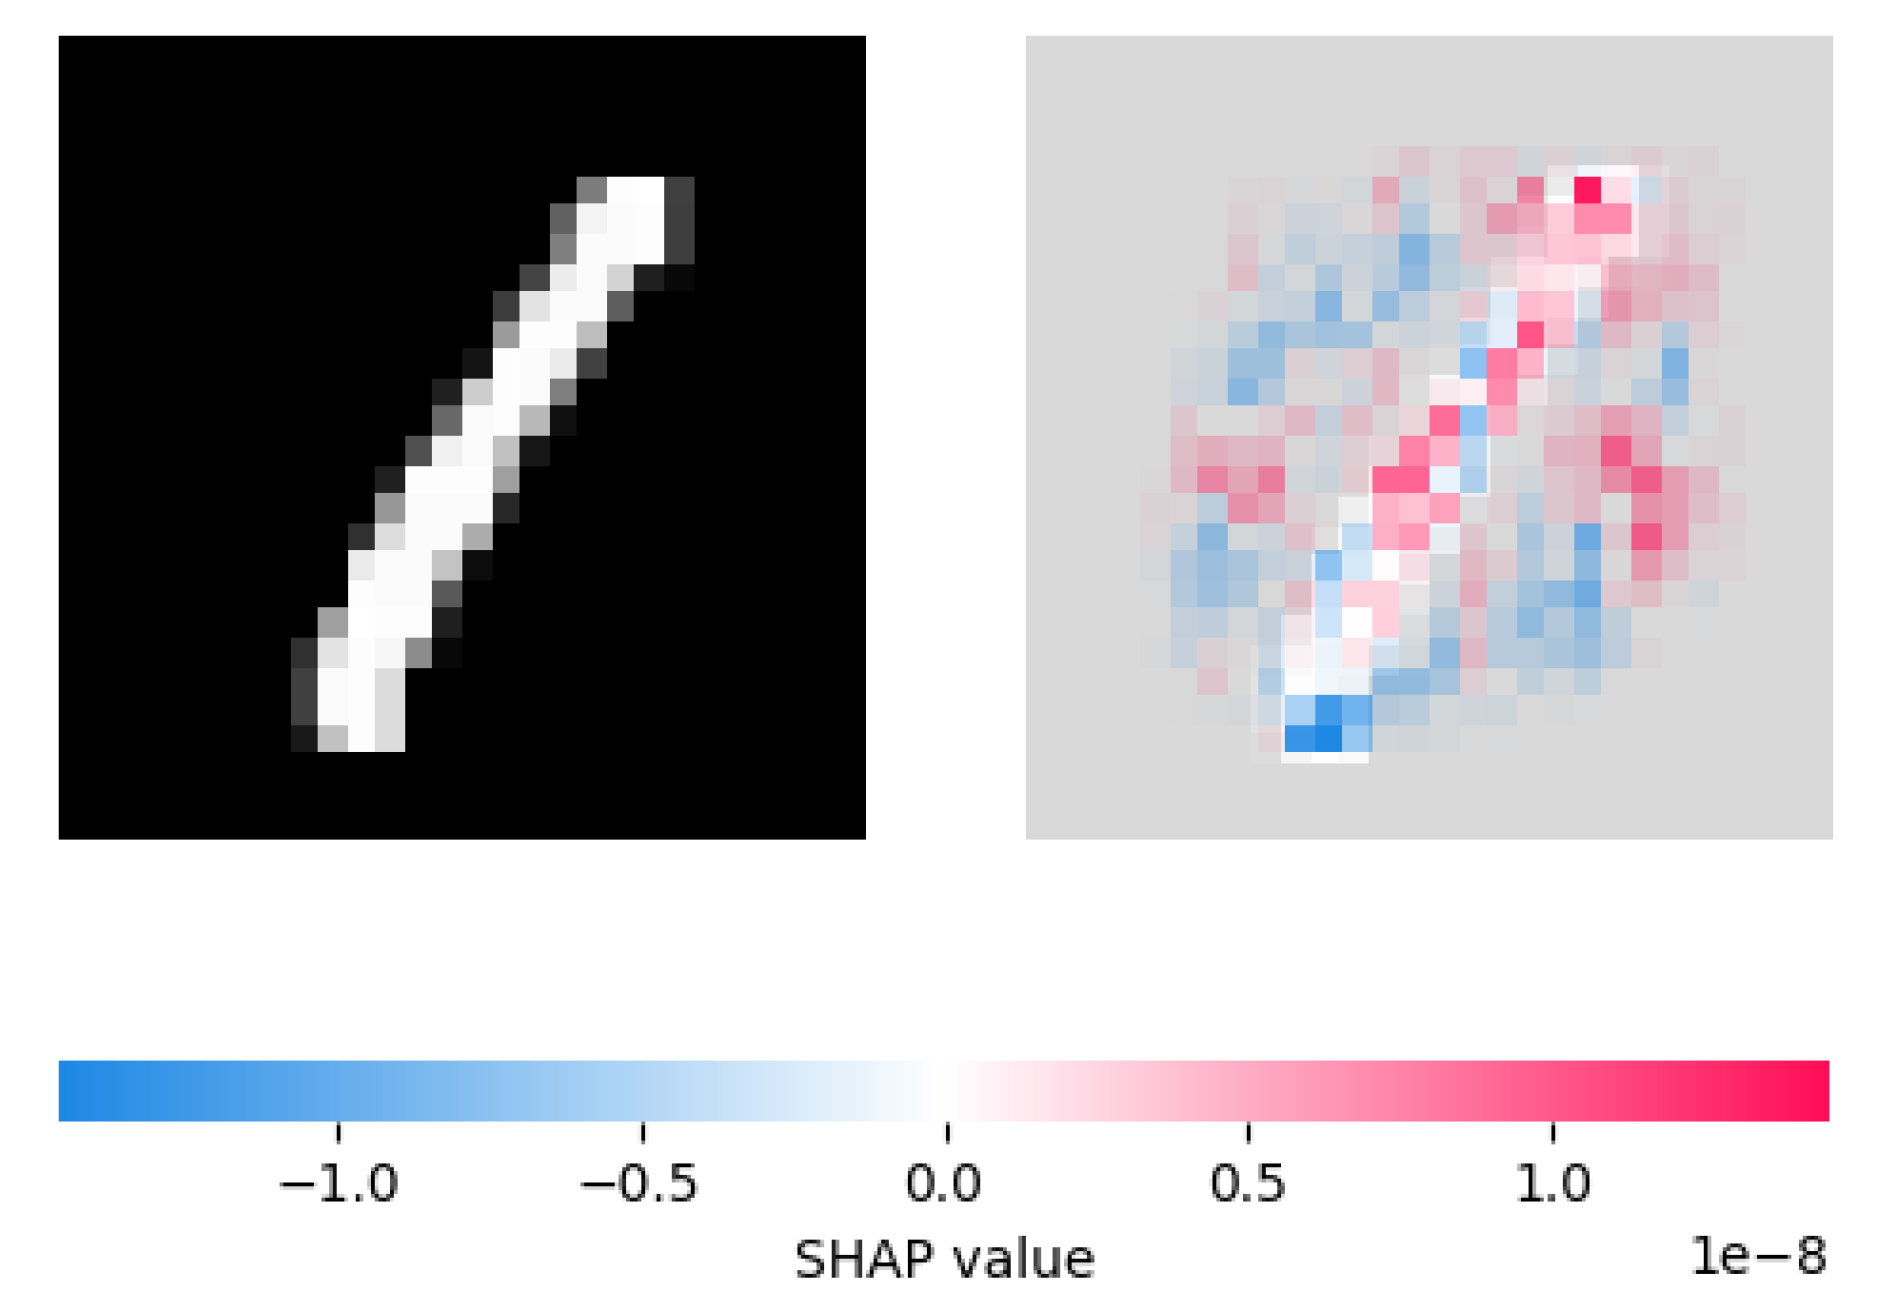
4.3.1. Comparison with SHAP
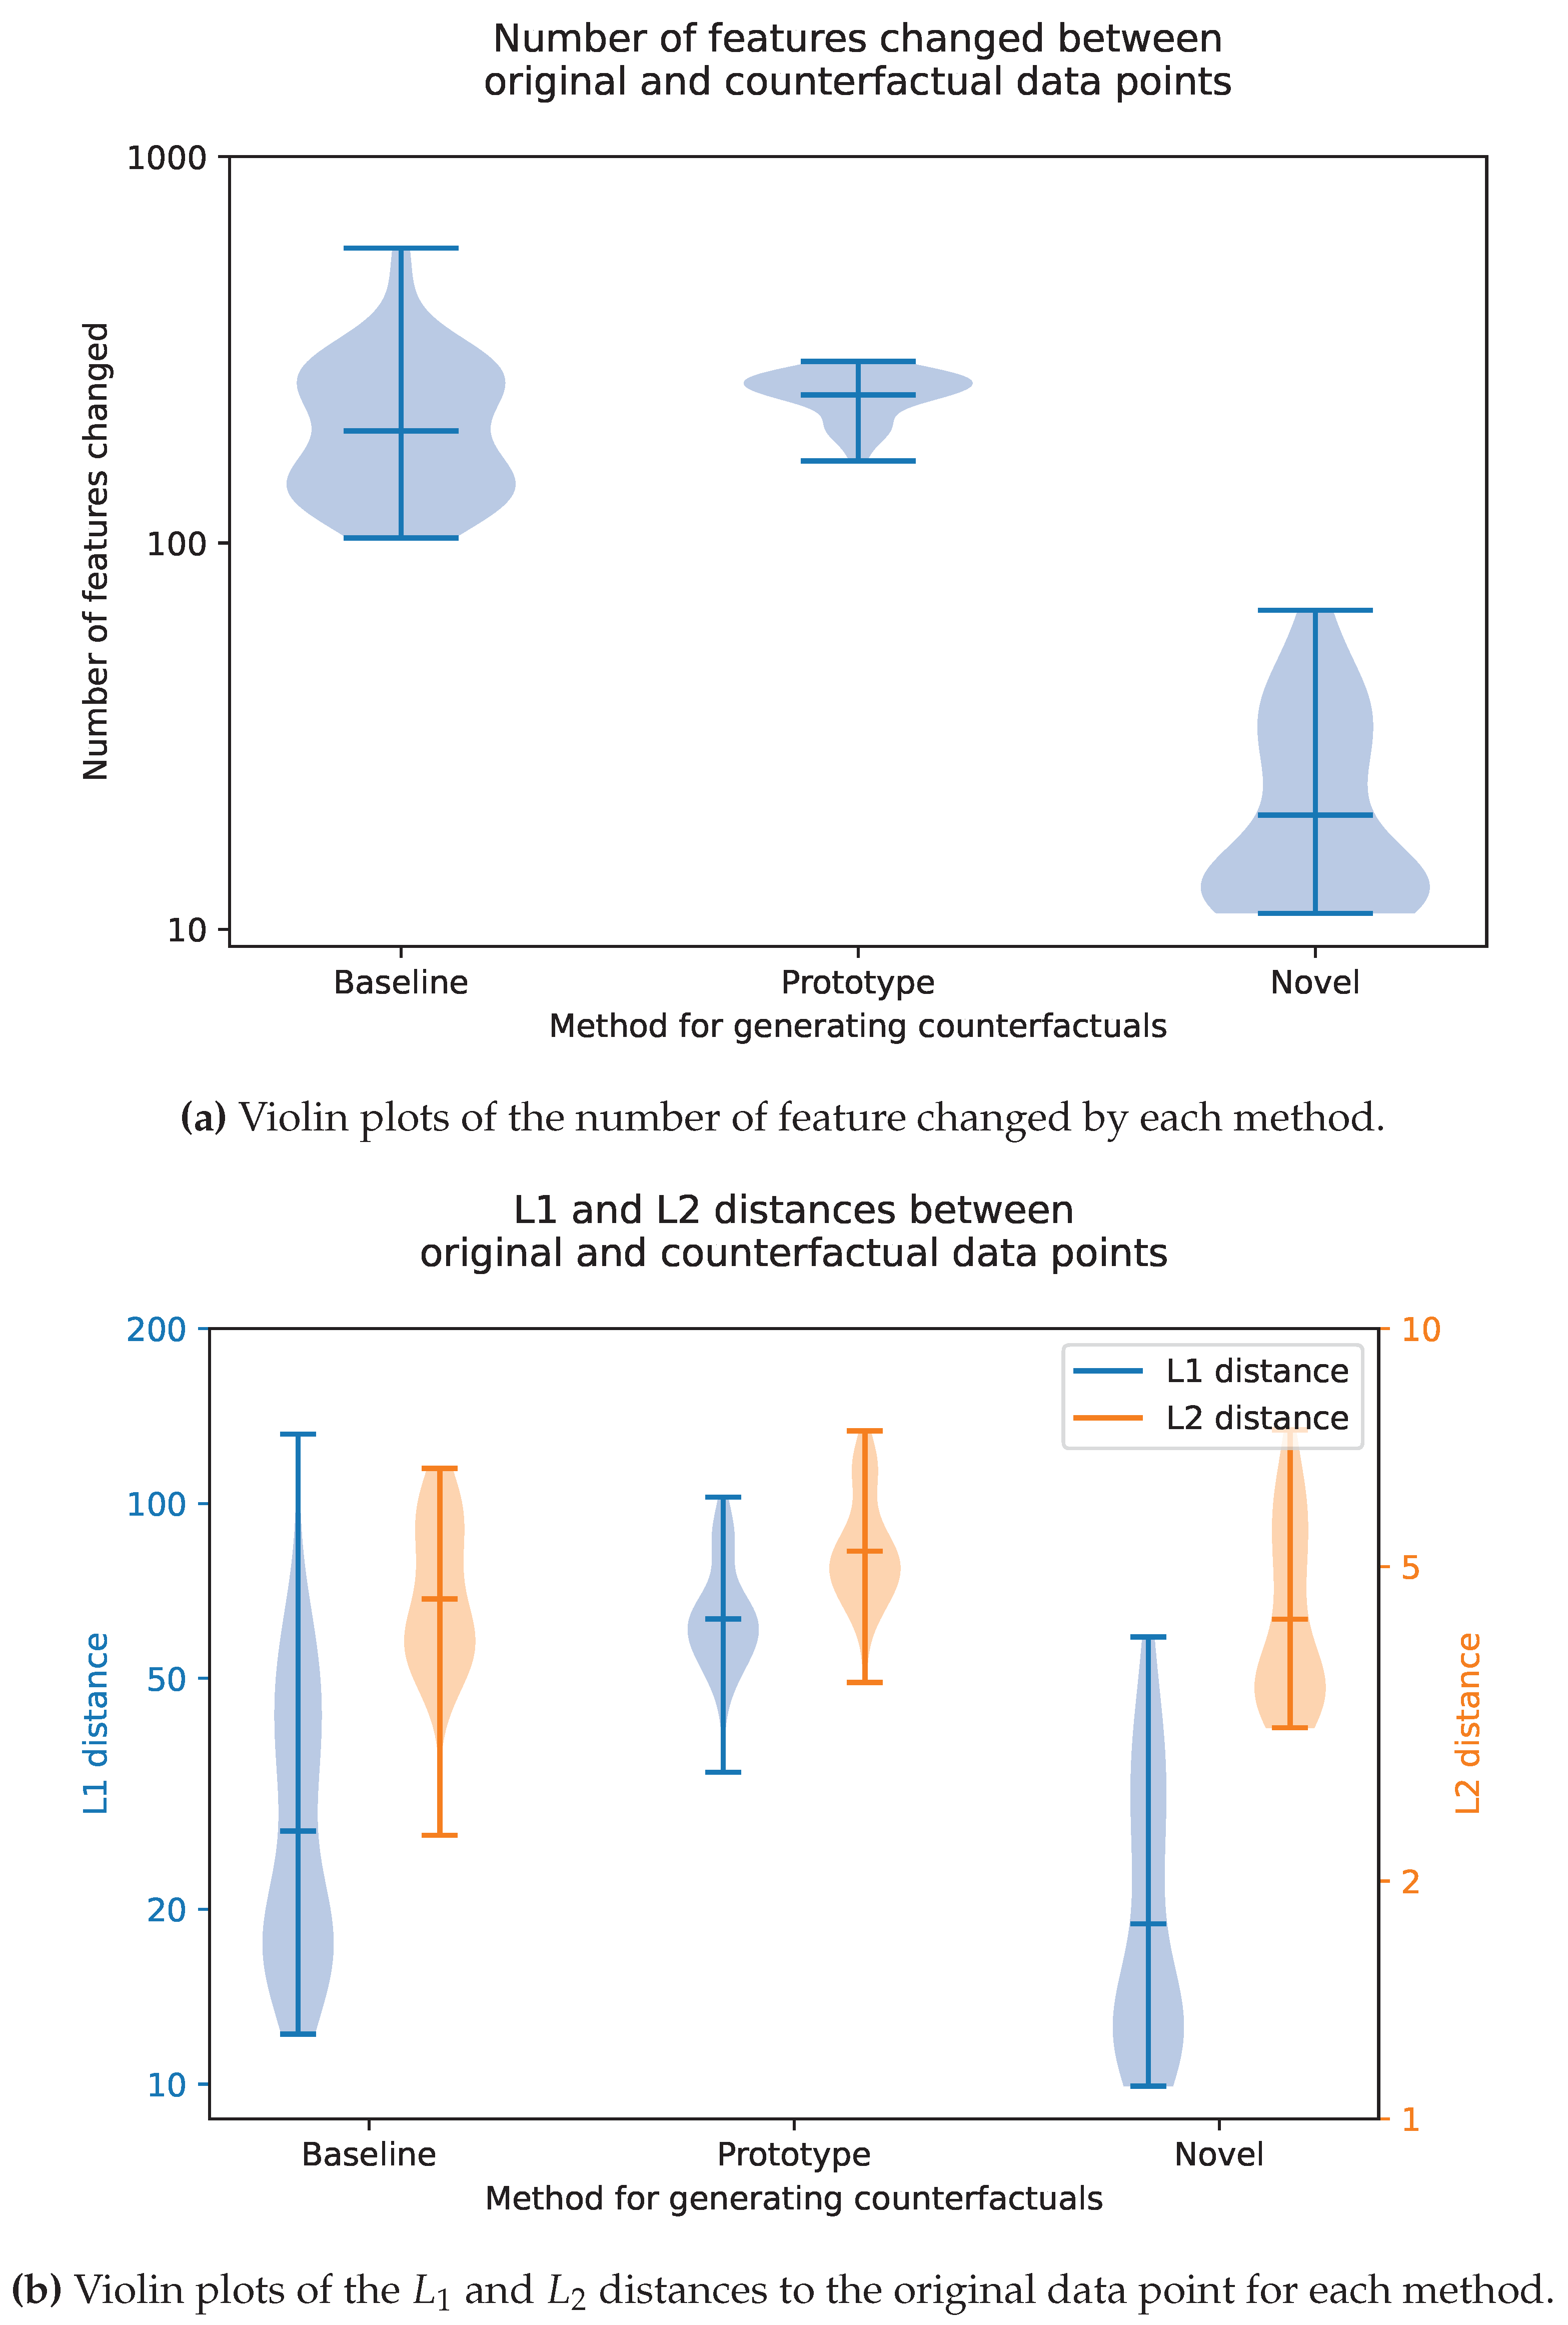
4.4. Quantitative Evaluations
5. Conclusions
5.1. Key Contributions
5.2. Limitations and Future Work
Conflicts of Interest
Data Availability Statement
Author Contributions
Funding
References
- Molnar, C. Interpretable Machine Learning; Independently published, 2023.
- Castelvecchi, D. Can we open the black box of AI? Nature News 2016, 538, 20. [Google Scholar] [CrossRef] [PubMed]
- Lundberg, S. slundberg/shap, 2023. original-date: 2016-11-22T19:17:08Z.
- Ribeiro, M.T.; Singh, S.; Guestrin, C. "Why Should I Trust You?": Explaining the Predictions of Any Classifier, 2016. arXiv:1602.04938.
- Office of Ron Wyden. Algorithmic Accountability Act of 2022 One-Pager. Technical report, Office of Ron Wyden, 2022.
- Ramakrishnan, G.; Lee, Y.C.; Albarghouthi, A. Synthesizing Action Sequences for Modifying Model Decisions. Proceedings of the AAAI Conference on Artificial Intelligence 2020, 34, 5462–5469. [Google Scholar] [CrossRef]
- Allen, D.M.W.a.J.R. How artificial intelligence is transforming the world, 2018.
- Gibbons, S. 2023 Business Predictions As AI And Automation Rise In Popularity, 2023. Section: Entrepreneurs.
- Islam, M.R.; Ahmed, M.U.; Barua, S.; Begum, S. A Systematic Review of Explainable Artificial Intelligence in Terms of Different Application Domains and Tasks. Applied Sciences 2022, 12, 1353. [Google Scholar] [CrossRef]
- Lundberg, S.M.; Lee, S. A unified approach to interpreting model predictions. CoRR 2017, abs/1705.07874, [1705.07874].
- Zhou, B.; Khosla, A.; Lapedriza, A.; Oliva, A.; Torralba, A. Learning Deep Features for Discriminative Localization, 2015. arXiv:1512.04150.
- Koh, P.W.; Nguyen, T.; Tang, Y.S.; Mussmann, S.; Pierson, E.; Kim, B.; Liang, P. Concept Bottleneck Models, 2020. arXiv:2007.04612.
- Towards Automatic Concept-based Explanations, 2019. arXiv:1902.03129 [cs, stat]. [CrossRef]
- Yeh, C.K.; Kim, B.; Arik, S.; Li, C.L.; Pfister, T.; Ravikumar, P. On Completeness-aware Concept-Based Explanations in Deep Neural Networks. In Proceedings of the Advances in Neural Information Processing Systems. Curran Associates, Inc., 2020, Vol. 33, pp. 20554–20565.
- Banerjee, S.; Lio, P.; Jones, P.B.; Cardinal, R.N. A class-contrastive human-interpretable machine learning approach to predict mortality in severe mental illness. npj Schizophrenia 2021 7:1 2021, 7, 1–13. [Google Scholar] [CrossRef]
- Lash, M.T.; Lin, Q.; Street, W.N.; Robinson, J.G.; Ohlmann, J.W. Generalized Inverse Classification. CoRR 2016, abs/1610.01675, [1610.01675].
- Wachter, S.; Mittelstadt, B.; Russell, C. Counterfactual Explanations Without Opening the Black Box: Automated Decisions and the GDPR, 2017. Place: Rochester, NY Type: SSRN Scholarly Paper. [CrossRef]
- Guidotti, R. Counterfactual explanations and how to find them: literature review and benchmarking. Data Mining and Knowledge Discovery 2022. [Google Scholar] [CrossRef]
- Kingma, D.P.; Ba, J. Adam: A Method for Stochastic Optimization. arXiv 2017. [Google Scholar] [CrossRef]
- Powell, M.J.D. On search directions for minimization algorithms. Mathematical Programming 1973, 4, 193–201. [Google Scholar] [CrossRef]
- Verma, S.; Boonsanong, V.; Hoang, M.; Hines, K.E.; Dickerson, J.P.; Shah, C. Counterfactual Explanations and Algorithmic Recourses for Machine Learning: A Review. arXiv 2022. [Google Scholar] [CrossRef]
- Tolomei, G.; Silvestri, F.; Haines, A.; Lalmas, M. Interpretable Predictions of Tree-based Ensembles via Actionable Feature Tweaking. In Proceedings of the Proceedings of the 23rd ACM SIGKDD International Conference on Knowledge Discovery and Data Mining, Halifax NS Canada, 2017; pp. 465–474. [CrossRef]
- Carreira-Perpiñán, M.Á.; Hada, S.S. Counterfactual Explanations for Oblique Decision Trees:Exact, Efficient Algorithms. Proceedings of the AAAI Conference on Artificial Intelligence 2021, 35, 6903–6911. [Google Scholar] [CrossRef]
- Lucic, A.; Oosterhuis, H.; Haned, H.; de Rijke, M. FOCUS: Flexible Optimizable Counterfactual Explanations for Tree Ensembles, 2021. arXiv:1911.12199.
- Russell, C. Efficient Search for Diverse Coherent Explanations. In Proceedings of the Proceedings of the Conference on Fairness, Accountability, and Transparency, Atlanta GA USA, 2019; pp. 20–28. [CrossRef]
- Ustun, B.; Spangher, A.; Liu, Y. Actionable Recourse in Linear Classification. In Proceedings of the Proceedings of the Conference on Fairness, Accountability, and Transparency, Atlanta GA USA, 2019; pp. 10–19. [CrossRef]
- Fernández, R.R.; Martín de Diego, I.; Aceña, V.; Fernández-Isabel, A.; Moguerza, J.M. Random forest explainability using counterfactual sets. Information Fusion 2020, 63, 196–207. [Google Scholar] [CrossRef]
- Ho, T.K. Random decision forests. In Proceedings of the Proceedings of 3rd International Conference on Document Analysis and Recognition, 1995, Vol. 1, pp. 278–282 vol.1. [CrossRef]
- Cui, Z.; Chen, W.; He, Y.; Chen, Y. Optimal Action Extraction for Random Forests and Boosted Trees. In Proceedings of the Proceedings of the 21th ACM SIGKDD International Conference on Knowledge Discovery and Data Mining, Sydney NSW Australia, 2015; pp. 179–188. [CrossRef]
- Freund, Y.; Schapire, R.E. A Decision-Theoretic Generalization of On-Line Learning and an Application to Boosting. Journal of Computer and System Sciences 1997, 55, 119–139. [Google Scholar] [CrossRef]
- Friedman, J.H. Greedy Function Approximation: A Gradient Boosting Machine. The Annals of Statistics 2001, 29, 1189–1232, Publisher: Institute of Mathematical Statistics. [Google Scholar] [CrossRef]
- Laugel, T.; Lesot, M.J.; Marsala, C.; Renard, X.; Detyniecki, M. Comparison-Based Inverse Classification for Interpretability in Machine Learning. In Proceedings of the Information Processing and Management of Uncertainty in Knowledge-Based Systems. Theory and Foundations; Medina, J.; Ojeda-Aciego, M.; Verdegay, J.L.; Pelta, D.A.; Cabrera, I.P.; Bouchon-Meunier, B.; Yager, R.R., Eds., Cham, 2018; Communications in Computer and Information Science, pp. 100–111. [CrossRef]
- Dhurandhar, A.; Chen, P.Y.; Luss, R.; Tu, C.C.; Ting, P.; Shanmugam, K.; Das, P. Explanations based on the Missing: Towards Contrastive Explanations with Pertinent Negatives, 2018. arXiv:1802.07623.
- Dhurandhar, A.; Pedapati, T.; Balakrishnan, A.; Chen, P.Y.; Shanmugam, K.; Puri, R. Model Agnostic Contrastive Explanations for Structured Data, 2019. arXiv:1906.00117 [cs, stat].
- Beck, A.; Teboulle, M. A Fast Iterative Shrinkage-Thresholding Algorithm for Linear Inverse Problems. SIAM Journal on Imaging Sciences 2009, 2, 183–202, Publisher: Society for Industrial and Applied Mathematics. [Google Scholar] [CrossRef]
- Guidotti, R.; Monreale, A.; Ruggieri, S.; Pedreschi, D.; Turini, F.; Giannotti, F. Local Rule-Based Explanations of Black Box Decision Systems, 2018. arXiv:1805.10820 [cs].
- Dandl, S.; Molnar, C.; Binder, M.; Bischl, B. Multi-Objective Counterfactual Explanations. In Proceedings of the Parallel Problem Solving from Nature – PPSN XVI. Springer International Publishing, 2020, pp. 448–469. [CrossRef]
- Duong, T.D.; Li, Q.; Xu, G. Causality-based Counterfactual Explanation for Classification Models, 2023. arXiv:2105.00703 [cs].
- Van Looveren, A.; Klaise, J. Interpretable Counterfactual Explanations Guided by Prototypes, 2020. arXiv:1907.02584 [cs, stat].
- Jordan, J. Introduction to autoencoders., 2018.
- Kanamori, K.; Takagi, T.; Kobayashi, K.; Arimura, H. DACE: Distribution-Aware Counterfactual Explanation by Mixed-Integer Linear Optimization. In Proceedings of the Proceedings of the Twenty-Ninth International Joint Conference on Artificial Intelligence, Yokohama, Japan, 2020; pp. 2855–2862. [CrossRef]
- Mahalanobis, P.C. On the Generalised Distance in Statistics, 1936.
- Breunig, M.M.; Kriegel, H.P.; Ng, R.T.; Sander, J. LOF: Identifying Density-Based Local Outliers. SIGMOD Rec. 2000, 29, 93–104. [Google Scholar] [CrossRef]
- Mahajan, D.; Tan, C.; Sharma, A. Preserving Causal Constraints in Counterfactual Explanations for Machine Learning Classifiers, 2020. arXiv:1912.03277 [cs, stat].
- Xiang, X.; Lenskiy, A. Realistic Counterfactual Explanations with Learned Relations, 2022. arXiv:2202.07356 [cs, stat].
- Kingma, D.P.; Welling, M. Auto-Encoding Variational Bayes, 2022. arXiv:1312.6114 [cs, stat]. [CrossRef]
- Singh, R.; Miller, T.; Lyons, H.; Sonenberg, L.; Velloso, E.; Vetere, F.; Howe, P.; Dourish, P. Directive Explanations for Actionable Explainability in Machine Learning Applications. ACM Transactions on Interactive Intelligent Systems 2023, p. 3579363. [CrossRef]
- Naumann, P.; Ntoutsi, E. Consequence-Aware Sequential Counterfactual Generation. In Proceedings of the Machine Learning and Knowledge Discovery in Databases. Research Track; Oliver, N.; Pérez-Cruz, F.; Kramer, S.; Read, J.; Lozano, J.A., Eds., Cham, 2021; Lecture Notes in Computer Science, pp. 682–698. [CrossRef]
- Van Rossum, G.; Drake Jr, F.L. Python tutorial; Centrum voor Wiskunde en Informatica Amsterdam, The Netherlands, 1995.
- Klaise, J.; Van Looveren, A.; Vacanti, G.; Coca, A. Alibi Explain: Algorithms for Explaining Machine Learning Models, 2021.
- Parmar, J. Tuneable Counterfactuals; GitHub, 2024.
- Van Looveren, A.; Klaise, J.; Vacanti, G.; Cobb, O. Conditional Generative Models for Counterfactual Explanations, 2021.
- Inam, R.; Terra, A.; Fersman, E.; Feljan, A.V. Explainable AI: How humans can trust Artificial Intelligence, 2021.
- Blackwell, A. Bias and Fairness, 2022. Place: University of Cambridge.
- Goodman, B.; Flaxman, S. European Union Regulations on Algorithmic Decision-Making and a “Right to Explanation”. AI Magazine 2017, 38, 50–57, Publisher: Wiley. [Google Scholar] [CrossRef]
- Wiyatno, R.R.; Xu, A.; Dia, O.; de Berker, A. Adversarial Examples in Modern Machine Learning: A Review. CoRR 2019, abs/1911.05268, [1911.05268].
- Nemirovsky, D.; Thiebaut, N.; Xu, Y.; Gupta, A. CounteRGAN: Generating counterfactuals for real-time recourse and interpretability using residual GANs. In Proceedings of the Proceedings of the Thirty-Eighth Conference on Uncertainty in Artificial Intelligence. PMLR, 2022, pp. 1488–1497. ISSN: 2640-3498.
- Goodfellow, I.; Pouget-Abadie, J.; Mirza, M.; Xu, B.; Warde-Farley, D.; Ozair, S.; Courville, A.; Bengio, Y. Generative Adversarial Nets. In Proceedings of the Advances in Neural Information Processing Systems. Curran Associates, Inc., 2014, Vol. 27.
- Pedregosa, F.; Varoquaux, G.; Gramfort, A.; Michel, V.; Thirion, B.; Grisel, O.; Blondel, M.; Prettenhofer, P.; Weiss, R.; Dubourg, V.; et al. Scikit-learn: Machine Learning in Python. Journal of Machine Learning Research 2011, 12, 2825–2830. [Google Scholar]
- Chollet, F.; et al. Keras. https://keras.io, 2015.
- Warren, G.; Keane, M.T.; Byrne, R.M.J. Features of Explainability: How users understand counterfactual and causal explanations for categorical and continuous features in XAI, 2022, [arXiv:cs.HC/2204.10152].
- pandas development team, T. pandas-dev/pandas: Pandas, 2023. [CrossRef]
- Schut, L.; Key, O.; McGrath, R.; Costabello, L.; Sacaleanu, B.; Corcoran, M.; Gal, Y. Generating Interpretable Counterfactual Explanations By Implicit Minimisation of Epistemic and Aleatoric Uncertainties. arXiv 2021.
- Tse, L. Credit Risk Dataset, 2020.
- Saeed, M.; Villarroel, M.; Reisner, A.; Clifford, G.; Lehman, L.w.; Moody, G.; Heldt, T.; Kyaw, T.; Moody, B.; Mark, R. MIMIC-II Clinical Database, 2011. [CrossRef]
- Raffa, J. Clinical data from the MIMIC-II database for a case study on indwelling arterial catheters:, 2016. [CrossRef]
- Deng, L. The mnist database of handwritten digit images for machine learning research. IEEE Signal Processing Magazine 2012, 29, 141–142. [Google Scholar] [CrossRef]
- Banerjee, S. Generating Complex Explanations for Artificial Intelligence Models: An Application to Clinical Data on Severe Mental Illness. Life 2024, Vol. 14, Page 807 2024, 14, 807. [CrossRef]

| Parameter Name | Description |
|---|---|
| variables | A list of variables to be “searched over”. If this is not specified, it will be assumed from the training data. |
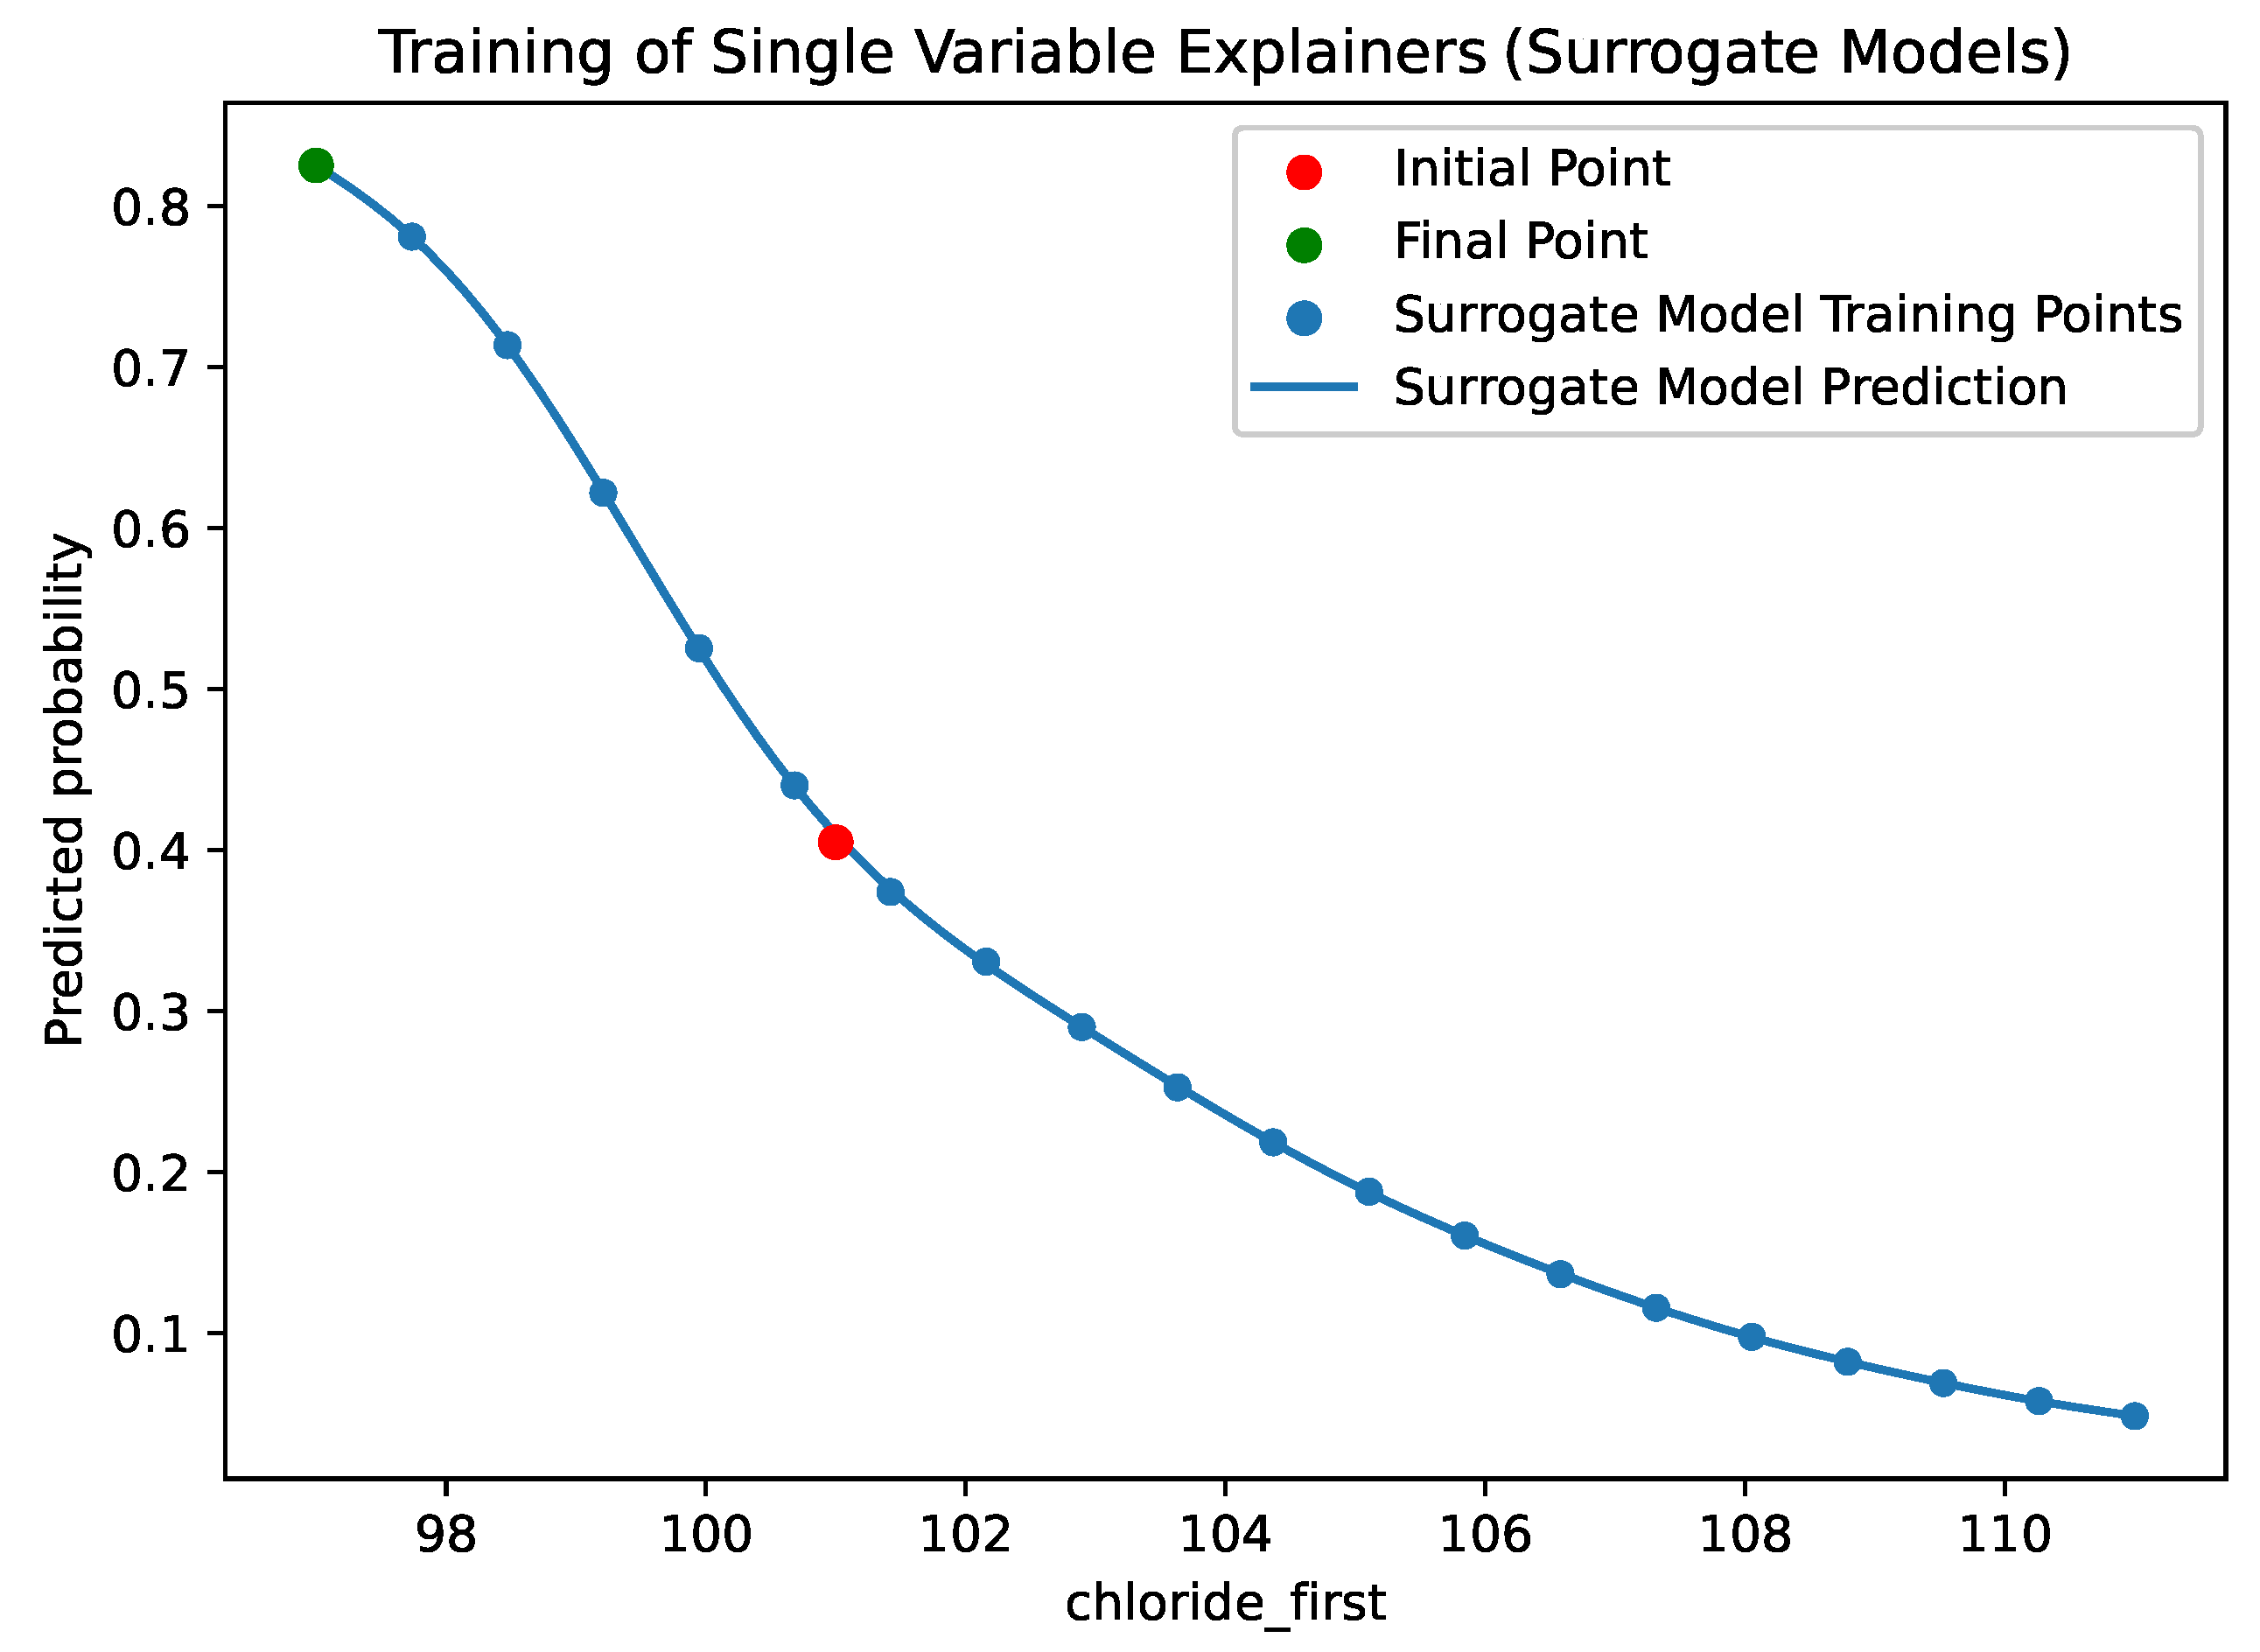
| sampling_method | The method used the sample the points used to train the surrogate models. By default this is “uniform”, such that the training points shown in Figure 4 are evenly spaced. Alternatively, “random” will sample values at random from the training dataset. |
| bounding_method | If uniform sampling is used, the user is able to define the “bounds” for the sampling. While the user can provide the bounds manually (in override_variable_bounds), either in the form of a Python Dictionary containing “min, max” tuples or as a single such tuple; they can also instruct the use of a method to calculate the bounds based on the training data. The methods available are “minmax”, which takes the minimum and maximum values of the feature in the training data; “quantile”, which will take the specified upper and lower quantiles; and “meanstd”, which takes the mean plus/minus a specified number of standard deviations. |
| override_variable_bounds | |
| std_dev | |
| quantiles | |
| number_of_samples | The number of samples to be used to train each surrogate model. This is the number of points shown in Figure 4. |
| regressor | The SKLearn Regressor used for each surrogate model. Any SciKit-Learn Regression Model can be used here. The user can also provide the strings “gaussian_process” or “linear” for these most commonly used regressors. |
| changability_scores | A python dictionary of the scores described in Section 3.1.2. If this is not specified, a score of 1 will be assigned to each of the variables specified. |
|
probability_prediction_function (Compatibility Option) |
Function mapping an [n rows x features_in columns] DataFrame to (n x 2) probability matrix. |
| Example: lambda x: model.predict(x).reshape(-1,2) | |
|
class_prediction_function (Compatibility Option) |
Function mapping an [1 rows x features_in columns] DataFrame to integer representing the predicted class. |
| Example: lambda x: model.predict(x).argmax() |
| Feature | Value |
|---|---|
| person_age | 22.0 |
| person_income | 40000.0 |
| person_emp_length | 4.0 |
| loan_grade | 1.0 |
| loan_amnt | 14125.0 |
| loan_int_rate | 11.49 |
| loan_percent_income | 35.0 |
| cb_person_default_on_file | 0.0 |
| cb_person_cred_hist_length | 3.0 |
| person_home_renting | 1.0 |
| person_home_mortgage | 0.0 |
| person_home_own | 0.0 |
| loan_status | 0.0 |
| model_1_prediction | 0.0 |
| Feature | Value |
|---|---|
| age | |
| bmi | |
| weight_first | |
| icu_los_day | |
| hospital_los_day | 22 |
| day_icu_intime_num | 7 |
| hour_icu_intime | 5 |
| map_1st | 87 |
| hr_1st | 71 |
| temp_1st | |
| spo2_1st | 100 |
| abg_count | 2 |
| wbc_first | |
| hgb_first | |
| platelet_first | 209 |
| sodium_first | 139 |
| potassium_first | |
| tco2_first | 26 |
| chloride_first | 101 |
| bun_first | 6 |
| creatinine_first | 1 |
| day_28_flg | 0.000000 |
| Feature | Value |
|---|---|
| Age | 22.0 |
| Income | 50508.0 |
| Length of Employment | 5.0 |
| Grade | 0.0 |
| Loan Amount | 6000.0 |
| Loan Interest Rate | 5.42 |
| Loan Amount as Percent of Income | 12.0 |
| Credit History Default on File | 0.0 |
| Lenght of Credit History (Year)S | 3.0 |
| Renting Indicator | 1.0 |
| Home Mortgate Indicator | 0.0 |
| Home Ownwership Indicator | 0.0 |
| Loan "Status" | 1.0 |
| Our Prediction | 1.0 |
Disclaimer/Publisher’s Note: The statements, opinions and data contained in all publications are solely those of the individual author(s) and contributor(s) and not of MDPI and/or the editor(s). MDPI and/or the editor(s) disclaim responsibility for any injury to people or property resulting from any ideas, methods, instructions or products referred to in the content. |
© 2025 by the authors. Licensee MDPI, Basel, Switzerland. This article is an open access article distributed under the terms and conditions of the Creative Commons Attribution (CC BY) license (http://creativecommons.org/licenses/by/4.0/).


