Submitted:
13 January 2025
Posted:
14 January 2025
You are already at the latest version
Abstract
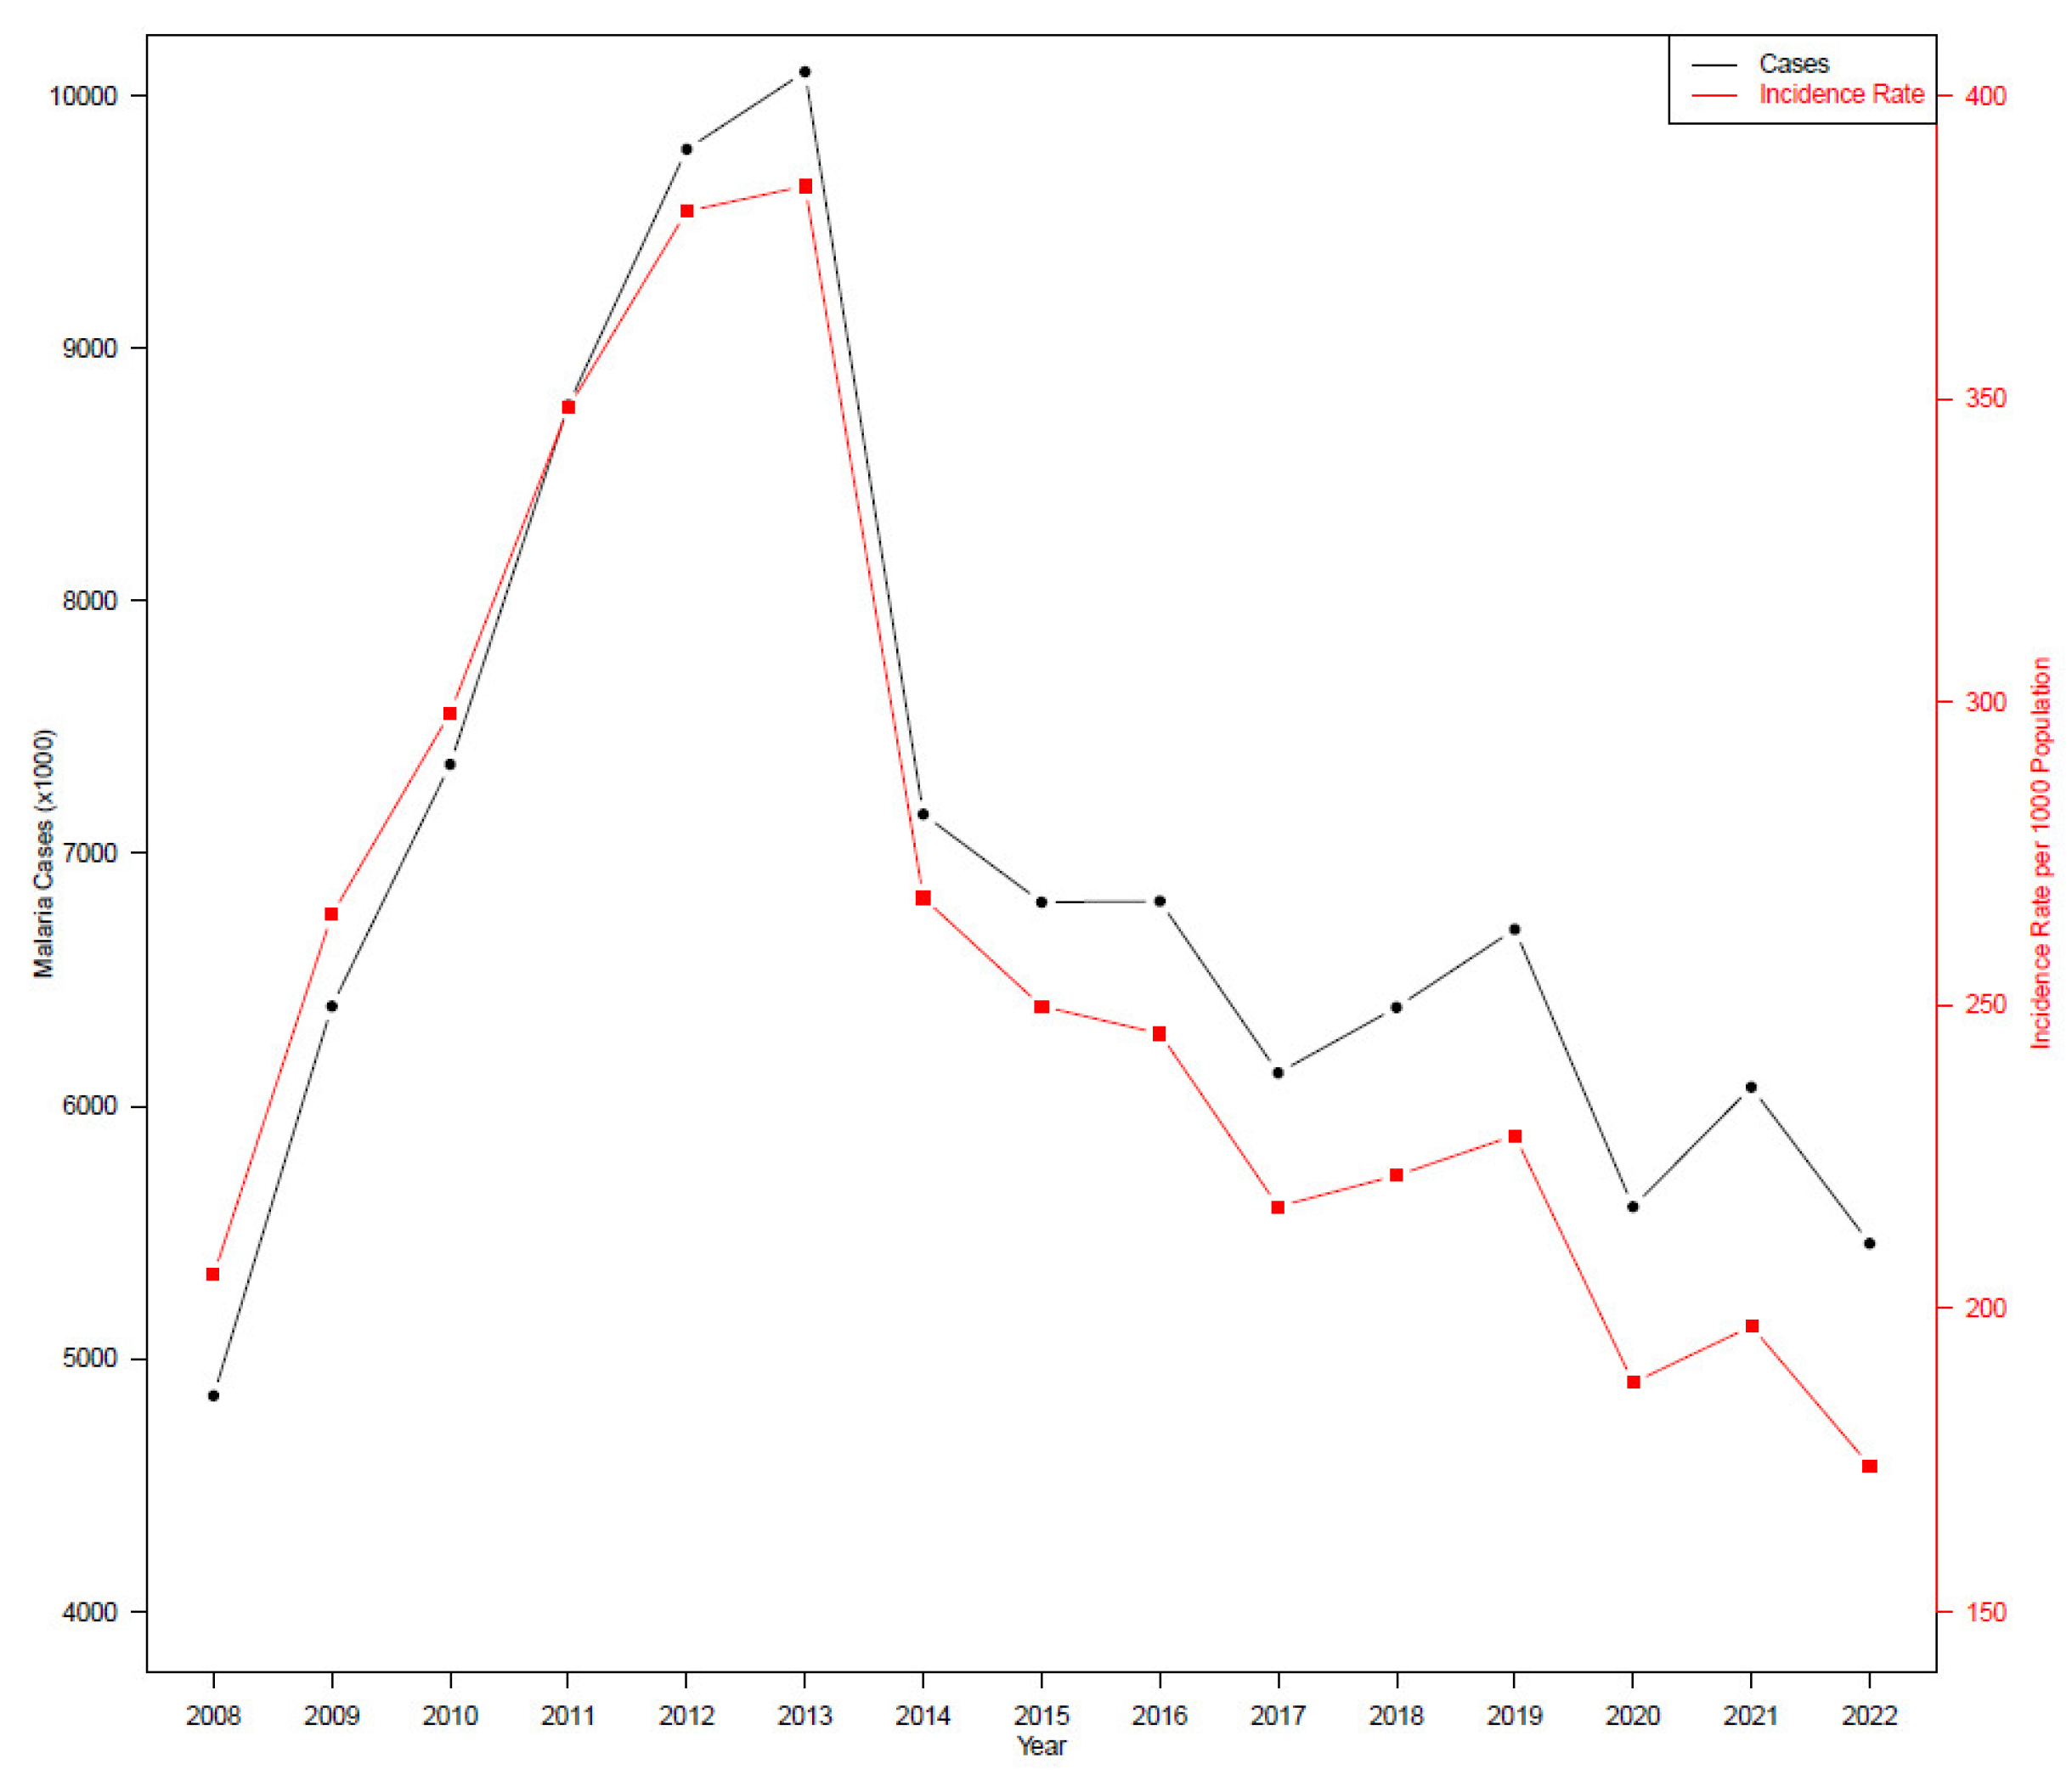
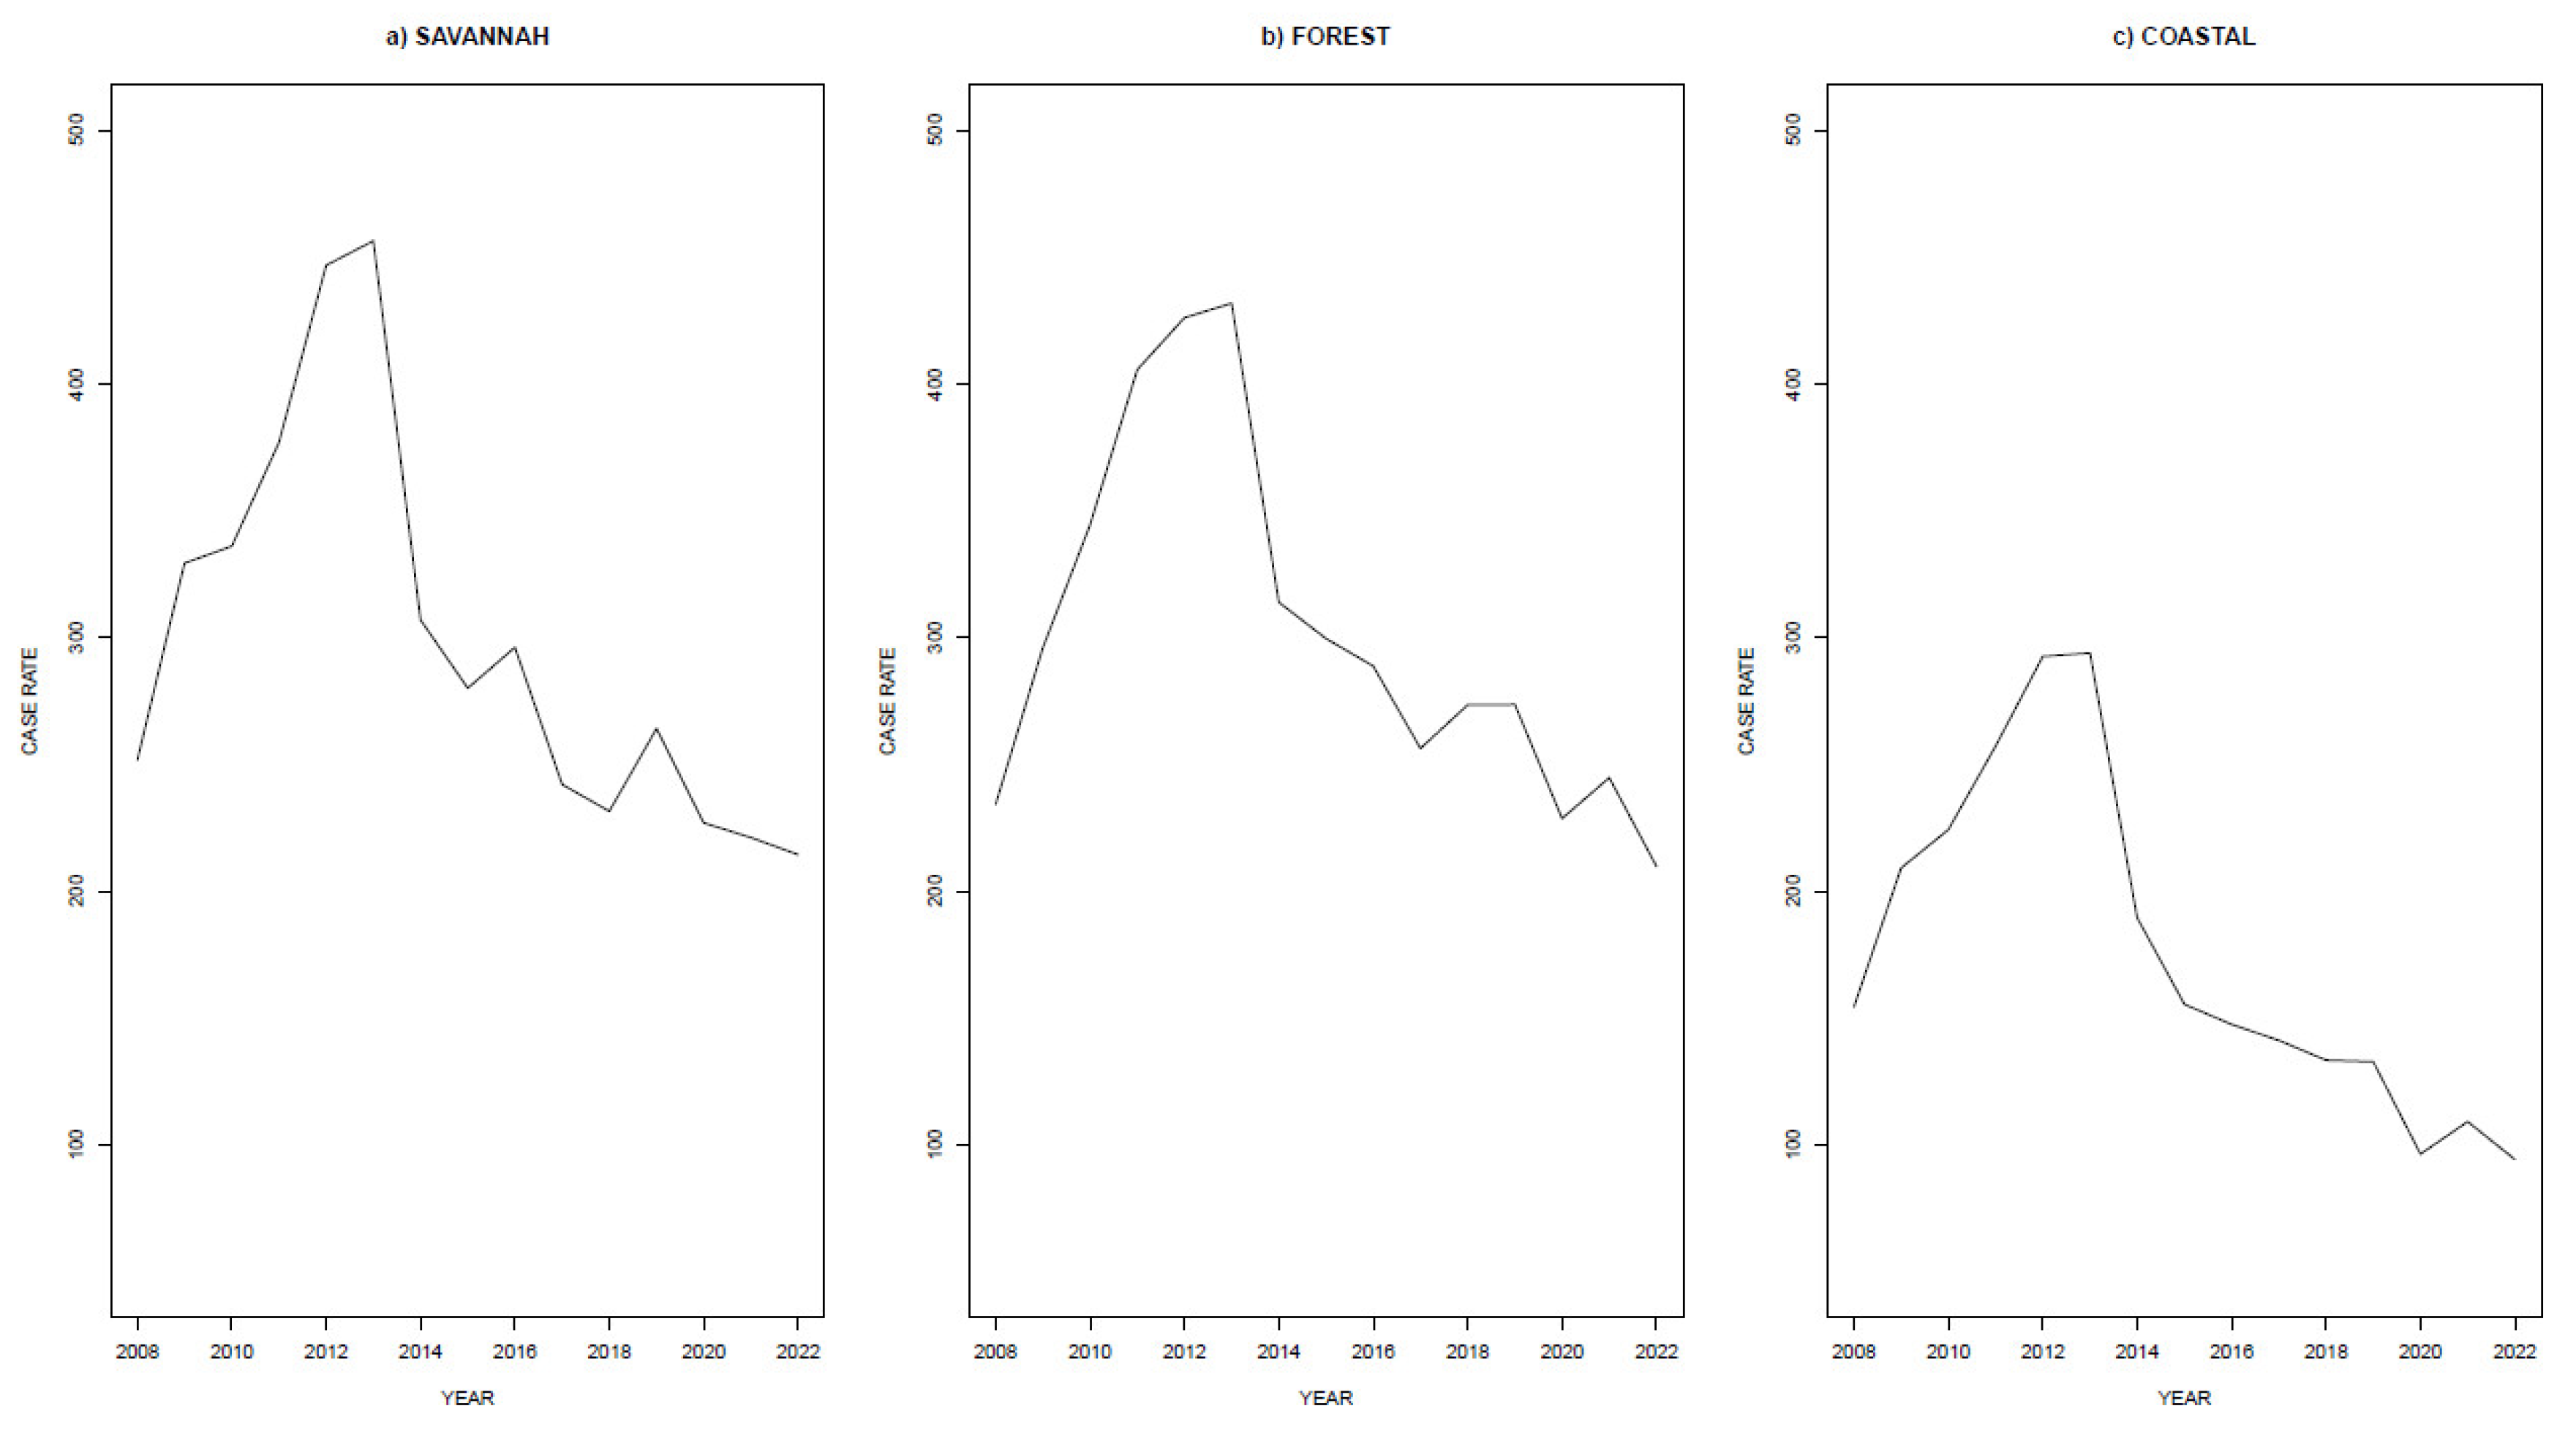
This study investigated recent climate changes in Ghana and the relationships between climate and malaria case rates. for 2008–2022. These were analysed at three spatial scales: national; regional; and ‘climate zone’ (i.e., coastal, savannah and forest zones that are roughly horizontal zones that move south to north across Ghana). Descriptive statistics and qualitative discussion were used to identify possible relationships between the climate variability and the malaria case rates. A correlation analysis was used to provide a quantitative framing for the discussion of the results. The climate analysis identified a general warming over the period with a mid-2010s maximum temperature peak in the forest and savannah zones, also associated with changes in the annual temperature cycle. Malaria case rates increased between 2008 and 2013, decreased sharply in 2014, and then decreased steadily from 2015 to 2022 for all spatial scales. The sharp decline was broadly coincident with a change in the temperature regime that would provide a less favourable environment for the malaria vectors. This was particularly so for an increase in maximum temperatures in the savannah and coastal climate zones in the key months for malaria transmission after 2014. The correlation analysis showed statistically significant (p<0.05) relationships between malaria case rates and mean and maximum temperatures at the national scale, and malaria case rates and mean, maximum and minimum temperatures for the coastal climate zone.
Keywords:
1. Introduction
1.1. Background
1.2. Climate Variables and Malaria
1.2.1. Temperature
1.2.2. Precipitation
1.2.3. Humidity
1.2.4. Climate Zones in Ghana
2. Materials and Methods
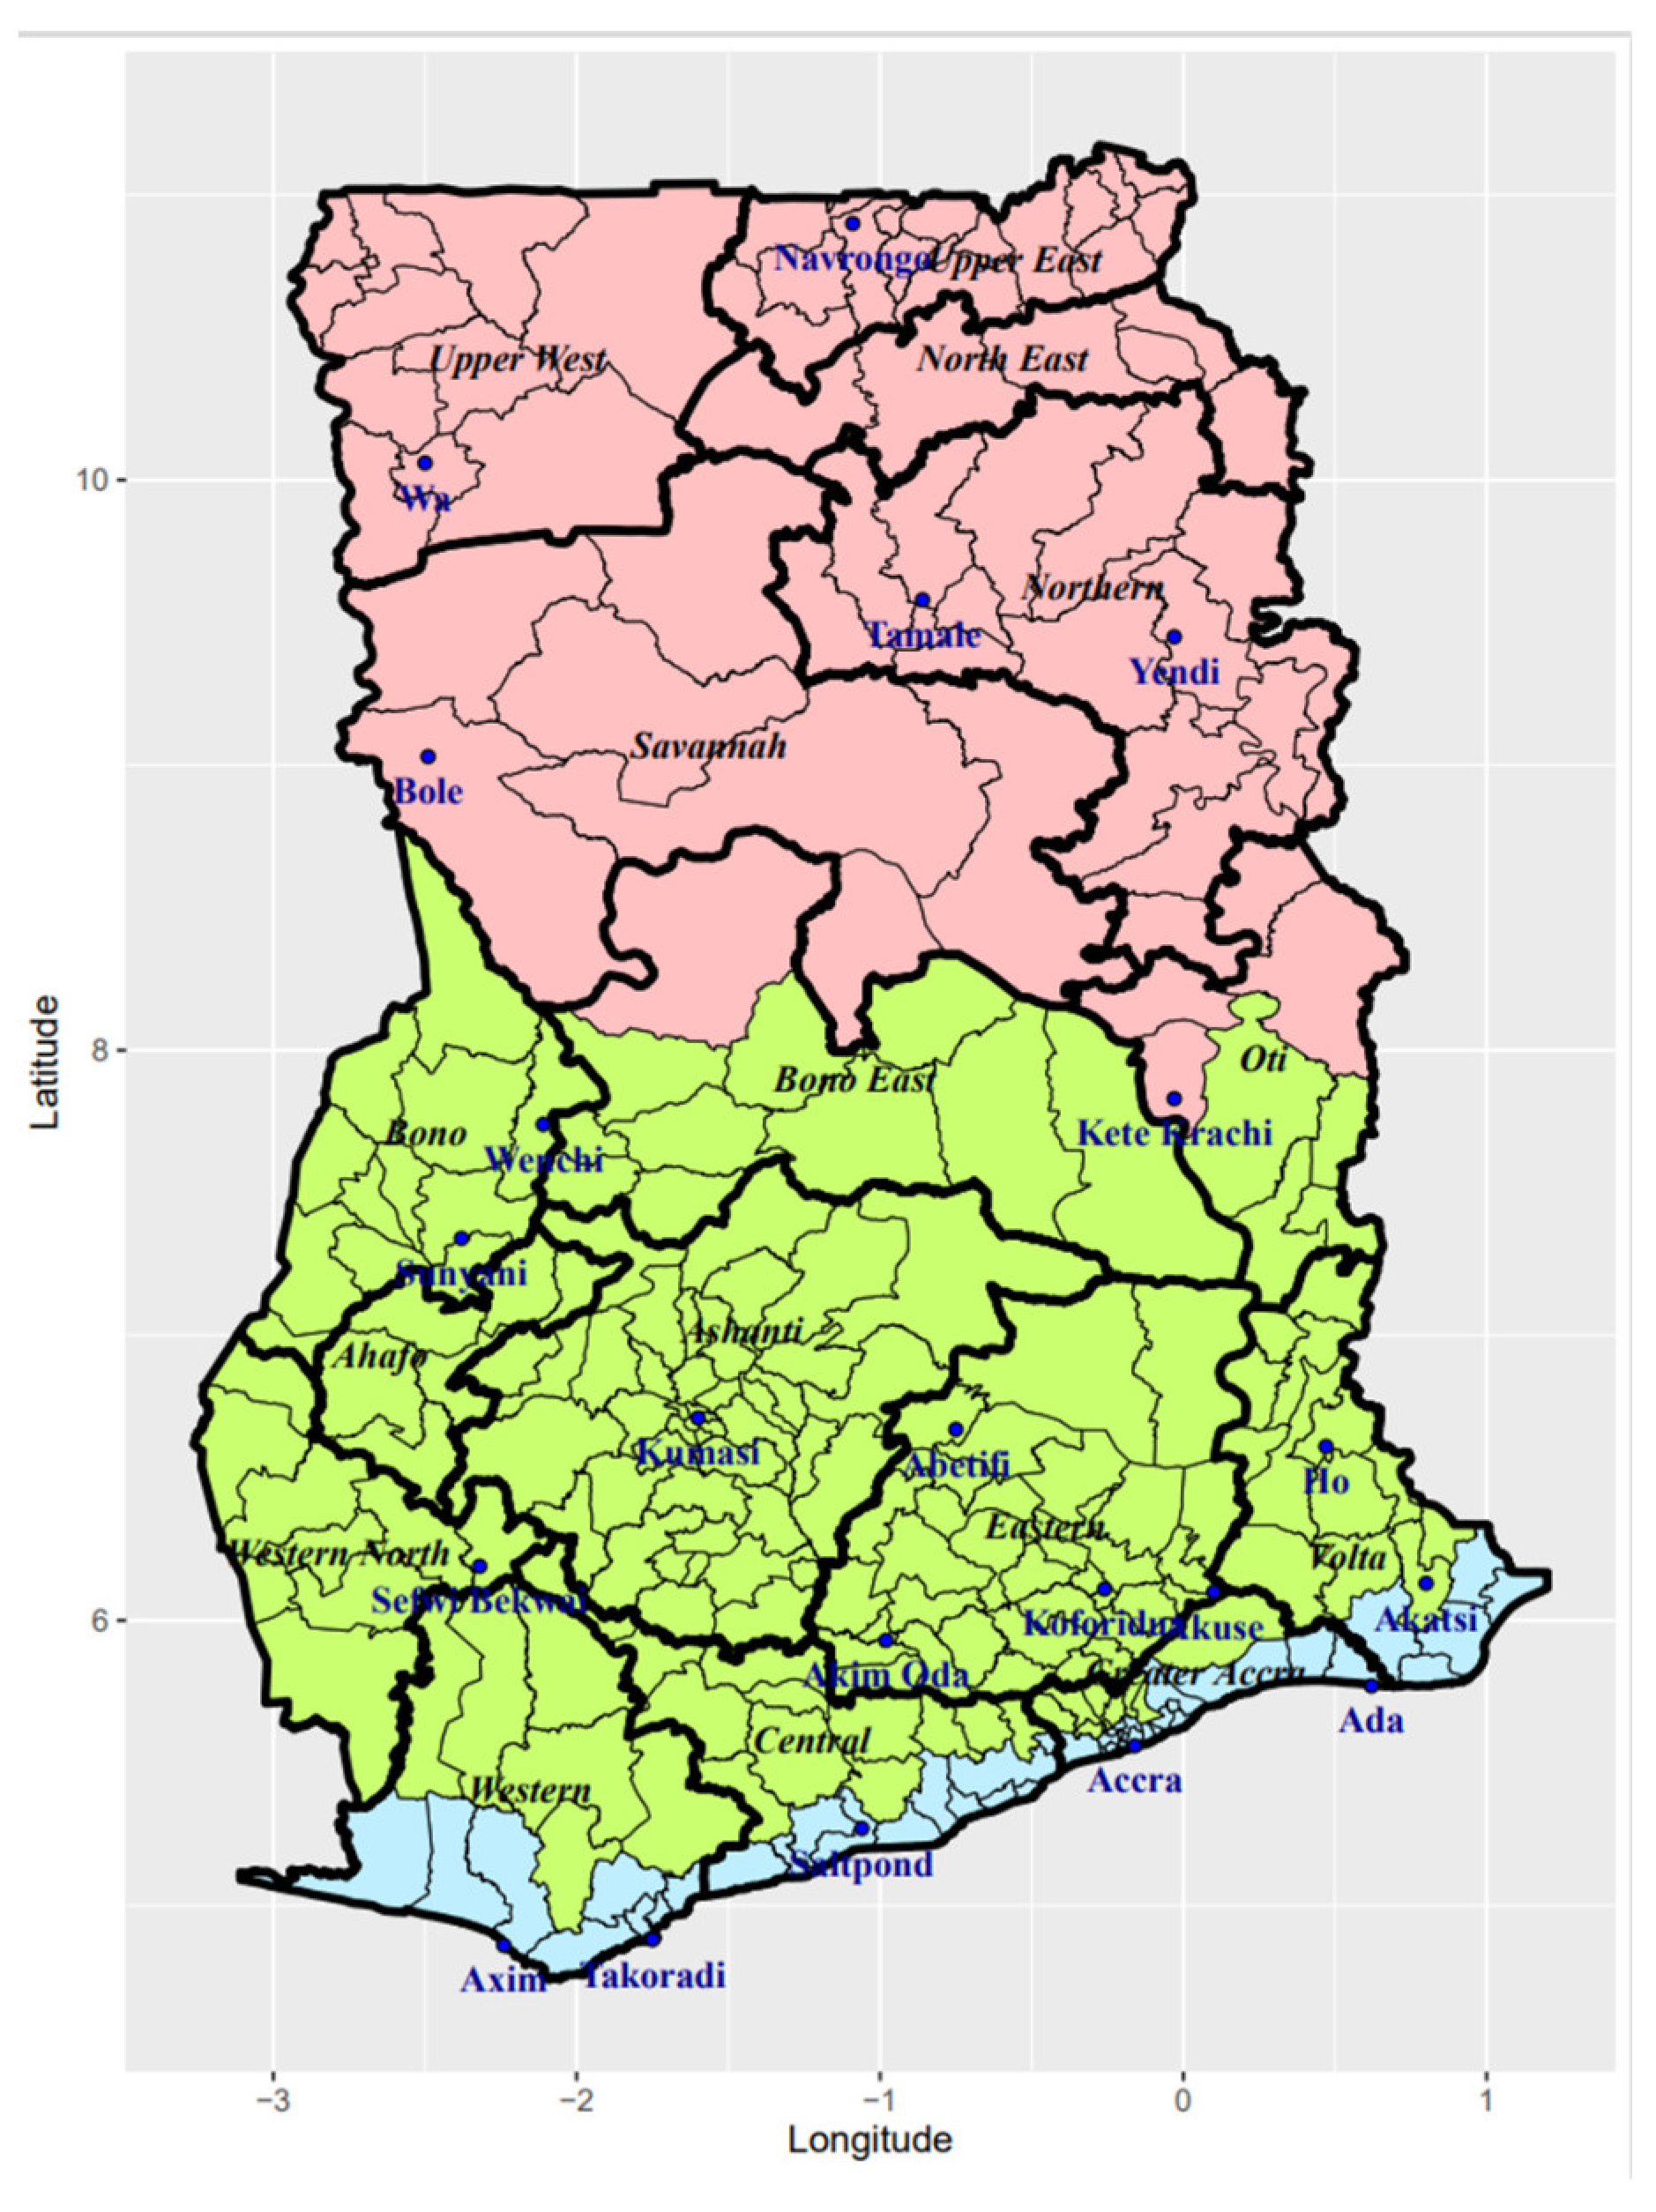
2.1. Study Area
2.2. Malaria Case and Case Rate Data
2.3. Meteorological Data
3. Results and Discussion
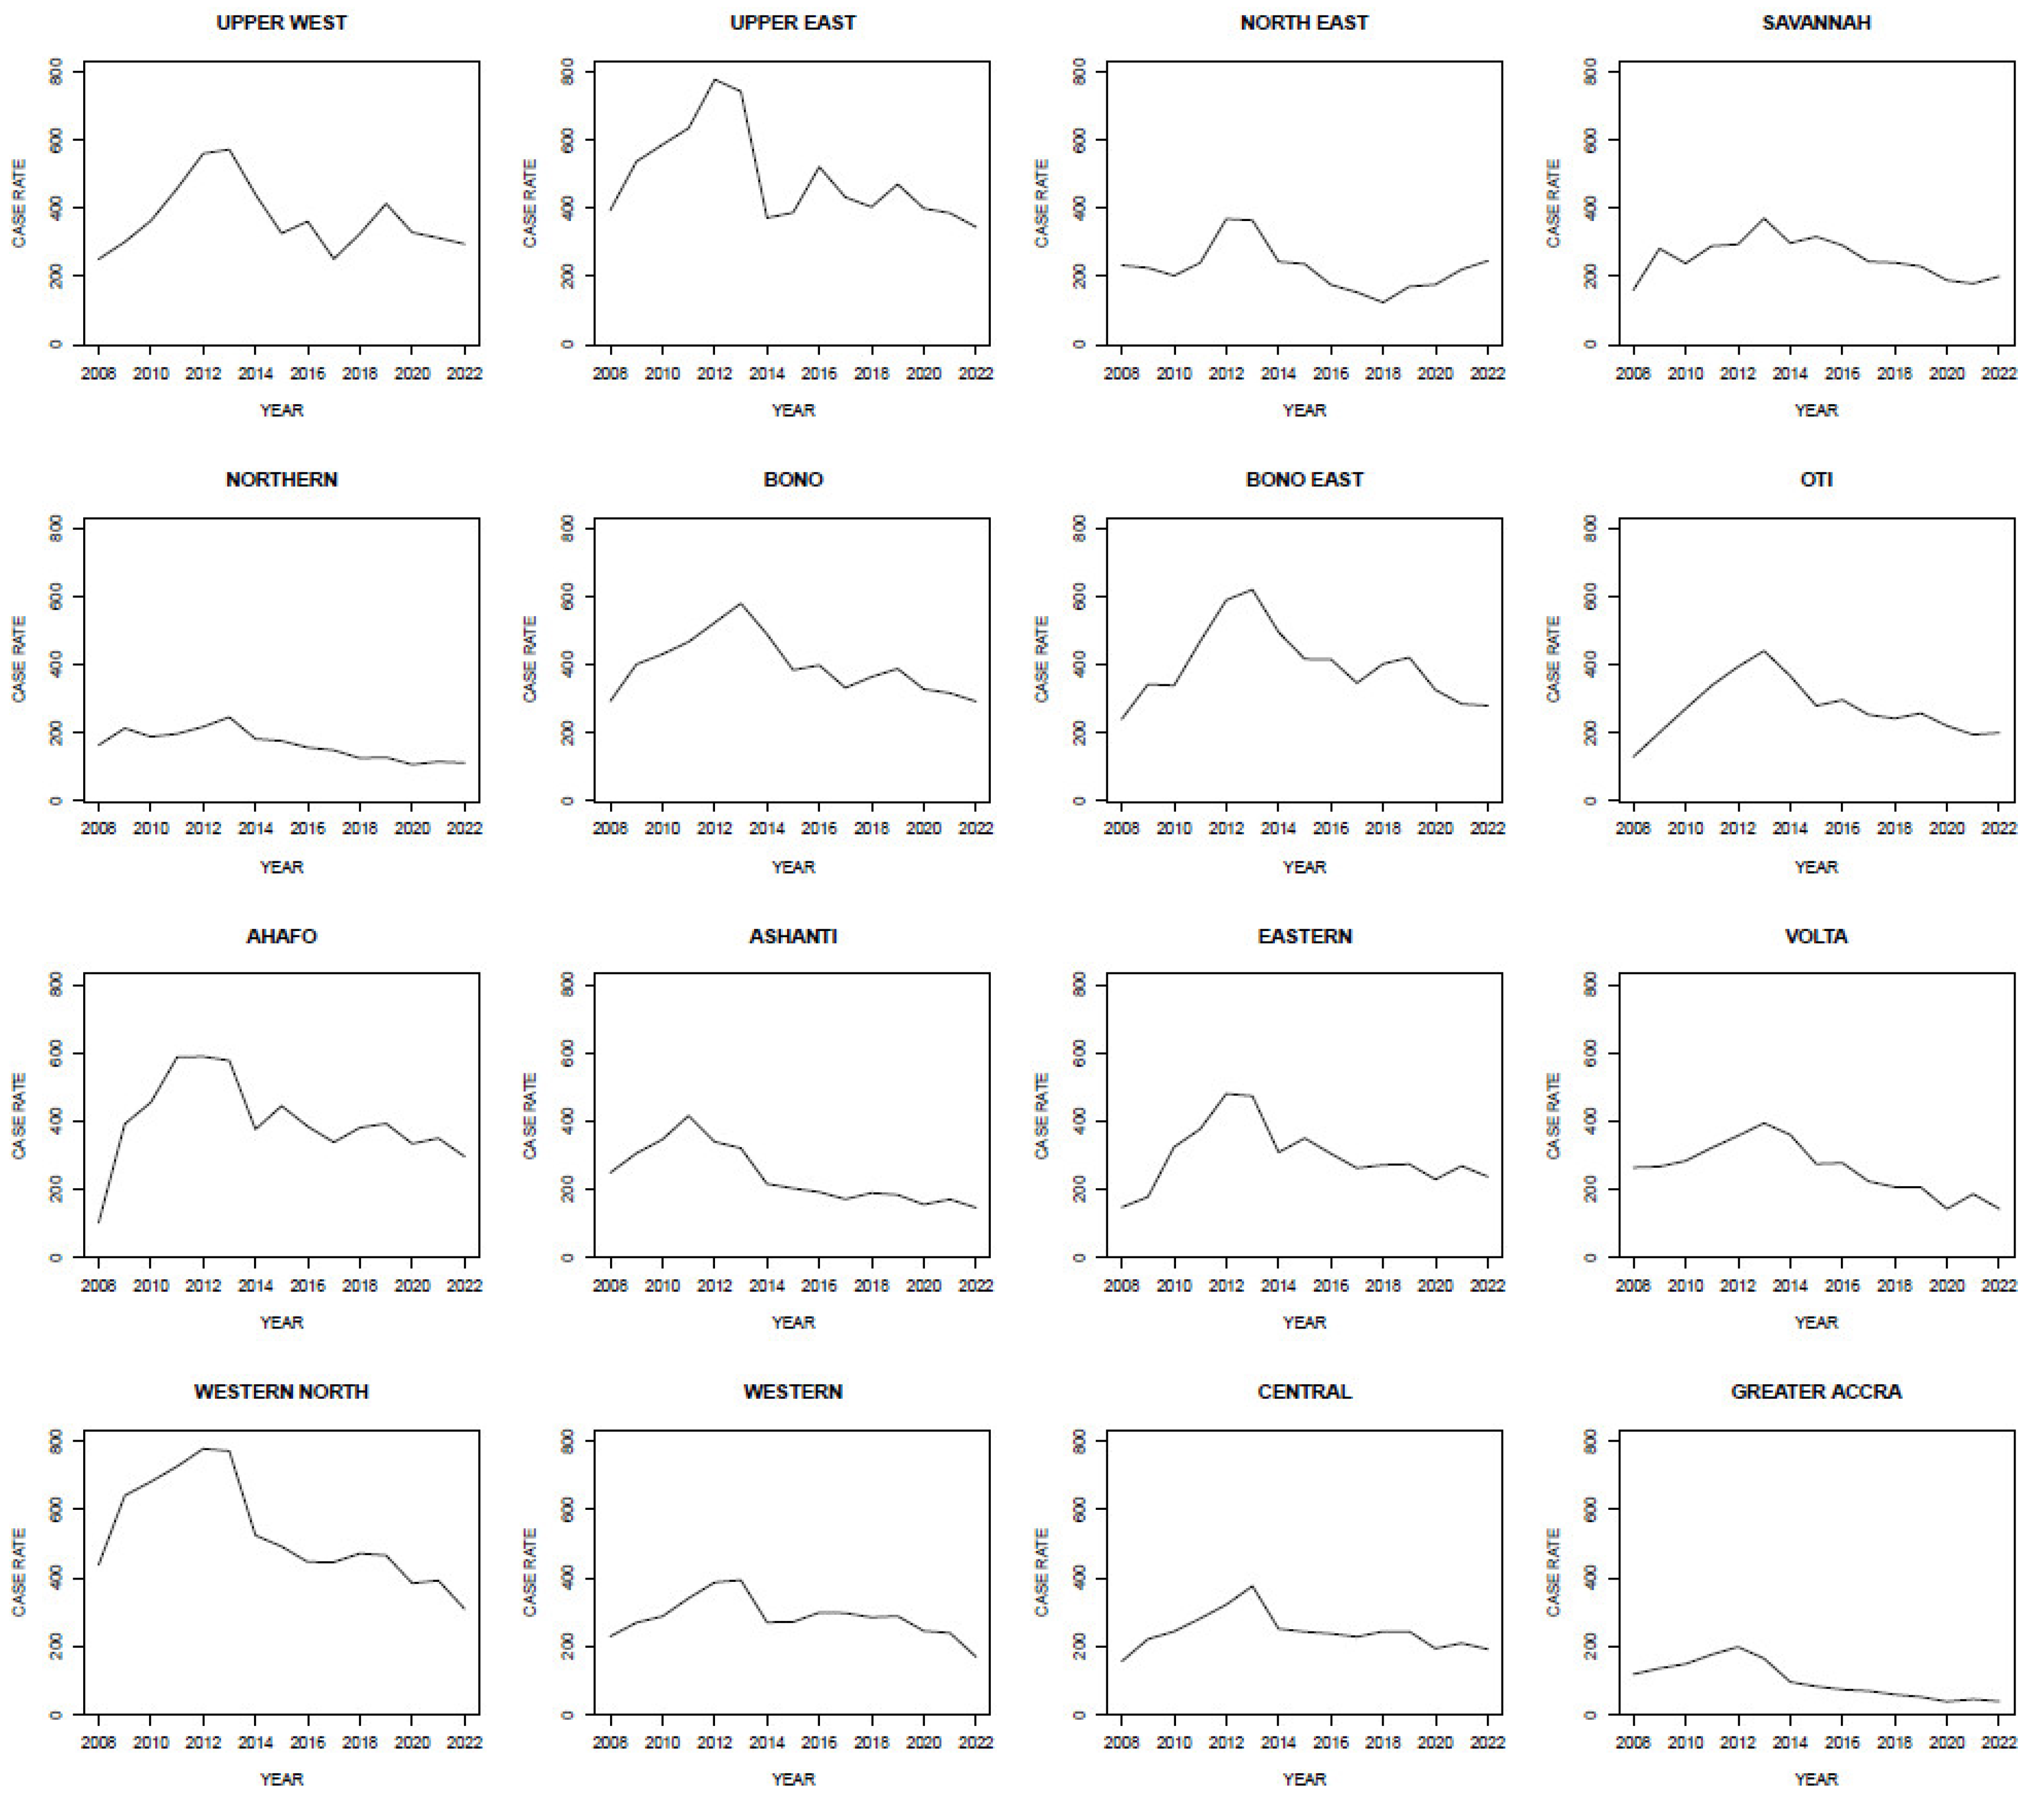
3.1. Summary of Annual Malaria Cases 2008–2022
3.2. Climate Analysis
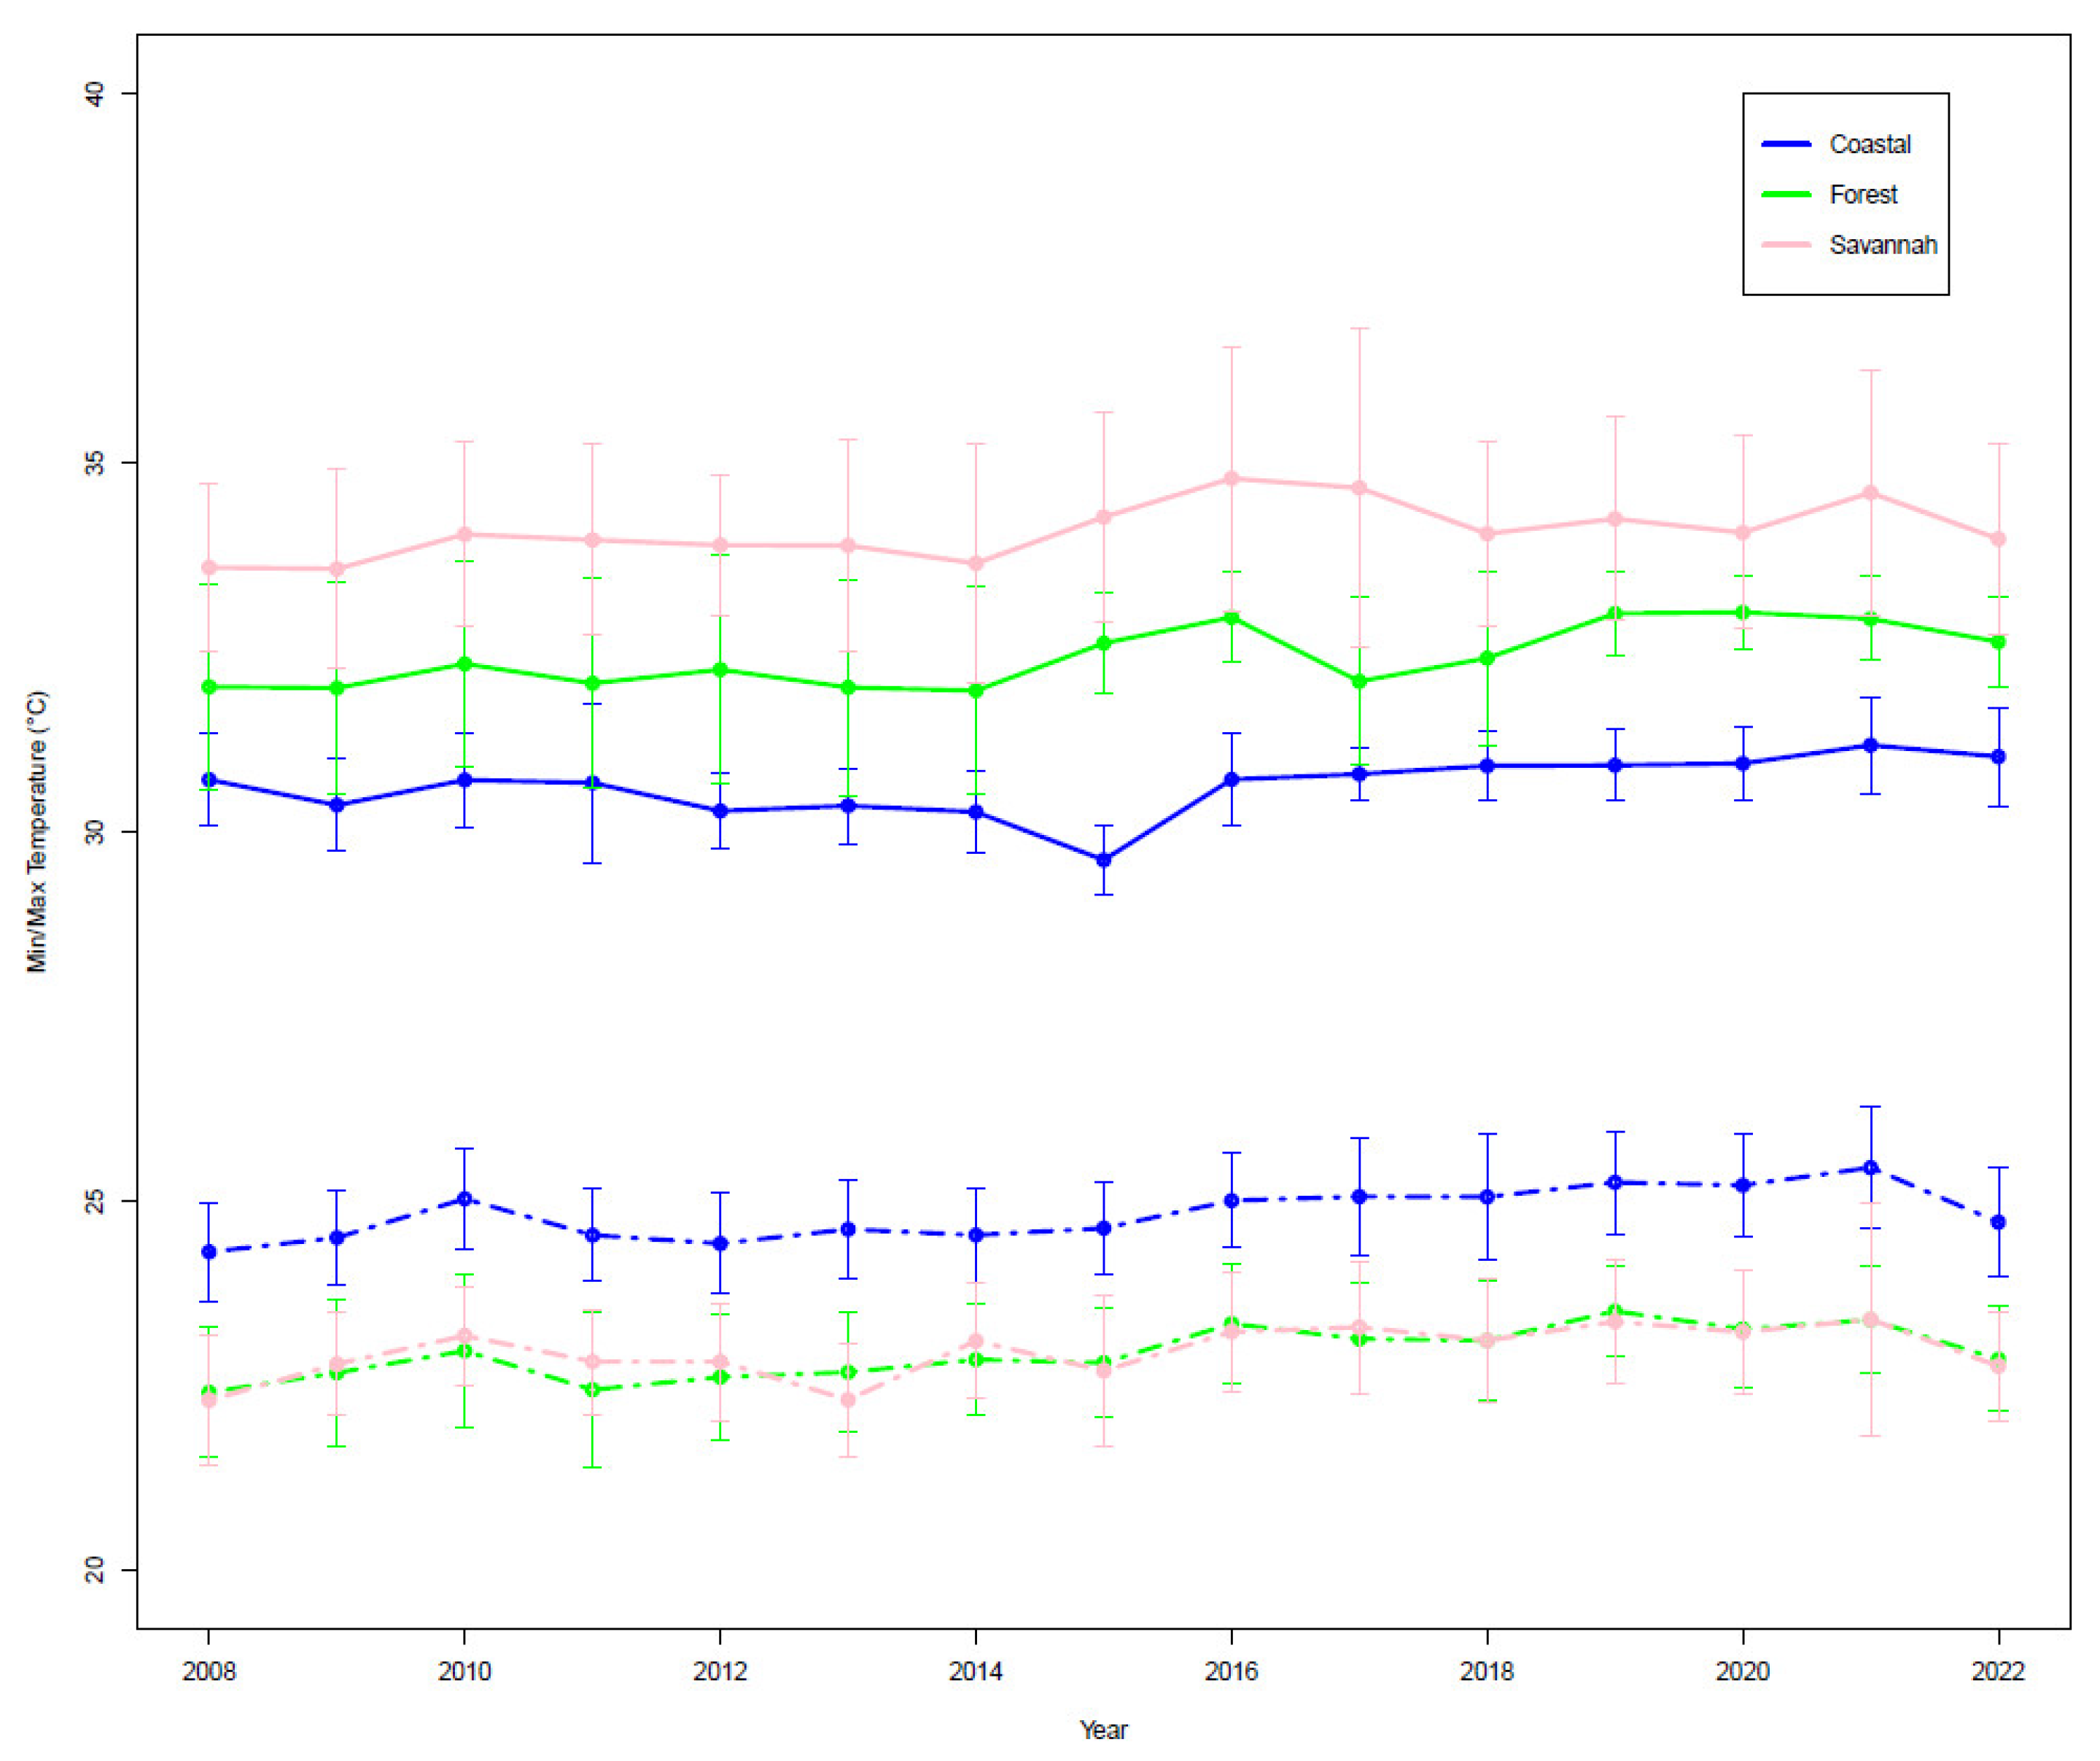
3.2.1. Interannual Temperature Variability
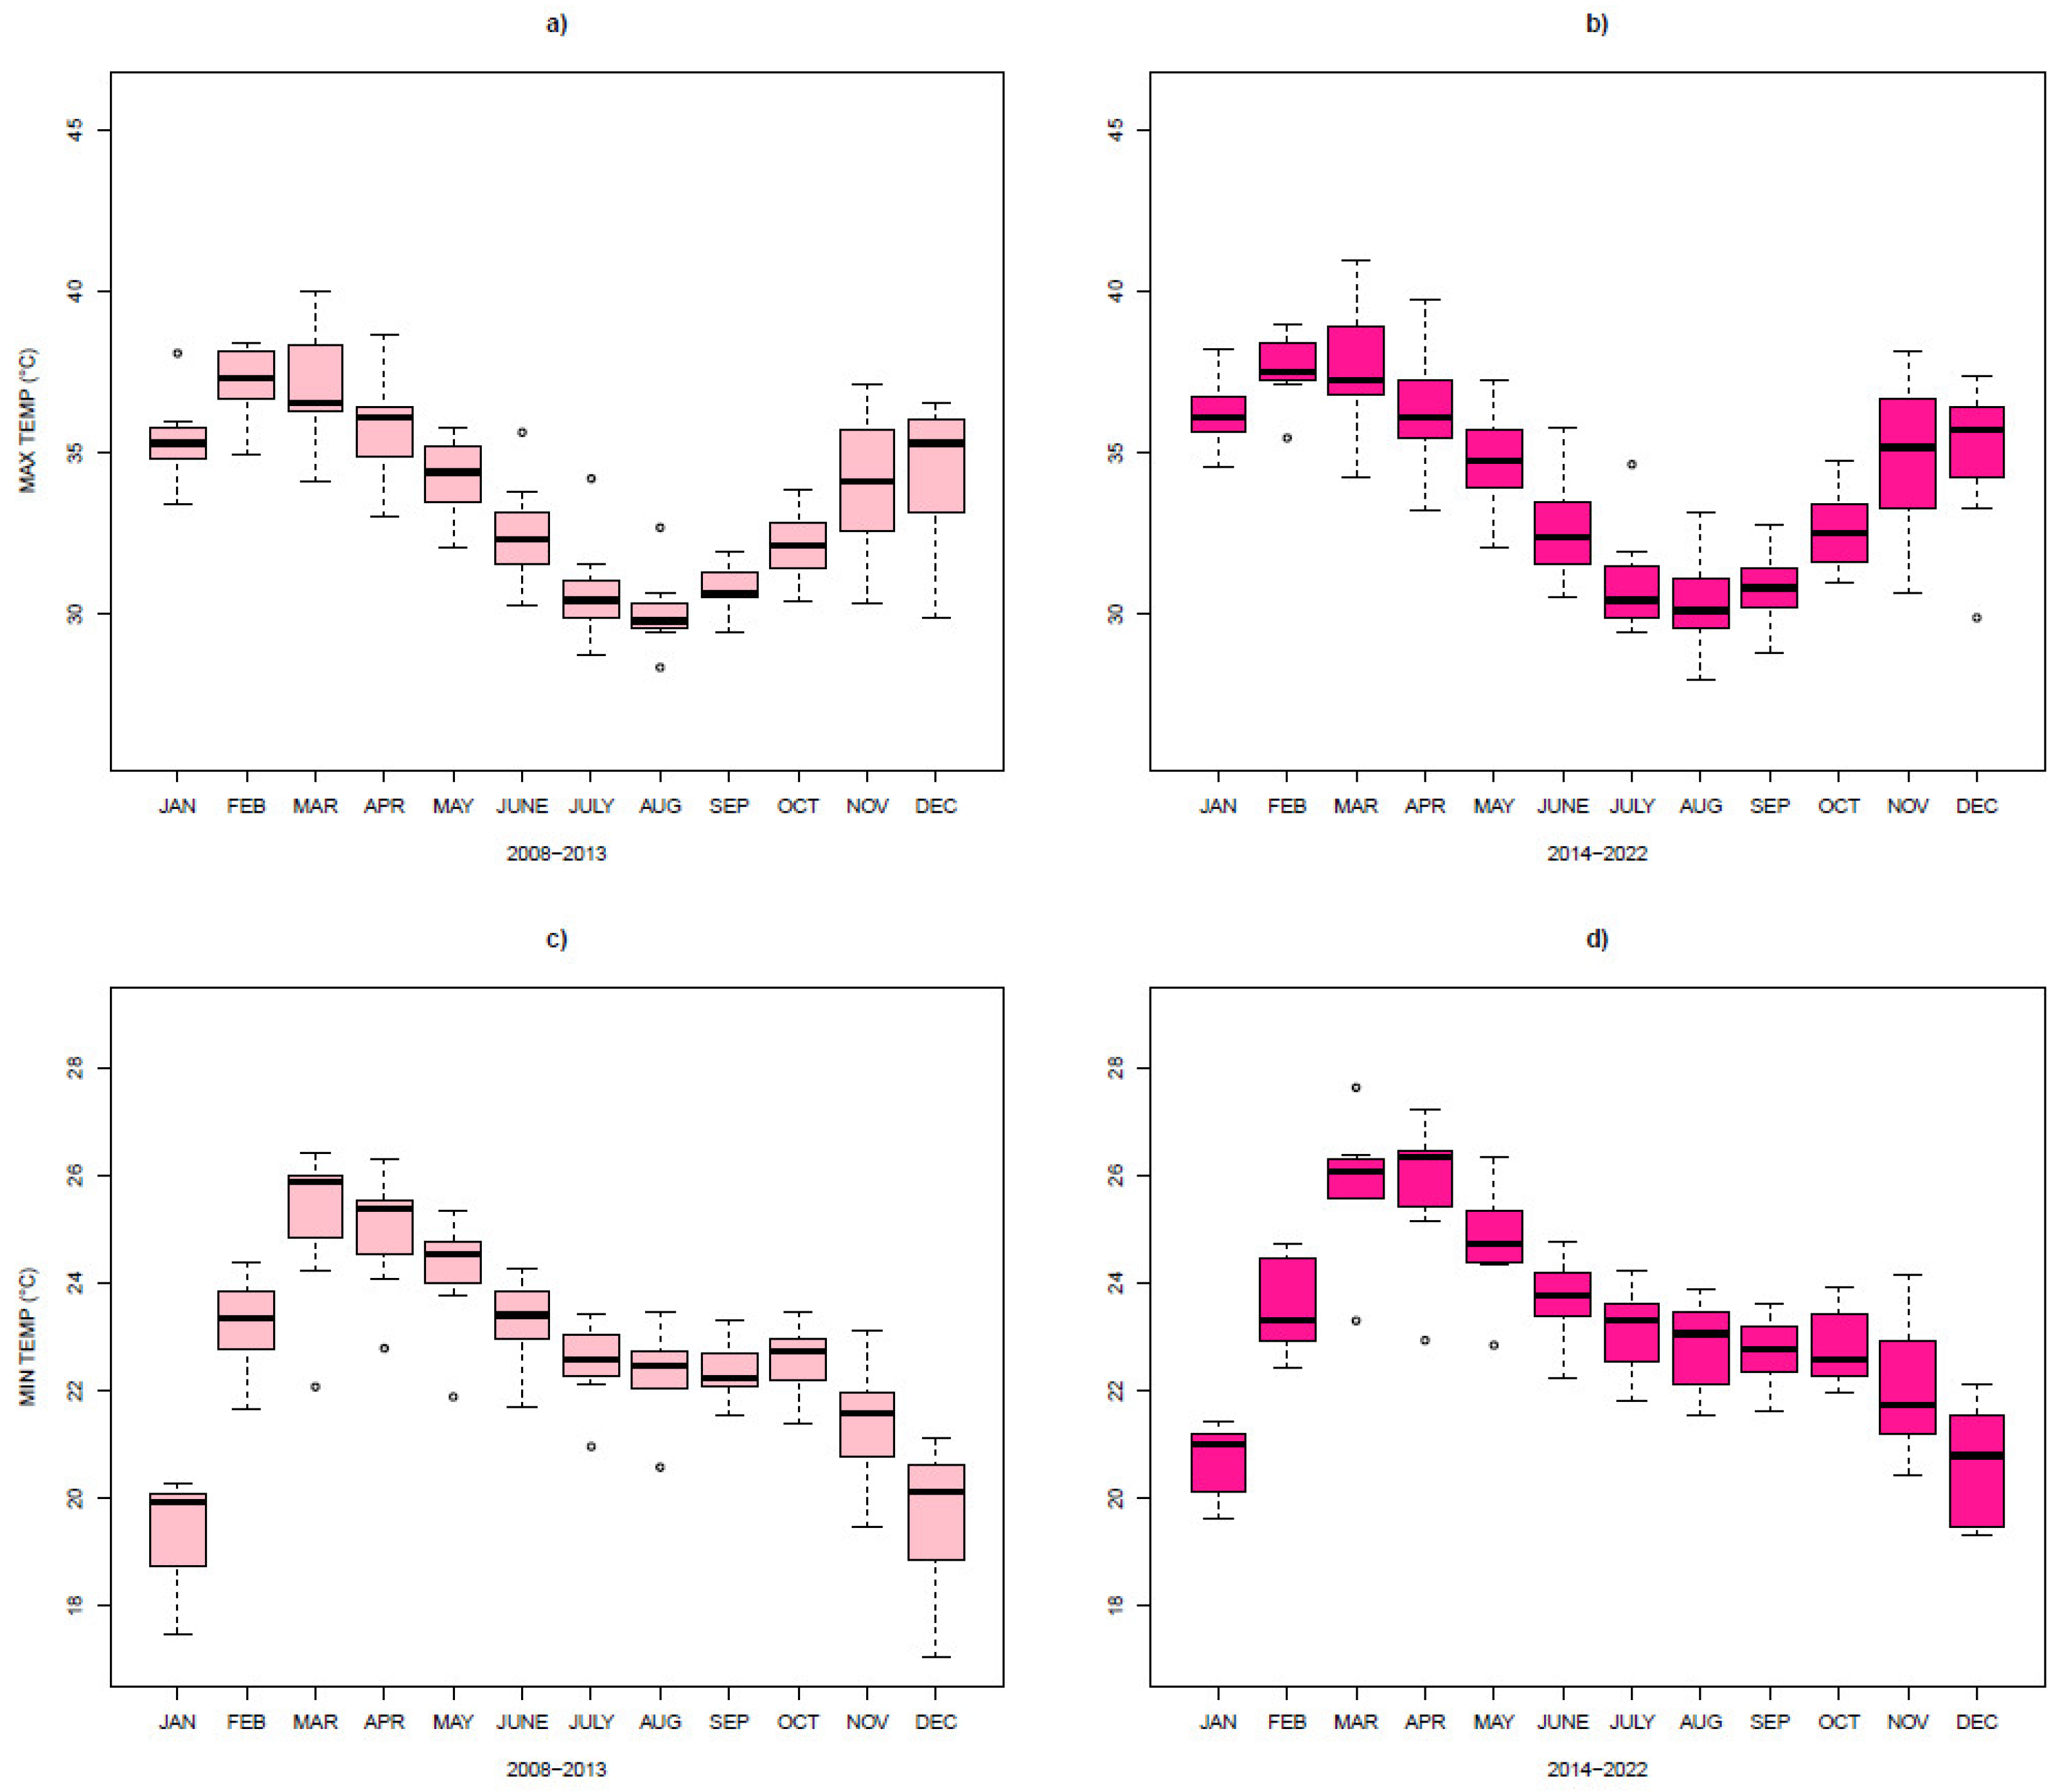
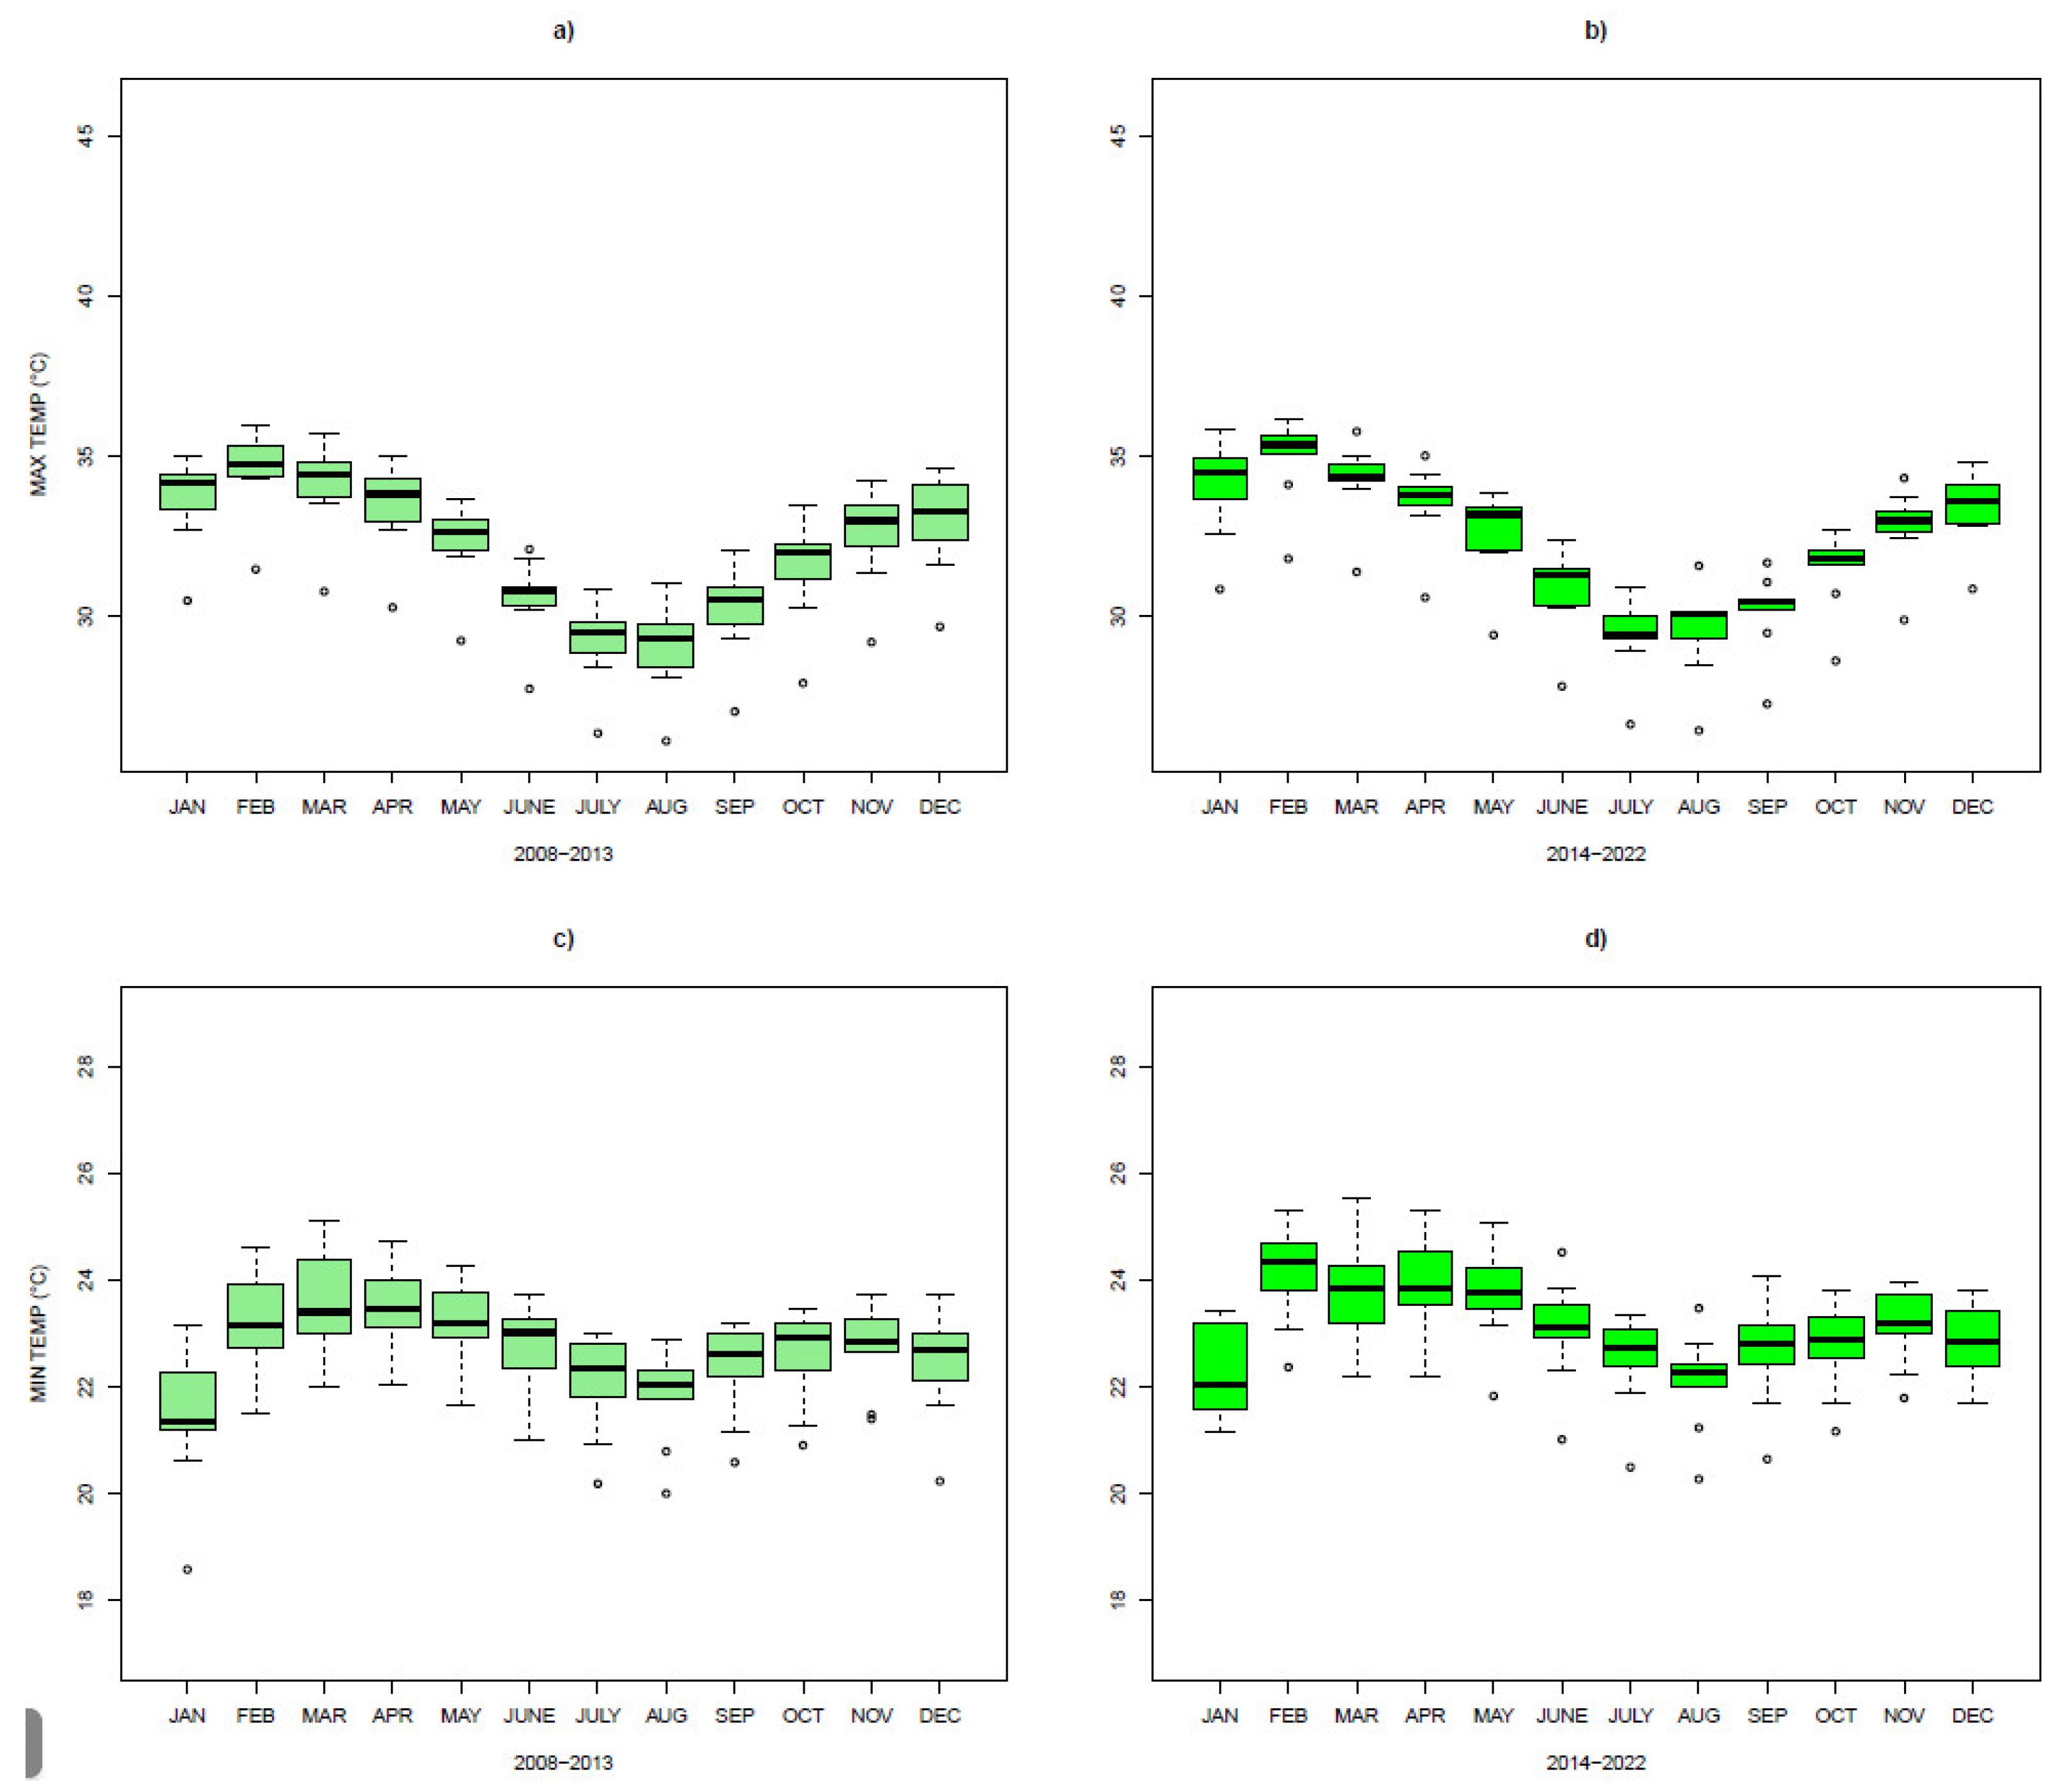
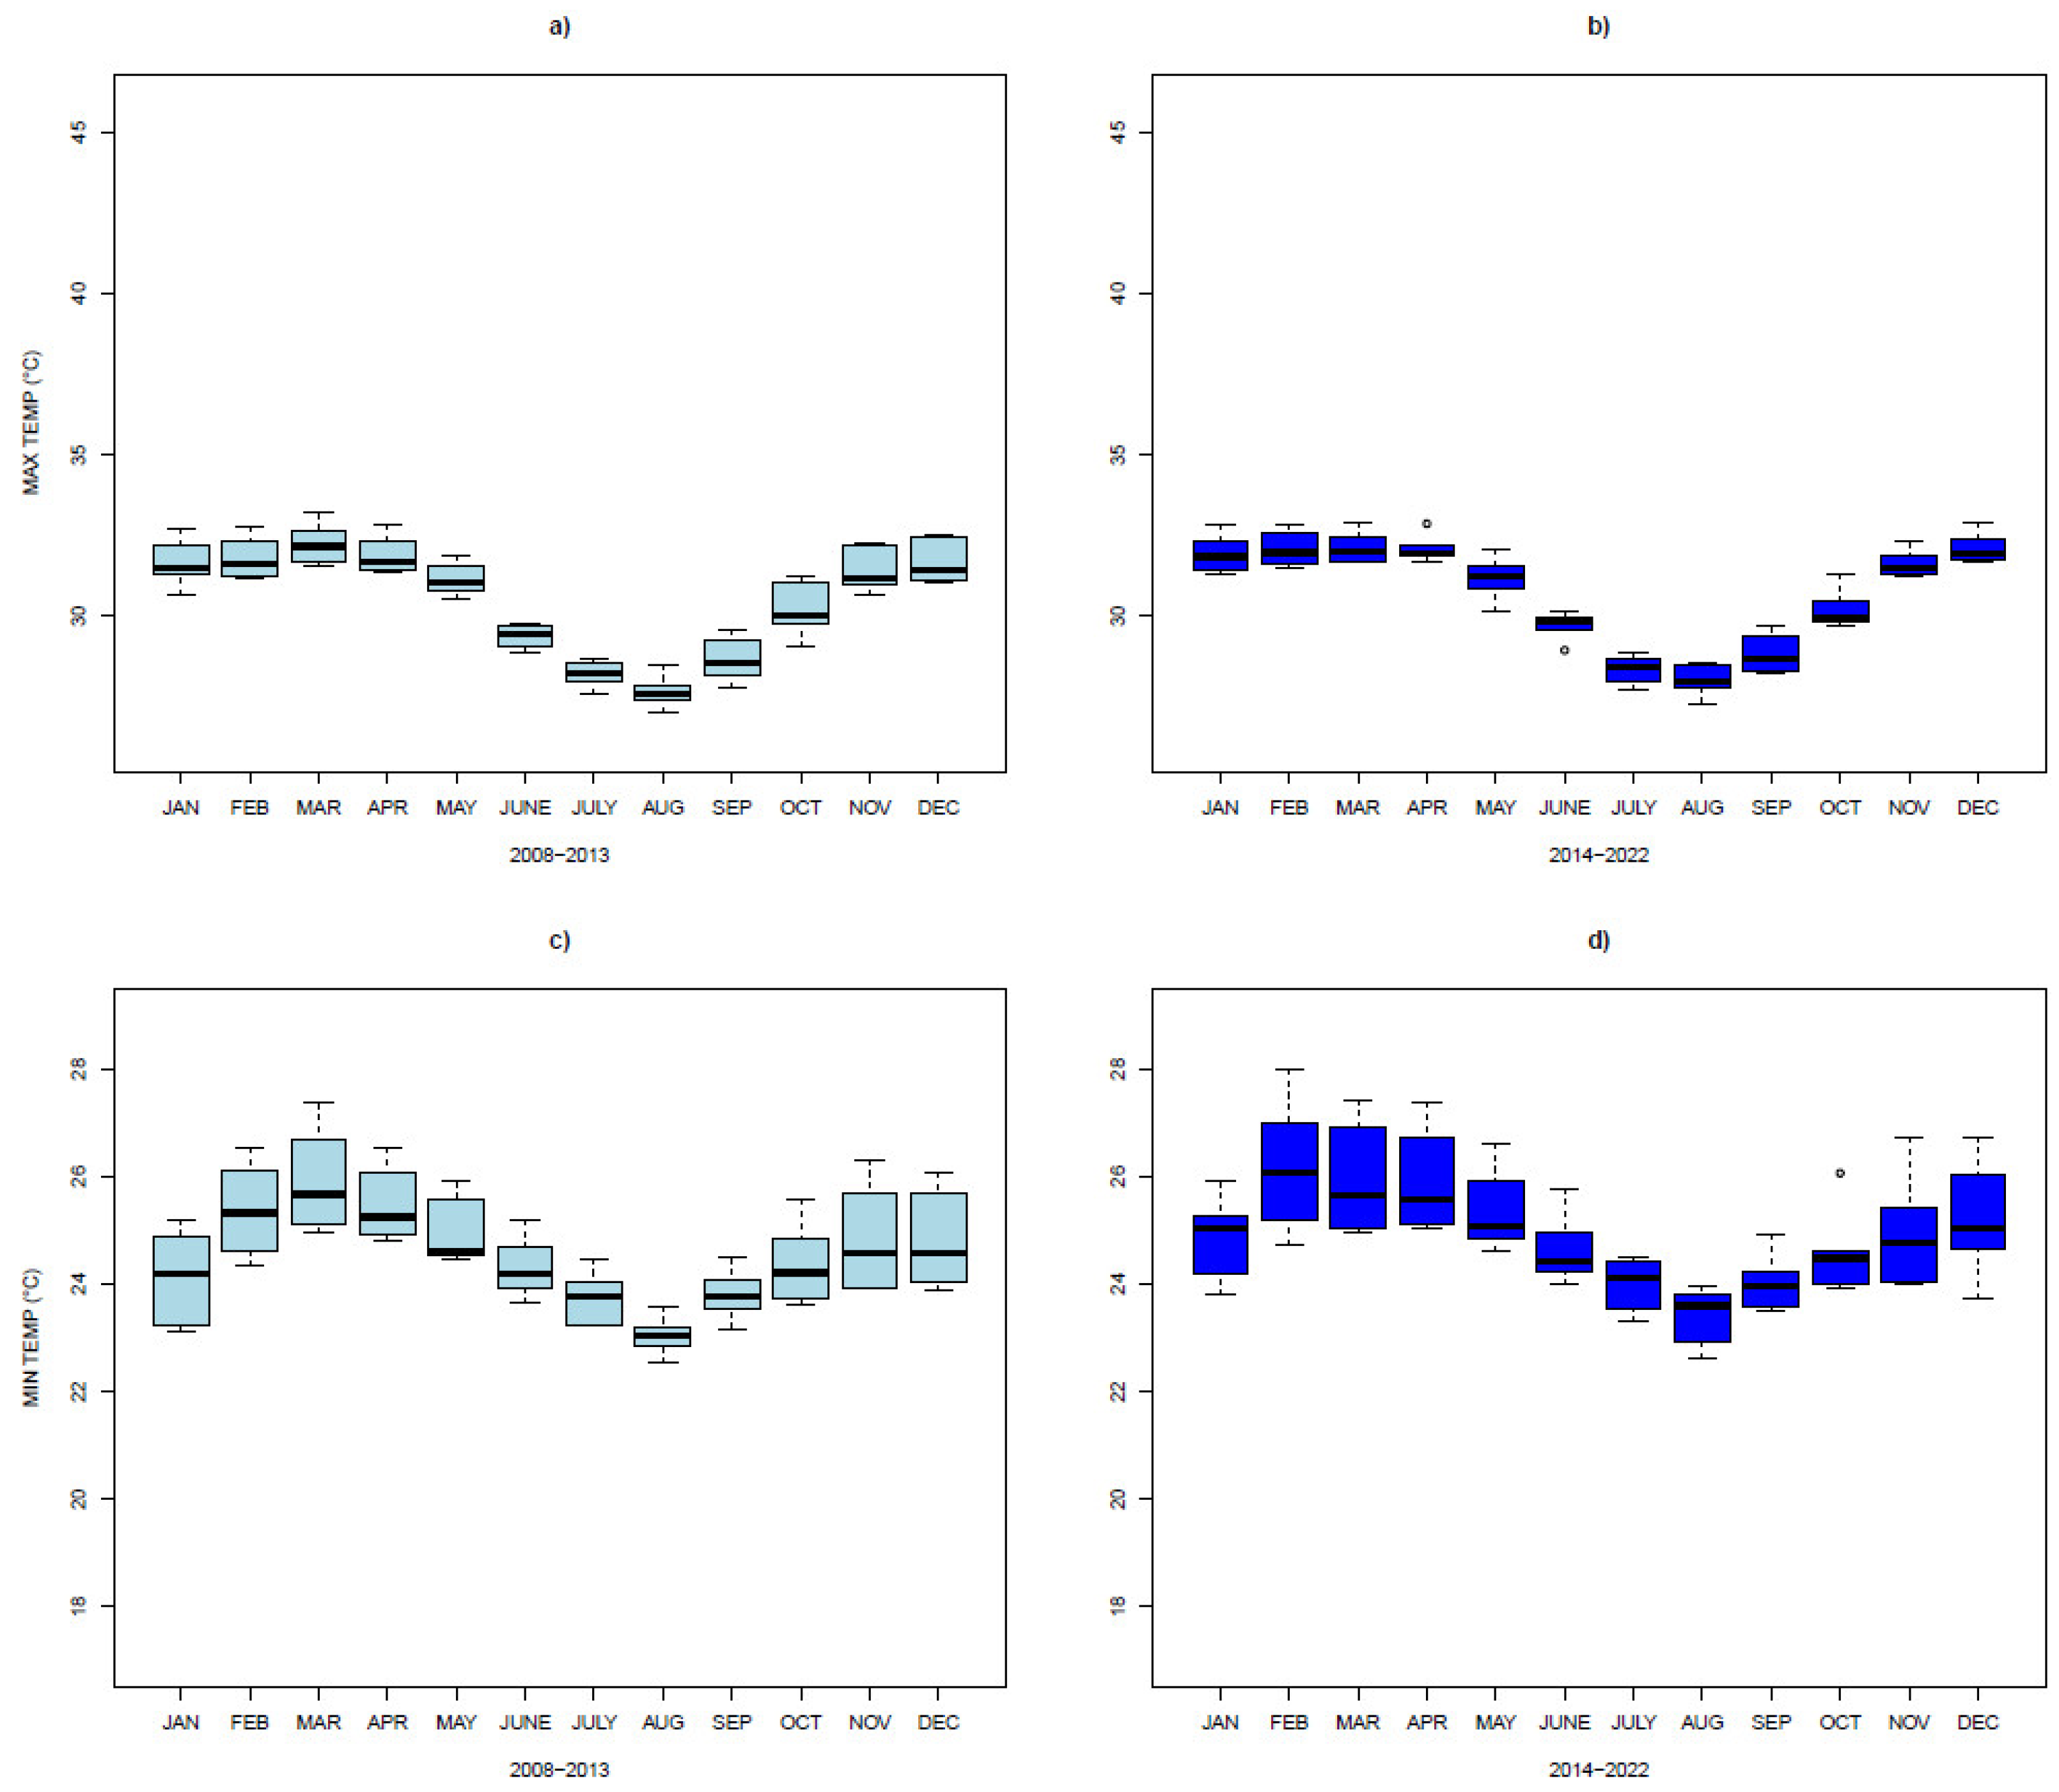
3.2.2. Annual Cycle of Temperature
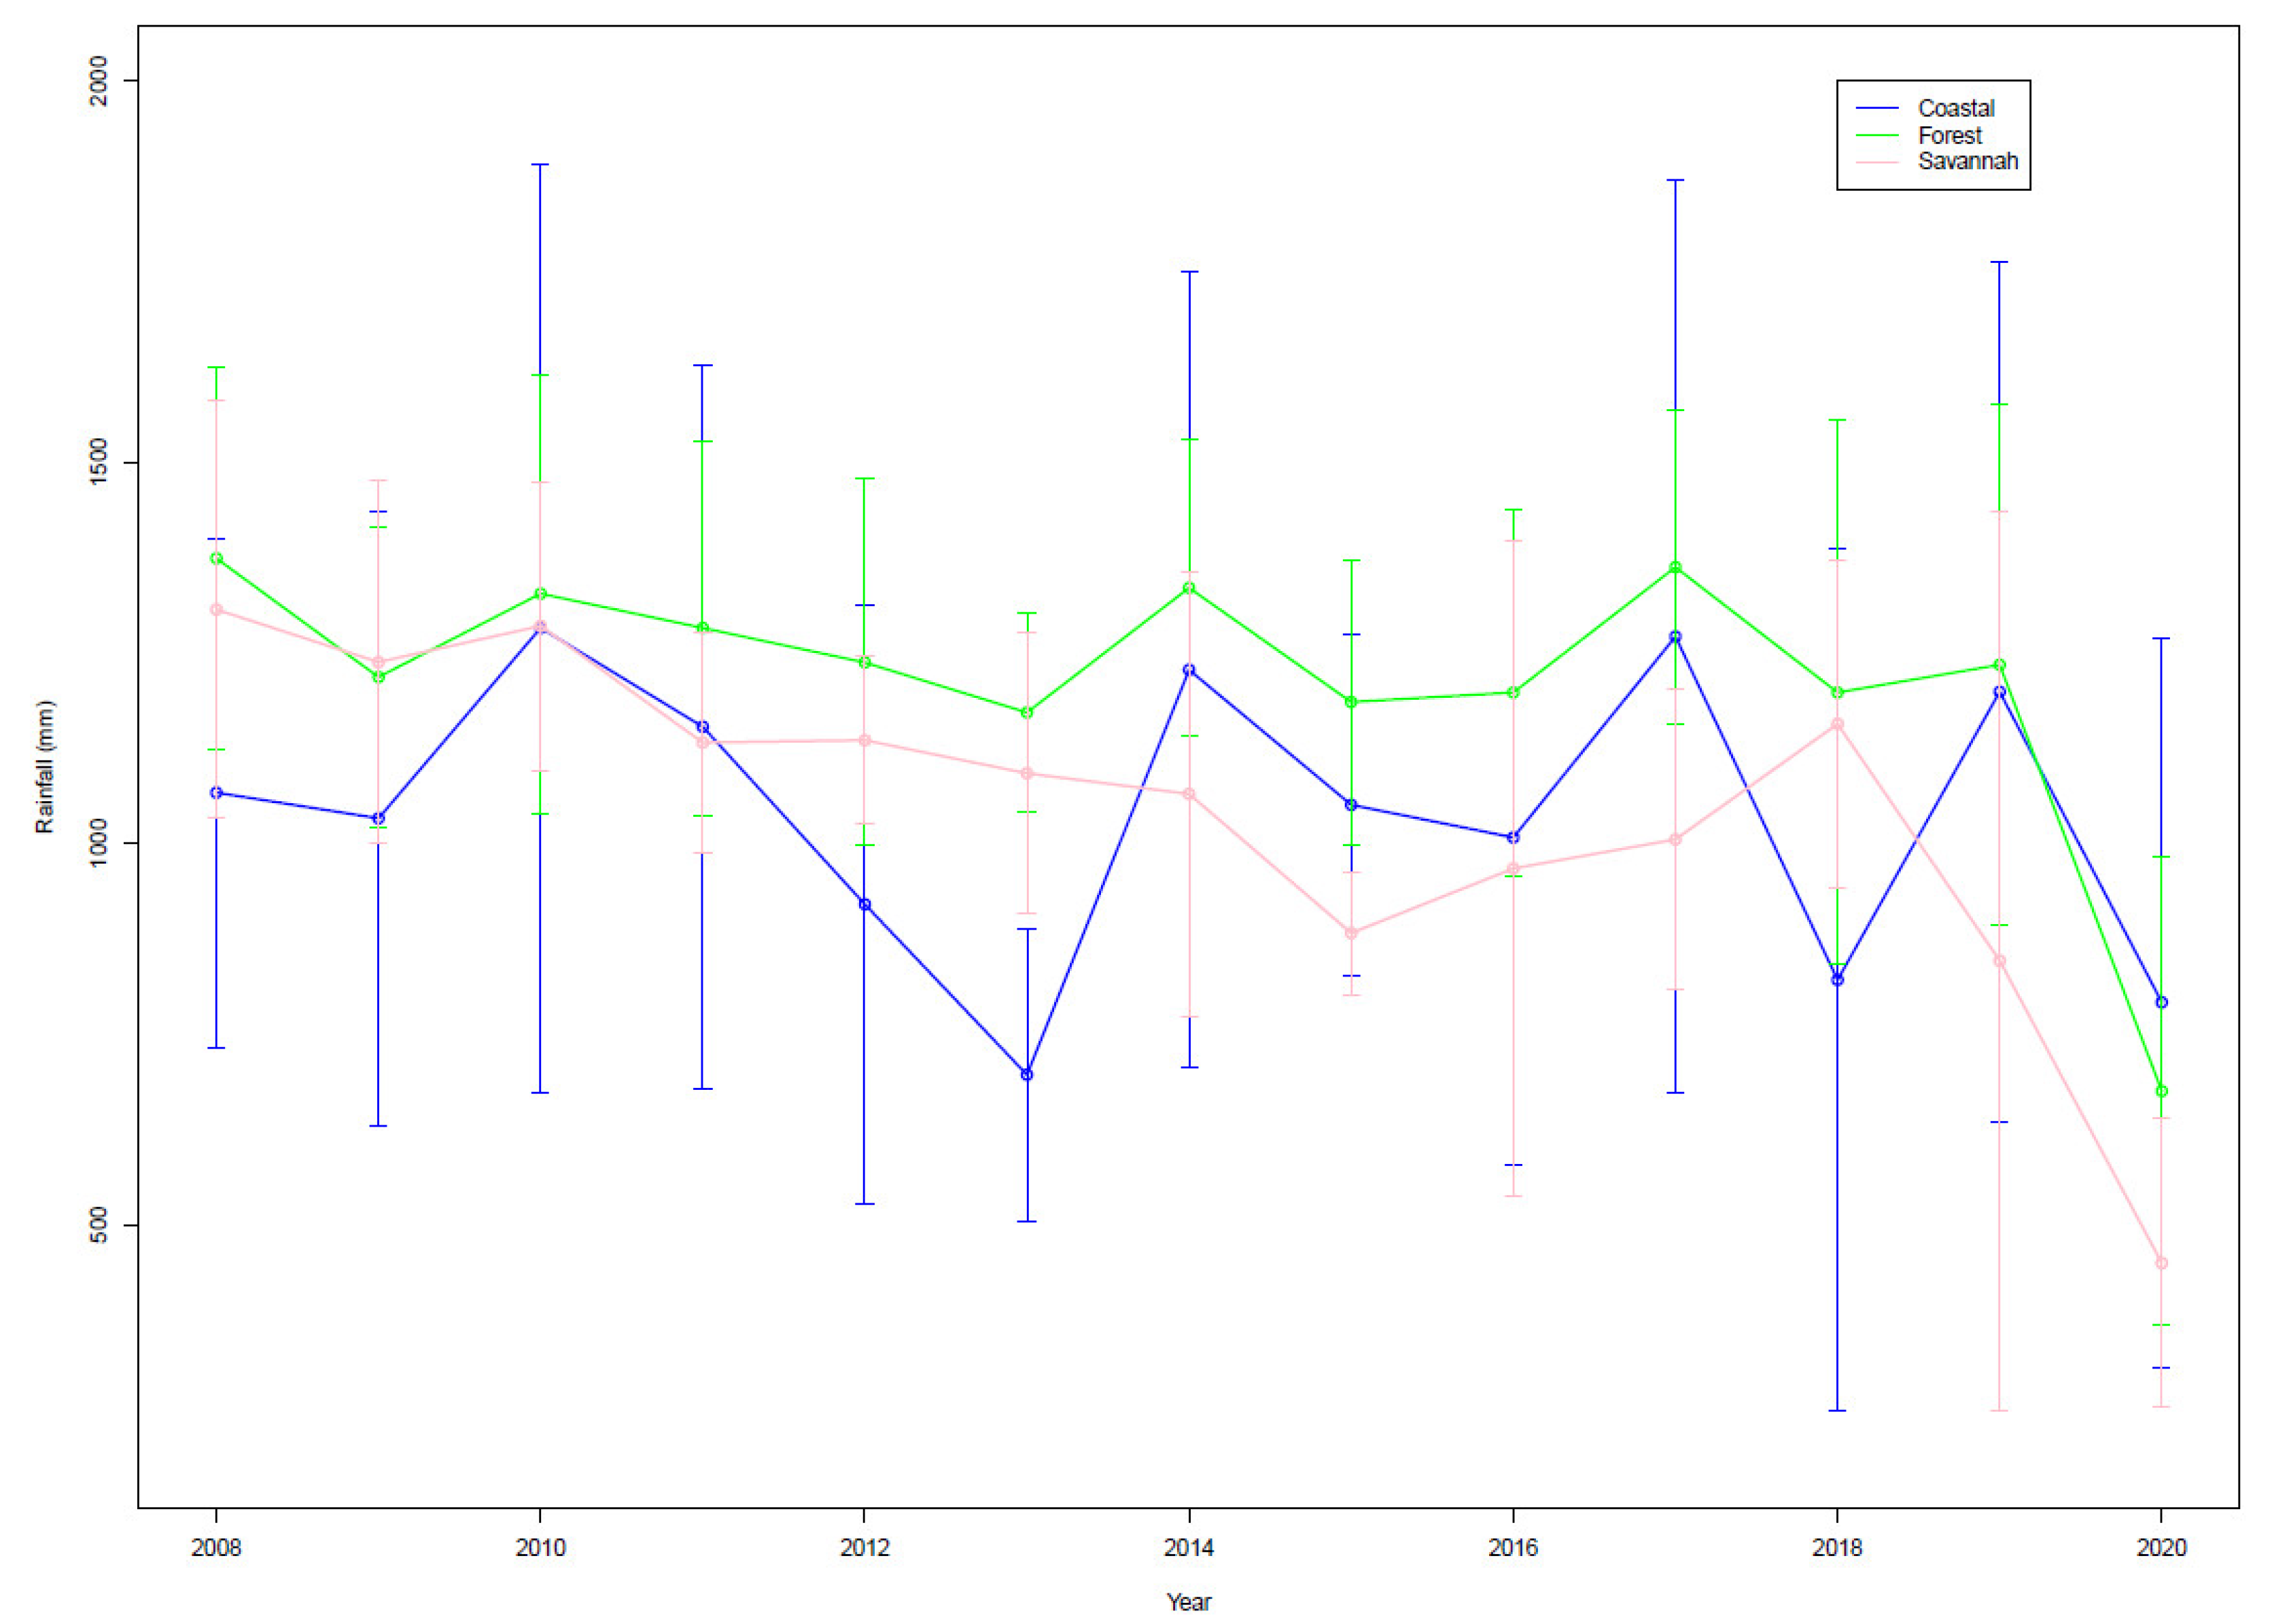
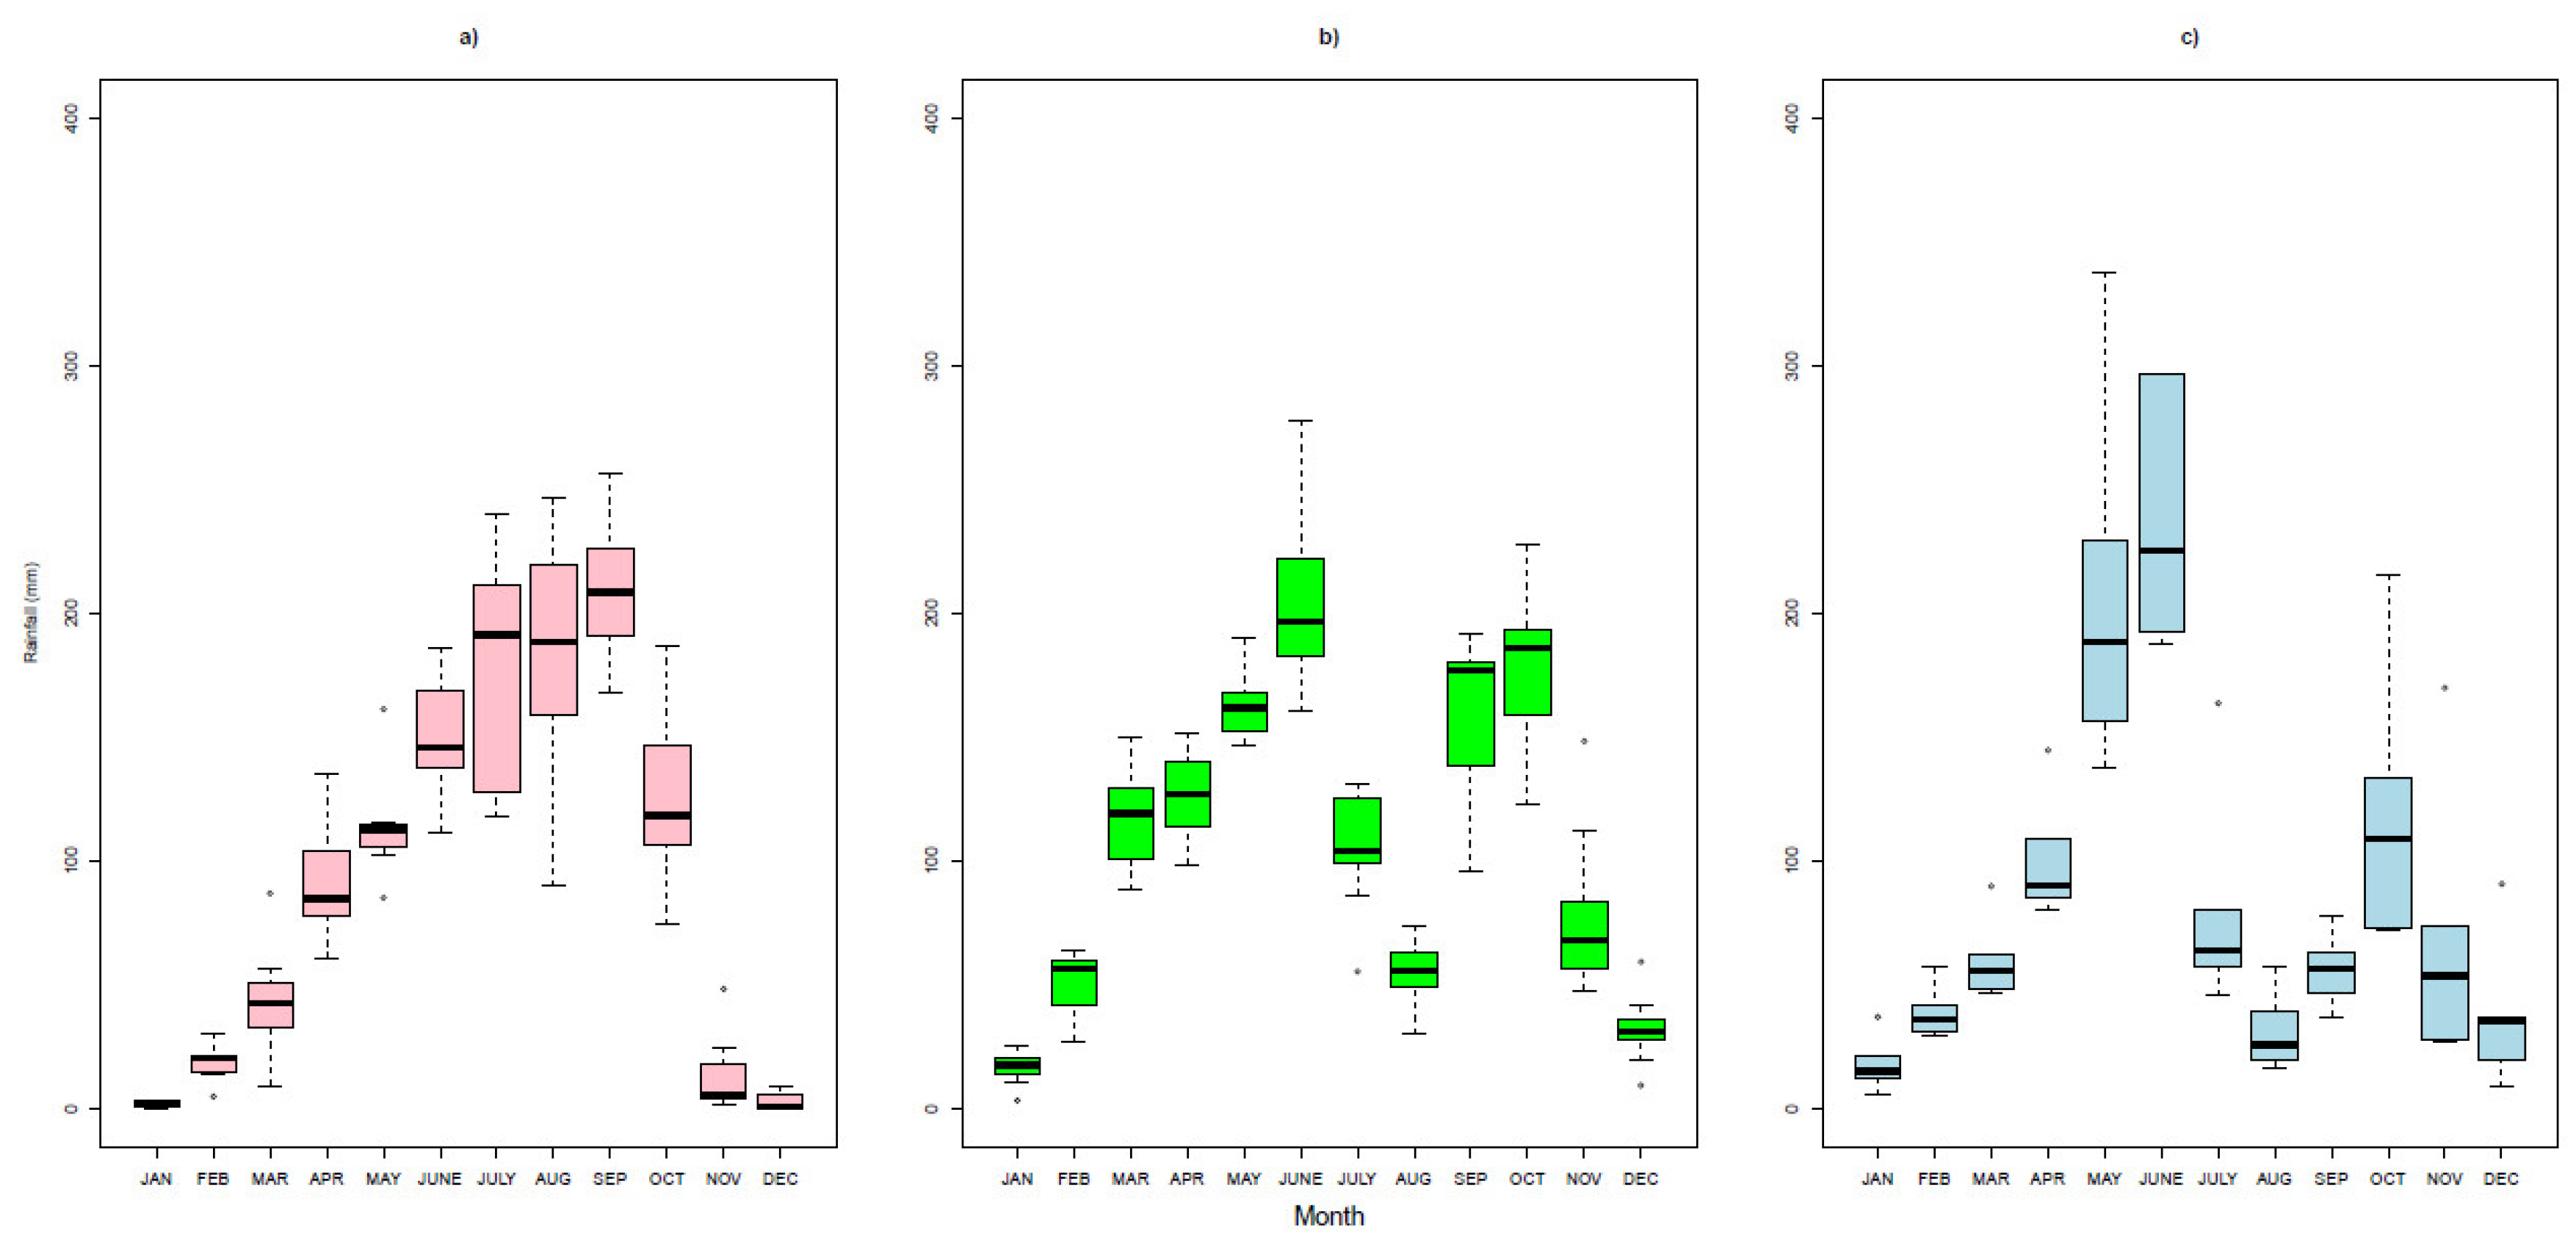
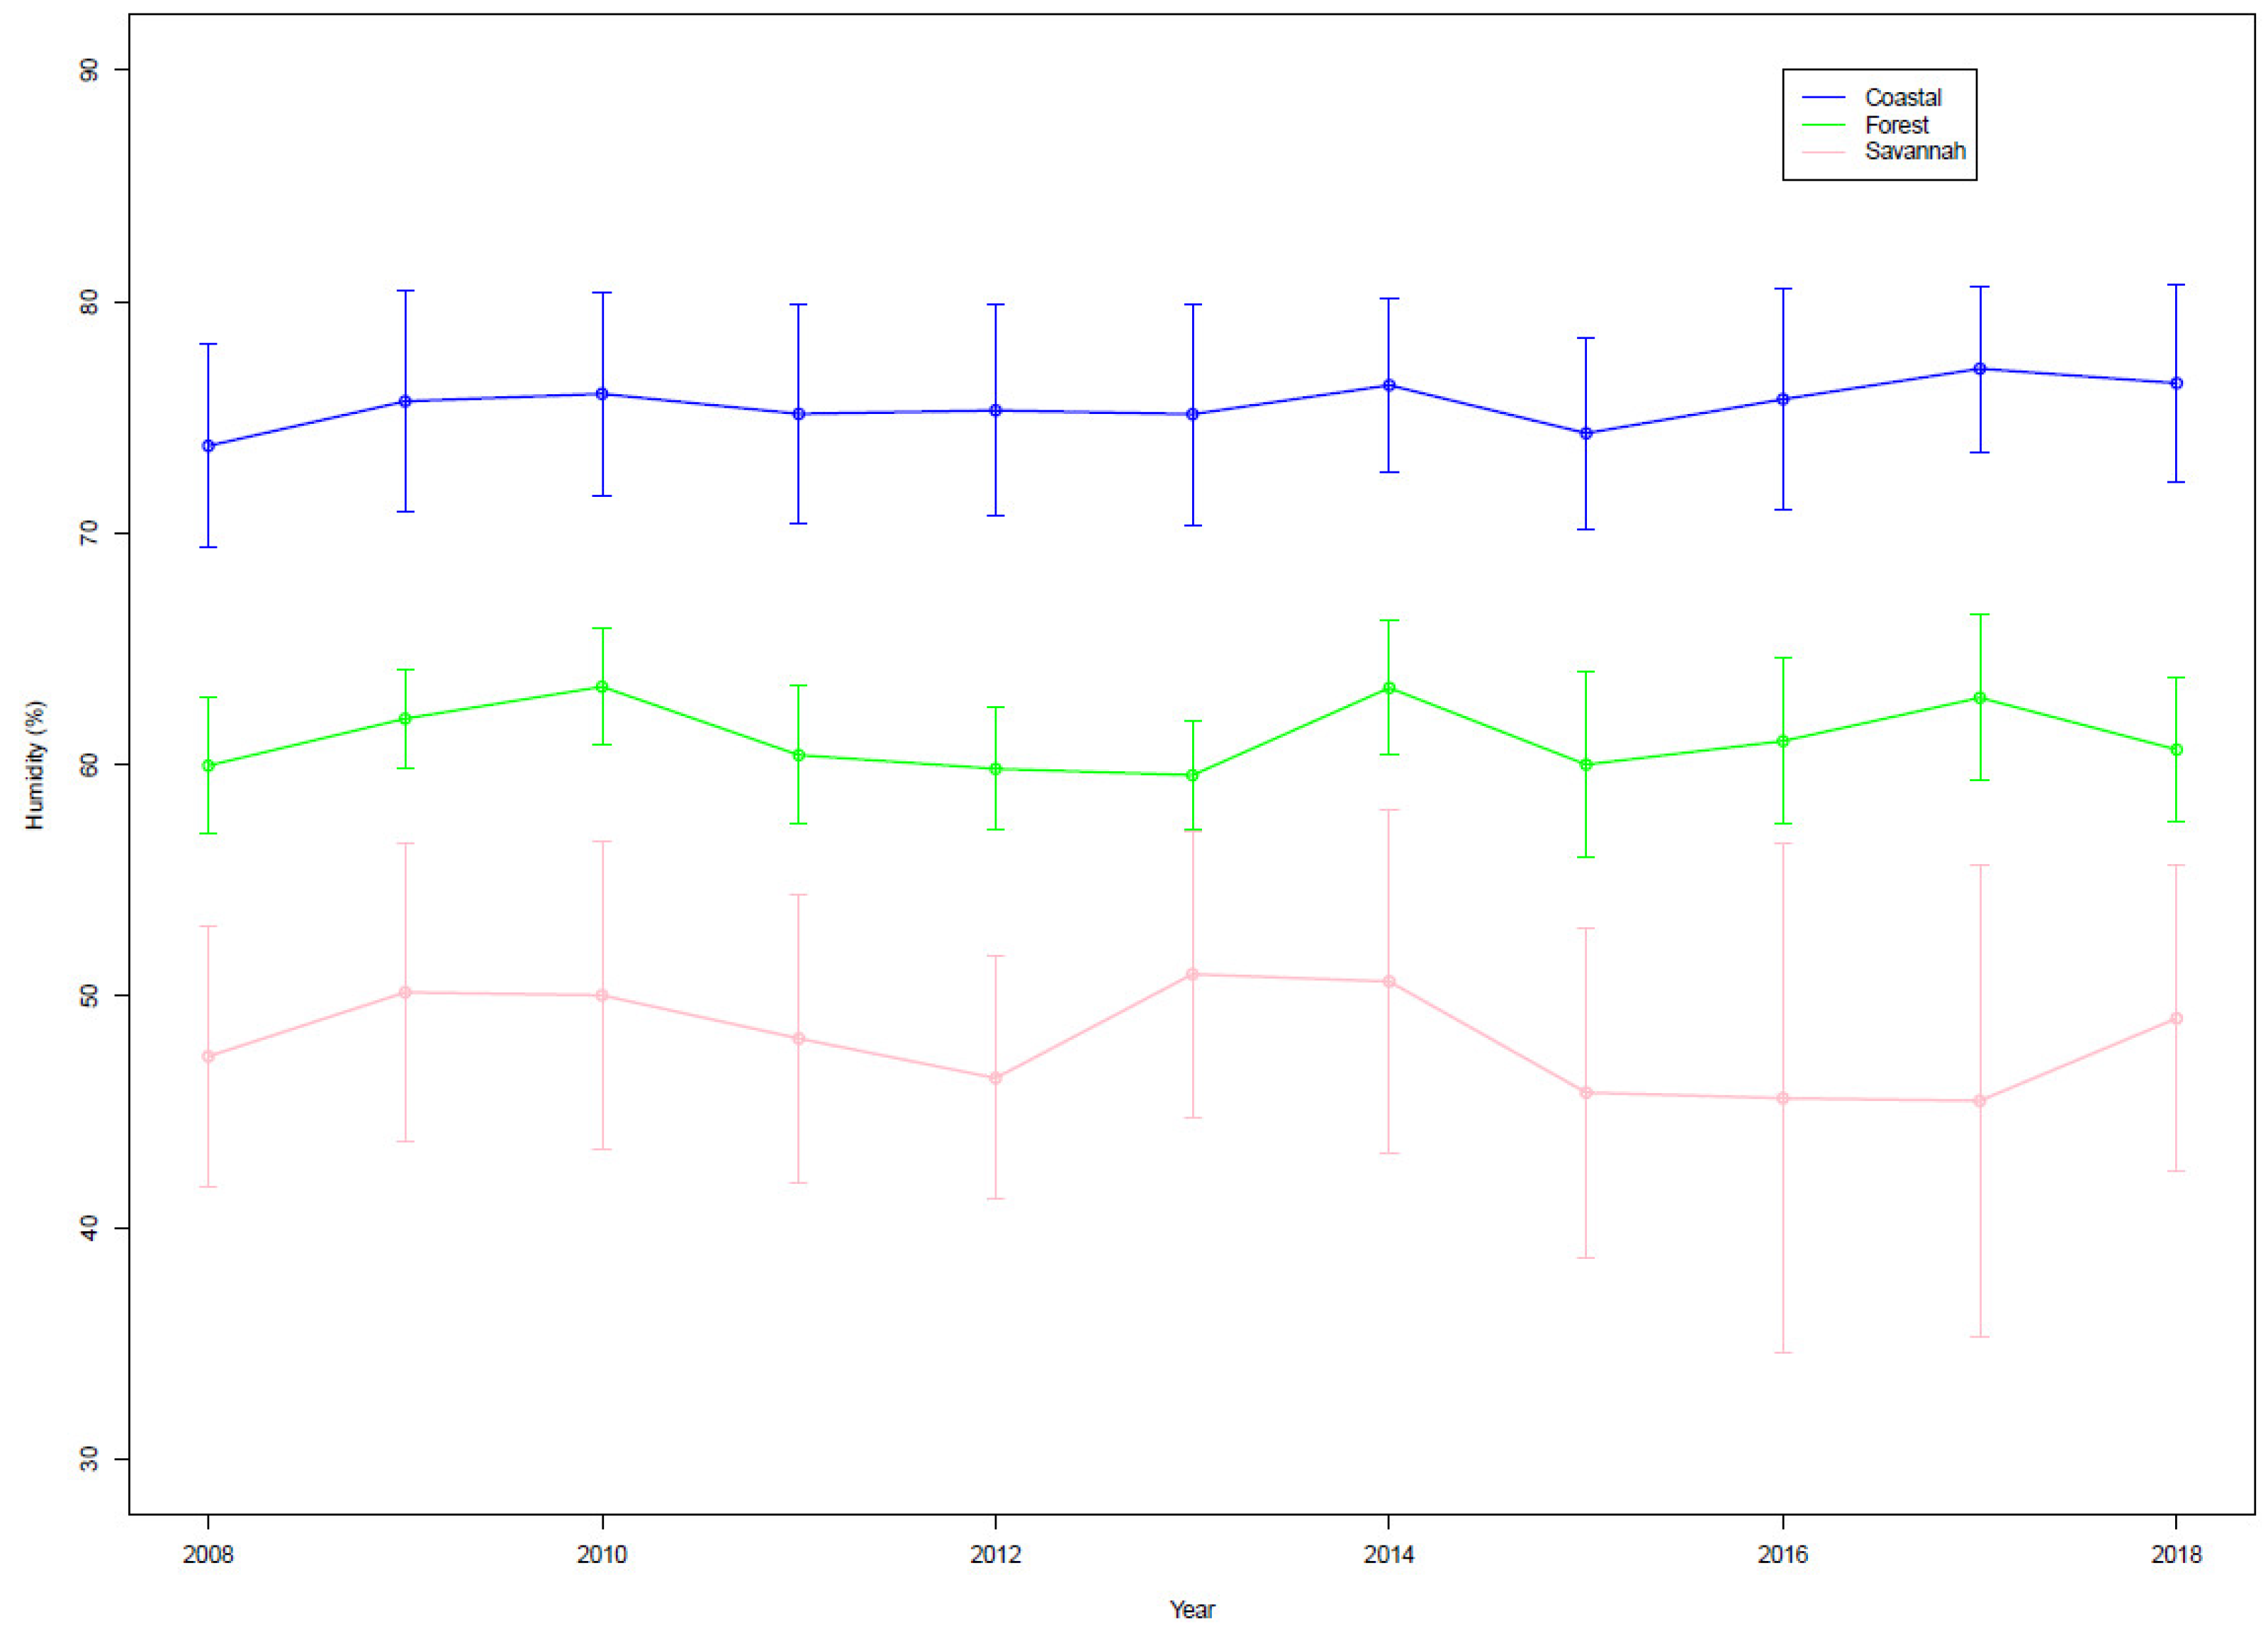
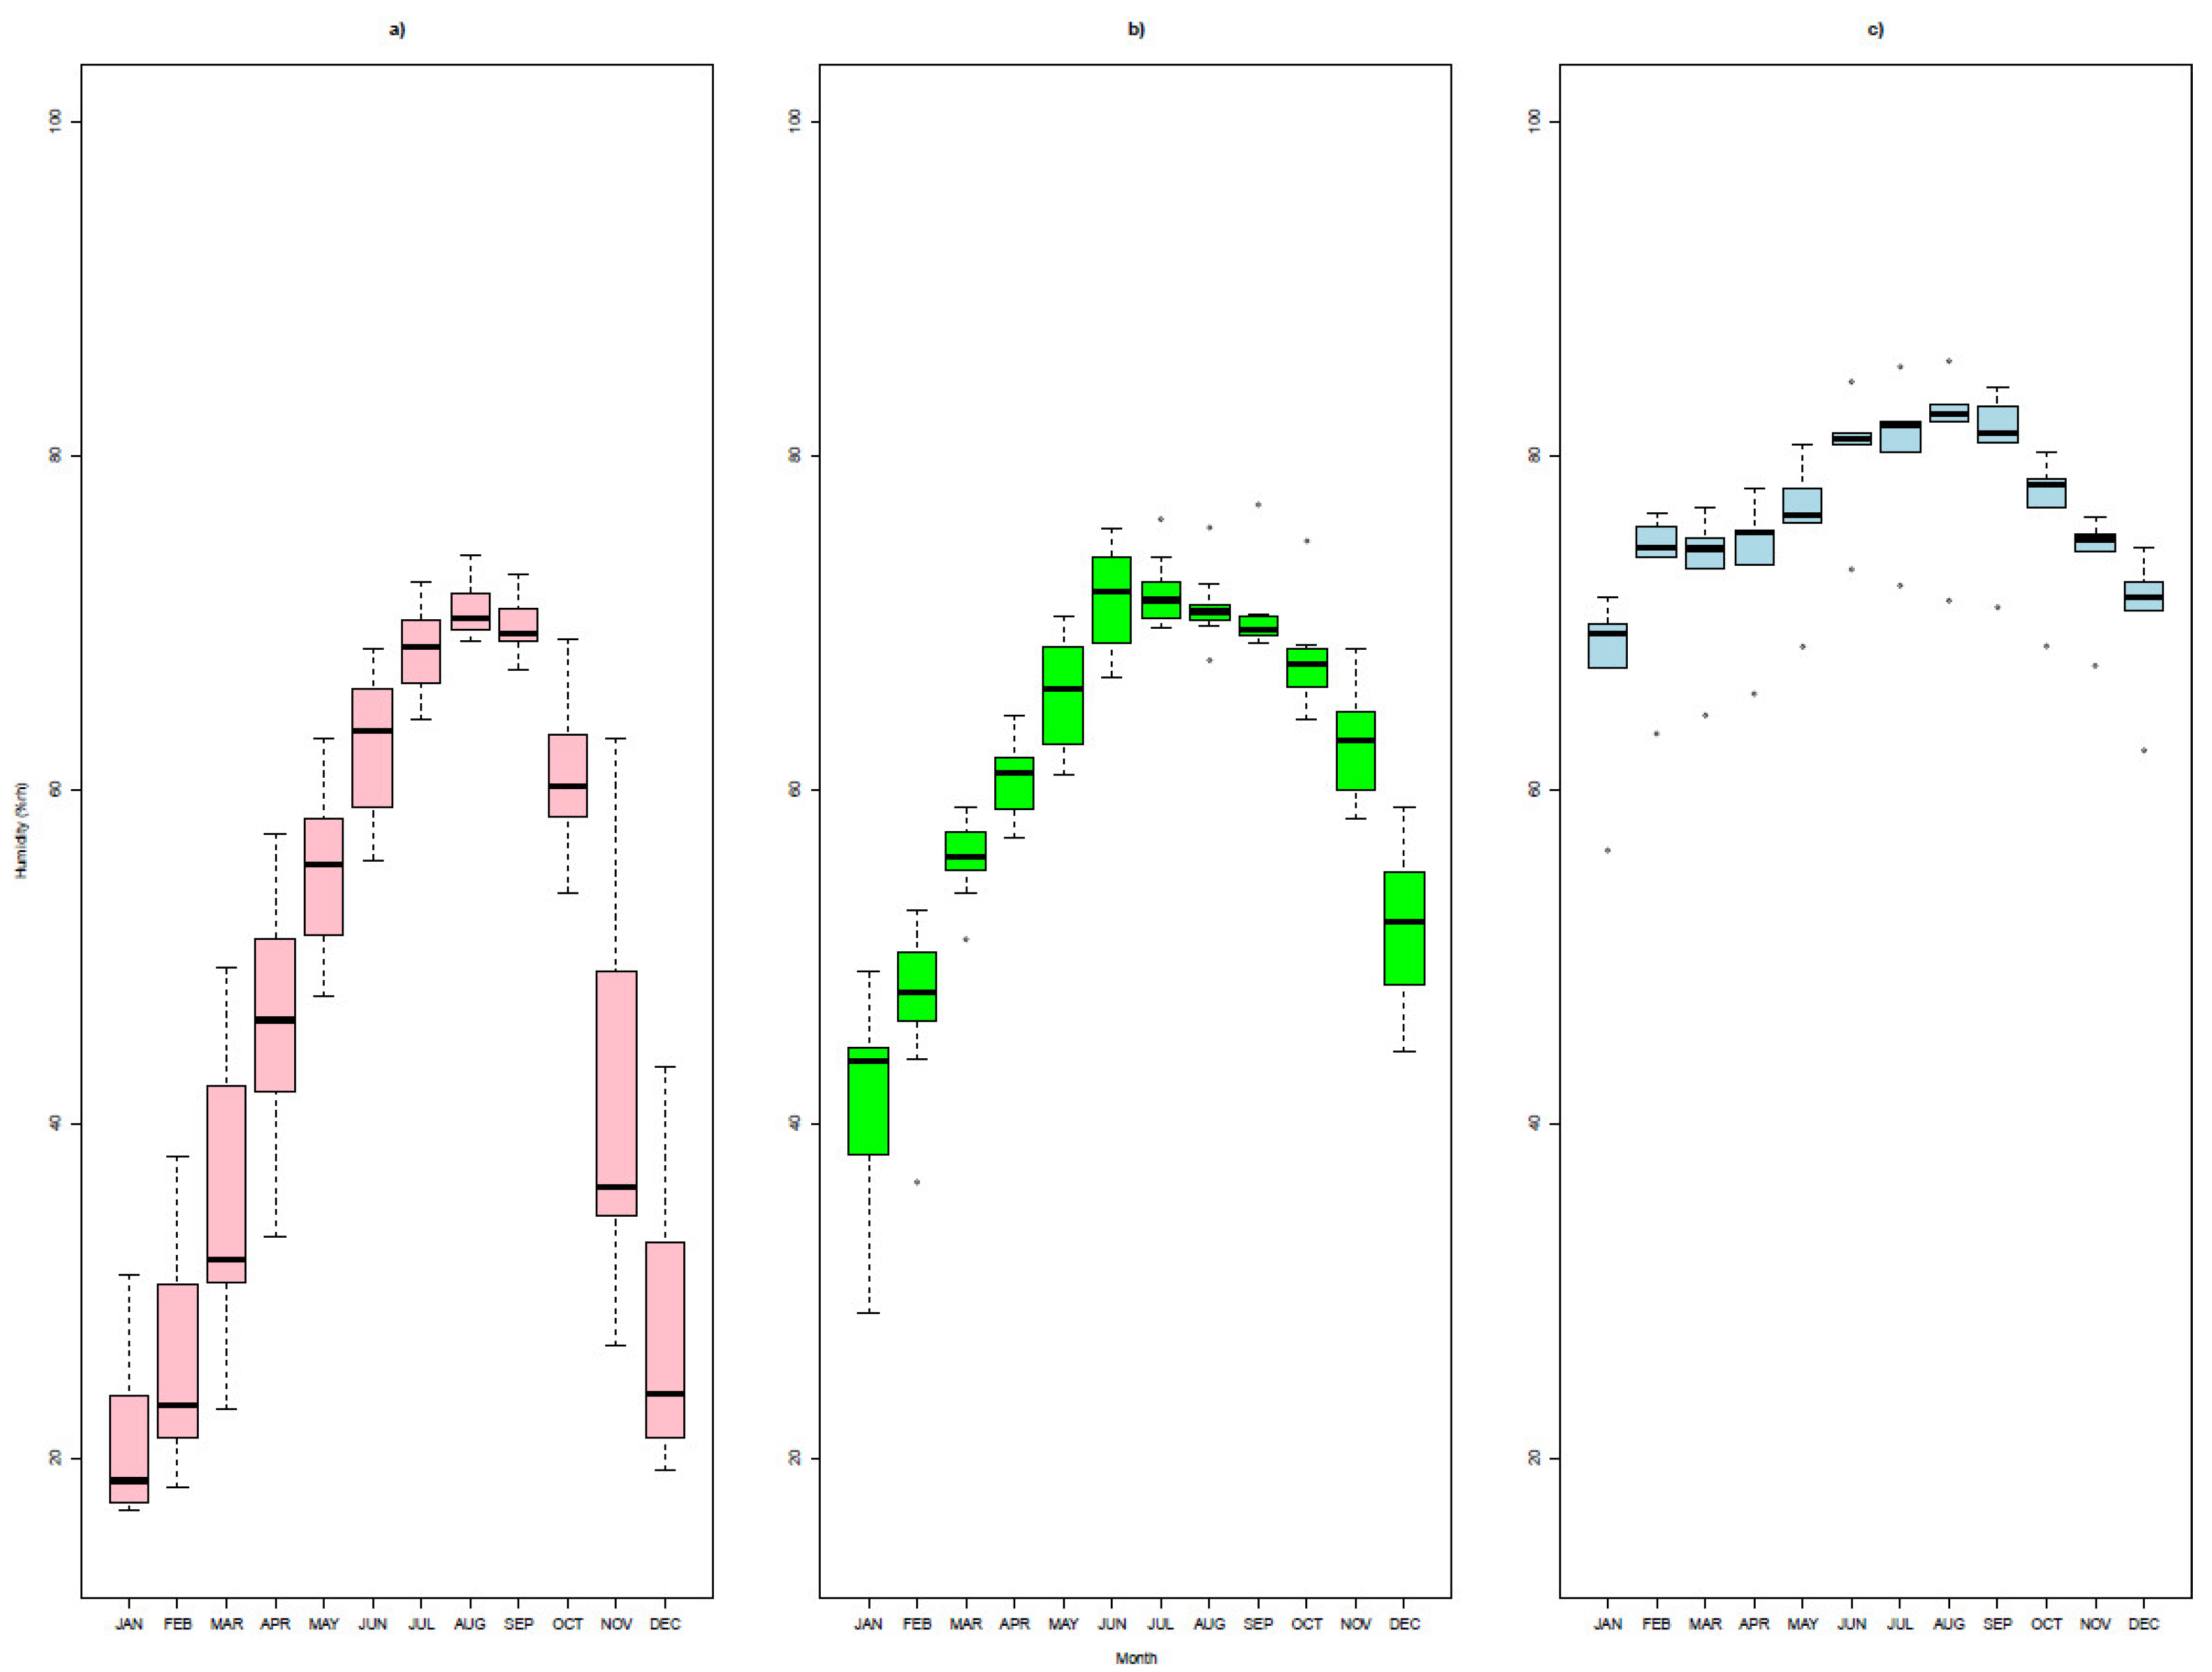
3.2.3. Interannual Variability and Annual Cycle of Precipitation and relative Humidity
3.2.4. Summary of the Climate Analysis
3.3. Correlation of Malaria and Climate Variables
4. Conclusions
Author Contributions
Funding
Data Availability Statement
Conflicts of Interest
Abbreviations
| GMet | Ghana Meteorological Agency |
| RH | Relative Humidity |
| WHO | World Health Organisation |
References
- Badmos, A.O.; Alaran, A.J.; Adebisi, Y.A.; Bouaddi, O.; Onibon, Z.; Dada, A.; Lin, X.; Lucero-Prisno, D.E. What sub-Saharan African countries can learn from malaria elimination in China. Tropical Medicine and Health 2021, 49, 1–6. [Google Scholar] [CrossRef] [PubMed]
- World Health Organization: World malaria report 2022. Available online: https://www.who.int/teams/global-malaria-programme (accessed on 13 January 2025).
- Ejigu, B.A.; Wencheko, E. Spatial Prevalence and Determinants of Malaria among under-five Children in Ghana. MedRxiv 2021. 2021.03.12.21253436. [Google Scholar]
- U.S. President’s Malaria Initiative Ghana Malaria Operational Plan 2022. Available online: www.pmi.gov (accessed on 13 January 2025).
- Cissé, G.; McLeman, R.; Adams, H.; Aldunce, P.; Bowen, K.; Campbell-Lendrum, D.; Clayton, S.; Ebi, K.L.; Hess, J.; Huang, C.; Liu, Q.; McGregor, G.; Semenza, J.; Tirado, M.C. Health, Wellbeing, and the Changing Structure of Communities. In Climate Change 2022: Impacts, Adaptation and Vulnerability. Contribution of Working Group II to the Sixth Assessment Report of the Intergovernmental Panel on Climate Change; Pörtner, H.-O., Roberts, D.C., Tignor, M., Poloczanska, E.S., Mintenbeck, K., Alegría, A., Craig, M., Langsdorf, S., Löschke, S., Möller, V., Okem, A., Rama, B., Eds.; Cambridge University Press: Cambridge, UK; New York, NY, USA; pp. 1041–1170.
- Klepac, P.; Hsieh, J.L.; Ducker, C.L.; Assoum, M.; Booth, M.; Byrne, I.; Dodson, S.; et al. Climate change, malaria and neglected tropical diseases: a scoping review. Transactions of The Royal Society of Tropical Medicine and Hygiene 2024, 118, 561–579. [Google Scholar] [CrossRef]
- Klutse, N.A.B.; Aboagye-Antwi, F.; Owusu, K. .; Ntiamoa-Baidu, Y. Assessment of Patterns of Climate Variables and Malaria Cases in Two Ecological Zones of Ghana. Open Journal of Ecology 2014, 4, 764–775. [Google Scholar] [CrossRef]
- Asare, E.O.; Amekudzi, L.K. Assessing Climate Driven Malaria Variability in Ghana Using a Regional Scale Dynamical Model. Climate 2017, 5, 20. [Google Scholar] [CrossRef]
- Ankamah, S.; Nokoe, K.S.; Iddrisu, W.A. Modelling Trends of Climatic Variability and Malaria in Ghana Using Vector Autoregression. Malaria Research and Treatment 2018. [Google Scholar] [CrossRef]
- Bessah, E.; Amponsah, W.; Owusu Ansah, S.; Afrifa, A.; Yahaya, B. , Senyo Wemegah, C.; Tanu, M.; Amekudzi, L.K.; Agyei Agyare, W. Climatic zoning of Ghana using selected meteorological variables for the period 1976-2018. Meteorological Applications, 2002. [Google Scholar]
- Turell, M.J. Effect of environmental temperature on the vector competence of Aedes fowleri for rift valley fever virus. Research in Virology 1989, 140, 147–154. [Google Scholar] [CrossRef]
- Egbendewe-Mondzozo, A.; Musumba, M.; Mccarl, B.A.; Wu, X. Climate Change and Vector-borne Diseases: An Economic Impact Analysis of Malaria in Africa. Int. J. Environ. Res. Public Health 2000, 8, 913–930. [Google Scholar] [CrossRef] [PubMed]
- Agusto, F.B.; Gumel, A.B.; Parham, P.E. Qualitative assessment of the role of temperature variations on malaria transmission dynamics. Journal of Biological Systems 2015, 23, 597–630. [Google Scholar] [CrossRef]
- Shapiro, L.L.M.; Whitehead, S.A.; Thomas, M.B. (2003). Quantifying the effects of temperature on mosquito and parasite traits that determine the transmission potential of human malaria. PLOS Biology 2003. [Google Scholar]
- Dasgupta, S. Burden of climate change on malaria mortality. International Journal of Hygiene and Environmental Health 2018, 221, 782–791. [Google Scholar] [CrossRef] [PubMed]
- Mordecai, E.A.; Paaijmans, K.P.; Johnson, L.R.; Balzer, C.; Ben-Horin, T.; Moor, E.; Mcnally, A.; Pawar, S.; Ryan, S.J.; Smith, T.C.; Lafferty, K.D. Optimal temperature for malaria transmission is dramatically lower than previously predicted. Ecology Letters 2012. [Google Scholar] [CrossRef] [PubMed]
- Paaijmans, K.P.; Read, A.F.; Thomas, M.B. Understanding the link between malaria risk and climate. Proceedings of the National Academy of Sciences of the United States of America 2009, 106, 13844–13849. [Google Scholar] [CrossRef] [PubMed]
- Oesterholt, M.J.A.M.; Bousema, J.T.; Mwerinde, O.K.; Harris, C.; Lushino, P.; Masokoto, A.; Mwerinde, H.; Mosha, F.W.; Drakeley, C.J. Spatial and temporal variation in malaria transmission in a low endemicity area in northern Tanzania. Malaria Journal 2006, 5. [Google Scholar] [CrossRef] [PubMed]
- Thomson, M.C.; Doblas-Reyes, F.J.; Mason, S.J.; Hagedorn, R.; Connor, S.J.; Phindela, T.; Morse, A.P.; Palmer, T.N. Malaria early warnings based on seasonal climate forecasts from multi-model ensembles. Nature 2006, 439, 576–579. [Google Scholar] [CrossRef]
- Akpalu, W.; Codjoe, S.N.A. Economic analysis of climate variability impact on malaria prevalence: The case of Ghana. Sustainability 2013, 5, 4362–4378. [Google Scholar] [CrossRef]
- Hay, S.I.; Rogers, D.J.; Randolph, S.E.; Stern, D.I.; Cox, J.; Shanks, D.; Snow, R. (2002). Hot topic or hot air? Climate change and malaria resurgence in East African highlands. Trends Parasitol. 2002, 18, 530–534. [Google Scholar] [CrossRef]
- Dev, V.; Dash, A.P. Rainfall and malaria transmission in north-eastern India. Annals of Tropical Medicine and Parasitology 2007, 101, 457–459. [Google Scholar] [CrossRef]
- van der Hoek, W.; Konradsen, F.; Perera, D.; Amerasinghe, P.H.; Amerasinghe, F.P. Correlation between rainfall and malaria in the dry zone of Sri Lanka. Annals of Tropical Medicine & Parasitology 1997, 91, 945–949. [Google Scholar]
- Nsereko, G.; Kadobera, D.; Okethwangu, D.; Nguna, J.; Rutazaana, D.; Kyabayinze, D.J.; Opigo, J.; Ario, A.R. (2020). Malaria outbreak facilitated by appearance of vector-breeding sites after heavy rainfall and inadequate preventive measures: Nwoya District, Northern Uganda, February-May 2018. Journal of Environmental and Public Health 2020. [Google Scholar] [CrossRef] [PubMed]
- Nissan, H.; Ukawuba, I.; Thomson, M. Climate-proofing a malaria eradication strategy. Malaria Journal, 2021; 20. [Google Scholar]
- Bhattacharya, S.; Sharma, C.; Dhiman, R.C.; Mitra, A.P. (2006) Climate change and malaria in India. Current Science 2006, 90, 369–375. [Google Scholar]
- Haque, U.; Glass, G.E.; Bomblies, A.; Hashizume, M.; Mitra, D.; Haque, R.; Yamamoto, T. The role of climate variability in the spread of malaria in Bangladeshi highlands. PLoS ONE 2010, 5, e14341. [Google Scholar] [CrossRef] [PubMed]
- Tian, L.; Bi, P.; Cazelles, B.; Zhou, S.; Huang, C.; Yang, J. One-year delayed effect of fog on malaria transmission: A time-series analysis in the rain forest area of Mengla County, south-west China. Malaria Journal, 2008; 7. [Google Scholar]
- FAO: Fertilizer use by crop in Ghana. Rome (2005): Food and Agriculture Organization of the United Nations. Available online: https://www.fao.org/4/a0013e/a0013e00.htm (accessed on 13 January 2025).
- Abass, K. A regional geography of Ghana for senior high schools and undergraduates; Pictis Publications: Accra, Ghana, 2009. [Google Scholar]
- Asante, F.A.; Amuakwa-Mensah, F. Climate change and variability in Ghana: Stocktaking. Climate 2015, 3, 78–99. [Google Scholar] [CrossRef]
- Ghana Statistical Service: 2021 population & housing census. Available online: https://statsghana.gov.gh/gssmain/fileUpload/pressrelease/Population_projection_280624_final_ffa2[1][2]_with_links[_final_website.pdf (accessed on 13 January 2025).
- WHO: Ghana Malaria incidence (per 1000 population at risk) Available online:. Available online: https://data.who.int/indicators/i/B868307/442CEA8?m49=288 (accessed on 13 January 2025).
- U.S. President’s Malaria Initiative Ghana Malaria Operational Plan 2020. Available online: www.pmi.gov (accessed on 13 January 2025).
- Country Coordinating Mechanism (CCM) Ghana: Malaria in Ghana: 2018-2020 Principal Recipients. Available online: https://www.ccmghana.net/index.php/principal-recipients/2018-2020/malaria (accessed on 24 May 2022).
- Yamba, E.I.; Fink, A.H.; Badu, K.; Asare, E.O.; Tompkins, A.M.; Amekudzi, L.K. Climate Drivers of Malaria Transmission Seasonality and Their Relative Importance in Sub-Saharan Africa. GeoHealth 2023, 7. [Google Scholar] [CrossRef] [PubMed]
- Vitolo, C.; Scutari, M.; Ghalaieny, M.; Tucker, A.; Russell, A. Modeling Air Pollution, Climate, and Health Data Using Bayesian Networks: A Case Study of the English Regions. Earth and Space Science 2018, 5, 76–88. [Google Scholar] [CrossRef]
- Harwood, H.; Hall, R.; Di Capua, G.; Russell, A.; Tucker, A. Using Bayesian Networks to investigate the influence of subseasonal Arctic variability on midlatitude North Atlantic circulation. Journal of Climate 2021, 34, 2319–2335. [Google Scholar] [CrossRef]

| Region | Population | Population Density (km-2) |
|---|---|---|
| Ahafo | 564,668 | 108.6 |
| Ashanti | 5,440,463 | 222.7 |
| Bono | 1,208,649 | 108.8 |
| Bono East | 1,203,400 | 51.8 |
| Central | 2,859,821 | 291.0 |
| Eastern | 2,925,653 | 151.0 |
| Greater Accra | 5,455,692 | 1678.3 |
| North East | 658,946 | 72.6 |
| Northern | 2,310,939 | 87.1 |
| Oti | 747,248 | 67.5 |
| Savannah | 653,266 | 18.7 |
| Upper East | 1,301,226 | 49.0 |
| Upper West | 901,502 | 173.6 |
| Volta | 1,659,040 | 148.6 |
| Western | 2,060,585 | 148.6 |
| Western North | 880,921 | 87.4 |
| Total | 30,832,019 | 128.8 |
| Synoptic station (zone) | Latitude | Longitude |
|---|---|---|
| Tamale (savannah) | 9.42 | -0.85 |
| Yendi (savannah) | 9.45 | -0.02 |
| Bole (savannah) | 9.03 | -2.48 |
| Navrongo (savannah) | 10.90 | -1.10 |
| Wa (savannah) | 10.05 | -2.50 |
| Kete Krachi (savannah) | 7.82 | -0.03 |
| Kumasi (forest) | 6.72 | -1.60 |
| Sunyani (forest) | 7.33 | -2.33 |
| Wenchi (forest) | 7.75 | -2.10 |
| Ho (forest) | 6.60 | 0.47 |
| Akatsi (forest) | 6.12 | 0.80 |
| Koforidua (forest) | 6.08 | -0.25 |
| Akuse (forest) | 6.10 | 0.12 |
| Akim - Oda (forest) | 5.93 | -0.98 |
| Abetifi (forest) | 5.60 | -0.17 |
| Sefwi Bekwai (forest) | 6.20 | -2.33 |
| Accra (coastal) | 5.60 | -0.17 |
| Tema (coastal) | 5.62 | 0.00 |
| Ada (coastal) | 5.38 | 0.63 |
| Saltpond (coastal) | 5.20 | -1.07 |
| Takoradi (coastal) | 4.88 | -1.77 |
| Axim (coastal) | 4.87 | -2.23 |
| Coastal | Forest | Savannah | |
|---|---|---|---|
| Malaria season | May-Nov | May-Nov | Jul-Nov |
| Temperature (interannual) | Within 21–33°C optimum range for all years | Within 21–33°C optimum range for all years | Exceeds 34°C after 2014 (21–33°C optimum range) |
| Temperature (annual cycle) | 21–33°C all year | 21–33°C in Apr-Dec | 21–33°C in Jun-Nov |
| Precipitation (interannual) | Within 690–1300 mm, optimum range for all years | Within 670–1400 mm, optimum range for all years | Within 450–1400 mm, optimum range for all years |
| Precipitation (annual cycle) | Moderate to high Apr-Sept | Moderate to high Mar-Oct | Moderate to high Mar-Oct |
| RH (interannual) | 73–77% (within 55–80% optimum range) | 59–64% (within 55–80% optimum range) | 45–51% (outside 55–80% optimum range) |
| RH (annual cycle) | 55–80% in Oct-May | 55–80% in Apr-Nov | 55–80% in May-Oct |
| Climate variable | r (national) | r (savannah) | r (forest) | r (coastal) |
|---|---|---|---|---|
| Mean temp. | -0.54 (0.04) | -0.44 (0.10) | -0.50 (0.06) | -0.60 (0.02) |
| Max temp. | -0.55 (0.03) | -0.34 (0.22) | -0.47 (0.07) | -0.51 (0.05) |
| Min temp. | -0.49 (0.07) | -0.45 (0.09) | -0.48 (0.07) | -0.59 (0.02) |
| Rainfall | -0.42 (0.11) | 0.47 (0.08) | 0.47 (0.08) | 0.32 (0.24) |
| Humidity | 0.02 (0.96) | 0.32 (0.34) | -0.32 (0.33) | -0.19 (0.60) |
Disclaimer/Publisher’s Note: The statements, opinions and data contained in all publications are solely those of the individual author(s) and contributor(s) and not of MDPI and/or the editor(s). MDPI and/or the editor(s) disclaim responsibility for any injury to people or property resulting from any ideas, methods, instructions or products referred to in the content. |
© 2025 by the authors. Licensee MDPI, Basel, Switzerland. This article is an open access article distributed under the terms and conditions of the Creative Commons Attribution (CC BY) license (http://creativecommons.org/licenses/by/4.0/).


