Highlights:
hMPV has reemerged as reported in the beginning of 2025.
hMPV has been reported in Asian regions recently.
The model indicated hMPV has potential distribution to high latitude and longitude towards north and east of Asia continent.
hMPV has preferences for winter and lower temperature, and also high precipitation.
Local transmission data required urgently to confirm the potential distribution in low latitude and southern hemisphere.
1. Introduction
The first occurrences of hMPV were firstly reported by Hoogen et al. (2001) following a suspected case in the Netherland, a country in the temperate regions. A few years after that, Rao et al. (2004) reported a case in Pune, India. It indicates a virus's potential to spread over a distance. After that, the occurrences of hMPV have been reported in several locations around the world, ranging from Canada, the United Kingdom, and Australia (Nissen et al. 2002). This situation indicates the ability of the virus to spread and be regulated by environmental variables, including climate variables. Since the virus has the ability to adapt to the new locations, then it requires an approach to estimate its potential distribution. A method used widely to study the potential distribution is using machine learning.
Recently, numerous machine learning-based modeling has been used to estimate the disease potential distribution, including viruses and COVID-19 (He et al. 2021, Pramanik et al. 2021, Pan et al. 2024). As an example, Yu et al. (2019) have used the model to predict the potential geographical distribution of the H7N9 avian influenza virus in several locations in China where known as high-risk zones for H7N9 occurrences. Following the progress and advantages of the distribution model, it is important to elaborate the bioclimatic variables responsible for present distribution as well as the potential distribution of hMPV across Asian regions. Hence, the present study used the machine learning-based potential distribution modeling approach to determine the risk areas of hMPV and climatic sensitivity influencing the hMPV occurrences based on reports and existing data. The machine learning then is considered the only efficient approach for controlling and preventing the hMPV potential spreads and also to identify the determinant bioclimatic risk of hMPV.
2. Materials and Methods
The research was conducted on several Asian countries where hMPV has been reported recently. The modeling methodology followed recent study (Ren et al. 2020), including hMPV occurrence, bioclimatic variables, and model evaluation.
2.1. Study Site
The study was implemented in several Asian countries where hMPV has been reported recently. Deep analysis was implemented in the regions that have the most hMPV reports, and the data can be used for modeling.
2.2. hMPV Occurrences
HMPV just reemerged recently, and this has limited the data collection. Most of the data and hMPV occurrences were based on the news where the geographical locations of hMPV occurrences were mentioned. The geographical locations then were tracked to record the geocoordinates. If the locations were a city, then a geocoordinate of the center of the city were retrieved. The geocoordinates were tabulated as longitude and latitude and saved as CSV formats for further analyses. The threshold for hMPV occurrences data recording was 9th January 2025.
2.3. Bioclimatic Variables
This study, in accordance with Dong et al. (2023) and Arshad et al. (2022), incorporated a variety of 19 bioclimatic variables (
Table 1) range from Bio 1 to Bio 19 and retrieved from the WordClim global climate database (
www.worldclim.org), specifically version 2.0 [33]. This database is widely used including in Asia (Rana et al. 2017) and has been used extensively to develop potential distribution model (Khanum et al. 2013). Grids were used to visualize the bioclimatic variables. These grids have a spatial resolution of roughly 25 m
2 at the equator and less elsewhere (Fick et al. 2013).
In order to produce an accurate and unbiased potential distribution model, those bioclimatic variables were selected based on the selection and exploration of bioclimatic variables having a major contribution. Each bioclimatic variable's contribution to the final model was assessed using Jackknife analysis. If those bioclimatic variables having a low percentage contribution or with values less than 6%, then those bioclimatic variables were considered having less impacts on distribution model (Wei et al. 2018).
2.4. Multicollinearity Test
The distribution model was developed upon the association of hMPV occurrences with 19 bioclimatic variables. To gain the unbiased distribution model, the bioclimatic variables needed to be checked for their possibility of collinearity among variables. Here in this study, by using Pearson's correlation tests (Préau et al. 2018) on 19 bioclimatic variables with ranges of Bio 1 – Bio 19, a multicollinearity test was carried out to create a model with improved performance with fewer variables and to prevent collinearity between the variable. Highly cross-correlated variables with r
2 values larger than 0.8 were eliminated, while variables with r
2 values less than 0.8 were retained for additional examination in the context of geographical distribution modeling. When multicollinearity arises, a variable's predictive capacity is unstable and unreliable because it has a strong correlation with other variables in the model (As’ary et al. 2022). The chosen bioclimatic variables to be employed were Bio 1, 9, and 15 based on the results of the multicollinearity test (
Table 1).
2.5. hMPV Potential Distribution Modeling
In order to produce estimated suitable distribution areas of hMPV across Asian regions, this study uses machine learning (Dolci and Peruzzi 2022) within R applications version 3.6.3 (Mao et al. 2021). The R applications used to support the machine learning analyses and create the hMPV suitability models include the"dismo" and "sp" packages (Khan et al. 2022), the "rgdal" package (Bivand 2022), and the "raster" library (Lemenkova 2020). For developing the suitable distribution model, Bio 1, 9, 4, and 15 were included in the model's inputs.
A Jackknife test was employed within the model to identify the contribution and influence of each bioclimatic variable on the hMPV potential distribution areas model (Promnikorn et al. 2019). Following that, the analysis findings from machine learning models predicting hMPV potential distribution area ranges were imported into GIS for visualization and further spatial analysis (Hijmans et al. 2012). The QGIS platform version 2.16 was used in this study. Wei et al. (2018) state that there are five suitability levels for prospective potential distribution areas on the used machine learning model map: for very low, low, moderate, high, and very high hMPV potential.
3. Results
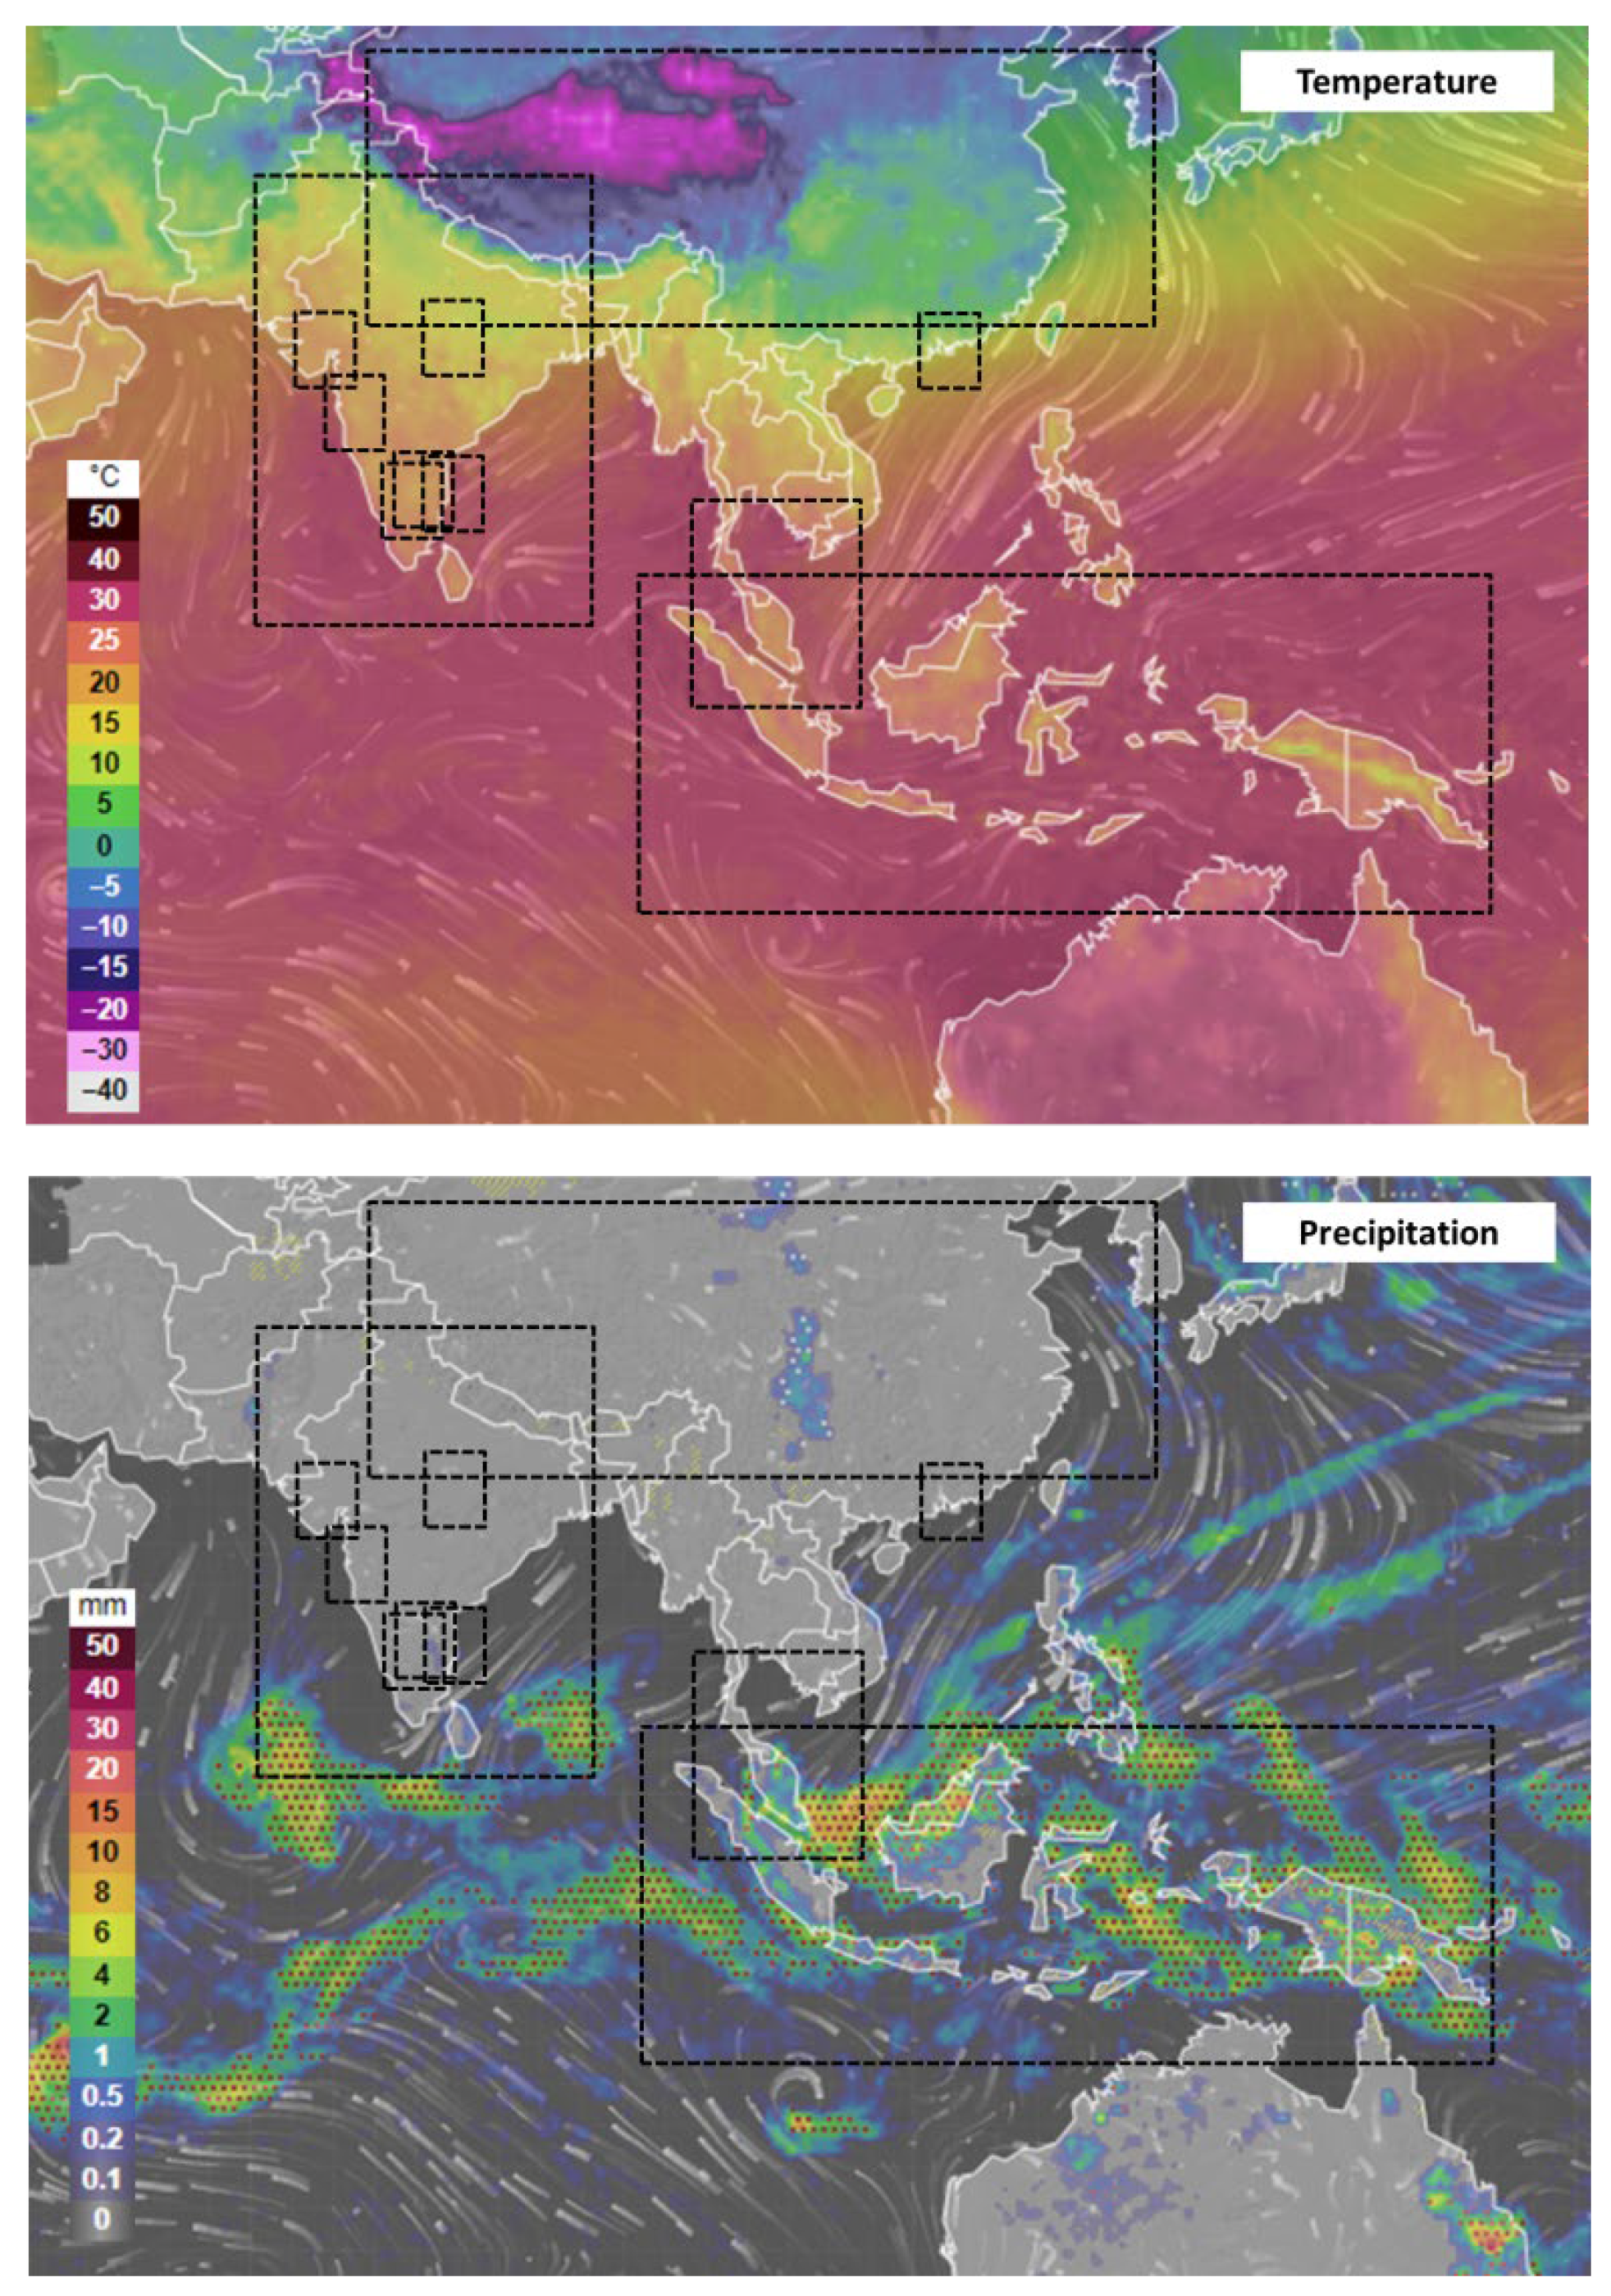
3.1. Regions with Reported hMPV Cases Overlaid with Temperatures and Precipitation
As of 9
th January 2025, several regions or countries have reported hMPV cases, as can be seen in
Figure 1. The countries with reported hMPV were mostly still experiencing winter seasons. In northern and high-latitude regions, hMPV is occurring in temperate regions with temperatures lower than 25°C. While hMPV were also occurring in the southern regions near the equator in tropical countries with temperature ranges of 25–30 °C. In comparing with the precipitation layers, the regions impacted by hMPV are overlapped with precipitation, as can be seen in the southern regions near the equator. In this region, the presence of hMPV is coincided with the precipitation ranges of 8–20 mm. At the same time, the northern and temperate regions has no precipitation. The Indian subcontinent has reported the presence of hMPV at least in the six locations. The first group, consisting of three locations, was in the higher latitude closed to the temperate regions, and another three hMPV occurrences were reported in the lower latitude latitude closed to the tropicsl regions. While no further information or data, especially in regions at lower latitudes and near the equator in Southeast Asia, whether the hMPV was due to the local transmission or transmitted from a person who has travelled from the impacted regions.
3.2. Contribution of Bioclimatic Variables to the Suitable Distribution Areas of hMPV
The multicollinearity tests have resulted in selecting three determinant bioclimatic variables, including Bio 1, 9, and 15, as selected variables. Those selected bioclimatic variables have varied contributions to the area suitable for hMPV distributions in studied areas, as can be seen in
Table 2. From the results, the mean temperature of the driest quarter, followed by the precipitation seasonality and the annual mean temperature, were the climate variables that have the most contribution to the suitable areas of hMPV currently in the studied areas with the values of 50.45%, 35.01%, and 14.53%.
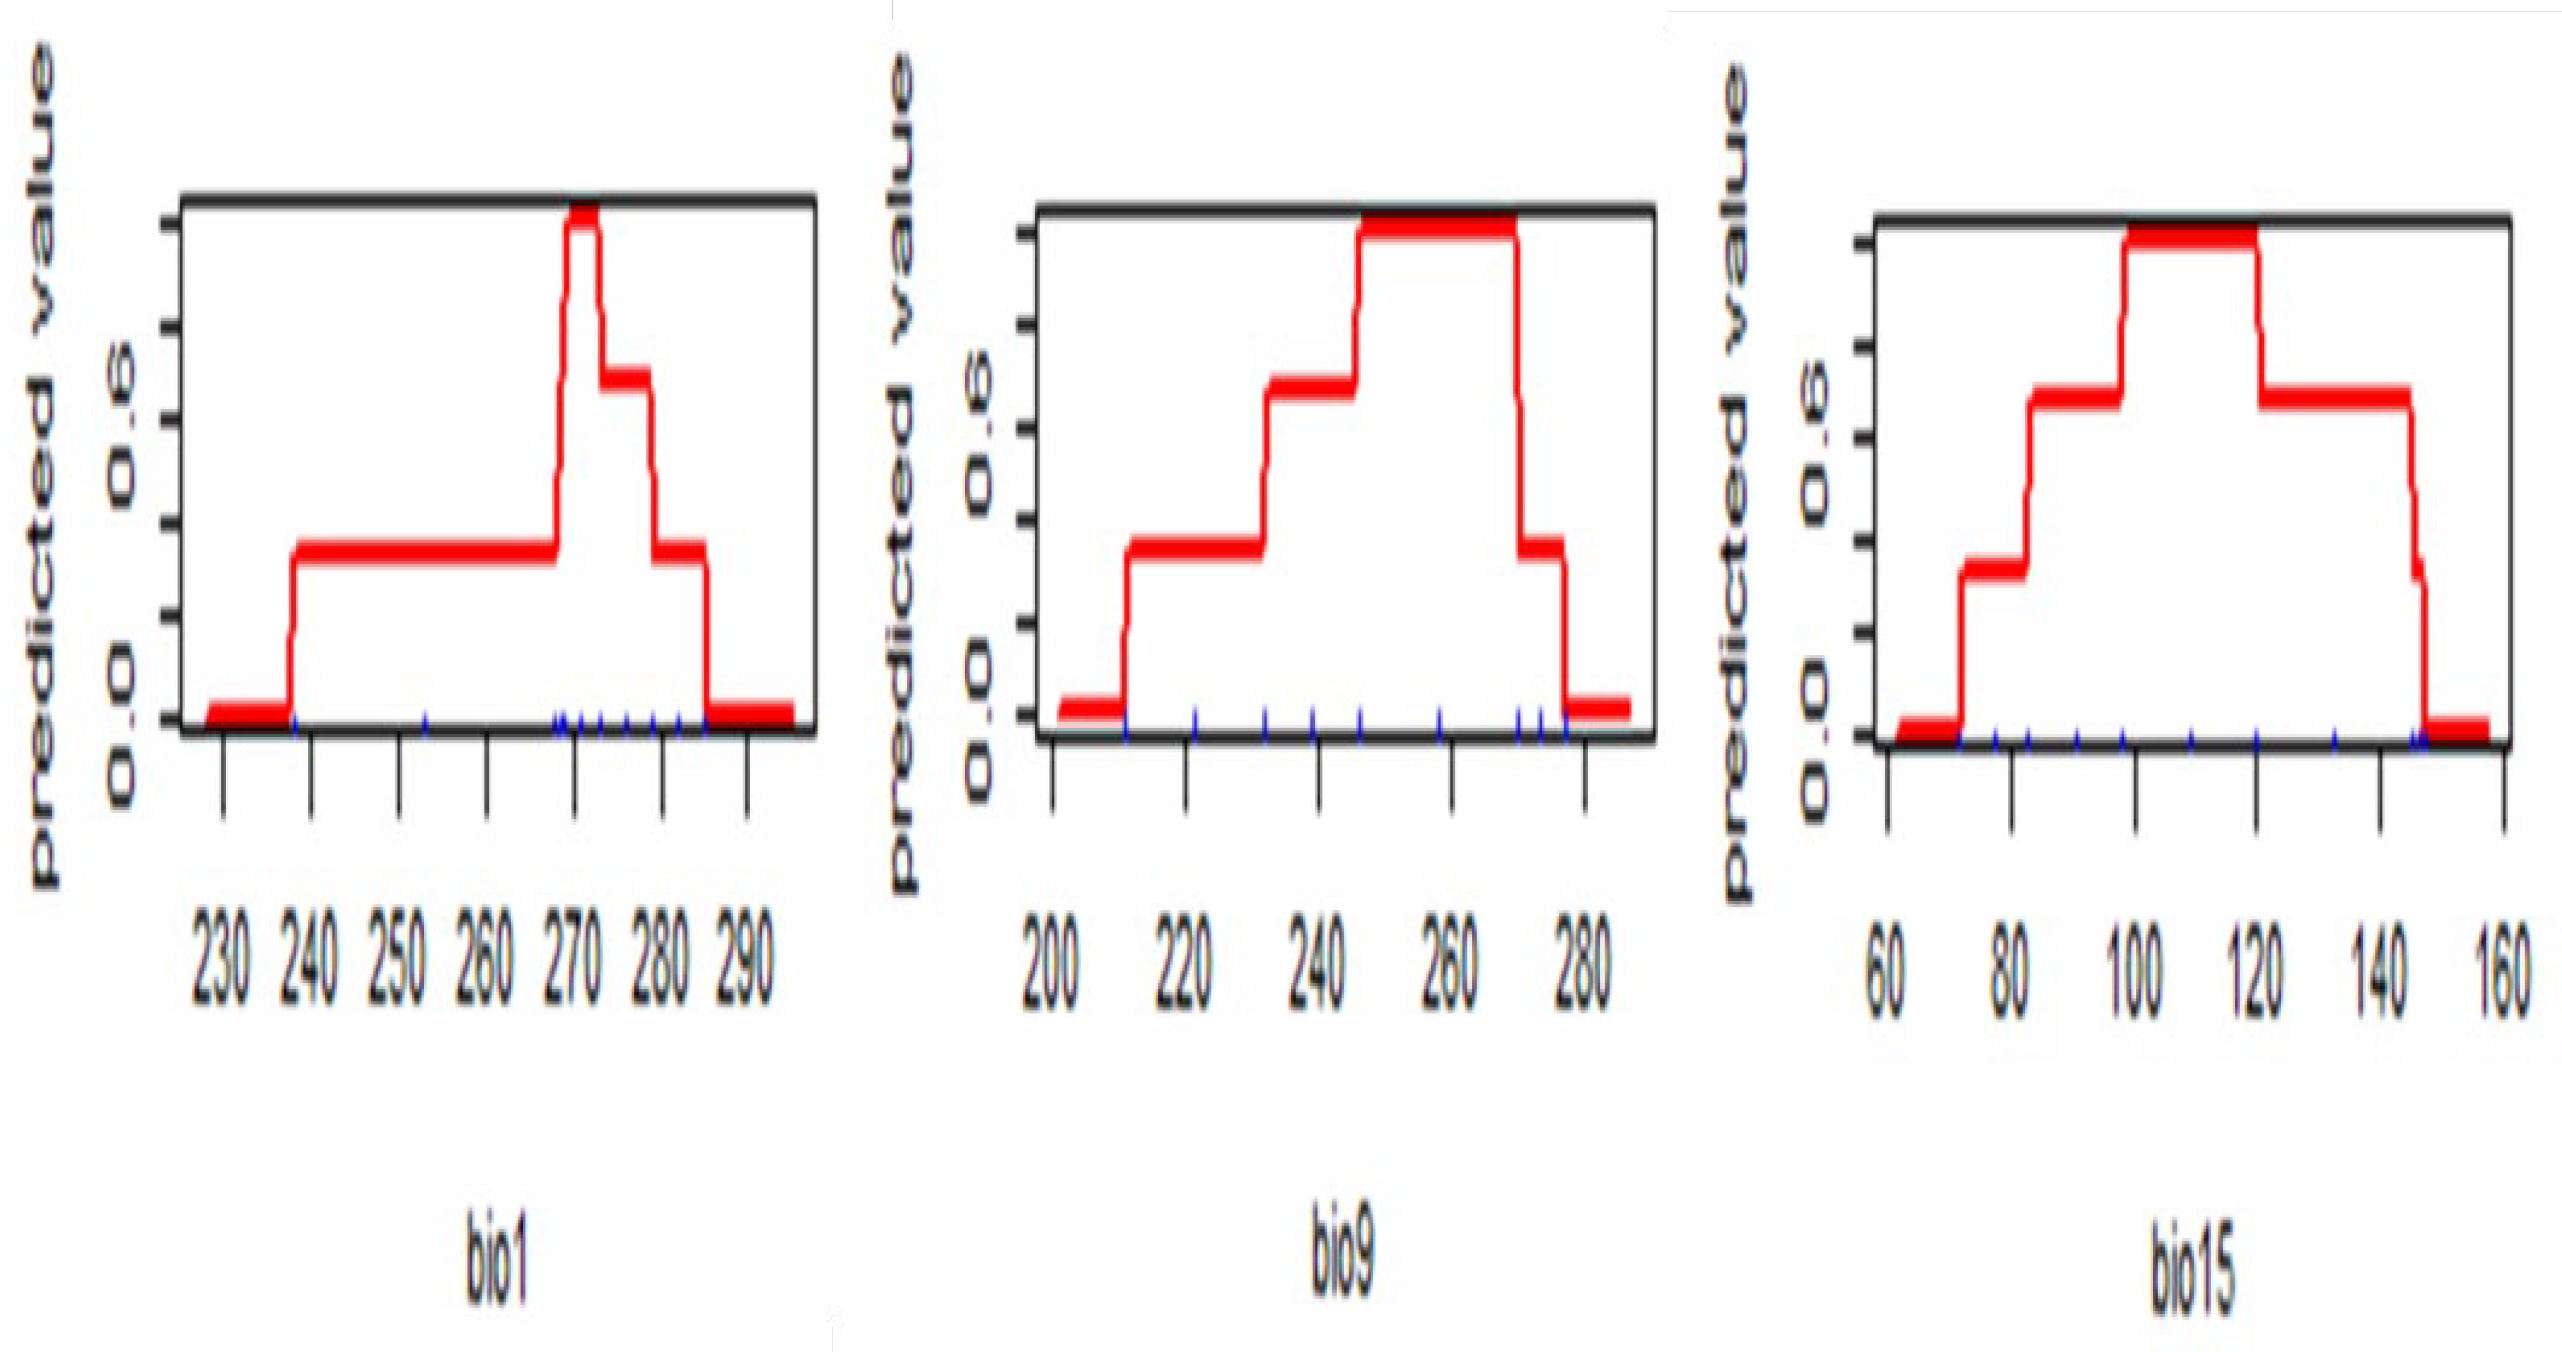
3.3. Response Curves of Bioclimatic Variables
The response curves show the relationships between the probability of occurrence and the suitability level of hMPV with each selected bioclimatic variable (
Figure 2). The response curves of the suitable distribution areas of hMPV were drawn for the selected three bioclimatic variables. The existence probability of each bioclimatic variable to hMPV showed that with the increase in the bioclimatic variable value, the occurrence probability of suitable distribution areas for hMPV showed a trend of first increasing and then decreasing rapidly. In this study, the range of bioclimatic variables when the occurrence probability is greater than 0.6 was used to represent the bioclimatic characteristics of the hMPV suitable distribution areas. The bioclimatic characteristics of the distribution area of hMPV are as follows: the annual mean temperature (Bio 1) is limited at 27.0 °C, the mean temperature of the driest quarter (Bio 9) is limited at 24.0 °C, and the precipitation seasonality (Bio 15) is limited at 10.
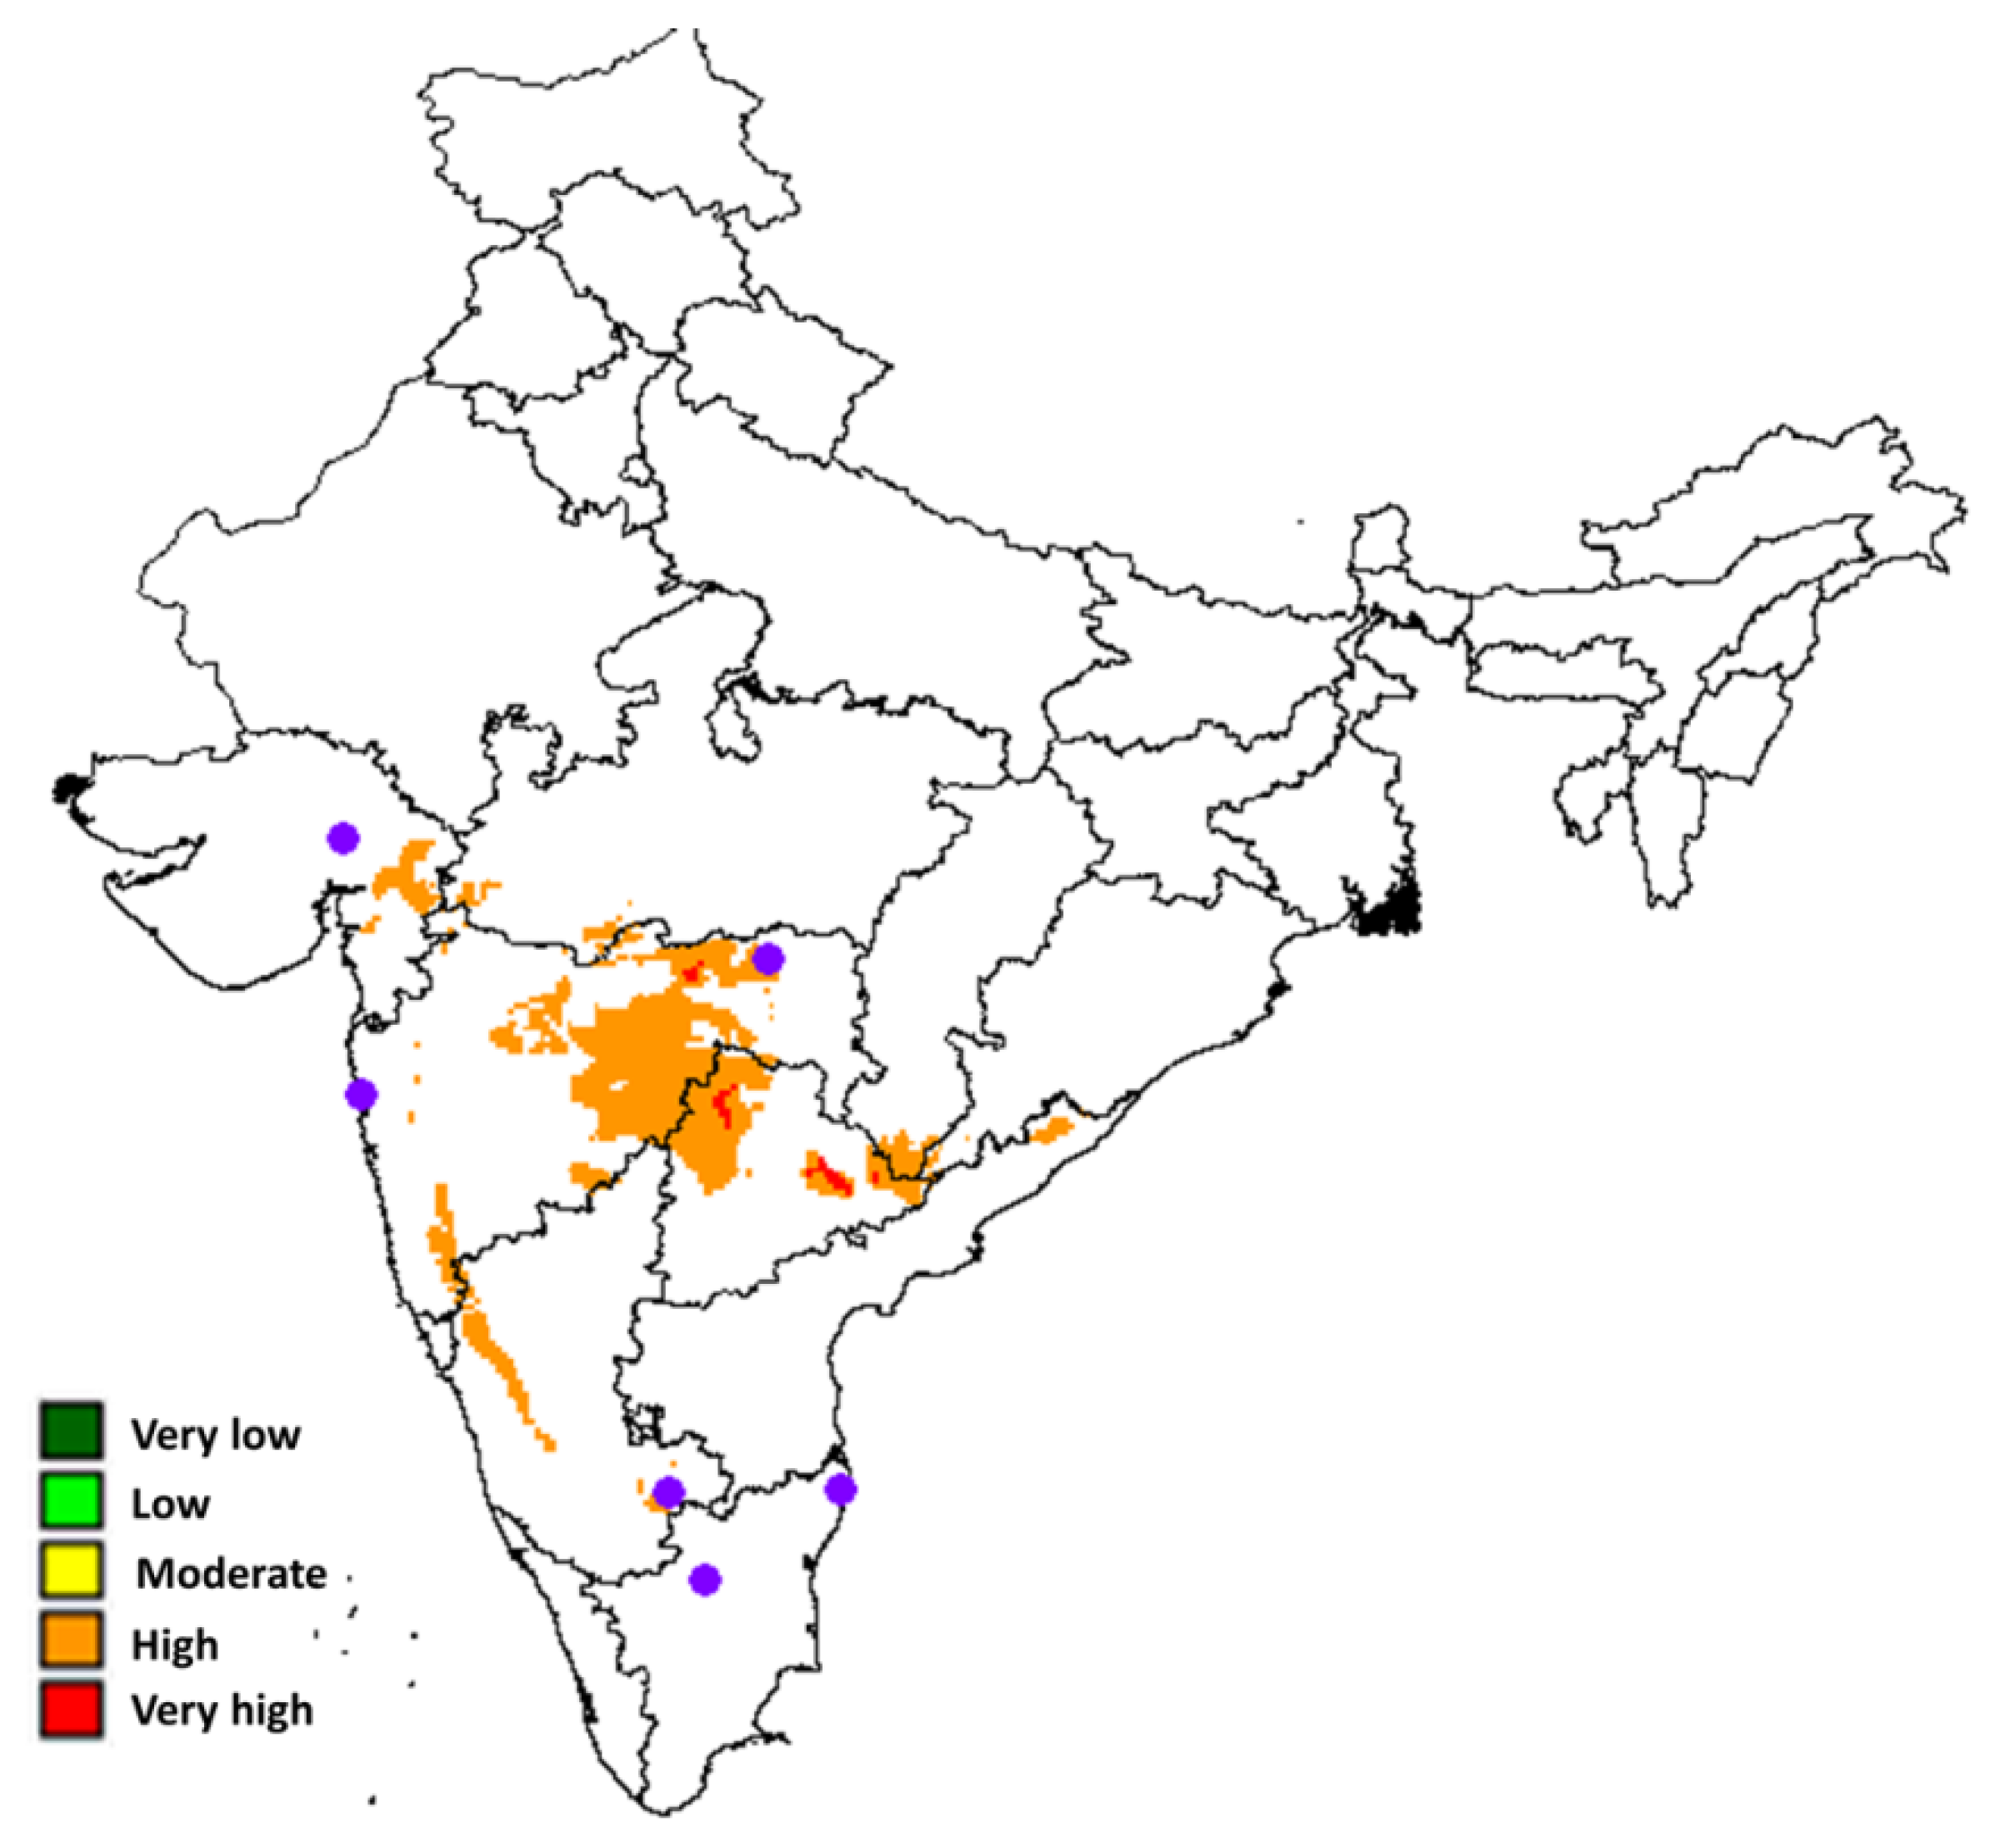
3.4. Potential hMPV Distribution Areas Under Current Climate
Potential hMPV distribution areas under current climate in the India subcontinent region have been modeled using data from 9
th January 2025, as can be seen in
Figure 3. Since there are several occurrences, then potential distribution analyses can be implemented. In India there are at least three potential distribution areas in the northern and southern parts of this subcontinent region. The potential areas were divided into five classes of suitability ranging from very low to very high. The first large high-risk areas are predicted in central and northern parts with north latitude of 16
0-22
0 and east longitude of 75
0-79
0. In these areas, very high areas were observed with north latitude of 17
0-19
0 and east longitude of 76
0-78
0, indicating preference areas toward the east direction. The second areas were observed in very high north latitude of 21
0-23
0 and east longitude of 72
0-75
0, indicating preferences in temperate regions. The third area was observed in the southern parts with north latitude of 13
0-17
0 and east longitude of 73
0-75
0, indicating potential preferences in tropical regions.
3. Discussions
The hMPV has reemerged, and a comprehensive study to estimate its potential distribution is required. Machine learning distribution modeling has succeeded in studying the potential distribution of COVID-19 recently and led to effective health management, planning, and mitigation. Following the current achievement in modeling COVID-19, the hMPV has been the first attempt to model the potential distribution of hMPV in particular Asian regions. The model confirmed the contributions of climate in particular temperature and precipitation, and indicates potential high hMPV infection areas characterized mostly by precipitation and temperature variables in subcontinent regions. This result was consistent with earlier research (Coro and Bovem 2022). According to the model, weather and climate variables like precipitation and air temperature are important in identifying potential sites that could have a high hMPV high infection incidence. As reported by earlier studies (Sajadi et al. 2020, Wang et al. 2020), the model also suggests a temperature and precipitation range that has also been associated with the spread of hMPV.
The potential spread of hMPV affected by climate, as identified in this study, can be plausibly explained by combining mechanisms that include relations of several climate variables, including climate, temperature, precipitation, and latitude (Chen et al. 2021). This study and hMPV distribution model estimated that the degrees of hMPV risk areas are varied following the differences of season, weather, precipitation, and temperature as a function of latitude. It is predicted that when absolute latitude rises by 1°, the risk areas of hMPV are estimated to be expanded. The winter season and low temperatures were known to be more vulnerable to viral diseases (Neves et al. 2023). In spite of preferences on low temperature, the model indicates that the virus can persist at maximum temperatures higher than 20°C and has the potential to spread to tropical regions. The presences of the virus beyond its winter ranges were also observed in previous COVID-19. Then, if the hMPV as predicted by the model can adapt to warm tropical temperatures, special vigilance is needed to detect the peak of hMPV, especially around 24–27℃ at minimum. Possible spread of winter viral infection to tropical areas is consistent with previous study (Wang et al. 2020), and this should be supported by local transmission data.
Another important bioclimatic variable that contributes to the estimated hMPV is precipitation variables. It is predicted that precipitation is conversely correlated with potential viral infection. As reported by Menebo (2020) and taken COVID-19 as an example, precipitation is positively associated with the incidence of COVID-19 previously. The extended wet season will decrease sunshine and solar radiation while simultaneously lowering the temperature. Considering solar radiation can effectively eliminate and limit the presences of the virus in the environment, then precipitation and rainy season can cause virus to spread more quickly and lead to the virus infecting a variety of surfaces and the environment.
5. Limitations of the Study
The limitation of this study is represented in the low AUC value. This value is related to the numbers of samples or the presences of the hMPV cases recorded. Most of the cases used in this study are recorded from news, and it is very limited. As a preliminary study, this study only recorded limited hMPV cases and do not distinguish between hMPV local transmission or not. Despite the limited records, this study at least has succeeded in providing a baseline for hMPV potential distribution modeling. For future study and to deal with the limitations of the study, there is plenty of opportunity for improvement. It ranges from a comparison study among modeling algorithms and further study using climate change scenarios following the latest CMIP 6 scenarios.
6. Conclusions
As modeled in this study, this study has succeeded in estimating and even providing scientific evidence of potential spreads of hMPV. It has provided an insight that hMPV has restricted its spread to the center of the subcontinent or has a preference for the higher latitude or temperate regions. While there is still a patch in the southern parts of the subcontinent, or lower latitude, that indicates potential of hMPV preferences in the tropical regions. These potential areas indicate the risks of hMPV adapting and spreading in the tropical regions, and this can deliver significant health risks, considering several countries presented in the Asia and Southeast Asia regions are tropical countries.
Funding
This research was funded through internal funding mechanisms of Center for Health and Earth Modeling (CHEM).
Declaration of Competing Interest
The authors declare that they have no known competing financial interests or personal relationships that could have appeared to influence the work reported in this paper.
Data availability
Data will be made available on request.
References
- Arshad, F. , Waheed, M., Fatima, K., Harun, N., Iqbal, M., Fatima, K., Umbreen, S. (2022). Predicting the suitable current and future potential distribution of the native endangered tree Tecomella undulata (Sm.) As’ary, M., Setiawan, Y., Rinaldi, D. Analysis of changes in habitat suitability of the Javan Leopard, 2000–2020. Diversity 2022, 15, 529. [Google Scholar] [CrossRef]
- Seem. in Pakistan. Sustainability, 14, 7215. [CrossRef]
- Bivand, R. R Packages for Analyzing Spatial Data: A Comparative Case Study with Areal Data. Geogr. Anal. 2022, 54, 488–518. [Google Scholar] [CrossRef]
- Chen, S.; Prettner, K.; Kuhn, M.; Geldsetzer, P.; Wang, C.; Bärnighausen, T.; Bloom, D.E. Climate and the spread of COVID-19. Sci. Rep. 2021, 11, 1–6. [Google Scholar] [CrossRef] [PubMed]
- Coro, G.A.; Bovem, P. A High-resolution Global-scale Model for COVID-19 Infection Rate. ACM Transactions on Spatial Algorithms and Systems 2022, 8, 1–24. [Google Scholar] [CrossRef]
- Dolci, D.; Peruzzi, L. Assessing the Effectiveness of Correlative Ecological Niche Model Temporal Projection through Floristic Data. Biology 2022, 11, 1219. [Google Scholar] [CrossRef] [PubMed]
- Dong, H.; Zhang, N.; Shen, S.; Zhu, S.; Fan, S.; Lu, Y. Effects of Climate Change on the Spatial Distribution of the Threatened Species Rhododendron purdomii in Qinling-Daba Mountains of Central China: Implications for Conservation. Sustainability Fick, S.E., Hijmans, R.J. (2017). WorldClim 2: new 1 km spatial resolution climate surfaces for global land areas. International Journal of Climatology 37(12), 4302-431. 2023, 15, 3181. [Google Scholar] [CrossRef]
- He, P.; Gao, Y.; Guo, L.; Huo, T.; Li, Y.; Zhang, X.; Li, Y.; Peng, C.; Meng, F. Evaluating the Disaster Risk of the COVID-19 Pandemic Using an Ecological Niche Model. Sustainability 2021, 13, 11667. [Google Scholar] [CrossRef]
- Hijmans, R.J. , Guarino, L., Mathur, P. (2012) Diva-GIS Version 7.
- Van Den Hoogen, B.G.; De Jong, J.C.; Groen, J.; Kuiken, T.; De Groot, R.; Fouchier, R.A.; Osterhaus, A.D. A newly discovered human pneumovirus isolated from young children with respiratory tract disease. Nat. Med. 2001, 7, 719–724. [Google Scholar] [CrossRef]
- Khan, A.M.; Li, Q.; Saqib, Z.; Khan, N.; Habib, T.; Khalid, N.; Majeed, M.; Tariq, A. MaxEnt Modelling and Impact of Climate Change on Habitat Suitability Variations of Economically Important Chilgoza Pine (Pinus gerardiana Wall.) in South Asia. Forests 2022, 13, 715. [Google Scholar] [CrossRef]
- Khanum, R.; Mumtaz, A.; Kumar, S. Predicting impacts of climate change on medicinal asclepiads of Pakistan using Maxent modeling. Acta Oecologica 2013, 49, 23–31. [Google Scholar] [CrossRef]
- Lemenkova, P. Using R packages 'tmap', 'raster' and 'ggmap' for cartographic visualization: An example of dem-based terrain modelling of Italy, Apennine Peninsula. Zb. Rad. - Geogr. Fak. Univ. u Beogr. [CrossRef]
- Mao, M.; Chen, S.; Ke, Z.; Qian, Z.; Xu, Y. Using MaxEnt to Predict the Potential Distribution of the Little Fire Ant (Wasmannia auropunctata) in China. Insects 2022, 13, 1008. [Google Scholar] [CrossRef] [PubMed]
- Menebo, M.M. Temperature and precipitation associate with Covid-19 new daily cases: A correlation study between weather and Covid-19 pandemic in Oslo, Norway. 737, 1396; 59. [Google Scholar] [CrossRef]
- Neves, J.M.M.; Belo, V.S.; Catita, C.M.S.; de Oliveira, B.F.A.; Horta, M.A.P. Modeling the Climatic Suitability of COVID-19 Cases in Brazil. Trop. Med. Infect. Dis. 2023, 8, 198. [Google Scholar] [CrossRef]
- Nissen, M.D.; Mackay, I.M.; Withers, S.J.; Siebert, D.J.; Sloots, T.P. Evidence of human metapneumovirus in Australian children. The Medical Journal of Australia 2002, 176, 188–188. [Google Scholar] [CrossRef]
- Pan, J.; Villalan, A.K.; Ni, G.; Wu, R.; Sui, S.; Wu, X.; Wang, X. Assessing eco-geographic influences on COVID-19 transmission: a global analysis. Sci. Rep. 2024, 14, 1–16. [Google Scholar] [CrossRef] [PubMed]
- Pramanik, M.; Singh, P.; Dhiman, R.C. Identification of bio-climatic determinants and potential risk areas for Kyasanur forest disease in Southern India using MaxEnt modelling approach. BMC Infect. Dis. 2021, 21, 1–15. [Google Scholar] [CrossRef] [PubMed]
- Préau, C. , Trochet, A., Bertrand, R., Isselin-Nondedeu, F. (2018). Modeling potential distributions of three European amphibian species comparing ENFA and Maxent.
- Promnikorn, K. , Jutamanee, K. ( 2019). Maxent model for predicting potential distribution of Vitex glabratar. Br. in Thailand. Agr. Nat Resour. 53, 44–48.
- Rana, S.K.; Rana, H.K.; Ghimire, S.K.; Shrestha, K.K.; Ranjitkar, S. Predicting the impact of climate change on the distribution of two threatened Himalayan medicinal plants of Liliaceae in Nepal. J. Mt. Sci. 2017, 14, 558–570. [Google Scholar] [CrossRef]
- Rao, B.L.; Gandhe, S.S.; Pawar, S.D.; Arankalle, V.A.; Shah, S.C.; Kinikar, A.A. First Detection of Human Metapneumovirus in Children with Acute Respiratory Infection in India: a Preliminary Report. J. Clin. Microbiol. 2004, 42, 5961–5962. [Google Scholar] [CrossRef]
- Ren, H.; Zhao, L.; Zhang, A.; Song, L.; Liao, Y.; Lu, W.; Cui, C. Early forecasting of the potential risk zones of COVID-19 in China's megacities. Sci. Total. Environ. 2020, 729, 138995–138995. [Google Scholar] [CrossRef] [PubMed]
- Sajadi, M.M. , Habibzadeh P., Vintzileos A., Shokouhi S., Miralles-Wilhelm F., Amoroso A. (2020).Temperature and latitude analysis to predict potential spread and seasonality for COVID-19. Available at SSRN 3550308. 2020.
- Mahatara, D.; Acharya, A.; Dhakal, B.; Sharma, D.; Ulak, S.; Paudel, P. Maxent modelling for habitat suitability of vulnerable tree Dalbergia latifolia in Nepal. Silva Fenn. 2021, 55. [Google Scholar] [CrossRef]
- Wang, B., Xin, S., Khattak, R. H. (2020). Influence of Temperature and Precipitation on the Climate Suitability of Severe Acute Respiratory Syndrome Coronavirus 2. Proceedings, The 3rd International Electronic Conference on Environmental Research and Public Health, 2- 10.
- Wang, J. , Tang, K., Feng K., Lu, W. (2020). High temperature and high humidity reduce the transmission of COVID-19. Available at SSRN 3551767. Wei, B., Wang, R., Hou, K.,Wang, X., Wu, W. (2018).Predicting the current and future cultivation regions of Carthamus tinctorius using Maxent model under climate change in China. Global Ecology and Conservation 16, E00477. [CrossRef]
- Yu, H.Y. , Sun, C.K., Huo, X., Hu, J.L., Qi, X., Xu, K. (2019). Predicting the transmission risk of H7N9 using ecological niche modeling. Mod. Prev. Med. 46: 206–210, 229.
|
Disclaimer/Publisher’s Note: The statements, opinions and data contained in all publications are solely those of the individual author(s) and contributor(s) and not of MDPI and/or the editor(s). MDPI and/or the editor(s) disclaim responsibility for any injury to people or property resulting from any ideas, methods, instructions or products referred to in the content. |
© 2025 by the author. Licensee MDPI, Basel, Switzerland. This article is an open access article distributed under the terms and conditions of the Creative Commons Attribution (CC BY) license (https://creativecommons.org/licenses/by/4.0/).