
Submitted:
10 January 2025
Posted:
13 January 2025
You are already at the latest version
Abstract
Resveratrol (RSV) improves metabolic and cardiovascular functions, but its tissue-specific effects on diabetes remain unclear. This study investigated RSV's impact on cardiac and skeletal muscle and adipose tissue in a rat diabetes model. Thirty-two Wistar rats were assigned to four groups: control (C), control treated with RSV (RC), diabetic (D), and diabetic treated with RSV (RD). Diabetes was induced using streptozotocin and nicotinamide. After two weeks, RC and RD groups received RSV for six weeks. Histological and protein expression analyses were performed on cardiac, skeletal muscle, and visceral fat tissues. RSV significantly reduced collagen accumulation in diabetic cardiac and skeletal muscles compared to untreated diabetic rats. Adipose tissue in diabetic rats exhibited the most notable reduction in collagen levels following RSV treatment (D/C: 30.15, IQ: 9.66–50.36 vs. RD/C: 8.88, IQ: 4.86–19.06, p < 0.01).In cardiac tissue, RSV downregulated AKT and rpS6 phosphorylation. In skeletal muscle, RSV suppressed rpS6 phosphorylation and in adipose tissue, RSV enhanced mTOR and PPARα expression. RSV reduced receptor for advanced glycation end products expression across all examined tissues, indicating its role in modulating pathways driven by hyperglycemia. Although RSV improved fibrosis and signaling pathways, it did not reverse structural damage or metabolic dysfunction. These results highlight the need for further studies to refine RSV-based therapies for diabetes-induced tissue damage.
Keywords:
resveratrol
; diabetic cardiomyopathy
; skeletal muscle atrophy
; adipose tissue remodeling
; inflammatory pathways
; fibrosis
1. Introduction
Diabetes mellitus is a chronic metabolic disorder often accompanied by secondary complications stemming from hyperglycemia, which significantly impacts both the microvascular and macrovascular systems. These complications can affect multiple organs, including the eyes, kidneys, brain, heart, and skeletal muscles [1]. One of the most concerning consequences of diabetes mellitus is the heightened susceptibility to cardiovascular diseases, with diabetic cardiomyopathy characterized by diastolic dysfunction, cardiomyocyte hypertrophy, fibrosis, and metabolic dysregulation [2]. Beyond the heart, these pathophysiological changes extend to metabolic disturbances and structural alterations in skeletal muscle and adipose tissue, exacerbating systemic organ dysfunction [3,4]. The dysregulation of cardiomyocyte function in chronic conditions such as diabetes is primarily driven by alterations in the expression and post-translational modification of key proteins within the cardiomyocytes [5]. This systemic disruption manifests as an imbalance between the synthesis and degradation of contractile proteins. In diabetes, this imbalance leads to cardiac hypertrophy due to increased protein synthesis, while skeletal muscle atrophy occurs due to accelerated proteolysis [6]. The insulin-like growth factor-1 (IGF-1)/protein kinase B (AKT)/mammalian target of rapamycin (mTOR) signaling pathway is central to the regulation of protein synthesis and degradation. This pathway is activated by binding insulin and growth factors to receptors on muscle cell membranes. AKT plays a key role in activating mTOR, a critical regulator of protein synthesis, by promoting ribosomal biogenesis through its downstream effector, S6 kinase 1 (S6K) [7,8]. Moreover, the AKT pathway inhibits protein degradation by modulating both the ubiquitin-proteasome and lysosomal-autophagic systems. In diabetes, decreased AKT expression in skeletal muscle weakens the inhibition of forkhead box O (FOXO) transcription factors, thereby activating the ubiquitin-proteasome system and promoting muscle atrophy [9,10,11].
Persistent hyperglycemia leads to the formation of advanced glycation end-products (AGEs), which interact with their primary receptor, the receptor for advanced glycation end-products (RAGE), playing a pivotal role in the development of diabetic complications [12,13]. Evidence from several studies indicates that RAGE functionality relies on its ability to form oligomers or heterodimers with other cell surface proteins, such as heparan sulfate proteoglycans, which are essential for the assembly of the oligomeric complex necessary for ligand binding [14,15,16]. The interaction between the extracellular domain of RAGE and its ligands initiates the transcription of proinflammatory cytokines, adhesion molecules, and profibrotic growth factors, collectively driving cellular stress and exacerbating disease-related complications [17,18].
RAGE activation by AGEs was already demonstrated as responsible by activation of transforming growth factor β (TGF β)/Smad signaling, a pro fibrotic pathway, in renal tubular cells and in liver fibrosis [19].
Resveratrol (RSV), a natural polyphenolic compound, has demonstrated various beneficial effects on cardiovascular, metabolic, and immune functions. In experimental models of obesity and type 2 diabetes, RSV has been shown to improve insulin sensitivity, increase mitochondrial content, and enhance overall survival [20]. While the majority of RSV’s protective effects are attributed to the activation of Sirtuin-1 (SIRT-1), evidence also suggests that it functions through SIRT-1-independent pathways [21,22,23,24]. Studies indicate that RSV exerts its effects by inhibiting the mTOR signaling pathway [25]. Our previous research has shown that RSV significantly mitigates diabetic cardiomyopathy, as it reduces collagen fiber accumulation in cardiac tissue and improves diastolic dysfunction in diabetic rats [26]. This finding further supports the potential of RSV in addressing diabetic complications.
This study aims to investigate the effects of resveratrol on molecular pathways in an experimental diabetes model, particularly focusing on its role in addressing abnormal tissue growth patterns, including cardiac hypertrophy and atrophy in skeletal muscle and adipose tissue. Through this investigation, we aim to deepen our understanding of the molecular mechanisms underlying resveratrol’s protective effects. Importantly, this research could potentially lead to the development of resveratrol-based therapies for managing diabetes-induced complications.
2. Results
Glucose levels in the 8th week were 133 mg/dL, IQ: 118-143, and 128 mg/dL, IQ: 116-136 for C and RC, and 589 mg/dL, IQ: 481-610 and 586, IQ: 547-641 for D and RD group.
2.1. Anthropometric Measurements
When indexed to body weight, the heart mass and left ventricular dimensions were significantly higher in the diabetic and RSV-treated diabetic groups than in the control groups, confirming the presence of LV hypertrophy in these diabetic rats. Additionally, the gastrocnemius muscle mass was markedly lower in the D and RD groups compared to the C and RC groups, indicating skeletal muscle atrophy (Table 1).
2.2. Cardiac Muscle
In cardiac muscle (Table 2, Figure 1), the expression of RAGE was significantly elevated in diabetic rats (D group), and RSV treatment effectively reduced these elevated levels. Among the RAGE cofactors, both Glypican-1 and Syndecan-4 mirrored the RAGE expression pattern, showing a similar increase in diabetic rats and a decrease following RSV treatment.
Regarding anabolic proteins, the p-AKT/AKT, p-mTOR/mTOR, and p-rpS6/rpS6 ratios were increased in the diabetic group, suggesting hyperactivation of anabolic pathways. Following RSV treatment, the concentrations of these proteins decreased, reflecting a potential normalization of protein synthesis regulation. However, the mTOR ratio remained elevated after treatment, indicating a partial restoration of these pathways.
The autophagy-related protein Beclin-1 was also significantly increased in the diabetic group but returned to normal levels after RSV treatment, implying reduced autophagic activity. Fbx-32, a marker of muscle atrophy, was elevated in diabetic rats, but RSV treatment effectively reduced its concentration, suggesting a protective effect against muscle degradation. Lastly, SIRT-1 levels remained normal or slightly decreased after RSV treatment. PPARα concentrations were reduced in diabetic and RSV-treated groups, indicating impaired fatty acid metabolism in cardiac tissue under diabetic conditions.
2.3. Skeletal Muscle
In skeletal muscle (Table 2, Figure 1), following a pattern similar to that observed in cardiac muscle, RAGE expression was significantly elevated in the diabetic group compared to the control group. This increase was attenuated following treatment with RSV. Syndecan-4, but not Glypican-1, mirrored this trend, further reinforcing the tissue-specific regulation of RAGE and its cofactors in muscle tissues.
Regarding anabolic signaling pathways, the phosphorylation levels of key proteins, including AKT, mTOR, and rpS6, were differentially affected by diabetes and RSV treatment. While the p-rpS6/rpS6 ratio was elevated in diabetic rats and normalized after RSV treatment, the phosphorylation levels of AKT and mTOR remained suppressed in both diabetic and RSV-treated groups, indicating a persistent impairment in anabolic signaling.
Beclin-1, consistent with the findings in cardiac muscle, was increased in diabetic rats and reduced after RSV treatment, suggesting a normalization of autophagic activity. Interestingly, Fbx-32, a marker of muscle atrophy, showed a contrasting response between muscle types; while its concentration was elevated in cardiac muscle of diabetic rats, it was reduced in skeletal muscle of the same group of rats. No change was observed after RSV treatment, indicating a differential response in muscle atrophy regulation between these tissues. Unlike the cardiac muscle, the skeletal muscle of diabetic rats showed an increase in SIRT-1 level, which returned to baseline after treatment. On the other hand, PPARα levels demonstrated a consistent reduction under diabetic and treatment conditions, suggesting disrupted fatty acid metabolism in skeletal muscle.
2.4. Histopathological Analysis
2.5. Adipose Tissue
In adipose tissue (Table 4), RAGE level was similarly elevated in diabetic rats, with RSV treatment effectively reducing its expression. However, unlike cardiac and skeletal muscles, neither of the RAGE cofactors, Glypican-1 nor Syndecan-4, followed the same expression pattern, indicating tissue-specific differences in regulating inflammatory pathways.
The expression of anabolic proteins p-AKT/AKT, p-mTOR/mTOR, and p-rpS6/rpS6 was significantly lower in the diabetic group compared to controls, and this downregulation persisted after RSV treatment, except for the p-mTOR/mTOR ratio, which returned to normal levels. This suggests a more profound impairment in protein synthesis in adipose tissue, with RSV treatment having only a partial restorative effect.
Interestingly, Beclin-1 showed a divergent response in adipose tissue compared to muscle tissues. While its expression was reduced in cardiac and skeletal muscles after RSV treatment, it increased in adipose tissue, indicating enhanced autophagic activity in this tissue following treatment. SIRT-1 levels were decreased after RSV treatment, consistent with the trends observed in muscle tissues. Finally, PPARα concentrations were higher in the diabetic group. However, they were significantly downregulated following RSV treatment, suggesting that RSV may help mitigate the excessive lipid metabolism activity observed in diabetic adipose tissue.
2.6. Histopathological Analysis
HE staining of adipose tissue was performed to evaluate adipocyte size in the C, RC, D, and RD groups. Adipocytes in the D and RD groups were smaller (diameter: 34 µm, IQ: 24-45 and 31 µm, IQ: 23-45, respectively) when compared to the C group (61 µm, IQ: 47-79) and RC group (62 µm, IQ: 44-82), with statistical significance of p < 0.0001. (Figure 3)
Picrosirius staining was performed to evaluate collagen content in adipose tissue (Figure 4A and B). According to the results, C/C: 1.00, IQ: 0.45-1.47; RC/C: 0.52, IQ: 0.29-1.35; D/C: 30.15, IQ: 9.66-50.36 vs. RD/C: 8.88, IQ: 4.86-19.06, the D group exhibited a significant increase in collagen accumulation partially mitigated after RSV treatment (p<0.01).
Additionally, macrophage clusters arranged in a crown-like structure surrounding the adipocytes, a marker of inflammation, were identified only in diabetic rats, even after RSV treatment. The presence of macrophages could be detected using HE staining (Figure 4C,D) and by immunohistochemistry reaction using an anti-CD68 antibody (Figure 4E,F).
3. Discussion
We evaluated cardiac and skeletal muscles and adipose tissue to observe differences between diabetic and non-diabetic rats before and after RSV treatment. RAGE levels were elevated in all analyzed tissues, but RSV treatment reduced its production. RSV modulated anabolic and catabolic protein expression only in diabetic rats, suggesting hyperglycemia as a trigger for its effects. While RSV reduced collagen accumulation in the three tissues under analysis, resulting in less tissue fibrosis, it did not reverse all the structural changes in these tissues. In the adipose tissue of diabetic rats, RSV did not reverse reduced the inflammation, as evidenced by the presence of crown-like structures in RD group. Molecular responses to hyperglycemia and RSV administration varied across tissues, with the heart showing the most substantial benefits. Nevertheless, RSV could not fully reverse the structural and functional alterations induced by diabetes, particularly in skeletal muscle and adipose tissue.
3.1. Cardiac Muscle
Hyperglycemia-induced inflammation, marked by elevated pro-inflammatory cytokines, contributes to insulin resistance and promotes advanced glycation end products (AGEs) formation. These AGEs interact with their receptor (RAGE), exacerbating diabetic complications [27,28]. In this study, RAGE levels were elevated in the cardiac muscle of diabetic rats, but RSV treatment reversed this increase. A similar pattern was observed for its cofactors, Syndecan and Glypican.
D and RD groups showed structural changes in cardiac muscle, including increased heart and left ventricular mass, indicative of the hypertrophic cardiomyopathy commonly associated with diabetes [29,30]. In our study, RSV treatment reduced collagen accumulation in cardiac muscle tissue. AGE-RAGE interaction stimulates the nuclear factor-kappa B signaling pathway, leading to elevated levels of pro-inflammatory cytokines such as tumor necrosis factor-alpha. These cytokines are implicated in cardiac hypertrophy, fibrosis, and LV dysfunction pathogenesis. Covalent modification of collagen by AGEs renders it resistant to proteolytic degradation by matrix metalloproteinases, thereby contributing to extracellular matrix accumulation and tissue fibrosis [31]. In cell culture models, RSV inhibited the induction of cardiac fibrosis through the TGF-β1/Smad3 pathway, which attenuates ECM synthesis [32]. Similarly, in our study, RSV-induced RAGE downregulation was associated with reduced fibrosis progression. On the other hand, RSV treatment was insufficient to reverse all the tissue structural abnormalities induced by the disease.
Diabetes disrupts the balance between protein synthesis and degradation, leading to muscle hypertrophy or atrophy. Our analysis of anabolic markers, including p-AKT/AKT, p-mTOR/mTOR, and p-rpS6/rpS6, as well as proteins involved in degradation pathways such as the ubiquitin-proteasome system (Fbx32) and the autophagy-lysosome system (Beclin-1), revealed an increase in both anabolic and catabolic protein markers in diabetic cardiac muscle which is consistent with previous results that demonstrated the activation of the AKT/mTOR/rpS6 axis in hypertrophic cardiac tissue [33]. RSV-mediated downregulation of anabolic and catabolic protein expression may account for our previous findings, in which an improvement in cardiac function was observed, characterized by a better diastolic performance [26]. RSV reduced rpS6 phosphorylation, probably through S6K inhibition and independently of mTOR, highlighting its ability to modulate protein synthesis in diabetic models without directly influencing mTOR signaling [34]. A lower presence of Beclin-1 in the RD group was anticipated, as minimal insulin signaling leads to RSV-induced inhibition of S6K1, which suppresses autophagy. This catabolic process could be harmful if activated by increased Beclin-1 levels [35,36].
Interestingly, RSV downregulated SIRT-1 levels, suggesting RSV may function independently of SIRT-1, potentially acting as a competing substrate in protein regulation [23,24].
Fatty acid oxidation rates were increased in the cardiac muscle of diabetic rats, reflecting a shift toward lipid metabolism due to impaired glucose uptake. PPARα, a regulator of fatty acid oxidation, was downregulated in cardiac muscle, possibly protecting against hypertrophy [37] or due to the chronic inflammatory state associated with diabetes, where elevated cytokines act as inhibitors of PPARα expression [29,38,39]. RSV treatment did not affect PPARα concentration in cardiac tissue.
3.2. Skeletal Muscle
Similar to findings in cardiac muscle, levels of RAGE and its cofactor Syndecan were elevated in the skeletal muscle of diabetic rats and were subsequently downregulated following RSV treatment. RSV also reduced collagen deposition and fibrosis in skeletal muscle; however, it did not prevent muscle atrophy, a common characteristic associated with diabetes [29,30].
Parallel to its effects on cardiac tissue, RSV treatment restored SIRT1 expression in skeletal muscle. However, the diabetes-induced downregulation of PPARα persisted despite RSV treatment, similar to what was observed in cardiac tissue.
While RSV did not influence the suppressed anabolic markers p-AKT/AKT and p-mTOR/mTOR in atrophic skeletal muscle, it did downregulate p-rpS6/rpS6. This effect may be mediated by inhibiting S6K, a pathway linked to suppressed autophagy.
Also, the elevated level of Beclin-1, a protein linked to catabolism, was reduced after RSV treatment [7,35]. Although RSV modulated some signaling pathways, it did not reverse the sarcopenia state of the skeletal muscle. One hypothesis is that even though RSV has been capable of protecting against some of the muscle damage caused by diabetes, it could not induce the necessary anabolic response.
3.3. Adipose Tissue
Histological analysis showed reduced adipocyte size in diabetic rats compared to controls. In diabetic rats, insulin’s anti-lipolytic effect in adipose tissue is diminished due to lower plasma insulin levels, leading to the breakdown of stored triglycerides into free fatty acids (FA) and glycerol [40]. Additionally, insulin’s role in promoting lipogenesis is impaired, reducing fat synthesis and adipocyte storage. Taken together, these factors likely contribute to the observed reduction in adipocyte size.
In adipose tissue, despite a reduction in fibrosis following RSV treatment, the observed atrophic state of the tissue persisted. This phenomenon may share a similar mechanism to that observed in cardiac tissue [32].
Crown-like structures (CLS) were identified within diabetic adipose tissue. These structures, comprised of macrophages surrounding dying fat cells, are a sign of inflammation in adipose tissue. These immune cells can release cytokines, attracting additional macrophages to the area, and worsening the inflammation [41]. CLS structures were observed even after RSV treatment in diabetic rats suggesting that the downregulation of RAGE, a mediator of immune responses, did not change the inflammatory state of the adipose tissue.
PPARα expression was upregulated, likely reflecting the tissue’s role in energy storage and fatty acid mobilization during insulin resistance. RSV treatment restored PPARα levels in adipose tissue to normal, though it did not affect adipocyte size. Differently from muscle tissues, RSV normalized the reduced mTOR levels found in the adipose tissue of diabetic rats, may be because mTOR activity is essential for suppressing lipolysis and maintaining systemic lipid homeostasis [42].
3.4. Study Limitations
Despite consistent findings, the study’s limitations include the lower dosage of RSV used. Recent research has employed higher concentrations, such as 60, 120, and 240 mg/kg body weight [43] and up to 250 mg/kg body weight {44], which may elicit more pronounced effects. Another area for improvement is the relatively short follow-up period. While this study observed animals for six weeks, longer durations, such as 12 weeks [44] and 16 weeks [45], might better capture the cumulative effects of RSV treatment. Furthermore, RSV’s efficacy might depend on the progression of type 2 diabetes. It may be more effective in earlier stages when insulin levels remain sufficient to support glucose uptake by cells. In advanced stages, where insulin levels are significantly depleted, the therapeutic benefits of RSV may be diminished.
4. Materials and Methods
Thirty-two Wistar rats (250–350 g) from the University of São Paulo Medical School were randomly assigned to four groups: control (C), control treated with RSV (RC), diabetic (D), and diabetic treated with RSV (RD), with eight animals per group. After 8 weeks, all animals were sacrificed by decapitation. The heart and gastrocnemius muscles were excised, washed in ice-cold 0.9% NaCl, and weighed. Total visceral fat was also collected. Tissues were either prepared for histological analysis or frozen in liquid nitrogen and stored at −80°C. The study adhered to the 2011 Guide for the Care and Use of Laboratory Animals and was approved by the institutional ethics committee.
4.1. Diabetes Induction
Type 2 diabetes was induced by administering streptozotocin (50 mg/kg IV, dissolved in citrate buffer) followed by nicotinamide (100 mg/kg IP). Rats with glucose levels ≥180 mg/dL after 15 days were considered diabetic, and glucose levels were monitored weekly using a portable glucometer. After 2 weeks, groups RC and RD were treated with RSV (22.04 mg/kg) for 6 weeks via gavage, while the control and diabetic groups (C and D) received only 12% ethanol.
4.2. Muscle Measurements
Heart and gastrocnemius muscle weights were normalized to body mass and expressed as mg/g. Left ventricular mass was also calculated by echocardiogram and normalized to body weight (Data extracted from Strunz et al., 2017)
4.3. Histopathological Analysis
For histological analysis, 5-μm sections obtained from formalin-fixed paraffin-embedded samples of cardiac and skeletal muscle and adipose tissue were stained with hematoxilin-Eosin (HE) and picrosirius red (for collagen detection).
The percentage of positive area stained with picrosirius red (collagen) was evaluated in five randomly chosen histological fields (40x mangnification) using the image analysis software Image, J. The results were expressed as multiples of the median of the control rats (C) to which was attributed a unitary value.
Adipocyte diameters were measured using HE staining. To obtain representative values, we used the average measurements of adipocyte diameters from five randomly chosen histological fields (all whole cells were evaluated) captured at 20x magnification using the AxioVision system (Zeiss, Oberkochen, Germany). The results were expressed in micrometers as median and Interquartiles (IQ).
For immunohistochemistry, 5 µm thick sections underwent antigen retrieval in citrate buffer, pH 6.0 for 2 min at 121 psi pressure in Pascal pan (DAKO Cytomation, Carpinteria, CA, USA). The sections were incubated with anti-CD68 as the primary antibody for macrophage identification (EPR23917 from Abcam, Cambridge, Cambridgeshire, UK) diluted 1:500 in a specific antibody diluent reagent (Thermo Scientific). Picture Max kit (Thermo Scientific) was used for the detection of the antigen/antibody complex. Positive control (rat heart) was treated as described.
4.4. Western Blot Analysis
Protein extraction from cardiac and skeletal muscles and adipose tissue was performed using RIPA buffer. Approximately 30 µg of protein per sample was separated by SDS-PAGE and transferred to Immobilon-P membranes. Primary antibodies included anti-Glypican-1, anti-Syndecan-4, anti-RAGE, p-AKT/AKT, p-mTOR/mTOR, p-S6rp/rpS6, Beclin 1, Fbx 32, SIRT-1, and PPARα. Protein extraction was performed from the cardiac and skeletal muscle pool obtained from all eight animals of each group using the L-Beader 6 (Loccus Biotecnologia, SP, Brazil) tissue disruptor and RIPA buffer (Santa Cruz Biotechnology, Santa Cruz, CA, USA). Protein concentration was determined using the Bradford method. Adipose tissue protein was extracted using the same method, but the tissue was previously pressed between two sheets of filter paper to remove excess fat. Approximately 30 µg of protein were analyzed by 10% SDS-polyacrilamide gel electrophoresis electrotransferred to an Immobilon-P membrane (Millipore, Billerica, MA, USA), blocked and probed with primary antibodies: M-95 anti-Glypican-1 (1:500), H-140 anti-Syndecan-4 (1:500), SIRT-1 (H-300) all from Santa Cruz Biotechnology, anti-RAGE (0,6 µg/ml, Thermo Scientific), mammalian target of rapamycin (mTOR, 7C10) and the phosphorylated form (p-mTOR), the ribosomal protein S6 (rpS6, 5G10) and the phosphorylated form (p-rpS6, 91B2) (1:1000) from Cell Signalling Technologies (Danvers, MA, USA), p-AKT, AKT (EPR 18853 and 16798 respectively), Beclin-1 (EPR19662), Fbx 32(EPR914(2) and PPAR α from ABCAM (Cambridge, UK) and followed by incubation with secondary horseradish peroxidase (HRP)-conjugated goat anti-rabbit IgG (Calbiochem, EMD Millipore MA, USA, 1:2500). Blots were developed using a western blot chemiluminescent reagent (Thermo Scientific). Quantification of bands was performed using Image J software (Schneider CA et al., 2012). A kaleidoscope marker (Bio-Rad) was used to measure molecular weights. The pool of each group was run in quadruplicate in two different gels with two samples/gel. Results were normalized by GAPDH (ABCAM) and beta-actin (Santa Cruz Biotechnology) for adipose tissue values and expressed as multiples of control rat results.
4.5. Statistical Analysis
The Kolmogorov-Smirnov normality test was used to analyze the normality of the data. Data was expressed as median, and interquartile range (IQR). The comparison between groups was performed using the Student’s t-test for parametric variables and the Mann–Whitney for non-parametric variables. The significance level adopted for the statistical tests was 5% (p<0.05). Statistical analyses were performed using the MedCalc Statistical Software version 14.12.0 (MedCalc Software bvba, Ostend, Belgium).
5. Conclusions
This study emphasizes the complex tissue-specific responses to diabetes and RSV treatment. The cardiac muscle demonstrated the greatest benefit from the modulation induced by RSV. RSV demonstrated a significant therapeutic effect by reducing fibrosis while modulating protein pathways and normalizing markers such as RAGE and rpS6. Although RSV’s impact on fibrosis was promising, it did not fully reverse structural and functional impairments associated with diabetes. The persistent sarcopenia in skeletal muscle and metabolic dysfunction in adipose tissue indicate that while RSV holds potential in addressing fibrosis, its efficacy may be limited in fully countering the broad range of diabetes-related complications.
Author Contributions
CMCS conceived the project, performed the statistical analyses, and wrote the manuscript. AR conducted the technical procedures and wrote the manuscript. PLC and MCI were responsible for the animal experimentation phase. LAB supervised the histological evaluation, and APM contributed to writing the manuscript.
Funding
This research was funded by Fundação de Amparo à Pesquisa do Estado de São Paulo – FAPESP, grant number 201220262-7.
Acknowledgments
During the preparation of this work, AI tools ChatGPT (OpenAI) and Gemini were used to perform the correction and grammatical review of the text in English. Our goal in using these tools was to improve the clarity and accuracy of the writing, always ensuring that the scientific findings and the analytical approach remained unchanged.
Conflicts of Interest
The authors declare no conflicts of interest.
Abbreviations
| AGE | Advanced glycation end-products |
| AKT | Protein kinase B |
| FOXO | Forkhead box O |
| IGF | Insulin growth factor |
| mTOR | Mammalian target of rapamycin activity |
| PPAR α | Peroxisome proliferator-activated receptor alpha) |
| rpS6 | Ribosomic protein S6 |
| SIRT-1 | Sirtuin 1 |
| TGFβ | Transforming growth factor β |
| RSV | Resveratrol |
References
- Crasto, W.; Patel, V.; Davies, M.J.; Khunti, K. Prevention of Microvascular Complications of Diabetes. Endocrinol Metab Clin North Am 2021, 50, 431–455. [Google Scholar] [CrossRef] [PubMed]
- Huynh, K.; Bernardo, B.C.; McMullen, J.R.; Ritchie, R.H. Diabetic cardiomyopathy: mechanisms and new treatment strategies targeting antioxidant signaling pathways. Pharmacol Ther 2014, 142, 375–415. [Google Scholar] [CrossRef]
- Garnham, J.O.; Roberts, L.D.; Espino-Gonzalez, E.; Whitehead, A.; Swoboda, P.P.; Koshy, A.; Gierula, J. , Paton, M.F.; Cubbon, R.M.; Kearney, M.T.; Egginton, S.; Bowen, T.S.; Witte, K. Chronic heart failure with diabetes mellitus is characterized by a severe skeletal muscle pathology. J Cachexia Sarcopenia Muscle 2020, 11, 394–404. [Google Scholar] [CrossRef] [PubMed]
- Tandon, P.; Wafer, R.; Minchin, J.E.N. Adipose morphology and metabolic disease. J Exp Biol 2018, 221 (Suppl 1), jeb164970. [Google Scholar] [CrossRef] [PubMed]
- Dilman, W.H. Diabetic Cardiomyopathy. Circ Res 2019, 12, 1160–1162. [Google Scholar] [CrossRef]
- Lee, G.; Goldberg, A. Atrogin1/MAFbx: what atrophy, hypertrophy, and cardiac failure have in common. Circ Res 2011, 8, 123–126. [Google Scholar] [CrossRef] [PubMed]
- Schiaffino, S.; Dyar, K.A.; Ciciliot, S.; Blaauw, B.; Sandri, M. Mechanisms regulating skeletal muscle growth and atrophy. FEBS J 2013, 280, 4294–4314. [Google Scholar] [CrossRef]
- Sartori, R.; Romanello, V.; Sandri, M. Mechanisms of muscle atrophy and hypertrophy: implications in health and disease. Nat Commun 2021, 12, 330. [Google Scholar] [CrossRef]
- Stitt, T.N.; Drujan, D.; Clarke, B.A.; Panaro, F.; Timofeyva, Y.; Kline, W.O.; Gonzalez, M.; Yancopoulos, G.D.; Glass, D.J. The IGF-1/PI3K/Akt pathway prevents expression of muscle atrophy-induced ubiquitin ligases by inhibiting FOXO transcription factors Mol Cell 2004, 14, 395–403. [CrossRef]
- Sandri, M. Autophagy in health and disease. Involvement of autophagy in muscle atrophy. Am J Physiol Cell Physiol 2010, 298, C1291–C1297. [Google Scholar] [CrossRef]
- Bonaldo, P.; Sandri, M. Cellular and molecular mechanisms of muscle atrophy. Dis Model Mech 2013, 6, 25–39. [Google Scholar] [CrossRef]
- Brett, J.; Schmidt, A.M.; Yan, S.D.; Zou, Y.S.; Weidman, E.; Pinsky, D.; Nowygrod, R.; Neeper, M.; Przysiecki, C.; Shaw, A.; et al. Survey of the distribution of a newly characterized receptor for advanced glycation end products in tissues. Am J Pathol 1993, 143, 1699–1712. [Google Scholar] [PubMed]
- Negre-Salvayre, A.; Salvayre, R.; Augé, N.; Pamplona, R.; Portero-Otín, M. Hyperglycemia and glycation in diabetic complications. Antioxid Redox Signal 2009, 11, 3071–3109. [Google Scholar] [CrossRef] [PubMed]
- Ostendorp, T.; Leclerc, E.; Galichet, A.; Koch, M.; Demling, N.; Weigle, B.; Heizmann, C.W.; Kroneck, P.M.H.; Fritz, G. Structural and functional insights into RAGE activation by multimeric S100B. EMBO J 2007, 26, 3868–3878. [Google Scholar] [CrossRef]
- Zong, H.; Madden, A.; Ward, M.; Mooney, M.H.; Elliott, C.T.; Stitt, A.W. Homodimerization Is Essential for the Receptor for Advanced Glycation End Products (RAGE)-mediated. Signal Transduction J Biol Chem 2010, 285, 23137–23146. [Google Scholar] [CrossRef]
- Yatime, L.; Andersen, G.R. Structural insights into the oligomerization mode of the human receptor for advanced glycation end-products. FEBS Journal 2013, 280, 6556–6568. [Google Scholar] [CrossRef]
- Barlovic, D.P.; Soro-Paavonen, A.; Jandeleit-Dahm, K.A. RAGE biology, atherosclerosis and diabetes. Clin Sci (Lond) 2011, 121, 43–55. [Google Scholar] [CrossRef] [PubMed]
- Sorci, G.; Riuzzi, F.; Giambanco, I.; Donato, R. RAGE in tissue homeostasis, repair and regeneration. Biochim Biophys Acta 2013, 1833, 101–109. [Google Scholar] [CrossRef]
- Liu, J.; Jin, Z.; Wang, X.; Jakoš, T.; Zhu, J.; Yuan, Y. RAGE pathways play an important role in regulation of organ fibrosis. Life Sci 2023, 323, 121713. [Google Scholar] [CrossRef]
- Lagouge, M.; Argmann, C.; Gerhart-Hines, Z.; Meziane, H.; Lerin, C.; Daussin, F.; Messadeq, N.; Milne, J.; Lambert, P.; Elliott, P.; Geny, B.; Laakso, M.; Puigserver, P.; Auwerx, J. Resveratrol improves mitochondrial function and protects against metabolic disease by activating SIRT1 and PGC-1alpha. Cell 2006, 127, 1109–1122. [Google Scholar] [CrossRef] [PubMed]
- Nemoto, S.; Fergusson, M.M.; Finkel, T. Nutrient availability regulates SIRT1 through a fork head dependent pathway. Science 2004, 306, 2105–2108. [Google Scholar] [CrossRef] [PubMed]
- Mansur, A.P.; Roggerio, A.; Goes, M.F.; Avakian, S.D.; Leal, D.P.; Maranhão, R.C.; Strunz, C.M. Serum concentrations and gene expression of sirtuin 1 in healthy and slightly overweight subjects after caloric restriction or resveratrol supplementation: A randomized trial. Int J Cardiol 2017, 15, 788–794. [Google Scholar] [CrossRef] [PubMed]
- Um, J.H.; Park, S.J.; Kang, H.; Yang, S.; Foretz, M.; McBurney, M.W.; Kim, M.K.; Viollet, B.; Chung, J.H. AMP-activated protein kinase-deficient mice are resistant to the metabolic effects of resveratrol. Diabetes 2010, 59, 554–563. [Google Scholar] [CrossRef]
- Chan, A.Y.; Dolinsky, V.W.; Soltys, C.L.; Viollet, B.; Baksh, S.; Light, P.E.; Dyck, J.R. Resveratrol inhibits cardiac hypertrophy via AMP-activated protein kinase and Akt. J Biol Chem 2008, 283, 24194–24201. [Google Scholar] [CrossRef]
- Liu, M.; Liu, F. Resveratrol inhibits mTOR signaling by targeting DEPTOR. Commun Integr Biol 2011, 4, 382–384. [Google Scholar] [CrossRef] [PubMed]
- Strunz, C.M.; Roggerio, A.; Cruz, P.L.; Pacanaro, A.P.; Salemi, V.M.; Benvenuti, L.A.; Mansur, A.P.; Irigoyen, M.C. Down-regulation of fibroblast growth factor 2 and its co-receptors heparan sulfate proteoglycans by resveratrol underlies the improvement of cardiac dysfunction in experimental diabetes. J Nutr Biochem 2017, 40, 219–227. [Google Scholar] [CrossRef] [PubMed]
- Nowotny, K.; Jung, T.; Höhn, A.; Weber, D.; Grune, T. Advanced Glycation End Products and Oxidative Stress in Type 2 Diabetes Mellitus. Biomolecules 2015, 5, 194–222. [Google Scholar] [CrossRef] [PubMed]
- Liang, B.; Zhou, Z.; Yang, Z.; Liu, J.; Zhang, L.; He, J.; Li, H.; Huang, Y.; Yang, Q.; Xian, S.; Wang, L. AGEs-RAGE axis mediates myocardial fibrosis via activation of cardiac fibroblasts induced by autophagy in heart failure. Exp Physiol 2022, 107, 879–891. [Google Scholar] [CrossRef]
- Feng, B.; Chen, S.; Chiu, J.; George, B.; Chakrabarti, S. Regulation of cardiomyocyte hypertrophy in diabetes at the transcriptional level. Am J Physiol Endocrinol Metab 2008, 294, E1119–E1126. [Google Scholar] [CrossRef] [PubMed]
- Leender, M.; Verdijk, L.B.; van der Kranenburg, J.; Nilwik, R.; van der Loon, L. Patients with type 2 diabetes show a greater decline in muscle mass, muscle strength, and functional capability with aging. J Am Med Dir Assoc 2013, 14, 585–592. [Google Scholar] [CrossRef] [PubMed]
- Nunes, S.; Sores, E.; Pereira, F.; Reis, F. The role of inflammation in diabetic cardiomyopathy. International Journal of Interferon, Cytokine and Mediator. Research 2012, 4, 59–73. [Google Scholar] [CrossRef]
- Zhu, Y.; Wu, F.; Yang, Q.; Feng, H.; Xu, D. Resveratrol Inhibits High Glucose-Induced H9c2 Cardiomyocyte Hypertrophy and Damage via RAGE-Dependent Inhibition of the NF-κB and TGF-β1/Smad3 Pathways. Evid Based Complement Alternat Med 2022, 2022, 7781910. [Google Scholar] [CrossRef]
- Heineke, J.; Molkentin, J. Regulation of cardiac hypertrophy by intracellular signalling pathways. Nat Rev Mol Cell Biol 2006, 7, 589–600. [Google Scholar] [CrossRef]
- Dolinsky, V.W.; Chakrabarti, S.; Pereira, T.J.; Oka, T.; Levasseur, J.; Beker, D.; Zordoky, B.N.; Morton, J.S.; Nagendran, J.; Lopaschuk, G.D.; Davidge, S.T.; Dyck, J.R. Resveratrol prevents hypertension and cardiac hypertrophy in hypertensive rats and mice. Biochim Biophys Acta 2013, 1832, 1723–1733. [Google Scholar] [CrossRef] [PubMed]
- Armour, S.M.; Baur, J.A.; Hsieh, S.N.; Land-Bracha, A.; Thomas, S.M.; Sinclair, D.A. Inhibition of mammalian S6 kinase by resveratrol suppresses autophagy. Aging (Albany NY) 2009, 1, 515–528. [Google Scholar] [CrossRef]
- Nishida, K.; Kyoi, S.; Yamaguchi, Y.; Sadoshima, J.; Otsu, K. The role of autophagy in the heart. Cell Death Differ Cell Death and Differentiation 2009, 16, 31–38. [Google Scholar] [CrossRef] [PubMed]
- Lee, T.W.; Bai, K.J.; Lee, T.I.; Chao, T.F.; Kao, Y.H.; Chen, Y.J. PPARs modulate cardiac metabolism and mitochondrial function in diabetes. J Biomed Sci 2017, 24, 5. [Google Scholar] [CrossRef] [PubMed]
- Remels, A.H.; Schrauwen, P.; Broekhuizen, R.; Willems, J.; Kersten, S.; Gosker, H.R.; Schols, A.M. ; Peroxisome proliferator-activated receptor expression is reduced in skeletal muscle in COPD. European Respiratory Journal 2007, 30, 245–252. [Google Scholar] [CrossRef] [PubMed]
- Sathyapala, S.A.; Kemp, P.M.; Polkey, I. Decreased muscle PPAR concentrations: a mechanism underlying skeletal muscle abnormalities in COPD? Polkey. European Respiratory Journal 2007, 30, 191–193. [Google Scholar] [CrossRef] [PubMed]
- Zhao, J.; Wu, Y.Y.; Rong, X.L.; Zheng, C.W.; Guo, J. Anti-Lipolysis Induced by Insulin in Diverse Pathophysiologic Conditions of Adipose Tissue. Diabetes Metab Syndr Obes 2020, 13, 1575–1585. [Google Scholar] [CrossRef] [PubMed]
- Surmi, B.K.; Hasty, A.H. Macrophage infiltration into adipose tissue: initiation, propagation and remodeling. Future Lipidol 2008, 3, 545–556. [Google Scholar] [CrossRef]
- Paolella, L.M.; Mukherjee, S.; Tran, C.; Bellaver, B.; Hugo, M.; Luongo, T.S.; Shewale, S.V.; Lu, W.; Chellappa, K.; Baur, J.A. mTORC1 restrains adipocyte lipolysis to prevent systemic hyperlipidemia. Molecular Metabolism 2020, 32, 136–147. [Google Scholar] [CrossRef] [PubMed]
- Zhang, G.; Wang, X.; Ren, B.; Zhao, Q.; Zhang, F. The Effect of Resveratrol on Blood Glucose and Blood Lipids in Rats with Gestational Diabetes Mellitus 2021, 956795, 1–7. [CrossRef]
- Li, S.; Feng, F.; Deng, Y. Resveratrol Regulates Glucose and Lipid Metabolism in Diabetic Rats by Inhibition of PDK1/AKT Phosphorylation and HIF-1α Expression. Diabetes, Metabolic Syndrome and Obesity 2023, 16, 1063–1074. [Google Scholar] [CrossRef]
- Fang W-J. ; Wang C-J.; He Y, Zhou Y-L.; Peng X-D.; Liu S-K. Resveratrol alleviates diabetic cardiomyopathy in rats by improving mitochondrial function through PGC-1α deacetylation. Acta Pharmacologica 2018, 39, 59–73. [Google Scholar] [CrossRef]
Figure 1.
Western blot analysis of Glypican-1, Syndecan-4, RAGE, p-AKT, AKT, p-mTOR, mTOR, rpS6, prpS6, Fbx32, Beclin-1, SIRT1, and PPARα levels in cardiac (A and B) and skeletal muscle (C and D) tissues, as well as adipose tissue (E and F), from Control (C), Resveratrol Control (RC), Diabetic (D), and Resveratrol Diabetic (RD) rats. GAPDH and β actin were used to normalize the values.
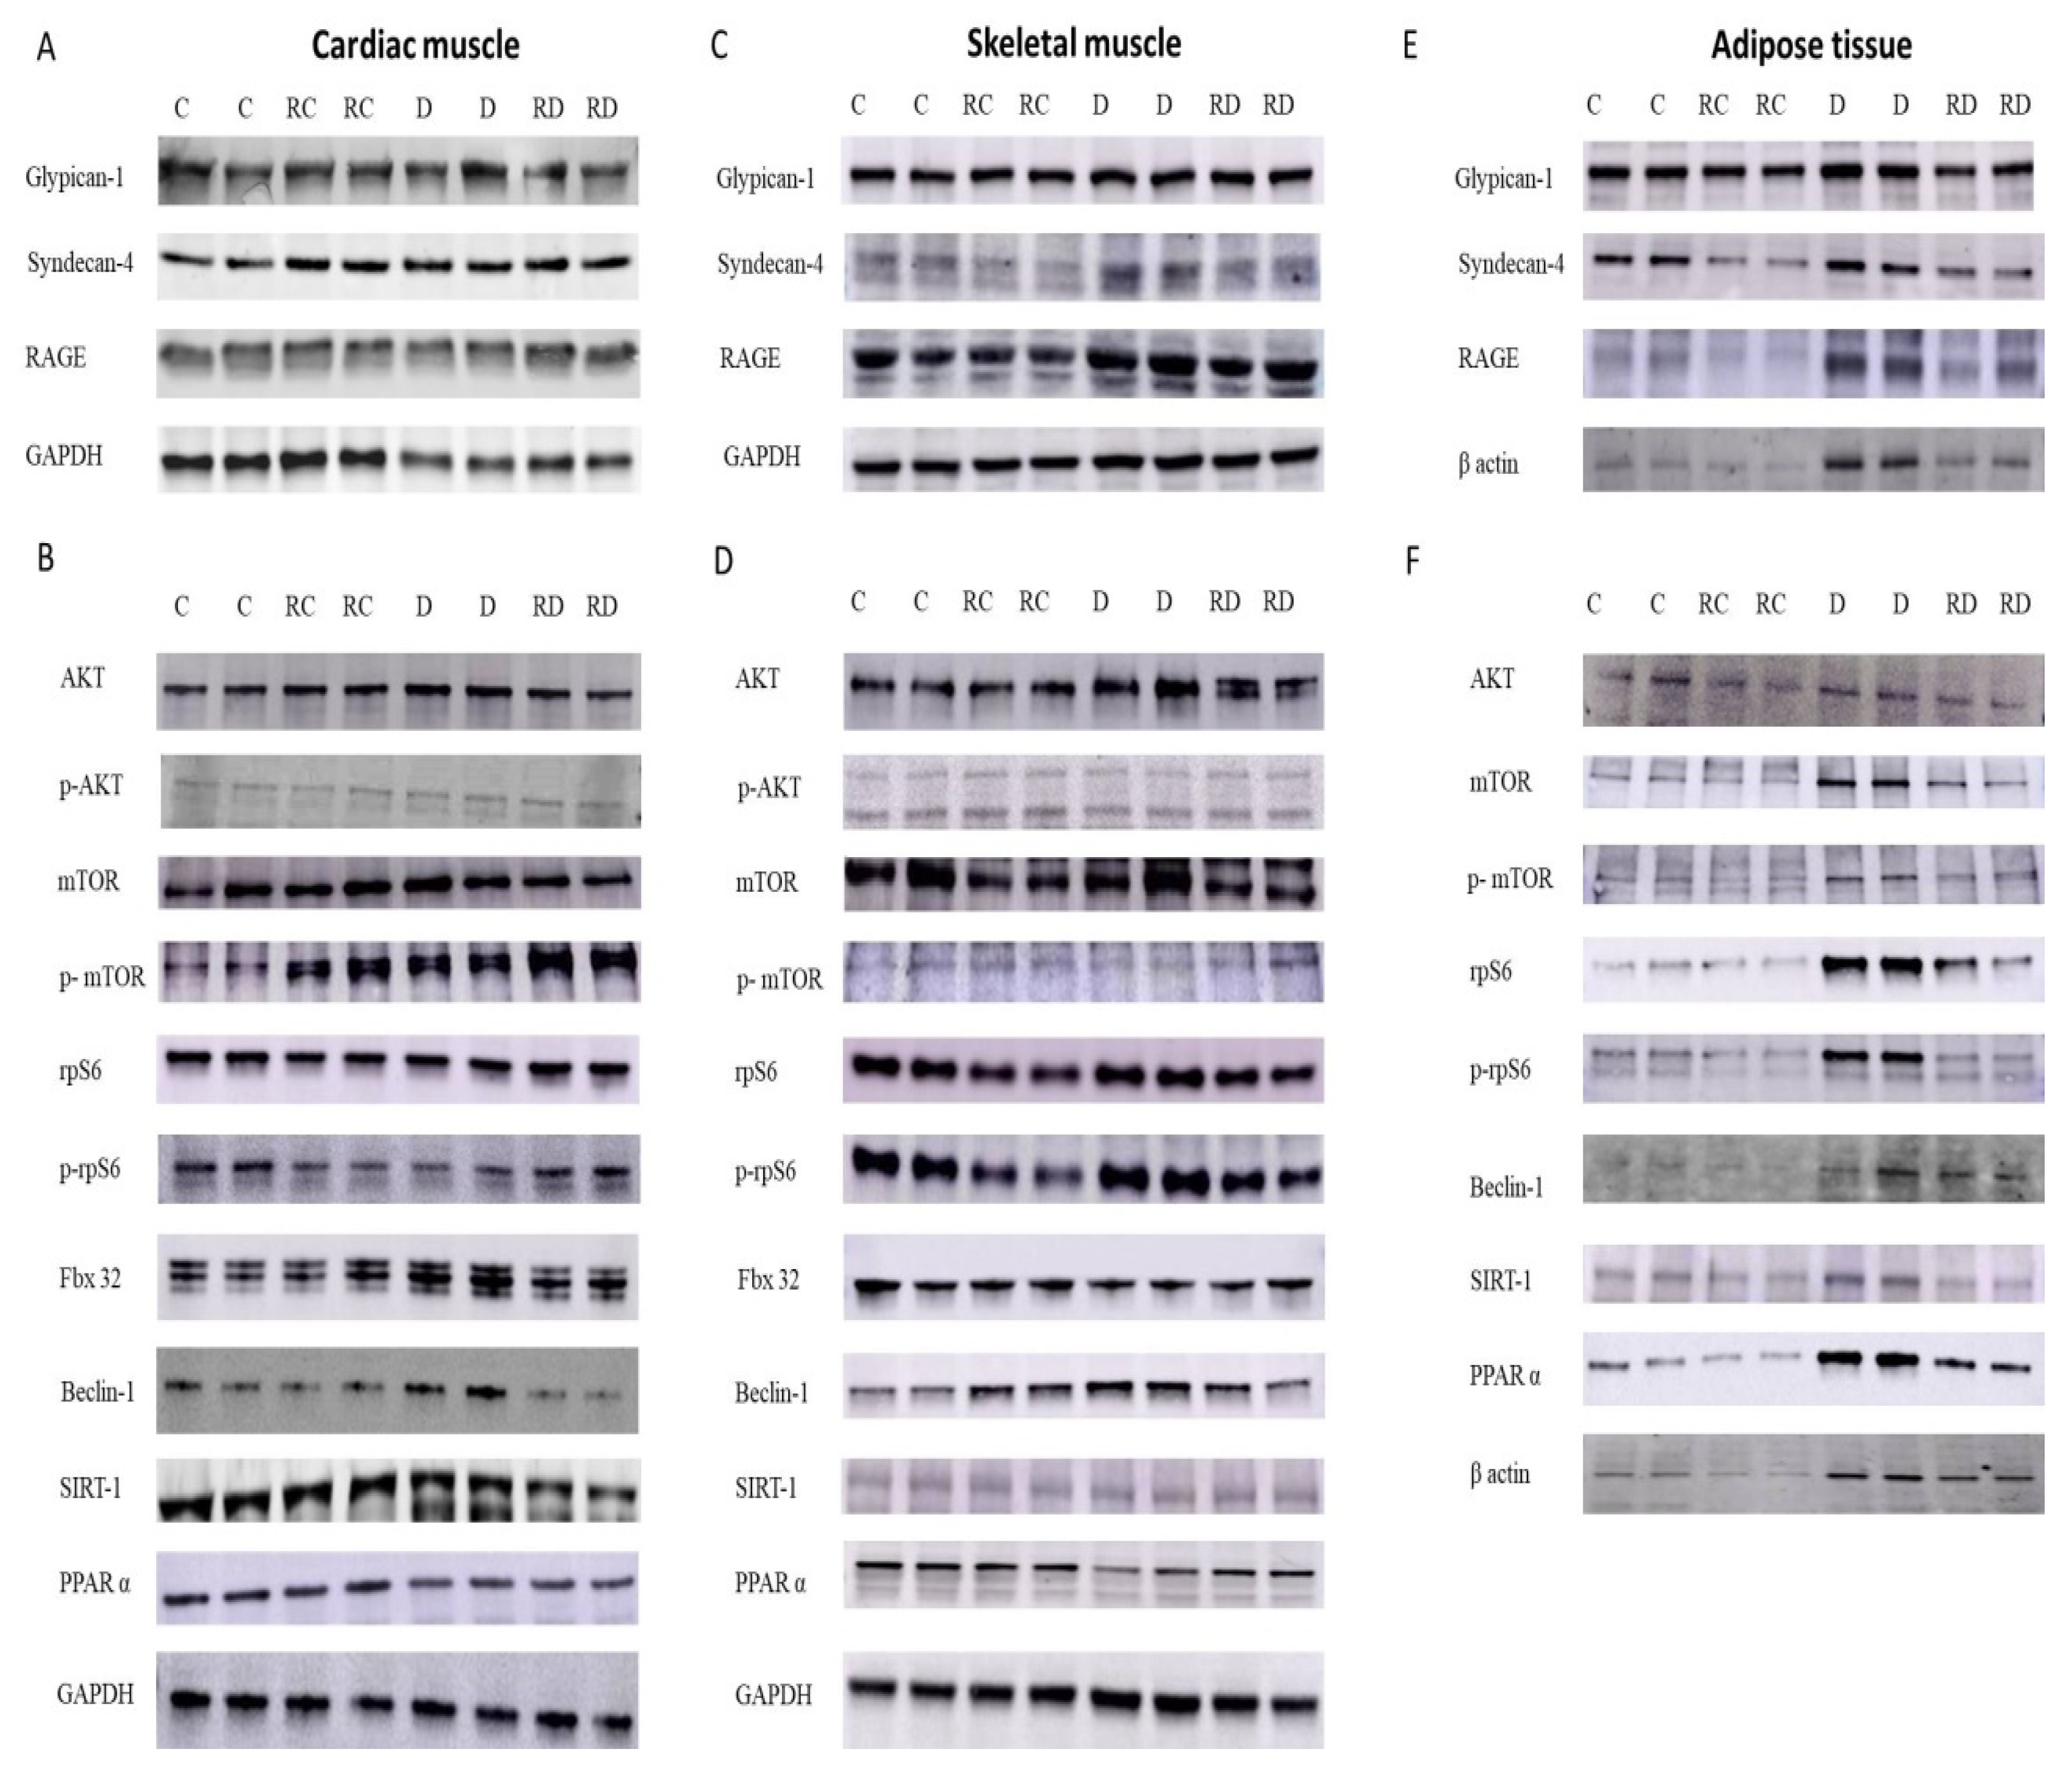
Figure 2.
Representative images of PicroSirius staining. Diabetic (D) and Resveratrol Diabetic (RD) rats in cardiac and skeletal muscle. Scale bars: 50 μm.
Figure 2.
Representative images of PicroSirius staining. Diabetic (D) and Resveratrol Diabetic (RD) rats in cardiac and skeletal muscle. Scale bars: 50 μm.
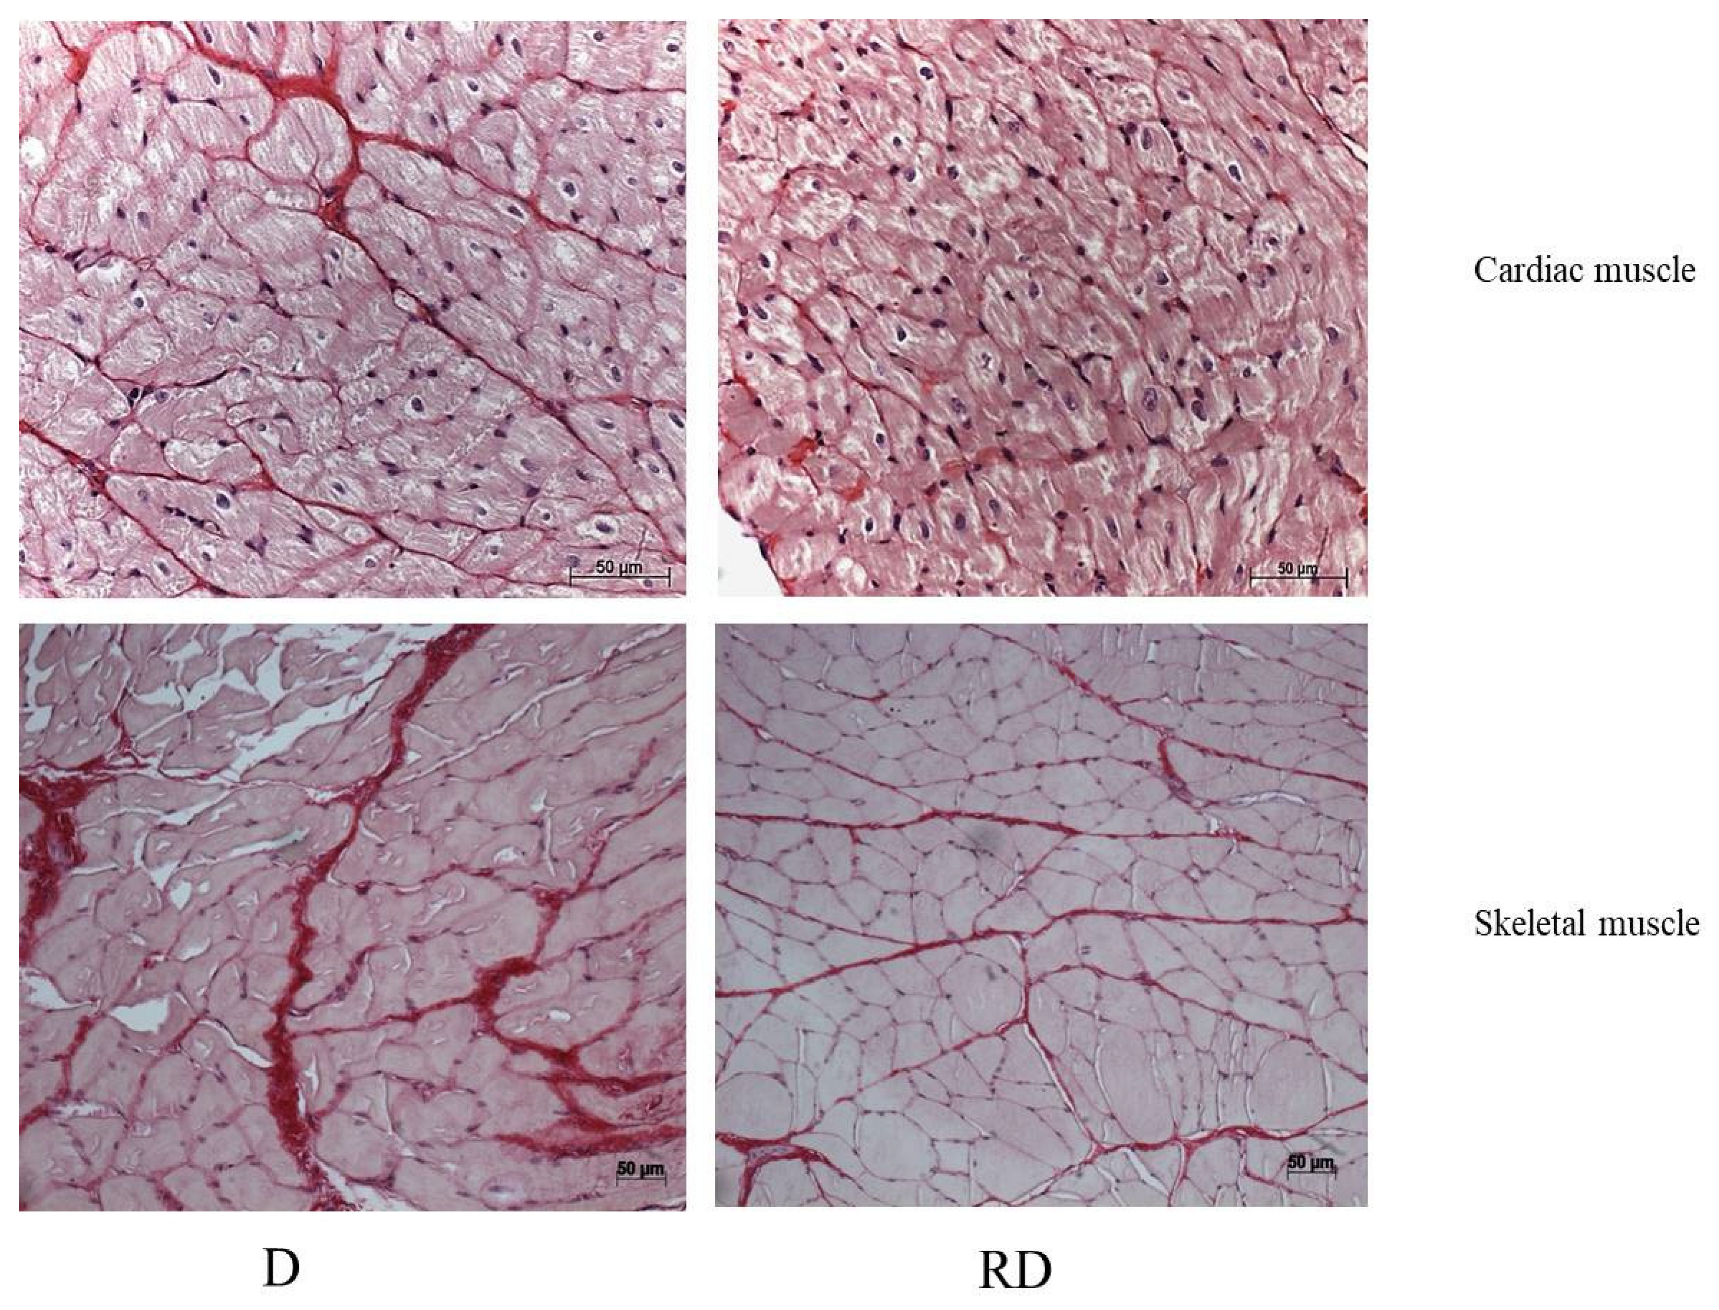
Figure 3.
Adipocyte size. Control (C), Resveratrol Control (RC) Diabetic (D) Resveratrol Diabetic (RD).
Figure 3.
Adipocyte size. Control (C), Resveratrol Control (RC) Diabetic (D) Resveratrol Diabetic (RD).
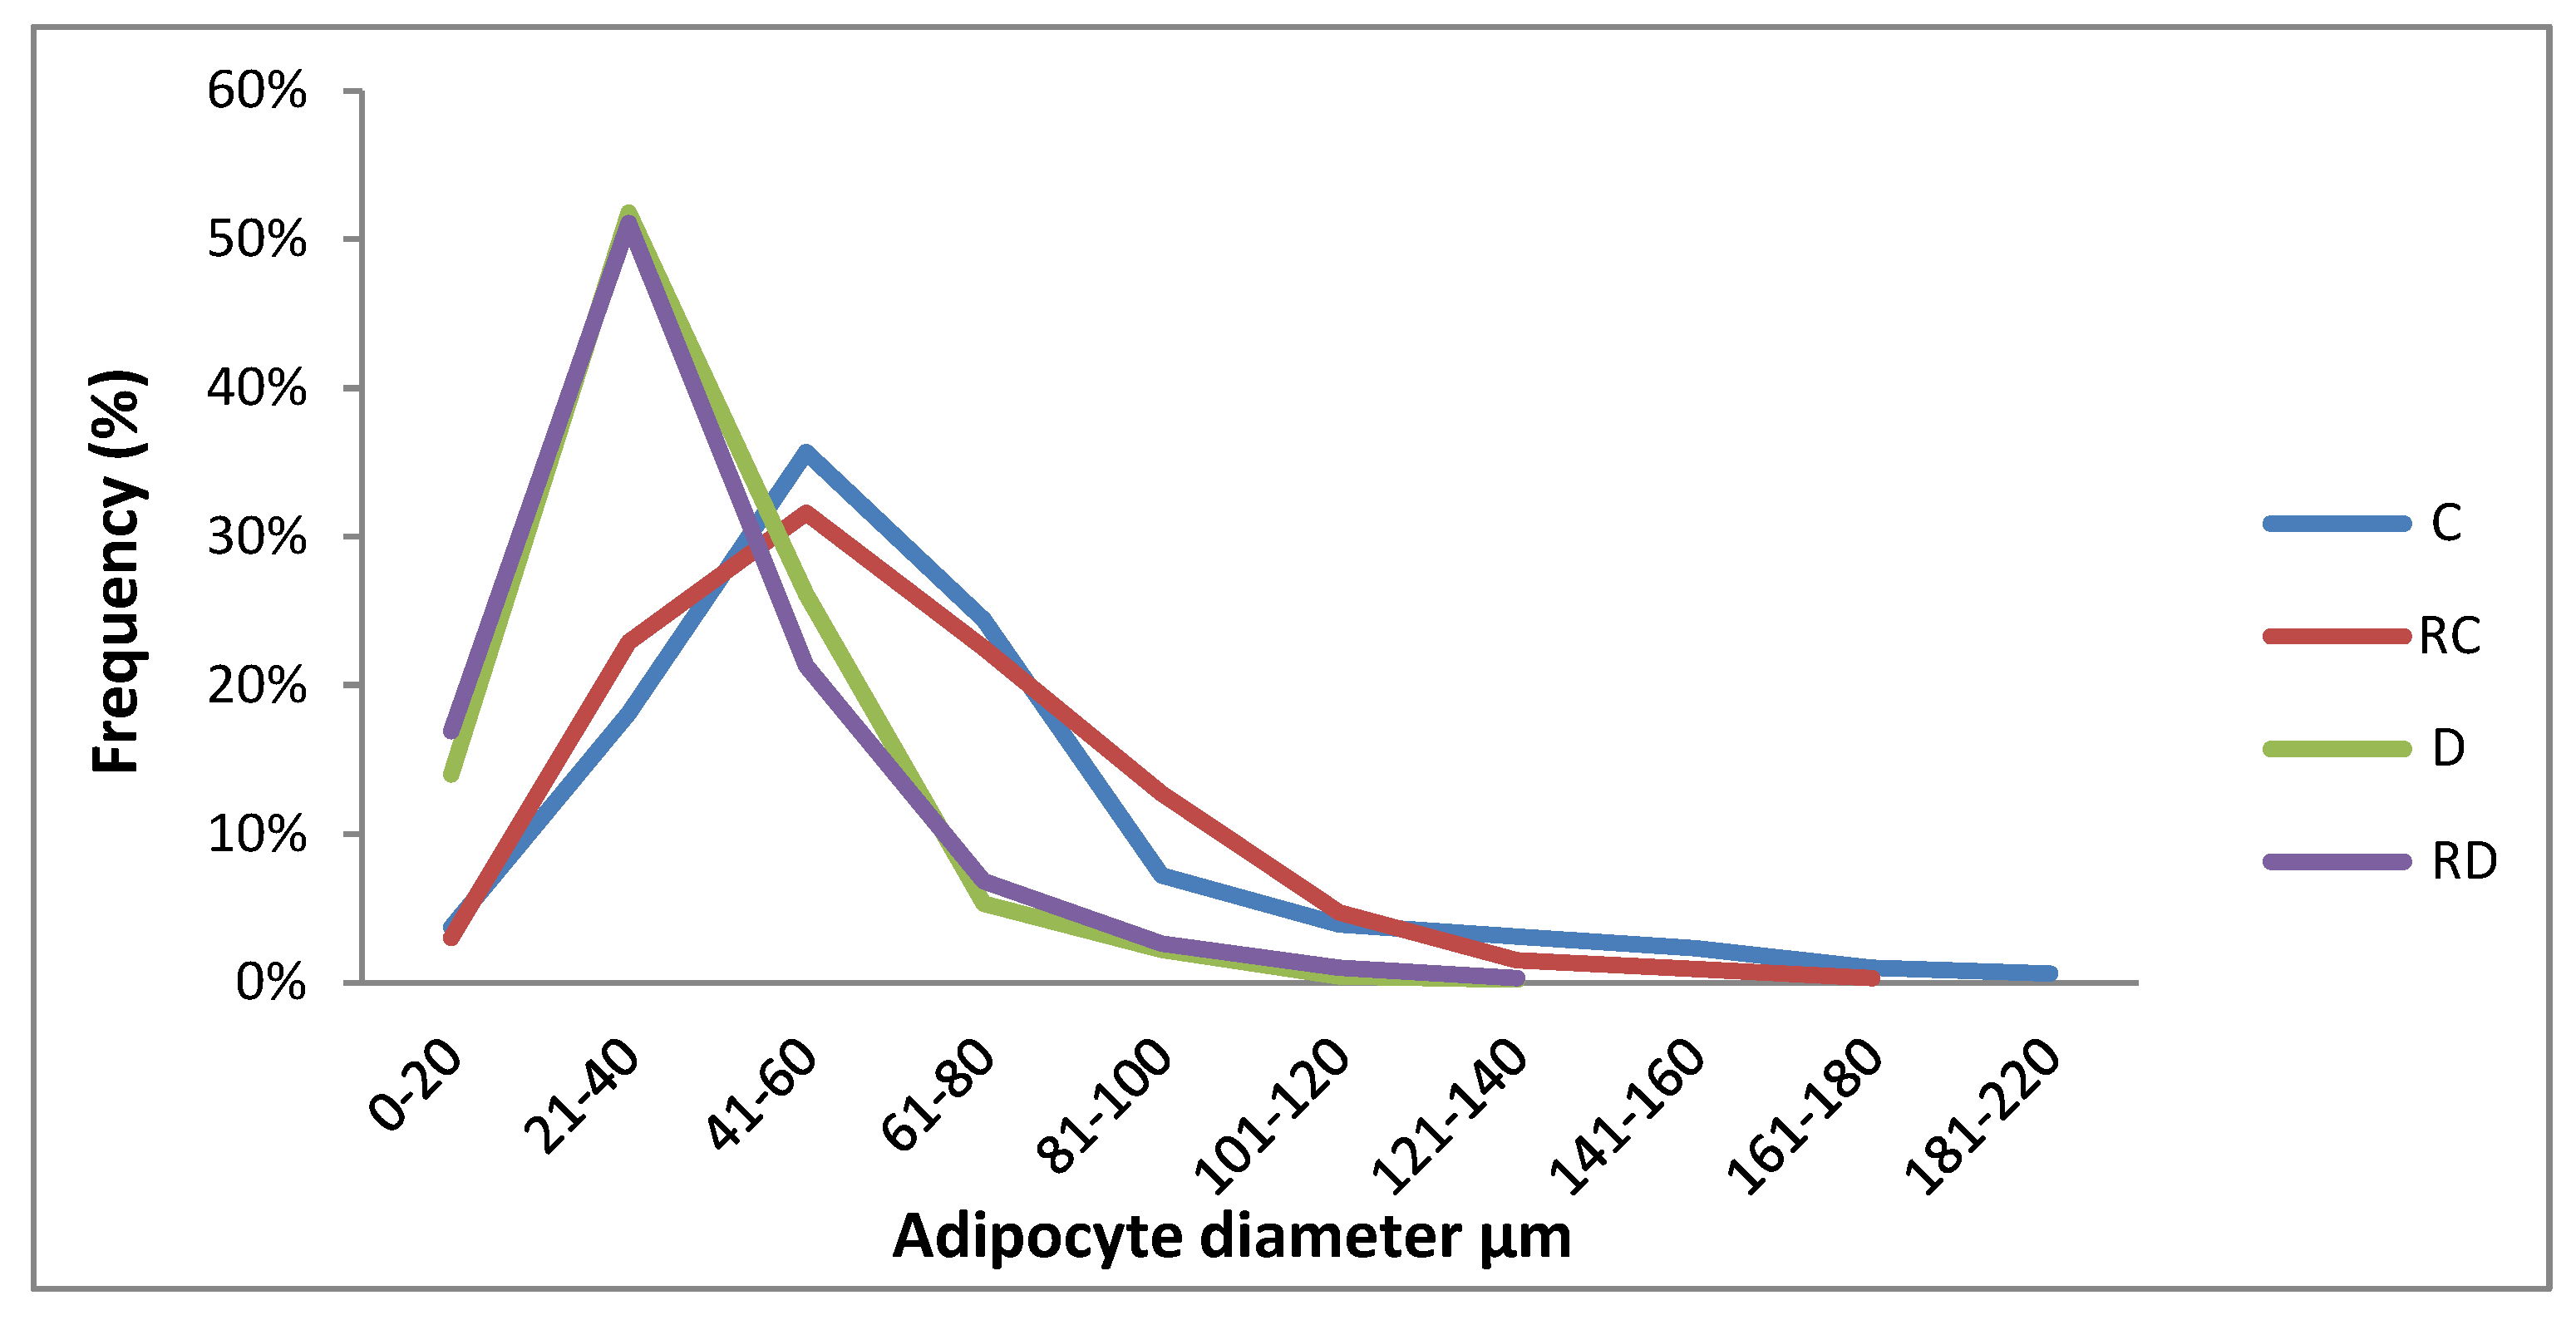
Figure 4.
Adipose tissue histological analysis: Figures A and B representative images of picrosirius staining in Diabetic (D) and Resveratrol Diabetic rats (RD). 200x, scale bars 50 um. Figures C and D representative images of Hematoxilin and Eosin staining in D and RD rats. Black arrows indicate crown-like structures. 20x, scale bars 50 um. Figures E and F representative images of CD68 immunohistochemistry reaction in D and RD rats. 100x, scale bars 10 um.
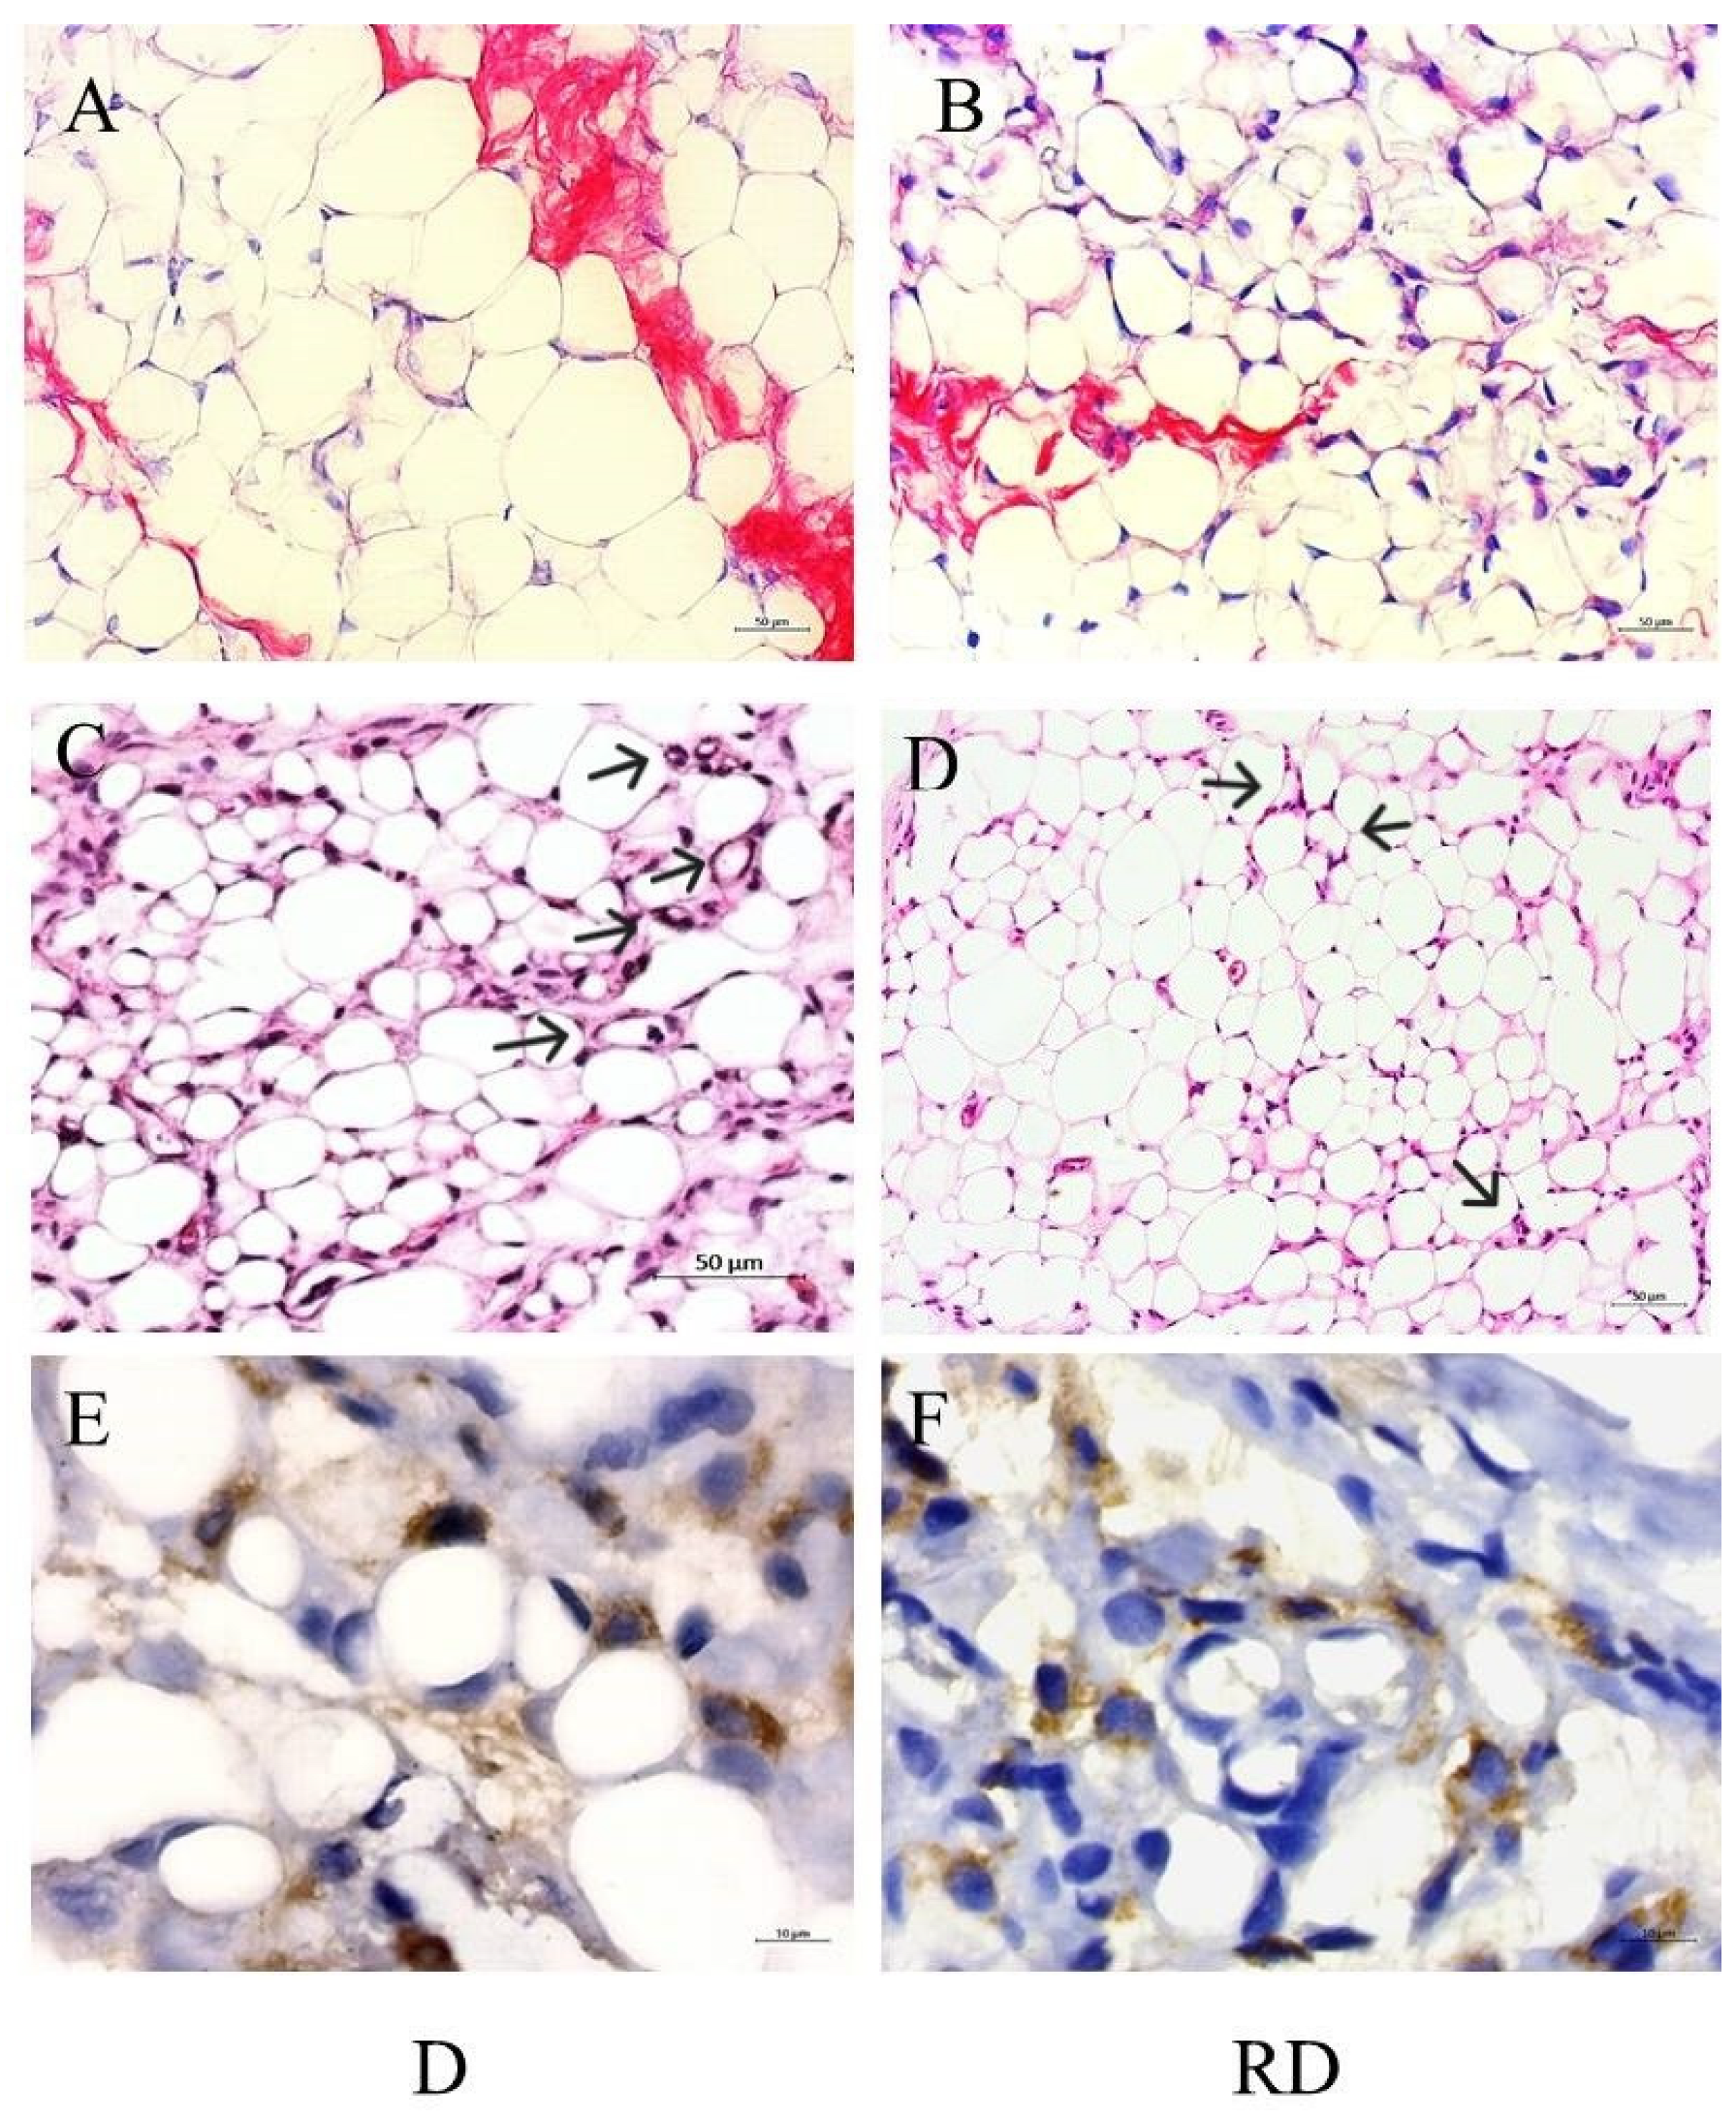

Table 1.
Anthropometric measurements for Control, Resveratrol Control, Diabetes, and Resveratrol Diabetes groups obtained at the end of the study.
Table 1.
Anthropometric measurements for Control, Resveratrol Control, Diabetes, and Resveratrol Diabetes groups obtained at the end of the study.
| C | RC | D | RD | |
|---|---|---|---|---|
| Heart mass/BW (mg/g) | 3.22 (2.74-3.51) |
3.30 (3.17-3.53) | 3.96*† (3.57-4.11) | 3.94* (3.43-5.20) |
| LV mass index/BW(mg/g) | 1.87 (1.80–2.00) | 1.99 (1.80–2.20) | 2.36* (2.07–2.71) | 2.30* (2.20–2.50) |
| Gastrocnemius mass/BW (g/g) | 5.44 (5.14-5.64) | 5.01 (4.84-5.35) | 4.4*† (4.22-4.54) | 4.21*† (3.84-4.58) |
LV, left ventricle. n = 8. Values are presented as median and interquartile (25th and 75th). p < 0,05 *vs C; †vs RC.
Table 2.
Western Blot analysis of Cardiac Muscle and Skeletal Muscle proteins.
| Cardiac Muscle | Skeletal Muscle | ||||||||
|---|---|---|---|---|---|---|---|---|---|
| C/C | RC/C | D/C | RD/C | C/C | RC/C | D/C | RD/C | ||
| Glypican-1 | 1.00 0.95-1.06 | 0.88 0.85–0.91 | 1.66*† 1.54-1.86 | 0.72*†‡ 0.65-0.83 | 1.00 0.97-1.04 |
1.00 0.94-1.02 |
0.94 0.90-1.03 |
0.89* 0.87-0.92 |
|
| Syndecan-4 | 1.00 0.94-1.07 | 1.08 0.94–1.16 | 1.64*† 1.59-1.65 | 1.14*‡ 1.08-1.21 | 1.00 0.99-1.00 |
0.98 0.86-1.11 |
1.27* 1.23-1.33 |
1.08*‡ 1.03-1.11 |
|
| RAGE | 1.00 0.95-1.06 | 0.95 0.89–1,02 | 2.00*† 1.78–2.24 | 1.53*†‡ 1.47–1.55 | 1.00 0.88-1.12 |
1.03 0.98-1.05 |
1.42*† 1.20-1.54 |
1.15*†‡ 1.10-1.21 |
|
| p-mTOR/mTOR | 1.00 0.95-1.05 |
1.07 1.05-1.11 |
1.22*† 1.21-1.24 |
1.32*†‡ 1.32-1.33 |
1.00 0.98-1.02 |
0.98 0.94-1.02 |
0.71*† 0.65-0.77 |
0.70*† 0.65-0.74 |
|
| p-rpS6/rpS6 | 1.00 0.98-1.03 |
1.00 0.68-1.07 |
1.42*† 1.37-1.64 |
0.96‡ 0.85-1.00 |
1.00 0.97-1.03 |
0.92 0.91-0.98 |
1.10*† 1.10-1.11 |
0.93‡ 0.85-1.00 |
|
| p-AKT/AKT | 1.00 0.94-1.06 |
1.06 1.01-1.09 |
1.18*† 1.15-1.22 |
1.04‡ 1.00-1.07 |
1.00 0.94-1.05 |
0.87* 0.82-0.94 |
0.64* 0.56-0.85 |
0.72*† 0.66-0.75 |
|
| Beclin-1 | 1.00 0.96-1.03 |
1.00 0.92-1.07 |
1.30*† 1.20-1.40 |
0.86*†‡ 0.84-0.90 |
1.00 0.98-1.02 |
0.99 0.98-1.02 |
1.11*† 1.09-1.13 |
0.96‡ 0.87-1.01 |
|
| Fbx32 | 1.00 0.95-1.04 |
1.08 1.04-1.13 |
1.74*† 1.69-1.87 |
1.25*†‡ 1.23-1.28 |
1.00 0.93-1.08 |
0.91 0.82-0.95 |
0.76*† 0.72-0.77 |
0.89*‡ 0.81-0.96 |
|
| SIRT-1 | 1.00 0.97-1.04 |
0.93 0.9-0.95 |
0.97 0.95-0.98 |
0.81*†‡ 0.77-0.82 |
1.00 0.98-1.02 |
0.89 0.87-0.96 |
1.31*† 1.27-1.34 |
0.97‡ 0.90-1.03 |
|
| PPAR alpha | 1.00 0.94-1.05 |
1.01 0.85-1.03 |
0.71*† 0.67-0.79 |
0.72*† 0.67-0.76 |
1.00 0.99-1.01 |
0.99 0.0,91-1.05 |
0.72*† 0.63-0.77 |
0.83*†‡ 0.82-0.86 |
|
Receptor for advanced glycation end-products (RAGE); mammalian target of rapamycin activity (mTOR); phospho-mammalian target of rapamycin activity (p-mTOR); ribosomic protein S6 (rpS6); phospho-rpS6 (p-rpS6); phospho-protein kinase B (p-AKT); protein kinase B (AKT); protein F-box 32 (Fbx32); Sirtuína-1 (SIRT-1); Peroxisome proliferator-activated receptor (PPAR alpha); Control (C); Resveratrol control (RC); Diabetic (D); Resveratrol Diabetic (RD) rats. Results are expressed as multiples of control rat results. p <0.05: * vs C/C; † vs RC/C; ‡ vs D/C.
Table 3.
Picrosirius staining analysis of Cardiac Muscle and Skeletal Muscle.
| C/C | RC/C | D/D | RD/C | |
|---|---|---|---|---|
| Cardiac Muscle | 1.00 0.71-1.14 | 0.73* 0.51-0.96 | 1.24*† 0.83-2.48 | 0.77*‡ 0.58-1.02 |
| Skeletal Muscle | 1.00 0.72-1.41 | 0.53* 0.35-0.81 | 1.30*† 0.88-2.05 | 0.79*‡ 0.47-0.95 |
Control (C); Resveratrol control (RC); Diabetic (D); Resveratrol Diabetic (RD) rats. Results are expressed as multiples of control rat results. p <0.05: * vs C/C; † vs RC/C; ‡ vs D/C.
Table 4.
Western Blot Analysis of adipose tissue. Adipose tissue, with RSV.
| Adipose Tissue | ||||
|---|---|---|---|---|
| C/C | RC/C | D/C | RD/C | |
| Glypican-1 | 1.00 0.91-1.04 | 1.00 0.92-1.01 | 0.75 * 0.69-0.82 | 0.77 *† 0.76-0.82 |
| Syndecan-4 | 1.00 0.98-1.03 | 0.91 0.85-0.95 | 0.71*† 0.71-0.74 | 0.83* 0.70-0.92 |
| RAGE | 1.00 0.94-1.05 | 0.91 0.67-1.09 | 1.26*† 1.18-1.33 | 1.07‡ 1.05-1.08 |
| p-mTOR/mTOR | 1.00 0.99-1.01 | 0.89* 0.79-0.96 | 0.64*† 0.60-0.73 | 1.00†‡ 0.98-1.06 |
| p-rpS6/rpS6 | 1.00 0.95-1.06 | 0.77* 0.61-0.88 | 0.73* 0.67-0.79 | 0.74* 0.64-0.78 |
| AKT | 1.00 0.97-1.02 | 0.98 0.86-1.09 | 0.74*† 0.71-0.77 | 0.73*† 0.71-0.76 |
| Beclin-1 | 1.00 0.93-1.07 | 0.94 0.88-1.06 | 0.96 0.89-1.00 | 1.16‡ 1.04-1.21 |
| SIRT-1 | 1.00 0.97-1.04 | 0.97 0.92-1.12 | 1.05 0.98-1.07 | 0.62*†‡ 0.54-0.73 |
| PPAR alpha | 1.00 0.93-1.07 | 0.93 0.86-0.97 | 1.35*† 1.33-1.39 | 1.00‡ 0.94-1.09 |
Receptor for advanced glycation end-products (RAGE); mammalian target of rapamycin activity (mTOR); phospho-mammalian target of rapamycin activity (p-mTOR); ribosomic protein S6 (rpS6); phospho-rpS6 (p-rpS6); protein kinase B (AKT); Sirtuin 1 (SIRT-1); Peroxisome proliferator-activated receptor (PPAR alpha); Control (C); Resveratrol control (RC); Diabetic (D); Resveratrol Diabetic (RD) rats. Results are expressed as multiples of control rat results p <0.05: * vs C/C; † vs RC/C; ‡ vs D/C.
Disclaimer/Publisher’s Note: The statements, opinions and data contained in all publications are solely those of the individual author(s) and contributor(s) and not of MDPI and/or the editor(s). MDPI and/or the editor(s) disclaim responsibility for any injury to people or property resulting from any ideas, methods, instructions or products referred to in the content. |
© 2025 by the authors. Licensee MDPI, Basel, Switzerland. This article is an open access article distributed under the terms and conditions of the Creative Commons Attribution (CC BY) license (http://creativecommons.org/licenses/by/4.0/).
Copyright: This open access article is published under a Creative Commons CC BY 4.0 license, which permit the free download, distribution, and reuse, provided that the author and preprint are cited in any reuse.


