
Submitted:
10 January 2025
Posted:
13 January 2025
You are already at the latest version
Abstract
Following spatial data capture, stakeholders often invest significant resources to meet technical specifications. This challenge arises largely from varying interpretations of established standards, resulting in data that fails to meet the requirements for ingestion into the enterprise geospatial ecosystem. A key issue lies in the discrepancy between perceived data quality – how stakeholders understand or interpret the performance of the data, which is aligned with technical specifications – and actual data quality, which reflects objective performance when properly measured. The proposed data quality management (DQM) framework addresses this discrepancy by focusing on key aspects of spatial data quality, with an automated program playing a central role in bridging this divide. The framework enhances stakeholder communication and significantly improves the reliability of data governance by providing a comprehensive evaluation of data quality. This evaluation with the outputs combining error presentation through statistics, georeferenced files, and visualization enables rapid interpretation and error resolution. When applied to planned land use (PLU) data, this solution improved efficiency, enhanced overall data quality, and ensured seamless integration into the enterprise Spatial information system. This resulted in a higher level of maturity in data quality management.
Keywords:
quality assurance/quality control (QA/QC)
; continuous process improvement
; spatial data quality
; data steward
; data governance
; planned land use data
; perceived vs. actual data quality
; geospatial
; data quality management (DQM)
; uncertainty management
1. Introduction
Data quality is a complex and critical topic that requires a comprehensive understanding of the various issues associated with diverse data, supported by transparent communication. It encompasses various aspects, such as accuracy and consistency, while addressing challenges such as interoperability, harmonization, common geographies and metadata management to ensure data alignment with selected real-world phenomena. Attaining high-quality data requires interdisciplinary collaboration among data producers, data stewards, analysts, and end-users/customers to fulfill the requirements of decision-making processes and operational applications. For example, it is essential for spatial data quality to align with and support global sustainability initiatives, such as the United Nations’ Sustainable Development Goals (SDGs), as high-quality spatial data is crucial for spatial planning, environmental monitoring and sustainable resource management. The overcoming of these challenges requires not only technical expertise but also the development of a shared understanding of quality metrics and their practical implications across various stakeholders.
In the context of data quality, numerous critical issues are often overlooked or underestimated. The data quality, and consequently of resulting applications, is often inconsistent with users expectations [1], particularly when users lack a holistic understanding of metadata and data lineage, rely on it too much, or ignore it altogether (Figure 1). Furthermore, achieving a comprehensive understanding of the complexities of data quality presents a significant challenge due to the countless inherent uncertainties, biases and subjectivities that can propagate uncontrollably through data analytics processes. The lineage of data, along with its context and narrative, requires a comprehensive understanding that is often hidden by inaccessible documentation, dependent on the insights of data producers or lost amidst the dynamic nature of data quality driven by changing requirements and real-world conditions.
1.1. Overview of Advanced Spatial Data Quality Techniques
There is considerable evidence that the spatial data quality often falls short of expectations [3], due to factors such as siloed data, insufficient technical skills, and lack of transparency in data management workflows [4] [5]. The primary challenge with most data sources is not their inadequacy or the lack of available statistical methods, but the quality of the data itself. Automation is a promising way to address these challenges by improving efficiency and reducing human error in quality control processes [6]. Quality assurance and quality control (QA/QC) of spatial data are crucial for understanding and improving actual data thereby enhancing its reliability and usability.
Established methods for evaluating the spatial data quality are based on international standards, such as ISO 19157-1 (TC/211) – Geographic Information: Data Quality [7] [8] and the OGC guidelines [9], which provide systematic frameworks for assessing accuracy, completeness, consistency, etc. Comprehensive tools for GIS data quality management are available in commercial software [10], however, they are primarily not designed for seamless integration into fully automated, purpose-specific workflows. These approaches are well suited for structured environments, but may not fully leverage advances in technology and interdisciplinary methodologies [11], including AI and machine learning (ML) for automated anomaly detection [12]. Most of them rely on statistical models or trained personnel, such as data custodians, who ensure the integrity of spatial datasets. For example, positional accuracy is typically assessed by comparison with other, more relevant, usually authoritative data, while there are several possible alternatives where such evidence is not available.
Alternatives include mathematical, empirical, visual, a combination of these and other methods [13]. Mathematical methods such as spatial interpolation, statistical techniques, errors propagation through different types of spatial analysis [14], etc. help to quantify spatial data quality. Empirical approaches assess data quality through user centered metrics and performance testing [15]. Other options include mathematical and empirical methods for managing spatial data quality, such as uncertainty and unpredictability modeling through Monte Carlo simulations [14] (based on empirical data and simulations), and advanced probabilistic frameworks such as Bayesian networks and Markov random fields that represent spatial dependencies and predict errors in spatial attributes [16]. These techniques enhance the understanding of potential errors and their propagation [17]. Ontology-based frameworks provide structured methods for identifying inconsistencies [18].
Visual techniques, such as visual analytics provide exploratory tools for detecting patterns and anomalies, thereby improving the understanding of spatial errors and their distribution [19]. Similarly, digital twins offer a promising approach for real-time monitoring and iterative updating of spatial data quality, enabling dynamic and adaptive management [20]. While these methods may lack the robustness of traditional approaches when used in isolation, their intelligent and flexible combination can lead to superior results in spatial data quality management.
Collaborative methods, including gamification [21] as user centric approach, can engage users and foster collective data validation [22]. Gamification approaches have proven effective in improving crowdsourced spatial data quality, as demonstrated by projects such as OpenStreetMap [23].
AI-driven quality assurance leverages ML techniques, such as neural networks and decision trees, for predictive modeling to predict data quality issues, thereby improving proactive error detection and management [24]. Blockchain technology offers tamper-proof solutions for tracking changes, ensuring data integrity, and maintaining trust in spatial datasets, although considerations of scalability and computational overhead are essential for its effective implementation [25].
Techniques such as data conflation, fusion, merging and integration play a critical role in resolving spatial inconsistencies by combining multiple data sources to improve accuracy and completeness [26]. Dimensionality reduction methods, such as principal component analysis (PCA), t-distributed stochastic neighbor embedding (t-SNE), and automated feature engineering improve spatial data analysis by preserving critical information while minimizing noise and reducing computational complexity [27].
1.2. Problem to Be Solved
Different stakeholders – such as data producers, custodians, stewards, and users from diverse backgrounds – often have conflicting interpretations or priorities about what constitutes data quality, both in terms of the conceptual specifications and database implementation. A notable complexity of data quality issues lies in the communication challenges between data producers and data stewards responsible for managing data for input or ingestion into enterprise data platforms. These challenges often arise from biased interpretations of concepts implemented through technical rules or data quality standards. The standards cannot encompass all details or account for the diverse perspectives of different stakeholders, and their implementation heavily relies on expert knowledge.
This study addresses a critical knowledge gap by introducing a framework based on a comprehensive definition of spatial data quality, incorporating management and technical aspects, as well as the geospatial perspective. A key element of this definition is the distinction between perceived and actual data quality, which often diverge due to various factors. The framework based on the comprehensive definition of data quality emphasizes the understanding of the discrepancy between perceived and actual data quality, and aims to minimize it through transparent and iterative communication processes (Figure 2).
The individual methods discussed in the previous section may be less robust when used in isolation compared to well established procedures. However, an intelligent and flexible combination of these methods can deliver superior results. In addition, plugins, APIs or standalone programs facilitate seamless interaction between data producers and data stewards, minimizing manual oversight and fostering dynamic, efficient collaboration. By enabling automated data exchange and continuous feedback, these tools help to bridge perceived and actual data quality instantly, as demonstrated in this study.
2. Materials and Methods
The methods are built on the identified knowledge gap (Figure 2), which includes a comprehensive definition of spatial data quality followed by a solution to reduce the discrepancy between perceived and actual data quality. The data used is structured vector or raster spatial data, typically processed and analyzed using GIS software, which ultimately serves as the source for comprehensive enterprise databases or data warehouses. These systems form the backbone of spatial data infrastructures or integrated geospatial ecosystems, supporting a wide range of applications and services.
Quality is generally defined as a timeless concept, often described as being error-free and fit for its intended purpose. Many authors and organizations have proposed alternative definitions that reflect various perspectives such as business, customer, process, data, and spatial. The complexity of this concept is evident in definitions that highlight various aspects, including fitness for use [28], meeting expectations [29], fitness to the purpose of use, achieving a level of excellence, meeting specifications, the degree to which a set of inherent characteristics meet requirements [30] and a focus on specific types of metadata.
2.1. Straightforward Technical Definition of Spatial Data Quality
In the context of data, the quality can be simply defined as the extent to which data meets user requirements and is consistent with its intended purpose. This study particularly focuses on (geo)spatial data quality, which can be examined from various perspectives [7]. A universally accepted definition of (spatial) data quality does not exist. A common understanding of the principles of data quality is essential, as we define it as the degree to which a “dataset” accurately and appropriately represents the intended aspects of the “real world” within the defined “universe of discourse”. More precisely, the universe of discourse is considered as a view of the real or hypothetical world that includes everything of interest (Figure 3). For instance, consider a real world phenomenon such as a boundary marker. It is initially modeled through a conceptual schema that serves as a universe of discourse and includes all properties of interest from the real world, such as the concept of the vector point feature with specific attributes or other relevant representations, depending on the application. These properties are then implemented into a digital format, such as a dataset or database, and subsequently applied to address specific “users” needs.
The most uncertain aspect in the discussed concept is the interpretation of reality or real-world phenomena as a universe of discourse or a conceptual schema through abstraction. People can adopt any of various conceptualizations of geographic space, which may reflect the distinctions between perceptual and cognitive spaces or be influenced by different geometric properties, such as continuous or discrete representations [31]. In the proposed case, these conceptualizations also vary depending on the perspectives of experts from diverse fields, including geodesists, urban planners, and IT specialists.
2.2. Technical and Managerial Aspects of Data Quality
Technical aspects are fundamental when examining data quality as highlighted in the previous section. The managerial or organizational part of spatial data quality focuses on implementing standardized protocols to ensure consistency and reliability. These protocols are defined by international standards such as ISO 19157-1 for geographic information and the broader ISO 9000 family for quality systems management [30], including ISO 9001 for quality management systems. Furthermore, this approach aligns with the principles of Six Sigma, which emphasize total data quality management (TDQM) [32]. These practices are particularly valuable for addressing the unique complexities of spatial data quality management.
Effective spatial data quality management also requires the design and implementation of workflows that systematically handle data from collection to analysis. Well structured workflows ensure the consistent application of QA/QC processes, such as validation, transformation, and integration. Robust data governance practices complement these efforts by establishing policies and procedures that oversee data management throughout its lifecycle. Critical practices include maintaining accurate metadata, ensuring compliance with legal and ethical standards, and conducting regular audits to monitor and improve data quality.
It is commonly known that geospatial specialists and data scientists spend a significant portion of 80% or more of their time preparing data for analysis. This preparation typically includes time-consuming tasks such as data cleaning and validation. Alarmingly, studies suggest that nearly half of all newly created data records contain at least one critical error, and only a small percentage of organizational data meets basic quality standards [1]. Poor data quality can lead to significant long-term costs, highlighting the importance of robust management practices [33]. The highlighted topics present various issues that prevent the datasets from aligning with common quality expectations. These challenges highlight the urgent need for greater focus on data quality management, underscoring its pivotal role in ensuring the reliability and usability of analytical outcomes.
A shared focus on effective management and advanced technical solutions is crucial for ensuring that spatial data meets the demands of critical applications. These methodologies emphasize continuous improvement, operational efficiency, and error minimization, making them integral to spatial data quality management. In our case, it is essential to use tools that enhance the understanding of data quality requirements, thereby reducing the transmission of misunderstood draft data between the data producer and the data steward.
Achieving successful data quality management requires the harmonious integration of managerial and technical aspects. Managerial efforts establish policy standards and strategic frameworks to guide data processes, while technical solutions ensure the practical implementation of these policies, delivering reliable, high-quality data to support decision-making.
2.3. Geospatial Perspective of Data Quality
The geospatial perspective on data quality focuses on 2D or 3D spatial attributes, including more complex quality elements of accuracy and completeness, with particular attention to coordinate reference systems (CRS), topology, data structures, data formats, spatial relationships and other geospatial concepts. Specialized technical software, including GIS, remote sensing tools, and BIM based applications are important for managing and analyzing spatial data. The geospatial perspective also explores how spatial inaccuracies affect data quality, propagate through geospatial analysis, and introduces uncertainties that impact decision-making tied to location-based data.
Unlike non-spatial approaches, the geospatial approach requires a deep understanding of the spatial component of data, and consequently its associated quality. High-quality spatial data is critical for applications such as mapping, construction, spatial planning, navigation, and environmental monitoring, where spatial accuracy and other elements of data quality are essential to achieving reliable outcomes.
2.4. Understanding Perceived and Actual Data Quality
A further question is whether data producers and data stewards adequately and consistently understand how spatial data quality is defined, as well as the characteristics of the produced dataset. To address this question, we propose the concept of perceived and actual data quality (Figure 4, left).
Based on the data quality definition in Section 2.1, we assume an ideal scenario where perceived data quality aligns perfectly with the universe of discourse (conceptual schema, technical specifications) and thus satisfies all data quality requirements. Simply put, perceived data quality (light blue) reflects stakeholders’ understanding or interpretation of data performance as they believe it conforms to established standards. In contrast, actual data quality (light red) objectively reflects the performance of the data when measured [34]. It is often lower than perceived data quality due to stakeholder limited understanding of the universe of discourse schema and potentially incomplete or erroneous data in the dataset. This gap highlights an evident discrepancy between perceived and actual data quality.
In other words, the defined discrepancy highlights the difference between the expected quality of the data and a critical view of the data. When metadata is available, this distinction can be identified as the discrepancy between the quality described in the metadata and the quality observed by an expert, typically an experienced user or other stakeholder. This discrepancy is often overlooked or even deliberately ignored due to a lack of knowledge and understanding as illustrated in Figure 1 or even intentionally disregarded.
For instance, data quality can be assessed using standardized metrics such as accuracy, completeness, or timeliness. However, real world applications involving spatial analysis often reveal issues that standard QA/QC assessments overlook, such as system inconsistencies or hidden errors within large datasets. This knowledge gap poses a significant challenge to decision-making, particularly when stakeholders rely solely on perceived quality without identifying the underlying issues.
A less ideal scenario, based on the provided definition, is more common (Figure 4, right). In this case, we assume that a portion of the perceived data quality does not align with the universe of discourse (cross-hatched area). This indicates a detected discrepancy, where certain erroneous data is identified but remains uncorrected.
2.5. Reduce the Discrepancy Between Perceived and Actual Quality Utilizing a DQM Framework
By adopting a critical perspective, this research proposes a data quality management (DQM) framework designed to align actual spatial data quality with perceived quality while enhancing stakeholder understanding through optimized communication. Specifically, the framework emphasizes holistic communication between contractors responsible for data production (data producers) and data stewards responsible for quality governance and adherence to organizational standards. This focus ensures both improved data reliability and more effective collaboration among all stakeholders, such as users, producers, and stewards of spatial data.
Previously described straightforward definition is transitioning from real world phenomena, through the universe of discourse, to the database, and finally to the end users. The core implementation focus lies in the intermediate space between the universe of discourse and the database (Figure 5). Highlighted with a grey background, this area emphasizes the operationalization of the universe of discourse (conceptual schema) through technical rules, standards, or ontologies, which together form the backbone of the geospatial ecosystem represented by actual data or databases.
The definition of data quality is time-sensitive, evolving alongside changes in context and requirements. As such, the conceptual schema that represents the universe of discourse should align with the business, user, or customer perspective to ensure it remains fit for its intended purposes. Consequently, actual data must adapt to reflect these developments and maintain relevance.
The overall concept of perceived and actual spatial data quality is illustrated in Figure 6. We assume that overall data quality is measured (scored) based on the evaluation of the number of data quality elements specified in the conceptual schema. This schema provides a simplified view of data complexity, involving new features, attributes their interconnections, and new datasets.
Ideally, the perceived data quality simply aligns with the number of data elements defined in the conceptual schema, convincing the stakeholder that all data quality requirements are met. However, a significant discrepancy can exist between perceived and actual quality due to a limited understanding of the dataset quality. The conceptual schema evolves over time, driven by a deeper understanding of user requirements. As stakeholders refine their perception of data quality, actual data quality also improves. Consequently, the discrepancy between perceived and actual quality reduces over time.
To address improved understanding through communication and the alignment of actual with perceived spatial data quality, various practical solutions are available. These include training and education, data quality audits, advanced stakeholder collaboration, comprehensive metadata management, data quality dashboards, continuous feedback mechanisms, as well as automated program toolkits, which is the primary focus of this research.
2.6. Automated Progam Toolkit for Implementing the DQM Framework
The practical focus is on the automated program toolkit to implement the developed DQM framework. The solution emphasizes the implementation of holistic automated QA/QC procedures with the following key features designed to effectively address these challenges, improve operational efficiency, and optimize the user experience (UX):
- Design for consistent use by both the data producers and the data stewards who oversee its governance;
- A fully automated data evaluation program built on the QA/QC process and extended with additional capabilities;
- A standalone desktop program, independent of the internet and designed as a cross-platform communication interface that works independently and is not a plugin or API;
- The use of the program and results does not require the use of GIS or other geospatial tools;
- The design of the program to operate seamlessly on all major operating systems and is optimized for execution on any modern computer;
- No program installation and intuitive interfaces to minimize operating instructions;
- Ensures scalability of the program by enabling it to handle increasing amounts of data, computational tasks, and the integration of new databases without significant performance degradation;
- Ongoing adaptation of the program based on collective feedback from diverse stakeholders, particularly domain experts and end users, to optimize performance, address potential conflicts, and align with national and international strategies and plans;
- Minimum number required configuration parameters for processing;
- Highly efficient algorithms design to process data and deliver results within expected timeframes;
- Compliance of the implemented methods with the requirements of the technical rules for data production and international standards;
- Prioritizes end user’s needs, preferences, and workflows to improve usability;
- The robust program design anticipates and warns of unexpected errors without crashing;
- Comprehensive understanding of potential inaccuracies through a combination of descriptive statistics, georeferenced data files and error visualization.
3. Results
The developed methods were implemented using datasets managed by the Ministry of Natural Resources and Spatial Planning of Slovenia, accessible through the enterprise open data platform (geospatial ecosystem) known as the Spatial information system [35]. This system plays a critical role in governance and decision-making frameworks supported by e-commerce in public administration across multiple fields, including spatial planning and construction. It integrates spatial data with various information sources and documents, enabling users to analyze patterns, relationships, and trends within the context of physical space.
Names of datasets, attributes, configuration files, and related elements used in this section are detailed in Appendix A to facilitate the effective use of the provided program.
3.1. Data Used
The main source is authorized structured spatial data of the municipalities on the Planned land use (PLU) [36] in Slovenia. The PLU data refers to spatial data representing classifications of land based on its permitted use, management objectives, or restrictions as determined by zoning regulations, planning guidelines, or environmental policies. The PLU data is organized in vector format as polygons representing specific geographic areas with designated land use types, such as building, agriculture, forests, water bodies and other zones. In addition, the data related to the Land cadaster (LC) points outline five methods for determining the graphical representation of PLU polygons.
Standards based on ISO/TC 211 and OGC ensure compatibility across systems. The CRS used for spatial data is EPSG: 3794 (Slovenia 1996), which is used in a wide range of mapping and geospatial applications in the country. The system accepts input data in Esri shapefile and OGC GeoPackage formats.
The universe of discourse is realized through the Technical rules for the preparation of municipal spatial acts in digital form [37], which specifies the structure and attributes for the textual and graphical part. The PLU data must be interoperable both internally and externally and must be subordinate to the design of the Real estate cadaster (REC). In this respect, they are also connected to the dynamics of the LC points reflecting the temporal variation in cadastral geographical positions.
The quality of PLU data is highly dependent on the source and methods used for data acquisition, in our context cadastral surveys and field mapping. The errors can arise from several factors, including outdated maps or datasets, the skill level and accuracy of operators, digitization processes, misalignments with other spatial datasets and similar issues. These factors underscore the importance of rigorous quality control measures and continuous updates to ensure data accuracy and reliability. By understanding these characteristics, stakeholders can effectively analyze, manage, and apply PLU data to achieve planning, development, and environmental objectives.
3.2. Functional Design of the DQM Framework
The developed DQM framework enhances understanding through improved communication, bridging the discrepancy between actual and perceived spatial data quality. It operationalizes the universe of discourse through the application of technical rules [37].
Let’s assume that the stakeholder (data producer or data steward) does not initially use the DQM framework (first set of columns in Figure 7). Their understanding of the quality of the dataset/technical specifications is very limited, resulting in a significant discrepancy between perceived and actual data quality. Additionally, the stakeholder recognizes that it is impossible for them to eliminate all errors in the data (detected but uncorrected discrepancy), leaving a certain portion of inaccuracies in the dataset.
Over time, stakeholders adopt the DQM framework, which provides a comprehensive data evaluation toolkit that includes both mandatory and optional recommended outputs (second to last set of columns in Figure 7). The recommended component primarily informs data stewards and producers about upcoming standards that will be sustainably implemented to support the long-term evolution of data quality improvement. More specifically, the recommended outputs are not included in any present technical specifications, but they serve as a catalyst for developing and iteratively refining new versions of the technical specifications and consequently successive DQM framework versions. As a result, the discrepancy between perceived and actual data quality reduces over time, along with the magnitude of detected but uncorrected discrepancies.
3.3. Implementation of the DQM Framework in the NRPvalid Automated Program
The NRPvalid program provides an automated QA/QC evaluation with capabilities referred to DQM framework that effectively address all the characteristics outlined in the Methods section. It consists of two main parts. The first part is used for configuration input/output folders and parameter settings providing different thresholds, which are then used to generate a configuration file (Figure 8). The input files are PLU polygons and LC points.
The second, main part forms the core of the NRPvalid, built upon the DQM framework. The program executes data evaluation tools, starting with various evaluation focus areas and gradually increasing the complexity of quality measures in a logical, step-by-step progression. This repeatable process ensures a high degree of objectivity.
The program distinguishes between different error levels and responds accordingly. The highest level of error is “critical” which includes situations such as missing input files that prevent any further quality evaluation. In such cases, the program immediately terminates and sends a notification specifying the error type. The next error level is “major”. In this case, the program halts the evaluation for the current municipality, sends an appropriate notification, and then continues with minimal impact to the next municipality. The third error level is “moderate”. These errors are listed as aggregated results files and logfile. Finally, if an error cannot be identified but is related to a “major” or “critical” issue in the input data, the message “Unidentified error during program execution” is displayed and program halts.
The outputs of the evaluation include aggregated results highlighting potential testing errors, which appear in an aggregated results table, a descriptive table, a logfile, an overview map, and error layers where potential errors are marked (Figure 9). In the aggregated results table, the left column contains the description of the error along with its unique code. Key attributes compared include the expected number (M.B.) and the observed number (Ime-obcine). Values marked in red indicate potential errors that require further verification and data cleaning.
The predefined evaluation tools used to measure data quality, categorized by group codes 10, 20, …, are outlined in Table 1. In total, over 100 quality evaluation tools have been developed and implemented as a rules-based solution. These tools serve as data quality metrics, indicating potential errors and the overall dataset quality. Although automated data cleaning is not the focus of this study, the program provides experimental output. As described earlier, the evaluation results are divided into a mandatory and a recommended component, as well as that the program was designed to effectively address the required challenges including UX optimization.
As can be seen from Figure 9 and Table 1, the proposed approach incorporates techniques such as data quality summary scoring, descriptive aggregated quality scoring, comparison with trusted sources of higher quality than the tested dataset, relative comparisons between sources, pattern discovery, and more.
Strategy to error identification across outputs involves combination of the results. The primary output consists of various visuals and statistics, enabling the use of combined methods to effectively assess, assure and improve data quality. They require experienced data stewards and data producers for further semi-automated and manual data cleaning reviews to ensure objectivity. This experience includes geospatial literacy, which depends on people’s ability to “read” geospatial visualizations – a challenging issue that is not as straightforward as reading text.
Furthermore, several highly complex errors were identified, prompting the development of specialized procedures. These procedures integrate multiple tools and measures to ensure accurate detection and effective cleaning. All these outputs also serve as a powerful instrument to enhance understanding and communication helping to align actual data quality with perceived.
Figure 10 illustrates the workflow of the NRPvalid automated program. In this process, the data steward or data producer uses the program to examine the outputs and determine whether to accept the high-quality files for ingestion into the Spatial information system or to reject them. Rejected files typically undergo further, often manual, data cleaning using GIS or other specialized software.
4. Discussion
The outcome of this study is a significantly improved understanding of spatial data, achieved through improved communication between stakeholders, specifically data producers and data stewards. This advancement, reinforced by positive stakeholder feedback, is both impactful and encouraging. The DQM framework, implemented through an automated program bridges the discrepancy between perceived data quality based on technical rules, and the actual data quality. While the discrepancy between perceived and actual data quality had been previously suspected, this study provides solid evidence to substantiate its existence.
Considering prior research, numerous studies demonstrate that spatial data quality is a far more critical issue than often acknowledged [1]. For example, the propagation of errors through spatial analysis [14] [38] is more complex than the average data user might anticipate. Furthermore, a significant portion of scientific studies fail due to the neglect of inaccurate measurements as a primary source of error in spatial data processing [39], the misuse of AI to generate inappropriate synthetic data [40], or the failure to apply semantic layer principles to translate data into a standardized language within a customer context [41]. These previous findings were carefully considered in the development of this study, which focuses on specific aspects of enhancing geospatial literacy and, consequently, improving communication, collaboration and partnership, consistency, and data quality.
As outlined in this study, over 100 tools have been developed as part of comprehensive toolkit and implemented as rule-based solutions within the DQM framework, integrated into the NRPvalid automated program. The tools follow a combination of mathematical, empirical, and visual approaches, where many of them were specifically designed for this study. There is significant potential for further automation of quality evaluation, particularly in developing methods to detect complex contextual and semantic errors. These methods would consider the previous state of the data and adhere to legal constraints, such as those prohibiting changes to the PLU. From a technical perspective, future developments are going to focus on regression and cluster analysis, significance testing or simulations, area and shape analysis, as well as the application of predictive models using selected indicators, ML, AI techniques, and generalization techniques. Additionally, more sophisticated tools for visualization of complex datasets are planned for implementation [19] to enhance the synergy of combining different approaches.
In the developed case, the target enterprise Spatial information system ingests data and performs basic data checks using the Build-then-Test method [42]. However, these and similar enterprise systems lack flexibility and effectiveness compared to the proposed solution, which employs an independent automated program approach based on the Test-then-Build method. The implemented solution not only offers enhanced adaptability and accuracy but is also significantly easier to develop and is exempt from safety requirements imposed on enterprise systems.
In a broader context, a toolkit within the geospatial ecosystem – such as the target governmental Spatial information system – should aim to provide simple, predefined analytical functions that leverage its comprehensive datasets. For example, this toolkit could perform spatial intersections between selected parcels and other datasets, including external sources like DEMs. Utilizing well-established data quality properties, the system could incorporate transparent optimization and harmonization processes such as semantic data generalization, aggregation, or resampling, while also providing key parameters about the quality of the output data. Enhanced with appropriate data quality visualizations, this approach would enable a “quality-in, quality-out” workflow, ensuring reliable and meaningful results.
When high quality data is utilized, decision making becomes more accurate and reliable. Users develop greater confidence in the data, allowing them to concentrate on the analysis rather than questioning its validity. This leads smother exchange and integration with other quality datasets, further increasing the value of the data or its ecosystem. Additionally, high-quality data is more easily reusable for diverse purposes. Although ensuring data quality requires a significant initial investment in effort and resources, the long-term benefits often far exceed these costs.
Trust in data is hard to earn but easy to lose. Continuous improvement concerns greater emphasis on quality assurance (QA) over quality control (QC) and prioritizing automated tools and services over extensive human resources. This philosophy is already integrated into the proposed program. The inclusive framework describes enhanced communication among stakeholders and fostering significantly higher confidence in decision-making processes.
Understanding and incorporating metadata including data lineage, as discussed earlier in this article, is a critical aspect planned for future implementation in the program. This information plays a vital role in dataset governance, providing essential insights that support informed decision-making and enhance the overall reliability of the data.
5. Conclusions
The developed framework effectively bridges the discrepancy between perceived and actual data quality by addressing key aspects such as the comprehensive data quality definition, management though enhanced communication, and technical considerations of spatial data quality from a geospatial perspective. Perceived spatial data quality, in contrast to actual quality, were implemented into the data quality management (DQM) framework and this to the NRPvalid automated program, playing a crucial role in aligning the actual data quality with perceived, thereby significantly enhancing the reliability of spatial data governance. The results prove that bridging the discrepancy between perceived and actual data quality is a challenging task. However, our solution demonstrates significant progress with an estimated actual/perceived quality rate of approximately 90%.
The automated solution ensures continuous evaluation of the data from the beginning, making it more accessible and usable to a broader audience. Once the data meets the required technical specifications and quality standards, it is seamlessly integrated into the geospatial ecosystem, specifically the enterprise Spatial information system in this case.
The standalone desktop program significantly improves communication among stakeholders, addressing a common issue where data providers faced repeated rejections from data stewards and the Spatial information system, creating unnecessary burdens. Now, with improved data quality, a single interaction is typically sufficient, leading to exceptional cost-benefit outcomes. The program empowers data stewards to establish best practices for data evaluation and management, fostering a stronger organizational culture and encouraging greater responsiveness from local government data producers.
Additionally, the solution accelerates the adoption of a participatory governance model, enabling data producers to actively contribute to data quality improvements. This collaborative approach ensures that evaluation procedures align with stakeholder needs, particularly end users, while promoting transparency, accountability, and overall quality management. Enhanced interactions further improve geospatial literacy, support the continuous refinement of technical specifications, and strengthen the effectiveness of the DQM framework. These advancements have been validated through positive feedback from diverse stakeholders.
Looking ahead, the future of holistic automated geospatial data quality evaluation lies in the synergy of diverse methodologies, blending traditional approaches with innovative techniques. While maintaining a standalone program, it will evolve to incorporate and address various ideas for specific problems, allowing continuous learning and education from diverse data perspectives. This approach aims to deliver more accurate, reliable, and timely spatial data, meeting the needs of a broad range of users.
Funding
This research was funded by the Green Slovenian Location Framework (GreenSLO4D) for 2021–2026, under the Recovery and Resilience Plan, founded by the European Union through NextGenerationEU.
Data Availability Statement
A data package is freely available on request of the author and includes an automated program NRPvalid, based on the data quality management (DQM) framework, version 1.0.13, 64-bit Windows, licensed under CC-BY-NC-ND 4.0. The package also contains operating instructions (in Slovenian) and testing data.
Acknowledgments
The author would like to express his sincere gratitude to Jurij Mlinar and his team for their invaluable support, as well as to the data providers for their essential contributions and feedback throughout the development of the product and this study.
Conflicts of Interest
The author declares no conflicts of interest.
Abbreviations
The following abbreviations are used in this manuscript:
| AI | Artificial intelligence |
| API | Application programming interface |
| BIM | Building information modeling |
| CRS | Coordinate reference system |
| DEM | Digital elevation model |
| DQM | Data quality management |
| GIS | Geographic information system |
| ISO | International organization for standardization |
| LC | Land cadaster |
| ML | Machine learning |
| OGC | Open Geospatial Consortium |
| PCA | Principal component analysis |
| PLU | Planned land use |
| QA/QC | Quality assurance/quality control |
| REC | Real estate cadaster |
| SDI | Spatial data infrastructure |
| TDQM | Total data quality management |
| t-SNE | t-distributed stochastic neighbor embedding |
| UML | Unified modeling language |
| UTF-8 | Unicode transformation format (8-bit) |
| UX | User experience |
Appendix A
The simplified expressions of datasets, attributes, configuration files, and other elements used in the DQM framework, developed in Python programming language, correspond to the descriptions utilized in the NRPvalid automated program, as described in the Results section (Table A1).

Table A1.
Simplifications used in this article and corresponding codes used in the program.
| Simplified expression | Description |
|---|---|
| Planned land use (PLU) polygons | eup_nrp_pos data |
| Land cadaster (LC) points | tgd data with attributes TGD_VRSTA = 1 |
| Real estate cadaster (REC) points | tgd data with attribute NRP_ID = 3000 to 3999 |
| Planned land use (PLU) attribute | eup_nrp_pos data with attributes NRP_ID (land use types of group codes: 1000, 2000, 3000, 4000, 5000) |
| Land cadaster (LC) attribute | tgd data with attributes TGD_VRSTA = 1 |
| configuration file | *.INI file (NRP.ini, NRP_sablona.ini and others) |
| NRPvalid configuration | NRPvalid_start.exe file |
| NRPvalid core | NRPvalid.exe file |
References
- Nagle, T.; Redman, T.C.; Sammon, D. Only 3% of Companies’ Data Meets Basic Quality Standards. September 11, 2017.
- Deming, W.E. Elementary Principles of the Statistical Control of Quality: A Series of Lectures; Nippon Kagaku Gijutsu Remmei, 1950.
- Fujimaki, R. Most Data Science Projects Fail, But Yours Doesn’t Have To Available online: https://www.bigdatawire.com/2020/10/01/most-data-science-projects-fail-but-yours-doesnt-have-to/ (accessed on Dec 7, 2024).
- Devillers, R.; Jeansoulin, R.; Goodchild, M.F. Fundamentals of spatial data quality; ISTE London, 2006.
- Goodchild, M.F.; Li, L. Assuring the quality of volunteered geographic information. Spat. Stat. 2012, 1, 110–120. [Google Scholar] [CrossRef]
- M. A. Xavier, E.; Ariza-López, F.J.; Ureña-Cámara, M.A. Automatic evaluation of geospatial data quality using web services. Rev. Cartográfica 2019, 59–73. [CrossRef]
- ISO 19157-1:2023(en), Geographic information — Data quality — Part 1: General requirements Available online: https://www.iso.org/obp/ui/en/#iso:std:iso:19157:-1:ed-1:v1:en (accessed on Nov 19, 2024).
- Parslow, P.; Jamieson, A. GIM International. June 24, 2024.
- OGC Available online: https://www.ogc.org/ (accessed on Dec 7, 2024).
- GIS Data Quality Management & Validation | ArcGIS Data Reviewer Available online: https://www.esri.com/en-us/arcgis/products/arcgis-data-reviewer/overview (accessed on Dec 15, 2024).
- Follin, J.-M.; Girres, J.-F.; Olteanu Raimond, A.-M.; Sheeren, D. The Origins of Imperfection in Geographic Data. In; 2019; pp. 25–44 ISBN 978-1-78630-297-7. [CrossRef]
- Nassif, A.B.; Talib, M.A.; Nasir, Q.; Dakalbab, F.M. Machine Learning for Anomaly Detection: A Systematic Review. IEEE Access 2021, 9, 78658–78700. [Google Scholar] [CrossRef]
- Chen, D. Reviewing Methods for Controlling Spatial Data Quality from Multiple Perspectives. Geosci. Remote Sens. 2022, 5, 22–27. [Google Scholar]
- Gerard B. M. Heuvelink Error Propagation in Environmental Modelling With GIS; 1st ed.; CRC Press, 1998.
- Devillers, R.; Bédard, Y.; Jeansoulin, R. Multidimensional Management of Geospatial Data Quality Information for its Dynamic Use Within GIS. Photogramm. Eng. Remote Sens. 2005, 71, 205–215. [Google Scholar] [CrossRef]
- Kersting, K.; De Raedt, L. Basic Principles of Learning Bayesian Logic Programs. In Probabilistic Inductive Logic Programming: Theory and Applications; De Raedt, L., Frasconi, P., Kersting, K., Muggleton, S., Eds.; Lecture Notes in Computer Science; Springer: Berlin, Heidelberg, 2008; pp. 189–221 ISBN 978-3-540-78652-8.
- Fotheringham, S.A.; Rogerson, P.A. The SAGE Handbook of Spatial Analysis; 1st ed.; SAGE Publications, Ltd., 2009; ISBN 978-0-85702-013-0.
- Yılmaz, C.; Cömert, Ç.; Yıldırım, D. Ontology-Based Spatial Data Quality Assessment Framework. Appl. Sci. 2024, 14, 10045–10.3390. [Google Scholar] [CrossRef]
- Podobnikar, T. Methods for visual quality assessment of a digital terrain model. SAPIENS Surv. Perspect. Integrating Environ. Soc. 2009, 2. [Google Scholar]
- Grieves, M.; Vickers, J. Digital Twin: Mitigating Unpredictable, Undesirable Emergent Behavior in Complex Systems. In Transdisciplinary Perspectives on Complex Systems: New Findings and Approaches; Kahlen, F.-J., Flumerfelt, S., Alves, A., Eds.; Springer International Publishing: Cham, 2017; pp. 85–113 ISBN 978-3-319-38756-7. [CrossRef]
- Yanenko, O.; Schlieder, C. Game Principles for Enhancing the Quality of User-generated Data Collections.; Castellón, 2014.
- Crowdsourcing Geographic Knowledge: Volunteered Geographic Information (VGI) in Theory and Practice; Sui, D., Elwood, S., Goodchild, M., Eds.; Springer Netherlands: Dordrecht, 2013; ISBN 978-94-007-4586-5. 10.1007/978-94-007-4587-2.
- Mooney, P.; Corcoran, P. The Annotation Process in OpenStreetMap. Trans. GIS 2012, 16, 561–579. [Google Scholar] [CrossRef]
- Ataman, A. Data Quality in AI: Challenges, Importance & Best Practices Available online: https://research.aimultiple.com/data-quality-ai/ (accessed on Dec 8, 2024).
- Chafiq, T.; Azmi, R.; Fadil, A.; Mohammed, O. Investigating the potential of blockchain technology for geospatial data sharing: Opportunities, challenges, and solutions. Geomatica 2024, 76, 100026–10.1016. [Google Scholar] [CrossRef]
- Podobnikar, T. Production of integrated digital terrain model from multiple datasets of different quality. Int. J. Geogr. Inf. Sci. 2005, 19, 69–89. [Google Scholar] [CrossRef]
- Vaddi, R.; Phaneendra Kumar, B.L.N.; Manoharan, P.; Agilandeeswari, L.; Sangeetha, V. Strategies for dimensionality reduction in hyperspectral remote sensing: A comprehensive overview. Egypt. J. Remote Sens. Space Sci. 2024, 27, 82–92. [Google Scholar] [CrossRef]
- Devillers, R.; Stein, A.; Bédard, Y.; Chrisman, N.; Fisher, P.; Shi, W. Thirty Years of Research on Spatial Data Quality: Achievements, Failures, and Opportunities. T GIS 2010, 14, 387–400. [Google Scholar] [CrossRef]
- Hayes, G.E.; Romig, H.G. Modern Quality Control; Bruce, 1977; ISBN 978-0-02-802910-8.
- ISO - ISO 9000 family — Quality management Available online: https://www.iso.org/standards/popular/iso-9000-family (accessed on Dec 8, 2024).
- Egenhofer, M.J.; Mark, D.M. Naive Geography. In Proceedings of the Spatial Information Theory: A Theoretical Basis for GIS; Frank, A.U., Kuhn, W., Eds.; Springer: Berlin, Heidelberg, 1995; pp. 1–15. [CrossRef]
- Ehrlinger, L.; Wöß, W. A Survey of Data Quality Measurement and Monitoring Tools. Front. Big Data 2022, 5. [Google Scholar] [CrossRef] [PubMed]
- Sakpal, M. 12 Actions to Improve Your Data Quality Available online: https://www.gartner.com/smarterwithgartner/how-to-improve-your-data-quality (accessed on Dec 16, 2024).
- R. Nolasco, H.; Vargo, A.; Komatsu, Y.; Iwata, M.; Kise, K. Perception Versus Reality: How User Self-reflections Compare to Actual Data. In Proceedings of the Human-Computer Interaction – INTERACT 2023; Abdelnour Nocera, J., Kristín Lárusdóttir, M., Petrie, H., Piccinno, A., Winckler, M., Eds.; Springer Nature Switzerland: Cham, 2023; pp. 665–674. [CrossRef]
- Spatial information system Available online: https://pis.eprostor.gov.si/en/pis/predstavitev-sistema.html?changeLang=true (accessed on Sep 20, 2024).
- INSPIRE Data Specification on Land Use – Technical Guidelines - European Commission Available online: https://knowledge-base.inspire.ec.europa.eu/publications/inspire-data-specification-land-use-technical-guidelines_en (accessed on Dec 24, 2024).
- Technical rules for the preparation of municipal spatial acts in digital form (Tehnična pravila za pripravo občinskih prostorskih izvedbenih aktov v digitalni obliki) 2024.
- Selmy, S.A.H.; Kucher, D.E.; Yang, Y.; García-Navarro, F.J.; Selmy, S.A.H.; Kucher, D.E.; Yang, Y.; García-Navarro, F.J. Geospatial Data: Acquisition, Applications, and Challenges; IntechOpen, 2024; ISBN 978-1-83769-828-8. [CrossRef]
- Data quality: implications for spatial data analysis. In Spatial Data Analysis: Theory and Practice; Haining, R., Ed.; Cambridge University Press: Cambridge, 2003; pp. 116–178 ISBN 978-0-521-77437-6. [CrossRef]
- Romano, A. Synthetic geospatial data and fake geography: A case study on the implications of AI-derived data in a data-intensive society. Digit. Geogr. Soc. 2025, 8, 100108–10.1016. [Google Scholar] [CrossRef]
- Southekal, P. Data for Business Performance: The Goal-Question-Metric (GQM) Model to Transform Business Data into an Enterprise Asset; First Edition.; Technics Publications: Basking Ridge, NJ, 2017; ISBN 978-1-63462-184-7.
- Parry-Jones, C. Data Quality Doesn’t Need to Be Complicated Available online: https://towardsdatascience.com/stop-overcomplicating-data-quality-4569fc6d35a4 (accessed on Dec 16, 2024).
Figure 1.
An example of unexpected inconsistencies occurs from an expert operator digitizing the same data source twice, approximately a week apart. The data sources include the Josephine 1st Military Topographic Survey from the 18th century at a scale of 1:28,800 (above) and a topographic map from the early 20th century at a scale of 1:25,000 (below). The results reveal significant differences in the identification of object boundaries and the assignment of their attributes, highlighting the bias and subjectivity inherent in interpreting data. This can be verified through inspection or statistical process control [2]; however, it is crucial to approach the data with a certain skepticism before making any decisions.
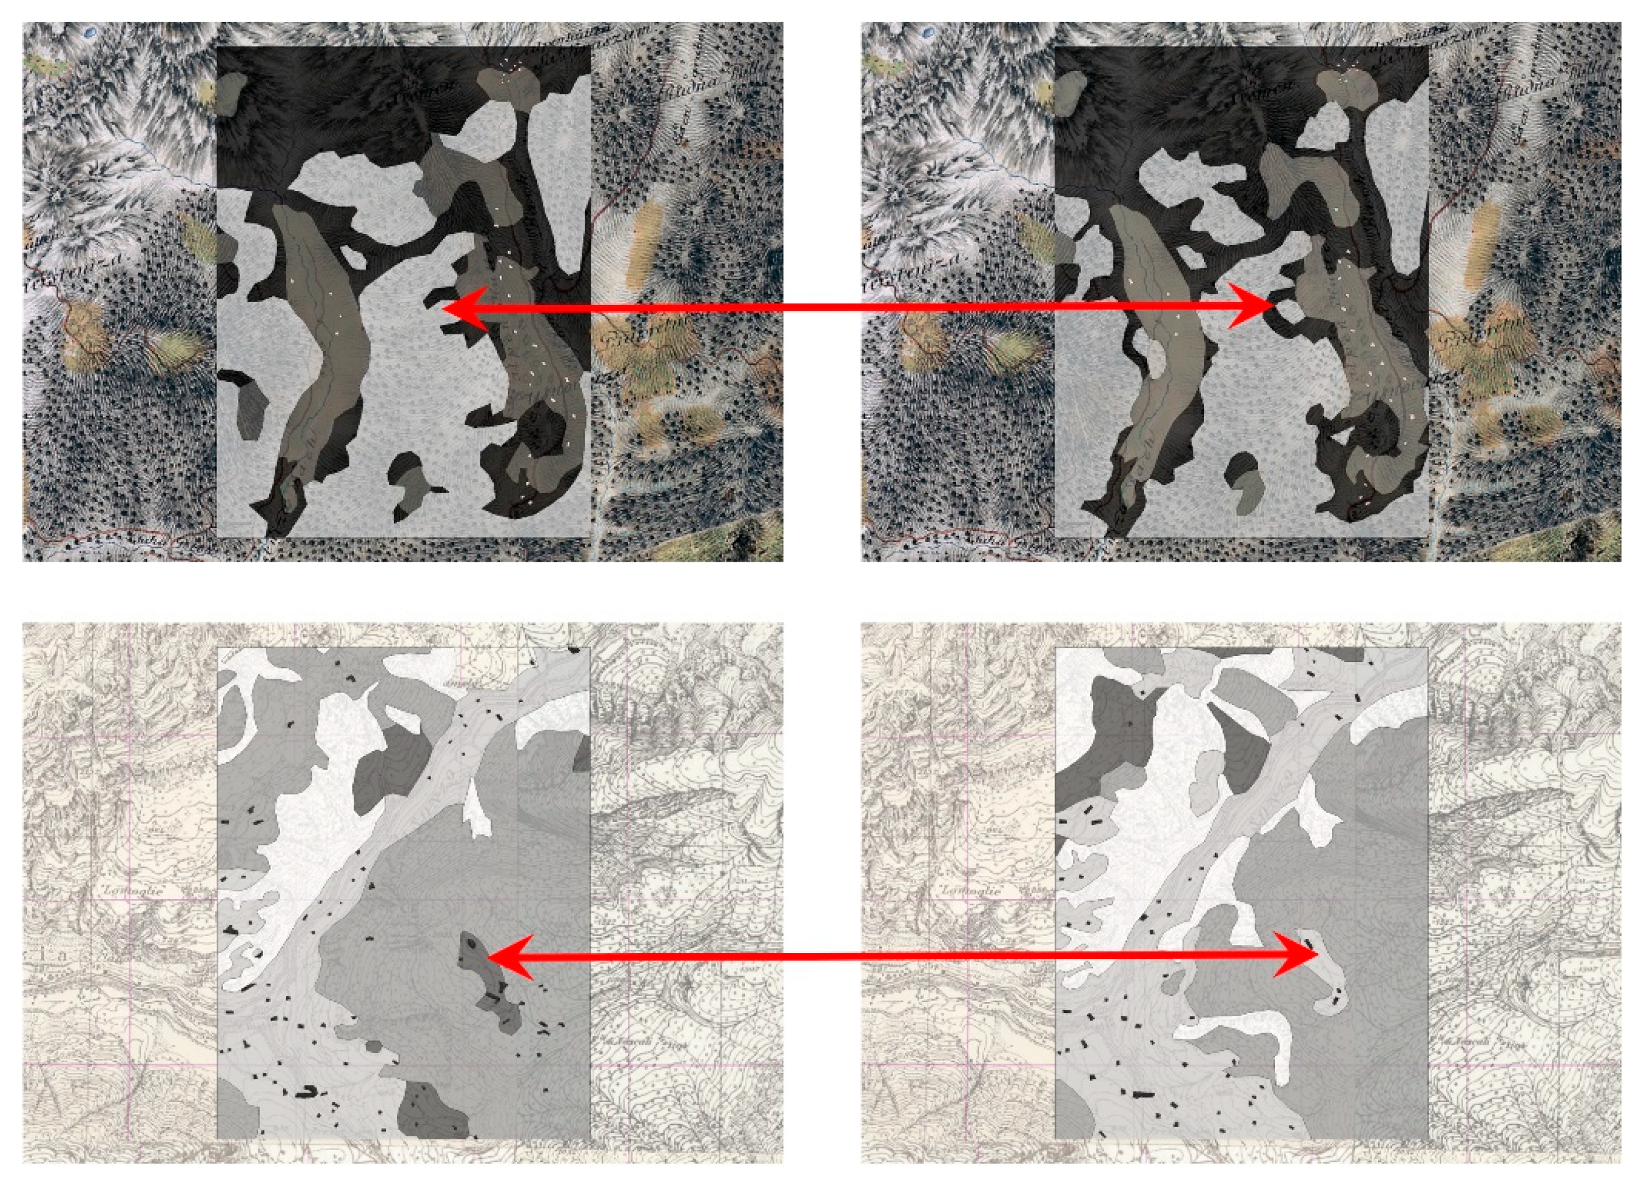
Figure 2.
Interrelated concepts for addressing the identified knowledge gaps.
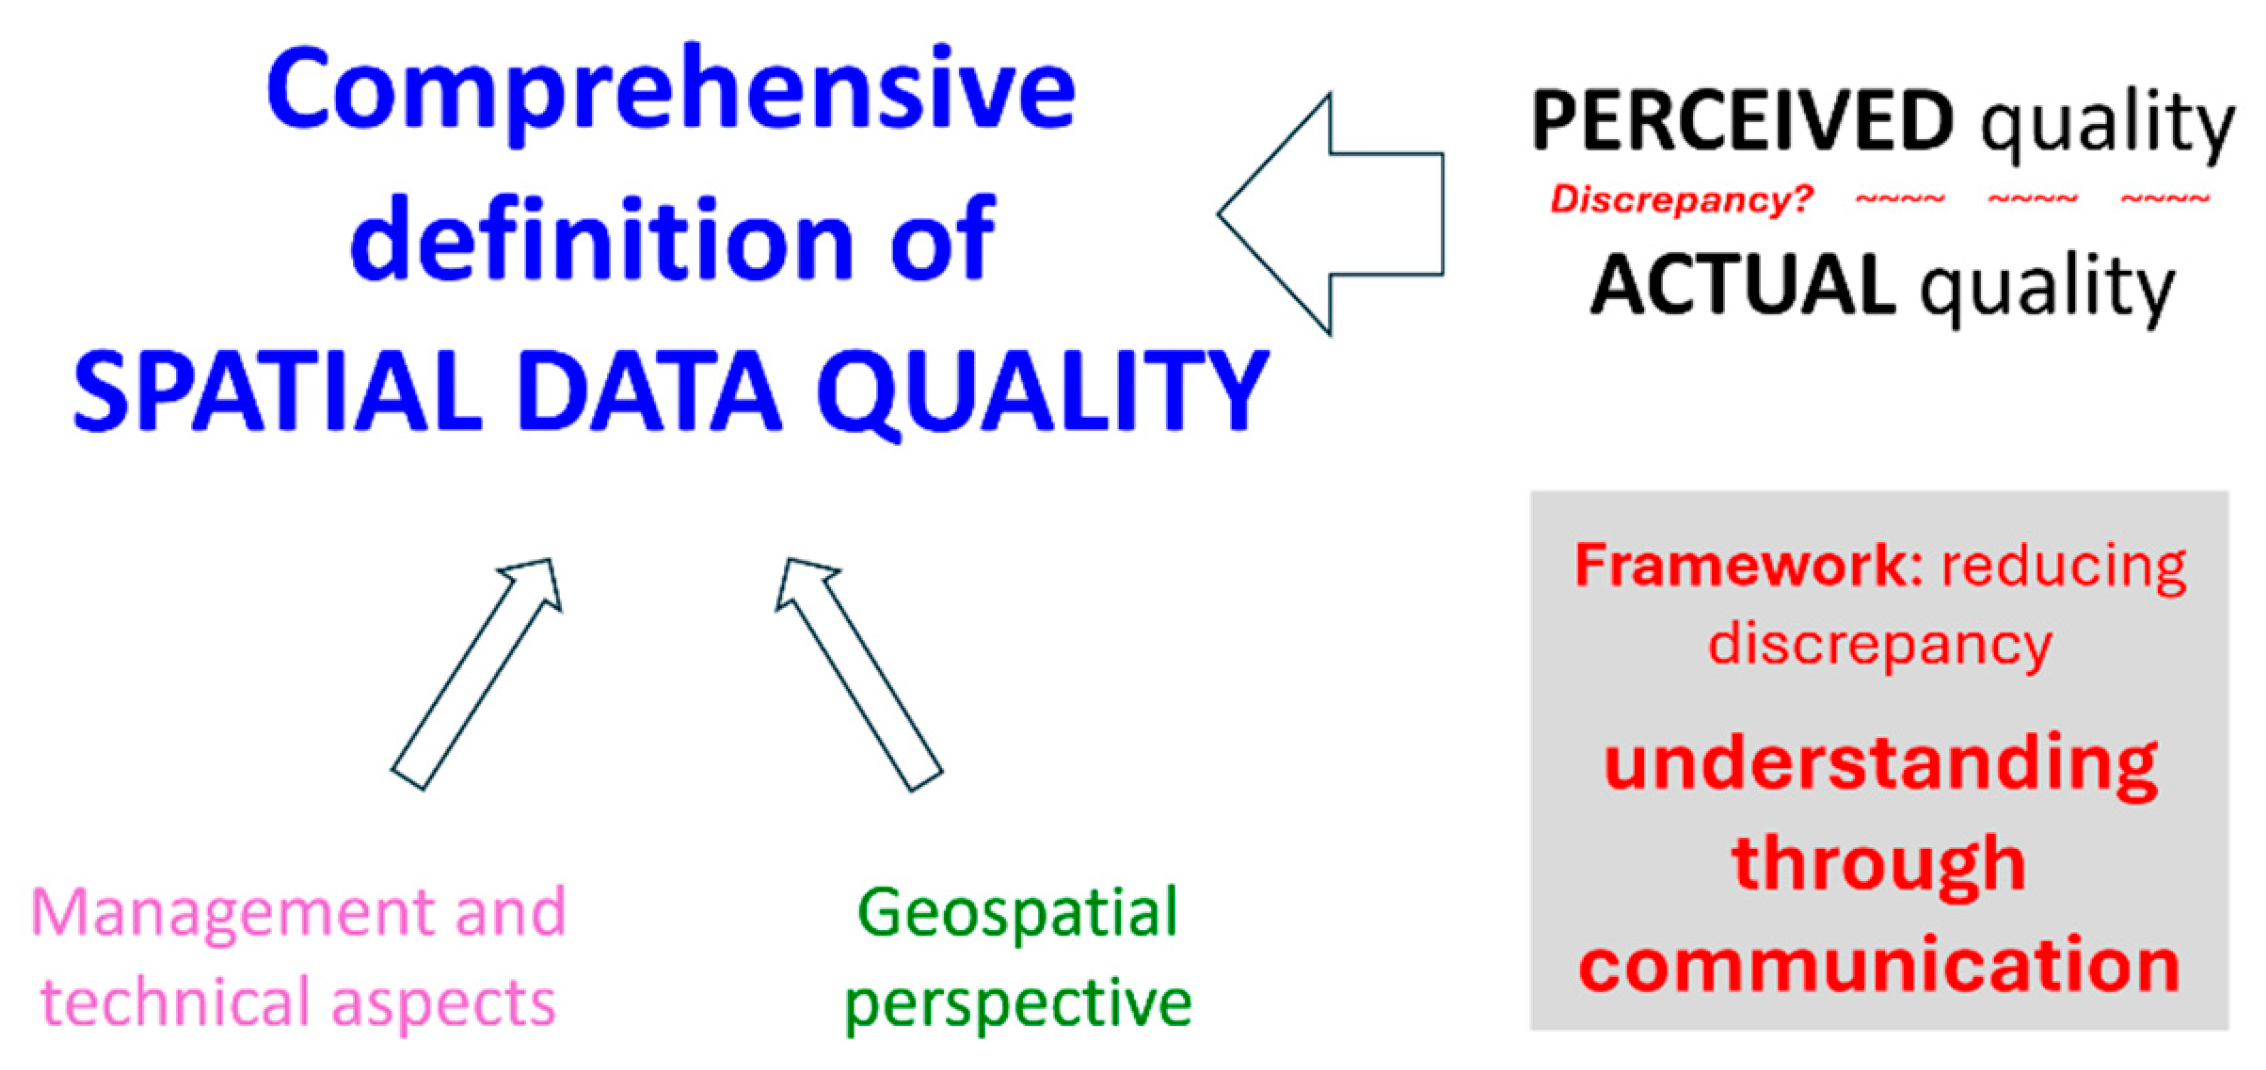
Figure 3.
From the real world, through the universe of discourse and dataset, to the users, with a focus on spatial data quality definition.
Figure 3.
From the real world, through the universe of discourse and dataset, to the users, with a focus on spatial data quality definition.
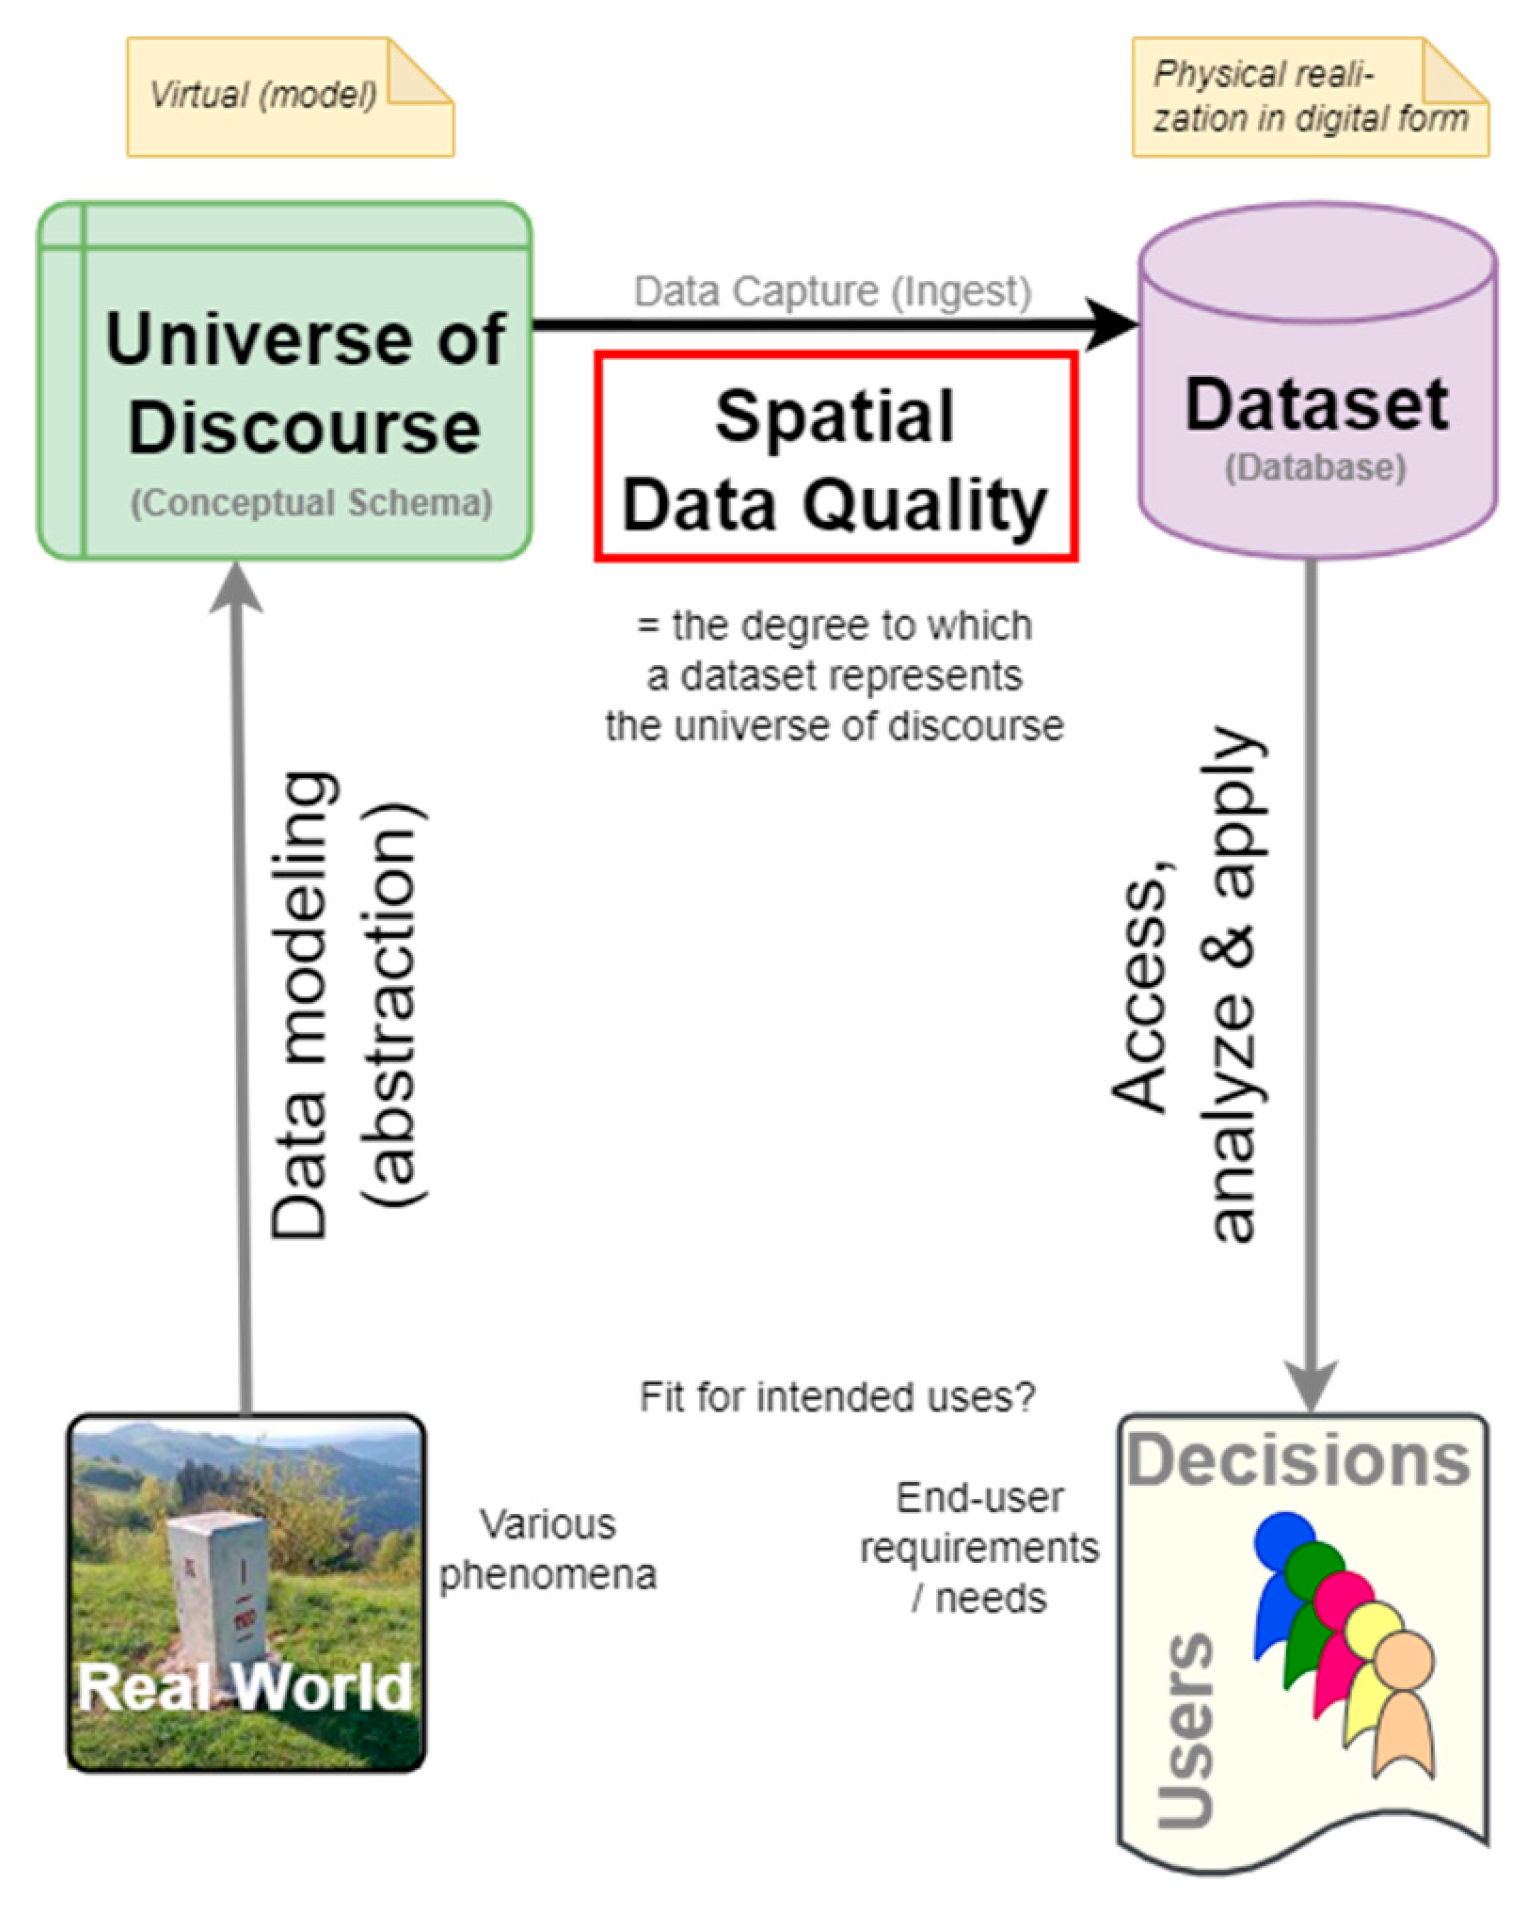
Figure 4.
Perceived data quality (light blue) and actual data quality (light red) are depicted. Unlike the left illustration, where the entire discrepancy goes undetected by stakeholders, the right scenario highlights a portion of the discrepancy that is detected but remains uncorrected (cross-hatched area).
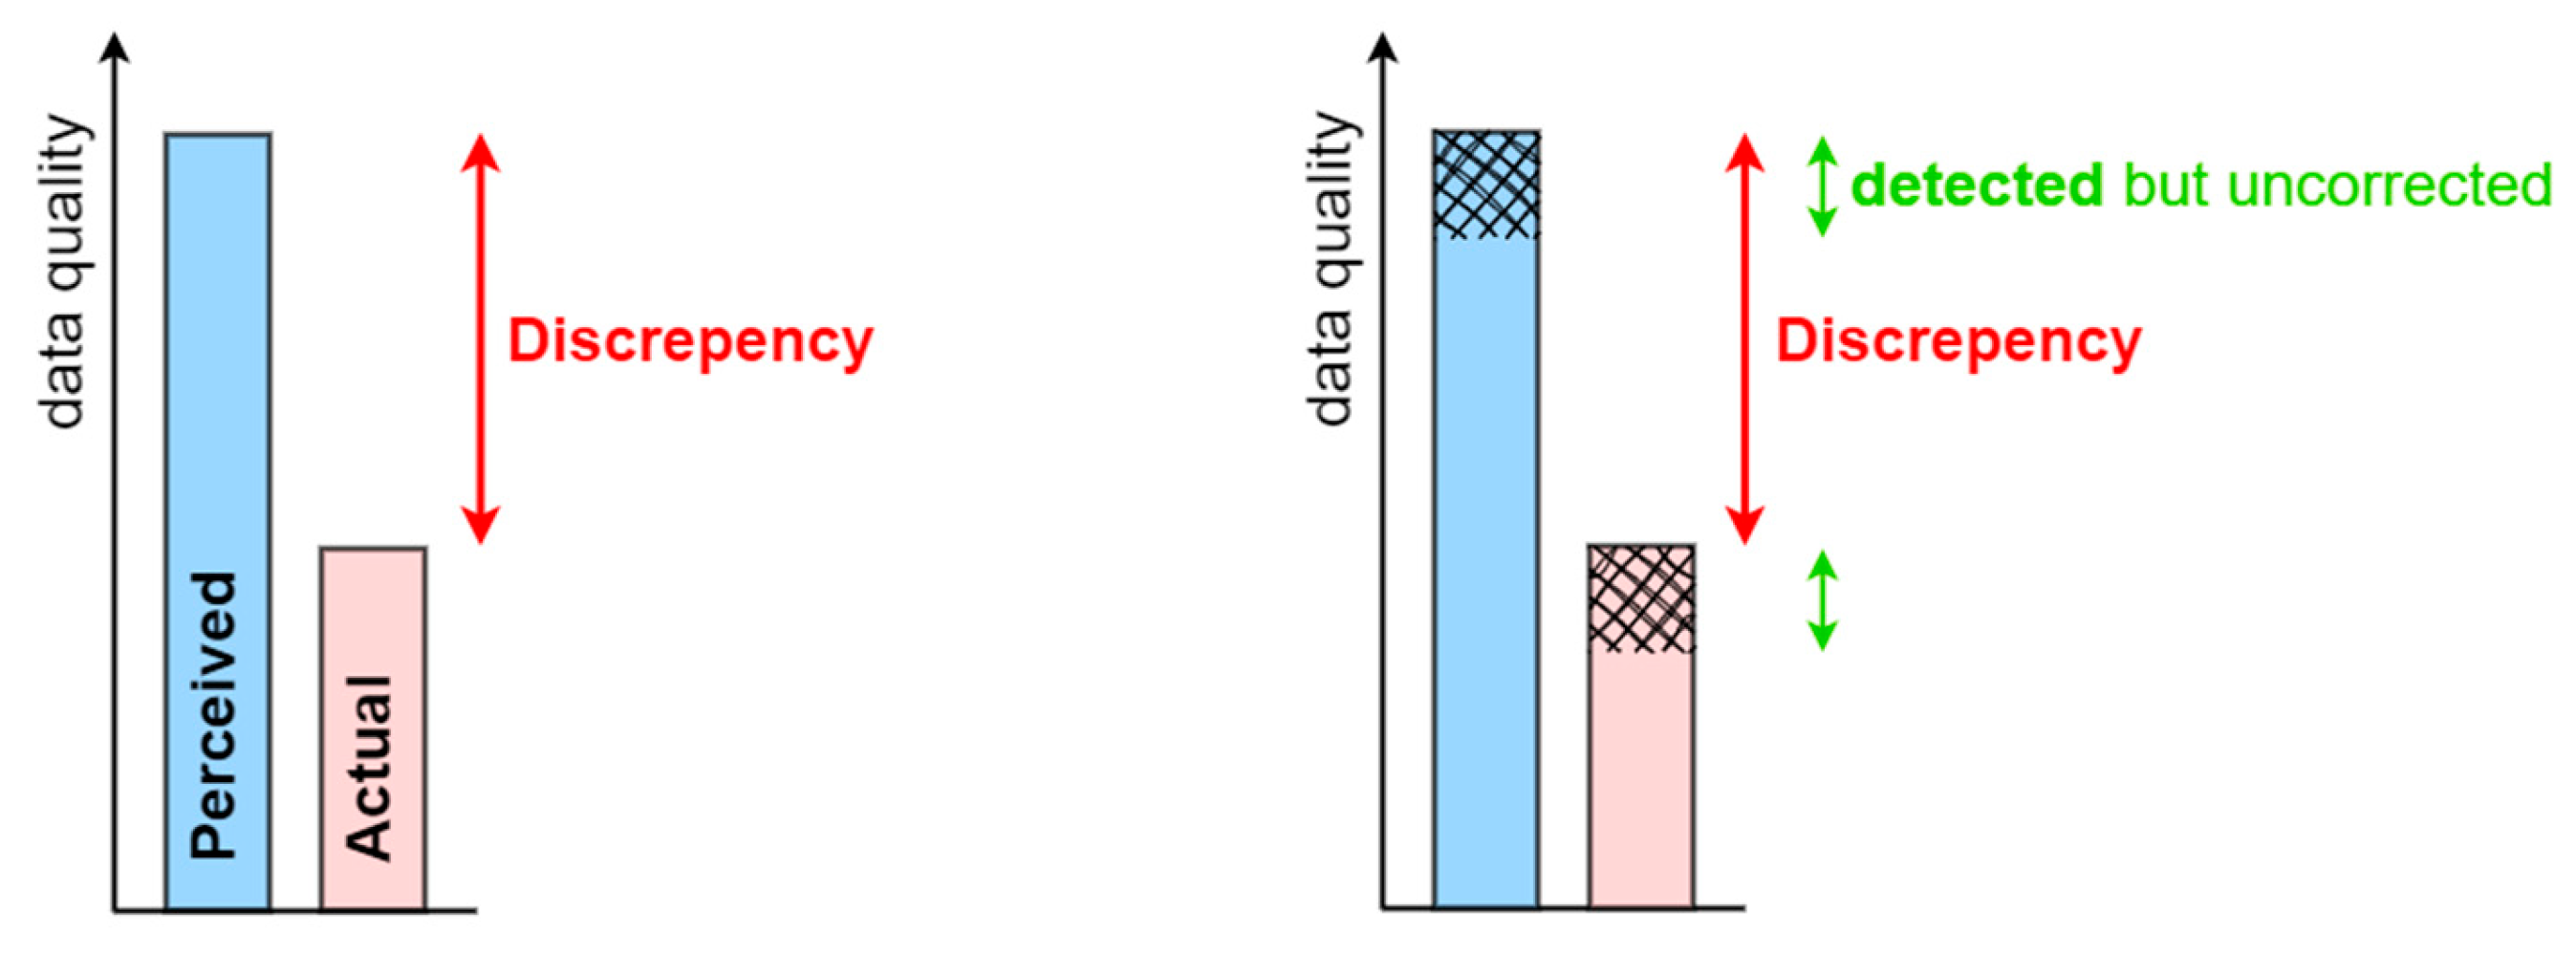
Figure 5.
From the real world, through the universe of discourse and dataset, to the users, with a focus on the developed DQM framework.
Figure 5.
From the real world, through the universe of discourse and dataset, to the users, with a focus on the developed DQM framework.

Figure 6.
Changes in perceived (light blue) and actual (light red) spatial data quality, along with discrepancies, over time.
Figure 6.
Changes in perceived (light blue) and actual (light red) spatial data quality, along with discrepancies, over time.
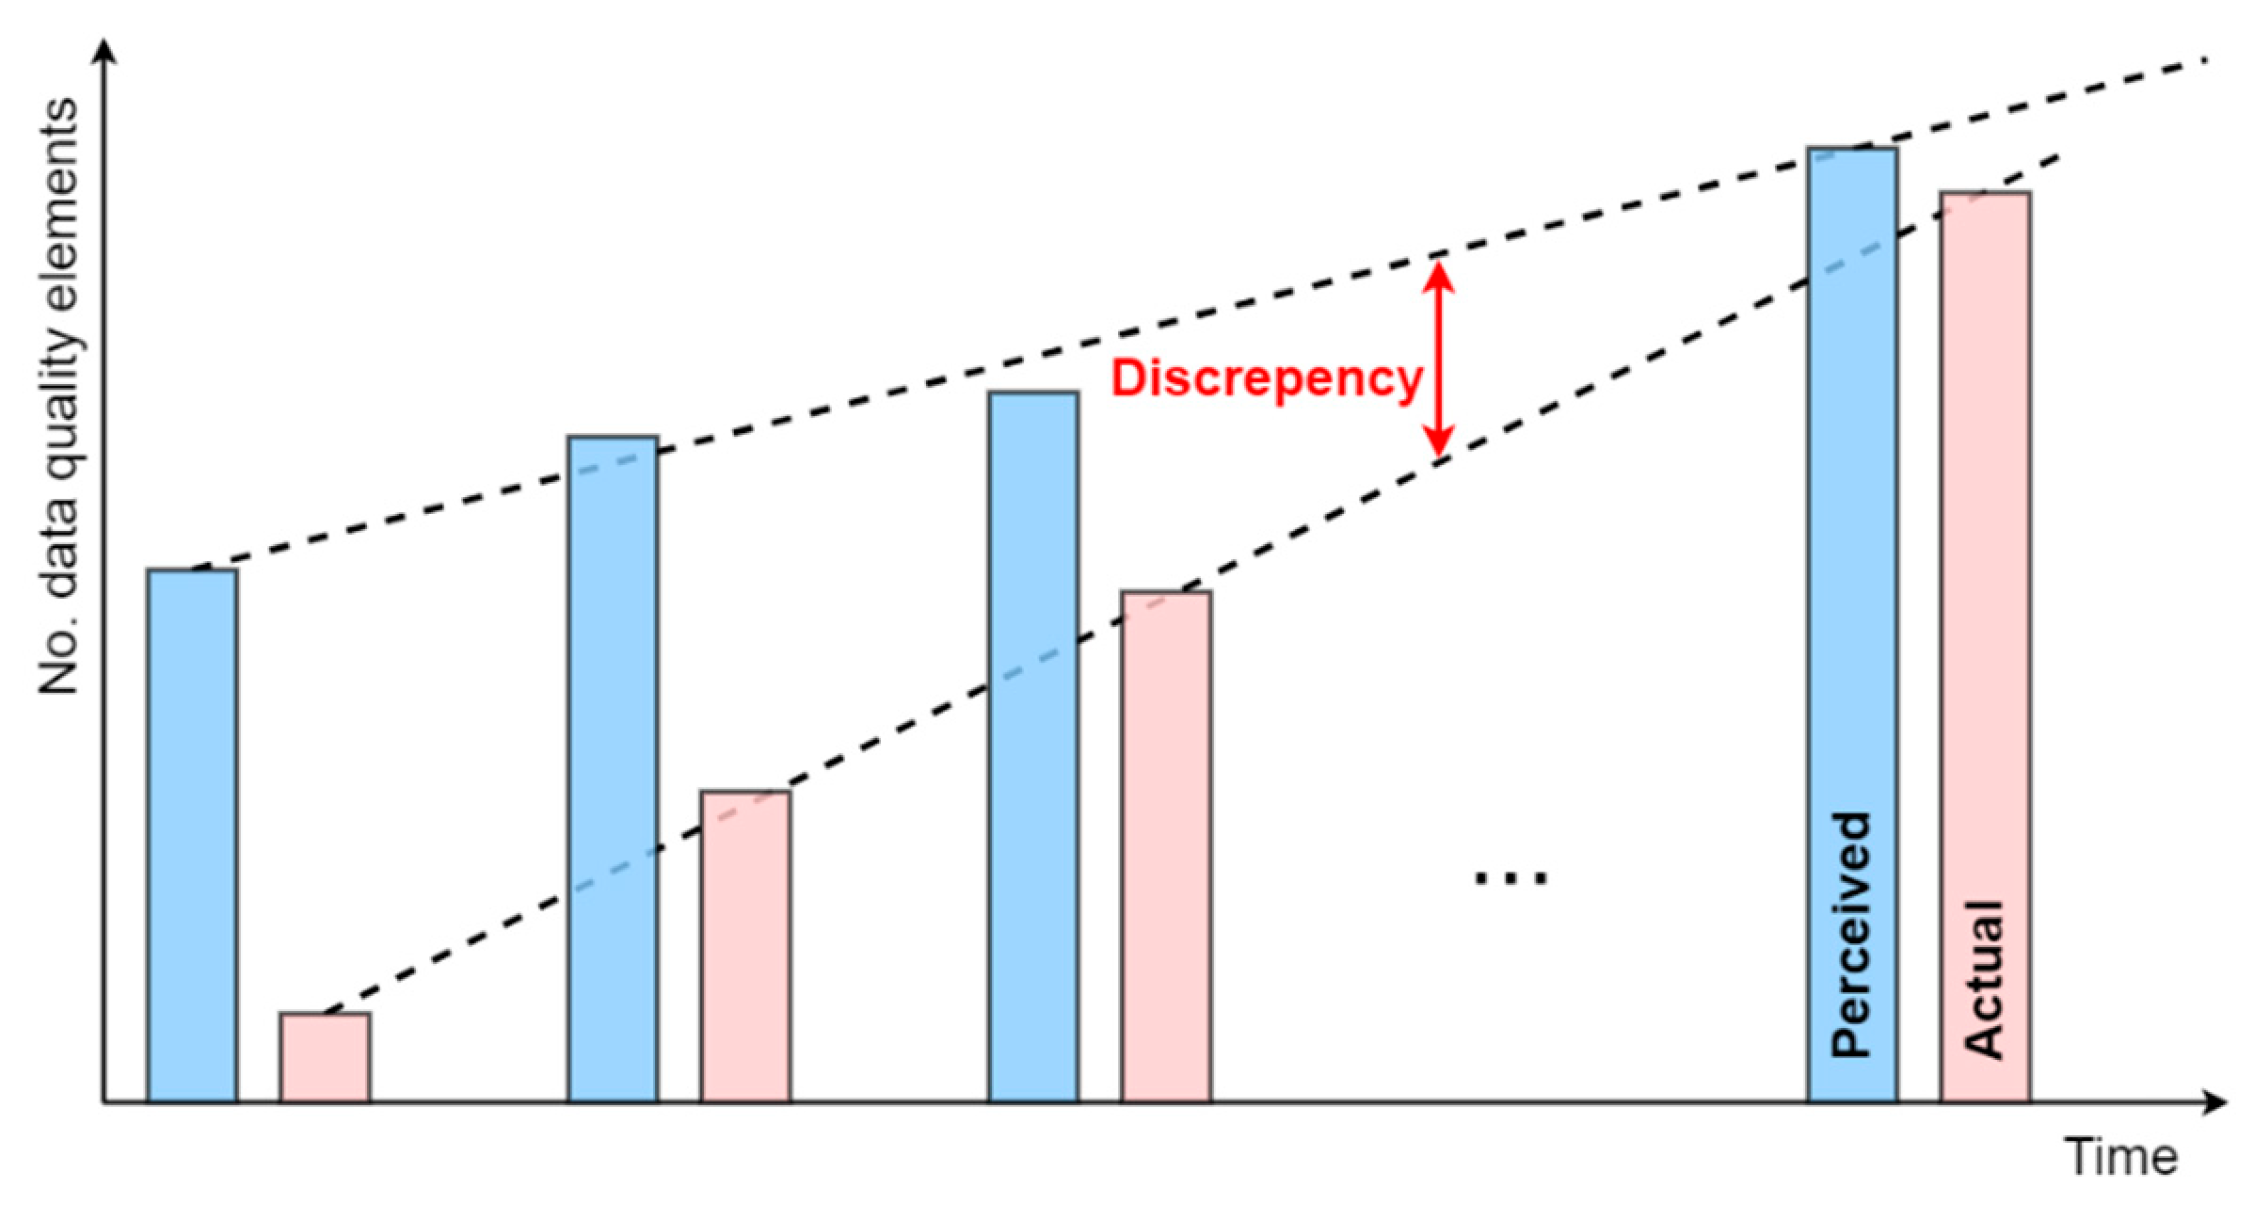
Figure 7.
Functional design of the DQM framework in relation to the perceived (light blue) and actual (light red) spatial data quality over time.
Figure 7.
Functional design of the DQM framework in relation to the perceived (light blue) and actual (light red) spatial data quality over time.
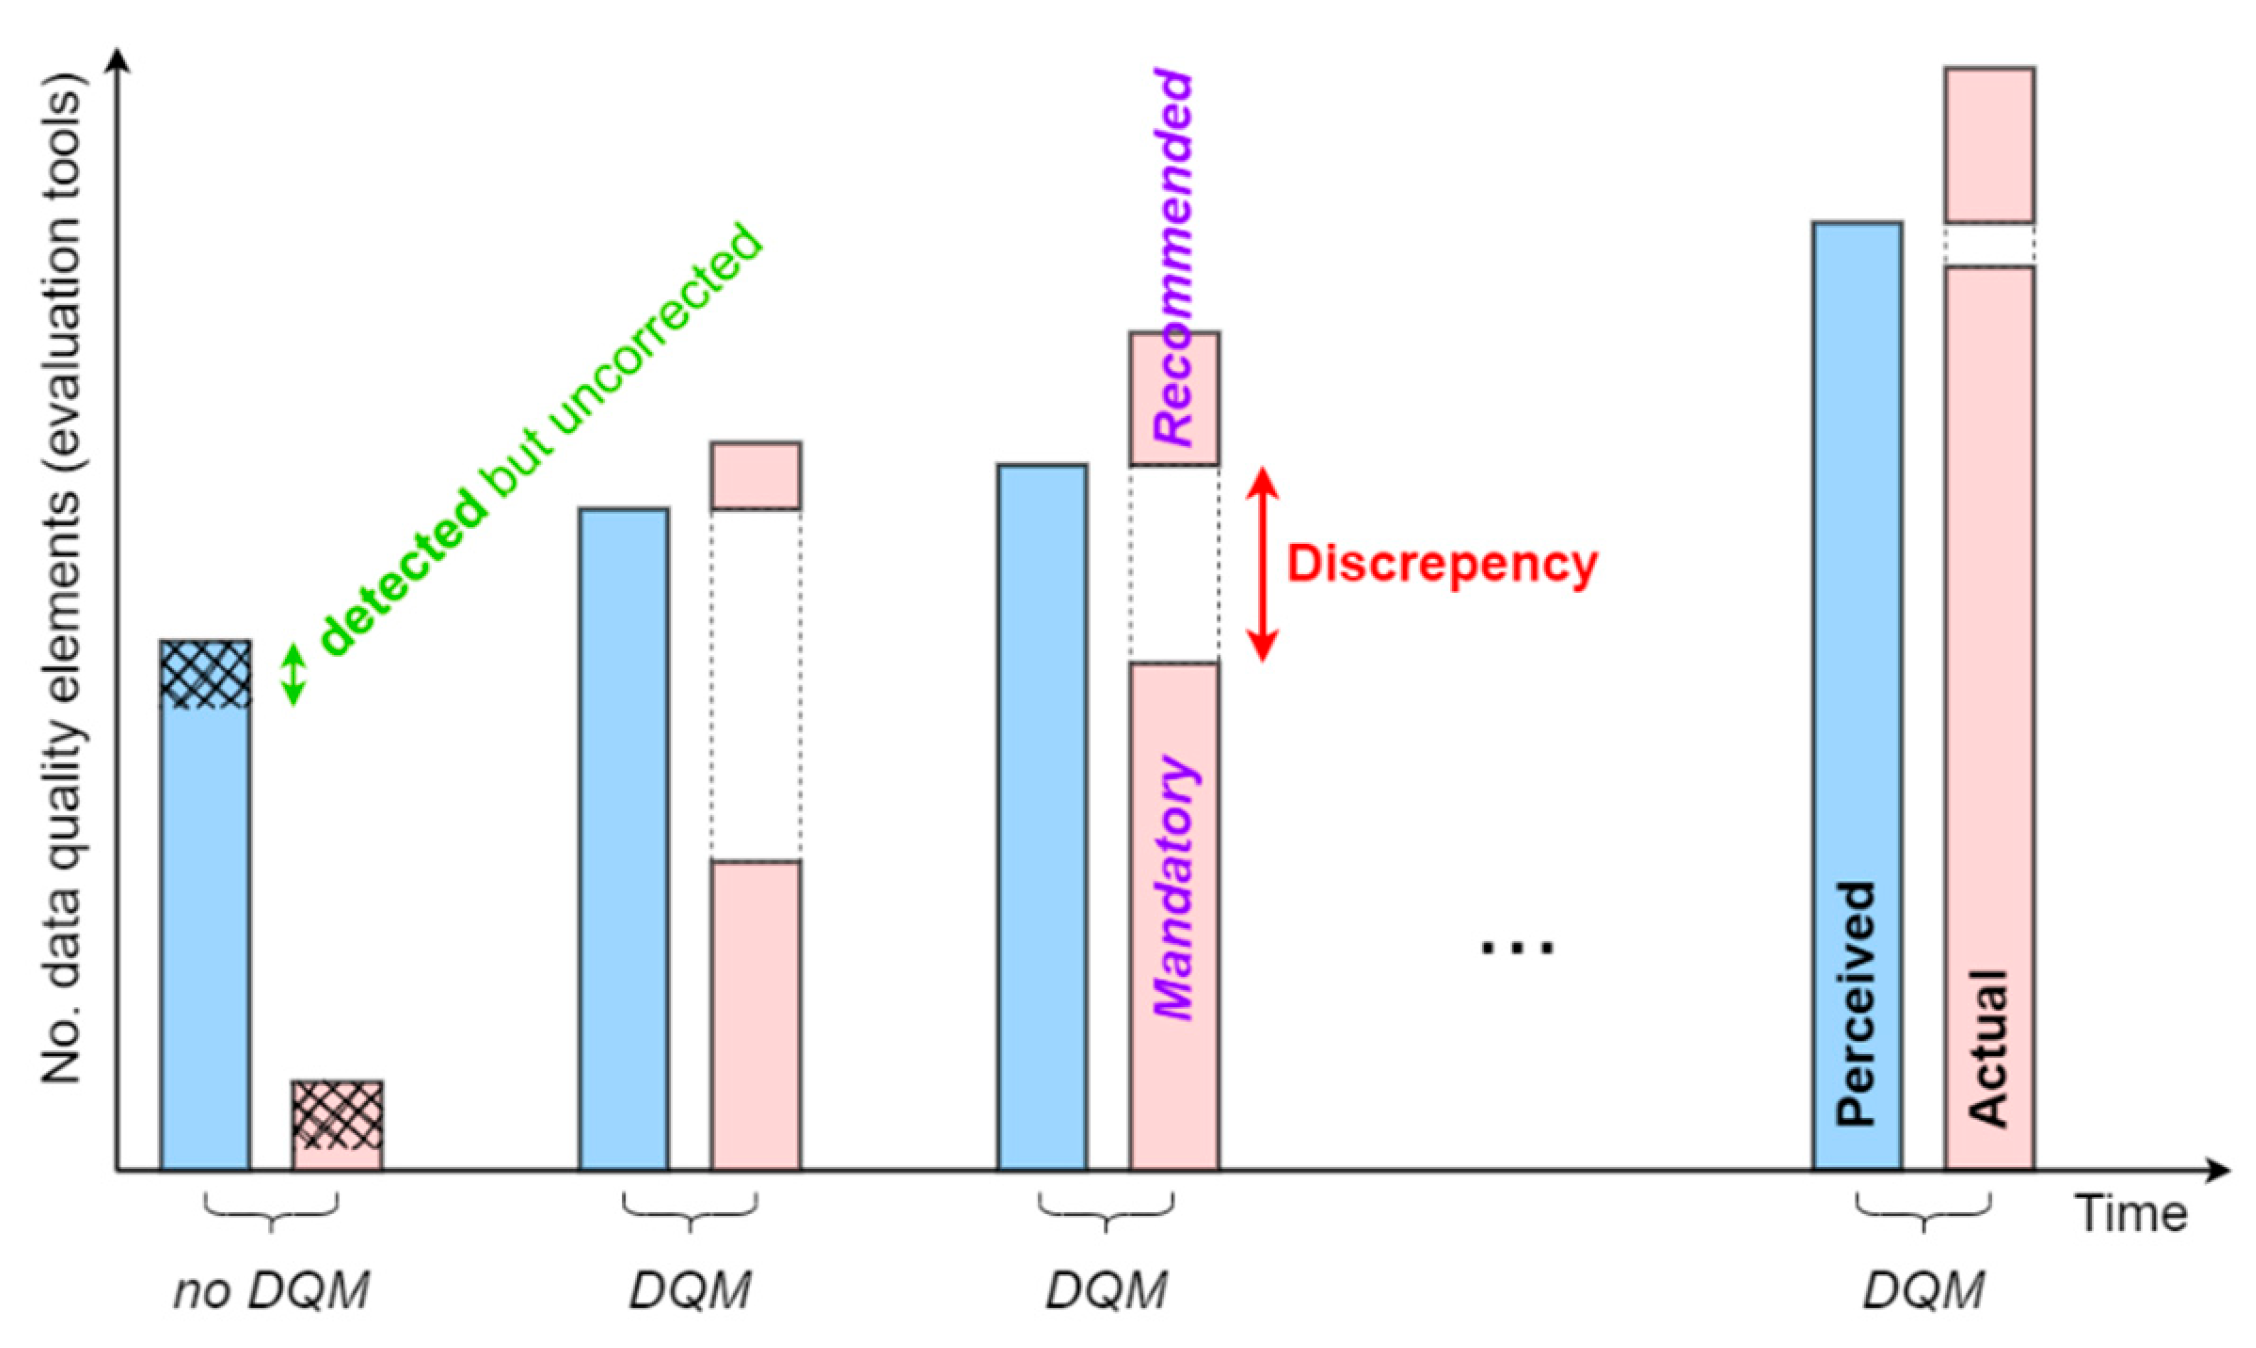
Figure 8.
Dialog box for the parameters (in Slovenian) and generated configuration file.
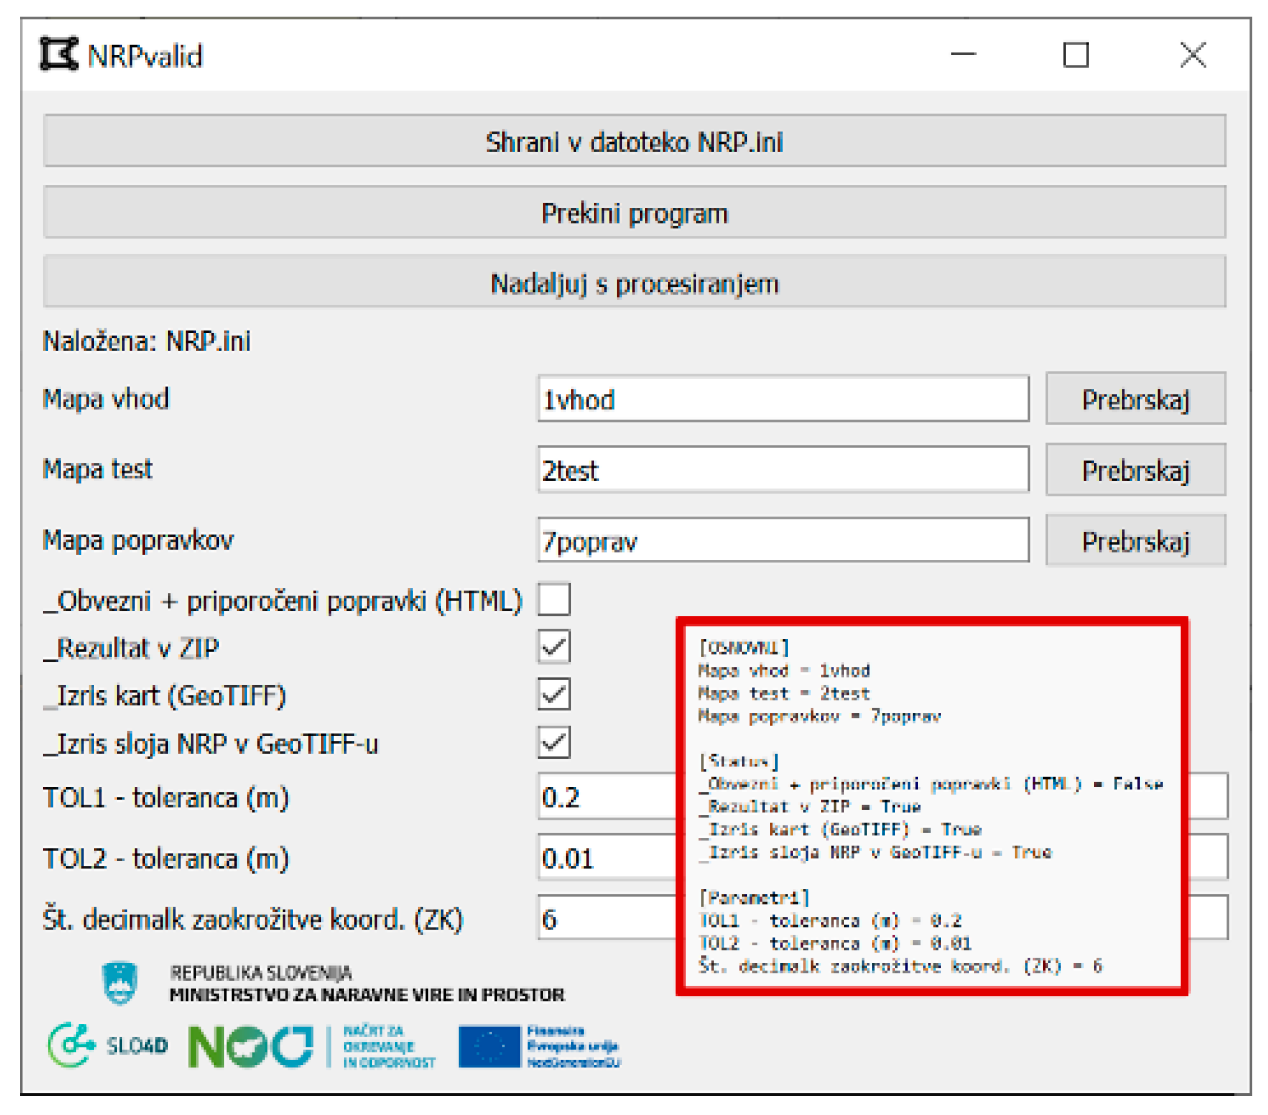
Figure 9.
Top left: An overview map (PDF format) with classifications to building (yellow), agriculture (light green), forests (green) and water bodies (blue). Bottom left: Errors identified and marked with red circles on the error layer map (GeoTIFF format). Right: An aggregated results table (in Slovenian) (HTML) showing potential errors (in red).
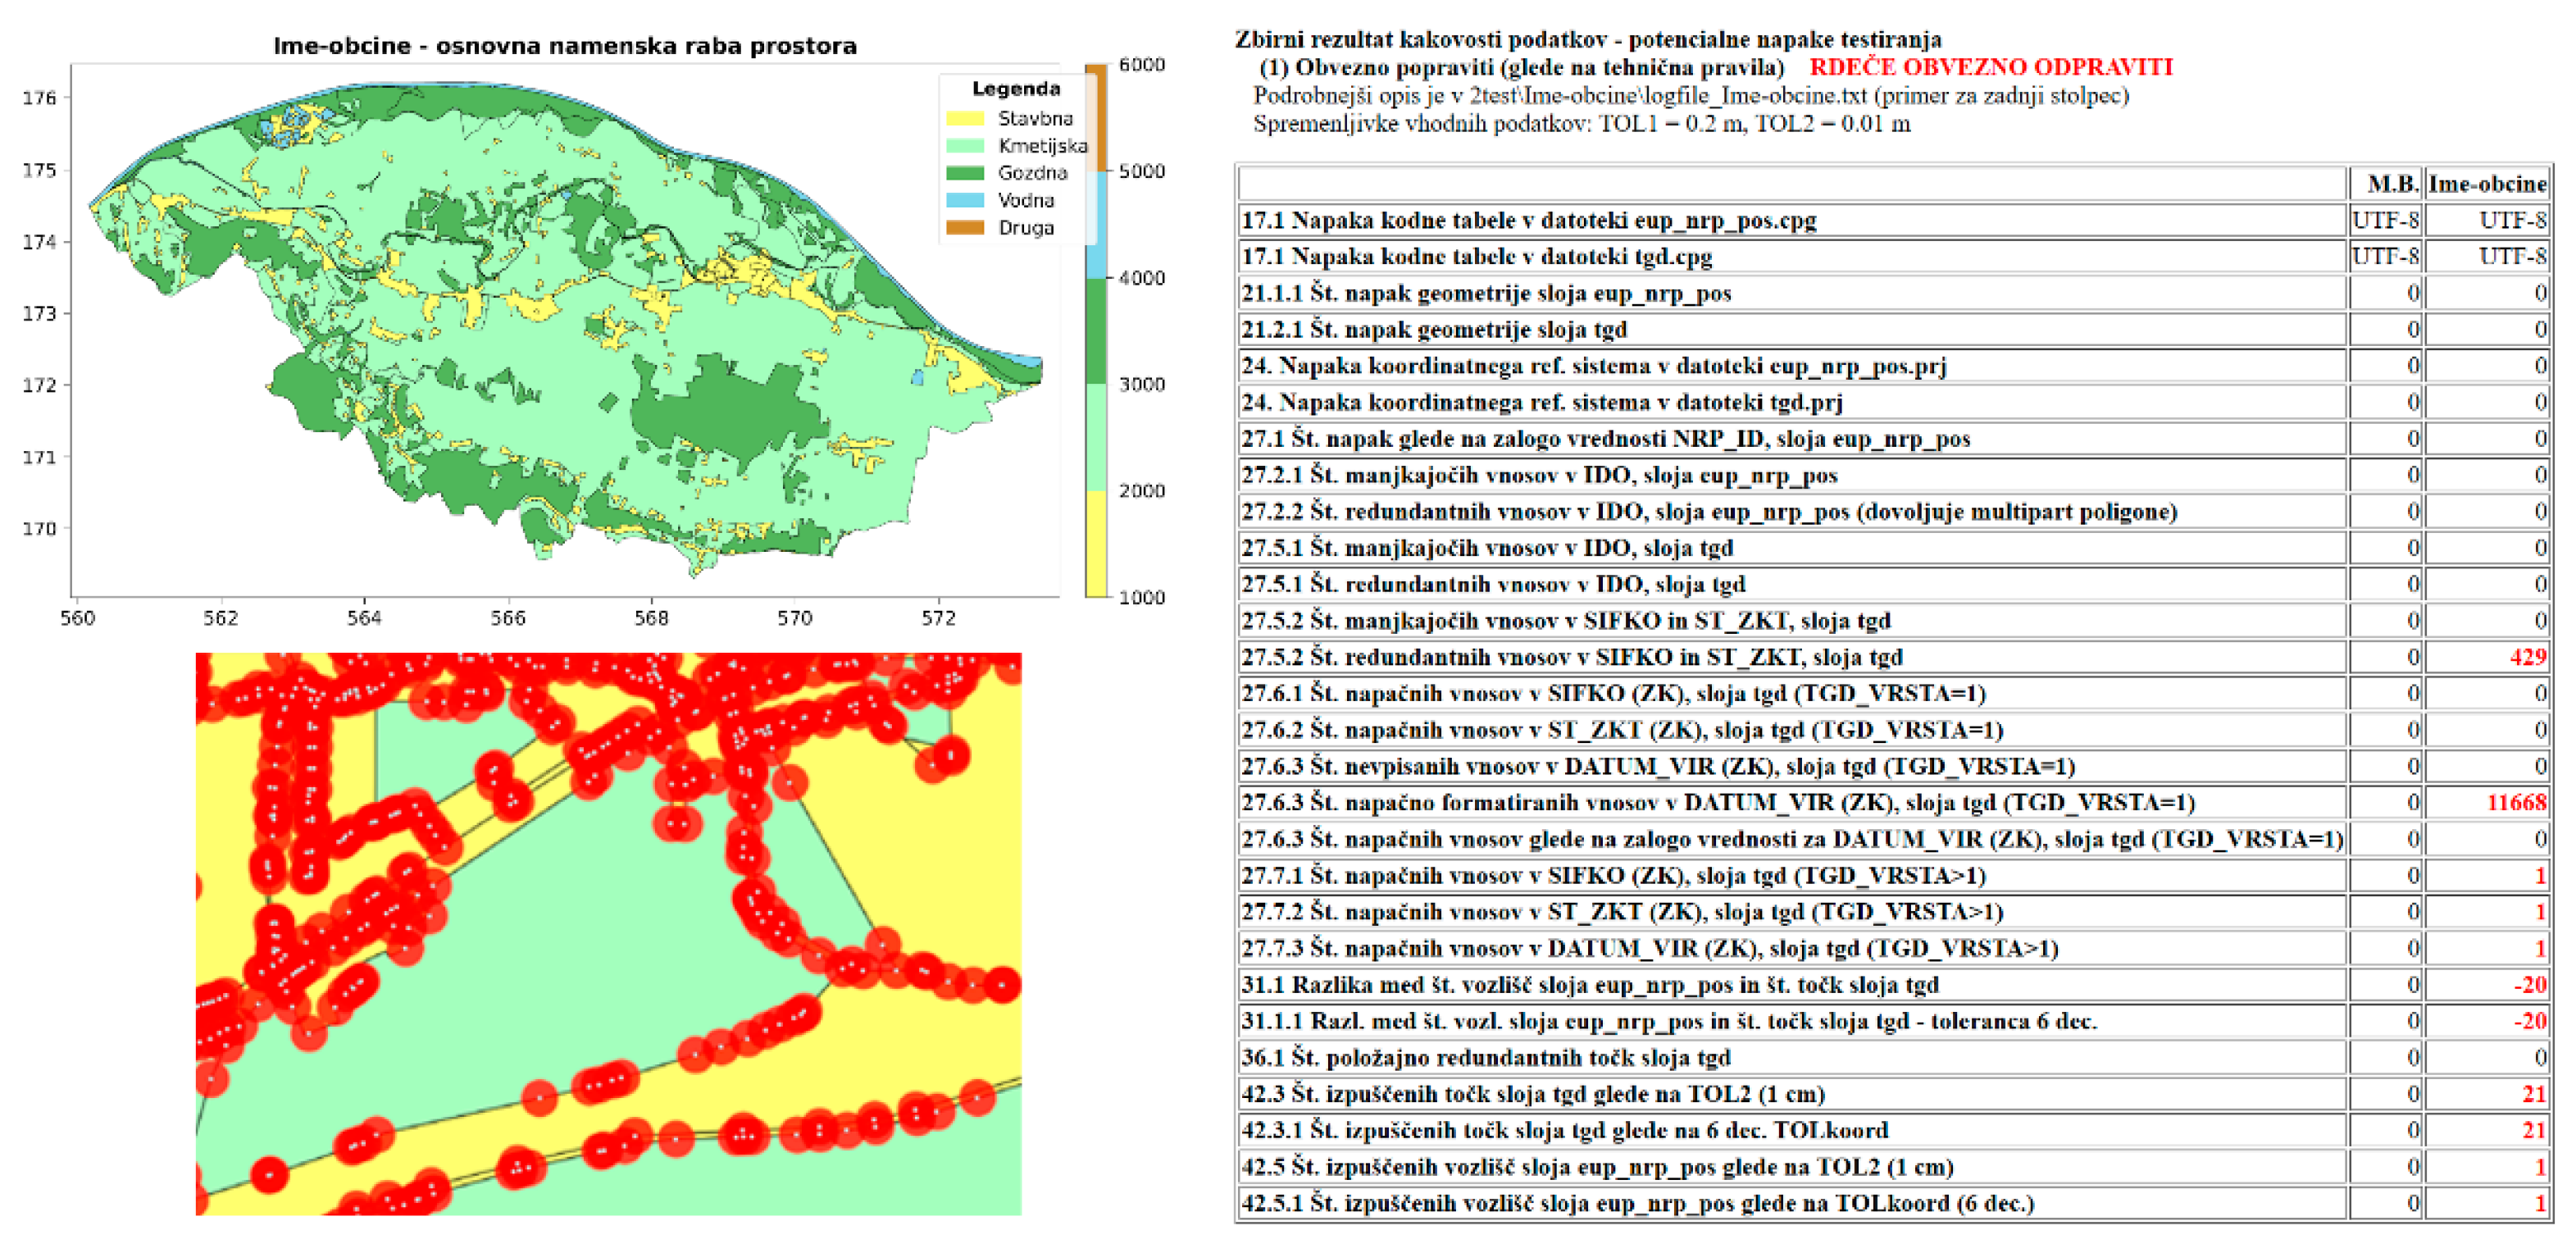
Figure 10.
Workflow of the NRPvalid program for holistic automated data quality evaluation, based on the DQM framework.
Figure 10.
Workflow of the NRPvalid program for holistic automated data quality evaluation, based on the DQM framework.
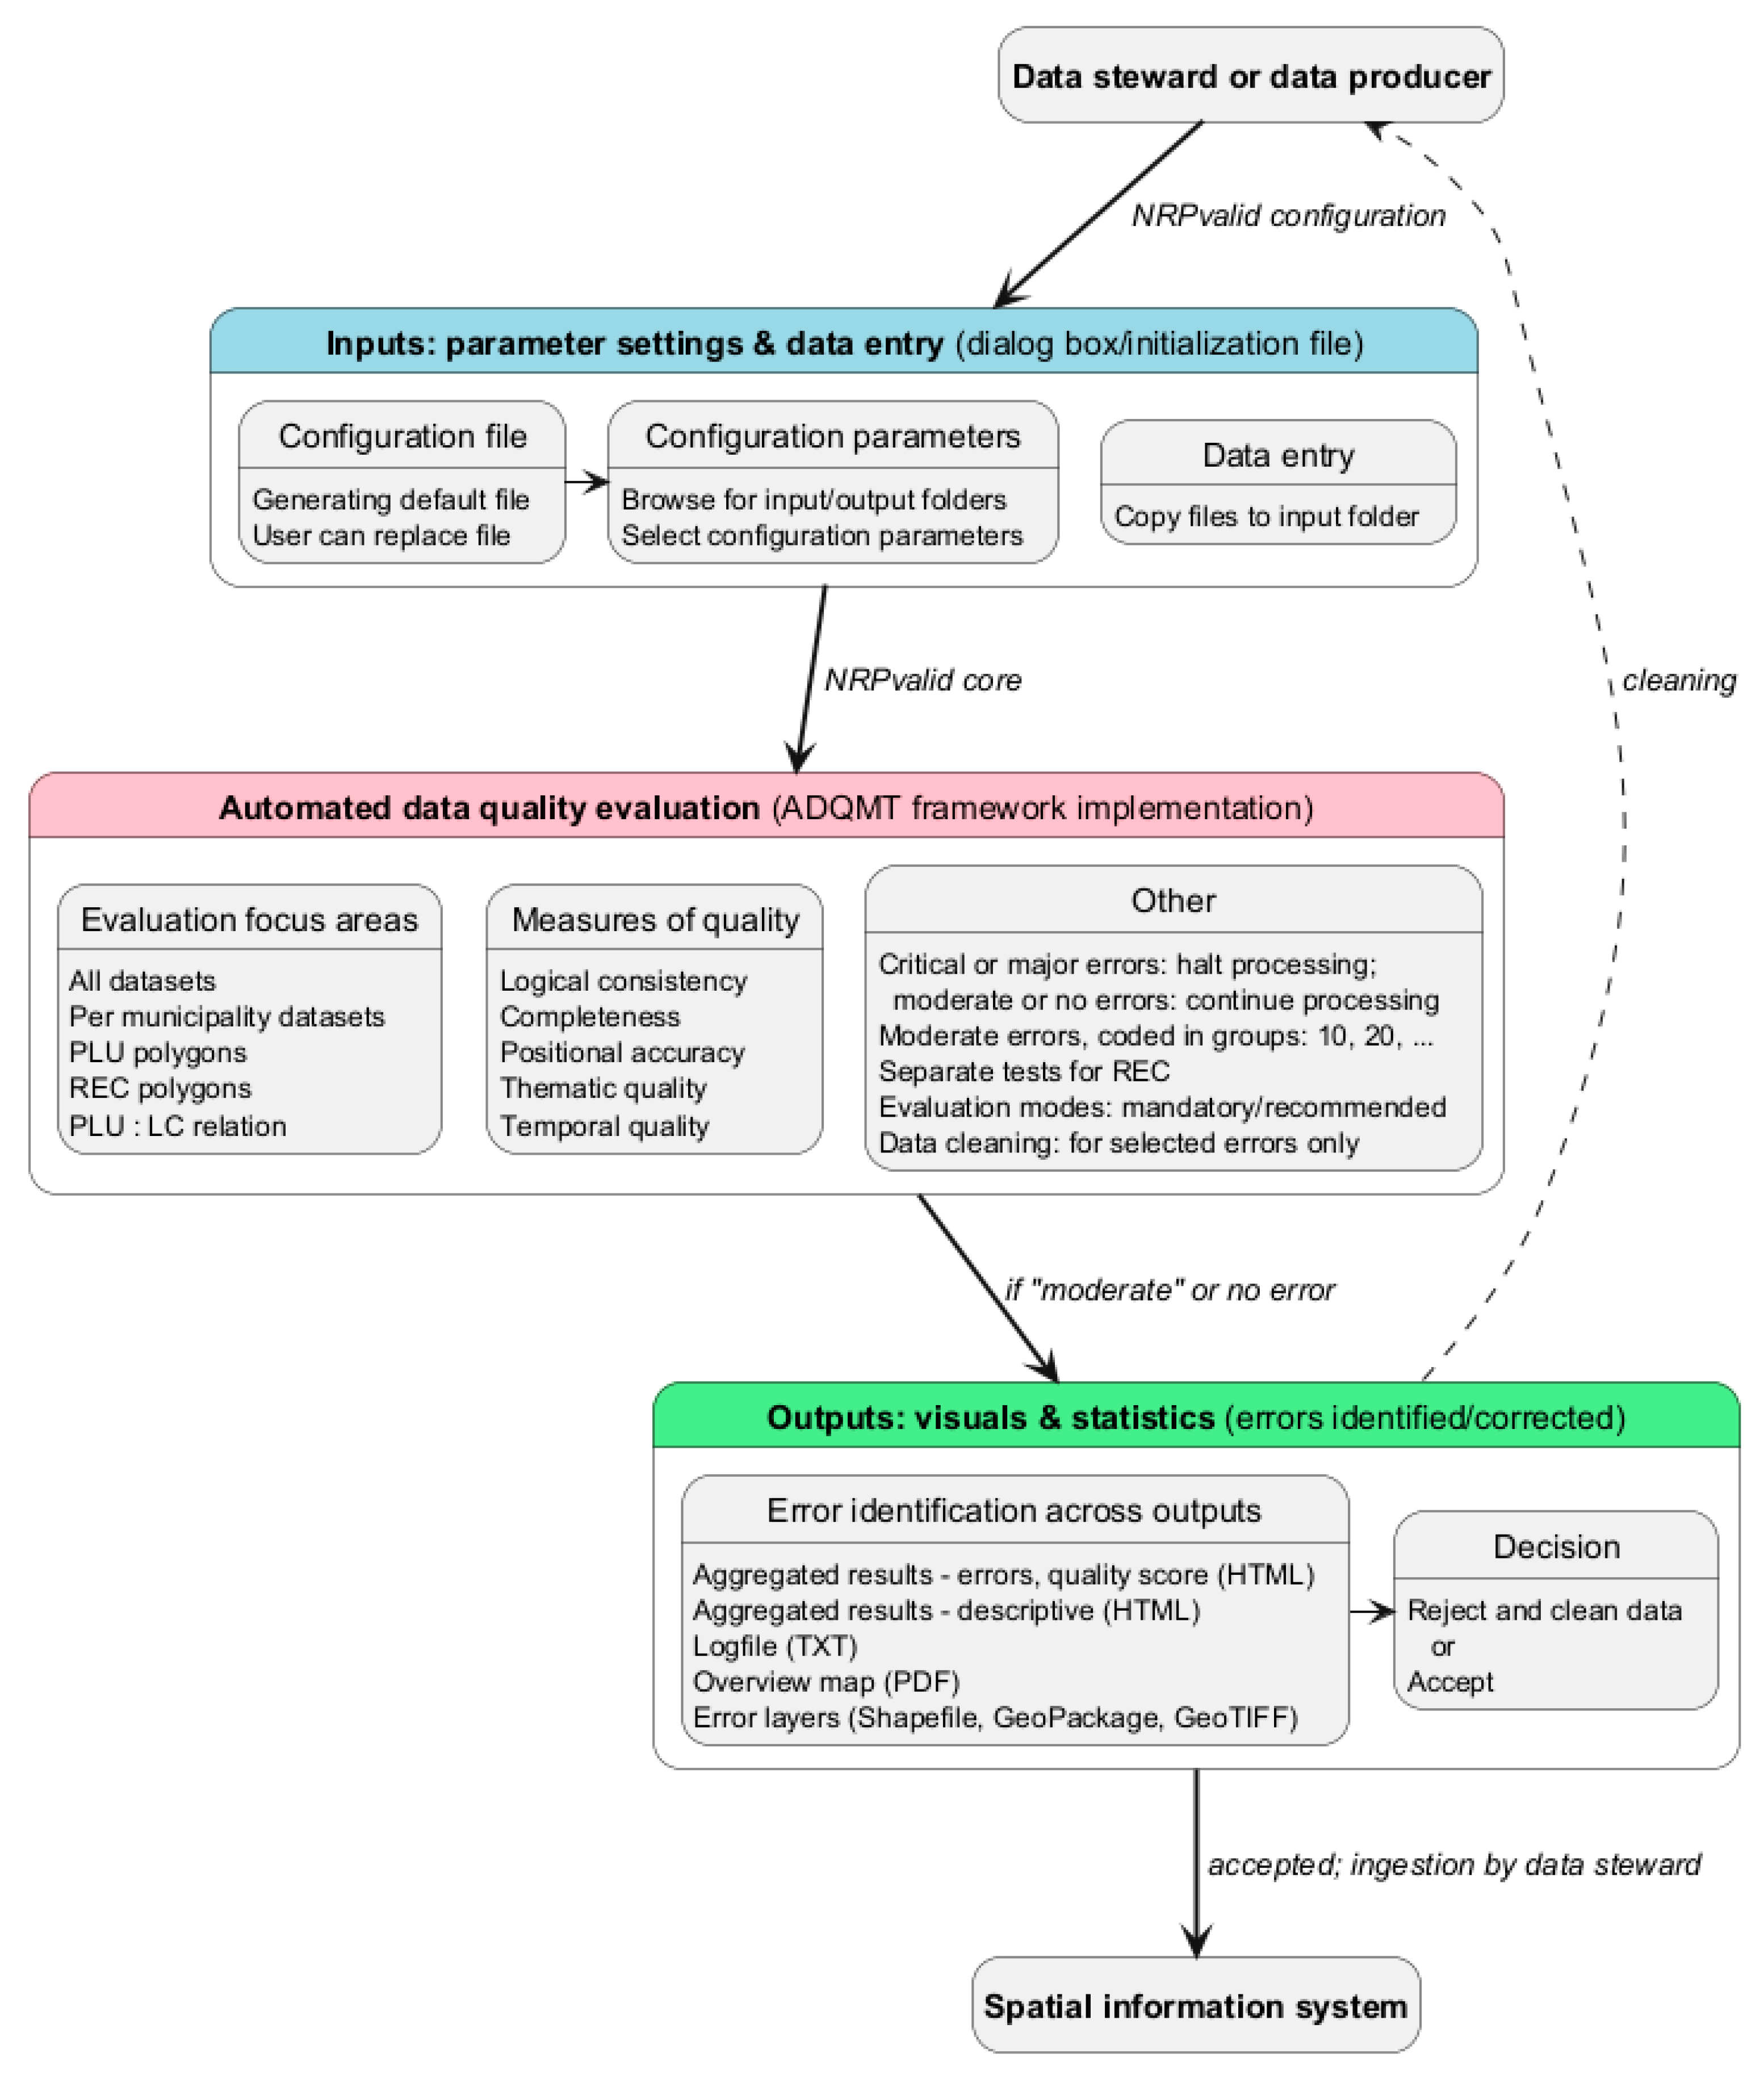
Table 1.
Quality evaluation toolkit is organized into code groups based on different focus areas. In some cases, measures or data quality elements may be interdependent or employ different concepts to assess the same error from multiple perspectives.
Table 1.
Quality evaluation toolkit is organized into code groups based on different focus areas. In some cases, measures or data quality elements may be interdependent or employ different concepts to assess the same error from multiple perspectives.
| Code group | Measure/element | Tool | Focus area |
|---|---|---|---|
| 10 | completeness | file presence | all datasets |
| . | logical consistency | format, readability | configuration file, all datasets |
| . | logical consistency | UTF-8, Windows-1250 | per municipality datasets |
| 20 | logical consistency | geometry, topology | per municipality datasets |
| . | logical consistency | data schema/attribute type | per municipality datasets |
| . | logical/thematic | attribute domain | per municipality (attributes) |
| . | completn./temporal | missing/duplicate/invalid val. | per municipality datasets |
| . | logical consistency | CRS parameters | per municipality datasets |
| 30 | completeness | counting | PLU and LC datasets |
| . | positional accuracy | counting | PLU and LC datasets |
| . | completeness | duplicates, matching | PLU and LC datasets |
| 40 | completeness | different No. points | relation PLU : LC |
| . | positional accuracy | matching with diff. tolerances | relation PLU : LC |
| 100 | logical consistency | verification coord. rounding | per PLU attribute |
| . | completeness | descriptive statistics | per PLU attribute |
| . | completeness | descriptive statistics | all/LC attribute |
| 900 | (data cleaning) | UTF-8, CRS, data schema | per municipality datasets |
Disclaimer/Publisher’s Note: The statements, opinions and data contained in all publications are solely those of the individual author(s) and contributor(s) and not of MDPI and/or the editor(s). MDPI and/or the editor(s) disclaim responsibility for any injury to people or property resulting from any ideas, methods, instructions or products referred to in the content. |
© 2025 by the authors. Licensee MDPI, Basel, Switzerland. This article is an open access article distributed under the terms and conditions of the Creative Commons Attribution (CC BY) license (http://creativecommons.org/licenses/by/4.0/).
Copyright: This open access article is published under a Creative Commons CC BY 4.0 license, which permit the free download, distribution, and reuse, provided that the author and preprint are cited in any reuse.


