Submitted:
11 January 2025
Posted:
13 January 2025
You are already at the latest version
Abstract
This paper will review the preprint submitted to this server about the development of sound power of wind turbines. Using information available in the scientific record, it will be shown:1. that the methods are not suited for the goal of the authors by reinterpreting their presented results;2. the results are not supported by data from the scientific record; 3. The discussion is based on a selected and small sample of the scientific literature;4. The conclusions in the discussed paper are not supported by the results.All this is supported by a review of the relevant literature, with examples of opposing interpretations.
Keywords:
wind turbine
; noise production
; annoyance
; legislation
Summary of Comments on This Preprint
The preprint is unacceptable for publication, given the following observed shortcomings:
- The authors deny any conflict of interest. However, each of them has financial stakes in the development of wind power generation by their advisory work with regard to wind turbines in general, permits and propositions for legislation in particular. The preprint in its current form raises the suspicion that it is intended to ease the installation of larger turbines by proposed new legislation.
- The narrative, that novel wind turbines produce less noise than older ones, as proposed in the preprint, is not supported by the data and their analysis and is contradictory to many scientific studies.
- The data are confidential, which precludes independent scrutinizing of the data, their analysis and outcomes.
- The data seem to be of poor quality, and do not include many relevant parameters as can be deduced from the next four items (5-9).
- The overall production of noise by wind turbines (apparent sound power level LAeq) is commonly determined according to ISO/IEC 17025 and IEC 61400-11, under neutral atmospheric conditions. The circumstances are not comparable to the actual situation during use, when higher peak values of (LF) sound power will occur due to stall and turbulence.
- A major limitation of this paper is the absence of (necessary) data segmentation, but instead, all data from various turbine types are combined into a single category.
- The effects of hub height, rotor diameter, and rotor speed on noise spectrum, noise power, and the range of the resultant noise contours are completely ignored.
- The effects of tonal sound, amplitude modulation, low frequency noise, infrasound noise are excluded from the analysis, which reduces wind turbine noise to the category of traffic noise. As a consequence, the contribution of these neglected parameters on annoyance is also ignored, which suggests that these parameters do not contribute to the general perception of wind turbine noise and the resulting annoyance.
- The preprint suggests that all negative effects of wind turbine noise are mediated by annoyance, thus denying all mechanisms of extracochlear sensing of sound, LF and infrasound and the possible adverse effects on health mediated by these pathways.
- The difference in annoyance levels between traffic noise and wind turbine noise is at least 10 dB, with wind turbine noise being 10 dB more effective in raising high annoyance.
- None, or only a limited number of the claims are supported by references to the scientific literature, which shows much more diverse positions with regard to all proposed truths in the preprint.
- This article implicitly admits, that serrations do have an impact at residential locations, particularly by raising the lower-frequency regions of the sound spectrum. However, this result is waved away with the claim that this increase can not be heard by the residents.
- The beneficial effect of serrations is overblown, given the fact that wind tunnel experiments have indicated that the load, and consequently the wear and tear of the turbine and its components, increase as a consequence of the serrations, resulting in a reduction of the lifetime of critical components of the wind turbine and its support.
- Any obtained reduction in sound power level will be nullified by the Lden measure for noise in Dutch regulations (this measure is a free loading permit to produce 47dB and more on any moment throughout a year, by lack of maximum permissible noise power levels in the regulations).
- Any reduction of noise power (relative to the increase caused by the size of the turbine) by serrations, lower tip speed etc. is driven by financial incentives, not by considerations with the inhabitants of dwellings close to wind turbines.
These points will all be discussed and analyzed in more detail in the next paragraphs of this comment.
Introduction
This preprint claims to provide a comprehensive overview of the historical evolution of increasing wind turbine power output alongside the relative reduction of the associated sound power levels of various wind turbine models. This comment intends to show that the authors have used a very simple approach to the historical evolution and have very poorly founded statements about power development and spectral development of wind turbine noise. Their discussion of sound power of wind turbines is, however, incomplete for the following reasons.
- The authors start by excluding tonal noise and amplitude modulation (AM) noise from their paper, because these data are not in their dataset. The authors acknowledge this significant limitation: “The focus here is on the development of sound power levels of onshore wind turbines and their spectral distribution, not on tonal sound or amplitude modulation for which no data are available in the dataset”. This statement thus implies that the two factors which are the main contributors to the observation that wind turbine noise is much more annoying than e.g. traffic noise of the same sound level, will be ignored in this study.
- Low frequency and infrasound noise is not adequately covered, because the authors express noise in dB(A), whereas it is generally accepted that for LF and infrasound SPL or dB(G) is more suited. As a consequence, infrasound is completely ignored, because “it is far below the perception threshold at residential distances”.
- The apparent sound power level, which is provided by the manufacturer is measured according to ISO/IEC 17025 with details about locations as stipulated in IEC 61400-11. These measurements are performed during neutral meteorological situations. The manufacturer is free to select optimal meteorologic conditions for the lowest outcome of the measurements. During operation of the turbines, excessive sound power levels can be produced due to stall conditions and turbulence during variable wind situations, which are not covered by the data from the manufacturer. The enforcement of the maximum legal sound levels must be performed by measurements during neutral atmospheric situations, so this will never detect the true amount of wind turbine noise.
Another shortcoming which receives no attention at all is the fact that all wind turbine noise is expressed as Lden in dB(A), which is calculated on the basis of IEC 61400-11 and ISO 9613 thus neglecting influences of turbulence and stall as well as propagation effects as a result of the wake and due to different parameters like vertical wind and temperature gradients (Öhlund and Larsson 2015). Moreover, it is in general the average over the period of one year with penalties for evening and night periods. Since it is an average, it will smooth out peaks of noise production and seasonal influences such as the presence or absence of foliage (Öhlund and Larsson 2015). As a result, important sources of annoyance are being ignored which makes the basis and outcome of the analyses highly questionable.
Although the title mentions development of Sound Power, the paper largely ignores the evolution of wind turbine technology, but only focuses on the effect of serrations as a method to reduce the noise production of the tip of the blades. No attention to the effects of increasing rotor diameter, hub height, drive construction, different regulation mechanisms, the effect of the parameters by which the turbine is regulated, the effect on the other types of noise (tonal, AM, LF, infra). The only segmentation used in the paper is power (<2MW vs >2MW and with or without serrations, while it is necessary to identify technologically different approaches to increase the rated power, cut-in and cut-out speed, regulation of output power and noise reduction, to name but a few important categories which have potentially great influence on sound spectra.
The manuscript deals with wind turbine noise from the point of view of the operators: it shows no consideration for the perception of the local residents, but is only aimed at optimization of power production within the legal framework. Every dB(A) of noise reduction directly translates into increased financial yield, because this space will be filled with extra hours of operation or increased levels of operation. This is obvious from Figure 13 in the preprint, which shows the reduction in power in relation to the noise reduction (tip noise) by downregulating rotational speed, which is estimated to be 5% per dB noise reduction. Oerlemans has presented a similar figure, but expressed as gain of power production per dB noise reduction of 20% increase per dB(A) noise reduction (Oerlemans 2012)1. In other words, any reduction in wind turbine noise becomes a source of increased power yield, and thus financial benefits. This explains why the simplest measure for noise reduction from wind turbines, downregulation by rotor speed limitation, which is a standard procedure for virtually any make and brand of wind turbines, meets massive resistance from the operators.
And, probably the most important neglection: ignoring the perceived annoyance of the people who live in the immediate vicinity of wind turbine operations. Their complaints are mostly rejected due to poor regulations or failing enforcement of the rules. Measurements are often interpreted as non-annoying so they must feel as if they are suffering from mental disorders. The preprint serves as a means to support poor legislation as is advised by the Authors (Arcadis) in The Netherlands.
This comment is divided into two parts: part 1 covers the manuscript sec, the second part explains the consequences for the situation in the Netherlands, as the authors are involved in Dutch rule making.
Remarks on the Manuscript
The authors try to show that the development of sound power has not paralleled the increase in electrical power generation, a claim that diverges from established knowledge (Hoen et al. 2023)2. Traditionally, as the preprint states, it has been understood that sound power correlates logarithmically with power output, and thus with rotor diameter for turbines of a similar design (i.e., without specific noise reducing measures) (Søndergaard 2015) (Møller and Pedersen 2011). According to the preprint, this was a valid observation 10 years ago, but this relationship is now probably not applicable. However, it appears that the relationship between rated power and SPL still holds, when data are properly segmented, e.g. by year of design, but with different regression parameters for different types of turbines.
According to the preprint, this correlation is no longer valid due to the implementation of noise reduction technologies in modern wind turbine designs. To substantiate their claims, the authors analyze data derived from a database containing specifications from wind turbine brochures. The aggregated data show indeed a reduced correlation with increasing rated power (Figure 3). A similar graph, but using segregation by decade of design (3 decades, 80, 90 and 00, combined with current day), shows a time dependent relationship, which is probably technology driven, but which still follows a logarithmic correlation with a breakpoint at 1990 (Luesutthiviboon 2022). Current day designs fit well with the regression for 90’s and 00’s designs, indicating a steady increase of the SPL with increasing rotor diameter3. The data in the preprint are not segmented according to drive technology, which would make a comparison of tonal (gear box) noise possible.
Additionally, the study’s reliance on dB(A) as a metric for assessing sound levels introduces further limitations. This measure substantially diminishes the influence of low frequency noise and completely disregards the influence of infrasound, tonal noise and AM to the annoyance experienced by individuals exposed to wind turbine sounds and vibrations (Møller and Pedersen 2011)
Wind Turbine Sound Sources
The section “wind turbine sound sources” outlines the primary sources of sound generated by wind turbines. Several important issues need to be addressed here.
A key oversight in the publication is the failure to distinguish between gear-box turbines and direct drive turbines (Wagner, Bareiß, and Guidati 2012)4. This distinction is crucial for understanding the tonal characteristics of wind turbines. Tonal sound and AM are widely recognized as being the major source of annoyance (Larsson and Öhlund 2014) (Conrady et al. 2020) (Pedersen and Persson Waye 2004)5. When measuring sound power in octave or third-octave bands, tonal and AM sounds often disappear/blend into the background noise (Nguyen et al. 2021) 6. The problems with regard to the detection and quantification of AM in wind turbine noise are summarized in the International Energy Agency (IEA) task 39 Factsheet7. Only a detailed small-band or continuous spectral analysis, along with suitable Fast Fourier Transform (van der Velden and Oerlemans 2017) analysis, or a neural network trained on expert evaluation (Nguyen et al. 2021) can effectively reveal these tonal or AM components, which this study does not undertake. Recent experiments in anechoic listening chambers have revealed that small contributions of tonal sounds to simulated wind turbine noise, even at low frequencies and power levels of the added noise, drastically increased the perceived annoyance of the participants in the test (Yonemura et al., 2021). Søndergaard mentions that the conclusions of his own research are only valid in the absence of tonal noise in the low frequency domain, indicating the increased annoyance of wind turbine low frequency noise by tonal components (Søndergaard 2015)
The other factor that is causing high levels of annoyance is amplitude modulation (Nguyen et al. 2021) 8. This study showed that AM was more prevalent during the night (22h – 4 h) with a maximum around 24h, in which a correlation with lower background levels was observed. The frequency of the modulation was between 0.5 and 1 Hz, which is related to the rotor’s rotations per minute (RPM). It was observed that AM occurs in short bursts of about 15 s and shows a low degree of reduction by insolation, as was shown by the measurements outside and inside a house. Also, reduction of AM by distance is very low and it was possible to detect the AM sound at several kilometers from the windfarm. In general, AM is caused by the stratification of the atmosphere, which occurs mainly during the night and this explains why the AM can be detected at much larger distances than medium frequency noise. This is a direct consequence of the fact that AM deals with LF noise, the stability of the atmosphere during the night and the focusing effect of the wake, which can add up to 7.5 dB to the expected SPL (Barlas et al. 2017). This wake effect is strongly influenced by the height of the emitter, so a rotor with diameter of 120 m will increase the amplitude of the local observable AM. This phenomenon may explain why AM is such a persistent source of annoyance and does not obey the traditional spherical attenuation rules.
Dominant Sources
The authors claim that the maximum rotational speed of a wind turbine is primarily determined by the generator’s capacity. While this may be true for gear-box turbines, it does not apply to direct drive turbines, which lack a gear-box. A direct-drive turbine’s drive train consists of the main axis, the main bearing and the disk with the magnets, possibly accompanied by a down bearing on the opposite side, which are less prone to tonal sound production(Nejad et al. 2022)9. A careful study of publications dealing with wind turbine failures(Thomas 2024) learns that mechanical problems with generators are very rare, whereas gearboxes and electronics are the most sensitive parts of a wind turbine, after the blades. What seems to be the limiting factor is Leading Edge Erosion (LEE), which drastically increases with increasing tip speed10, resulting in severe degradation of the blade surface (Han, Kim, and Kim 2018; Shankar Verma et al. 2021; Verma et al. 2021). This degradation of the surface exposed to the highest wind load causes also increased turbulence and hence increased noise from the blade tip (Zhang et al. 2021)11. As a consequence, the LAeq specifications are no longer valid and will result in excessive noise production, far above the permitted values. This effect (LEE) accounts for high repair cost, being second to drive train failures. Verma et al. 2021 provide a simulated lifespan analysis of two different turbines, a 10 MW and a 1.5MW with tip speeds of 90 and 75 m/s respectively. These simulations show an average lifetime of their blade coatings of 3 and 6.3 years, with 7 and 3 repairs during that time on average12 In both cases, the drive train and the maximum tip speed limit the maximum rotational speed.
In contrast, the gearbox includes multiple parts, such as planetary gears, which require very clean lubricating oil, leading to higher operational costs. It is important to note that the maximum rotational speed in both types of turbines is governed by the Supervisory Control and Data Acquisition (SCADA) system, rather than being dictated solely by the generator capacity. This is illustrated by the observation that in the early days of off-shore wind turbines, turbine types designed for application on land were used for off-shore applications with larger blades and modified operational SCADA parameters (increased maximum rpm) and higher power yields due to the less stringent requirements for noise reduction as compared to land-based turbines. When reviewing the performance graphs of different wind turbines, it is useful to analyze the Thrust Coefficient (Ct) and Cp (Power Coefficient) curves, which show the efficiency of the wind turbine (Ct) and the overall system (Cp) in relation to wind speed (Excellently explained in (Adams and Keith 2013)) . Many turbines, using simple algorithms, display a flat Ct curve up to the maximum power level and then gradually reduce the Ct13. This adjustment may be to protect the turbine from excessive mechanical stress, but it is also likely that it reflects regulation to comply with sound and noise limitations. More advanced turbine models often show a decrease in Ct at wind speeds below the maximum power level 14. The change in the Ct versus wind speed graph is not due solely to mechanical reasons, suggesting that the SCADA system may also factor in other parameters while it controls the turbine rotational speed by adapting the orientation of the blades (pitch).
Relation with Size
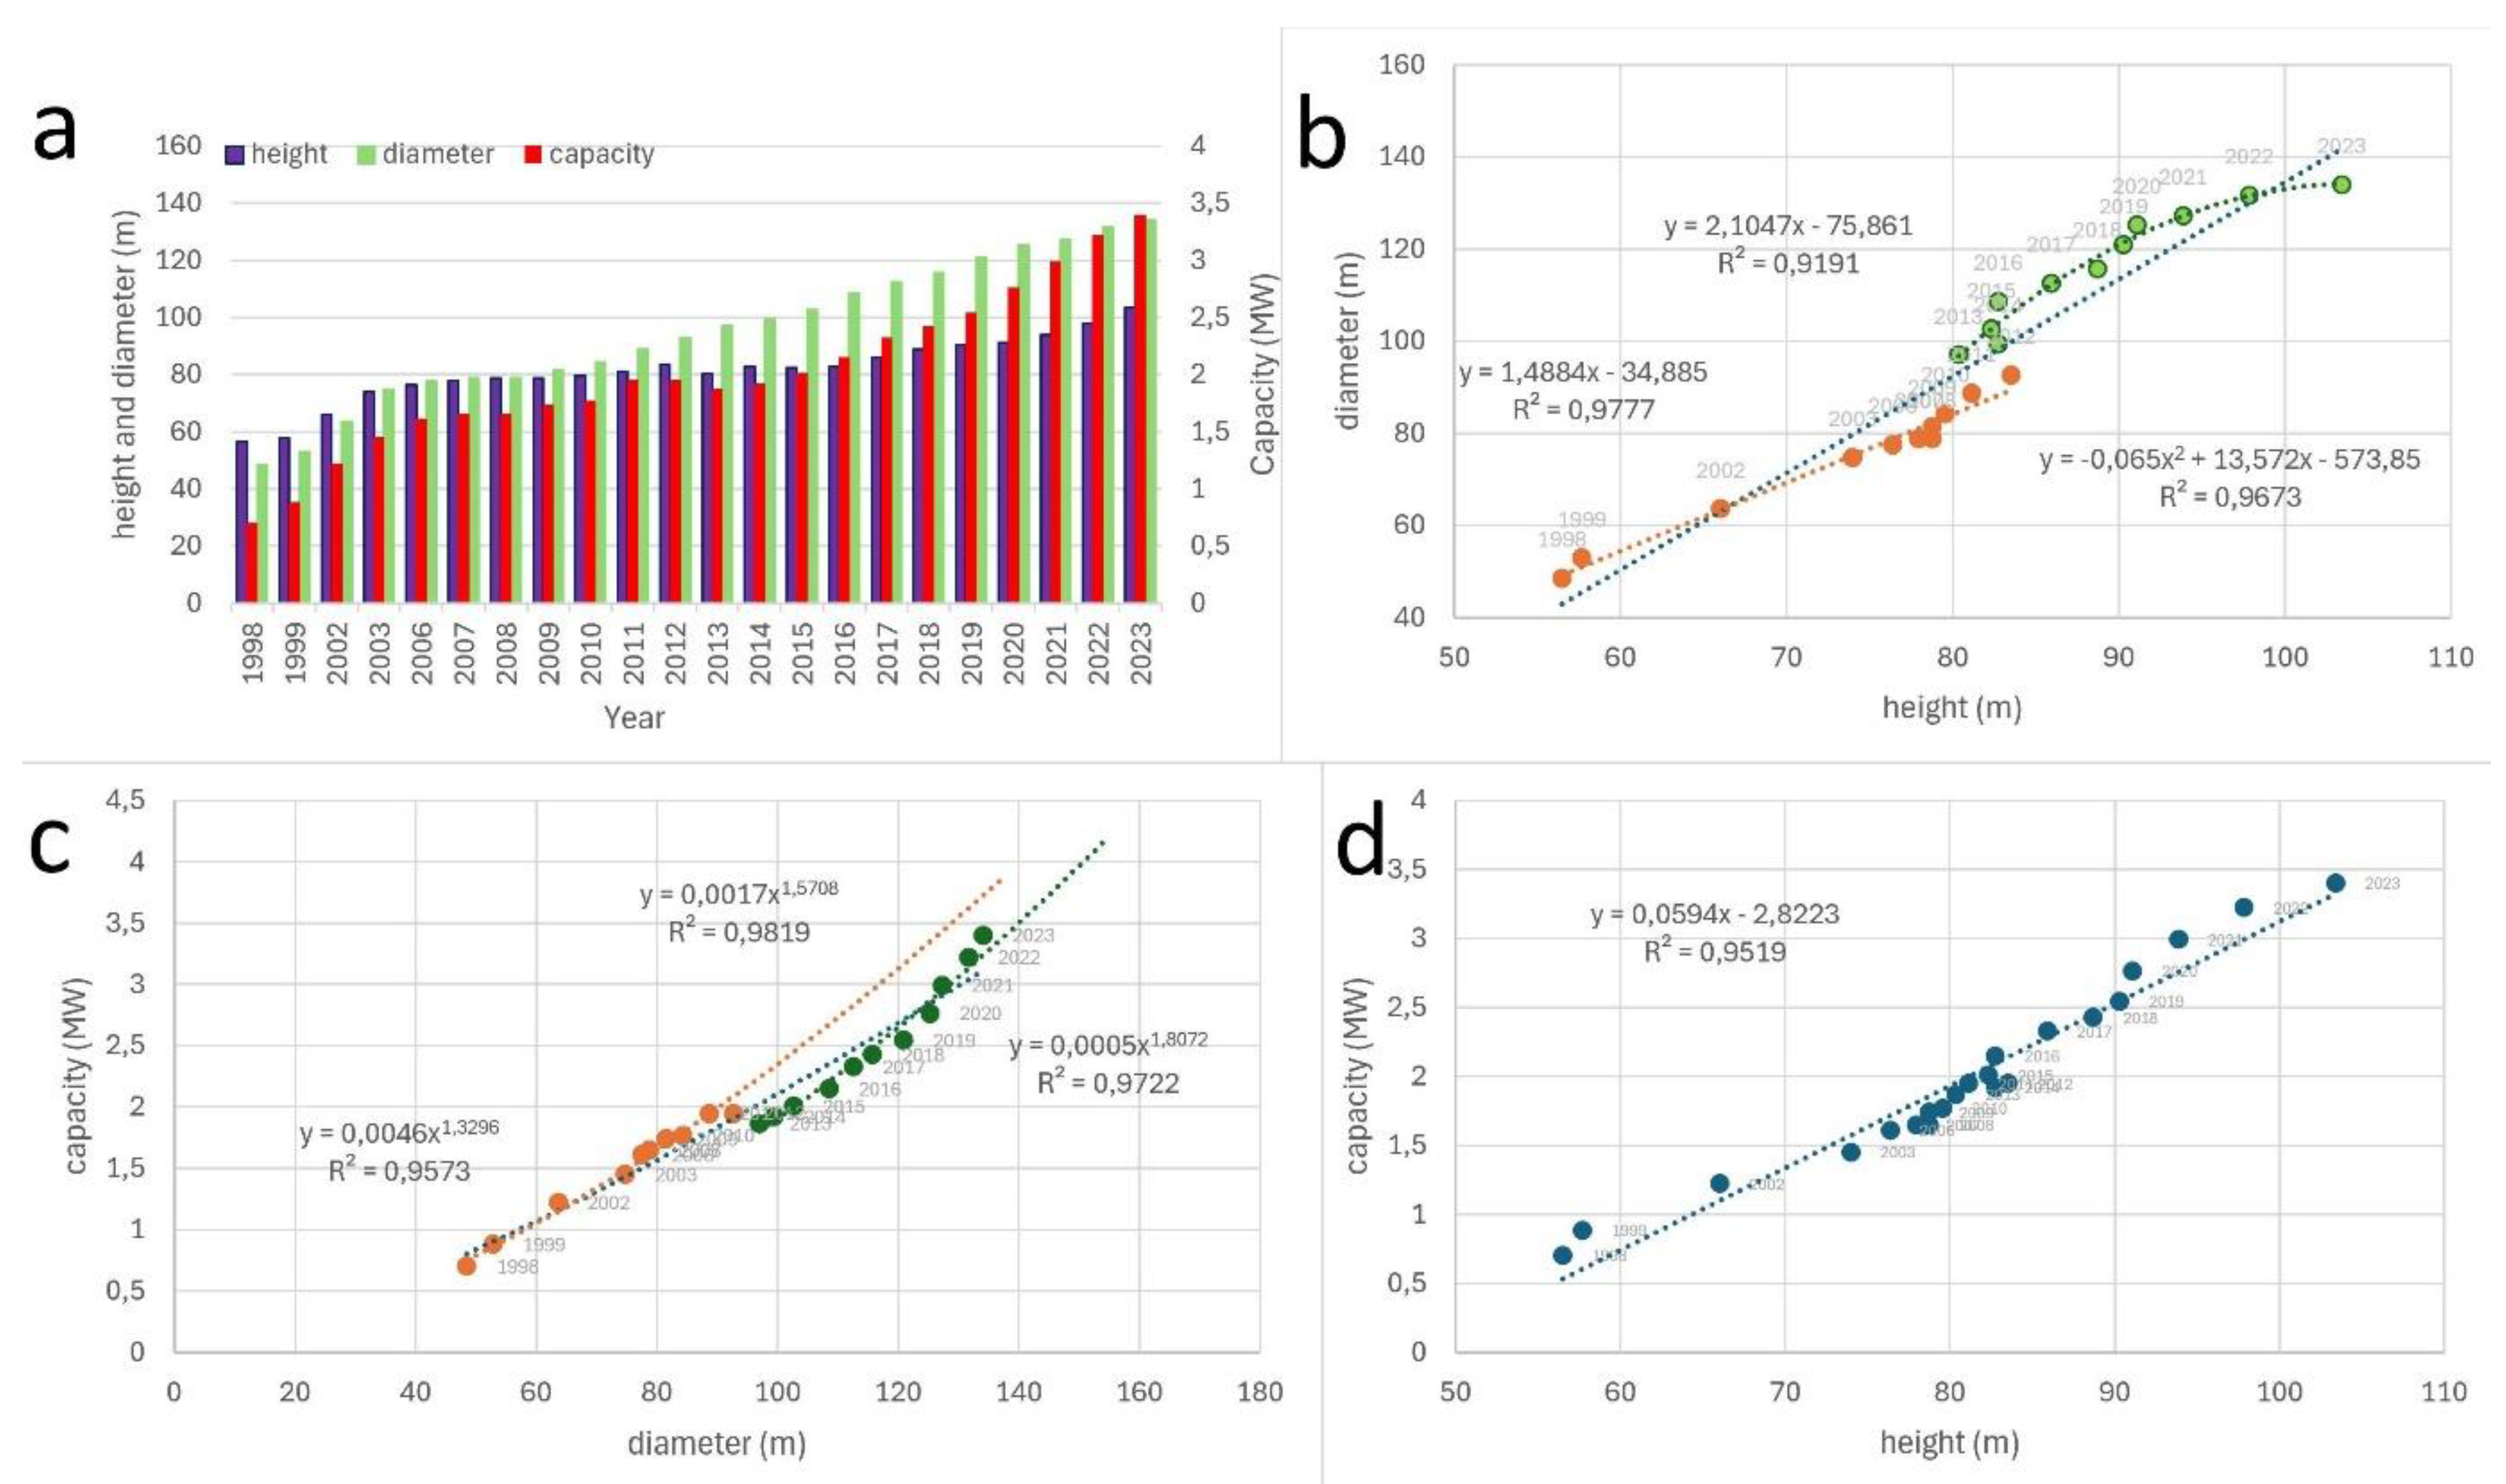
If the generator is not the main factor influencing the maximum rotational speed in relation to wind speed, what else might be involved? Comparison of the characteristics of different types of wind turbines from various manufactures is valuable. A historical overview is presented in Figure 1a, below, which shows nameplate capacity, rotor diameter and hub height for all the turbines installed in the USA averaged on a yearly basis. This figure shows a steady, yearly increase in rotor diameter (fit close to expected square power) and, to a lesser degree (linear fit), hub height as explainers for power level (Figure 1c,d). The relation between diameter and hub height is complicated, as shown in Figure 1b. No information about sound power level was present in this database. This makes a comparison challenging, due to the limited availability of sound curves in the public domain. The available information is often measured under ideal conditions (neutral atmosphere)15, which limits the applicability of the LAeq curves versus wind speed for accurate, real world calculations of the total noise exposure (For vertical wind speed distributions see van den Berg 2004(G. P. Van Den Berg 2004)).
Figure 1.
a: Average turbine hub height, rotor diameter, and nameplate capacity for all US land-based wind projects, data digitized and adopted from the Land-Based Wind Market Report: 2024 Edition 16; b: turbine height vs rotor diameter history, two sub populations can be identified with a break around 2012. The three regression lines give the best fit, with the middle one the lowest fit for the entire set; c: diameter vs capacity, also in this graph a clear breach in the trend around 2012, left regression for the entire set; d: height vs capacity, showing a good linear fit.
When we make this comparison, it is striking that almost all of the larger wind turbines installed in the Netherlands, have an LAeq of 106 dB(A), regardless of their height, construction type, hub height or blade length. A different picture can be found in a presentation of Oerlemans (Stefan Oerlemans and Fuglsang 2012). In this presentation, the various parameters are presented in graphical form17. The graphs in the preprint suggest there are significant differences in parameters for turbines up to 3 MW compared to more powerful models. However, these graphs do not account for all interactions between wind turbine parameters. Specifically, the relationship between rotational speed and rotor diameter, which is equivalent to swept area per min, is missing. This relationship is crucial for comparing energy production across different turbine models at maximum windspeed. As an alternative to Figure 4, the following graph is presented, using digitized data from Figure 4 of the preprint, recalculated to show the swept area per minute.
Relation of SPL with Hub Height
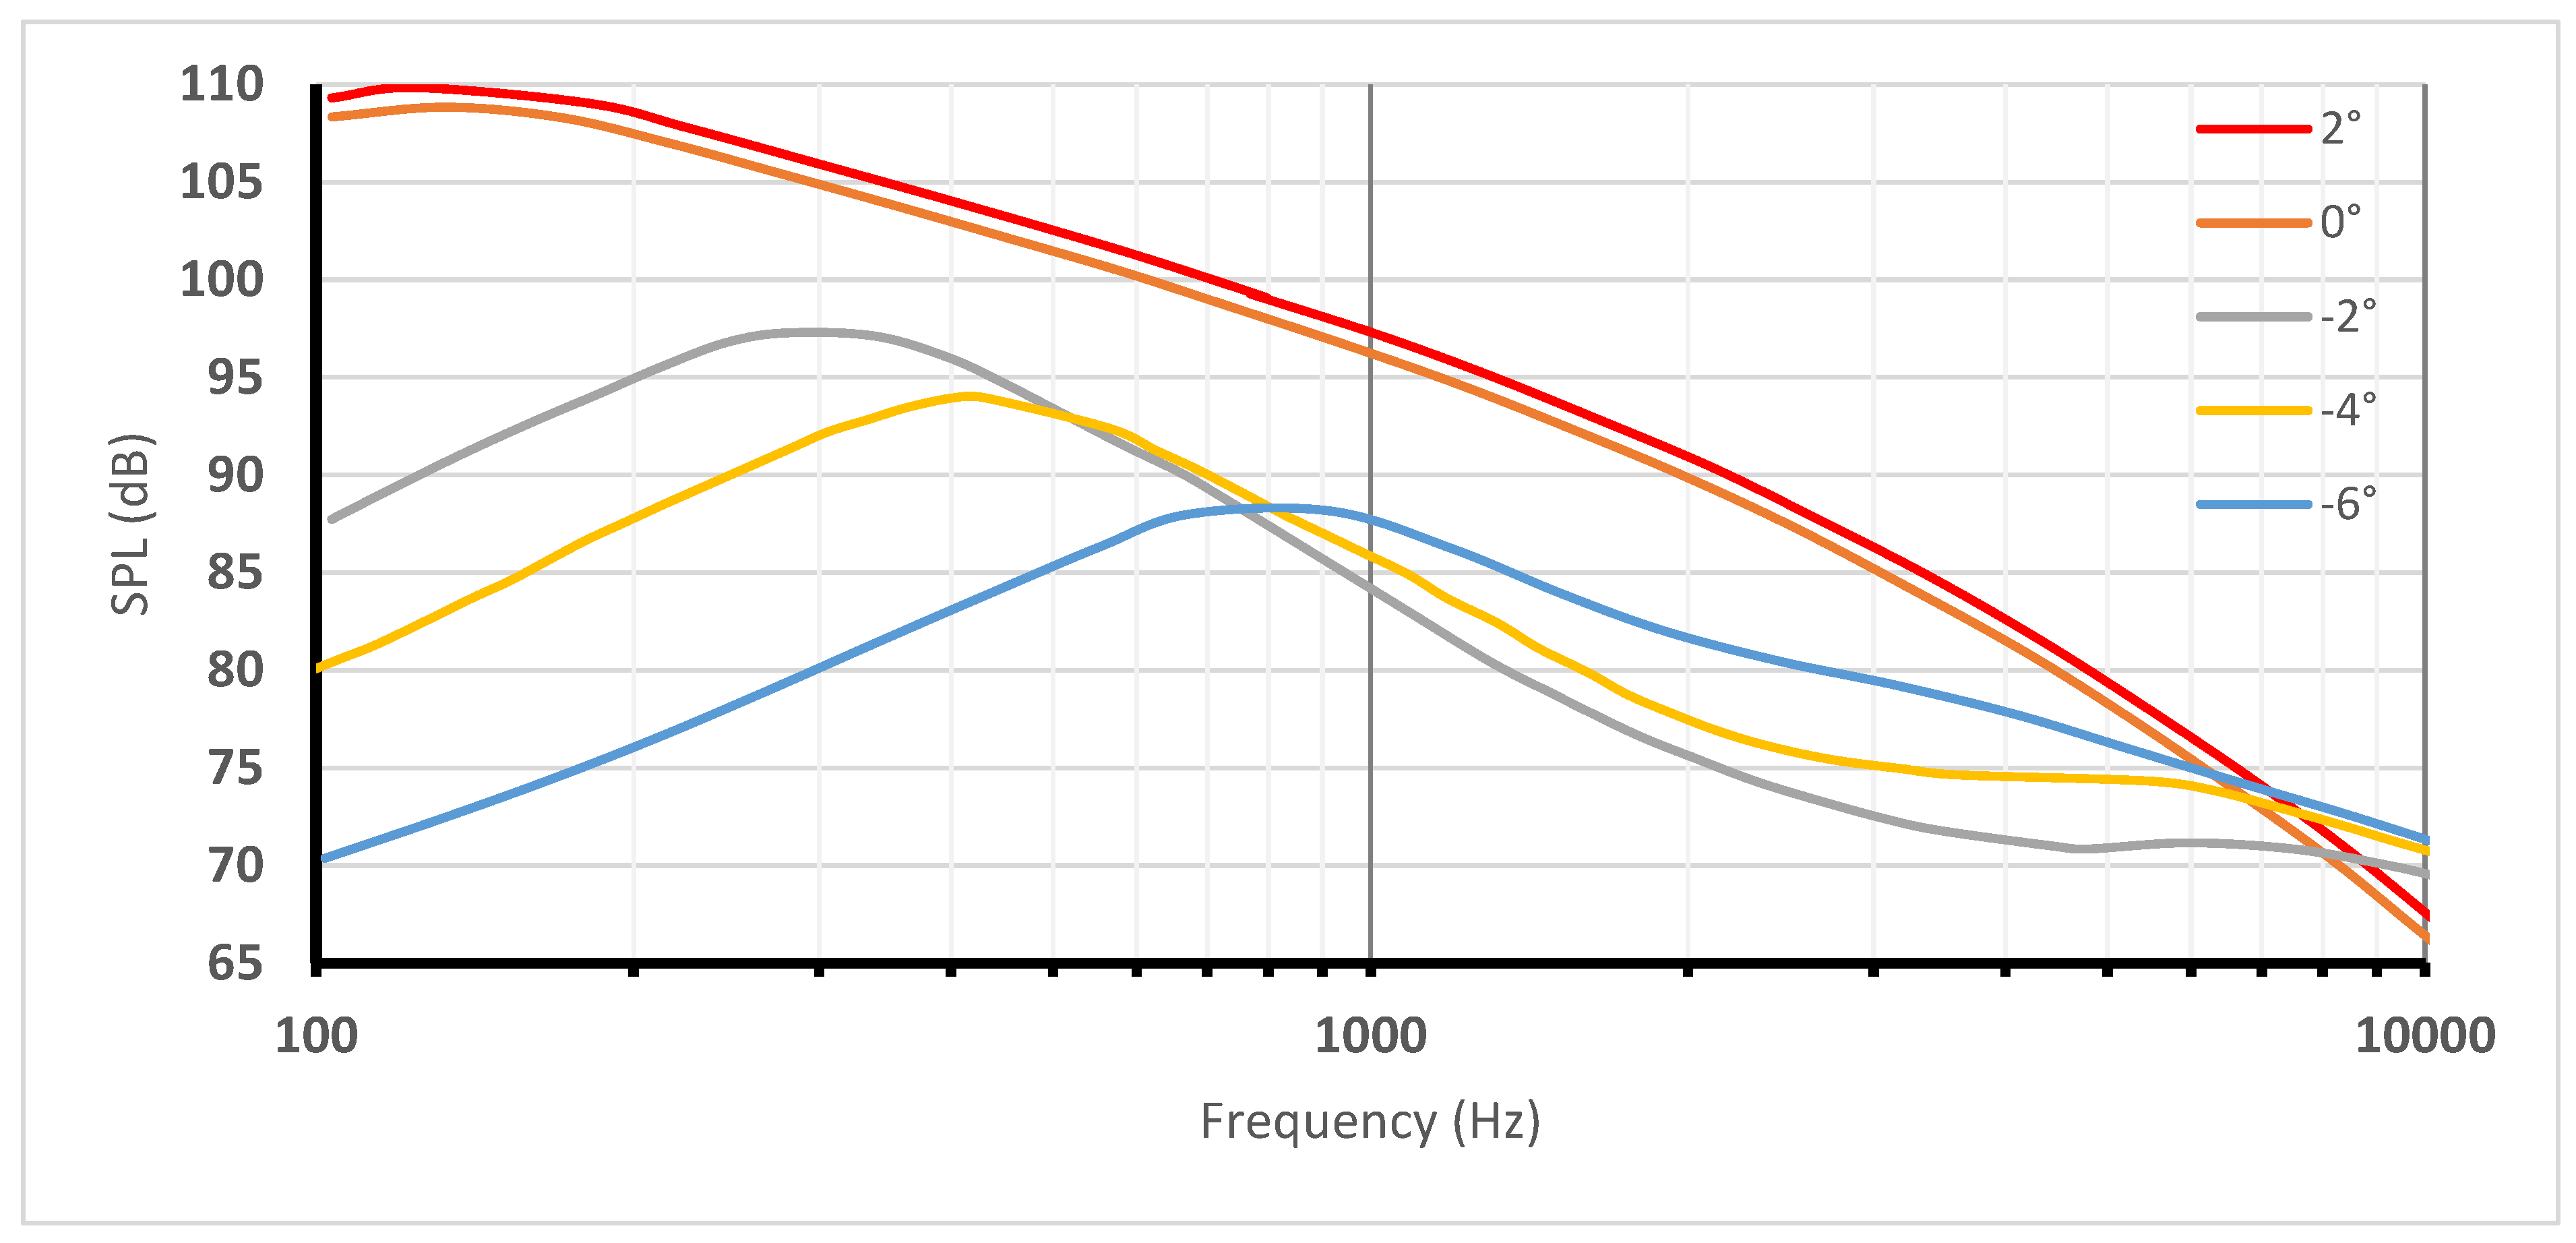
The authors seem to ignore the effect of hub height on SPL levels as experienced at ground level. From preprint Figure 1, it is obvious that hub height has increased over time with a variable rate, but now at a steady rate. This has of course a relation with rotor diameter, since a larger rotor requires a higher hub height. But there is also the desire to exploit the higher wind speeds at higher layers of the atmosphere (Vasel-Be-Hagh and Archer 2017). A simple logarithmic relation18 has been found between the velocity at a higher level as compared to the wind speed at 10m depending on the meteorological conditions. All data regarding noise levels from wind turbines (the reference curves for calculating the yearly noise production) are done in a neutral atmosphere. The effect of higher windspeeds is that the yearly frequency distribution of windspeed classes shifts in its entirety to higher wind speeds, which results in increased yields of power. And thus, more noise. An additional feature of increased hub height in combination with a larger rotor diameter is that the tips of the rotating blades pass through horizontal layers with different windspeeds. The angle of attack of the blades is optimized for a maximum yield of energy, which is a setting that is not optimal for a large part of one rotation. The stress that this imbalance of the angle of attack causes, will result in a varying strain during the rotation on the blades, with increased noise as a consequence (Bolin 2011). Increasing values of the angle of attack leads to (pre)stall moments in the upper part of the rotor and extreme increments of low frequencies (Stefan Oerlemans 2015), as shown in Figure 2. The situation becomes even worse when the atmosphere is not in a neutral condition (Zajamšek et al. 2016).
Figure 2.
Influence of angle of attack(colors) vs noise spectrum and SPL. Adopted from Oerlemans 2015 (Stefan Oerlemans 2015). The 2-degree graph has been shifted up by 1dB for clarity.
Figure 2.
Influence of angle of attack(colors) vs noise spectrum and SPL. Adopted from Oerlemans 2015 (Stefan Oerlemans 2015). The 2-degree graph has been shifted up by 1dB for clarity.
Then the vertical wind speed profile will show layers with different wind speeds, resulting in a (pre)stall inflow on the wind turbine (Ghaisas et al. 2017). As a result, LF and infrasound production can dramatically increase. Since these situations mostly occur during the night, annoyance levels can abruptly increase due to this effect. Moreover, stable atmosphere situations often result in a wave guide like phenomenon, which in conjunction with the wake vortex, can guide infrasound and LF over considerable distances, (channeling), up to 90 km (O. Marcillo et al. 2015) and can even be detected in the seismic record (O. E. Marcillo and Carmichael 2018).
Figure 3.
Rotor swept area (vertical, m2) per min (Rotor area * rpm) versus rotor diameter (horizontal, m). Data source was Figure 4 vd Berg et al 2024 (F. G. P. Van Den Berg et al. 2024).
Figure 3.
Rotor swept area (vertical, m2) per min (Rotor area * rpm) versus rotor diameter (horizontal, m). Data source was Figure 4 vd Berg et al 2024 (F. G. P. Van Den Berg et al. 2024).
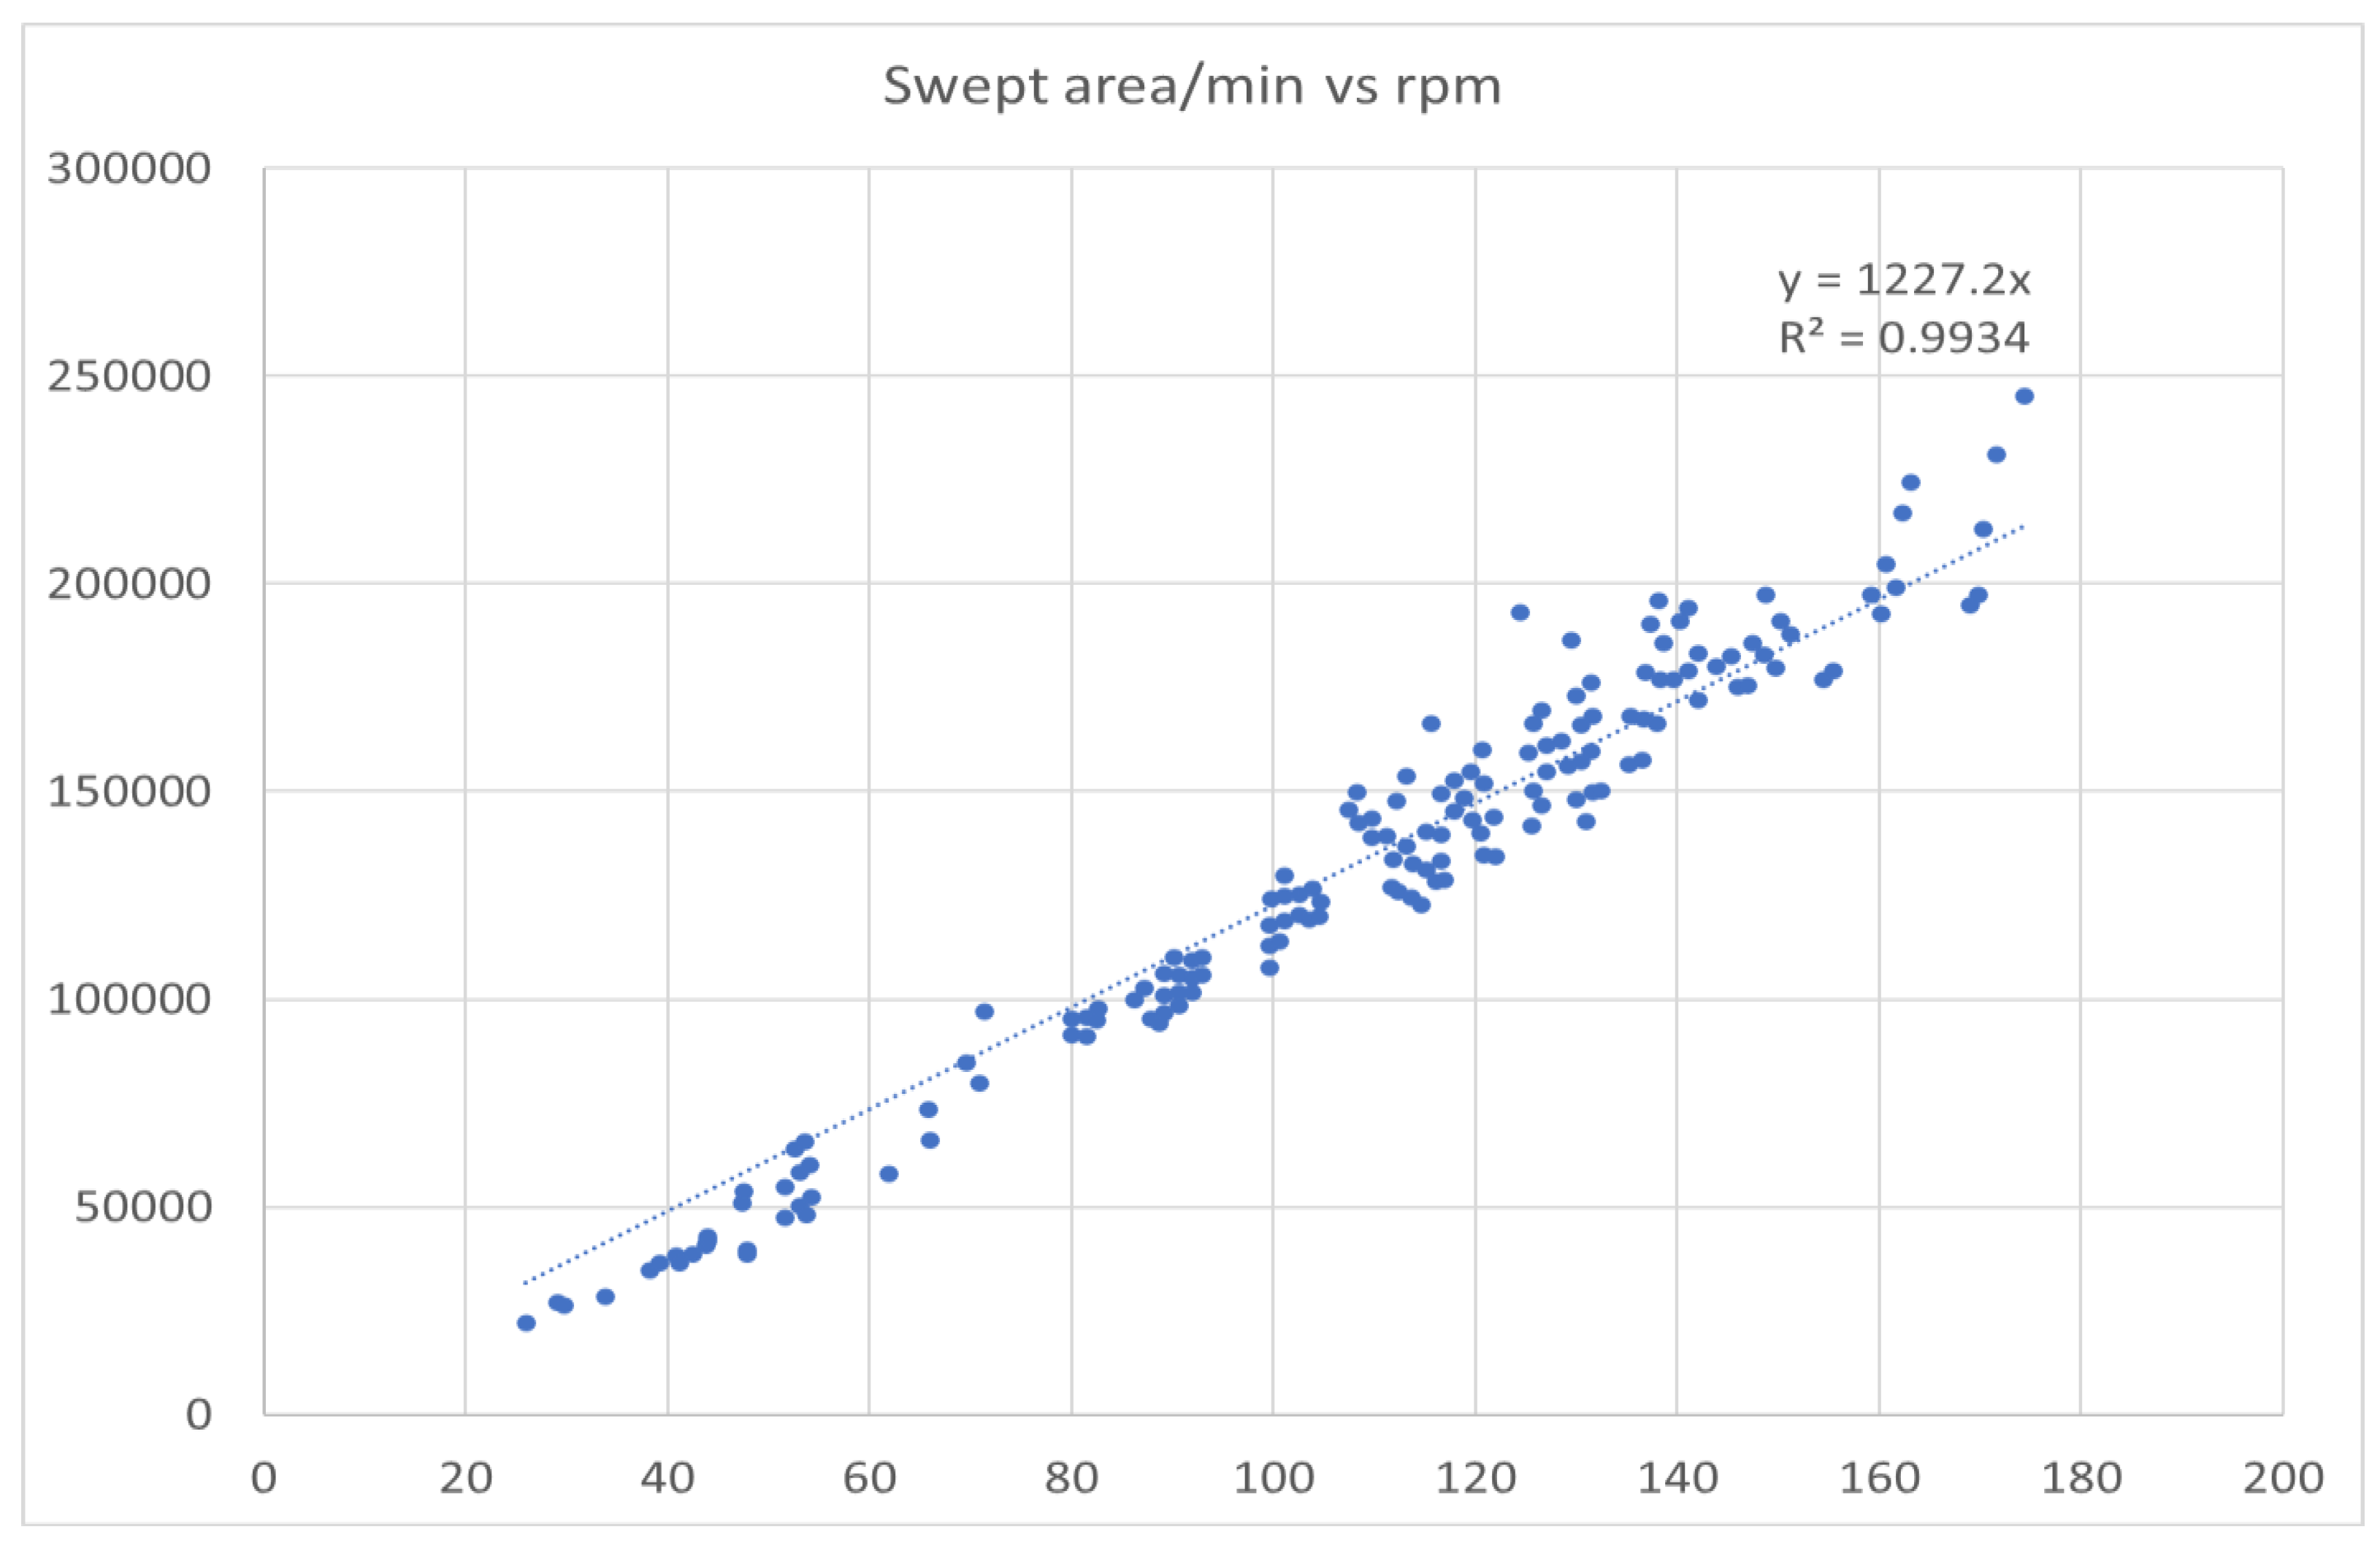
This graph (Figure 3, above) demonstrates a linear relationship between RPM and swept area per minute, suggesting a constant tip velocity for all turbines at their maximum power output. This implies that an additional parameter is limiting the yield increases typically expected with larger rotor diameters.
Figure 4.
Tipspeed (vertical, m/s) as calculated (rpm* π*d/60) from digitized values from Figure 4 ((F. G. P. Van Den Berg et al. 2024) as function from rotor diameter (horizontal, m). The red and black ellipses indicate two putative different turbine types. The green ellipsis is the population analogous to the two populations as identified in Figure 1.3 from Luesutthiviboon 2022.
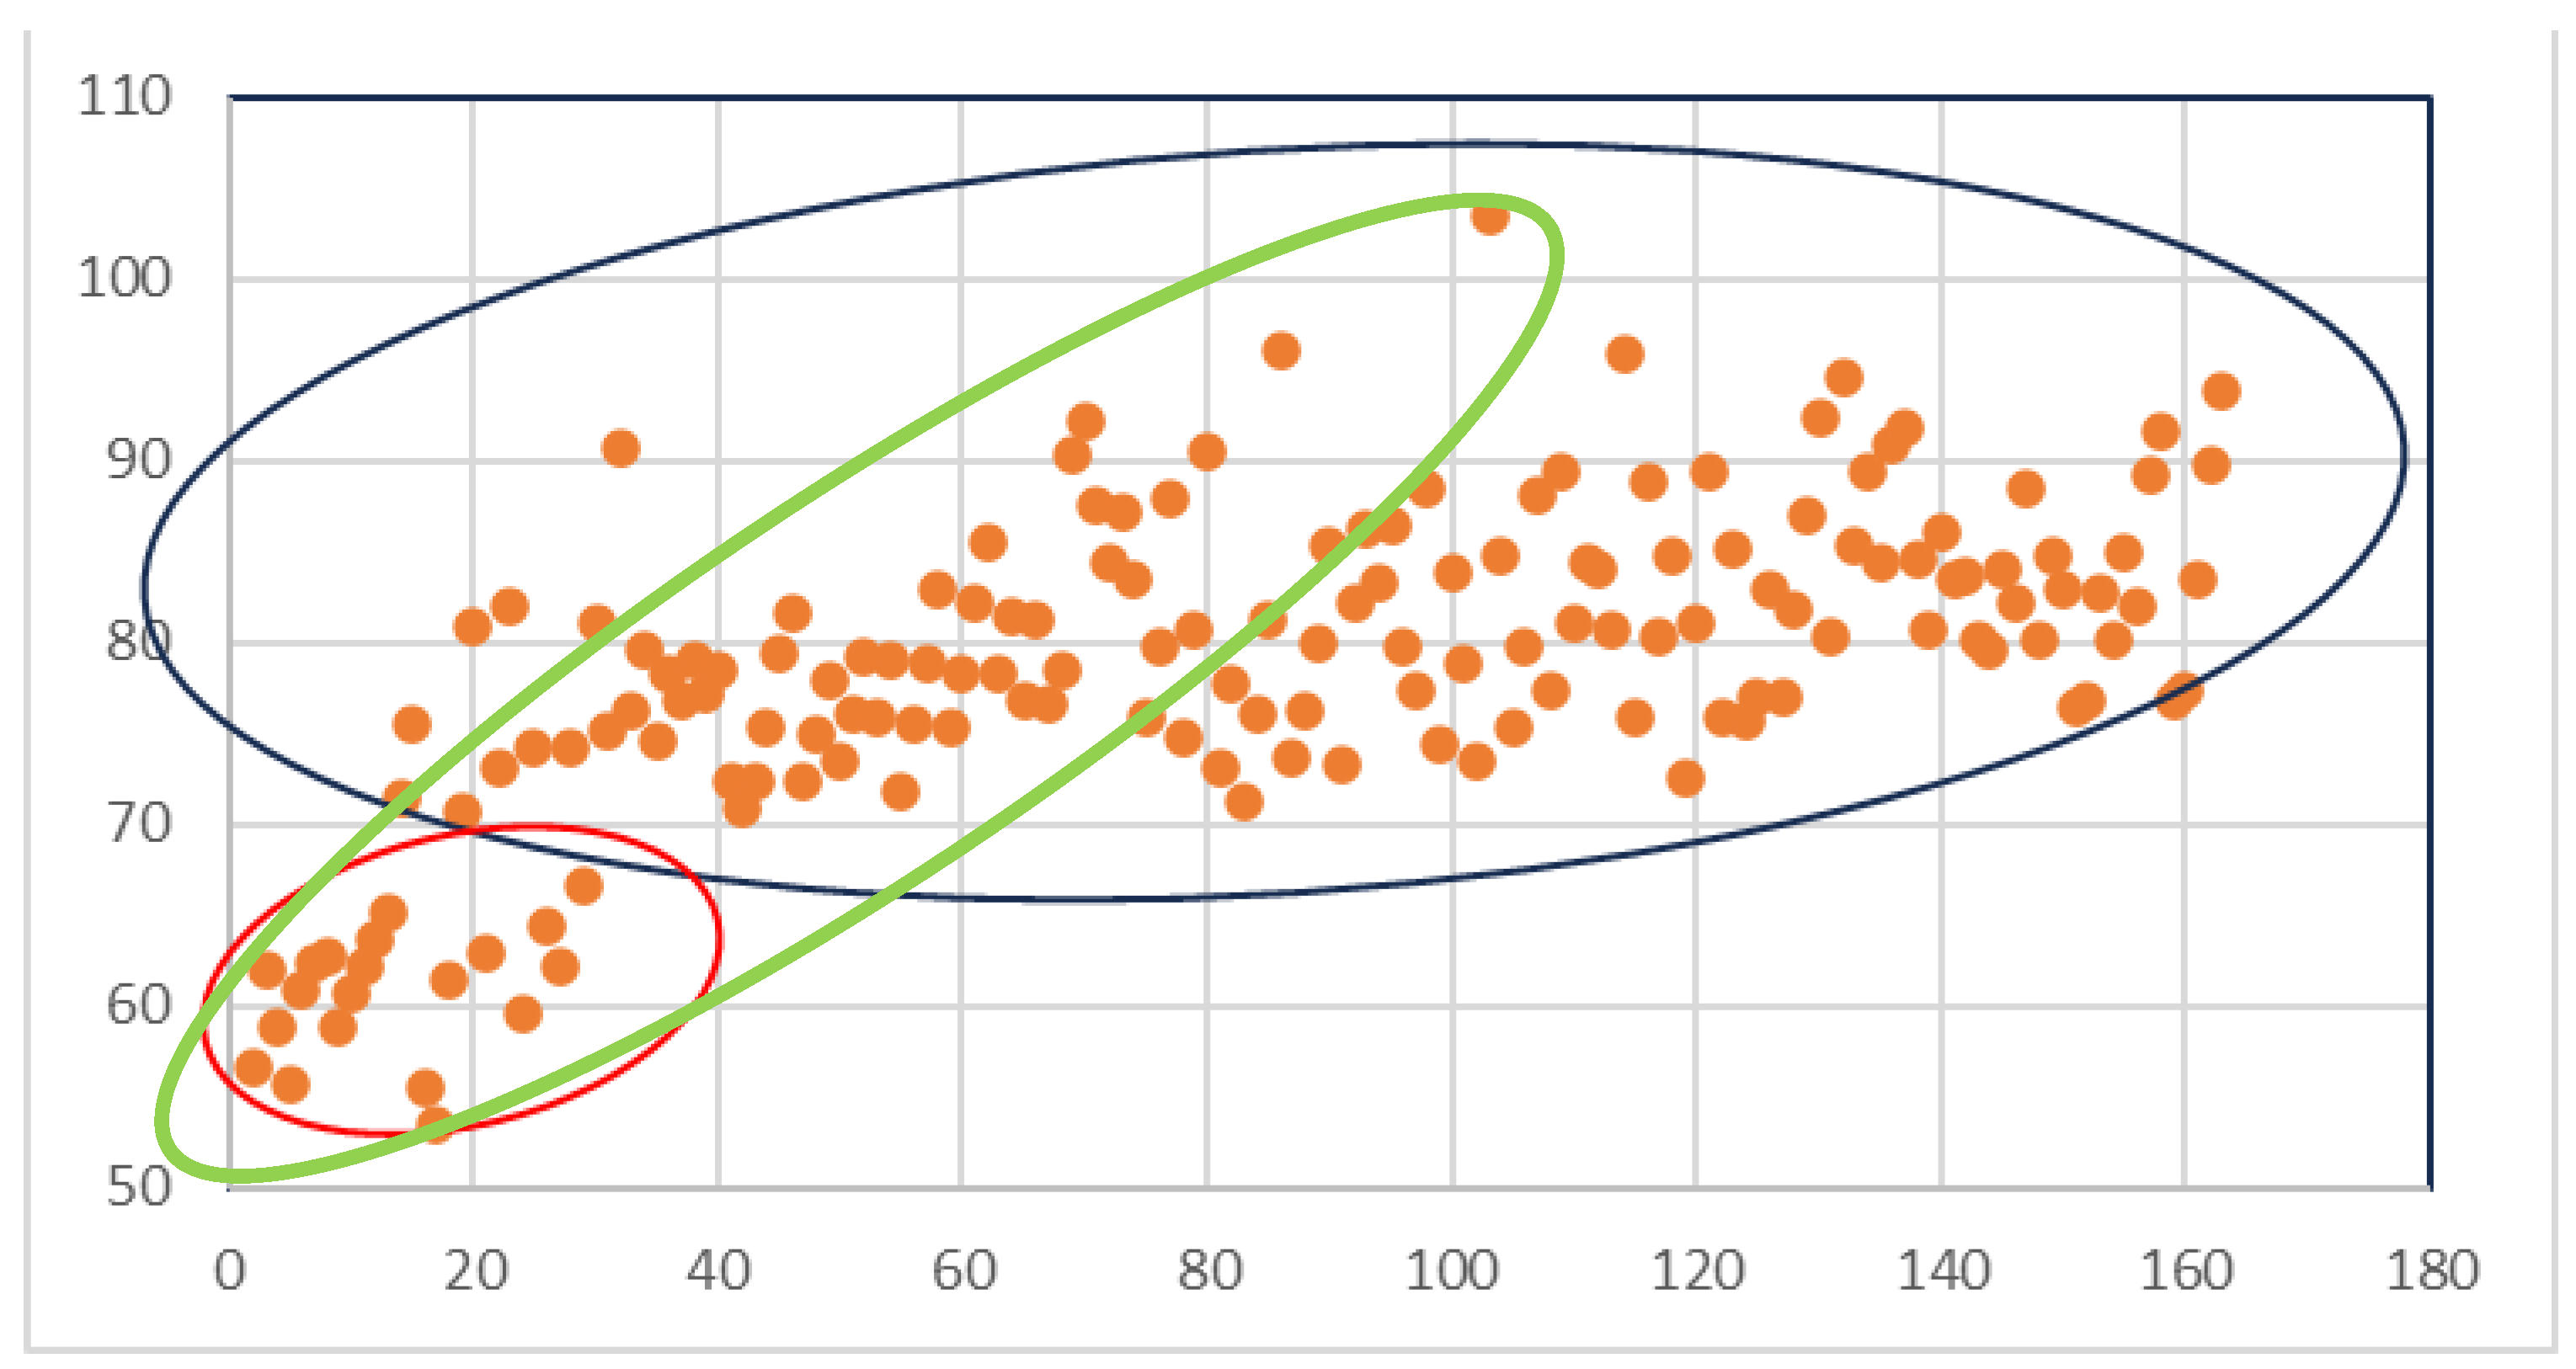
When RPM is plotted (Figure 4, above) against the calculated tip speed (using the digitized values from Figure 4 (F. G. P. Van Den Berg et al. 2024)), a completely different pattern emerges. The two ellipses separate the data points into two distinct groups with contrasting behavior: the red ellipse shows a slight increase of tip speed with increasing rotor diameter, while the blue ellipse reveals very little, if any, increase in tip speed with larger rotor diameters19. The green ellipsis is the population of wind turbines, as suggested in Figure 1.3 from Luesutthiviboon 2022. These turbines are characterised by a higher rpm and smaller rotor diameters. As was previously mentioned, LEE is a major limitation for the development of larger wind turbines and is directly related to tip speed (Verma et al. 2021)(Shankar Verma et al. 2021). This observation suggests that the main motive for speed limitation is damage prevention and not noise reduction.
As previously noted, a major limitation of this preprint is the absence of data segmentation, which combines data from various turbine types into a single category. This disregard for significant differences between turbine types obscures the interpretation of the data and leads to erroneous conclusions. The data itself suggests alternative approaches to analysis, such as multivariate data analysis, which could result in a clearer picture, with different conclusions for different types of wind turbines. With access to the complete dataset in the restricted database, a principal component analysis (PCA) could have revealed important interactions between windturbine types and noise production across different rotor diameters. However, this would require access to the original data, as digitization the presented graphs alone , does not allow to establish an accurate relation between the data in the different plots. Such an analysis would also require advanced data processing, which is beyond the scope of this Comment. The approach chosen for this preprint of FvdB is therefore inadequate, and combined with the restricted access to the underlying database, the outcome is inconclusive.
Sound Power Spectra
This section of the manuscript is problematic. It defies common sense to take the data from 123 turbines, average them, and present the resulting spectrum as representative of individual turbine spectra. A close examination of the graphs reveals substantial variations between individual turbine spectra, with difference of 19, 13, 12, 10, 13, 16, 18 and 27 dB between the minimum and maximum levels for across the respective octave bands. A multivariate analysis would have been a more appropriate approach, allowing identification of distinct turbine types and any effects of serrations on the frequency spectrum. This method would better demonstrate spectral effects of serration than Figure 10 currently does.
The normalization shown in Figure 9B is misleading, as it obscures the large variation in baseline sound power levels across different turbine types, which spans 16 dB at 1 kHz in Figure 9A before normalization. Additionally, the spectral range itself is remarkable: data for the commonly included 31.5 Hz octave band are omitted, in contrast to Figure 10, which shows the data from Sondergaard (Søndergaard 2015) and Møller and Pedersen (Møller and Pedersen 2011) that do include this band20. This omission is significant, as serrations have been reported to increase sound levels in the lower octave bands, as well as higher octave bands (van der Velden & Oerlemans, 2017) . As for relation between level of LF and sound power, they show that with increasing electrical power, the contribution of LF strongly increases21, up to 10 dB in the 31.5 Hz octave band.
Effect of Serrations on Sound Power Level
This paragraph, despite having its own section and title, does not meet expectations. It appears to be based on a different dataset or processed differently compared to the figures in the previous section. The spectral resolution is inconsistent, and error bars are suddenly introduced. Why? The likely explanation is simple: the database used for this paper does not contain detailed spectral information. As mentioned in the previous section, only octave-band spectra are available, starting at 63 Hz. Yet in this paragraph, data are presented starting from 21.5 Hz in third-octave bands. The preprint presents serrations as a universal solution for the reduction of tip velocity related wind turbine noise. This has been confirmed in wind tunnel experiments (Llorente and Ragni 2020) 22. These experiments revealed a power increase of about 1% in combination with a noise reduction of 3 dB. Some publications find completely diverging sound profiles (S Oerlemans 2011), with (much) higher levels of noise in frequency bands below and/or above the 200 to 1000 Hz band that is mainly presented in the preprint. However, the serrations have also severe repercussions on the aeroacoustic and aerodynamic performance of the wind turbine and lead to increased ultimate and fatigue loads, which in turn contribute to early wear of critical components of wind turbines.
Effect of Noise Mode
This paragraph is perplexing. It presents the use of low power settings in the SCADA system as if intended to reduce the sound annoyance for the residents in the neighbourhood of wind turbines. In reality, however, the purpose is quite the opposite: it is intended to maximize energy yield within legal limits by compensating for power reductions at certain times with increased production. Noise mode is effectively a method to shift production to times when, wind speeds and market prices are more favourable for revenue. Oerlemans 2012. It essentially guarantees that the maximum allowable soundpressure over the year will be fully utilized. All measures are designed to maximize financial yield. In this respect the nomenclature ‘noise mode’ is misleading. No data of noise spectra is available and SCADA data are not made public. If the noise mode operates by changing the angle of attack overall noise may be reduced but low frequencies are increased. So effectively the noise may be heavily increased and reveals a opposite meaning of ‘noise mode’. Ignoring this knowledge, vd Berg et al presents the data of 16 turbines as conclusive.
Effect of Serrations and Spectra Content at Residential Locations.
This entire section is uninformative. If a turbine does not emit sound at a particular frequency, there will be no effect at residential locations. Consequently, this section implicitly admits, that serrations do have an impact at residential locations, particularly in the lower-frequency regions of the sound spectrum. This likely explains why the lower-frequency octave bands were excluded from the comparison in previous sections. The authors neglect existing knowledge of propagation effects as a result of meteorological variables and the very existence of the turbine wake. In this respect the presented ISO-9613 calculations are pointless.
Discussion and Conclusions
The final words in the discussion of vd Berg:” Social resistance already has a major influence on the expansion of onshore wind energy and can only be addressed successfully if authorities, developers and operators include residentials’ interests in the planning and operation of wind farms [14].”
The authors of the preprint fully neglect their own responsibility to acknowledge the residential interests by not including scientific knowledge of the annoying factors of wind turbine noise in the analyses. The only way to investigate trends in wind turbine sound power is by including these insights. Without this all conclusions of the article are missing the point.
It is unclear why this section appears to contradict the main arguments of this preprint. The real conclusion should be as follows:
- Lden is an unsuitable metric for assessing annoyance
- dB(A) is an unsuitable metric for assessing annoyance
- Any measure based on averaging is unsuitable for assessing annoyance
- AM and tonal noise are the main predictors of the level of annoyance, with LF and infrasound to a lesser degree. Tip related noise is only of limited importance for the prediction of annoyance.
- Economic factors, not the annoyance experienced by local residents, govern wind turbine operational parameters.
Error Progression Analysis
An error progression analysis was conducted on several formulas used in this preprint. Issues arise because many of the so-called ‘data’ points are actually model outputs, not empirical data, yet they are treated as ‘real values’ without accounting for error margins. Examples include windspeed at the turbine location, wind speed at hub heigth, one-dimensional models for surface roughness around the turbine site and changes in atmospheric stratification by time of day and season. All these values are model-derived, and are used without a proper consideration of their reliability margins, let alone their uncertainties. On the contrary, model outputs are often presented as if they were actual data, though they are not. Adjusting a single parameter within the model can drastically alter the model’s outcome. None of these aspects are accounted for in the preprint.
Concluding Remarks
This rebuttal demonstrates that the authors’ claims are not consistently supported by scientific literature, and significant dissent exists regarding several topics presented by the authors as being established truths.
Specific Remarks for the Situation in The Netherlands
Another noteworthy limitation of the preprint is that the study is contextualized within the regulatory framework of the Netherlands, specifically regarding the replacement of smaller turbines (80m hub height) with large models (>120m hub height). In the Netherlands, wind turbine noise as calculated at the walls of residential dwellings is limited at a maximum permissible level of 47 dB(A) as Lden (day-evening-night level). Lden incorporates a penalty system that accounts for sound production during different times of day (D+0), evening (E+5) and night (N+10)23. This regulatory framework is applied as an annual average, meaning that, while there are penalties for evening and night related noise, instantaneous noise levels can exceed 47 dB during any period (be it day, evening or night) without a consequence, as long as the annual average (including penalties) is 47 dB(A) or lower. This regulation makes it possible to fill days with insufficient wind (windspeed below cut-in or higher than cut-off) with excess production on other days. Because all calculations are, as in the preprint, based on the source power standard IEC 61400-11 and propagation calculations after ISO-9613, maximum sound levels are supposed to be less than Lden – 3 dB(A). In reality, the maximum sound levels are much higher especially for low frequencies as is the resulting annoyance. This is strongly related to hub height. In the Lden systematic these extremes will not be detectable due to averaging.
Another issue in the Netherlands are plans to replace the currently installed turbines with hubs of 80 to 100m by (much) larger versions, with tip heights up to 280m. The suggestion is to put these new turbines on the locations of the currently installed ones, because this will avoid new permission requests, since they are simple upgrades of the existing ones. The authors are involved in the planning of new legislation. The preprint is an important tool to gain political acceptance. It suggests that the Lden systematics is sufficient to guarantee a safe environment for neighbors when large turbines are introduced. This rebuttal shows this is not the case. As Hoen et al (Hoen et al. 2023) point out, larger turbines require a larger distance between individual turbines to avoid the mechanical stress caused by the vortex of the neighboring turbines, and advises a distance increase of 60% for the example in his paper, with a 30% increase for the setback to dwellings. Therefore, the number of installable turbines must be reduced to 30% of the previously installed number of turbines. Turbine spacing and hub height is the topic of a large number of recent publications (e.g. (Vasel-Be-Hagh and Archer 2017), (Parada et al. 2017), (Azlan et al. 2021)(Gao, Yang, and Lu 2016), (Archer and Vasel-Be-Hagh 2019), which underscores the need for careful planning when replacing smaller turbines by higher ones with more power.
Furthermore, the promotion of onshore wind turbines is often framed as a climate benefit. However, the underlying motivation for the installation of onshore wind turbines is predominantly economic: given the financial interest of the authors in the expansion of onshore wind turbine power, stemming from their affiliations with consulting firms involved in various aspects of wind turbine regulation, this preprint raises concerns about its objectivity and scientific validity. It may be more appropriately viewed as an “advertorial” rather than a purely scientific publication.
Conflicts of Interest
The author declares no conflicts of interest
| 1 | |
| 2 | Hoen et al. state in their Introduction:” over the last decade, average wind turbine sound power levels (referred to as SWL) have steadily increased” and have presented this development in Figure 2, using data from three manufacturers for the period 2006 up to 2020. |
| 3 | Luesutthiviboon, Figure 1.3, identifies two different types of turbines, each with a high correlation between rated power and sound pressure level, but with different regression parameters. Current day designs fit well within the segment of 90’s and 00’s design in this plot. |
| 4 | Wagner (Wagner, Bareiß, and Guidati 2012) provides a diagram (Figure 4.1, page 69) which shows the contributions of the various parts of a wind turbine to the total noise level together with the ways of noise transmission. It shows that besides blade related noise, the gearbox is the second major source of sound, and the major source for tonal noise, as presented in Figure 4.2 and 4.4. Direct drive turbines lack a gearbox, so produce less tonal noise: their tonal noise is mainly caused by turbulence by the blades in dynamic stall conditions. |
| 5 | In this paper, authors express (as early as 2004) their amazement about the (much) higher level of annoyance of wind turbine noise, compared to aircraft, traffic and railway: respectively, 37, 52, 57 and 67 dB(A) for 10 % highly annoyed and mention the swishing, whistling, pulsating/throbbing and resounding characteristics of wind turbine noise as possible explanations. These sounds are related to tonal and AM noise. |
| 6 | Nguyen et al state: “Given that ‘‘swish’’ noise is dominant at 500 Hz and that enhanced amplitude modulation and tonal amplitude modulation can occur at much lower frequencies, the overall A-weighted AM depth may be poorly correlated with human perception and is likely to substantially underestimate the perceived AM depth.” |
| 7 |
https://doi.org/10.1016/j.apenergy.2017.03.089 (accessed 20122024). |
| 8 | In these papers, it is stated that AM is one of the most annoying properties of wind turbine noise and is often referred to as the major sleep disturbing noise component especially in the low frequency region. |
| 9 | See Nejad et al, Figure1. for a schematic diagram. |
| 10 | Erosion increases with rain impact velocity to the power 6.7 according to the Springer model Verma et al., 2021; Shankar Verma et al.,2021), which is why tip velocity is mostly around 75 m/s. |
| 11 | Zhang et al state: “LEE also leads to reduction in power yield and a higher noise production due to impaired laminar flow over the damaged area of the blade.” In fact, this phenomenon has been used to detect early signs of LEE as a diagnostic tool. |
| 12 | Table 4 from Shankar Verma et al 2021 gives the simulated outcomes for hypothetical wind turbines at every location of the KNMI weather stations, using their daily wind and weather data for modelling weather induced damage. |
| 13 | Typical example: https://en.wind-turbine-models.com/turbines/427-enercon-e-115-2.500 (down load 08122024) |
| 14 | Typical example: https://en.wind-turbine-models.com/turbines/1183-enercon-e-126-ep4 (download 08122024) |
| 15 | Neutral, stable and unstable are used to describe the wind speed as function of height. The relationship is defined by the power law exponent, defined as: α= ln(Vh/Vref)/ln(h/href), with α<0.2 as unstable, 0.2 < α <0.28 as neutral and 0.28< α< 0.41 as stable |
| 16 | |
| 17 | See footnote 16. |
| 18 | See footnote 16. |
| 19 | It is tempting to correlate this graph with graph 1.3 from Luesutthiviboon. This the motivation for the (speculative) green ellipsis in Figure 3, which is only based on a visual evaluation of the digitized data from the graphs in the preprint. |
| 20 | In Møller and Pedersen, 2011, the curve from FvdB is compared to their own values (Figure 15) and this shows a difference of 4 dB(A) for the 31.5 Hz octave band for turbines <2MW compared to turbines with >2MW. All other values are within close fit of each other. |
| 21 | Figure 19 and Table III show that the contribution of low frequencies strongly increases with electrical power, reaching an absolute level of 89 dB for a 10MW turbine in octave band 31.5 Hz, which is 10dB higher than a 2.5 MW turbine in the same band. |
| 22 | See Llorente and Ragni 2020. They state in their conclusions: “The analysis of the experimental data on a real wind turbine shows higher power curve due to the presence of the trailing-edge serrations that consequently give more production than theoretically expected. This significant power increment will cause higher loads on the wind turbine that reduce its lifetime. A more detailed study on real wind turbines focusing on load analysis at different parts of the machine should be done to clarify the impact of the trailing-edge serrations on the loads and lifetime of a real wind turbine.” |
| 23 | Only a few countries use Lden to regulate wind turbine noise. |
References
- Adams, Amanda S., and David W. Keith. 2013. “Are Global Wind Power Resource Estimates Overstated?” Environmental Research Letters 8 (1). [CrossRef]
- Archer, Cristina L., and Ahmad Vasel-Be-Hagh. 2019. “Wake Steering via Yaw Control in Multi-Turbine Wind Farms: Recommendations Based on Large-Eddy Simulation.” Sustainable Energy Technologies and Assessments 33 (June):34–43. [CrossRef]
- Azlan, F., J. C. Kurnia, B. T. Tan, and M. Z. Ismadi. 2021. “Review on Optimisation Methods of Wind Farm Array under Three Classical Wind Condition Problems.” Renewable and Sustainable Energy Reviews 135 (January). [CrossRef]
- Barlas, Emre, Wei Jun Zhu, Wen Zhong Shen, Mark Kelly, and Søren Juhl Andersen. 2017. “Effects of Wind Turbine Wake on Atmospheric Sound Propagation.” Applied Acoustics 122:51–61. [CrossRef]
- Berg, Frits G P Van Den, Erik Koppen, Jaap Boon, and Madelon Ekelschot-smink. 2024. “Development of Sound Power of Onshore Wind Turbines Including Its Spectral Distribution.”. [CrossRef]
- Berg, G. P. Van Den. 2004. “Effects of the Wind Profile at Night on Wind Turbine Sound.” Journal of Sound and Vibration 277 (4–5): 955–70. [CrossRef]
- Bolin, Karl. 2011. “Infrasound and Low Frequency Noise from Wind Turbines : Exposure and Health Effects,” no. September. [CrossRef]
- Conrady, Kristina, Karl Bolin, Anna Sjöblom, and Anna Rutgersson. 2020. “Amplitude Modulation of Wind Turbine Sound in Cold Climates.” Applied Acoustics 158:107024. [CrossRef]
- Gao, Xiaoxia, Hongxing Yang, and Lin Lu. 2016. “Optimization of Wind Turbine Layout Position in a Wind Farm Using a Newly-Developed Two-Dimensional Wake Model.” Applied Energy 174 (July):192–200. [CrossRef]
- Ghaisas, Niranjan S., Cristina L. Archer, Shengbai Xie, Sicheng Wu, and Eoghan Maguire. 2017. “Evaluation of Layout and Atmospheric Stability Effects in Wind Farms Using Large-Eddy Simulation.” Wind Energy 20 (7): 1227–40. [CrossRef]
- Han, Woobeom, Jonghwa Kim, and Bumsuk Kim. 2018. “Effects of Contamination and Erosion at the Leading Edge of Blade Tip Airfoils on the Annual Energy Production of Wind Turbines.” Renewable Energy 115:817–23. [CrossRef]
- Hoen, Ben, Ryan Darlow, Ryan Haac, Joseph Rand, and Ken Kaliski. 2023. “Effects of Land-Based Wind Turbine Upsizing on Community Sound Levels and Power and Energy Density.” Applied Energy 338 (July 2022): 120856. [CrossRef]
- Larsson, Conny, and Olof Öhlund. 2014. “Amplitude Modulation of Sound from Wind Turbines under Various Meteorological Conditions.” The Journal of the Acoustical Society of America 135 (1): 67–73. [CrossRef]
- Llorente, Elena, and Daniele Ragni. 2020. “Trailing-Edge Serrations Effect on the Performance of a Wind Turbine.” Renewable Energy 147:437–46. [CrossRef]
- Luesutthiviboon, S. 2022. “Assessing and Improving Trailing-Edge Noise Reduction Technologies for Industrial Wind- Turbine Applications.” TU Delft University. [CrossRef]
- Marcillo, Omar, Stephen Arrowsmith, Philip Blom, and Kyle Jones. 2015. “Journal of Geophysical Research : Atmospheres,” 9855–68. [CrossRef]
- Marcillo, Omar E., and Joshua Carmichael. 2018. “The Detection of Wind-Turbine Noise in Seismic Records.” Seismological Research Letters 89 (5): 1826–37. [CrossRef]
- Møller, Henrik, and Christian Sejer Pedersen. 2011. “Low-Frequency Noise from Large Wind Turbines.” The Journal of the Acoustical Society of America 129 (6): 3727–44. [CrossRef]
- Nejad, Amir R., Jonathan Keller, Yi Guo, Shawn Sheng, Henk Polinder, Simon Watson, Jianning Dong, et al. 2022. “Wind Turbine Drivetrains: State-of-the-Art Technologies and Future Development Trends.” Wind Energy Science 7 (1): 387–411. [CrossRef]
- Nguyen, Phuc D., Kristy L. Hansen, Peter Catcheside, Colin H. Hansen, and Branko Zajamsek. 2021. “Long-Term Quantification and Characterisation of Wind Farm Noise Amplitude Modulation.” Measurement: Journal of the International Measurement Confederation 182 (April): 109678. [CrossRef]
- Oerlemans, S. 2011. “Wind Turbine Noise : Primary Noise Sources.” Nlr-Tp-2011-066, 1–57.
- Oerlemans, S. 2012. https://www.ewea.org/events/workshops/wp-content/uploads/2012/12/EWEA-Noise-Workshop-Oxford-2012-1-1-Stefan-Oerlemans.pdf.
- Oerlemans, Stefan. 2015. “Effect of Wind Shear on Amplitude Modulation of Wind Turbine Noise.” International Journal of Aeroacoustics 14 (5–6): 715–28. [CrossRef]
- Oerlemans, Stefan, and Peter Fuglsang. 2012. “Low-Noise Wind Turbine Design.”.
- Öhlund, Olof, and Conny Larsson. 2015. “Meteorological Effects on Wind Turbine Sound Propagation.” Applied Acoustics 89:34–41. [CrossRef]
- Parada, Leandro, Carlos Herrera, Paulo Flores, and Victor Parada. 2017. “Wind Farm Layout Optimization Using a Gaussian-Based Wake Model.” Renewable Energy 107:531–41. [CrossRef]
- Pedersen, Eja, and Kerstin Persson Waye. 2004. “Perception and Annoyance Due to Wind Turbine Noise—a Dose–Response Relationship.” The Journal of the Acoustical Society of America 116 (6): 3460–70. [CrossRef]
- Shankar Verma, Amrit, Zhiyu Jiang, Zhengru Ren, Marco Caboni, Hans Verhoef, Harald van der Mijle-Meijer, Saullo G.P. Castro, and Julie J.E. Teuwen. 2021. “A Probabilistic Long-Term Framework for Site-Specific Erosion Analysis of Wind Turbine Blades: A Case Study of 31 Dutch Sites.” Wind Energy 24 (11): 1315–36. [CrossRef]
- Søndergaard, Bo. 2015. “Low Frequency Noise from Wind Turbines: Do the Danish Regulations Have Any Impact? An Analysis of Noise Measurements.” International Journal of Aeroacoustics 14 (5–6): 909–15. [CrossRef]
- Thomas, Daniel. 2024. “Unveiling Wind Turbine Failures Causes, Detection, and Prevention for Enhanced Reliability.” Journal of Failure Analysis and Prevention 24 (5): 2051–53. [CrossRef]
- Vasel-Be-Hagh, Ahmadreza, and Cristina L. Archer. 2017. “Wind Farm Hub Height Optimization.” Applied Energy 195:905–21. [CrossRef]
- Velden, W. C.P. van der, and S. Oerlemans. 2017. “Numerical Study on Combed Teeth Serrations for Wind Turbine Noise Reduction.” 23rd AIAA/CEAS Aeroacoustics Conference, 2017, no. June. [CrossRef]
- Verma, Amrit Shankar, Sandro Di Noi, Zhengru Ren, and Zhiyu Jiang. 2021. “Minimum Leading Edge Protection Application Length to Combat Rain-Induced Erosion of Wind Turbine Blades.” Energies 14 (6): 1629.
- Wagner, S, R Bareiß, and G Guidati. 2012. Wind Turbine Noise. Environmental Engineering. Springer Berlin Heidelberg. https://books.google.nl/books?id=N-jnCAAAQBAJ.
- Zajamšek, Branko, Kristy L. Hansen, Con J. Doolan, and Colin H. Hansen. 2016. “Characterisation of Wind Farm Infrasound and Low-Frequency Noise.” Journal of Sound and Vibration 370:176–90. [CrossRef]
- Zhang, R. G., B. J. Wang, J. B. Wang, H. Lei, and S. C. Xia. 2021. “Wind Turbine Blade Failure.Case Analysis and Control Measures.” Journal of Physics: Conference Series 2047 (1). [CrossRef]
Disclaimer/Publisher’s Note: The statements, opinions and data contained in all publications are solely those of the individual author(s) and contributor(s) and not of MDPI and/or the editor(s). MDPI and/or the editor(s) disclaim responsibility for any injury to people or property resulting from any ideas, methods, instructions or products referred to in the content. |
© 2025 by the authors. Licensee MDPI, Basel, Switzerland. This article is an open access article distributed under the terms and conditions of the Creative Commons Attribution (CC BY) license (http://creativecommons.org/licenses/by/4.0/).
Copyright: This open access article is published under a Creative Commons CC BY 4.0 license, which permit the free download, distribution, and reuse, provided that the author and preprint are cited in any reuse.


