Submitted:
11 January 2025
Posted:
13 January 2025
You are already at the latest version
Abstract
Wildfires have burned hundreds of communities in the 11 western US states (11WS) over the last two decades, and a federal program, Confronting the Wildfire Crisis (CWC), is using fuel-reduction treatments (FRTs) over 7-9 million ha in 10 years to reduce exposure of communities to fires in forests, but could a landscape system of fire-resistant land uses and FRTs near communities better protect them all? I used GIS to estimate fire rates from 2000-2021 in 55 land covers to identify potential fire-resistant land uses, then used rates to place them into five categories from Safest to Very Dangerous. I added buffers of 100, 850, 2500, and 5000 m, representing different fire threats, to maps of 4,484 community complexes in the 11WS, then measured the extent of Safeness categories in complexes and their buffers. On average, a surprising 34-39% of area inside complexes and 53% in the outermost buffer was dangerous land uses. When fires from 2000-2021 burned into 788 complexes, 88% of burned area was in dangerous, only 6% in safe land uses, validating both dangerous and safe land uses. For landscape fire protection, communities could: (1) replace dangerous internal land uses with safe uses, (2) retain existing safe uses internally and in buffers, (3) link them with added safe uses, averaging as little as ∼25 m wide by 12-15 km long, across dangerous uses externally, and (4) supplement these externally with continuous FRTs to reduce fire intensity and ember and smoke production. Nearly all 4,484 community complexes could feasibly be protected in a decade if CWC funding were refocused on this effort.
Keywords:
wildfires
; United States
; living with fire
; fire-adapted communities
; fuel-reduction treatments
; fire-resistant land uses
; Confronting the Wildfire Crisis program
1. Introduction
About $5 billion from the 2021 Infrastructure Investment and Jobs Act and $1.8 billion from the 2022 Inflation Reduction Act are being expended on fuel-reduction treatments (FRTs) to reduce the severity and extent of wildfires that could burn into communities in the eleven western U.S. states, as many did between 2000 and 2021 (Figure 1). Reducing these fires is the goal of the latest U.S. Forest Service (USFS) “Confronting the Wildfire Crisis” (CWC) program (USDA Forest Service 2022). However, here I show this program is mis-focused on reducing fuels in forests rather than directly protecting communities, which I show here would likely be feasible for nearly all communities, if CWC funding were refocused on this goal.
Why did research that led to the CWC (e.g., Ager et al. 2019, 2021a) only analyze whether FRTs can reduce the exposure of communities to wildfire from forests, but not whether directly reducing vulnerability of communities to wildfires could much better address this crisis? A well-established Living with Fire (LWF) framework focuses on developing better adaptation to wildfires by communities (Moritz et al. 2014, McWethy et al. 2019). This is also the approach of the nationwide Fire-Adapted Communities (FAC) program (Paveglio and Edgeley 2020). This is mentioned in the CWC document, but it emphasizes collaborating with local groups, not directly providing CWC funding to these groups or doing work for them with CWC funding.
It has long been documented that funding spent on FRTs in forests, as is the CWC focus, could be better spent on LWF and FACs: lowering community vulnerability by reducing fuels near buildings and infrastructure, which also enables wildfires to be restored to their natural functions in nearby wildland vegetation (e.g., Cohen 2000, Calkin et al. 2023). Mechanical FRTs near buildings typically target the key home-ignition zone (HIZ) within about 20-40 m of buildings, where reducing fuels is well established to reduce building loss in wildfires (Cohen 2000). In a 1.4 million ha area of fire-prone forests in central Idaho, a comparison of landscape-scale FRTs in forests with mechanical treatments in HIZs found that “HIZ treatments were more cost-effective” (Alcasena et al. 2022 p. 11) with “estimated fuel-treatment costs of about $5-25 per year per structure or $6-29 per resident” (Alcasena et al. 2022 p. 12). Simulation modeling of alternative approaches to reducing exposure of communities to fires from the Sierra National Forest, California reported: “...treating USFS land does little to reduce overall wildland urban interface (WUI) exposure across the landscapes...treating defensible space near homes was by far the most efficient at reducing WUI exposure, including exposure transmitted from USFS lands” (Scott et al. 2016 p. 29). A recent comparison of ecological restoration treatments and FRTs (Stephens et al. 2021) also suggested focusing FRTs near buildings and infrastructure and using ecological restoration, not FRTs, in adjoining forests. These studies together strongly suggest it would make sense ecologically, economically, and socially to redirect CWC funding to using mechanical FRTs primarily to add to protection near buildings, infrastructure, and communities.
Evidence has become clearer that most building destruction and loss of life is from fast-moving fires burning from wildland vegetation, that is typically within 100-850 m (Caggiano et al. 2020, Balch et al. 2024). FRTs in forests and under the CWC are generally much further away and unlikely to have much effect (Calkin et al. 2014). Also, there is no time for creating closer protection during fast-moving fires. Deploying expensive fire crews to undertake rapid construction of firelines as wildfires advance toward communities (e.g., Wei et al. 2023) is also not very viable as a general solution either. Of course, there is substantial doubt, based on scientific evidence, that FRTs can slow or stop fast-moving, intense fires from burning into communities (e.g., Calkin et al. 2014, 2023). Recent systematic reviews focus on whether fire severity is reduced (Kalies and Kent 2016, Davis et al. 2024), not whether fire size is reduced by FRTs, which remains doubtful, but are there better uses for FRTs?
Here I present the case that adequate community protection needs extensive landscape-scale features in place, that are passively fire resistant, near communities not in distant forests. These are best located based on functional distances (e.g., how far are embers transported?) that are best implemented in distance-based buffers around communities. Landscape-scale approaches in general are needed that integrate multiple features into appropriate buffers, including fire-resistant land uses (e.g., Moritz et al. 2022), FRTs for ember and smoke reduction, and active fire-control locations. Potential operational delineations (PODs), for example, are semi-permanent locations, such as roads or other non-flammable physical features, suitable for controlling approaching fires (Thompson et al. 2022). FRTs could be placed near these, to reduce fire severity, ember production, and smoke, or to facilitate backburns for fire control, and these both might best function in outer buffers near communities. However, the key to “fire-smart landscape management” in the context of communities is sufficient fire-resistant land uses (e.g., agriculture; Sil et al. 2024) in buffers nearer communities. Landscape fire problems include fire-vulnerable land uses in and near communities, including wildland vegetation, which is strongly associated with WUI wildfire disasters (Caggiano et al. 2020).
Previous US studies suggested (e.g., Baker 2009, Moritz et al. 2022) redesigning community boundaries to more securely resist fires using nonflammable or low-flammable land uses, such as open parks, wetlands, canals, and wide roads (Table 1). Most of these likely fire-resistant features have not been fully tested, which is undertaken here. Some of these land uses may already occur in and near communities, but not necessarily in appropriate buffers where they will function to reduce fires that could enter communities as a fire front or as spot fires from embers, the two primary sources of ignitions in communities (Calkin et al. 2014, Filkov et al. 2023). FRTs and PODs could provide ember and smoke reduction and possible fire control while communities seek to more fully protect themselves by increasing fire-resistant land uses (Table 1), which will take time. Fast-moving high intensity wildfires can, as is well known (Filkov et al. 2023), spot across FRTs, PODs, and even fire-resistant land uses, so it is important to reduce fire severity, ember streams, and smoke, and control the fire itself some distance from community boundaries. The advantage of reaching adequate fire protection from fire-resistant land uses is more reliable protection and relatively little maintenance other than occurs to maintain the land use. Of course, these land uses also can themselves provide benefits to communities, including recreation, open space, habitat, food production, or water storage (Moritz et al. 2022), so landscape-scale fire management in buffers can be a win-win solution for communities.
Are communities already implementing fire-resistant land-use buffers and FRT reduction of embers and smoke? Communities may use parallel efforts to create Community Wildfire Protection Plans (CWPPs; Williams et al. 2012) and Fire-Adapted Communities (FACs; https://fireadapted.org, accessed 7-10-2024). There are > 1000 CWPPs (Palsa et al. 2022, Hamilton et al. 2024), which compares with several thousand populated places in the 11 western states (11WS), so most populated places do not have a specific CWPP, but instead are within a larger county CWPP. CWPPs typically have fixed boundaries based on existing jurisdictions, but vary in spatial scale and risk focus (Hamilton et al. 2024). Focuses can include FRTs, ecological restoration, emergency planning, land-use planning, mitigation by homeowners, and other methods (Williams et al. 2012). FACs aim at some of these, but also embrace LWF: “...members of FACs recognize the important ecological role that fire serves in broader landscapes and promote or mimic its use in ways that support ecosystem health” (Paveglio and Edgeley 2020 p. 320). FACs use many approaches to prepare communities for fire, including FRTs, evacuation planning, CWPPs, homeowner mitigation, land-use regulations, reduction of human-caused ignitions, prescribed burning, and others (Paveglio and Edgeley 2020). However, Moritz et al. (2022 p. 2) explained: “Issues related to evacuations and road networks, water supplies, fire-resistant ‘buffers’ of lower flammability (e.g., orchards or greenbelts), and homeowner training are generally beyond the scope of CWPPs and not addressed.”
Community-based efforts through CWPPs or FACs also vary over substantial spatial scales, and there is increasing concern that their scaling is not congruent with the scales of fire risk to communities. Hamilton et al. (2024) found 852 CWPPs in the 11WS covered from < 100 km2 to > 10,000 km2, whereas their analysis of fire scales suggested an optimum scale, related to fires, of about 500 km2. At 500 km2, which is 50,000 ha, it is conceptually feasible to use existing or create new fire-resistant features near vulnerable borders of each community or set of nearby communities. However, areas of communities vary greatly, as do areas of buffers and FRTs, so more evidence is needed about appropriate scales for community protection.
In the analysis here, I focused on fire-resistant and fire-vulnerable land uses, PODs, and FRTs within and adjacent to communities across the 11WS, using existing datasets and GIS. Questions include: (1) how many potential permanent-buffer categories (Table 1) have adequate GIS datasets, (2) what is the current extent of fire-resistant and fire-vulnerable land uses and vegetation within and near communities, (3) how strongly have fire-vulnerable land uses and vegetation facilitated wildfires in communities, and how well have fire-resistant land uses (Table 1) worked as barriers to wildfire in communities over the last two decades, which have had increased but fluctuating wildfire (Baker 2024), (4) are there already potentially permanent barriers in appropriate locations, (5) are there locations on public land where PODs and ember-reduction FRTs should be placed or expanded, (6) could fire-resistant land uses potentially stop wildfires from damaging communities, and (7) could funding allocated for the CWC be better spent protecting communities? This paper aims to narrow these questions about fire-resistant land uses, PODs, and FRTs, to further local analysis of these land uses near communities, and encourage communities to seek landscape-scale fire protection.
2. Materials and Methods
I undertook this research in a series of steps using existing and derived datasets (Table 2). I used a geographical information system (GIS), ArcGIS Pro 3.3.0 (ESRI, Redlands, CA), with all maps projected to the NAD 1983 North American Albers Equal Area Conic projection, and clipped to the 11 western US states (11WS), which cover 307,942,101 ha. The steps included: (1) developing and analyzing GIS maps of communities, their buffers, and their buildings, (2) finding GIS datasets for potential fire-resistant land-uses, (3) operationalizing them in GIS, (4) assessing how well these land-uses have resisted recent fires across the 11WS, (5) analyzing the abundance of safe and dangerous land uses across communities and their buffers, (6) analyzing how 2000-2021 wildfires interacted with these land uses in communities and their buffers, (7) analyzing whether a network of PODs and FRTs could be enhanced for protecting communities, (8) analyzing ownership of land, wildland vegetation, safeness categories, PODs, and mechanical FRTs in communities and their buffers, and (9) comparing area planned for treatments by the CWC over 10 years to area that could be treated across communities and their buffers.
The U.S. Census Bureau’s Populated Place Areas dataset (Table 2) contained 5,565 community boundaries covering 12,574,611 ha in the study area in the 11WS (Table 3). I first used the ArcGIS “Dissolve boundaries” command to merge adjoining sectors in communities and across communities that share boundaries, which reduced the number of community units from 5,565 to 4,484 (Figure 2). Buffers that extend across adjacent communities are shared, and it is also likely not feasible to place one community’s buffer inside an adjacent community. Note that areas in communities that were not adjoining were not merged, so communities may still have more than one polygon, but this makes sense since separated areas can have buffers.
In ArcGIS, I created separate buffers both internal and external to what I then called Populated Places Dissolved (PPDs), also called “communities” here, that were -2500 m to -850 m, -850 m to -100 m, -100 m to 0, 0 to 100 m, 100 m to 850 m, 850 m to 2500 m, and 2500 m to 5000 m from community boundaries ( Table 3 , Figure 2 ), for analyses. I used 100 m and 850 m, because these distances from large areas of wildland vegetation were found to have contained about 95% and 100%, respectively, of buildings destroyed in WUI wildfire disasters in the US from 2000 to 2018 (Caggiano et al. 2020). I used 2500 m, because it was half a 5000-m buffer and similar to the 2400 m thought to be a typical distance over which embers travel from a fire front to ignite a fire within a community (Dillon et al. 2024). I used 5000 m, which may represent the typical maximum distance over which embers travel to ignite fires within a community (Filkov et al. 2023). I used PPDs to erase external buffers that mistakenly extended into interiors of nearby communities. I used the ArcGIS “Aggregate Polygons” command to merge buffers, that overlap between communities, into larger units. Since wider buffers extend further, buffers declined from 3,755 with 0 to 100 m to 1,306 with 2500 m to 5000 m buffers (Table 3). At the 5000-m scale, very large areas may be joined, over 160 km north to south ( Figure 2 ), because they are close enough to share some areas of ember and smoke production and transmission.
I used Microsoft Building Footprint data (Table 2) to obtain a basic understanding of the abundance of buildings across PPDs and their buffers. Buildings are a primary resource that needs protection. Building density indicates the level of development. I counted buildings and calculated building density as the count within each buffer divided by the area (ha) of the buffer.
To understand the relationship of PPDs and their buffers with the Wildland-Urban Interface (WUI), as defined in Radeloff et al. (2005) and updated in Radeloff et al. (2023), I intersected the maps of PPDs and their 100 m buffers with the updated WUI map (Table 2), after omitting uninhabited areas. PPDs plus 100 m buffers contain 13,675,545 ha and the WUI - uninhabited contains 13,162,433 ha, whereas PPDs plus their buffers out to 850 m contain 20,794,158 ha.
Finding and Downloading GIS Datasets for Potential Fire-Resistant Land Uses
I used online search engines as well as ArcGIS online datasets to seek GIS data for entries in Table 1 . I downloaded both perimeters (polygons) and annual mosaics (rasters) of larger wildfires (about 405 ha+) from 2000-2021 (22 years) from the US government Monitoring Trends in Burn Severity program (MTBS). The 22-year MTB perimeter dataset in the 11WS contained 7,180 fires, totaling 35,701,715 ha, from ∼ 400 to 432,525 ha in area, although 11 were smaller due to clipping with the 11WS boundary. These were primarily wildfires, but also 573 prescribed fires totaling 710,562 ha, which I included as they could possibly escape and damage communities. I downloaded the 2020 Wildland-Urban-Interface (WUI) and used it directly, except that I removed “Uninhabited” areas, leaving 13,162,433 ha. I used the BLM Surface Management Agency dataset to identify landowners in the 11WS, which includes 28 agencies, mostly federal, but also State and private.
To identify vegetation types affected by wildfires, I used Landfire’s “Existing Vegetation Type” (EVT) data for 2001, an early map needed so that vegetation near or before 2000-2021 fires, not after most of these fires, could be identified. I reclassed the Landfire NVCSOrder attribute, which lists 231 Order-scale vegetation types in the National Vegetation Classification System (https://usnvc.org/, accessed 7-29-2024), into 34 broader vegetation types. The crosswalk between the 34 types and the Landfire EVT categories is in Table S1 . The 34 broader types were needed so that nearly all each cover larger areas (Table 4) than the largest recent 11WS wildfire of ca 432,525 ha (Perimeters; https://www.mtbs.org, accessed 4-15-2024). This is needed so that sample size would be sufficient in estimating rates of burning.
As a main source of land-use data, I used the Multi-Resolution Land Characteristics Consortium’s 2021 National Land Cover Database (NLCD), which contains 16 broad land-cover categories (e.g., cultivated crops, deciduous forest) across the 11 WS (Table 2). As in previous analysis of WUI wildfire disasters (Caggiano et al. 2020), I created a wildland vegetation dataset by combining several NLCD categories that are primary sources of wildfires burning into the WUI. Wildland vegetation includes the NLCD categories of evergreen forest, deciduous forest, mixed forest, scrub/shrub, grasslands, woody wetlands, emergent herbaceous wetlands, and developed open space (Caggiano et al. 2020). This dataset contained 319,488 polygons covering 266,238,807 ha (86%) of the 11WS. I used this dataset because it was found that 95% of building loss in WUI wildfire disasters occurred within 100 m of large patches of wildland vegetation (Caggiano et al. 2020). Here, I did not restrict this analysis to just large patches, as patches within communities could be small, but still significant in the context of small communities.
I downloaded several datasets to further assess the potential ability of physical features to resist wildfires. To assess whether the Freeways of the 11WS might serve as fire barriers, I used the ArcGIS Hub downloadable dataset for USA Freeways, which led to 21,818 km of freeways. I assumed that four-lane highways, obtained from Open Streetmap, which are generally ≥ 23.8 m wide, including shoulders and medians (National Research Council 2005), could also potentially function as barriers, which led to 9,733 km of four-lane motorways that were not freeways. Similarly, I extracted hydrologic features (lakes, reservoirs, rivers, wetlands) from the National Hydrography Dataset Plus Version 2 (NHDPv2) and the National Wetland Inventory, that, on average, were as wide or wider than four-lane highways. I restricted lakes, ponds, and reservoirs in the NHDPv2 nhdwaterbody dataset and National Wetland Inventory to those that were likely to have an area large enough to average ≥ 23.8 m in radius, rather than diameter since many are not circular, which is a minimum area (πr2) of 0.178 ha or 0.00178 km2. This led to 447,244 water bodies covering 44,899 km2. From the National Wetland Inventory, I selected only Freshwater Emergent Wetlands and Freshwater Forested/Shrub Wetlands. This led to n = 1,758,014 wetlands covering 4,120,737 ha. I also estimated the watershed area, likely to correspond with a stream bankfull width of ≥23.8 m, using an equation for the “West” (W = 2.27 * A0.28) in Faustini et al. (2009). This watershed area was 4403 km (440,300 ha), which I used to filter watersheds in the NHDP2 nhdflowline dataset, leading to a set of 142,859 river segments, totaling 84,287 km of length. Potential Operational Delineations (PODs), locations where fires may be controlled because of physical barriers, low fuel loads, and other factors, included 18,621 polygons in 138,671,305 ha of area and 33,217 lines over 228,408 km of length.
Finally, I also used the 0.178 ha minimum area criterion, with the USA Parks dataset, to select larger parks, including county and local parks, leading to 14,183 parks over 465,224 ha. Larger mines, on the surface, could function as fire-resistant land uses, but I could find no polygon mapping of mines, just 38,888 points from the National Mine Map Repository, which are only indicators of a potential mine that could possibly function as a fire-resistant land use.
Operationalizing Fire-Resistant and Dangerous Land Uses as Maps in GIS
Given available GIS data, there are seven previously suggested land uses (Table 1), and three new in this study, that can be operationalized as variables to analyze their potential as permanent buffers for protecting communities from wildfires. The resulting set of 55 GIS variables (Table 5) include 32 vegetation types, omitting disturbed forest and no data (Table 4), 16 types of land cover, and 7 miscellaneous features, including freeways, motorways, large rivers, water bodies, and wetlands, parks, and mine locations. This is not a final result, as I could not find GIS maps for some potentially significant fire-resistant land uses, including golf courses, greenbelts, parking lots and garages, gravel pits, rock pits, or canals (Table 1). Moreover, I hope that some other potentially useful land uses may be identified and mapped. These variables could be analyzed at various levels of detail (e.g., different types of wetlands rather than just wetlands), but this is beyond the scope of this paper, which is an initial exploration of feasibility, that is usable now, but also aims to facilitate more detailed research.
Table 5 provides the list of potential variables, which may be at least partly redundant, as several represent alternative formulations for differing purposes, such as “Cultivated crops” and “Agriculture” (Table 5). So, I narrowed and sharpened the list for the analysis here of potential fire-resistant land uses. In GIS, I compared alternative and potentially overlapping variables to help narrow the initial full list in Table 5. I omitted all categories of “Developed” land, although they are fire-resistant and have long fire rotations (Table 5), since a primary goal of this study is to find other land uses that will protect developed land. I chose Agriculture as one of 34 Vegetation Types instead of the NLCD “Cultivated Crops” and “Hay/Pasture” (Table 4) because the NLCD versions did not distinguish natural vegetation from agriculture quite as well when overlaid, but both are credible sources. Similarly, I omitted NLCD’s snow/ice, open water, and barren land categories, as the 34 Vegetation Types “Physical” category mapped all of these. I also omitted the NLCD Deciduous Forest, because it included some non-forested areas, and “Quaking aspen forest,” in the 34 Vegetation Types, appeared similar. I omitted the 34 Vegetation Type “Wetlands” and NLCD’s “Emergent herbaceous wetlands” and “Woody wetlands,” which overlap the National Wetland Inventory, which is a single, widely accepted source. I used the National Wetland Inventory map to erase wetlands from the Physical Category of the 34 Vegetation Types in the Safest category so there would not be duplication. I omitted NLCD’s “Mixed forest,” “Evergreen forest,” “Shrub/scrub,” and “Herbaceous” categories, which are likely valid, but are defined more finely by several of the 34 Vegetation Types maps.
How Well Did Fire-Resistant Land Uses Resist 2000-2021 Wildfires Across the 11WS?
For each of the 55 variables and for wildland vegetation, I used the MTBS fire data and the ArcGIS Con command with rasters and the ArcGIS Intersect command with polygons, lines, and points to select areas burned from 2000-2021 across the 11WS. I completed these analyses using Python scripts. Then, I calculated their fire rotation (FR) across the 11WS, as in Baker (2009), using 2000-2021 fire records as: 22 years / (area, length, or points burned/total area, length, or points). This is measuring the fraction of the total extent of each variable that burned in the 22 years, then using that to estimate how long it would take to burn the total extent of each variable, assuming that the 22-year rate continues. This is a speedometer-like short-term estimate that allows longer-term expected rates to be estimated and compared.
To measure burned area, I used categories 2-4 in MTBS rasters, which represent low-, moderate-, and high-severity burned area, but I omitted category 1 that represents unburned to low-severity burned area. MTBS categories 2-4 may underestimate total burned area somewhat, but including category 1 would likely overestimate burned area. For polygon and line data, I used MTBS polygon perimeters, which typically include some unburned areas, thus overestimating total burned area somewhat. To offset overestimation and underestimation of these two sources of fire data, I calculated FRs for the whole 11WS for 2000-2021, using each source, then compared the results, and used the mean of these two estimates as the best estimator of burned area for all variables. FRs can be directly compared, but to tie these to more tangible impacts to communities, I estimated the number of PPDs, expected to burn per year, on average, from: (1/FR) * 4484, since there are 4,484 dissolved communities (Table 3).
Looking at the FR results in decreasing order, I placed the 55 variables into categories of safeness, that have somewhat arbitrary divisions, for buffering communities. I chose two divisions, on both sides of a middle category of “Not Very Safe,” based on breaks in FRs. I reasoned that long FRs combined with relatively low numbers of dissolved communities expected to burn per year might represent socially acceptable and safest land uses to buffer communities. I also identified potentially dangerous categories with shorter FRs or very short FRs that represent fire vulnerabilities near communities. I separately analyzed wildland vegetation (Caggiano et al. 2020), a potentially dangerous source of WUI wildfire disasters, that may span one or more of the five categories. Variables classed as Dangerous and Very Dangerous (Table 5), as well as the broad category of wildland vegetation associated with WUI wildfire disasters (Caggiano et al. 2020), are not suitable as potential buffers to protect communities. They likely are facilitating wildfires in communities, so it is important to assess their occurrence within communities.
To provide geographical perspective on safeness and vulnerability across the 11WS, I created composites of the individual variables. I first converted all polygon, line, and point variables to raster, snapped to the 30 m pixels of the pooled National Vegetation Classification System (NVCS) set of 34 categories. I next examined possible redundancy in variables (e.g., Cultivated Crops vs. Agriculture) within each safeness category by overlaying them in ArcGIS. I then chose a subset of the potential variables to avoid redundancy within and among the safeness categories. I favored likely more reliable and detailed sources (e.g., National Wetland Inventory maps rather than other wetland maps, detailed Landfire data in the 34 Vegetation categories vs. coarser National Land Cover Database data). Where the choice was not obvious, I compared alternative maps to see which appeared most accurate and reliable. I pooled the chosen set of variables in each safeness category using the ArcGIS Raster Calculator’s Con command (e.g., If Cultivated Crops OR Agriculture, then Value = 1), which pooled separate variables while removing redundancy. Lastly, I compared among the safeness categories using overlays in ArcGIS, found small overlaps, then used Raster calculator to remove overlapping area from the higher category to avoid overestimating safeness where there was ambiguity.
Analyzing the Abundance of Safe and Dangerous Land Uses Across PPDs and Their Buffers
I analyzed the distribution of Safeness categories and wildland vegetation across communities and their buffers. In ArcGIS Pro, I used the polygon PPD boundaries and also their internal and external buffers of 0 to 100 m, 100 m to 850 m, 850 m to 2500 m, and 2500 m to 5000 m. I used the ArcGIS “Zonal Statistics as Table” command to analyze the abundance of the five raster Safeness categories within the 4484 PPDs and their buffers. For wildland vegetation, I intersected this polygon map with PPD and buffer polygons, then calculated areas of results.
How Did 2000-2021 Wildfires Interact with PPDs and Their Buffers?
I next analyzed how 2000-2021 wildfires interacted with communities, their buffers, and with Safeness categories and wildland vegetation. I intersected PPDs with the perimeter (polygon) version of MTBS wildfires from 2000-2021, which could produce several entries (fires) for a community. I then estimated FRs for this period to assess the recent risk of fires to communities. To do so, I exported the attribute table for the intersection, converted it to Excel, and imported it to Minitab 22.1 (Minitab, State College, Pennsylvania). I totaled area burned by individual fires across each community, estimated each community’s FR, and analyzed FRs across the 4484 PPDs. I derived and applied the empirical correction to polygon estimates of FRs for each of the 4484 Populated Places, and overall. To help interpret FRs across the 4484 communities, I compared each community’s FR to the FRs for the Safeness categories (Table 4, Table 5) from “Safest” to “Very Dangerous” and tallied how many communities were in each category between 2000 and 2021. I also tallied and graphed fires by area that did and did not burn into PPDs. Then, based on histograms showing non-normal distributions, I tested the null hypothesis that median fire areas were equal versus the alternative that medians were not equal, using the non-parametric Mann-Whitney test in Minitab. Anecdotal observations I made in GIS suggested wildland vegetation enabled fire to enter communities, so I intersected the map of fires that burned communities with the map of wildland vegetation, and calculated what fraction of burned area occurred in wildland vegetation. I similarly used the ArcGIS “Zonal Statistics as Table” command to analyze abundance of Safeness categories burned by fires in communities.
Could a Network of PODs and FRTs be Enhanced for Protection Around PPDs and Their Buffers?
I first estimated the area that might be needed for a complete PODs/FRT system around all 4484 PPDs across the 11WS. I estimated this area as the total perimeter length around the PPDs in exterior buffers, where this system would occur, times FRT widths of 100 m and 500m. These are approximate, since rectangular rather than circular, but high estimates since FRTs are likely not needed everywhere. Widths of even 40-70 m have been found to be capable of reducing high-intensity crown fires to low-intensity surface fires in California forests (Safford et al. 2012). Extreme conditions may require 400-500 m widths or more (Safford et al. 2021), so I am bracketing the potential range with 100 m and 500 m estimates.
Potential Operational Delineations (PODs) are established, and they could be permanent features where active control of advancing fires remains a focus (Thompson et al. 2022). Here I analyzed the potential for enhancing the PODs and FRT network specifically for community protection, using the datasets for PODs and FRTs (Table 2) within PPDs and their buffers. PODs data are provided as lines and polygons, but the lines, which contain data identifying the feature (e.g., road, river etc.) cover only 228,215 km. I used these incomplete data to initially evaluate PODs features in general. I converted the polygons to lines, which then covered 710,999 km, but these do not identify the feature. Nonetheless, I used these lines to measure the extent, in kilometers, and density (m/ha) of existing PODs within the PPDs and their buffers.
I also downloaded and used data from the Integrated Interagency Fuels Treatments dataset (Table 2) to similarly measure the extent of FRTs within PPDs and their buffers. I limited these FRT data to Treatment Category = mechanical, as larger prescribed fires are already included in the fire analysis. Also, the mechanical category likely includes most FRTs as well as mechanical treatments that could be for other purposes, so it is likely generous toward estimating FRTs. I also limited analysis of FRTs to 2000-2021 to be consistent with the fire analysis.
I next estimated the extent of a PODs/FRT network, assuming an FRT just outside the POD, that could be placed strategically for community protection by measuring the maximum POD lengths that could be needed within key external buffers of communities at the PPD boundary and at the outer edges of 850 m, 2500 m, and 5000 m buffers. Then, I also measured Dangerous and Very Dangerous Safeness categories along those perimeter lines, using “Zonal statistics as Table” to estimate and bracket this key focus for PODs/FRT extent along those lines.
Ownership of Land, Wildland Vegetation, Safeness Categories, PODs, and Mechanical FRTs
Since the PPDs and their buffers are potentially in need of land-use change to improve PPD safety, I analyzed land ownership within the PPDs and their buffers using the Federal and other land ownership GIS data (Table 2). I reclassed the 629 ownership entries in this dataset into simpler categories of U.S. Forest Service, other federal, private, state, tribes, and unknown, then intersected this ownership map with each PPD buffer category and summed the area in each ownership. Since wildland vegetation and dangerous land uses may be a conduit for fires entering the PPDs, I also intersected wildland vegetation inside PPD buffers with the ownership map and measured the percentage of each ownership. I did the same analysis with Safeness categories using “Zonal statistics as Table.” I undertook similar analyses with PODs and FRTs.
Comparing Treatment Areas for the CWC Program to Treatment Areas in PPDs and Their Buffers
Finally, I analyzed the potential for refocusing federal funding and treated land area for the CWC fully within the PPDs and their buffers. Analyzing potential cost differences and differences in treatments is beyond the scope of this analysis, so I assume here that costs and methods are similar. I assumed that if several million ha of land would be treated by the CWC program over 10 years, then that several million ha of land could all be placed within the PPDs and their buffers, and could now be moved there, if suitable locations, ownership, etc. are available. Therefore, I simply added up estimated areas planned by the CWC for Forest Service, other federal, state, tribal, and private owners, validated those estimates with the area reported to have been accomplished over the first 1-2 years, and then compared those areas with areas having similar ownership within the PPDs and their buffers. CWC treatments are generally FRTs, so in general these would be able to lower fire severity and, consequently, also ember and smoke production, within external buffers outside PPDs. I also summed the area that needs permanent change to safe land uses, which CWC funding could also be used to help accomplish.
3. Results
Communities, Their Buffers, Their Buildings, and the Wildland-Urban Interface
Average communities of the 11WS are relatively small in area, but their external buffers greatly expand their area of influence (Figure 2, Table 3). The 4484 PPDs had median area of just 351 ha, but averaged 2,804 ha in area, ranging from < 1 ha to 867,592 ha (greater Los Angeles) and totaling 12,574,611 ha, which is 4.08% of the 307,942,101 ha total area of the 11WS. Community average diameter is thus not very large, and this is reflected in the finding that 82% of their total internal area (10,361,636 ha) is within 2500 m of their outside boundary. This prevents internal buffers of 5000 m in most communities. External buffers out to 850 m add almost 2/3 (8,219,547 ha) of this internal community area, and external buffers out to 2500 m add nearly twice as much (24,099,959 ha) as internal community area, so that communities plus buffers out to 2500 m take up 11.9% of the 11WS. And, it is noteworthy that communities plus buffers out to 5000 m, sufficient to potentially limit community ignition by embers, would encompass 62,987,467 ha, which is 20.45% of the 11WS. This is a very large problem area.
Almost all buildings in the 11WS are in or near the 4484 PPDs (Table 3). Microsoft Building Footprint data show there are 26,696,450 buildings in the 11WS, and about 81% or 21,611,314 of them are fully within the 4484 PPDs, where mean density is 1.72 buildings/ha. This mean includes buildings in areas further in than 2500 m. Rapid outward density decline is evident from the 1.92 density in the interior -2500 m to -850 m buffer to 0.36 in the exterior 0 m to 100 m buffer to just 0.04 in the 2500 m to 5000 m buffer. In total ∼95% of all buildings in the 11WS are in the PPDs and their buffers out to 5000 m, showing that these are the key areas.
The areas of the PPDs + 100 m buffers (13,675,545 ha) and the WUI without uninhabited areas (13,162,433 ha) across the 11WS are similar. The intersection of the two shows that they are strongly related, as it contained 11,709,038 ha, which is 89% of the WUI area and 86% of the area of the PPDs + 100 m buffers.
How Well Did Land Uses Resist 2000-2021 Wildfires Across the 11WS?
Recent FRs for the 34 vegetation and cover types (Table 4) and corresponding locations of Safeness categories across the 11WS (Figure 3) show that over 3/4 of the area of the 11WS is not a safe setting. The prominent dark green and lighter green (Figure 3) represent the roughly 24% of the 11WS which have been relatively safe from wildfires, the light and dark reds represent the 56% of the 11WS which have been dangerous or very dangerous for wildfires from 2000-2021, and the last 20% in yellow represents 300-600 year FRs that are not safe, yet not as dangerous. California to Washington Mountains, the northern Rocky Mountains, and higher parts of the Southwest are very dangerous settings, with much of the interior West dangerous. Major agricultural areas, deserts, and wet areas, that are safer, are concentrated in the Southwest, and scattered elsewhere, with much of the Great Plains and parts of Nevada, Utah, and New Mexico deserts not dangerous, but not safe. Note that there are likely mapping errors that explain why types that are unlikely to ever burn (i.e., Physical–rocks, ice, lakes, streams, etc.) appear to have had some rare fires, so their FR is less than infinite. Overall, the FR for the 11WS was 213 years, which is in the Safeness category of Dangerous (Table 4).
What Is the Abundance of Safe and Dangerous Land Uses Across the PPDs and Their Buffers?
What is the current distribution and abundance of Safeness categories on average within and across the 4484 PPDs? Developed uses peaked at about 29%, on average, of total land area in the innermost buffer and declined outward (Figure 4f). Developed uses had recent FRs that place them in the Safest category (Table 5), so they can be grouped with Safest and Generally Safe (Figure 4h), although Developed is also the target of protection by other safe land uses. All interior buffers of communities were somewhat dominated, on average, by Developed + Safest + Gen Safe land uses (Figure 4h), but these declined outward.
However, it was unexpected to find that Dangerous + Very Dangerous land-use categories were 34-39% of interior PPD area (Figure 4g), since communities may be assumed to be mostly developed and safe. Moreover, the abundance of Dangerous + Very Dangerous categories inside communities varied widely across the 4484 PPDs (Figures 5,6). A surprisingly dangerous quartile of communities have 60.8% or more internally, although another safer quartile have 4% or less (Figure 6b). High danger is inside communities in small, scattered areas of Southern California shrublands, and in larger forested areas of northern Arizona and New Mexico, the Klamath in northern California and both sides of the Sierra, the Oregon Cascades, and scattered across the Rocky Mountains from Montana to Colorado (Figure 5).
Similar large variability is evident for Safest + Generally Safe (Figure S1), with a quartile of the 4484 PPDs having 45% or more, but another quartile having a much less safe 3.1% or less (Figure 6a). Safest and Generally Safe communities are concentrated in desert areas of southern Arizona, Nevada, and California, but also large urban areas of northern Utah and Colorado, and likely within agricultural areas in the central valley of California, in southern Washington and southern Idaho, and scattered elsewhere in the 11WS (Green areas in Figure 5). Histograms of the fractions of area within the 4484 PPDs that are in Safest + Generally Safe and Dangerous + Very Dangerous categories illustrate large variability from none to abundant across the 4484 communities and a similar peak in lowest levels (< 25%) of both land-use categories (Figure 6a, b). All the external buffers of the 4484 PPDs also have large variability in both relatively safe and dangerous land uses and similar peaks at low levels (Figure 6c-j). Dangerous + Very Dangerous land uses dominated all external buffers, on average, from 100 m to 5000 m (Figure 4g), so average communities have extensive immediately adjacent dangerous land uses that leave them vulnerable to wildfires.
Wildland vegetation, like dangerous land uses, was unexpectedly abundant on average within PPDs, visually dominating interiors, shown in red, of many communities (Figure 7a). About half of communities have 50% or more wildland vegetation internally (Figure 7c). Wildland vegetation also increased outward from a mean of 42% in the internal -2500 m to -850 m buffer to 54% in the external 2500 m to 5000 m buffer (Figure 7b). Also, 18% of communities have 90-100% wildland vegetation (Figure 7c), and these communities are likely quite vulnerable to fires. Fortunately, ∼19% of communities had < 10% internal wildland vegetation and about 28% had < 20% (Figure 7c), likely including the largest communities, such as Los Angeles, San Francisco, Phoenix, Las Vegas, Salt Lake City, and Denver (Figure 7a). These are visible as blue areas in the central valley of California, the Pacific Northwest, and scattered other locations (Figure 7a).
How Did 2000-2021 Wildfires Interact with PPDs, Their Buffers, and Their Land Uses?
Fortunately, communities were safer from wildfires than were their surroundings, but still were not very safe. FRs inside the 4484 PPDs, from 2000-2021 (Figure 8), were much longer, averaging 530 years, than the surrounding 213-year FR across the 11WS (Table 4). Buildings in communities, then, were recently substantially safer than were individual buildings outside communities in the 11WS as a whole. However, the 530-year FR within communities overall is still categorized as “Not Very Safe,” for which 8-14 of 4484 communities are expected to be burned per year (Table 5). There is potential to significantly lengthen FRs in communities using safer land uses as buffers, as is indicated by potentials in the Table 5 “Safest” and “Generally Safe” categories. The most potential for communities to lengthen FRs is not generally inside PPD boundaries, but instead in outside zones to 5000 m from boundaries (Figure 8). Buffers inside have mean FRs of 484-509 years, 91-96% of the internal mean overall of 530 years. The three outside buffers have mean FRs of 266-369 years, in the Not Very Safe to Dangerous categories, and just 50-70% of the internal mean overall of 530 years.
Fires that burned into PPDs between 2000 and 2021 (n = 788) were significantly larger than fires that did not burn into PPDs (n = 6,392). Both sets of fires had inverse J-shaped distributions (Figure 9). However, fires that did burn into PPDs had a lower proportion of small fires (< 2,500 ha in area) and a greater proportion of larger fires (> 2,500 ha), as also evident in Figure 9. Figure 9 omits fires >75,000 ha in area, which were too few to show up in this graph. The Mann-Whitney test of the null hypothesis that the median area of fires, that did not burn into PPDs (1,244 ha), was equal to the median area of fires, that did burn into PPDs (2,129 ha), was rejected and the alternative that they were not equal was accepted (W-value = 3381464.00, p-value = 0.000). Fires that did burn into PPDs, in this sample dataset, had medians 1.7 times as large as fires that did not burn into PPDs. Additionally, the minimum area of fires that burned into PPDs was 406 ha, but the minimum area of fires that did not was just 2 ha. Fires that burned deepest into internal buffers of PPDs were about 1.8 times larger, but only 19% as numerous as fires that just burned the outermost buffer (Table 6). This inward decline likely explains why the innermost FR was 509 years and the outermost FR was 266 years from 2000-2021 (Figure 8).
All the burned area inside communities from 2000-2021 was concentrated in 499 (11.1%) of the 4484 total PPDs, while 3985 (88.9%) had no fire at all from 2000-2021 (Table 7). And, of the 11.1% of 4484 communities with fire (Table 7), 7.1% (64% of the total with fire) had FRs over 2000-2021 that compare with the Not safe to Very dangerous categories of FRs (Table 5). Only 4.0% of the 11.1% with fire (36% of the total with fire) had FRs that compare with the Generally safe to Safest categories of FRs (Table 5). So, about 2/3 of fire area from 2000-2021 was in communities that were not receiving fire at safe rates, either because of large burned area or more than one fire. This shows that, although FRs decline on average inward to community boundaries (Figure 8), this decline is not evidence that communities are generally safe, as fires do not often burn communities, but when fires have done so, they have burned large areas or more than once into about 2/3 of the communities that burned. Indeed, the fires that burned into the innermost buffer of -850 to -2500 m on average were much larger and much less numerous than fires that burned into only the outermost buffer of 2500 m to 5000 m (Table 8).
Fires that burned into PPDs to any extent were by far most numerous and burned most PPD area in California and Arizona (Table 9, Figure 10). California had 39.5% of the 499 total PPDs with fires and 64.1% of total burned area inside PPDs from 2000 to 2021 (Table 9). Next most abundant fires in PPDs were in Arizona, which had 13.4% of 499 total PPD fires and 14.4% of total burned area inside PPDs (Table 9). The other nine of the 11WS each had smaller percentages (2.4 - 6.8%) of the 499 total PPD fires and small percentages (0.6 - 4.7%) of total burned area in PPDs (Table 9). These equate to lower numbers of communities burned per year (0.55 to 1.55) in the nine lowest states, but about 3 to 9 per year in Arizona and California, respectively (Table 9).
Fires that burned into PPDs almost exclusively burned in wildland vegetation. Of the 590,030 ha of PPD internal area burned in fires from 2000 to 2021, 558,575 ha (94.67%) was from fires in wildland vegetation. Fires occurred most commonly across areas of wildland vegetation connected from outside to inside the PPDs (e.g., Figure 11a). It is not known from these maps which direction the fires burned, but other evidence (e.g., Table 8) shows fire diminishing inward. The general pattern can be seen by zooming in (Figure 11) on southern California roughly from Los Angeles to San Diego (Figure 10). Figure 11a shows the large urban areas with small areas of wildland vegetation on their borders and within the PPDs, and Figure 11b shows that 2000-2021 fires typically burned across connected external to internal wildland vegetation. Fires burning at PPD edges made incursions where wildland vegetation extended inward.
Wildland vegetation was the broad land cover burning both inside and outside communities, but the Safeness categories strongly influenced which types of the 94.67% wildland vegetation and 5.33% of other land covers that burned, actually burned the most. Inside PPDs 68.2% of total burn area was in Very Dangerous land uses, 19.8% in Dangerous land uses, 6.2% in Not Very Safe, 3.9% in Generally Safe, and 1.9% in Safest. This is evidence Generally Safe and Safest land uses do burn to some extent, including 5.8% of total burn area, but 88% of burn area was in Dangerous and Very Dangerous categories, 94.2% if Not Very Safe is included.
Safeness categories and wildland vegetation experienced FRs from 2000-2021 within the exterior buffers of PPDs, that increased inward from the outmost 2500-5000 m buffer, where FRs for more dangerous categories and wildland vegetation were generally close to FRs across the 11WS as a whole (Table 6). This table shows that fires of all categories decline inward toward community boundaries, as also evident in Figure 8 for overall FRs. The Figure 8 FRs are most similar to the FRs for the Dangerous category (Table 6). The FRs and Ratio for wildland Vegetation (Table 6) are between Dangerous and Very Dangerous categories.
Also, and quite important, Table 6 and Figure 8 show that not only does fire continue to decline into and even beyond the community boundary, but the Safeness categories function within the buffers as they did across the 11WS and they too benefit from the inward decline in fire. The FRs in the outermost 2500 m to 5000 m buffer, within each category (e.g., Safest), are within the corresponding ranges in Table 5 for the 11WS, and the average for each Safeness category across the 11WS (Table 6) is also, as expected, within corresponding ranges in Table 5, indicating their resistance to fire is consistent, whether in the 11WS or in community buffers. Also, the inward decline in fire, shown by the ratio of inner and outer FRs (Table 6), is higher for Safest and Generally Safe categories than for Dangerous, and is much less in the Very Dangerous category. This lower rate of decline is further evidence that the Safest and Generally Safe categories produce a larger inward decline in fire than do other land uses.
What Is the Potential for Protecting PPDs with Fire-Resistant Land Uses Around Their Perimeters?
There is little difference in length needed for full protection around perimeters of PPDs and their buffers across the range of buffer distances, but substantially less length needed, if the focus is on dangerous land uses. The sum of perimeter lengths was 117,787 km around the 4484 PPDs, 95,207 km around 850 m buffers, 96,861 km around 2500 m buffers, and 99,194 km around 5000 m buffers, averaging 21-26 km per PPD. This occurs because as buffers enlarge, more PPDs join into shared buffers (Figure 2), reducing individual lengths and averaging out totals.
However, the primary need is for protection across Dangerous and Very Dangerous land uses, and these require only 45-67% of total perimeter length. The sum of perimeter lengths across just Dangerous + Very Dangerous land uses was 52,803 km around the 4484 PPDs so 45% of total perimeter length, 55,865 km around 850 m buffers so 59% of total perimeter length, 63,618 km around 2500 m buffers so 66% of total perimeter length, and 66,366 km around 5000 m buffers so 67% of total perimeter length. Across the 4484 PPDs, these average just 12-15 km per PPD, increasing outward, a more feasible distance to protect with fire-resistant land uses or PODs/FRTs than the 21-26 km average of total perimeter.
However, a significant finding here is the high potential of narrow fire-resistant land uses in creating fire-resistant barriers around PPDs. Consider the surprisingly small area that may need conversion to fire-resistant land uses if ≥23.8 m wide fire-resistant land uses (Safest + Generally Safe) can be used. The above result makes it clear that just 12-15 km per PPD may be sufficient, on average, to cross dangerous land uses within any buffer. Then, the minimum land area that would need to be converted can be roughly estimated as a narrow rectangle, which is 0.0238 km X 12 km to 0.0238 km X 15 km in area. This is just roughly 29-36 ha per community, a small area of conversion that could, at a minimum, fill a primary protection need for an average community.
Could PODs and FRTs in Outer Buffers Reduce Ember and Smoke Production, or Even Stop Fires?
The abundance of existing PODs and FRTs within PPDs and their buffers provides context for focusing these in outer buffers in a landscape plan to protect communities, particularly to reduce ember and smoke production, and lower fire severity, so fires are easier to stop. There is some uncertainty about the makeup of PODs. The 228,215 km of POD lines across the 11WS are half undescribed, but half the rest are roads, often small and dirt roads, and a smaller percentage each are bare surfaces, FRTs, lakes, rivers and streams, previous fires, and topographic features. PODs do include some fire-resistant land uses (Table 5), but are smaller and may not be very effective as passive fire-resistant features, since their goal is to provide active fire control.
Mapped existing PODs currently extend over 180,978 km within all parts of PPDs and their external buffers (Table 10). Almost 37,000 km of PODs are inside PPDs (Table 10), where they may be relatively unnecessary, and it is unclear whether the 29,000 km within 850 m of PPDs are necessary either, as in both cases it is most desirable to have the fires already out at the 850 m mark. These PODs have value if fires burn deeper into PPDs. Existing PODs do cover ∼1.8 times the ∼100,000 km needed to surround all 4484 PPDs in the 11WS, and the outer buffers between 850 m and 5000 m contain 114,952 km of PODs, about the right total if a system completely around the PPDs and their buffers is needed. However, it appears that the PODs system, if it was focused just on dangerous land uses, would currently be much longer than is actually needed. PODs are most extensive on private land, U.S. Forest Service land, and land with unknown owners, and are densest in 100-m buffers on each side of community boundaries (Table 10).
Would existing FRTs, if they had been assembled into a continuous length around the perimeters of the PPDs and their buffers, been extensive enough to serve to reduce ember and smoke production and fire severity as fires enter outer buffers? Mechanical FRTs from 2000-2021 are most extensive on U.S. Forest Service land and total 1,065,767 ha across PPDs and their buffers (Table 11), which together cover 62,987,467 ha (Table 3). So, only 1.7% of this total area has FRTs, also the percentage within the largest exterior buffer of 2500 m to 5000 m. However, if the 1,065,767 ha of existing FRTs had been done as a continuous FRT system around the ∼100,000 km total perimeters of the 4484 PPDs reported above, FRTs could have been about 100 m wide around all the PPDs in the 11WS (100,000 km X 0.1 km = 10,000 km2 = 1,000,000 ha). To achieve 500 m width would require about 5 million ha of FRTs, using the same logic. However, if 500-m width FRTs fully covered just dangerous land uses, reported above to cover 55,865 km around 850 m buffers and 66,366 km around 5000 m buffers, would require about 2.8 - 3.3 million ha of FRTs. Of course, these are rough estimates.
What Are the Patterns of Land Ownership Within the PPDs and Their Buffers?
Land ownership inside the PPDs and their buffers is incompletely recorded, given 19% with Unknown owners (Table 12), but if the extensive wildland vegetation (Table 13) and Dangerous + Very Dangerous land uses (Table 14) did not exist, and safe land uses (Table 15) were more extensive, fires could likely be better stopped at PPD borders. Safest + Generally Safe land uses are already somewhat extensive (Table 15). U.S. Forest Service, other federal, state, and tribal ownership are substantial inside PPDs and their buffers, together totaling about 24.3 million ha, 38.6% of the total area of PPDs + buffers (Table 12). These four owners, specific targets of the CWC program in its current form, all increase outward in the external buffers from PPD borders, while private land fluctuates from 40-53% (Table 12).
There is large land area within PPDs and buffers containing wildland vegetation. Ownership of wildland vegetation (Table 13) and dangerous land uses (Table 14) are most of interest, because 95% of recent burn area in PPDs occurred in wildland vegetation, and 88% in dangerous land uses. The four owners all have high percentages of their land in the PPDs and their buffers, that is wildland vegetation, varying from an overall 88.3% of state land to 98.4% of U.S. Forest Service land, contrasting with only 61.9% of private land (Table 13).
However, since not all wildland vegetation (e.g., deserts) is dangerous, the better estimator of community danger is land area in Dangerous + Very Dangerous categories (Table 14). Dangerous land uses are most extensive across 10.3 million ha of private land which is 38.7% of private land, 6.7 million ha of US Forest Service land which is 89.3% of their land, and 3.9 million ha of other federal land which is 47% of their land in the PPDs and buffers (Table 14). There are an additional 4.1 million ha in these categories across state and tribal land, with an overall total of 30,252,737 ha. This is the key area in the 11WS most in need and suitable for FRTs, to reduce embers/smoke, and for permanent fire-resistant land uses, which are consistent with CWC goals.
Contrasting this community danger, there is substantial land area in Safest + Generally Safe categories (Table 15) that already provides a solid backbone for protection of PPDs by fire-resistant land uses. In total this is 18,735,161 ha, of which only 5.6% of U.S. Forest Service land is in this category, with the other federal, state, private, and unknown owners all having about 30-35% of their ownership in the PPDs and their buffers in safe land uses (Table 15).
The upshot of these land ownership patterns is that the U.S. Forest, which has most of its land ownership in Dangerous + Very Dangerous land uses (Table 14) and very little in Safest + Generally Safe land uses (Table 15), largely has responsibility for reducing dangerous land uses. The other four land owners have a lower percentage of their land area in Dangerous + Very Dangerous land uses (39-50%, Table 14), but also substantially more total land area (Table 15).
How do FRT Treatment Areas for the CWC Compare to FRTs Needed in PPD Buffers?
How do the areas being used in the CWC compare to the critical areas within the PPD buffers from 850 m to 5000 m that need action to reduce fire risk to communities? The 10-year CWC plan focused within 8,093,712 million ha (20 million acres) of U.S. Forest Service (USFS) land plus 12,140,568 ha (30 million acres) of “other Federal, State, Tribal, and private lands” (USDA Forest Service 2022 p. 4), a total of 20,234,280 ha (50 million acres). The area from the CWC GIS map (Table 2) is 19,488,159 ha, so about 3.7% less than the plan. However, the CWC plan explains that “...fire-adapted conditions should be restored on 35 to 45 percent...” (USDA Forest Service 2022 p. 28). Using the original estimate and assuming 35-45 percent treatment means 2.83-3.64 million ha of U.S. Forest Service land, 4.25-5.46 million ha of other Federal, State, Tribal, and private lands, and 7.08-9.11 million ha in total of the 20,234,280 ha project area would be treated over 10 years. USFS reporting (e.g. USDA Forest Service 2024) only includes USFS accomplishments, but they are reporting for the first two years a rate that could reach the 2.83-3.64 million ha goal in 10 years. Therefore, I assume here that 7-9 million ha treated is a reasonable estimate for the 21 CWC landscapes in 10 years. Some of this 7-9 million ha is already being applied to protect communities, as the CWC program included this goal, and mentioned FACs, but not FRTs focused on communities, just FRTs often in distant forests.
Above, it was reported that about 3-5 million ha of FRTs within 850 m to 5000 m buffers around the 4484 PPDs in the 11WS could feasibly significantly lower ember and smoke production, and even stop wildfires under extreme conditions. This 3-5 million ha need is only about half of the 7-9 million ha expected to be treated in total under the CWC. Possibly around 20% of the 7-9 million ha have already been treated in distant forests and in some areas near PPDs under the CWC. In any case, there should be more than ample resources available to complete the 3-5 million ha of FRT treatments around all the PPDs in the 11WS, if necessary remaining CWC funds were re-allocated to this focus. There likely also is sufficient funding to assist communities in converting their internal dangerous land uses to safe land uses and for constructing narrow fire-resistant land uses to link safe land uses together in a CFRB. If this reaallocation occurred soon, then within about eight years, all communities could have exterior PODs/FRTs in place sufficient to slow or stop fires under even severe conditions, and be well underway in reducing dangerous land uses and in constructing a barrier (see below) of safer land uses.
4. Discussion
Average Populated Places Are Small, but with Large Buffers and Circumferences to Protect
The physical reality is that average PPDs in the 11WS are not large (Table 3), and are mostly surrounded (76%) by dangerous or not very safe vegetation (Figure 3). Among the 4484 PPDs in the 11WS, the average area is just 2,804 ha (Table 3), and if it were circular this would have a diameter of ∼6 km. However, the average perimeter needing protection from fire would then be ∼18.8 km and the average total of buffer areas out to 5000 m, that could contribute burning embers and smoke, would be 30,448 ha. This is more than ten times the area of the average PPD, and the total area of the 4484 PPDs and their buffers out to 5000 m is 62,987,467 ha, 20.45% of the 11WS. Also significant is that the number of units declines due to aggregation from 4484 in the PPDs to only 1306 in the most exterior 2500-5000 m buffer, which on average spans more than three PPDs (Figure 2). This means collaboration among PPDs is needed to protect exterior buffers, particularly larger shared ones. It is a daunting physical situation and spatial extent needed for protecting PPDs from fire, but sharing resources can reduce individual PPD burdens.
The finding that the total area of PPDs + 100 m buffers (Table 3) is 86% similar to the area of WUIs across the 11WS minus their uninhabited areas, underscores that the analysis here shows the important roles that exterior 850 m, 2500 m, and 5000 m buffers play in WUI fire safety. It is also indicative of the fire situation that 3,660,649 buildings (13.7% of the 11WS total) are in these outer buffers (Table 3) in the area of the PPDs + buffers most vulnerable to fires (Figure 8). This is evidence that WUIs alone are not a sufficient scale for analyzing the 11WS fire situation.
Average Populated Places Contain Dangerous Land Uses and Are Vulnerable to Fires
Unfortunately, the situation is much worse regarding fires than just the physical size reality, because for the 4484 PPDs, the average situation is substantial Dangerous and Very Dangerous land uses, that are not just extensive externally (40-54%; Figure 4g), but also surprisingly extensive (34-39%) internally (Figure 4g). These represent dangerous pathways that enable fires to burn deeply into internal areas of communities, which 372 fires did from 2000-2021 (Table 8).
This unfortunate finding is definitely partly a consequence of extensive naturally dangerous settings in wildland vegetation across the 11WS (Figure 3, Table 4). However, it is also likely that community expansion into dangerous wildland vegetation, possibly episodically repeated as densification reached a limit or communities simply desired to expand, contributed to the pattern of most smaller communities with extensive internal wildland vegetation, that are red (Figure 7a). Many small red communities with abundant internal wildland vegetation (Figure 7a), that also have high levels of Dangerous or Very Dangerous land uses (Figure 5), appear common. These are in dangerous shrub settings, as in parts of southern California, or dry-forest settings, as in the western Sierra and Klamath Mountains of California, in parts of northern Arizona and New Mexico, and in and near the Cascade Mountains of Oregon and the Rocky Mountains of Montana, Wyoming, and Colorado (Figure 3). Many other red communities are scattered around the margins of large PPDs that are blue (Figure 7a), suggesting these could be sprawled expansions into wildland vegetation. The red communities appear to be most at risk of fires.
However, Safeness categories (Figure 4, Figure 5 and Figure 6, Table 5) better define fire risk by incorporating the type of wildland vegetation. For example, red communities northeast of Los Angeles and in the Sonoran Desert of southern Arizona (Figure 7a) likely are relatively fire safe (Figure 3 and Figure 4), because substantial area of wildland vegetation is in Safest to Generally Safe categories (Table 5). Also, other red communities in the Chihuahuan Desert of southern New Mexico and in Great Plains grasslands of eastern New Mexico, Colorado and Wyoming (Figure 7a) are set in the Not Very Safe category of surrounding vegetation (Table 4, Figure 3). Wildland vegetation is definitely a significant risk factor for wildfire disasters (Caggiano et al. 2020), but wildland vegetation that recently had longer FRs, such as in deserts (Table 5), is safer.
Larger communities possibly could not continue expansion as they reached adjoining communities, so simply densified and consumed their internal wildland vegetation, leaving them mostly blue (Figure 7a). Internal densification and consumption of wildland vegetation function to limit fire penetration into larger PPDs (Figure 11). Lateral expansion of larger communities until adjoining community boundaries are reached is documented here by the 1,081 Populated Places (5,565-4,484 in Table 3) that now effectively share boundaries and so have merged into larger urbanized units. This is likely a general, but imperfect trend, as it can be seen that not all large Dissolved units have large areas without wildland vegetation (Figure 7a). Have these communities not densified enough to have developed their wildland vegetation or did they intentionally protect it, or are there other explanations? Further research is needed.
Another pattern is that smaller communities that appear blue, indicating “Not wildland vegetation” internally (Figure 7a), may often be in the midst of extensive agriculture and other relatively safe land uses, as in the Central Valley, California, the Willamette Valley, Oregon, and parts of Washington, Idaho, and Montana (Figure 7a). I hypothesize that these communities may have expanded and densified in the midst of valuable agricultural land, but more direct evidence is needed. These could be some of the fire-safest communities in the 11WS, with little internal or nearby wildland vegetation and surrounded by extensive fire-resistant agricultural land (Table 5).
Patterns of lateral expansion, sprawl, and densification have been reconstructed from detailed records in the U.S. since 1810 (Leyk et al. 2020), and they did not generally lead to development of fire-safe communities. In some areas, as in the Southwest, early population nodes expanded, then infilled and increased in density, possibly leading to some fire-safe communities (Figure 7a). Other communities, such as San Francisco, had significant topographic limitations to expansion, thus primarily densified over a long period (Leyk et al. 2020), also leaving a core with little to no wildland vegetation. However, in some mountainous areas, early population nodes infilled in the first half of the 1900s, then expanded, often as sprawl into wildland vegetation, in the last half (Leyk et al. 2020), at best leaving a small core and abundant wildland vegetation (Figure 7a). Although these processes likely explain patterns found here, further research is needed to link these more directly to Leyk et al.’s historical findings. It would also be valuable to understand how communities could now reshape themselves and their buffers to increase resistance to fires.
Communities not Designed to Prevent Wildfires, and Now ∼23 per year Are Burning in 11WS
Fire risk likely was not historically a significant factor in community design, but large and fast fires are now burning into about 23 vulnerable communities per year in the 11WS. Multiple pathways of community development occurred (Leyk et al. 2020), but which factors elevate risk of wildfire was not well understood or incorporated into community development, and with fewer communities and fewer fires, the risk was lower than today. Even recently, fire burning into communities remains infrequent, with an FR of about 198 years from 2000-2021 (22 years/0.111 of 4484 communities burned). However, there are so many PPDs, that a 198 year FR, on average, means fires burning into about 23 of the 4484 PPDs in the 11WS every year.
And, key factors increasing fire risk to communities were not known. It was not historically known that buildings within 850 m of wildland vegetation were those most likely to be lost in WUI wildfire disasters (Caggiano et al. 2020) or that 89% of structures damaged or destroyed were from “fast fires” that burned > 1620 ha in a day (Balch et al. 2024). It is sobering that fast fires, that each destroyed > 100 structures, averaged 8,569 ha/day (Balch et al. 2024), when PPDs plus buffers out to 850 m contain an average of just 5,491 ha (Table 3). PPDs do not burn readily, but if they did, this PPD area, on average, provides only about 2/3 of one day before complete burn-over, 1/3 day to burn over half. It has also been larger fires that most burn into PPDs (Figure 9, Syphard et al. 2022), and the larger the fire the more likely it was to burn into the interior of PPDs (Table 8). These have been most common in California and Arizona, but scattered around the West (Figure 1). Also, the ten fastest fires (Balch et al. 2024) were in grasslands, and three types of grasslands were found here to have had Very Dangerous FRs from 2000-2021 (Table 5). Finally, fast fires are often associated with strong winds on the day of ignition (Syphard et al. 2022) and in WUIs, which include most PPDs and buffers, 97% of ignitions have recently been human-caused (Mietkiewicz et al. 2020). People without this recent scientific knowledge settled in or near dangerous fire settings (Figure 3) likely not well understood at the time, and likely do not know now that people are igniting most of their fires. This is not mainly a wildfire problem, as explained by Calkin et al. (2023). These are mostly fires set near communities and burning large areas, and clear now that it is also a problem of wildland vegetation and dangerous land uses within and near communities.
In hindsight, it would have been best to have had no wildland vegetation, particularly no Dangerous or Very Dangerous wildland vegetation, inside PPDs or in their buffers out to at least 850 m. There likely would have been less chance of fires burning into and destroying buildings in the PPDs themselves. Of the 590,030 ha of PPD internal area burned from 2000 to 2021, 95% was burned in wildland vegetation and 88% burned in dangerous land uses. Also, Dangerous and Very Dangerous land uses had fires in external buffers at much higher rates than did safer land uses or wildland vegetation as a whole (Table 6). Unfortunately, there are ∼4.5 million ha of Dangerous and Very Dangerous land uses within PPDs and ∼8.3 million ha within PPDs and their buffers out to 850 m (Table 15). Abundant internal Dangerous and Very Dangerous land uses are most common in California and Arizona, but also scattered around the 11WS (Figure 5). What are possible solutions?
Small-Patch Burning Around PPDs as a Culturally Congruent Land-Use to Protect PPDs?
Could Native American burning practices provide a model for protecting communities today with small-patch burning? Native Americans burned around their living areas to reduce fuels, subsequent fires, and for other purposes, often called “small-patch burning” which is supported by evidence of more extensive fires after depopulation (e.g., Liebmann et al. 2016, Taylor et al. 2016). The scale of small-patch burning effects on landscapes is contested (Taylor et al. 2016), but in one case (Liebmann et al. 2016) impacts were near the 50,000 ha scale suggested for CWPPs by Hamilton et al. (2024). However, even at this scale, evidence suggests small-patch burns were not large: “Tree-ring records indicate that most of these fires were small and patchy, creating a fine mosaic of burned and unburned areas...” (Roos et al. 2024 p. 94). Small-patch burning was supplemented by small wood harvesting for fuel and construction (Roos et al. 2021).
This evidence suggests that today it could be culturally congruent and possibly also a little effective for there to be small-patch prescribed burning and limited small wood harvesting within buffers out to 5000 m from PPD boundaries. Where there are dry forests, identified here as a dangerous land use, these forests could be restored, perhaps to the lowest levels of tree density known historically, and have small-wood harvesting and prescribed burning every two decades, as suggested by Davis et al. (2024), potentially creating FRTs usable in the outer buffers as explained further below. I call this “modern small-patch burning” below. Unfortunately, analysis of 5,636 surveys of residents in 13 fire-prone communities across the West found mechanical treatment was most preferred and prescribed burning least-preferred for FRTs near communities (Brenkert-Smith et al. 2023). Perhaps this widespread preference could change, but if not, then this is likely not a good option. There would also be management complexity to accomplish it.
Directly Replacing Dangerous Land Uses with Safe Land Uses
It would be best for at-risk communities with abundant Dangerous and Very Dangerous land uses internally (Figure 5) or within 850 m to replace them as soon as possible with Safest and Generally Safe land uses (Table 5). This could occur by intentional densification, since developed areas have proven to be among Safest land uses (Table 5), or by intentional replacement with agriculture, woody wetlands, lakes or reservoirs, or other safe land uses (Table 5). Safest and Generally Safe land uses burned at the lowest FRs across the 11WS as a whole from 2000 to 2021 (Table 5), and also burned within PPDs and their external buffers at similar or lower rates (Table 6), the best available validation that these are fire-resistant land uses. Other open covers, such as large ballfields, golf courses, parking lots etc. could not be tested here, but might also work. Further research on potentially safe land uses is certainly warranted.
Of course, replacement with safer land uses would not be easy to accomplish, and could require a decade or two, funding, and community action. As observed in this study, densification was a historical pattern of community development (Leyk et al. 2020) that led to replacement of wildland vegetation in larger PPDs (Figure 7a). This would be very beneficial now. Almost 3.1 million ha of Dangerous and Very Dangerous land uses are privately owned in PPDs and their buffers out to 850 m (Table 15), and these may be where rapid safe densification or new development could be encouraged, at least within the PPD part. There are also ∼2.5 million ha of dangerous land uses in U.S. Forest Service, other Federal, or State ownership out to 850 m (Table 15), where perhaps major land-use change to safer land uses or sale to communities for land-use replacement with safer land uses could rapidly occur. For example, the U.S. Forest Service, which owns ∼1.4 million ha of Dangerous and Very Dangerous land uses within PPDs and their buffers out to 850 m (Table 14), could make a major contribution to community safety, if it transferred these lands to communities at a bargain rate for development of safe land uses. Other public owners of dangerous land uses (Table 14) could also have major positive impacts.
Unfortunately, time is of the essence, since the expectation is that 15-74 communities in the 11WS would have Dangerous and Very Dangerous land-uses burned each year (Table 5) until these are replaced. Need for difficult land-use changes must be balanced against the high costs and social disruption of ongoing fire disasters in the PPDs and their buffers, which are likely to burn 88% or more in dangerous land uses, as from 2000-2021. I suggest that substantial current CWC funding be reallocated to facilitating replacement of publicly owned dangerous land uses within the PPDs and their buffers out to 850 m, with the understanding that communities receiving this assistance would also take actions to replace their other dangerous land uses.
Constructing a Community Fire-Resistance Barrier (CFRB) Across Dangerous Land Uses
An alternative is to leave dangerous land uses partly in place and break continuous pathways of these dangerous land uses into PPDs (e.g., Figure 11) using an intentionally linked system I call here a “Community Fire-Resistance Barrier (CFRB).” This would best be positioned in buffers between 850 m and 5000 m, which fortunately have 12.6 million ha of Safest and Generally Safe land uses with diverse owners (Table 15), a great start. It could be best to generally favor the 850 m to 2500 m buffer area, which covers 5.1 million ha, to leave more area for ember and smoke reducing PODs/FRTs within the 2500 m to 5000 m buffer.
Compared to directly replacing all dangerous land uses, a CFRB could be more rapid, easier to achieve, and have relatively low cost, although likely less effectiveness and higher maintenance. The CFRB goal would be to link fire-resistant land uses into a continuous barrier that provides both passive and active resistance to fire spread into PPDs. A CFRB would be similar in some ways to a fuel-break network (Ager et al. 2023, Gannon et al. 2023), but the CFRB focuses on passive fire-resistant land uses as the primary protection, while fuel-break networks use mostly constructed segments with low fuel loading, supplemented by some fire-resistant land uses, such as access roads (Ager et al. 2023). The CFRB aims to stop most spreading fires, whereas fuel breaks frequently fail at this (Syphard et al. 2011).
The CFRB goal would be to extend completely around all the PPDs. The backbone would start with as much length of existing and validated fire-resistant features (Table 5–Safest or Generally Safe) of any shape or area, assuming these features can be relatively permanent. This backbone, likely in disjunct pieces, would then be linked together with new fire-resistant features, at a minimum to fully cross and break up existing Dangerous and Very Dangerous land uses. New fire-resistant features could be created by replacing Dangerous and Very Dangerous land uses, by improving existing PODs or other features, or by creating new features.
What features might work to link disjunct safer land uses that makeup the CFRB backbone? It has been tested and validated here that fire-resistant land-uses that are generally linear and ≥ 23.8 m wide, including U.S. Freeways, four-lane U.S. Motorways (not freeways), and large streams and rivers, all of which have no vegetation and are generally themselves unburnable, are effective as fire-resistant land uses. Of course, these features, since they may be as narrow as 23.8 m, are vulnerable to spotting over the feature, which also may explain why they are just Generally Safe, not Safest (Table 5). Also, the testing I did could not identify whether features resisted fires in part because of active fire control, as opposed to completely passive limitation, so the testing I did is preliminary in this sense. These features primarily have value in passively limiting the spread of fire fronts, but do also provide high quality locations for active fire control. These features may already have been included in the backbone, since they are in Table 5. Also, any existing PODs feature or other feature outside the mapped PODs, that has a dirt, gravel, paved, or water surface, so no vegetation, and is at least 23.8 m wide warrants initial use and testing as a possible fire-resistant feature. Existing narrower features, including all fire breaks, also could potentially be widened and have their surfaces cleaned of vegetation and hardened. It is advisable to have easy access for firefighters along the entire length of the CFRB, since its features can also all enable active fire control; it makes sense to have a road or other fire break toward the community from the CFRB, and adjacent to it, to enable fire control and maintenance.
The success of narrow features in Table 5 means that newly constructed narrow features, as intentional fire-resistant links in the CFRB, are both feasible and likely relatively low in cost. I reported above that just 12-15 km of length may be sufficient, on average, to cross dangerous land uses within any buffer around the average PPD. This means that a narrow area 23.8 m wide and 12-15 km long is all that is needed to potentially protect the average PPD, if there are no existing safe land uses at all around the PPD perimeter. This covers just 28.56-35.70 ha for an average PPD, likely economically feasible and feasible to maintain. These new features could be designed to have multiple functions, including for transportation, recreation, or other uses. The potential of linear fire-resistant features is high and warrants more consideration and testing.
Developed areas themselves could theoretically even be used in the CFRB, since they are fire-resistant in general (Table 5). However, the evidence from 2000-2021 fires is that fire-resistant features may be partly burned by spreading fires (5.8% of total burn area within PPDs from 2000-2021), but are much less likely to allow fire to fully cross the feature. Developed areas, however, cannot be allowed to function this way, accepting 5.8% of total burn area. This could be a consideration for some other fire-resistant features too, which need to be able to tolerate some fire without burning completely.
If there are insufficient possibilities for creating a complete CFRB backbone around a community with existing, added, or created fire-resistant features, and if Dangerous and Very Dangerous land uses cannot be fully replaced, then the main alternative may be a substantial fuel break across segments or all dangerous land uses. This assumes a fuel break is appropriate, feasible, and likely to function. A fuel break is a mostly linear feature that has reduced fuel loads or improved fuel types or arrangements, that reduce fire severity and/or fire spread while enhancing firefighter access for fire control (Syphard et al. 2011, Gannon et al. 2023). Fuel breaks can be combined with fire breaks, that are typically narrower and have little to no fuel. Some fuel breaks and fire breaks are already included in the mapped PODs network, and the combination could possibly be sufficient, but was not tested here. New fuel/fire breaks can also be constructed. The best fuel breaks are 90 m or more wide, but most effective are 300+ m widths, which can eliminate high-intensity fires and reduce spotting across the break (Ager et al. 2023, Gannon et al. 2023), which may be essential in dangerous land uses near or within communities. Fuel breaks require good access for firefighters and regular fuel treatments, possibly using modern small-patch burning, but success at controlling fires may still be only 22-47%, based on studies in southern California, due to dry and windy weather and intense fire behavior with spotting (Gannon et al. 2023). Given that fast fires caused most lost or damaged structures (Balch et al. 2024), fuel breaks are inherently very imperfect for protecting PPDs, as they were not designed for this purpose, but likely are better than dangerous land uses. They could serve temporarily while creating the CFRB.
Adding Essential Fire-Severity and Ember/Smoke-Reduction FRTs and Fire Breaks
Embers that can ignite buildings in PPDs without actual fire spread to them, have been very significant in WUI wildfire disasters (e.g., Manzello and Foote 2014), and smoke, in general, from wildfires is likely responsible for more than 3,000 times as many deaths as fires themselves (Ma et al. 2024). FRTs to lower fire intensity are needed (Davis et al. 2024), and can reduce fire spread somewhat, but also ember and smoke production, both of which are generally increased by higher fire intensity (Burke et al. 2023, Filkov et al. 2023).
In the framework here, FRTs for reducing fire intensity, embers, and smoke would be focused outside the CFRB in buffers from 850 m to 5000 m from PPD boundaries. The 5000 m distance is the typical maximum distance for embers to potentially ignite fires, though rare fires can be ignited beyond even this distance (Filkov et al. 2023). The 850 m distance is where fires need to be fully controlled, so that structures within PPD boundaries are protected from WUI wildfire disasters (Caggiano et al. 2020) from either embers or spreading fire. The assumption here is that the PPDs will have a closer CFRB and/or set of fuel breaks or other means to prevent spreading fires reaching PPDs or the exterior of the 850 m buffer. FRTs from 850 m to 5000 m may reduce embers, but also smoke, fire intensity, and fire spread, particularly if they also have fire breaks and easy access for maintenance and active fire control.
Is the existing area of FRTs extensive enough to reduce ember and smoke production and fire severity as fires enter outer buffers, if it had been assembled in a continuous band around the perimeter of outer buffers? Yes, the roughly 1 million ha of FRTs completed from 2000-2021 could have covered about a 100 m wide band around all the PPDs in the 11WS (100,000 km X 0.1 km = 10,000 km2 = 1,000,000 ha). A 100-m wide FRT band is sufficient to reduce crown fires to surface fires along its whole length, based on research in California forests (Safford et al. 2012), and likely to also substantially reduce ember and smoke production. The existing 2000-2021 FRT system was thus a significant missed opportunity to have already provided very substantial protection to all the PPDs in the 11WS.
However, now there are other opportunities to use remaining CWC funding that could likely achieve even more protection of the 4484 PPDs with an FRT outer band around the PPDs. To achieve 500 m width, which Safford et al. suggest could be needed to slow or stop wildfires under extreme conditions in California forests, would require about 5 million ha of FRTs, using the same logic as above. However, if 500-m width FRTs fully covered just dangerous land uses, reported above to cover 55,865 km around 850 m buffers and 66,366 km around 5000 m buffers, it would require only about 2.8 - 3.3 million ha of FRTs. So, ∼3 million ha of FRTs could probably protect all 4484 PPDs in the 11WS from any fires, even in extreme conditions, burning in dangerous land uses, and ∼5 million ha of FRTs could likely protect all perimeters around the 4484 PPDs in the 11WS from any fires in even severe conditions. These are big opportunities, that could be fully completed in the next eight years with the remaining funding in the CWC.
It is not clear whether it would be better to place FRT/fire break combinations next to the CFRB toward its exterior or further out in the buffers. Adding FRTs/fire breaks adjacent to the CFRB could reduce fire intensity, spread, ember production, smoke, and possibly enable fire control right before fire reaches fire-resistant land uses, where the fire must be stopped. This would add to PPD protection from spreading fires. But, smoke and ember production and their aerial transport to the PPD may have already occurred from fire further out, which is undesirable. However, moving the FRT/fire break further out may also enable fire intensity, spread, and smoke/ember production to increase again before reaching the CFRB, if the fire is not extinguished at the FRT/fire break. Nonetheless, there are 2.13 million additional buildings in the two buffers beyond 850 m (Table 3) that, if they were protected at least with an FRT/fire break, would mean about 95% of buildings in the 11WS would have some direct protection from fires. These unresolved tradeoffs suggest more research and attention to local situations are needed.
An earlier creative conceptual framework suggested identifying zones of ember exposure to communities, based on variation in ember production in nearby wildland fuels, mostly bark and twigs in forests and finer materials in shrublands (Filkov et al. 2023), and ember transport, affected by local topography and weather (Maranghides and Mell 2013). Similar concepts are relevant for smoke, too. Identified zones of high ember and smoke exposure to the community would especially receive upwind FRTs and possibly replacement with fire-resistant land uses. However, data and analysis for calibrating and identifying zones are needed. Substantial research on embers is underway (e.g., Filkov et al. 2023), that could lead to more pragmatic guidance for community protection, but a focus on spatial aspects of ember production and transport is needed at the landscape and community scales. Spatial smoke transport and dispersion models (Mallia and Kochanski 2024) are available to analyze smoke transport within landscapes at the scale of communities and their buffers. An example is DaySmoke (Achtemeir et al. 2011), which has been used to estimate smoke transport to communities from prescribed fires. If ember transport was similar spatially to smoke transport, that could enable simpler analysis. Reducing ember and smoke production and transport to communities and their buffers warrants more research. If there were high source areas for embers and smoke, those could receive more intense FRT attention.
No Need for Focusing Community Planning and Action at a Particular Spatial Scale
Communities have been collaborating on Community Wildfire Protection Plans (CWPPs), but recent research suggests these may be at spatial scales that are too small or too large relative to fires (Hamilton et al. 2024), but this is not an important issue here. Here, the focus is not on matching the scale of fires from a planning standpoint, but instead from a defensive standpoint, matching the functional scales of ember and smoke production (2500 m, 5000 m), and high risk to buildings from spreading fires (850 m, 100m). And, there is very large variation in the area of the community plus its buffers, so there is no fixed relevant scale for a PPD. However, if the total area of PPDs and their buffers, 62,987,467 ha, is divided by 4484 PPDs (Table 3), the mean is 14,047 ha, which is the mean appropriate planning scale for the defensive approach to fire by PPDs. Also, with the approach here, the origin of the fires is not of much interest, unless to help understand which sides of a PPD are most vulnerable to fires. PPDs with effective fire-resistant land uses have little need for concern about exposure from fires in distant forests, as is the mis-directed CWC focus. An effective defensive approach enables prevention of fires from any source, also enabling wildfires to be restored in distant forests, a specific goal of FACs and the LWF approach, which the CWC explained but is not addressing as a primary focus.
Fire-Resistant Land Uses Around PPDs Enable Restoration of Wildfires in Adjoining Landscapes
This is an explicit goal of the FACs program and inherent in LWF conceptual frameworks, as reviewed in the Introduction. The CWC program focuses on reducing the severity of fires in forests and other vegetation to reduce fires burning into PPDs, but this would conceptually not be needed to protect PPDs, since all PPDs would be expected to be directly protected around their perimeters. Assuming that this works as expected here, and it warrants more analysis, this could mean that fires could burn to any size or at any severity without much concern to communities, except perhaps from smoke. It is already well documented, for example, that FRTs are not ecologically needed in dry forests of the western USA, which are one of the dangerous land uses in Table 5, since wildfires of all severities are deficient relative to historical fire regimes in most of these forests (Baker 2015, Baker et al. 2023), even based on the government’s own historical and recent evidence (Baker 2024). An exception is in California, where human-set fires and climate change may have led to too much recent fire. Other ecosystems may need additional assessments of historical versus modern fire regimes, as human-set fires and climate change could also have led to excessive fire in some cases.
Limitations
People living in communities of the 11WS may find the research completed in this paper to provide insufficient practical information about their particular communities; this is a limitation. There are 4484 PPDs with wide variation in landscape setting, history, and internal composition of land uses, too much to cover here. Unfortunately, individual communities at this point must complete their own analysis and plan, hopefully benefitting from this study and others. I would hope that further research on fire-resistant land uses will become available to assist communities. This study is not based on understanding or evidence about public desires and preferences or principles of urban planning, which is a significant shortcoming. There are assets and values in communities, such as open space, economic development etc. that warrant incorporation into the conceptual framework here. Similarly, practical understanding of community protection from wildfires by dedicated public personnel, is also not incorporated here, but would be beneficial. Other fire-related risks that need attention, such as evacuation routes, are not addressed. I hope that other research will help to overcome these limitations.
Why Move Funding/Action from CWC to This Proposed Landscape-Scale Fire Solution
Readers of this study may wonder–why did I not do an exposure analysis of fire risk to communities using simulated fire regimes, a central basis for the CWC program? Why is the CWC program’s use of simulated exposure analysis erroneous, and its use of FRTs highly likely to fail, possibly even increasing the damaging spread of wildfires into communities? The answer is that the scientific basis for the current CWC focus has very large errors or little to no evidence.
U.S. Forest Service researchers and their contractors created a simulation-driven alternative (FSIM; Finney et al. 2011) to the empirical method I used to estimate fire risk to communities. FSIM has been applied to estimate wildfire exposure to the WUI in the 11WS (Ager et al. 2019), and the impact of FRTs in forests on this exposure (Ager et al. 2021a), that is the basis for the ∼$7 billion dollar CWC program. Their method for wildfire risk assessment uses random fire-start locations, weather data from 134 planning units across the US, and maps of fuels that drive estimates of large fire sizes, calibrated with 1992-2008 fires, and estimates of suppression actions, to derive burn probabilities for individual locations, such as a place in or near PPDs.
Simulation can be valuable for understanding relationships and general findings, but it is very difficult to create landscape-scale simulation models that can make accurate predictions (Mladenoff and Baker 1999). The FSIM-based simulation method has now been tested for predicting exposure of communities to extreme wildfire events that lead to WUI wildfire disasters in the 11WS, and it failed this key test by a 260% over-prediction of exposure to these events (Ager et al. 2021b p. 10). That is such a large prediction error that the results cannot be trusted, and it is certainly not valid to use this model for prediction. However, Ager et al. (2021a) used this inaccurate simulation approach to estimate potential effects of ten years of FRTs during the CWC program: “Treatments in our scenario were narrowly focused on reducing uncontrolled fire spread into developed areas...” (Ager et al. 2021a p. 8-9). However, there was no empirical testing or results at all showing fire spread into communities was reduced by previous FRTs. So, this narrow focus has no empirical evidence, and the simulation modeling was too erroneous to use.
Also, no evidence was presented at all that FRTs reduce fire size, which is not even mentioned as a primary FRT purpose in a recent review (Davis et al. 2024). The CWC goal of reducing exposure of communities to wildfires cannot be accomplished by reducing just fire severity, as fires can still burn into communities. A systematic review of landscape-scale FRT effectiveness (McKinney et al. 2022) found only two significant studies of FRTs and fire size. Cochrane et al. (2012) studied 14 wildfires in nine states and found that: “...when fuel treatments encompassed 5.3 to 57.1% of land area, the average wildfire size was reduced by 7.2%” (McKinney et al. 2022 p. 12). Cochrane et al. (2013) studied 85 wildfires with 3489 FRTs and found that 54 wildfires had a mean reduction of 19% in area burned, two wildfires did not change in extent, but 19 wildfires actually had a mean increase of 22% in area burned (McKinney et al. 2022). These findings do not support Ager et al.’s (2021a) claim that the CWC program’s use of FRTs in distant forests will significantly reduce uncontrolled fire spread into developed areas, as wildfires may be reduced only a little (7.2-19% on average) or may actually increase by 22%.
It is also almost obvious that reducing fire severity in distant forests does not mean the fire’s severity will still be reduced if/when fires reach PPD buffers. To keep fire severity reduced, more FRTs would be required along the whole pathway from the distant forests to the outer PPD buffer. A wildfire can easily flare up within even 100 m of an FRT if unreduced fuels or more naturally susceptible vegetation are encountered. The CWC plan thus is based on large prediction error and omission of key evidence.
The fire record from 2000-2021 makes it possible to roughly estimate what could have and could not have been accomplished if the CWC program had been in place and completed by the year 2000, so FRTs had been completed over about 7-9 million ha of the 20.2 million ha CWC project area. What happened from 2000 to 2021 was 9,412,632 ha in fires in total across the 11WS that also burned within PPDs, but the area burned in the PPDs was only 590,030 ha. However, 4,373,713 ha of these fires burned in both CWC areas and PPDs, and only 2,103,235 ha of these fires burned within the CWC areas, so it is only this 22.3% subset of the total of 9,412,632 ha of fires, that had a part that reached PPDs, that could have been affected if CWC FRTs had occurred. And it is only 48.1% of the 4,373,713 ha that burned in both CWC areas and PPDs that could have been affected. Assuming the same 48.1% proportion of fires, that occurred in both CWC areas and PPD areas, reached PPDs, this means that 0.481 X 590,030 ha or 283,804 ha of the 590,030 ha total burn area within PPDs could have been affected by FRTs in CWC areas. Assume the best outcome from the Cochrane et al. (2013) study, which is a mean reduction in area burned of 19%, omitting the 22% increase that also occurred. That would be a reduction of 0.19 X 283,804 ha = 53,923 ha. So, in total out of the 590,030 ha burned in PPDs from 2000-2021, the best possible reduction in burned area in PPDs would have been to 536,107 ha, a 9% reduction in burned area within the PPDs, with 91% still occurring.
It is easy to see from this that the central problems of the CWC approach are that the CWC areas are too far away from the PPDs and can affect only a small percentage (22.3%) of fires that reach the PPDs, and FRTs only reduce burned area by, at best, 19%, based on Cochrane et al. (2013). In contrast, there are two great advantages of the fire-resistant land-use approach in PPD buffers–the treatments are moved close to the PPDs so they affect nearly 100% of the fires that reach the PPDs and they likely can reduce burned area of the fires in PPDs by a high percentage, based on the validations here.
In summary, studies reviewed above show that the FSIM modeling of Ager et al. (2021b) cannot predict the exposure of communities or their buildings to wildfires at all accurately (260% prediction error). As a result, the ∼$7 billion dollar CWC program of using FRTs to reduce fire spread into communities is likely to incorrectly identify which communities have significant exposure to wildfires. The CWC program also will likely have little beneficial effect (mean of at best 19% reduction in fire spread), and could even increase fires burning into communities by 22%. FRTs in distant forests likely would not reduce the intensity of fires burning several km to PPD buffers.
5. Conclusions
The scientific basis for the current CWC program is based on large errors in simulations and significant omitted or nonexistent evidence. Research that supported this program did not first analyze and reject the most compelling alternative that is already widely accepted as a better alternative by the LWF scientific framework and is already being implemented by the Fire-Adapted Communities program around the 11WS. Evidence here is compelling that all remaining funding allocated to the CWC program should be redirected to a fire-resistant land-use program around communities, as explained and validated in this paper, if the goal of the CWC program is to reduce exposure of communities in the 11WS states to fires. Some funding has already been spent, but likely most communities in the 11WS states could still be potentially nearly fully protected from fires burning into them, if CWC funding was moved out of distant forests and into developing fire-resistant land uses within PPDs and their buffers over the next decade. It would be relatively easy to stop FRTs in distant forests and move them into the outer buffers of the PPDs, quickly providing the 4484 PPDs in the 11WS with solid reduction in risks from embers and smoke, as well as even a wide FRT band potentially capable of stopping fires under extreme conditions. This would buy time for PPDs to complete a barrier of fire-resistant land uses, validated here, that would not require complete retreatment every 20 years for hundreds of years, as do FRTs. More empirical research on this topic is certainly needed and welcome. However, the opportunity these findings provide is relatively quick, large, doable, and validated.
Funding
This research received no external funding.
Data Availability Statement
All original data used in the study are available from the sites listed in Table 2.
Acknowledgments
I appreciate comments from the reviewers and editor.
Conflicts of Interest
The author declares no conflicts of interest.
References
- Achtemeier, G.L., Goodrick, S.A., Liu, Y., Garcia-Menendez, F., Hu, Y., Odman, M.T. 2011. Modeling smoke plume rise and dispersion from southern United States prescribed burns with daysmoke. Atmophere 2: 358-388. [CrossRef]
- Ager, A.A., Palaiologou, P., Evers, C.R., Day, M.A., Ringo, C. 2019. Wildfire exposure to the wildland urban interface in the western US. Applied Geogr. 111, 102059. [CrossRef]
- Ager, A.A., Evers, C.R., Day, M.A., Alcasena, F.J., Houtman, R. 2021a. Planning for future fire: Scenario analysis of an accelerated fuel reduction plan for the western United States. Landsc. Urban Plan. 215: 104212.
- Ager, A.A., Day, M.A., Alcasena, F.J., Evers, C.R., Short, K.C., Grenfell, I. 2021b. Predicting Paradise: modeling future wildfire disasters in the western US. Sci. Tot. Envir. 784: 147057. [CrossRef]
- Ager, A.A., Day, M.A., Aparicio, B.A., Houtman, R., Stinchfield, A. 2023. Optimizing the implementation of a forest fuel break network. PloS One 18: e0295392. [CrossRef]
- Alcasena, F., Ager, A.A., Belavenutti, P., Krawchuk, M., Day, M.A. 2022. Contrasting the efficiency of landscape versus community protection fuel treatment strategies to reduce wildfire exposure and risk. J. Envir. Mgmt. 309: 114650. [CrossRef]
- Baker, W.L. 2009. Fire ecology in Rocky Mountain landscapes. Island Press, Washington, D.C.
- Baker, W.L. 2015. Are high-severity fires burning at much higher rates recently than historically in dry-forest landscapes of the western USA? PloS One 10: 30136147.
- Baker, W.L. 2024. Contemporary wildfires not more severe than historically: More fire of all severities needed to sustain and adapt western US dry forests as climate changes. Sustainability 16: 3270. [CrossRef]
- Baker, W.L., Hanson, C.T., Williams, M.A., DellaSala, D.A. 2023. Countering omitted evidence of variable historical forests and fire regime in western USA dry forests: The low-severity-fire model rejected. Fire 6: 146.
- Balch, J.K., Iglesias, V., Mahood, A.L., Cook, M.C., Amaral, C., DeCastro, A., Leyk, S., McIntosh, T.L., Nagy, R.C., St. Denis, L., Tuff, T., Verleye, E., Williams, A.P., Kolden, C.A. 2024. The fastest-growing and most destructive fires in the US (2001 to 2020). Science 386: 425-431.
- Brenkert-Smith, H., Goolsby, J.B., Champ, P.A., Meldrum, J.R., Donovan, C., Wagner, C., Barth, C.M., Forester, C., Wittenbrink, S. 2023. Western Econ. Forum 21(2): 5-23.
- Burke, M., Childs, M.L, de la Cuesta, B., Qui, M. Li, J., Gould, C.F., Heft-Neal, S., Wara, M. 2023. The contribution of wildfire to PM2.5 trends in the USA. Nature 622: 761-766.
- Caggiano, M.D., Hawbaker, T.J., Gannon, B.J., Hoffman, C.M. 2020. Building loss in WUI disasters: evaluating the core components of the wildland-urban interface definition. Fire 3: 73. [CrossRef]
- Calkin, D.E., Cohen, J.D., Finney, M.A., Thompson, M.P. 2014. How risk management can prevent disasters in the wildland-urban interface. Proc. Nat. Acad. Sci. 111: 746-751. [CrossRef]
- Calkin, D.E., Barrett, K., Cohen, J.D., Finney, M.A., Pyne, S.J., Quarles, S.L. 2023. Wildland-urban fire disasters aren’t actually a wildfire problem. Proc. Nat. Acad. Sci. 120: e2315797120. [CrossRef]
- Cochrane, M.A., Moran, C.J., Wimberly, M.C., Baer, A.D., Finney, M.A., Beckendorf, K.L., Eidenshink, J., Zhu, Z. 2012. Estimation of wildfire size and risk changes due to fuels treatments. Int. J. Wildl. Fire 21: 357-367.
- Cochrane, M.A., Wimberly, M.C., Eidenshink, J.C., Zhu, Z., Ohlen, D., Finney, M., Reeves, M. 2013. Fuel treatment effectiveness in the United States, Final report to the Joint Fire Science Program, JFSP Project #06-3-3-11.
- Cohen, J.D. 2000. Preventing disaster: Home ignitability in the wildland-urban interface. J. For. 98(3), 15-21.
- Davis, K.T., Peeler, J., Fargione, J., Haugo, R.D., Metlen, K.L., Robles, M.D., Woolley, T. 2024. Tamm review: a meta-analysis of thinning, prescribed fire, and wildfire effects on subsequent wildfire severity in conifer dominated forests of the western US. For. Ecol. Manage. 561: 121885.
- Dillon, G.K., Lazarz, M.T., Karau, E.C., Story, S.J., Pohl, K.A. 2024. Wildfire risk to communities 2.0: Methods for creating community wildfire risk reduction zones for the United States. USDA Forest Service, Wildfire Risk to Communities, Online at: https://wildfirerisk.org/download/, 23 pp.
- Faustini, J.M., Kaufmann, P.R., Herlihy, A.T. 2009. Downstream variation in bankfull width of wadeable streams across the conterminous United States. Geomorphology 108: 292-311. [CrossRef]
- Filkov, A.I., Tihay-Felicelli, V., Masoudvaziri, N., Rush, D., Valencia, A., Wang, Y., Blunck, D.L., Valero, M.M., Kempna, K., Smolka, J., De Beer, J., Campbell-Lochrie, Z., Centeno, F.R. Ibrahim, M.A., Lemmertz, C.K., Tam, W.C. 2023. A review of thermal exposure and fire spread mechanisms in large outdoor fires and the built environment. Fire Safety J. 140: 103871. [CrossRef]
- Finney, M.A., McHugh, C.W., Grenfell, I.C., Riley, K.L., Short, K.C. 2011. A simulation of probabilistic wildfire risk components for the continental United States. Stoch. Environ. Res. Risk Assess. 25:973-1000. [CrossRef]
- Gannon, B., Wei, Y., Belval, E., Young, J., Thompson, M., O’Connor, C., Calkin, D., Dunn, C. 2023. A quantitative analysis of fuel break effectiveness drivers in southern California National Forests. Fire 6: 104. [CrossRef]
- Hamilton, M., Evers, C., Nielsen-Pincus, M., Ager, A. 2024. Matching the scales of planning and environmental risk: an evaluation of community wildfire protection plans in the western US. Reg. Environ. Change 24: 93. [CrossRef]
- Kalies, E.L., Yocum Kent, L.L. 2016. Tamm review: Are fuel treatments effective at achieving ecological and social objectives? A systematic review. For. Ecol. Manage. 375: 84-95.
- Keeley, J.E., Fotheringham, C.J., Moritz, M.A. 2004. Lessons from October 2003 wildfires in Southern California. J. For. 102(7): 26-31. [CrossRef]
- Leyk, S., Uhl, J.H., Connor, D.S., Braswell, A.E., Mietkiewicz, N., Balch, J.K., Gutmann, M. 2020. Two centuries of settlement and urban development in the United States. Sci. Adv. 6: eaba2937.
- Liebmann, M.J., Farella, J., Roos, C.I., Stack, A., Martini, S., Swetnam, T.W. 2016. Native American depopulation, reforestation, and fire regimes in the Southwest United States, 1492-1900. Proc. Nat. Acad. Sci. 113: E696-E704.
- Ma, Y., Liu, Y., Wei, J., Lu, Y., Krumholz, H.M., Bell, M.L., Chen, K. 2024. Long-term exposure to wildland fire smoke PM2.5 and mortality in the contiguous United States. Proc. Nat. Acad. Sci. 121: e2403960121. [CrossRef]
- Maladenoff, D.J., Baker, W.L. (Editors). 1999. Spatial modeling of forest landscape change: approaches and applications. Cambridge University Press, New York.
- Mallia, D.V., Kochanski, A.K. 2024. A review of modeling approaches used to simulate smoke transport and dispersion. Pages 127-148 In: Loboda, T.V., French, N.H.F., Puett, R.C., Editors. Landscape fire, smoke, and health: linkingbiomass burning emissions to human well-being. Vol. 280, Geophysical Monograph Series, Am. Geophys. Union, Washington, D.C.
- Manzello, S.L., Foote, E.I.D. 2014. Characterizing firebrand exposure from wildland-urban interface (WUI) fires: results from the 2007 Angora fire. Fire Technology 50: 105-124. [CrossRef]
- Maranghides, A., Mell, W. 2013. Framework for addressing the national wildland urban interface fire problem–determining fire and ember exposure zones using a WUI hazard scale. National Institute of Standards and Technology Technical Note 1748, U.S. Dept. of Commerce. 26 pp.
- McKinney, S.T., Abrahamson, I., Jain, T., Anderson, N. 2022. A systematic review of empirical evidence for landscape-level fuel treatment effectiveness. Fire Ecol. 18: 21. [CrossRef]
- McWethy, D.B, Schoennagel, T., Higuera, P.E., Krawchuk, M., Harvey, B.J., Metcalf, E.C., Schultz, C., Miller, C., Metcalf, A.L., Buma, B., Virapongse, A., Kulig, J.C., Stedman, R.C., Ratajczak, Z., Nelson, C., Kolden, C. 2019. Rethinking resilience to wildfire. Nature Sustain. 2: 797-804. [CrossRef]
- Mietkiewicz, N., Balch, J.K., Schoennagel, T., Leyk, S., St. Denis, L.A., Bradley, B.A. 2020. In the line of fire: consequences of human-ignited wildfires to homes in the U.S. (1992-2015). Fire 3: 50.
- Moritz, M.A., Batllori, E., Bradstock, R.A., Gill, A.M., Handmer, J., Hessburg, P.F., Leonard, J., McCaffrey, S., Odion, D.C., Schoennagel, T., Syphard, A.D. 2014. Learning to coexist with wildfire. Nature 515: 58-66. [CrossRef]
- Moritz, M.A., Butsic, V. 2020. Building to coexist with fire: Community risk reduction measures for new development in California. Univ. Calif. Agric. Nat. Res. Publication 8680, Santa Barbara, CA.
- Moritz, M.A., Hazard, R., Johnston, K., Mayes, M., Mowery, M., Oran, K., Parkinson, A.-M., Schmid, D.A., Wesolowski, G. 2022. Beyond a focus on fuel reduction in the WUI: the need for regional wildfire mitigation to address multiple risks. Front. Forests Glob. Change 5: 848254. [CrossRef]
- National Research Council. 2005. Assessing and managing the ecological impacts of paved roads. National Academies Press, Washington, D.C.
- Palsa, E., Bauer, M., Evers, C., Hamilton, M., Nielsen-Pincus, M. 2022. Engagement in local and collaborative wildfire risk mitigation planning across the western U.S.–Evaluating participation and diversity in Community Wildfire Protection Plans. PloS One 17: e0263757. [CrossRef]
- Paveglio, T.B., Edgeley, C.M. 2020. Fire adapted community. Pages 320-328 In: Manzello, S., editor. Encyclopedia of wildfires and wildland-urban interface (WUI) fires. Springer Nature Switzerland AG.
- Radeloff, V.C., Hammer, R.B., Stewart, S.I., Fried, J.S., Holcomb, S.S., McKeefry, J.F. 2005. The wildland-urban interface in the United States. Ecol. Applic. 15: 799-805. [CrossRef]
- Radeloff, V.C., Mockrin, M.H., Helmers, D., Carlson, A., Hawbaker, T.J., Martinuzzi, S., Schug, F., Alexandre, P.M., Kramer, H.A., Pidgeon, A.M. 2023. Rising wildfire risk to houses in the United States, especially in grasslands and shrublands. Science 382: 702-707. [CrossRef]
- Roos, C.I., Swetnam, T.W., Ferguson, T.J., Liebmann, M.J., Loehman, R.A., Welch, J.R., Margolis, E.Q., Guiterman, C.H., Hockaday, W.C., Aiuvalasit, M.J., Battillo, J., Farella, J., Kiahtipes, C.A. 2021. Native American fire management at an ancient wildland-urban interface in the Southwest United States. Proc. Nat. Acad. Sci. 118: e2018733118. [CrossRef]
- Roos, C.I., Swetnam, T.W., Guiterman, C.H. 2024. Indigenous land use and fire resilience of southwest USA ponderosa pine forests. Pages 87-103 In: Whitaker, J.A., Armstrong, C.G, and Odonne, G., editors. Climatic and ecological change in the Americas, a perspective from historical ecology. Routledge, London.
- Safford, H.D., Stevens, J.T., Merriam, K., Meyer, M.D., Latimer, A.M. 2012. Fuel treatment effectiveness in California yellow pine and mixed conifer forests. For. Ecol. Manage. 274: 17-28. [CrossRef]
- Schoennagel, T., Balch, J.K., Brenkert-Smith, H., Dennison, P.E., Harvey, B.J., Krawchuk, M.A., Mietkiewicz, N., Morgan, P., Moritz, M.A., Rasker, R., Turner, M.G., Whitlock, C. 2017. Adapt to more wildfire in western North American forests as climate changes. Proc. Nat. Acad. Sci., 114: 4582-4590.
- Scott, J.H., Thompson, M.P., Gilbertson-Day, J.W. 2016. Examining alternative fuel management strategies and the relative contribution of National Forest System land to wildfire risk to adjacent homes–a pilot assessment on the Sierra National Forest, California, USA. For. Ecol. Manage. 362: 29-37. [CrossRef]
- Sil, A., Azevedo, J.C., Fernandes, P.M., Honrado, J.P. 2024. Will fire-smart landscape management buffer the effects of climate and land-use changes on fire regimes. Ecol. Proc. 13: 57.
- Stephens, S.L., Battaglia, M.A., Churchill, D.J., Collins, B.M., Coppoletta, M., Hoffman, C.M., Lydersen, J.M., North, M.P., Parsons, R.A., Ritter, S.M., Stevens, J.T. 2021. Forest restoration and fuels reduction: convergent or divergent? BioScience 71: 85-101.
- Syphard, A.D., Keeley, J.E., Brennan, T.J. 2011. Factors affecting fuel break effectiveness in the control of large fires on the Los Padres National Forest, California. Int. J. Wildland Fire.
- Syphard, A.D., Keeley, J.E., Gough, M., Lazarz, M., Rogan, J. 2022. What makes wildfires destructive in California? Fire 5: 133.
- Taylor, A.H., Trouet, V., Skinner, C.N., Stephens, S. 2016. Socioecological transitions trigger fire regime shifts and modulate fire-climate interactions in the Sierra Nevada, USA, 1600-2015 CE. Proc. Nat. Acad. Sci., 113: 13684-13689.
- Thompson, M.P., O’Connor, C.D., Gannon, B.M., Caggiano, M.D., Dunn, C.J., Schultz, C.A., Calkin, D.E., Pietruszka, B., Greiner, S.M., Stratton, R., Morisette, J.T. 2022. Potential operational delineations: New horizons for proactive, risk-informed strategic land and fire management. Fire Ecology 18: 17. [CrossRef]
- USDA Forest Service. 2022. Confronting the wildfire crisis, a strategy for protecting communities and improving resilience in America’s forests. FS-1187a, U.S. Forest Service, Washington, D.C. 47 pp.
- USDA Forest Service. 2024. A historic year: Expanding the pace and scale of wildfire risk reduction and forest health treatments. FS-1187, U.S. Forest Service, Washington, D.C. 15 pp.
- Wei, Y., Gannon, B., Young, J., Belval, E., Thompson, M., O’Connor, C., Calkin, D. 2023. Estimating WUI exposure probability to a nearby wildfire. Fire Ecology 19: 30. [CrossRef]
- Williams, D.R., Jakes, P.J., Burns, S., Cheng, A.S., Nelson, K.C., Sturtevant, V., Brummel, R.F., Staychock, E., Souter, S.G. 2012. Community wildfire protection planning: the importance of framing, scale, and building sustainable capacity. J. For. 110: 415-420. [CrossRef]
Figure 1.
Fires (n = 788) from 2000 to 2021 that burned into communities, the 4484 Populated Places Dissolved (PPDs) described in the Methods.
Figure 1.
Fires (n = 788) from 2000 to 2021 that burned into communities, the 4484 Populated Places Dissolved (PPDs) described in the Methods.
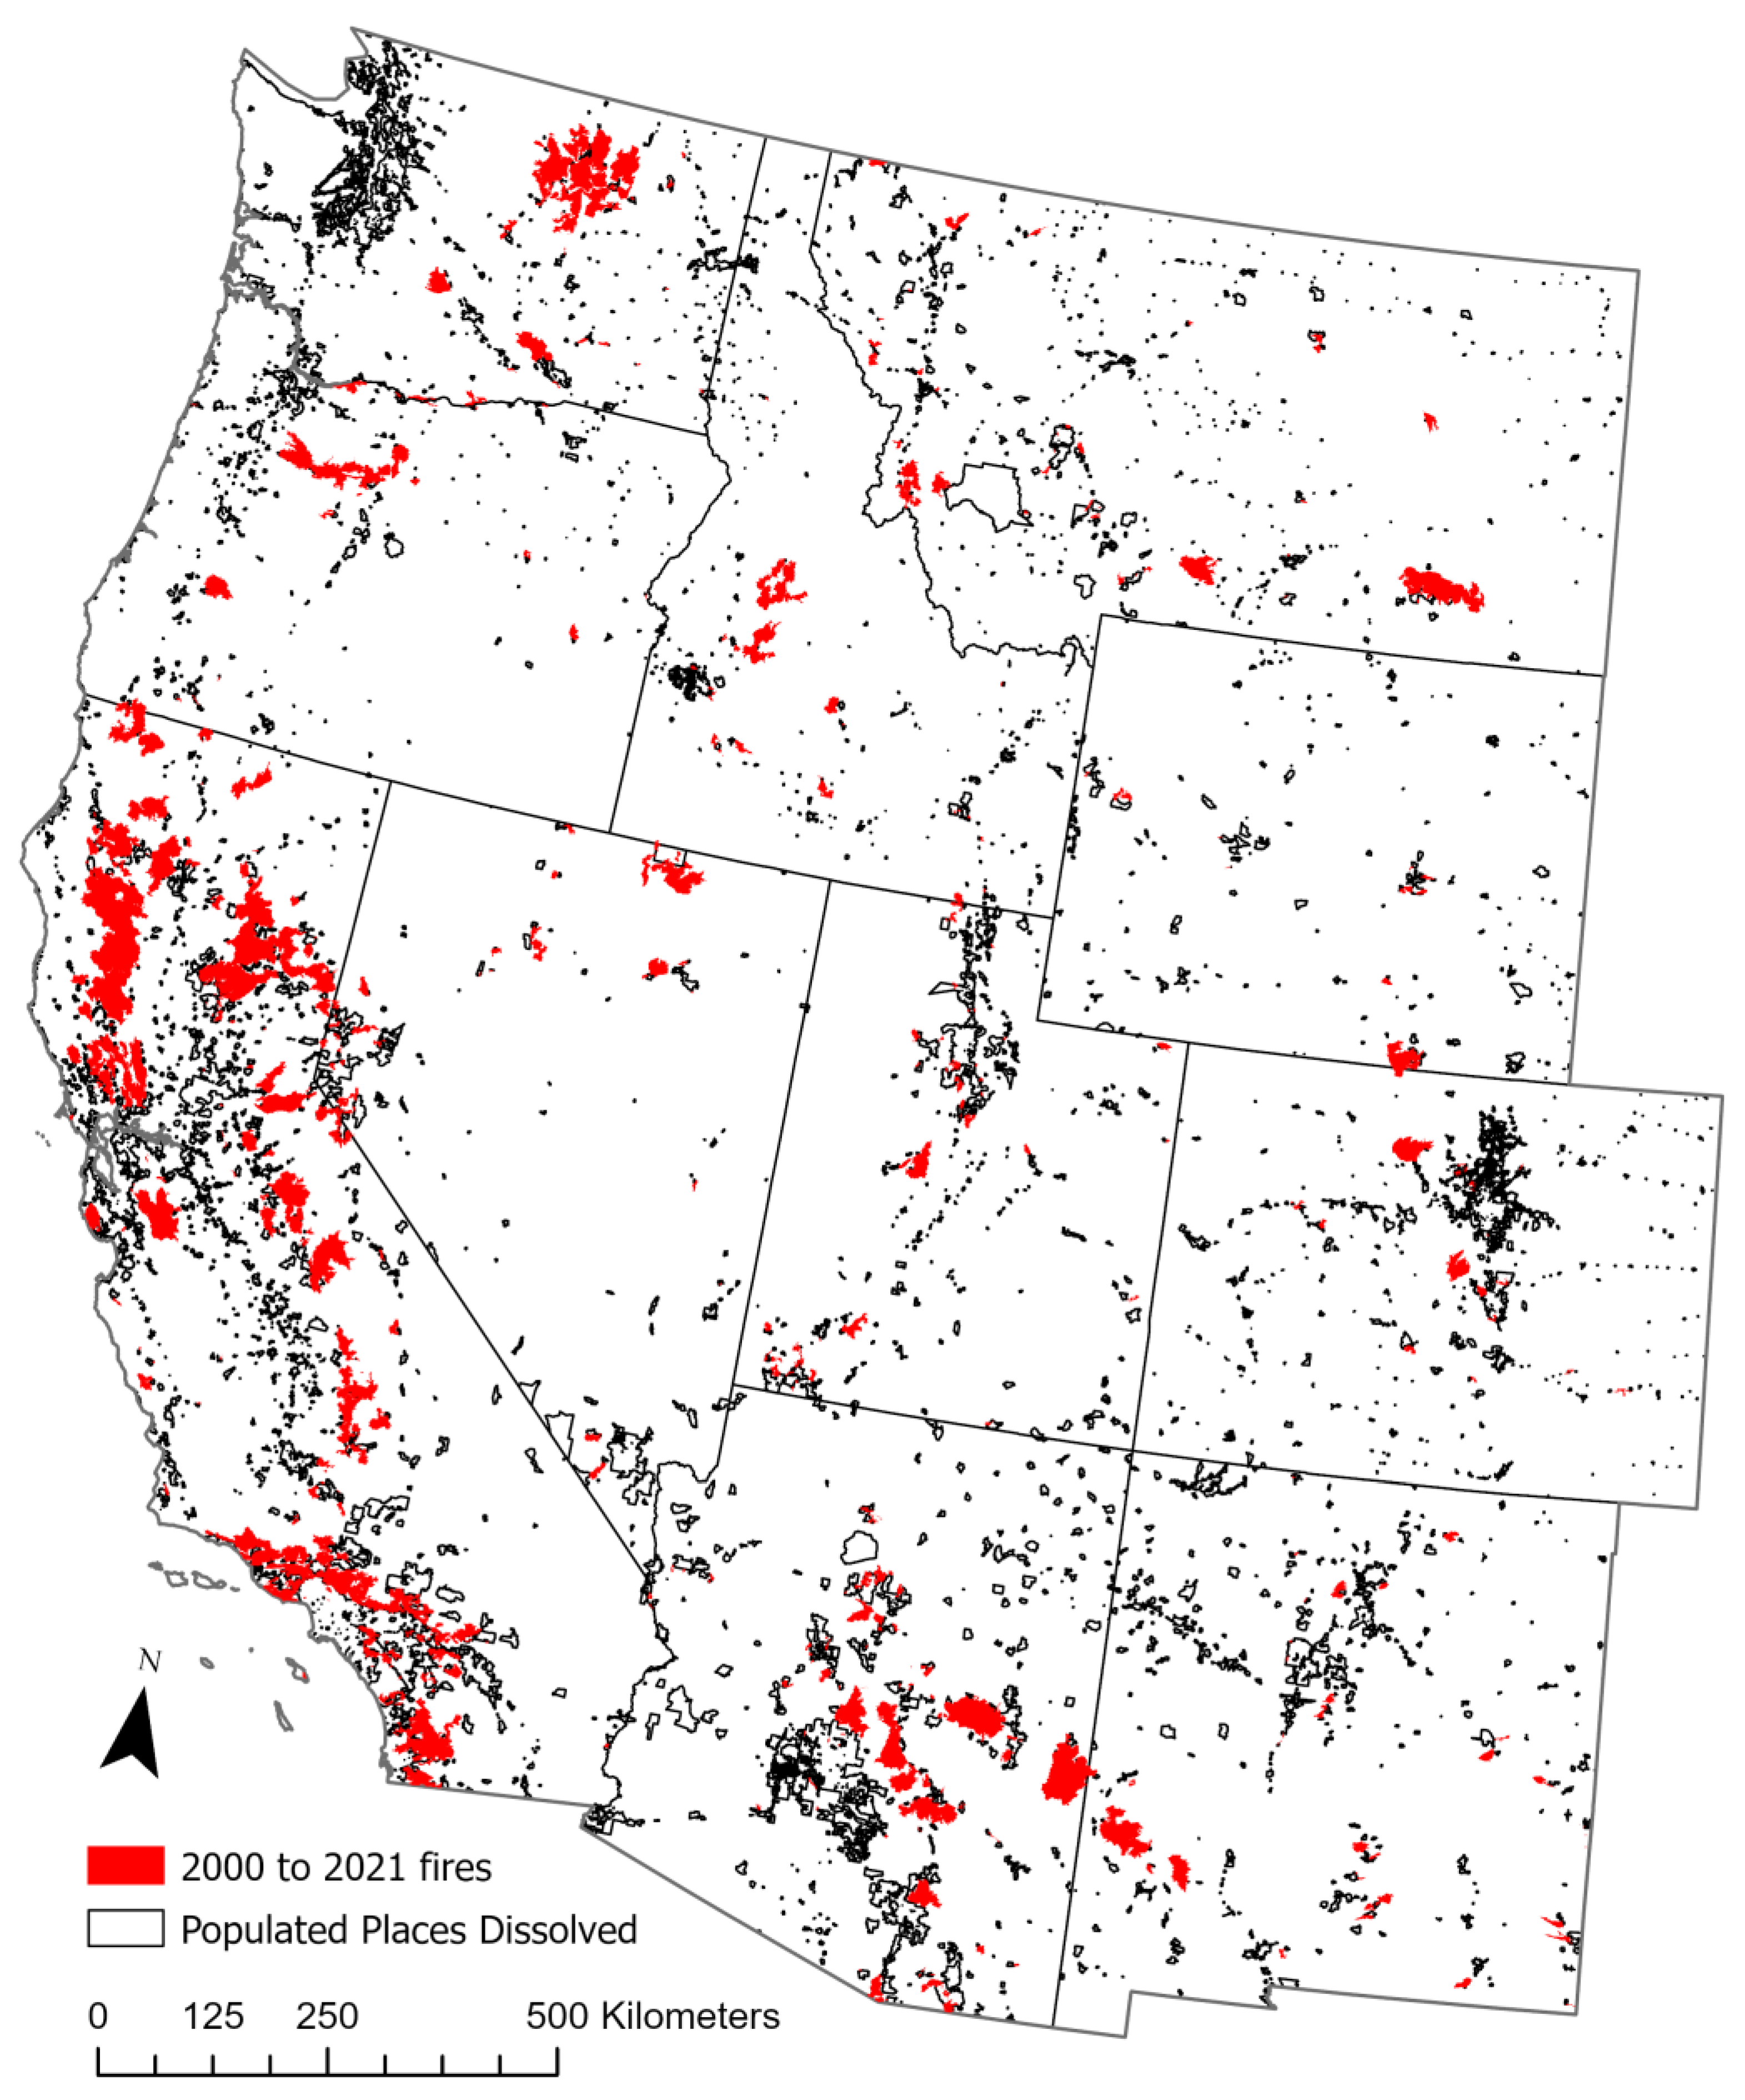
Figure 2.
Ember and smoke production that affect communities can extend to 2500 m to 5000 m from community boundaries, and buffers for these processes merge adjoining communities into surprisingly large units, extending ∼160 km north to south, where it may be sensible to share control efforts. Note that the 100 m buffer is not illustrated here, since it did not show up well at this scale. The larger location of this figure on the western Nevada border with California is evident in Figure 1 and Figure 3.
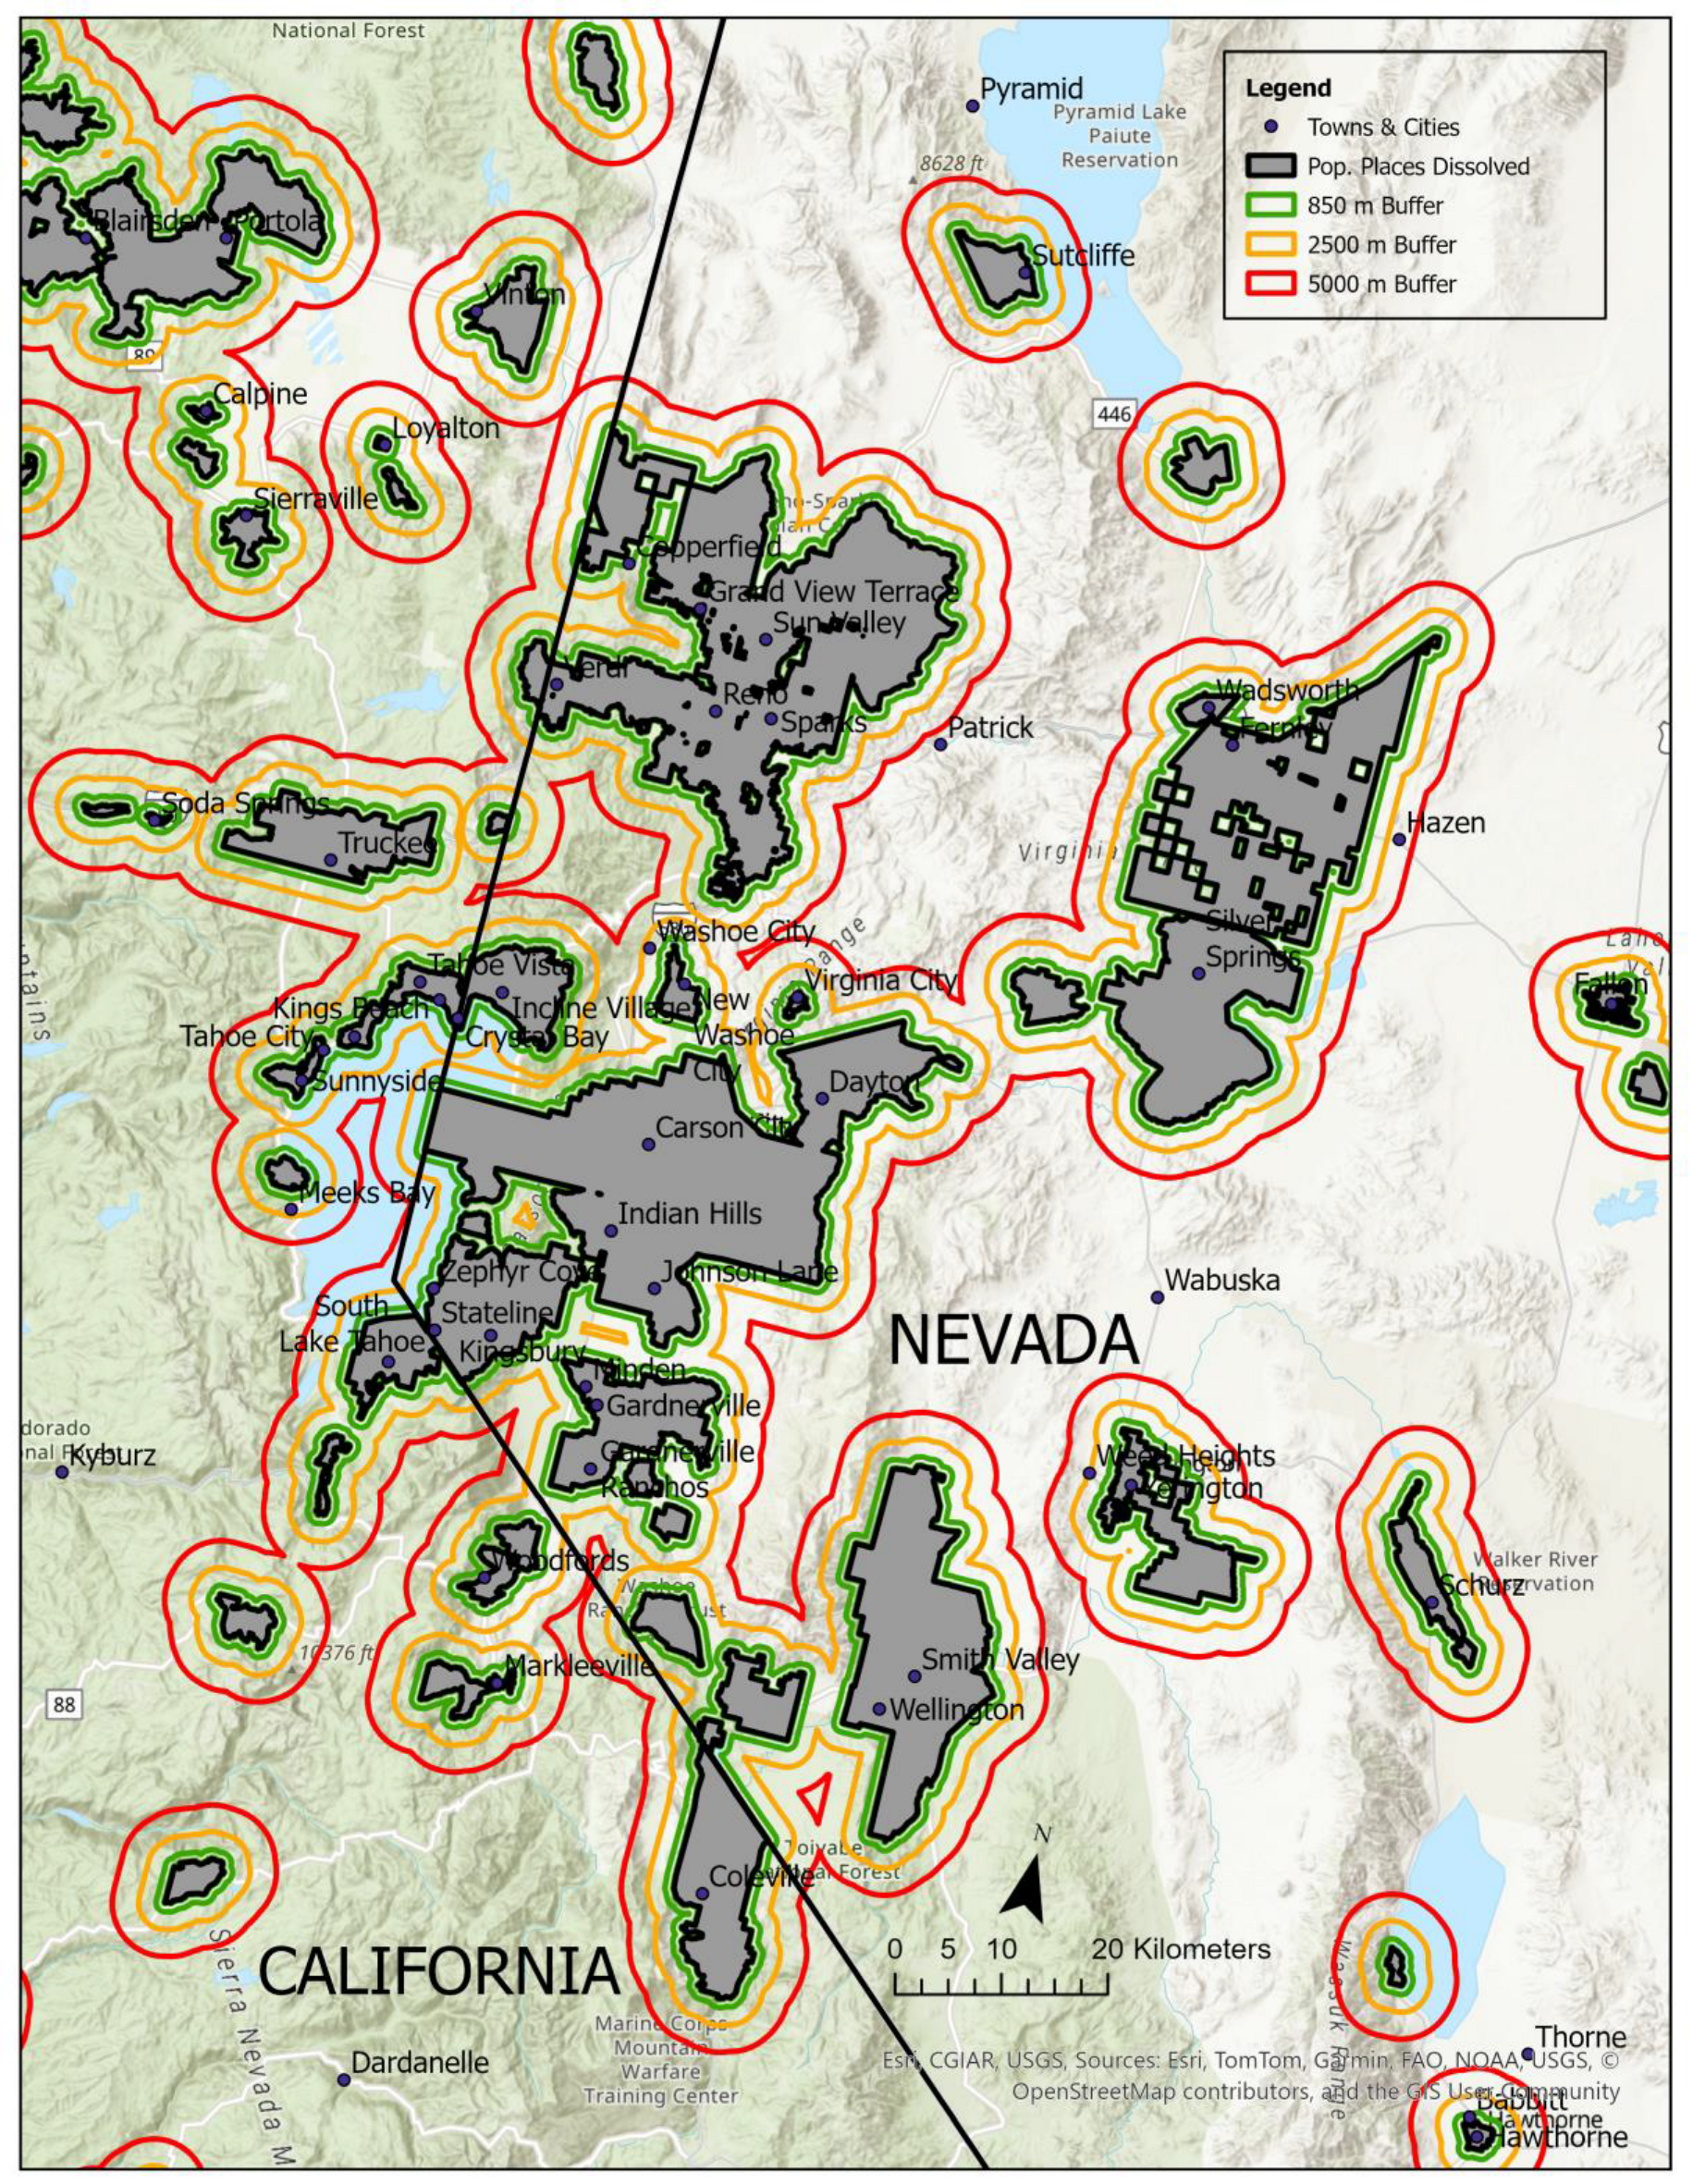
Figure 3.
Recent fire rotations, for 2000-2021, across the 11 western states, for the five Safeness categories used in this paper. Table 4 shows FRs for each of the 34 types and groups them into Safest and Generally Safe categories, shown here in greens, Not Safe shown here in Yellow, and Dangerous and Very Dangerous, shown here in reds.
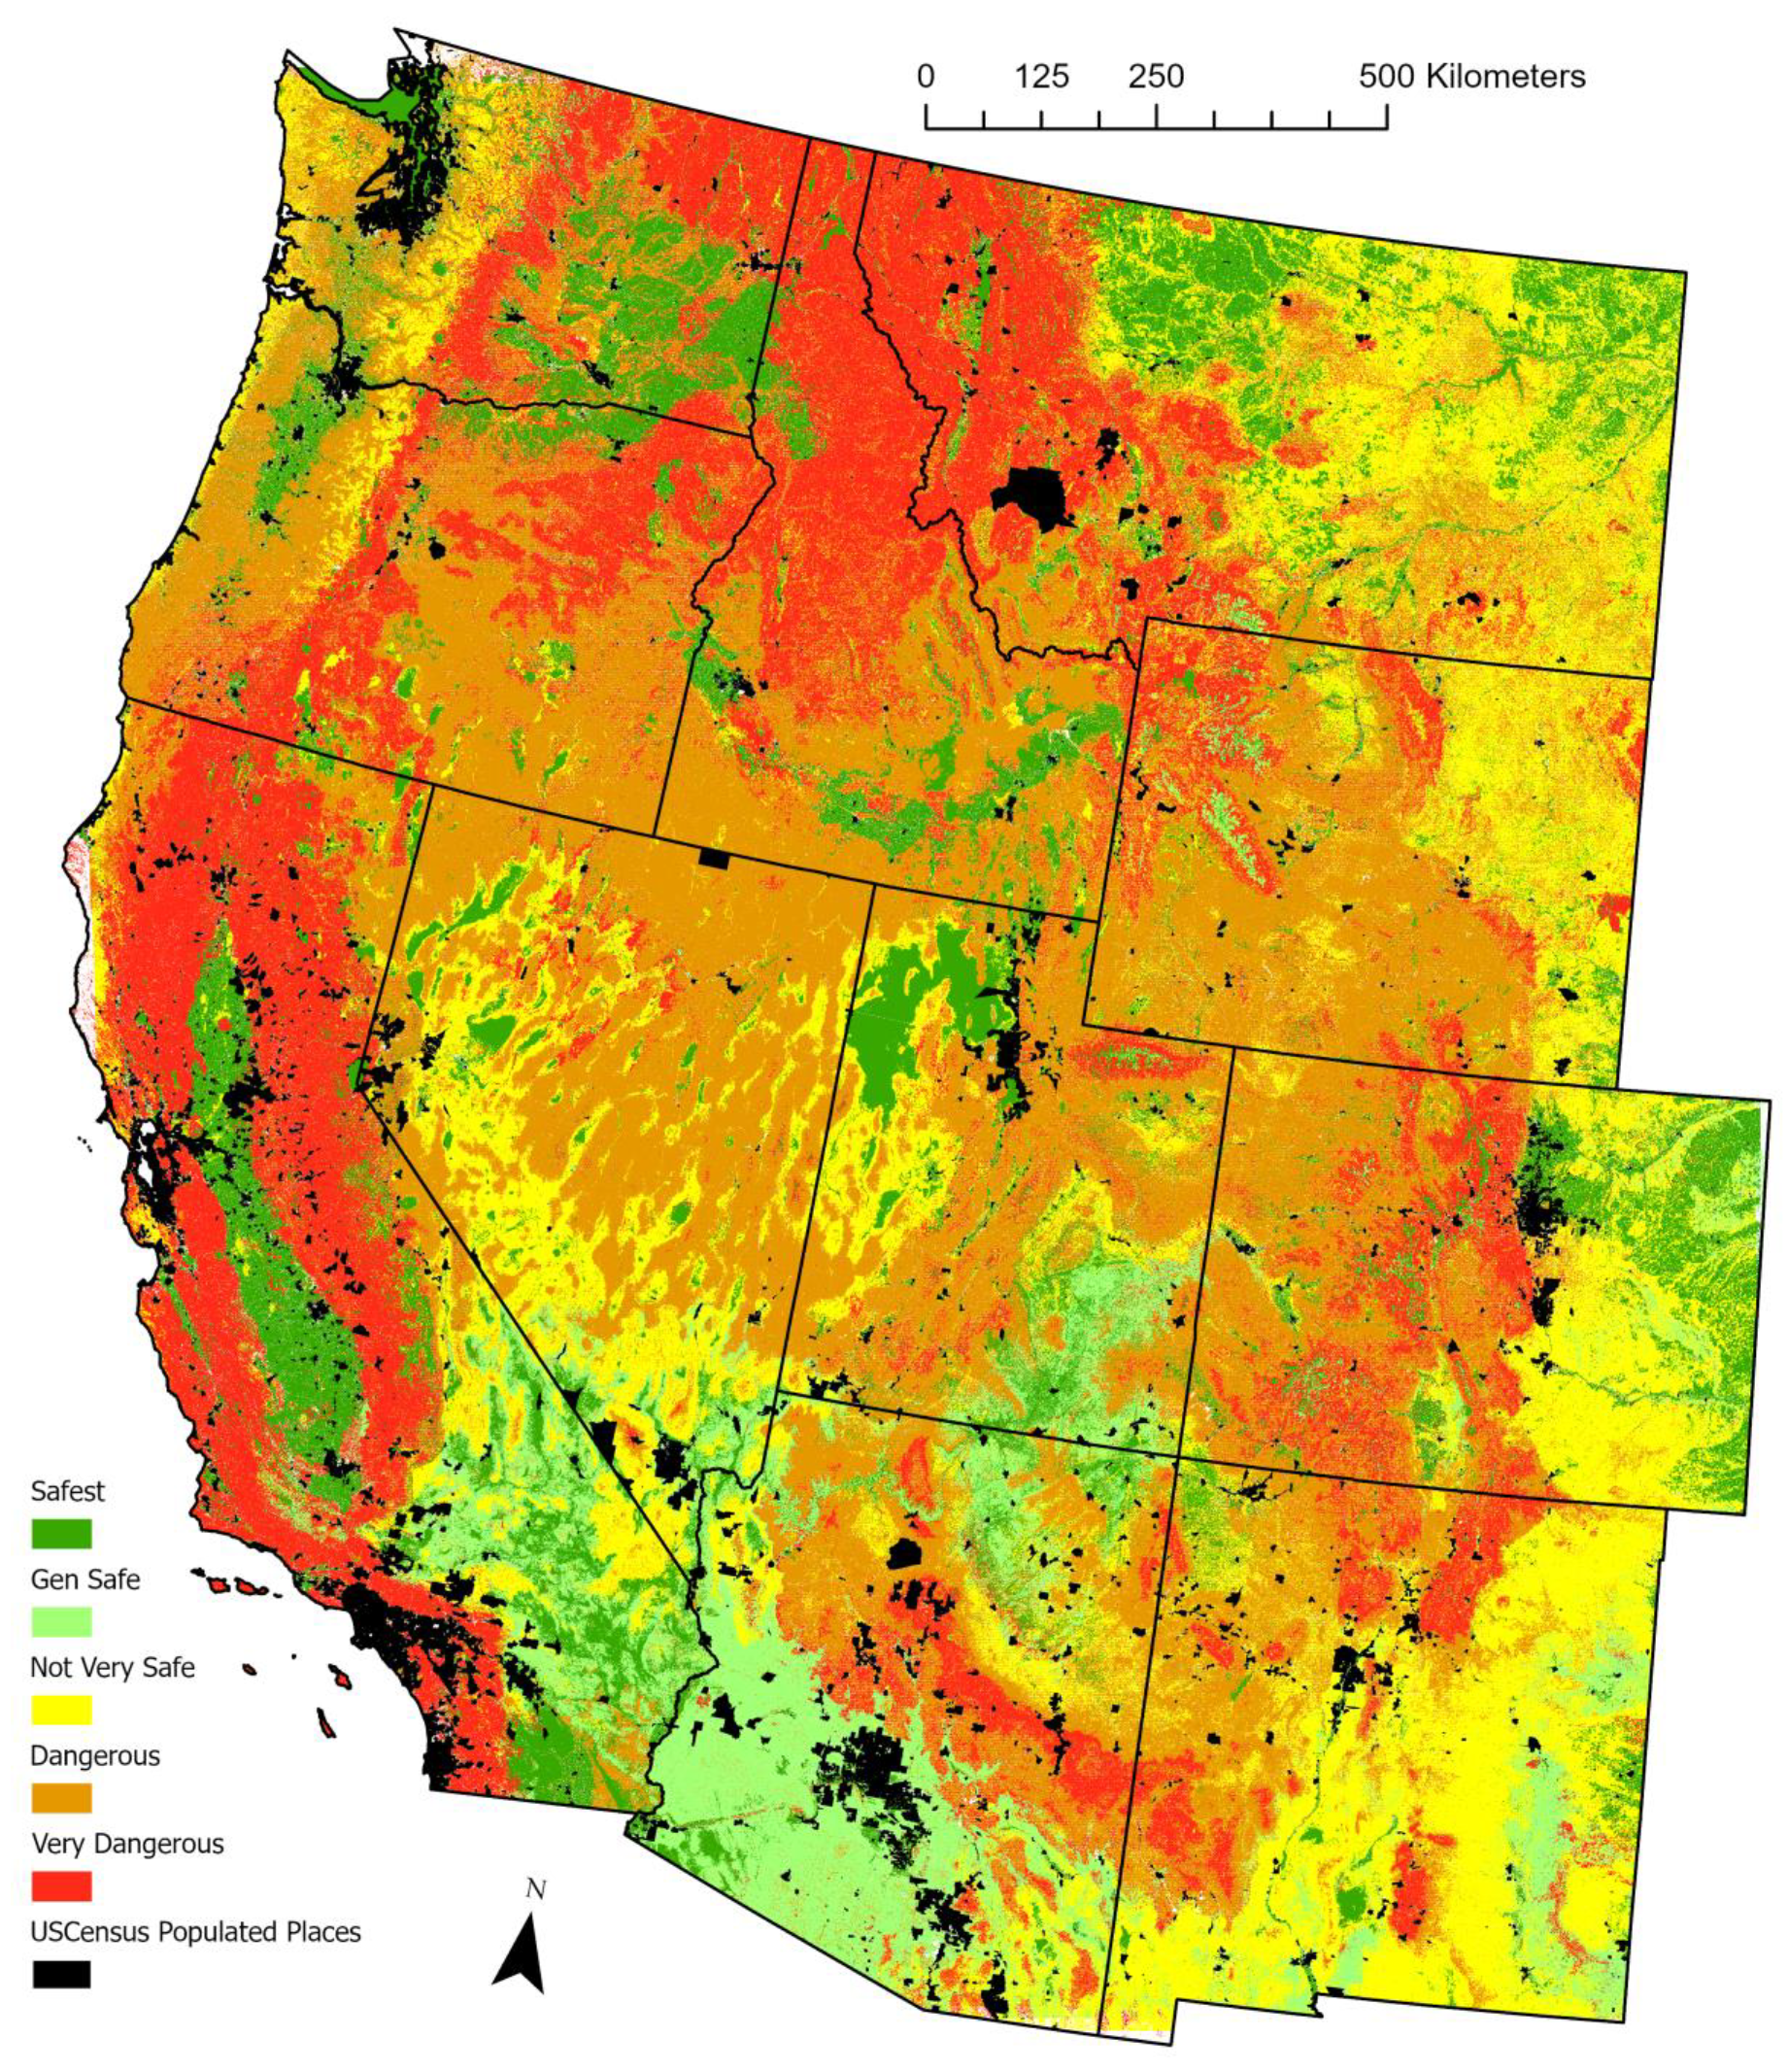
Figure 4.
Trends in Safeness categories (a-f) and combinations of Safeness categories (g-h) within buffers in and near PPDs in the 11WS.
Figure 4.
Trends in Safeness categories (a-f) and combinations of Safeness categories (g-h) within buffers in and near PPDs in the 11WS.
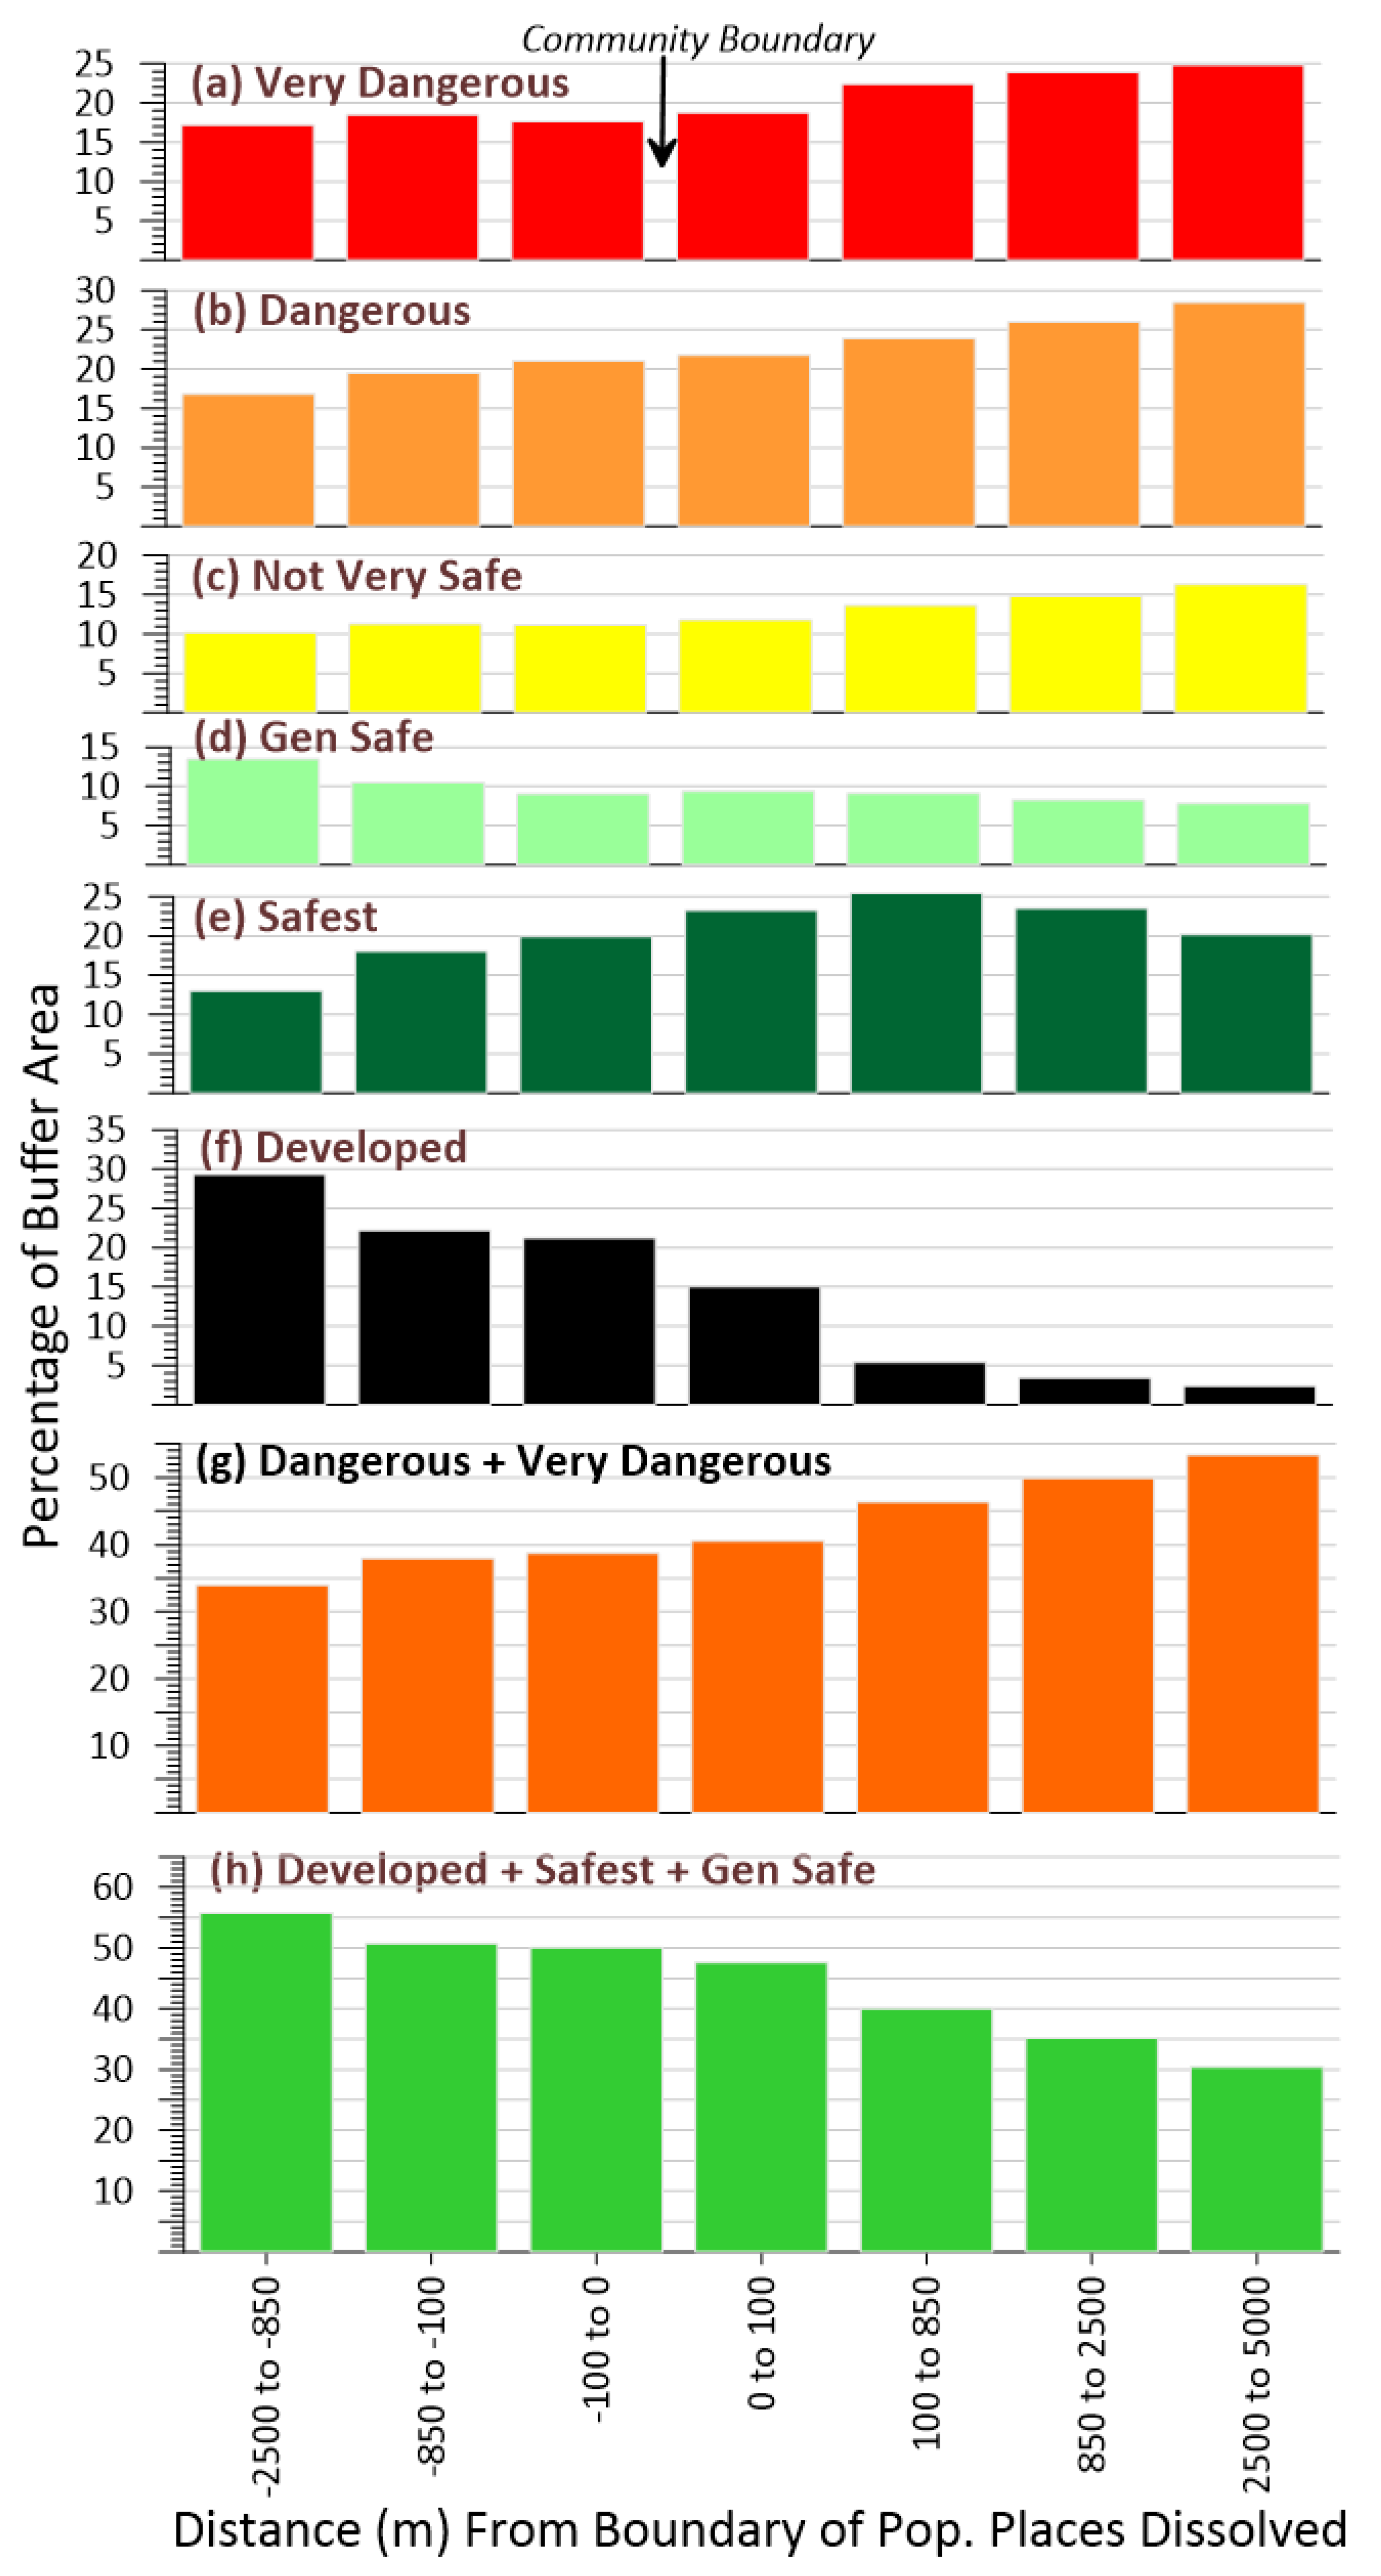
Figure 5.
Patterns in the sum of Dangerous and Very Dangerous categories inside PPDs in the 11WS. All the colored area is inside communities. The upper limits of the classes represent the first quartile (0.040), the median (0.234), the mean (0.342), and the third quartile (0.608) of the distribution of the 4484 values.
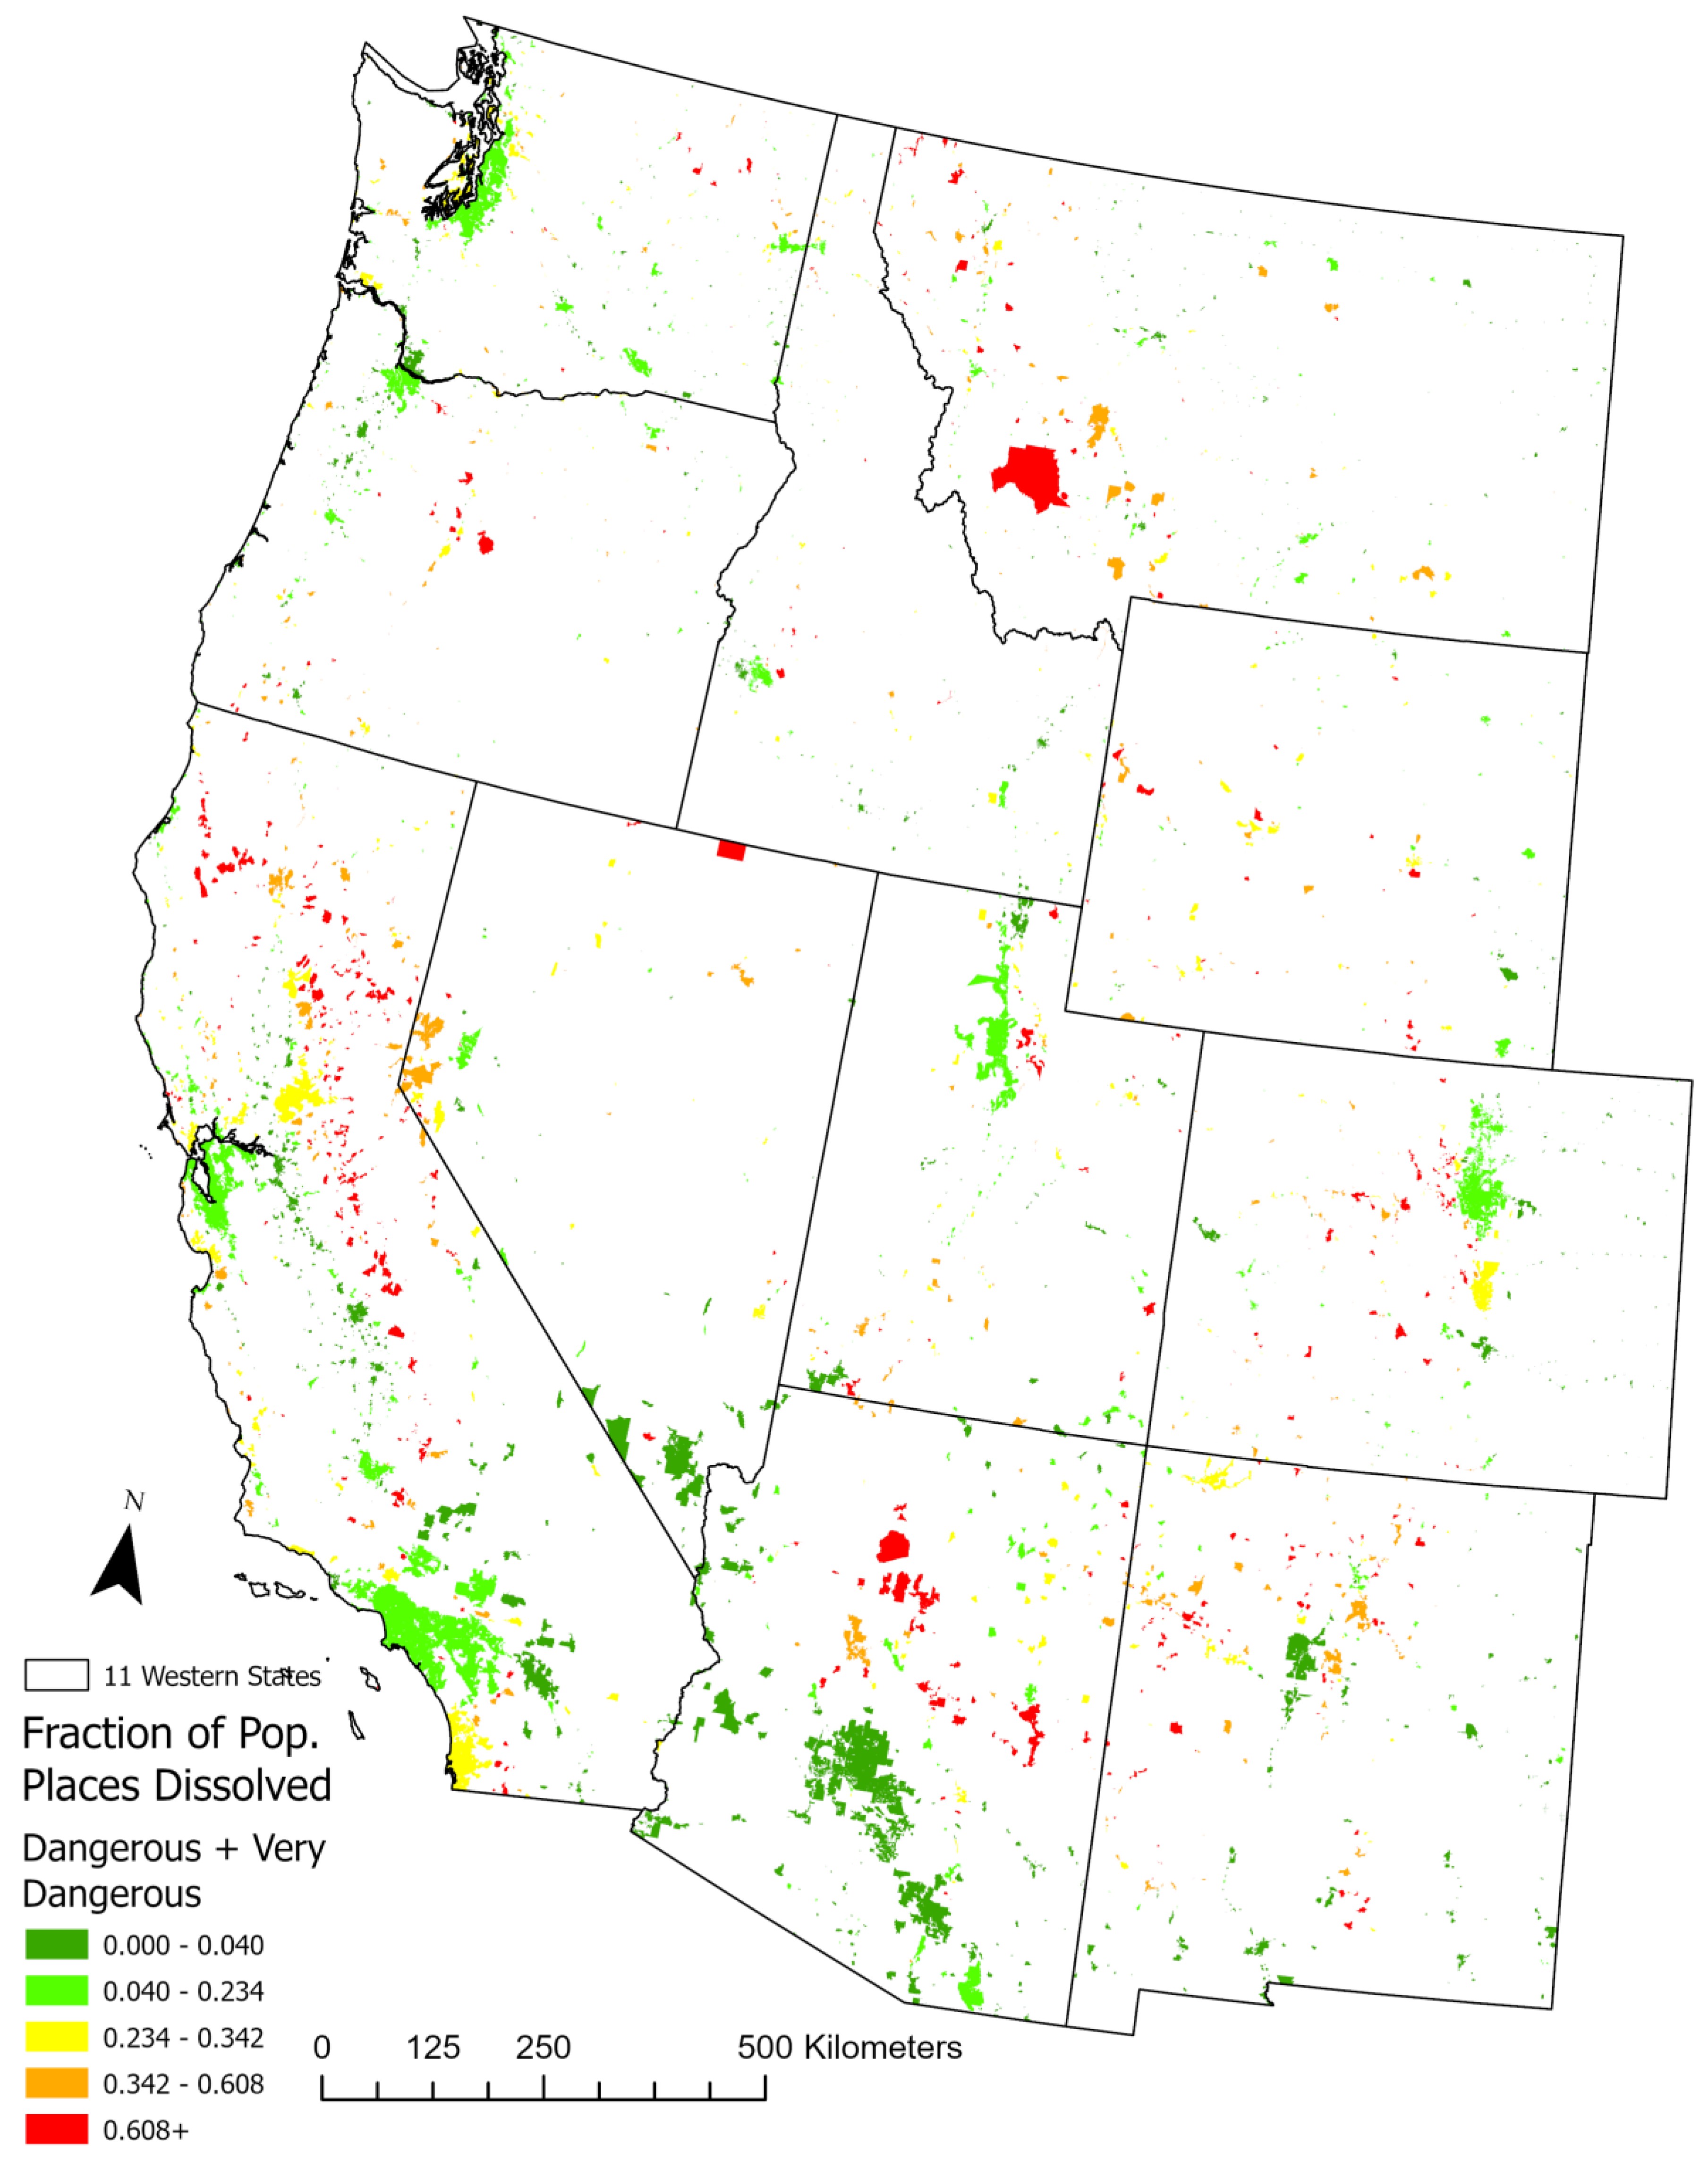
Figure 6.
Distribution of the abundance of safe (green) and dangerous (red) land-use categories across the 4484 PPDs in the 11WS (a-b) and across their external buffers from 0-100 m (c-d), 100-850 m (e-f), 850-2500 m (g-h), and 2500-5000 m (i-j).
Figure 6.
Distribution of the abundance of safe (green) and dangerous (red) land-use categories across the 4484 PPDs in the 11WS (a-b) and across their external buffers from 0-100 m (c-d), 100-850 m (e-f), 850-2500 m (g-h), and 2500-5000 m (i-j).
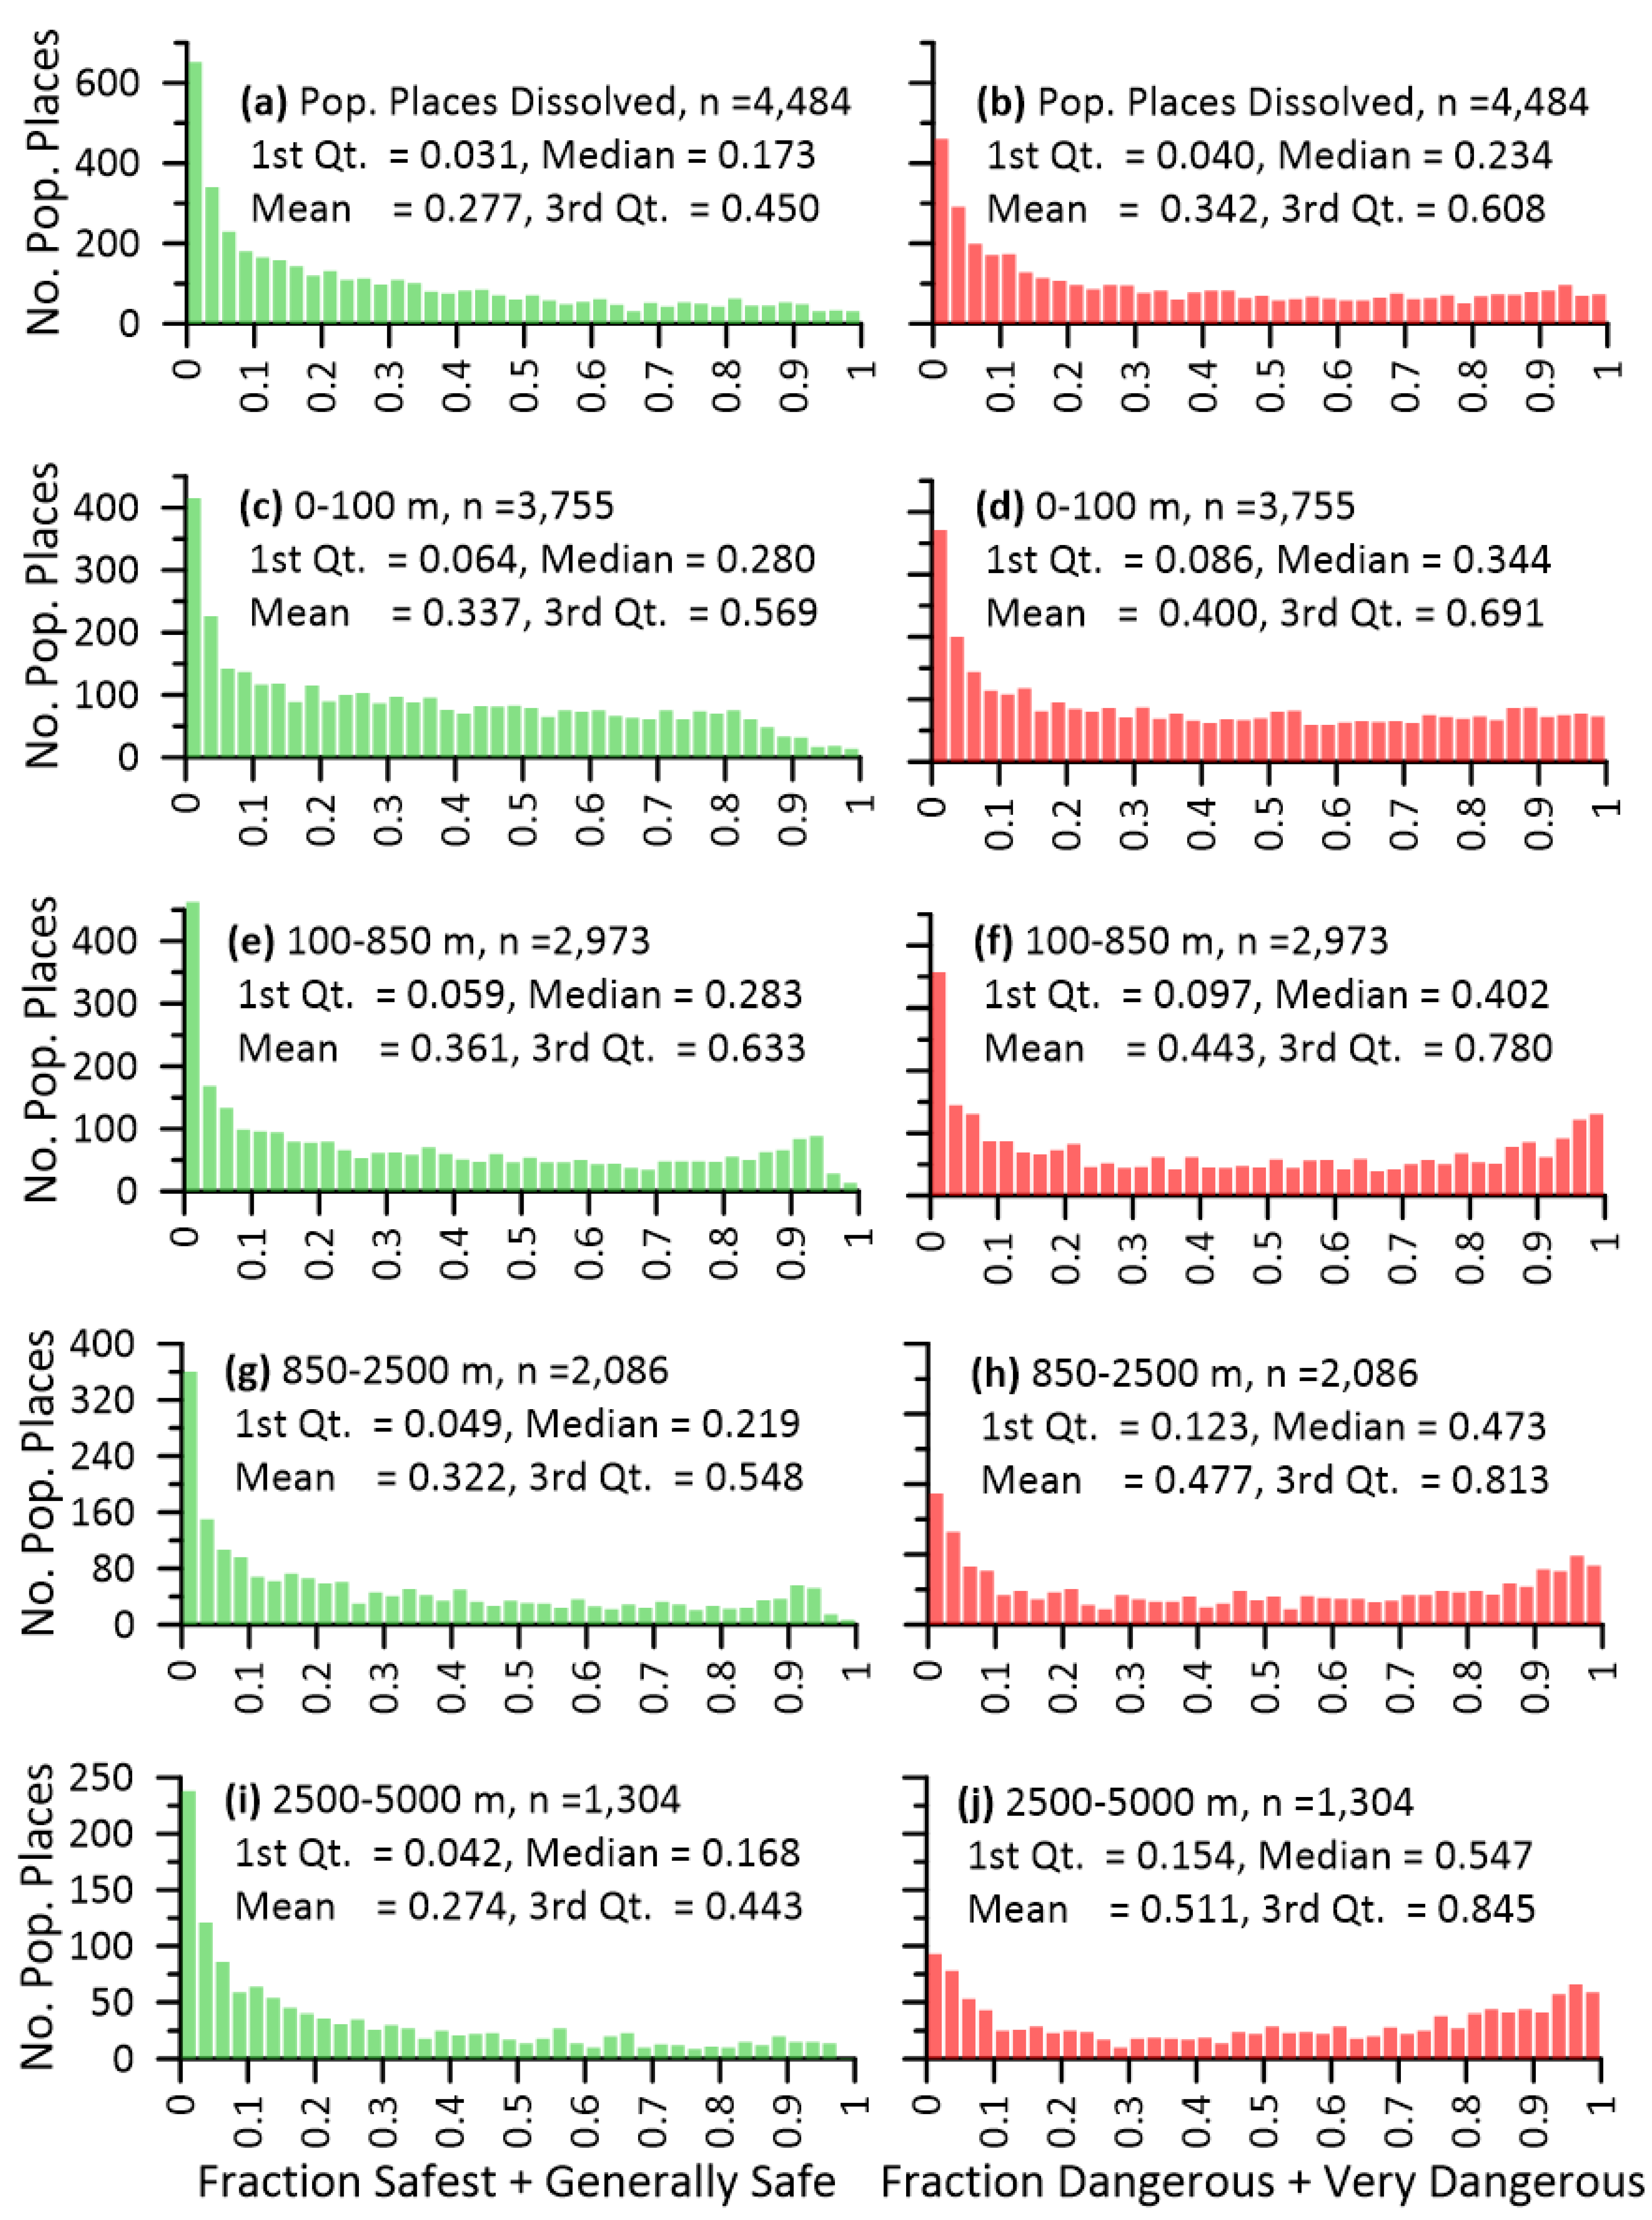
Figure 7.
Trends in wildland vegetation inside PPDs in the 11WS: (a) Abundance of wildland vegetation inside Populated Places of the 11WS; all the colored area is inside boundaries of Populated Places, (b) Trend in percent cover of wildland vegetation from the internal buffers to external buffers of PPDs, (c) Distribution of the percentage of wildland vegetation across the inside of PPDs.
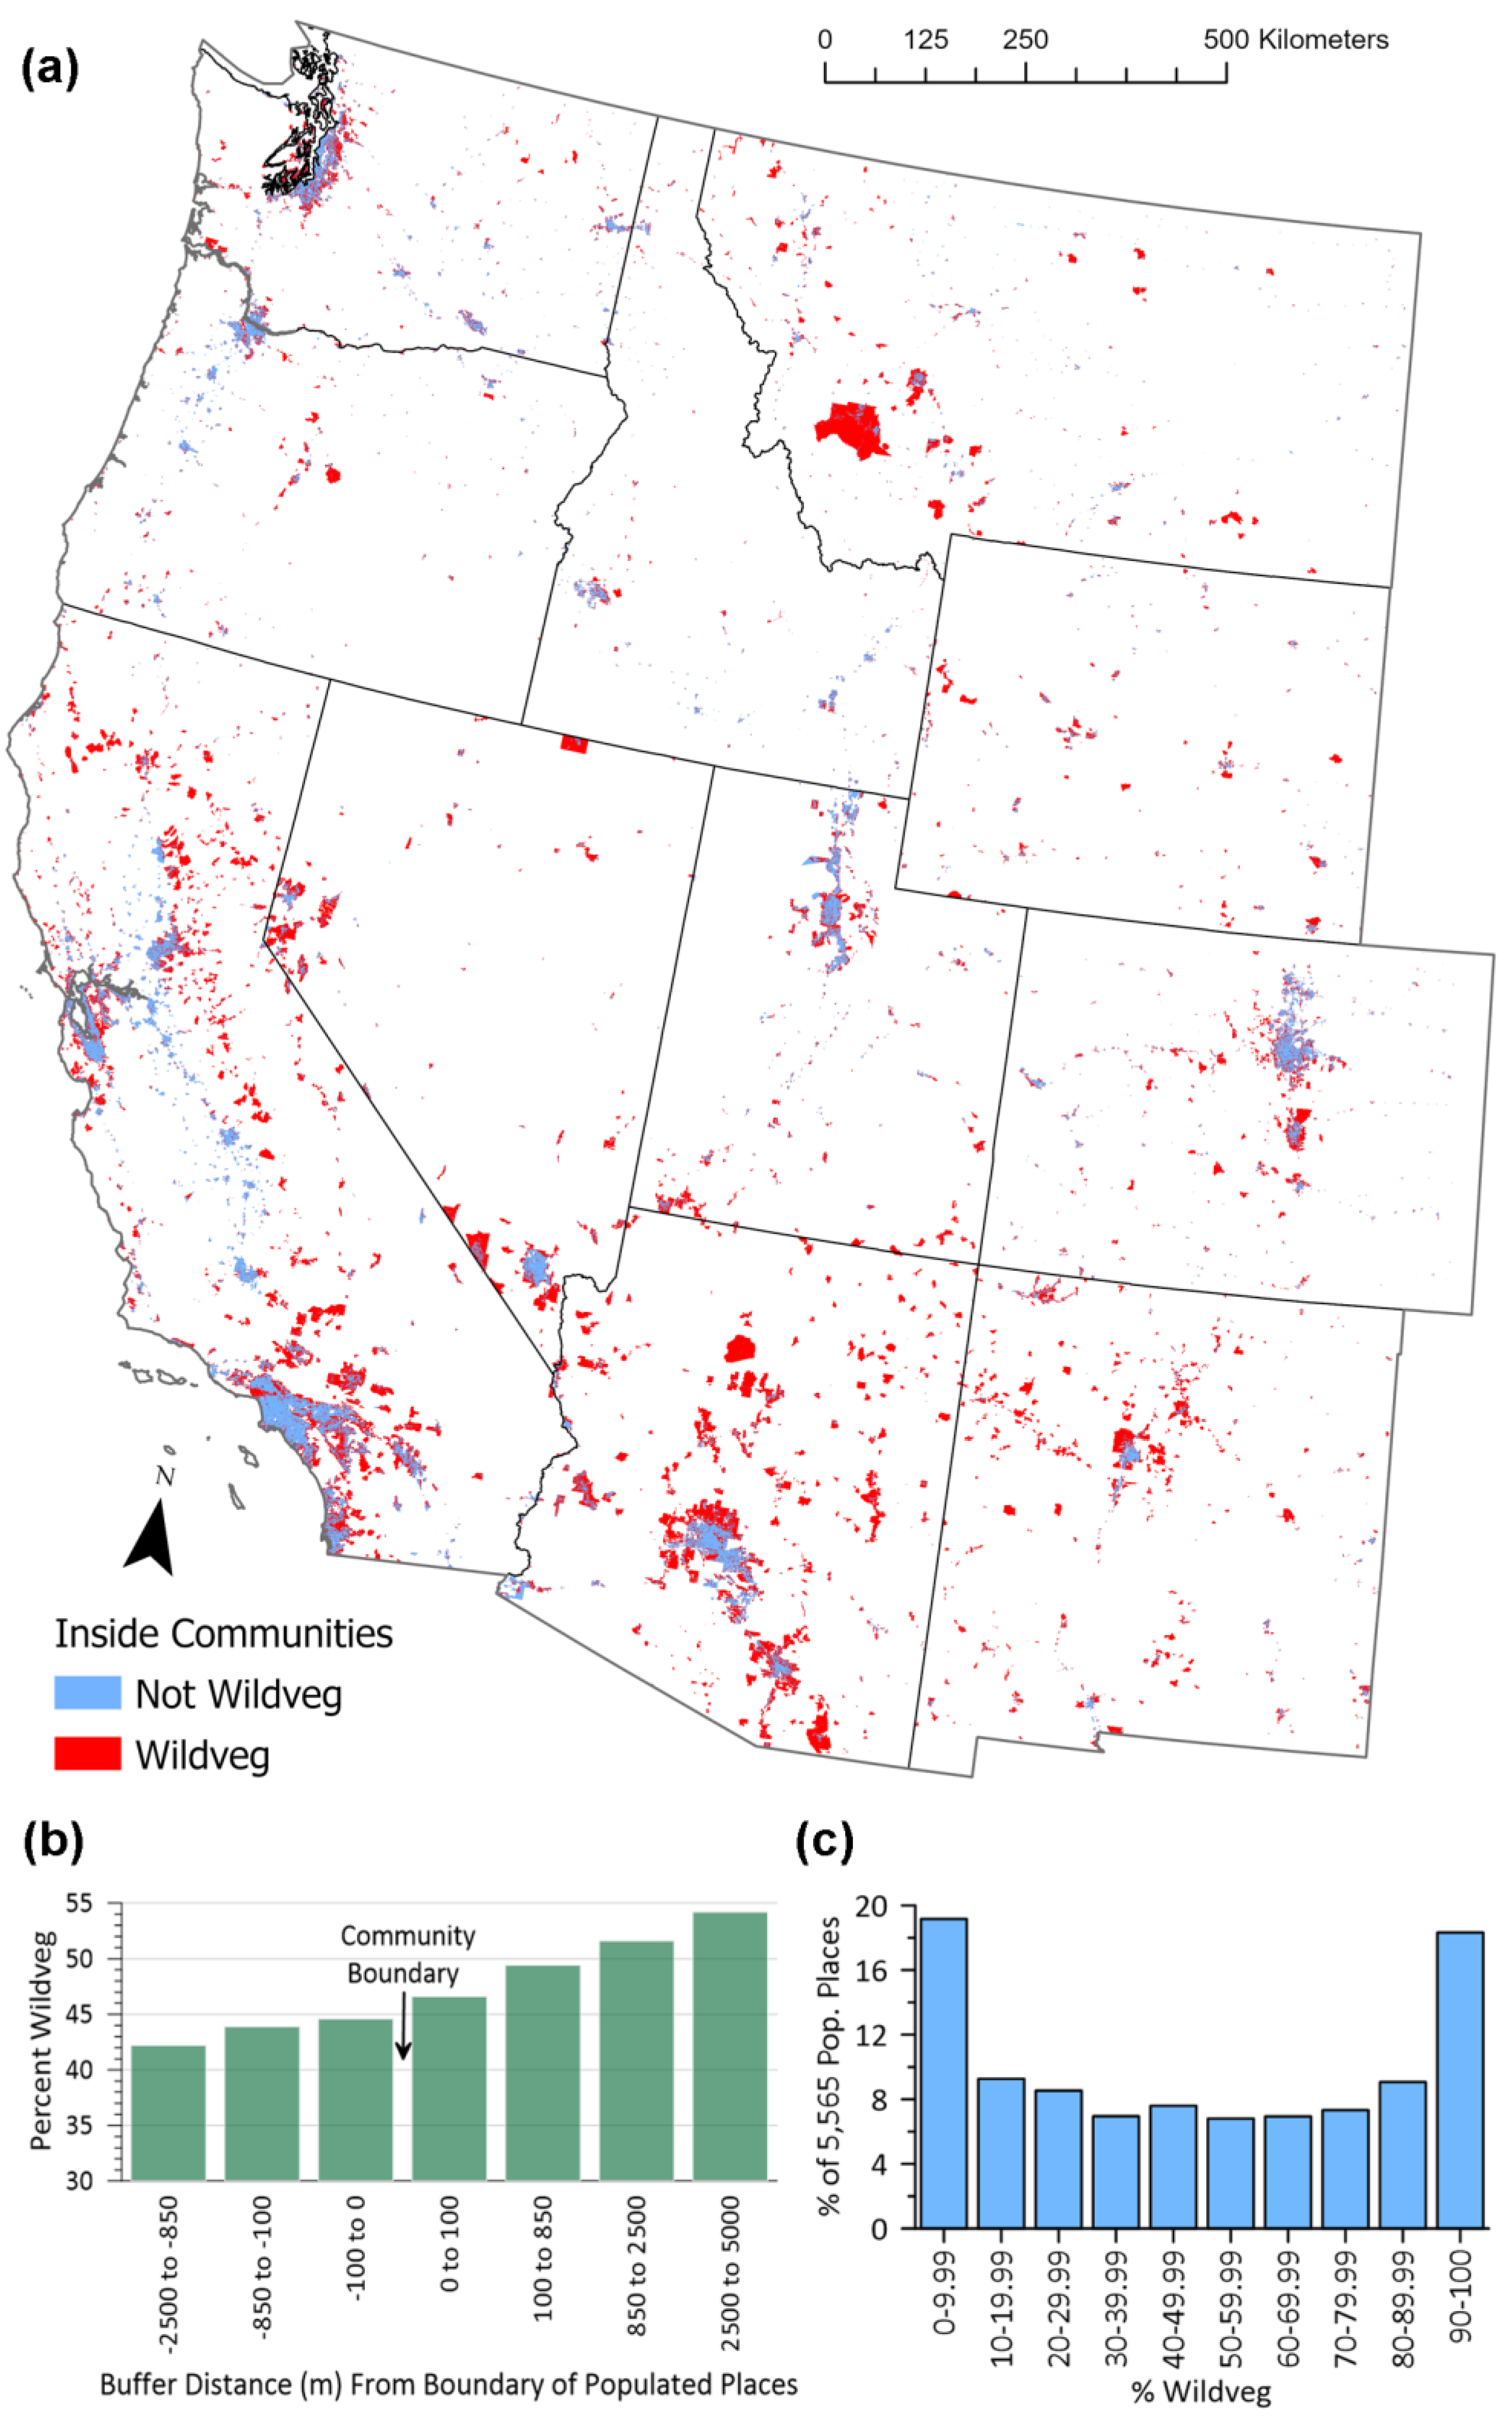
Figure 8.
Fire rotations for 2000-2021, on average, across the 4484 communities by buffer. Buffers are arranged in the same order as in Table 3. Distances are from the PPDs boundary.
Figure 8.
Fire rotations for 2000-2021, on average, across the 4484 communities by buffer. Buffers are arranged in the same order as in Table 3. Distances are from the PPDs boundary.
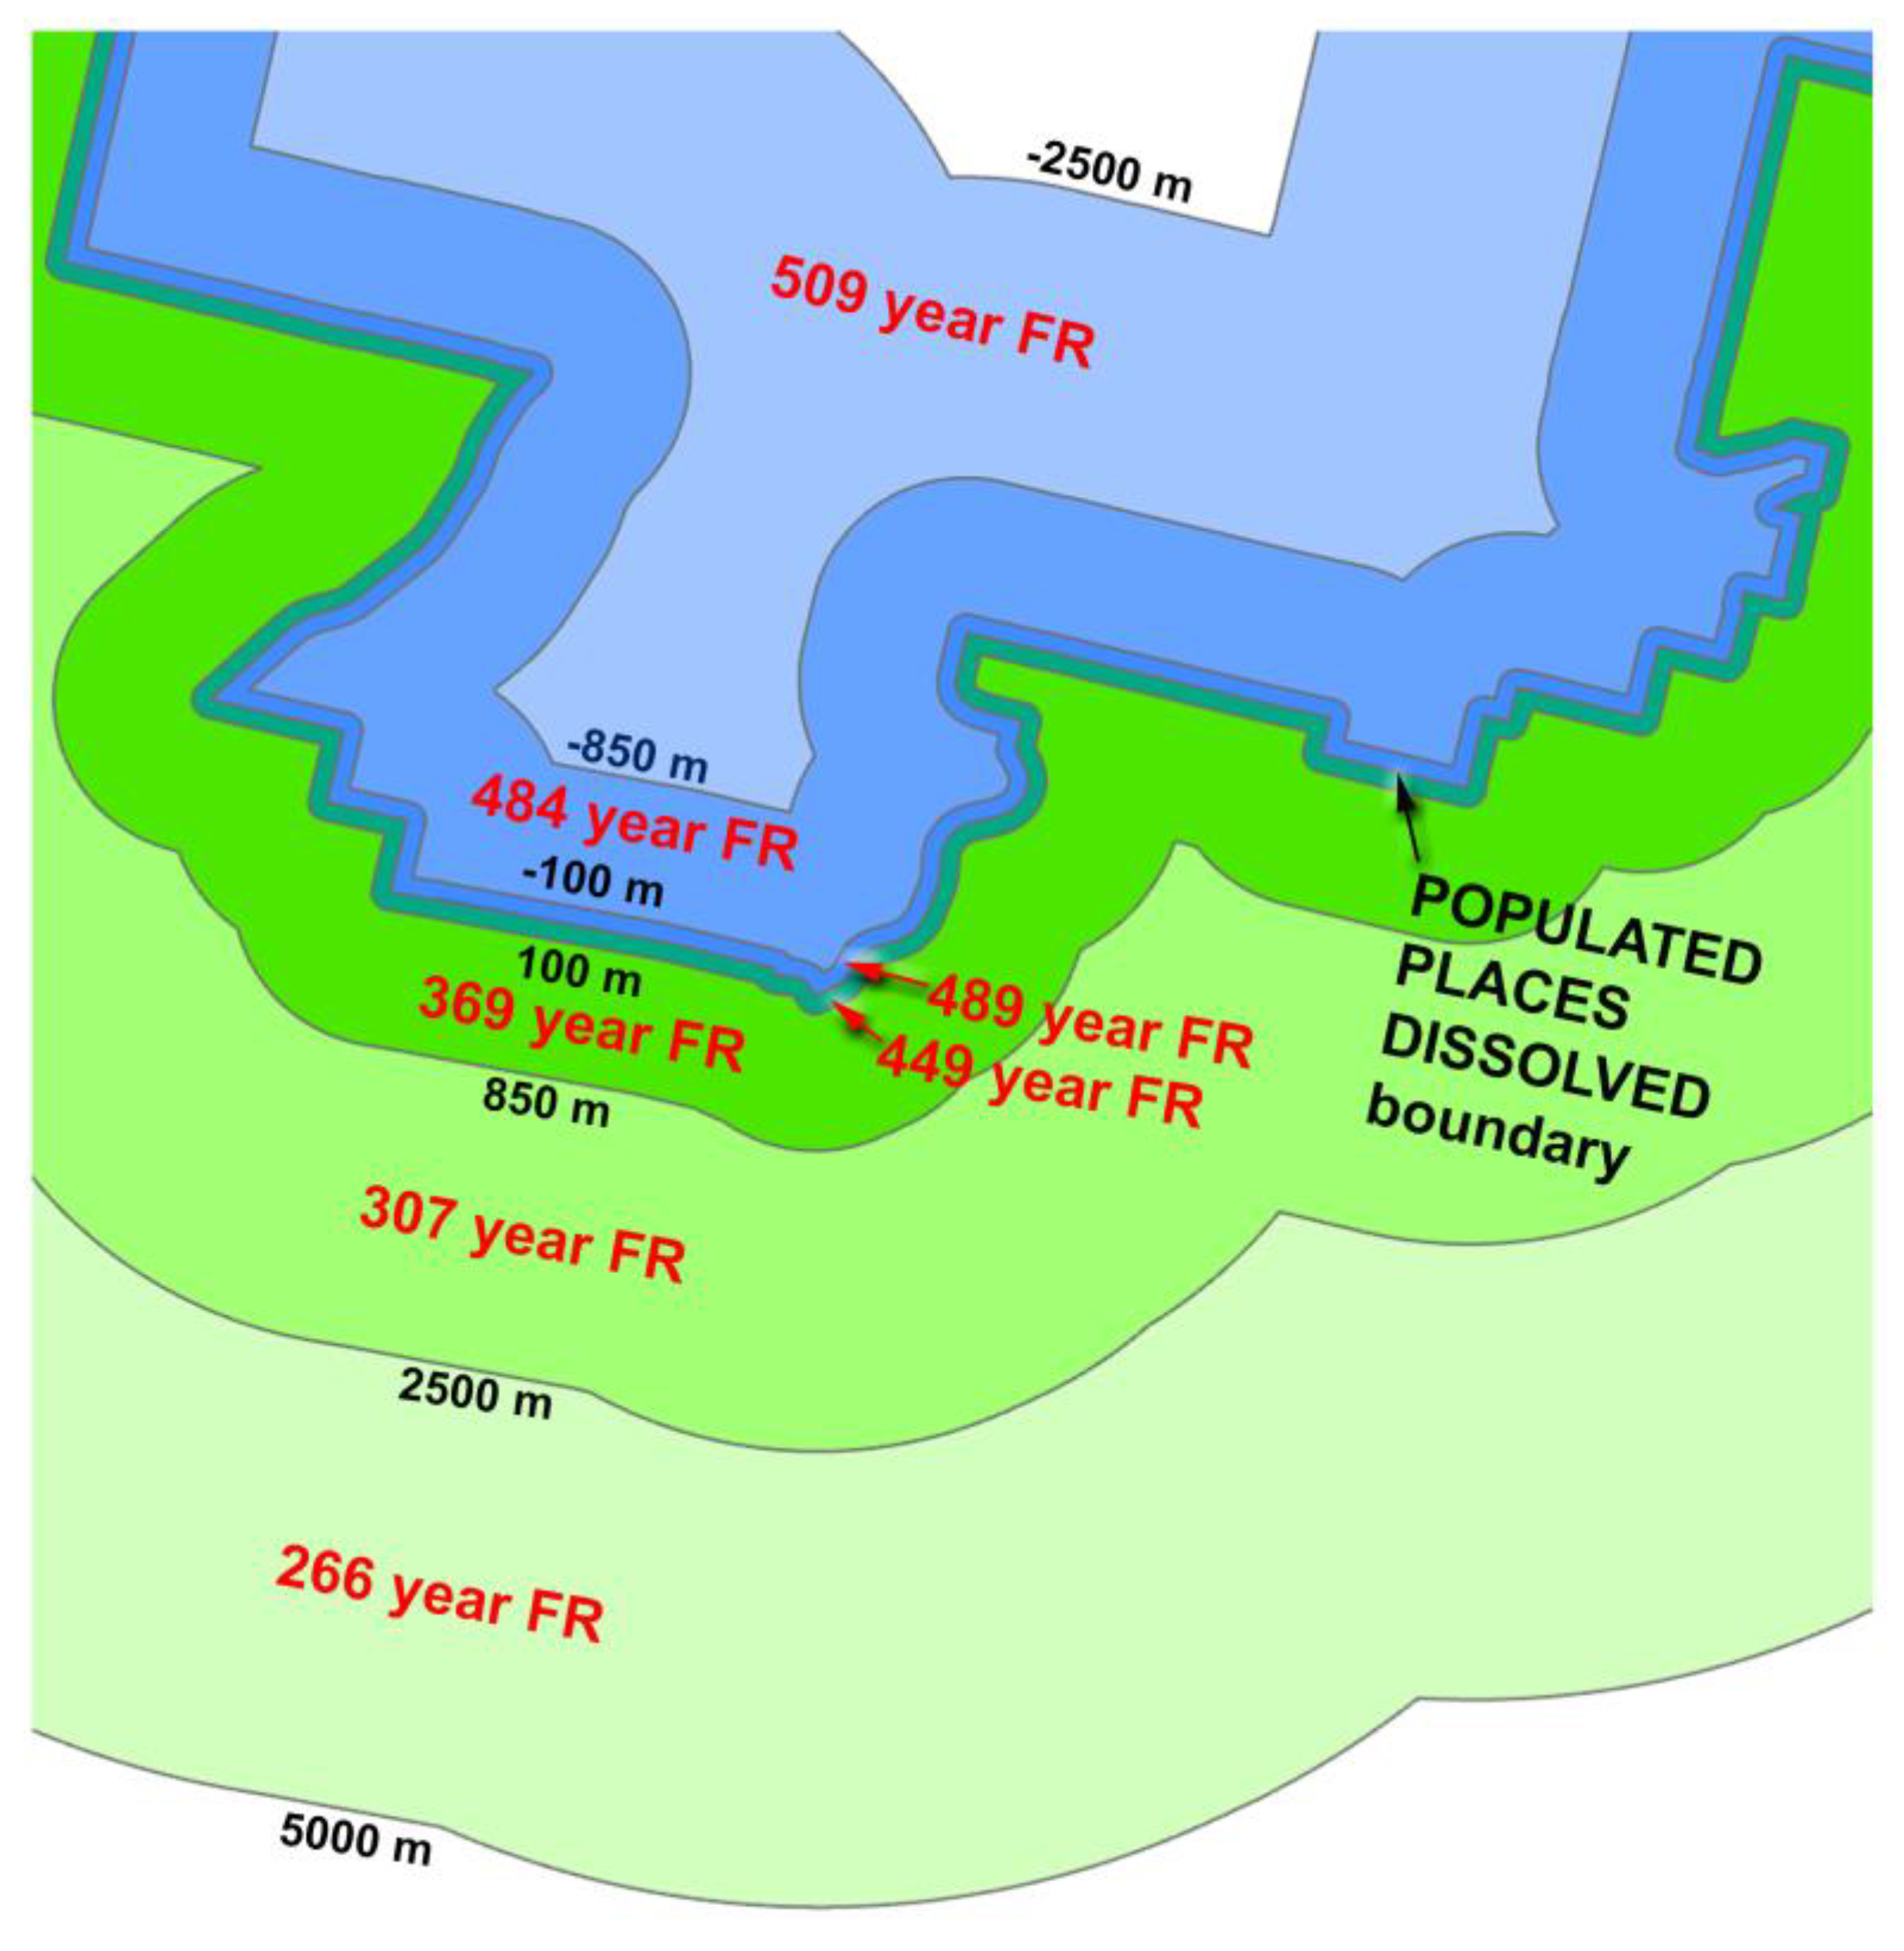
Figure 9.
Areas of fires that did (n = 788) and did not (n = 6,392) burn in PPDs (PPDs) between 2000 and 2021 in the 11WS.
Figure 9.
Areas of fires that did (n = 788) and did not (n = 6,392) burn in PPDs (PPDs) between 2000 and 2021 in the 11WS.
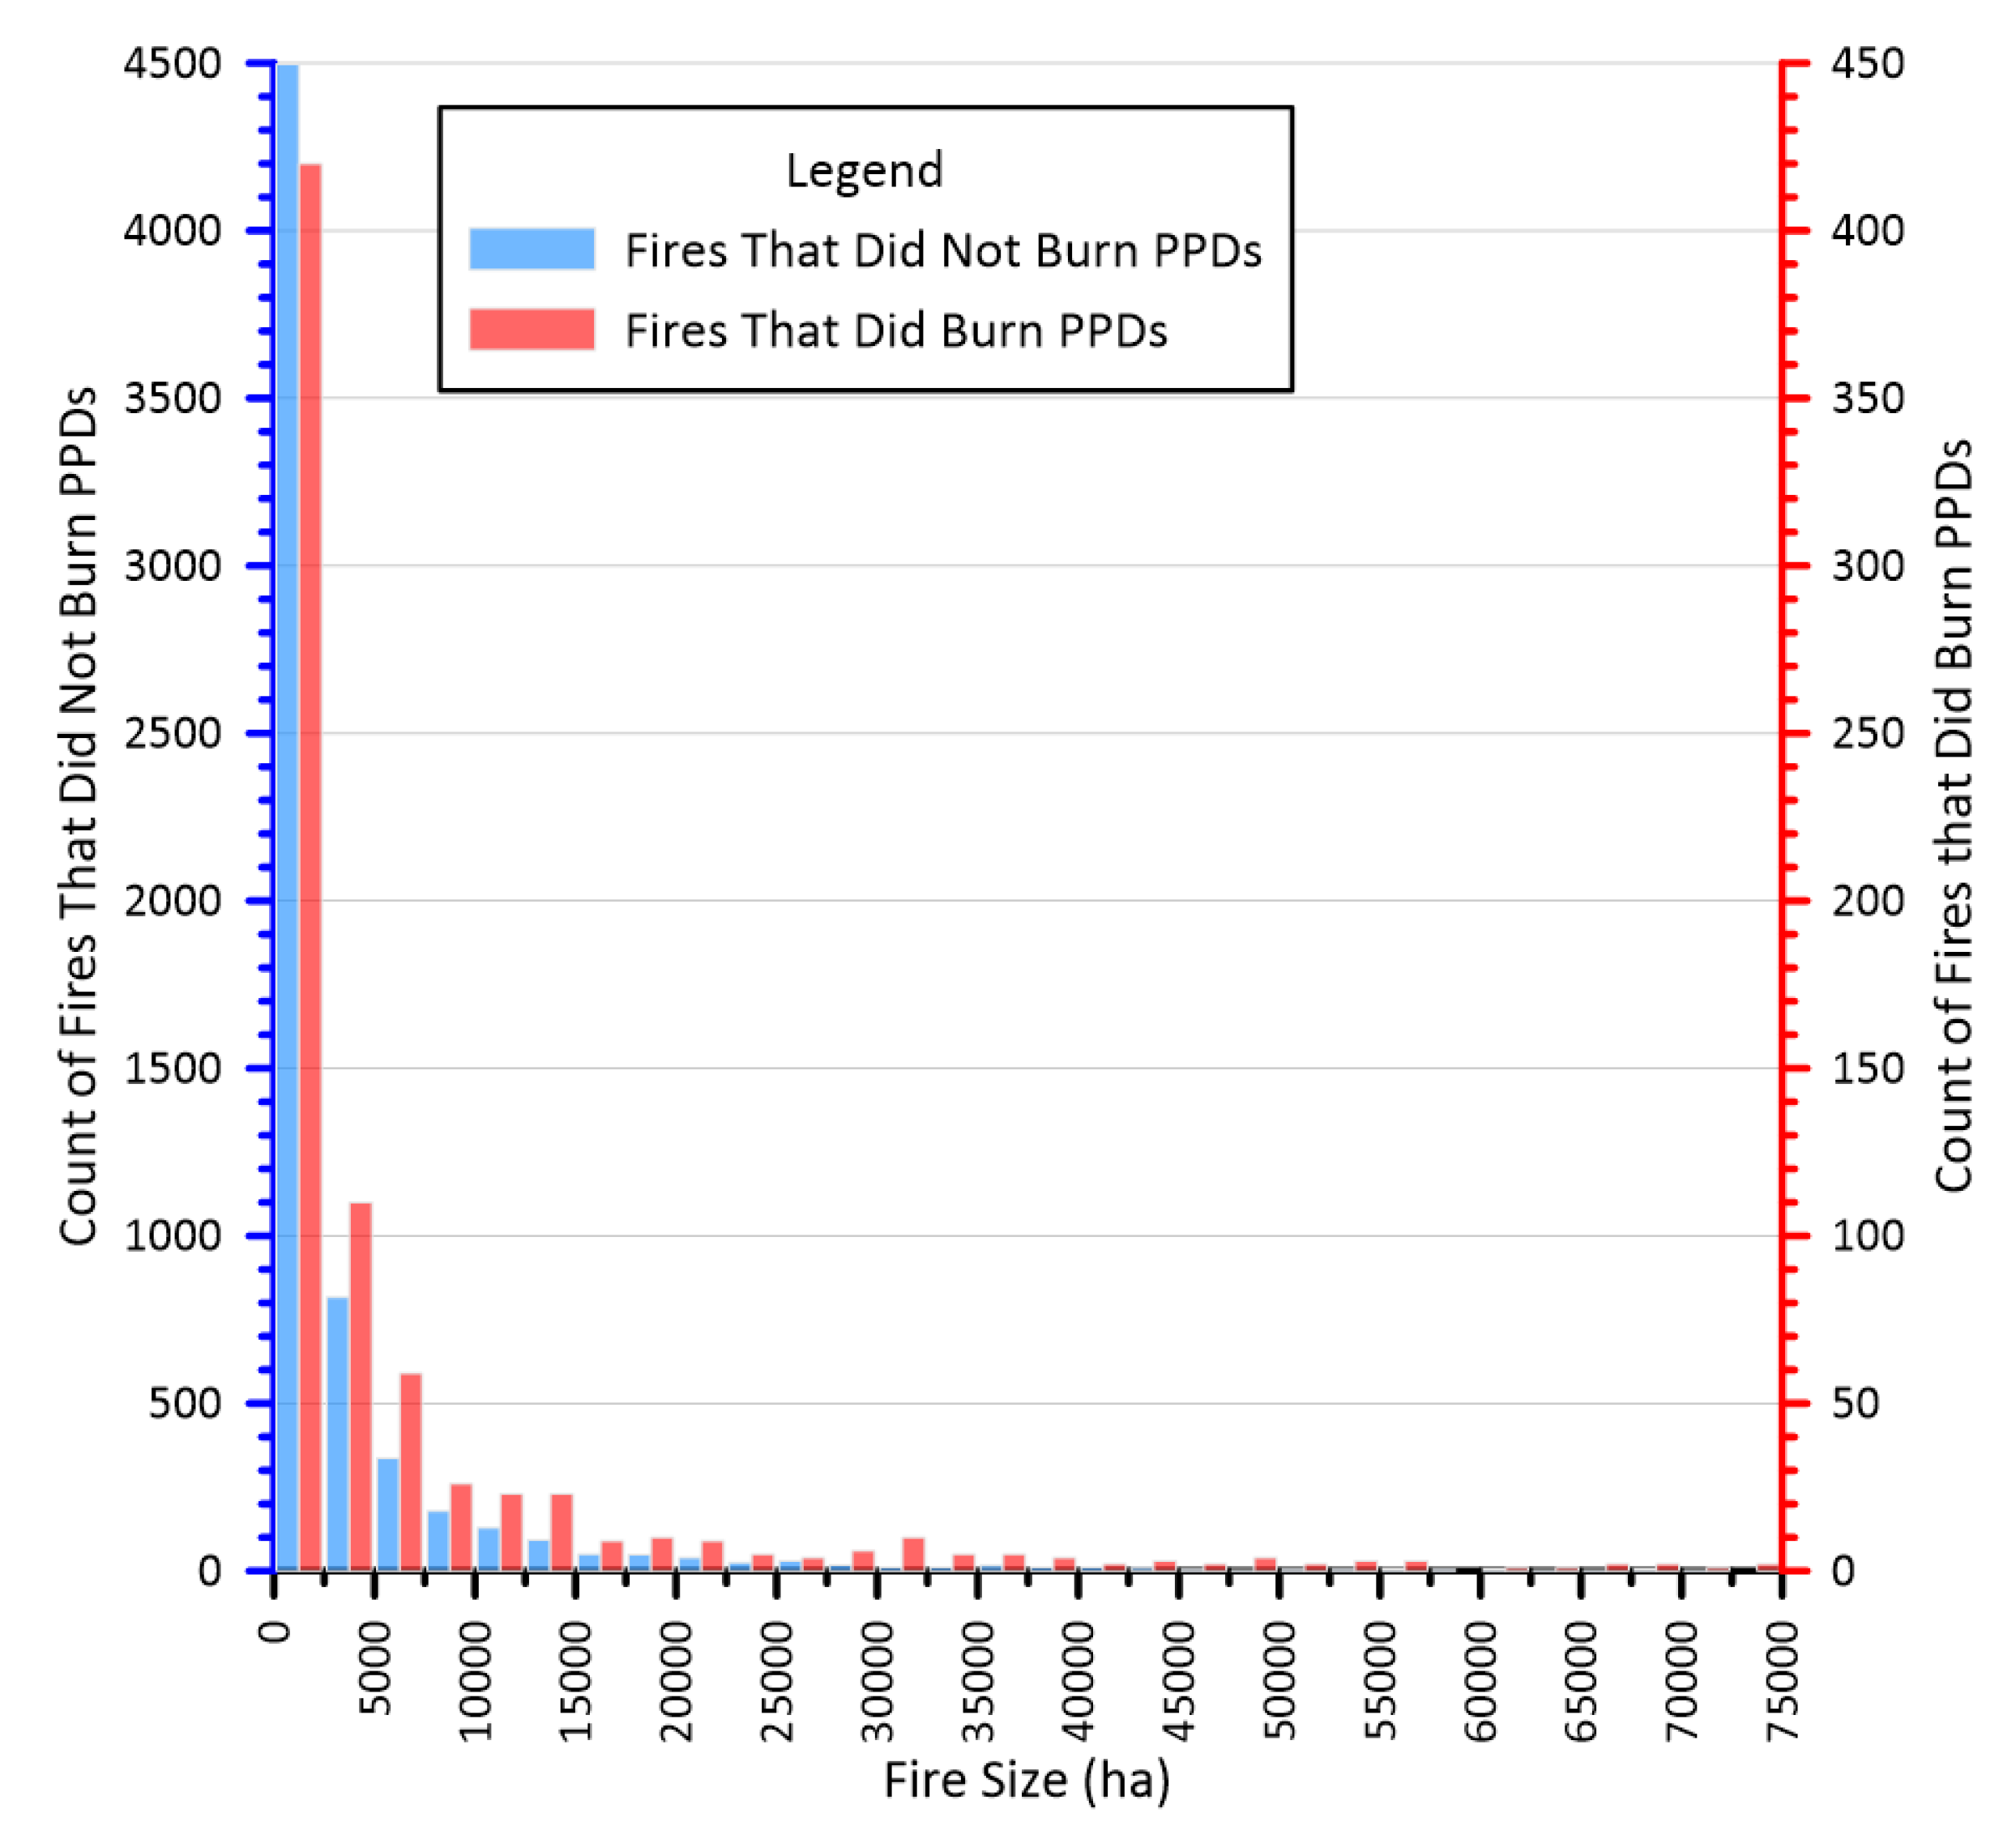
Figure 10.
The 2000-2021 burned area (590,030 ha) within PPDs across the 11WS.
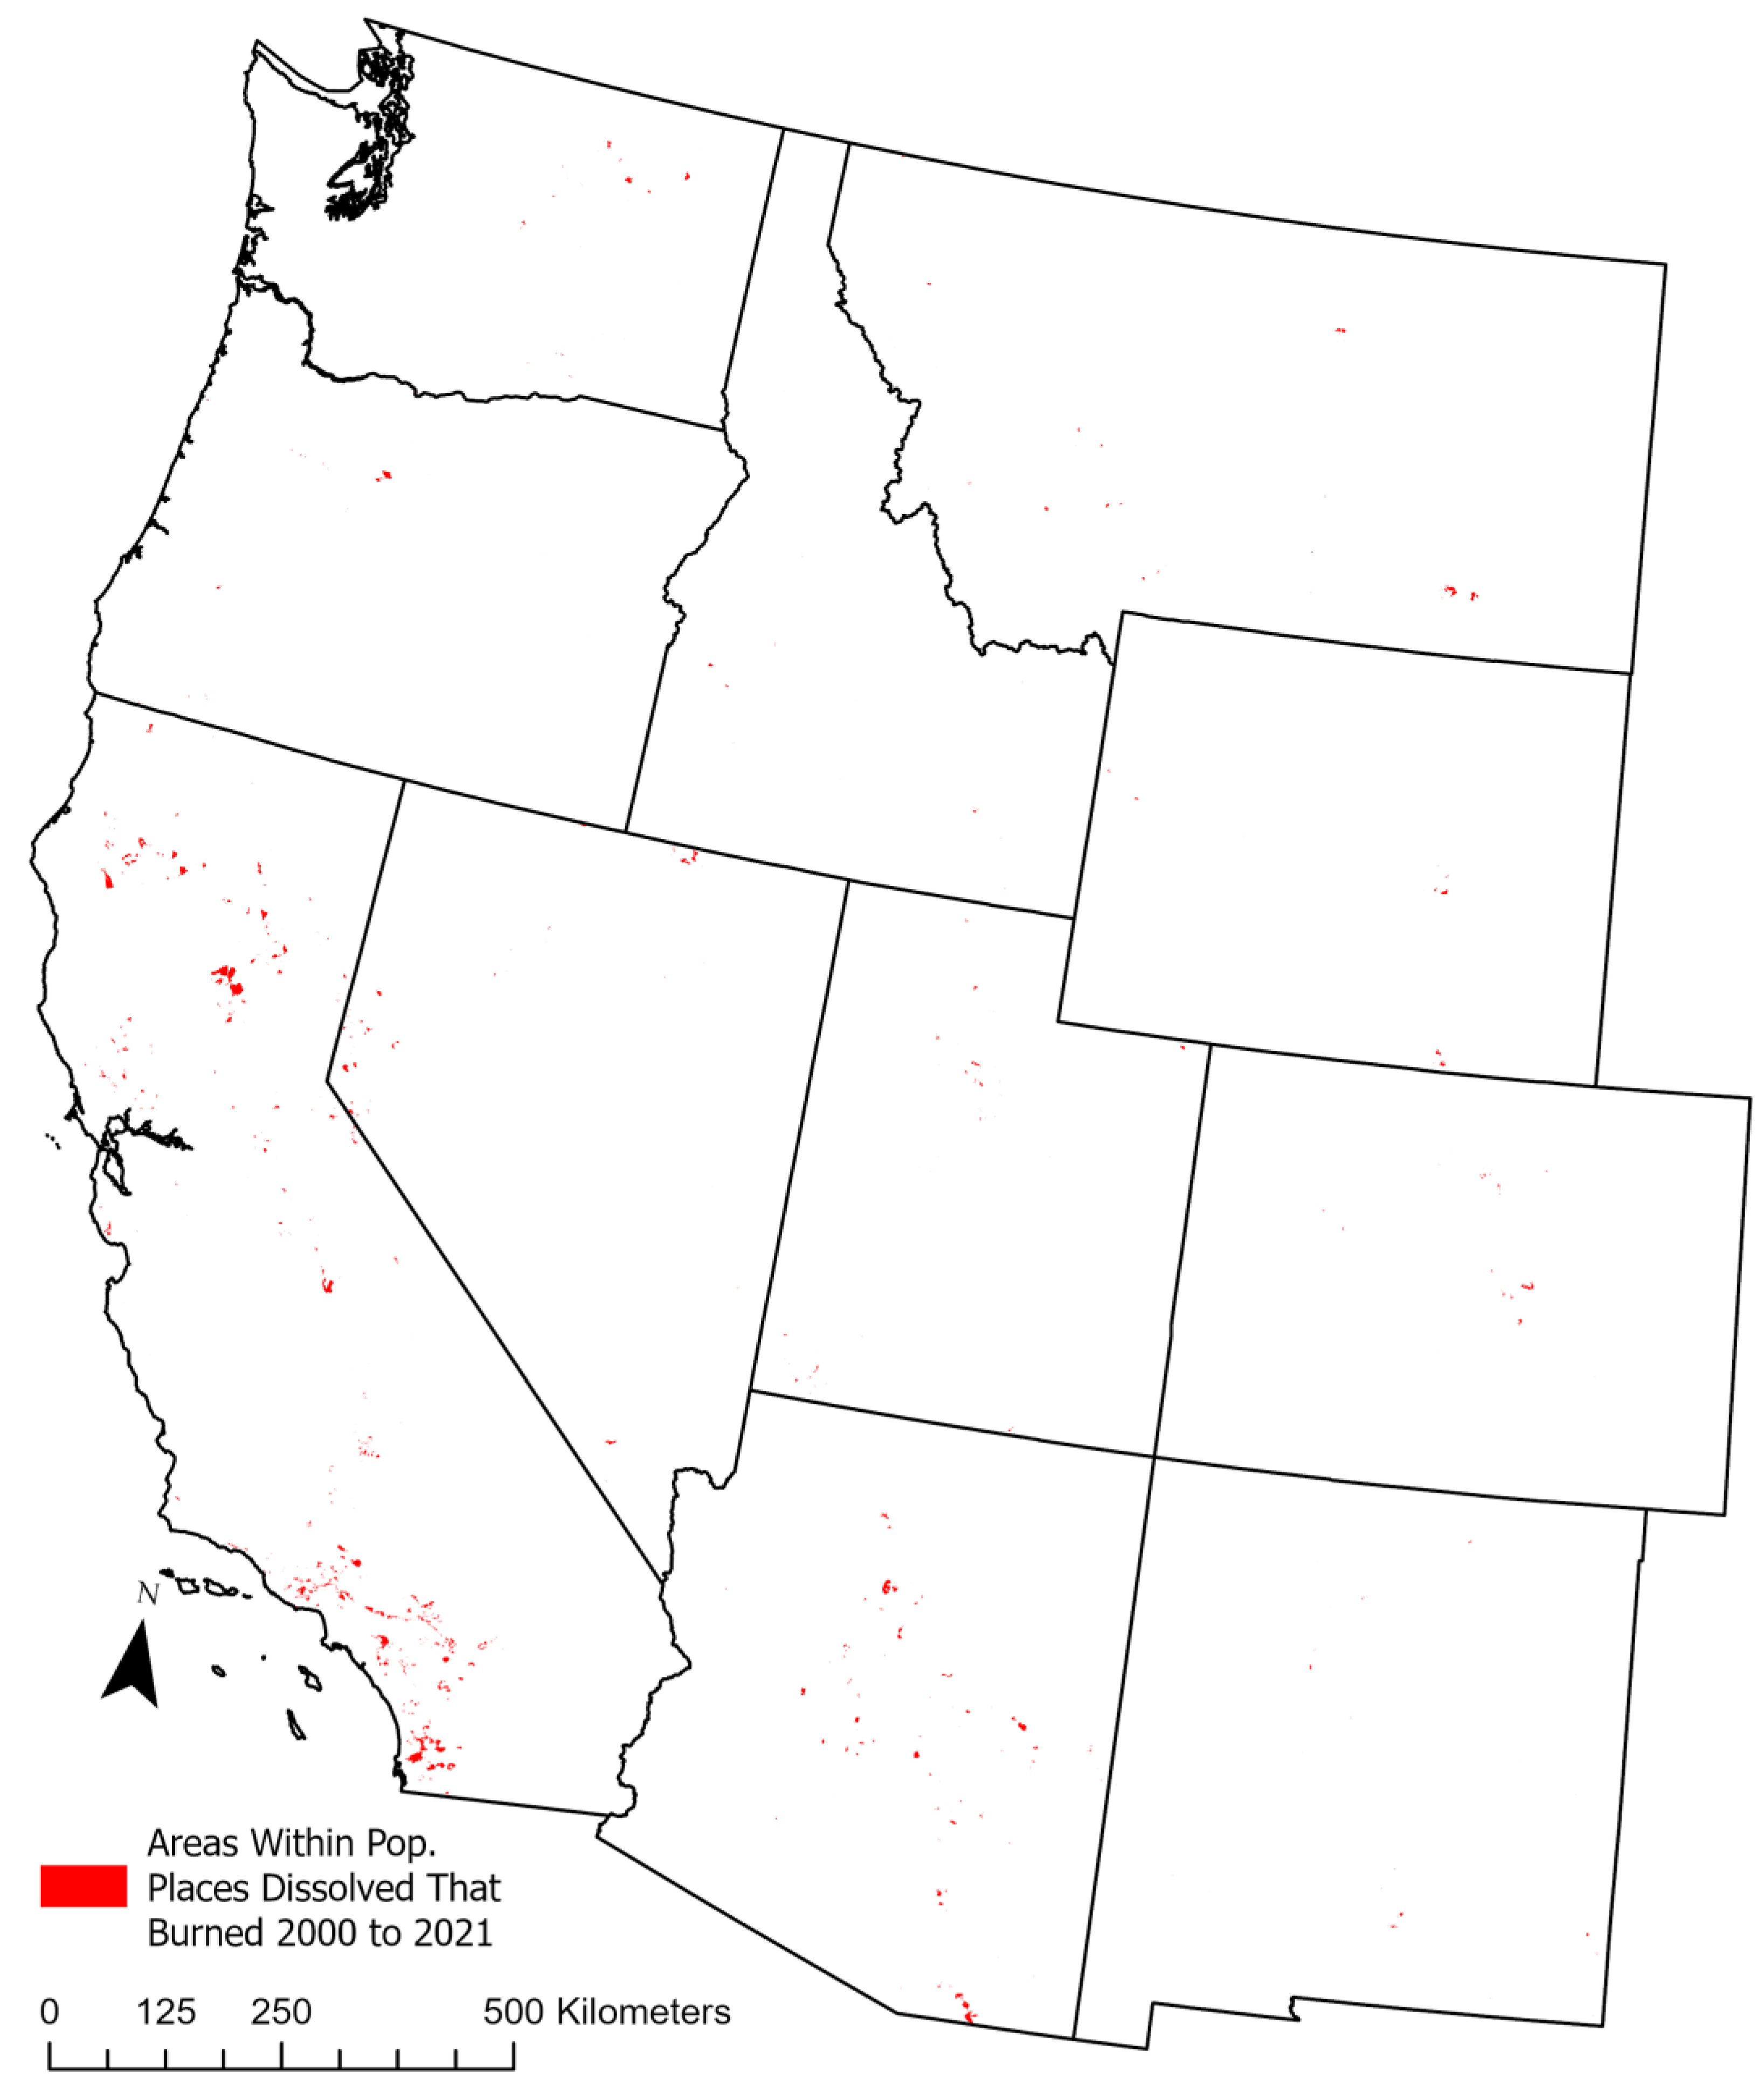
Figure 11.
The 2000-2021 burned area within wildland vegetation inside PPDs in southern California. This is an enlargement of the area visible in red in the southwest corner of Figure 10, which extends roughly from the greater Los Angeles area on the north to San Diego on the south: (a) note the areas of wildland vegetation visible on the inside of PPDs, and (b) note that many of these wildland vegetation areas inside PPDs were burned from 2000 to 2021, as shown in red, and these fires were nearly all within wildland vegetation.
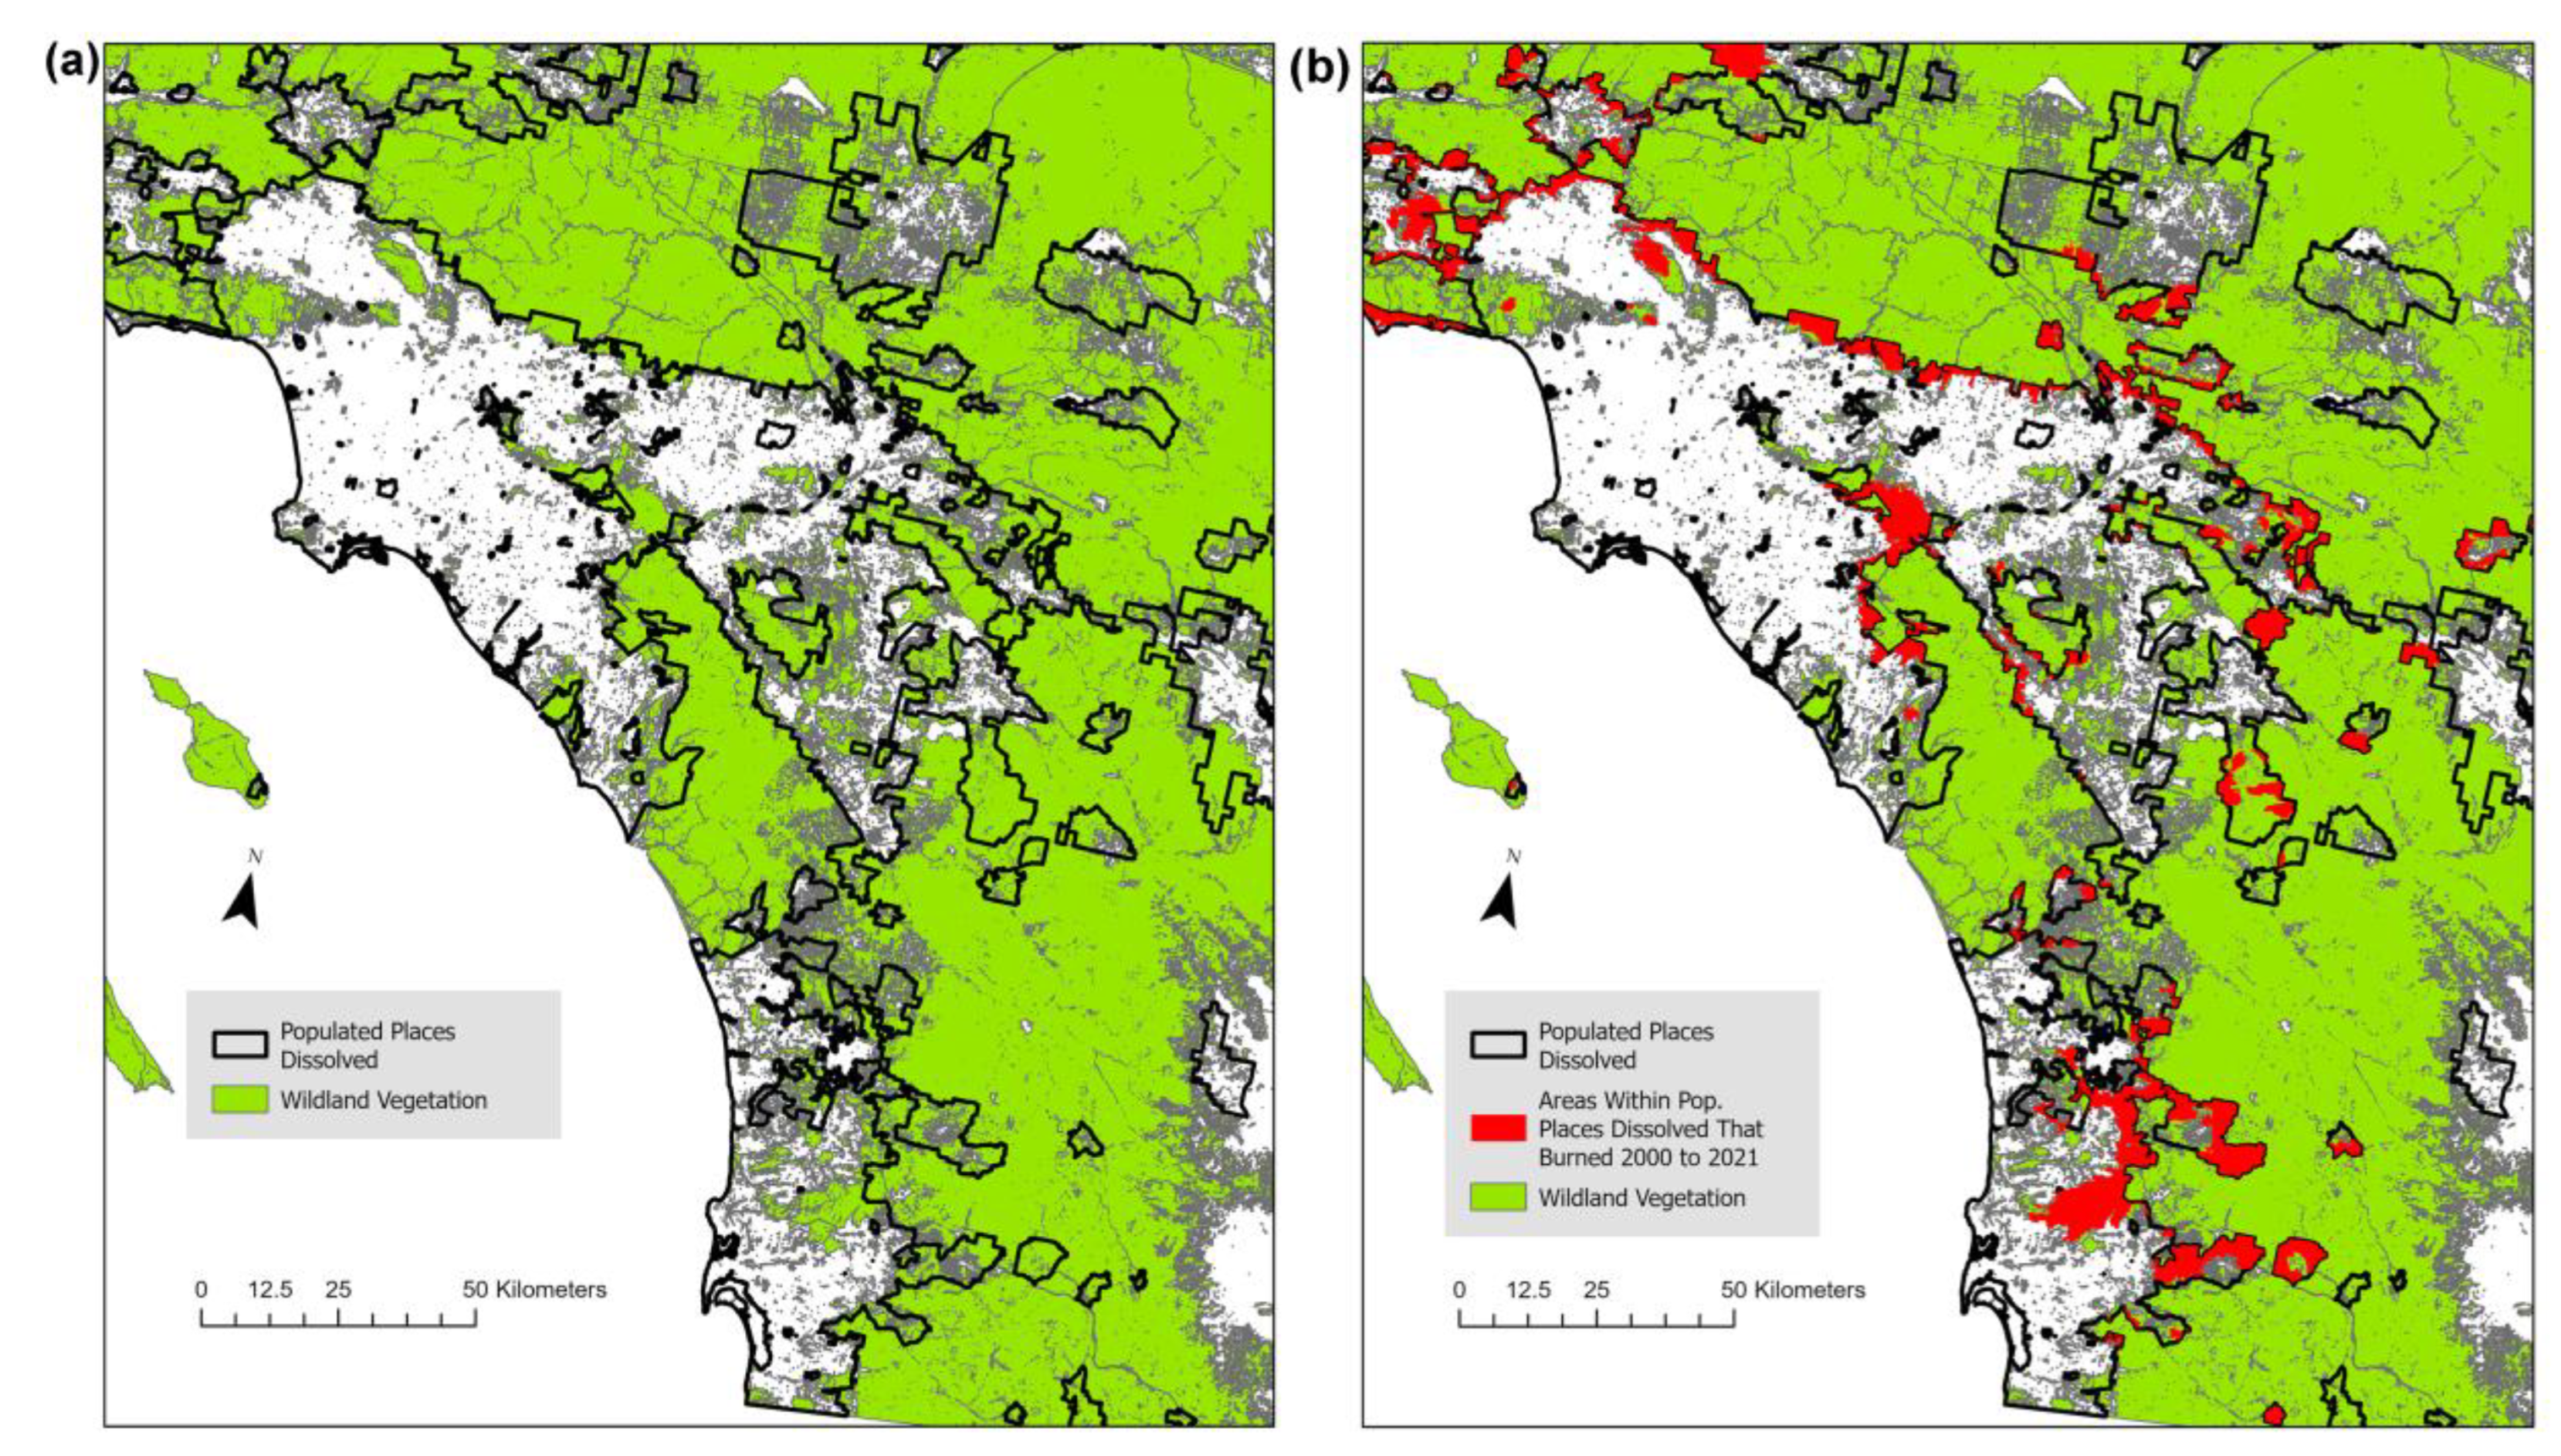

Table 1.
Land uses, initially proposed to be relatively fire-resistant, that could potentially serve as permanent fire buffers for communities.
Table 1.
Land uses, initially proposed to be relatively fire-resistant, that could potentially serve as permanent fire buffers for communities.
| Land Use | Sources | GIS? |
| Wide irrigated or low-flammability land uses | ||
| Agriculture–irrigated or low flammability | Baker (2009), Moritz and Butsic (2020), Moritz et al. (2022) | Yes |
| Golf courses–irrigated or low flammability | Keeley et al. (2004), Baker (2009), Moritz et al. (2022) | No |
| Greenbelts–irrigated or low flammability | Baker (2009), Moritz et al. (2022) | No |
| Parks–irrigated or low flammability recreation (e.g., ballparks) | Keeley et al. (2004), Baker (2009), Moritz and Butsic (2020), Moritz et al. (2022) | Yes |
| Wide concrete, asphalt, gravel infrastructure | ||
| Freeways | This paper | Yes |
| Wide roads | Baker (2009) | Yes |
| Parking lots, garages | This paper | No |
| Dry areas or areas with little fuel | ||
| Barrens | This paper | Yes |
| Gravel pits | This paper | No |
| Large mines | This paper | Yes |
| Rock outcrops | This paper | No |
| Pastures | Moritz et al. (2022) | Yes |
| Wet areas | ||
| Lakes, ponds, reservoirs | Moritz and Butsic (2020) | Yes |
| Rivers and large streams | Moritz and Butsic (2020) | Yes |
| Wetlands–natural or constructed | Baker (2009) | Yes |
| Wide canals | Baker (2009) | No |
Table 2.
Sources of Geographical Information System (GIS) data used in the analysis.
Table 3.
U.S. Census Bureau’s Populated Place Areas within the 11 western states and buffer widths and areas used in the analysis. Interior buffers of 5000 m were not feasible.
Table 3.
U.S. Census Bureau’s Populated Place Areas within the 11 western states and buffer widths and areas used in the analysis. Interior buffers of 5000 m were not feasible.
| Scale | n | Mean Area (ha) | TotalArea (ha) | Building Count | BldgDens.1 |
| Populated Places | 5,565 | 2,260 | 12,574,611 | 21,611,314 | 1.72 |
| Populated Places Dissolved (PPDs) | 4,484 | 2,804 | 12,574,611 | 21,611,314 | 1.72 |
| Interior -850 m to -2500 m buffers | 1,703 | 2,396 | 4,079,845 | 7,835,599 | 1.92 |
| Interior -100 m to -850 m buffers | 4,015 | 1,290 | 5,180,757 | 6,967,195 | 1.34 |
| Interior 0 m to -100 m buffers | 4,484 | 246 | 1,101,035 | 965,588 | 0.88 |
| Exterior 0 m to 100 m buffers | 3,755 | 293 | 1,100,934 | 396,755 | 0.36 |
| Exterior 100 m to 850 m buffers | 2,973 | 2,394 | 7,118,613 | 1,135,075 | 0.16 |
| Exterior 850 m to 2500 m buffers | 2,086 | 7,613 | 15,880,412 | 1,168,427 | 0.07 |
| Exterior 2500 m to 5000 m buffers | 1,306 | 20,148 | 26,312,897 | 960,392 | 0.04 |
| PPDs + exterior buffers | 62,987,467 | 25,271,963 | 0.40 |
1 Building Density is calculated as Building Count / Total Area.
Table 4.
Levels of safeness of 34 broad types of vegetation as settings for communities, based on 2000-2021 fire rotations. Vegetation types are pooled National Vegetation Classification System (NVCS) types in 2001 Landfire Existing Vegetation Type (EVT) data. Fire rotations are from 2000-2021 Monitoring Trends in Burn Severity raster data.
| Pooled NVCS vegetation types | Area (ha) in 11WS | 2000-2021 Burned Area (ha) | Fire rotation (years)1 |
| Safest (>1,400 year fire rotations) | |||
| NW landslide forest/shrubland | 661,846 | 3,562 | 3,679 |
| Agriculture | 25,657,081 | 244,025 | 2,082 |
| Physical-rocks, ice, lakes, streams etc. | 15,939,395 | 164,574 | 1,918 |
| Generally Safe (about 600-1400 year fire rotations) | |||
| Wetlands | 211,111 | 4,087 | 1,022 |
| Developed | 7,437,045 | 167,827 | 878 |
| Great plains shrubland | 1,855,347 | 44,453 | 826 |
| Sonoran desert | 16,548,583 | 428,436 | 765 |
| Alpine | 1,022,213 | 28,025 | 722 |
| Colorado Plateau shrubland | 3,652,307 | 101,851 | 710 |
| Not Very Safe (about 300-600 year fire rotations) | |||
| Salt desert shrubland | 19,972,608 | 791,135 | 500 |
| Great plains grassland | 27,569,211 | 1,173,056 | 465 |
| Chihuahuan desert | 8,728,820 | 385,569 | 448 |
| Subalpine grassland | 2,154,366 | 111,158 | 383 |
| Coastal forest | 3,292,872 | 207,988 | 313 |
| Dangerous (about 150-300 year fire rotations) | |||
| No Data | 31,697 | 2,115 | 297 |
| Riparian | 6,416,895 | 457,275 | 278 |
| Subalpine shrubland | 709,534 | 51,233 | 275 |
| Western grassland/forbland | 4,119,265 | 301,303 | 271 |
| Pinyon-juniper woodland | 18,071,175 | 1,420,898 | 252 |
| Montane shrubland | 4,458,682 | 382,277 | 231 |
| Quaking aspen forest | 5,340,811 | 465,178 | 228 |
| Montane woodland | 1,130,381 | 118,216 | 189 |
| Northwestern forest | 7,297,051 | 804,458 | 180 |
| Sagebrush | 57,702,559 | 6,686,210 | 171 |
| Very Dangerous (< 150 year fire rotations) | |||
| Montane grassland | 2,657,698 | 361,844 | 146 |
| Disturbed forest | 126,400 | 17,594 | 142 |
| Subalpine forest | 12,857,801 | 1,926,431 | 132 |
| Introduced | 7,844,991 | 1,194,502 | 130 |
| Mixed-conifer forest | 22,667,515 | 4,826,755 | 93 |
| Ponderosa pine forest | 8,744,564 | 1,903,749 | 91 |
| Coastal grassland, shrubland, or woodland | 804,667 | 192,659 | 83 |
| Chaparral | 5,855,840 | 1,585,133 | 73 |
| Northwestern steppe/grassland | 1,736,254 | 513,669 | 67 |
| Western oak-pine woodland | 4,665,456 | 1,515,172 | 61 |
| Total area | 307,942,041 | 28,582,417 | 213 |
1 Fire rotation, in years, is estimated as the length of the observation period (22 years) divided by the fraction of the vegetation area that burned over the observation period. It represents the expected period to burn an area equal to the vegetation area. Since these are raster estimates, the 0.9 correction multiplier was applied, as explained in methods.
Table 5.
Fire rotations for potential permanent safe buffers near communities, and for potentially dangerous categories, and those used (X) in the analysis. FR estimates are based on MTBS fire data for 2000-2021 across the 11WS. There is a corresponding expected number of dissolved communities, of 4484 total in the 11WS, burned per year.
| Used | GIS Source1 | Category | Area/ Length in 11 WS | FR (Yrs)2 | Expected Commun. Burned/Yr.3 | |
| Safest (>1,400 year fire rotations) | ||||||
| NLCD | Perennial snow/ice | 86,384 ha | 19,100 | 0.2 | ||
| NLCD | Open water | 3,101,210 ha | 9,954 | 0.5 | ||
| NLCD | Developed, high intensity | 619,542 ha | 8,689 | 0.5 | ||
| NLCD | Barren land | 6,712,973 ha | 7,493 | 0.6 | ||
| NLCD | Cultivated Crops | 20,371,109 ha | 4,893 | 0.9 | ||
| NLCD | Developed, medium intensity | 1,950,894 ha | 4,509 | 1.0 | ||
| NLCD | Hay/Pasture | 3,367,659 ha | 4,337 | 1.0 | ||
| X | 34VegTypes | NW landslide forest/shrubland | 661,846 ha | 3,679 | 1.2 | |
| X | 34VegTypes | Agriculture | 25,657,081 ha | 2,082 | 2.2 | |
| NLCD | Deciduous forest | 3,554,322 ha | 1,997 | 2.2 | ||
| X | 34VegTypes | Physical-rocks, ice, lakes, etc. | 15,939,395 ha | 1,918 | 2.3 | |
| NLCD | Developed, low intensity | 2,212,196 ha | 1,875 | 2.4 | ||
| Total Safest Used | 40,489,918 ha, 13.15% of 11WS | |||||
| Generally Safe (about 600-1400 year fire rotations) | ||||||
| MiscTypes | Large lakes, ponds, reservoirs | 4,489,900 ha | 1,324 | 3.4 | ||
| X | MiscTypes | Large streams and rivers | 84,287 km | 1,277 | 3.5 | |
| X | MiscTypes | US Freeways | 21,818 km | 1,141 | 3.9 | |
| NLCD | Emergent herbaceous wetlands | 2,523,327 ha | 996 | 4.5 | ||
| 34VegTypes | Developed | 7,437,045 ha | 878 | 5.1 | ||
| X | MiscTypes | US Motorways, not Freeways | 9,733 km | 867 | 5.2 | |
| X | 34VegTypes | Great plains shrubland | 1,855,347 ha | 826 | 5.4 | |
| NLCD | Mixed forest | 2,147,621 ha | 824 | 5.4 | ||
| NLCD | Woody wetlands | 1,711,600 ha | 808 | 5.5 | ||
| X | 34VegTypes | Sonoran desert | 16,548,583 ha | 765 | 5.9 | |
| X | 34VegTypes | Alpine | 1,022,213 ha | 722 | 6.2 | |
| X | 34VegTypes | Colorado Plateau shrubland | 3,652,307 ha | 710 | 6.3 | |
| Total Generally Safe Used | 23,407,133 ha, 7.60% of 11WS | |||||
| Not Very Safe (about 300-600 year fire rotations) | ||||||
| NLCD | Developed, Open Space | 3,703,757 ha | 546 | 8.2 | ||
| X | MiscTypes | Large Fresh. Emerg. Wetland | 2,909,070 ha | 510 | 8.8 | |
| X | 34VegTypes | Salt desert shrubland | 19,972,608 ha | 500 | 9.0 | |
| X | 34VegTypes | Great plains grassland | 27,569,211 ha | 465 | 9.6 | |
| NLCD | Evergreen forest | 59,040,607 ha | 464 | 9.7 | ||
| X | 34VegTypes | Chihuahuan desert | 8,728,820 ha | 448 | 10.0 | |
| X | MiscTypes | Mines-Mapped at points only | 38,888 pts | 437 | 10.3 | |
| NLCD | Shrub/scrub | 139,516,236 ha | 431 | 10.4 | ||
| X | 34VegTypes | Subalpine grassland | 2,154,366 ha | 383 | 11.7 | |
| X | 34VegTypes | Coastal forest | 3,292,872 ha | 313 | 14.3 | |
| Total Not Very Safe Used | 63,746,695 ha, 20.70% of 11WS | |||||
| Dangerous (about 150-300 year fire rotations) | ||||||
| X | MiscTypes | Lg. forested/shrub wetland | 1,211,667 ha | 288 | 15.6 | |
| X | 34VegTypes | Riparian | 6,416,895 ha | 278 | 16.1 | |
| X | 34VegTypes | Subalpine shrubland | 709,534 ha | 275 | 16.3 | |
| X | 34VegTypes | Western grassland/forbland | 4,119,265 ha | 271 | 16.5 | |
| X | 34VegTypes | Pinyon-juniper woodland | 18,071,175 ha | 252 | 17.8 | |
| X | MiscTypes | Parks-County and local | 465,224 ha | 251 | 17.9 | |
| X | 34VegTypes | Montane shrubland | 4,458,682 ha | 231 | 19.4 | |
| X | 34VegTypes | Quaking aspen forest | 5,340,811 ha | 228 | 19.7 | |
| X | 34VegTypes | Montane woodland | 1,130,381 ha | 189 | 23.7 | |
| X | 34VegTypes | Northwestern forest | 7,297,051 ha | 180 | 24.9 | |
| X | 34VegTypes | Sagebrush | 57,702,559 ha | 171 | 26.2 | |
| Total Dangerous Used | 106,066,528 ha, 34.44% of 11WS | |||||
| Very Dangerous (<150 year fire rotations) | ||||||
| X | 34VegTypes | Montane grassland | 2,657,698 ha | 146 | 30.7 | |
| X | 34VegTypes | Subalpine forest | 12,857,801 ha | 132 | 34.0 | |
| X | 34VegTypes | Introduced | 7,844,991 ha | 130 | 34.5 | |
| NLCD | Herbaceous | 57,290,894 ha | 113 | 39.7 | ||
| X | 34VegTypes | Mixed-conifer forest | 22,667,515 ha | 93 | 48.2 | |
| X | 34VegTypes | Ponderosa pine forest | 8,744,564 ha | 91 | 49.3 | |
| X | 34VegTypes | Coastal grassl., shrubl., woodl. | 804,667 ha | 83 | 54.0 | |
| X | 34VegTypes | Chaparral | 5,855,840 ha | 73 | 61.4 | |
| X | 34VegTypes | Northwestern steppe/grassland | 1,736,254 ha | 67 | 66.9 | |
| X | 34VegTypes | Western oak-pine woodland | 4,665,456 ha | 61 | 73.5 | |
| Total Very Dangerous Used | 67,834,787 ha, 22.03% of 11WS | |||||
| Synopsis | Total Safeness Categories | 301,545,061 ha, 97.92% of 11WS | ||||
| Total Developed Categories | 4,782,632 ha, 1.55% of 11WS | |||||
| Total Safeness + Developed | 306,327,693 ha, 99.47% of 11WS | |||||
1 Sources include: NLCD=2021 National Land Cover Database categories, which are raster data, 34VegTypes=derived from Landfire’s National Vegetation Classification System (NVCS) attribute, which are also raster data, MiscTypes=Mines, Parks, Freeways, Motorways, streams and rivers, lakes and reservoirs, and the National Wetland Inventory, which are all polygon data except Freeways, Motorways, and Large streams and rivers, which are line data and mines, which are point data. Initial raster estimates were multiplied by 0.9 and initial polygon, line, and point estimates were multiplied by 1.13 as explained in the methods. 2 Fire rotation, in years, is estimated as the length of the observation period (22 years from 2000-2021) divided by the fraction of the Category’s total area, length, or number of points that burned over the 22-year period. FR represents the expected period to burn an area equal to the Category’s total area, length, or number of points. 3 Expected communities burned per year uses the FR to estimate how many of the 4484 PPDs (Table 5) would be expected to burn in a single year if all the communities were surrounded by the Category. The formula is: 4484 * (1/FR).
Table 6.
Fire rotations (2000-2021) for the main Safeness categories and wildland vegetation within external buffers of PPDs and also across the whole 11WS.
Table 6.
Fire rotations (2000-2021) for the main Safeness categories and wildland vegetation within external buffers of PPDs and also across the whole 11WS.
| Fire Rotations (years) for Safeness Categories and Wildland Vegetation | |||||
| Buffer1 | Safest | Gen. Safe | Dangerous | Very Dangerous | Wildland Veg. |
| 0 m - 100 m | 4,567 | 1,515 | 462 | 137 | 323 |
| 100 m - 850 m | 4,068 | 1,142 | 402 | 125 | 274 |
| 850 m - 2500 m | 3,472 | 967 | 327 | 114 | 237 |
| 2500 m - 5000 m | 2,269 | 765 | 287 | 108 | 216 |
| Across 11WS | 1,775 | 764 | 195 | 97 | 190 |
| Ratio of Inner & Outer FRs2 | 2.01 | 1.98 | 1.61 | 1.27 | 1.50 |
1 Distances are outward from the exterior boundary of PPDs; 2 This is the ratio of the FR in the 0 m – 100 m buffer to the FR in the 2500 m to 5000 m buffer.
Table 7.
Variability in FRs, for 2000-2021 fires, across the 4484 PPDs, with them placed in Safeness categories by their fire rotation.
Table 7.
Variability in FRs, for 2000-2021 fires, across the 4484 PPDs, with them placed in Safeness categories by their fire rotation.
| Community FR Class (yrs) | Number of Communities | % of Burned Communities | % of 4484 Total |
| Very Dangerous (<150) | 198 | 39.6 | 4.4 |
| Dangerous (150-300) | 66 | 13.2 | 1.5 |
| Not Very Safe (300-600) | 55 | 11.0 | 1.2 |
| Generally Safe (600-1400) | 47 | 9.4 | 1.0 |
| Safest (1400+) | 133 | 26.7 | 3.0 |
| Communities with fire | 499 | 100.0 | 11.1 |
| Communities with no fire | 3985 | 88.9 |
Table 8.
Inward decline in the number and total size of fires, 2000-2021, that burned at least partly into any buffer of PPDs. This is not the area of fires within the buffers, but instead the total area of these fires, whether inside or outside the buffers. Figure 1 shows these 788 fires that burned into any part of a PPD.
| 2000-2021 Fires That Burned Into a Buffer | |||
| Buffer | Number | Mean area (ha) | Median area (ha) |
| -850 m to -2500 m | 372 | 14,907 | 2,587 |
| -100 m to -850 m | 661 | 12,970 | 2,214 |
| 0 m to -100 m | 757 | 12,399 | 2,297 |
| Pop. Places Diss. | 788 | 11,945 | 2,129 |
| 0 m to 100 m | 827 | 11,733 | 2,159 |
| 100 m to 850 m | 1060 | 10,550 | 1,987 |
| 850 m to 2500 m | 1483 | 9,218 | 1,764 |
| 2500 m to 5000 m | 1956 | 8,230 | 1,763 |
Table 9.
Burned area, by state, within the 499 PPDs that burned from 2000 to 2021.
| Total Burned Area | Mean Burned Area | ||||||
| State | (ha) | (%) | (N) | (%) | (ha/yr) | (N/yr) | Rank |
| Arizona | 85,052 | 14.4 | 67 | 13.4 | 3,866 | 3.05 | 2 |
| California | 377,898 | 64.1 | 197 | 39.5 | 17,177 | 8.95 | 1 |
| Colorado | 11,232 | 1.9 | 22 | 4.4 | 511 | 1.00 | 8 |
| Idaho | 3,732 | 0.6 | 19 | 3.8 | 170 | 0.86 | 11 |
| Montana | 24,083 | 4.1 | 33 | 6.6 | 1,095 | 1.50 | 4 |
| New Mexico | 6,075 | 1.0 | 34 | 6.8 | 276 | 1.55 | 10 |
| Nevada | 27,853 | 4.7 | 28 | 5.6 | 1,266 | 1.27 | 3 |
| Oregon | 16,016 | 2.7 | 31 | 6.2 | 728 | 1.41 | 5 |
| Utah | 14,065 | 2.4 | 22 | 4.4 | 639 | 1.00 | 7 |
| Washington | 15,540 | 2.6 | 34 | 6.8 | 706 | 1.55 | 6 |
| Wyoming | 8,485 | 1.4 | 12 | 2.4 | 386 | 0.55 | 9 |
| Totals/Means | 590,030 | 100.0 | 499 | 100.0 | 26,820 | 22.68 | |
Table 10.
Length of potential operational delineations (PODs) across six broad ownership categories, within PPDs and their buffers. Percentages, among ownership categories, add up to 100.0% within each buffer.
Table 10.
Length of potential operational delineations (PODs) across six broad ownership categories, within PPDs and their buffers. Percentages, among ownership categories, add up to 100.0% within each buffer.
| Owners: | US Forest Service | Other Federal | State | Tribal | Private | Unknown | Total1 | ||||||
| Buffer (m) | (km) | (%) | (km) | (%) | (km) | (%) | (km) | (%) | (km) | (%) | (km) | (%) | (km) |
| -850-2500 | 1,355 | 17.7 | 570 | 7.4 | 157 | 2.1 | 145 | 1.9 | 3,428 | 44.9 | 1,988 | 26.0 | 7,643 |
| -100-850 | 2,100 | 13.7 | 771 | 5.0 | 298 | 2.0 | 277 | 1.8 | 7,270 | 47.3 | 4,641 | 30.2 | 15,357 |
| 0-100 | 1,903 | 20.7 | 744 | 8.1 | 229 | 2.5 | 155 | 1.7 | 3,855 | 41.9 | 2,311 | 25.1 | 9,197 |
| In. PPDs2 | 6,015 | 16.3 | 2,518 | 6.9 | 777 | 2.1 | 652 | 1.8 | 16,253 | 44.1 | 10,612 | 28.8 | 36,827 |
| 0-100 | 2,176 | 24.7 | 744 | 8.5 | 213 | 2.4 | 190 | 2.2 | 3,285 | 37.4 | 2,181 | 24.8 | 8,789 |
| 100-850 | 5,481 | 27.1 | 1,788 | 8.8 | 689 | 3.4 | 365 | 1.8 | 7,084 | 35.1 | 4,803 | 23.8 | 20,210 |
| 850-2500 | 13,866 | 31.5 | 3,872 | 8.8 | 1,537 | 3.5 | 762 | 1.7 | 14,309 | 32.6 | 9,606 | 21.9 | 43,952 |
| 2500-5000 | 25,829 | 36.2 | 7,096 | 10.0 | 2,616 | 3.7 | 1,212 | 1.7 | 21,494 | 30.2 | 12,953 | 18.2 | 71,200 |
| PPDs+Buff. | 53,367 | 29.5 | 16,018 | 8.9 | 5,832 | 3.2 | 3,181 | 1.7 | 62,425 | 34.5 | 40,155 | 22.2 | 180,978 |
1 Total areas here are slightly different from total areas reported in Table 3, as they are measured in GIS using different methods. 2 Inside PPDs is not the sum of the three preceding buffer categories, as there is some additional area beyond -2500 m, but not sufficient to form another consistent deeper buffer inside the PPDs.
Table 11.
Area of mechanical fuel-reduction treatments and associated mechanical treatments across six broad ownership categories, within PPDs and their buffers. Percentages, among ownership categories, add up to 100.0% within each buffer.
Table 11.
Area of mechanical fuel-reduction treatments and associated mechanical treatments across six broad ownership categories, within PPDs and their buffers. Percentages, among ownership categories, add up to 100.0% within each buffer.
| Owners: | US Forest Service | Other Federal | State | Tribal | Private | Unknown | Total1 | ||||||
| Buffer (m) | (ha) | (%) | (ha) | (%) | (ha) | (%) | (ha) | (%) | (ha) | (%) | (ha) | (%) | (ha) |
| -850-2500 | 32,902 | 63.8 | 6,334 | 12.3 | 61 | 0.1 | 8,176 | 15.8 | 1,922 | 3.7 | 2,216 | 4.3 | 51,611 |
| -100-850 | 51,485 | 59.9 | 9,027 | 10.5 | 127 | 0.2 | 9,984 | 11.6 | 11,436 | 13.3 | 3,875 | 4.5 | 85,934 |
| 0-100 | 12,063 | 58.0 | 2,435 | 11.7 | 35 | 0.2 | 1,811 | 8.7 | 3,467 | 16.7 | 986 | 4.7 | 20,795 |
| In. PPDs2 | 104,351 | 60.9 | 20,650 | 12.1 | 226 | 0.1 | 21,093 | 12.3 | 17,165 | 10.3 | 7,446 | 4.3 | 171,381 |
| 0-100 | 15,985 | 61.1 | 4,101 | 15.7 | 143 | 0.5 | 2,379 | 9.1 | 2,557 | 9.7 | 1,014 | 3.9 | 26,179 |
| 100-850 | 99,294 | 66.0 | 19,949 | 13.2 | 723 | 0.5 | 13,166 | 8.7 | 12,149 | 8.1 | 5,237 | 3.5 | 150,518 |
| 850-2500 | 183,529 | 65.2 | 47,171 | 16.8 | 3,122 | 1.1 | 18,541 | 6.6 | 22,147 | 7.9 | 6,725 | 2.4 | 281,235 |
| 2500-5000 | 276,944 | 63.5 | 92,255 | 21.1 | 5,581 | 1.3 | 33,954 | 7.8 | 24,925 | 5.7 | 2,795 | 0.6 | 436,454 |
| PPDs+Buff. | 680,103 | 63.8 | 184,126 | 17.3 | 9,795 | 0.9 | 89,133 | 8.4 | 79.393 | 7.4 | 23,217 | 2.2 | 1,065,767 |
1 Total areas here are slightly different from total areas reported in Table 3, as they are measured in GIS using different methods. 2 Inside PPDs is not the sum of the three preceding buffer categories, as there is some additional area beyond -2500 m, but not sufficient to form another consistent deeper buffer inside the PPDs.
Table 12.
Land ownership trends, across six broad categories, within PPDs and their buffers. Percentages, among ownership categories, add up to 100.0% within each buffer.
Table 12.
Land ownership trends, across six broad categories, within PPDs and their buffers. Percentages, among ownership categories, add up to 100.0% within each buffer.
| Owners: | US ForestService | Other Federal | State | Tribal | Private | Unknown | Total1 | ||||||
| Buffer (m) | (ha) | % | (ha) | % | (ha) | % | (ha) | % | (ha) | % | (ha) | % | (ha) |
| -850-2500 | 230,112 | 5.6 | 347,686 | 8.5 | 195,988 | 4.8 | 271,123 | 6.7 | 1,835,812 | 45.0 | 1.199,259 | 29.4 | 4,079,980 |
| -100-850 | 302,951 | 5.9 | 411,625 | 7.9 | 213,375 | 4.1 | 359,659 | 6.9 | 2,568,602 | 49.6 | 1,323,917 | 25.6 | 5,180,129 |
| 0-100 | 65,594 | 6.0 | 80,169 | 7.3 | 41,392 | 3.7 | 68,280 | 6.2 | 582,615 | 53.0 | 262,085 | 23.8 | 1,100,135 |
| In. PPDs2 | 773,209 | 6.1 | 997,125 | 7.9 | 579,187 | 4.6 | 774,749 | 6.2 | 5,930,792 | 47.2 | 3,518,161 | 28.0 | 12,573,223 |
| 0-100 | 87,489 | 8.0 | 99,214 | 9.0 | 51,010 | 4.6 | 74,076 | 6.8 | 524,949 | 47.9 | 259,294 | 23.7 | 1,096,032 |
| 100-850 | 727,490 | 10.2 | 807,942 | 11.3 | 389,514 | 5.5 | 555,583 | 7.8 | 3,070,170 | 43.2 | 1,562,739 | 22.0 | 7,113,438 |
| 850-2500 | 1,999,436 | 12.6 | 2,159,774 | 13.6 | 916,108 | 5.7 | 1,314,751 | 8.3 | 6,505,124 | 41.0 | 2,982,116 | 18.8 | 15,877,309 |
| 2500-5000 | 3,909,570 | 14.9 | 4,205,236 | 16.0 | 1,626,502 | 6.2 | 2,238,286 | 8.5 | 10,584,099 | 40.2 | 3,747,061 | 14.2 | 26,310,754 |
| PPDs+Buff. | 7,497,194 | 11.9 | 8,269,291 | 13.1 | 3,562,321 | 5.6 | 4,957,445 | 7.9 | 26,615,134 | 42.3 | 12,069,371 | 19.2 | 62,970,756 |
1 Total areas here are slightly different from total areas reported in Table 3, as they are measured in GIS using different methods. 2 Inside PPDs is not the sum of the three preceding buffer categories, as there is some additional area beyond -2500 m, but not sufficient to form another consistent deeper buffer inside the PPDs.
Table 13.
Land ownership of wildland vegetation across six broad categories, within PPDs and their buffers. The percentage of the Table 12 entry that is wildland vegetation is indicated by the % column. For example, the total U.S. Forest Service land ownership (Table 12) that is wildland vegetation varies across the buffers from about 96-98%.
| Owners: | US For. Service | Other Federal | State | Tribal | Private | Unknow. | Total1 | ||||||
| Buffer (m) | (ha) | % | (ha) | % | (ha) | % | (ha) | % | (ha) | % | (ha) | % | (ha) |
| -850-2500 | 226,174 | 98.3 | 287,188 | 82.6 | 164,291 | 83.8 | 229,871 | 84.8 | 899,624 | 49.0 | 533,128 | 44.5 | 2,340,276 |
| -100-850 | 298,429 | 98.5 | 345,256 | 83.9 | 181,255 | 84.9 | 310,209 | 86.3 | 1,291,005 | 50.3 | 678,869 | 51.3 | 3,105,023 |
| 0-100 | 63,123 | 96.2 | 66,250 | 82.6 | 33,359 | 80.6 | 58,625 | 85.9 | 297,784 | 51.1 | 135,958 | 51.9 | 655,099 |
| In. PPDs2 | 760,599 | 98.4 | 824,859 | 82.7 | 490,092 | 84.6 | 663,988 | 85.7 | 2,959,077 | 49.9 | 1,556,060 | 44.2 | 7,254,675 |
| 0 to 100 | 84,306 | 96.4 | 85,547 | 86.2 | 42,308 | 82.9 | 63,982 | 86.4 | 287,705 | 54.8 | 133,485 | 51.5 | 697,333 |
| 100-850 | 713,876 | 98.1 | 729,247 | 90.3 | 339,219 | 87.1 | 495,711 | 89.2 | 1,865,360 | 60.8 | 871,316 | 55.8 | 5,014,729 |
| 850-2500 | 1,968,756 | 98.5 | 1,984,157 | 91.9 | 810,876 | 88.5 | 1,193,261 | 90.8 | 4,169,558 | 64.1 | 1,700,853 | 57.0 | 11,827,461 |
| 2500-5000 | 3,846,384 | 98.4 | 3,901,349 | 92.8 | 1,462,715 | 90.0 | 2,051,875 | 91.7 | 7,192,867 | 68.0 | 2,284,503 | 61.0 | 20,739,693 |
| PPDs+Buff | 7,373,921 | 98.4 | 7,525,159 | 91.0 | 3,145,210 | 88.3 | 4,468,817 | 90.1 | 16,474,567 | 61.9 | 6,546,217 | 54.2 | 45,533,891 |
1, 2 As in Table 12.
Table 14.
Land ownership of Dangerous + Very Dangerous Safeness categories across six broad ownership categories, within PPDs and their buffers. The percentage of the corresponding Table 12 entry that is in the Safeness categories is indicated by the % column. For example, the total U.S. Forest Service land ownership (Table 12) that is in Dangerous + Very Dangerous Safeness categories varies across the buffers from about 86-91%.
| Owners: | US For. Service | Other Federal | State | Tribal | Private | Unknown | Total1 | ||||||
| Buffer (m) | (ha) | % | (ha) | % | (ha) | % | (ha) | % | (ha) | % | (ha) | % | (ha) |
| -850-2500 | 208,383 | 90.6 | 100,388 | 28.9 | 54,148 | 27.6 | 140.056 | 51.7 | 488,318 | 26.6 | 397,185 | 33.1 | 1,388,478 |
| -100-850 | 272,817 | 90.1 | 148,919 | 36.2 | 75,103 | 35.2 | 171,373 | 47.6 | 770,919 | 30.0 | 532,144 | 40.2 | 1,971,275 |
| 0-100 | 56,398 | 86.0 | 31,075 | 38.8 | 15,288 | 36.9 | 31,712 | 46,4 | 185,462 | 31.8 | 106,947 | 40.8 | 426,882 |
| In. PPDs2 | 696,693 | 90.1 | 324,693 | 32.6 | 204,177 | 35.3 | 395,997 | 51.1 | 1,717,173 | 29.0 | 1,185,924 | 33.7 | 4,524,657 |
| 0-100 | 74,879 | 85.6 | 40,464 | 40.8 | 18,667 | 36.6 | 33,758 | 45.6 | 175,336 | 33.4 | 103,928 | 40.1 | 447,032 |
| 100-850 | 646,404 | 88.9 | 357,342 | 44.2 | 159,370 | 40.9 | 265,300 | 47.8 | 1,170,302 | 38.1 | 704,665 | 45.1 | 3,303,383 |
| 850-2500 | 1,785,691 | 89.3 | 1,034,752 | 47.9 | 416,536 | 45.5 | 644,767 | 49.0 | 2,671,646 | 41.1 | 1,389,259 | 46.6 | 7,942,651 |
| 2500-5000 | 3,494,923 | 89.4 | 2,135,290 | 50.8 | 783,089 | 48.1 | 1,146,074 | 51.2 | 4,577,321 | 43.2 | 1,898,317 | 50.7 | 14,035,014 |
| PPDs+Buff | 6,698,590 | 89.3 | 3,892,541 | 47.1 | 1,581,839 | 44.4 | 2,485,896 | 50.1 | 10,311,778 | 38.7 | 5,282,093 | 43.8 | 30,252,737 |
1, 2 As in Table 12.
Table 15.
Land ownership of Safest + Generally Safe categories across six broad ownership categories, within PPDs and their buffers. The percentage of the corresponding Table 12 entry that is in the Safeness categories is indicated by the % column. For example, the total U.S. Forest Service land ownership (Table 12) that is in Safest + Generally Safe categories varies across the buffers from about 5-7%.
| Owners: | US For. Serv. | Other Federal | State | Tribal | Private | Unknown | Total1 | ||||||
| Buffer (m) | (ha) | % | (ha) | % | (ha) | % | (ha) | % | (ha) | % | (ha) | % | (ha) |
| -850-2500 | 11,055 | 4.8 | 174,922 | 50.3 | 105,379 | 53.8 | 67,967 | 25.1 | 519,392 | 28.3 | 199,906 | 16.7 | 1,078,621 |
| -100-850 | 15,995 | 5.3 | 171,086 | 41.6 | 94,608 | 44.3 | 100,819 | 28.0 | 788,475 | 30.7 | 307,570 | 23.2 | 1,478,553 |
| 0-100 | 4,215 | 6.4 | 29,472 | 36.8 | 15,884 | 38.4 | 17,743 | 26.0 | 182,180 | 31.3 | 69,468 | 26.5 | 318,962 |
| In PPDs2 | 36,140 | 4.7 | 457,582 | 45.9 | 264,957 | 45.7 | 196,803 | 25.4 | 1,729,063 | 29.2 | 667,273 | 19.0 | 3,351,818 |
| 0-100 | 6,357 | 7.3 | 35,087 | 35.4 | 20,290 | 39.8 | 20,635 | 27.9 | 181,132 | 34.5 | 93,150 | 35.9 | 356,651 |
| 100-850 | 47,807 | 6.6 | 278,103 | 34.4 | 149,255 | 38.3 | 171,455 | 30.9 | 1,166,032 | 38.0 | 658,225 | 42.1 | 2,470,877 |
| 850-2500 | 112,831 | 5.6 | 661,843 | 30.6 | 295,906 | 32.3 | 413,412 | 31.4 | 2,331,590 | 35.8 | 1,277,856 | 34.1 | 5,093,438 |
| 2500-5000 | 213,665 | 5.5 | 1,144,814 | 27.2 | 434,741 | 26.7 | 697,835 | 31.2 | 3,484,466 | 32.9 | 1,486,856 | 39.7 | 7,462,377 |
| PPDs+Buff | 416,800 | 5.6 | 2,577,429 | 31.2 | 1,165,149 | 32.7 | 1,500,140 | 30.3 | 8,892,283 | 33.4 | 4,183,360 | 34.7 | 18,735,161 |
1, 2 As in Table 12.
Disclaimer/Publisher’s Note: The statements, opinions and data contained in all publications are solely those of the individual author(s) and contributor(s) and not of MDPI and/or the editor(s). MDPI and/or the editor(s) disclaim responsibility for any injury to people or property resulting from any ideas, methods, instructions or products referred to in the content. |
© 2025 by the authors. Licensee MDPI, Basel, Switzerland. This article is an open access article distributed under the terms and conditions of the Creative Commons Attribution (CC BY) license (http://creativecommons.org/licenses/by/4.0/).
Copyright: This open access article is published under a Creative Commons CC BY 4.0 license, which permit the free download, distribution, and reuse, provided that the author and preprint are cited in any reuse.


