
Submitted:
11 January 2025
Posted:
13 January 2025
You are already at the latest version
Abstract
GINS1 (PSF1 homolog) forms a part of complex called GINS, named after numbers 5-1-2-3 (go-ichi-ni-san in Japanese) apropos the 4 protein subunits of the complex, namely, SLD5, PSF1, PSF2, and PSF3. It is a subgroup of the CDC45-MCM-(2 to 7)- GINS (CMG) complex, the enzyme that unwinds double-stranded DNA at replication forks. GINS1 has been found to be overexpressed in multiple cancers. In colorectal cancer (CRC) cells treated with ETC-1922159, GISN1 was found to be down regulated along with other genes. A recently developed search engine ranked combinations of GISN1-X (X, a particular gene/protein) at 2nd order level after drug administration. Some of these combinations have been tested in wet lab, however many have been pointed out by the search engine that are yet to be explored/tested. These rankings reveal which GINS1-X combinations might be working synergistically in CRC. In this research work, I cover combinations of GINS1 with possible members of, origin recognition complex (ORC), minichromosome maintenance complex (MCM), DNA- directed DNA polymerases (POL), DNA-dependent RNA polymerase (POLR), topoisomerases (TOP), ubiquitin specific peptidase (USP), Fanconi anemia complementa- tion group (FANC), forkhead box (FOX) and notch receptor (NOTCH) family.
Keywords:
GISN1
; porcupine inhibitor ETC-1922159
; sensitivity analysis
; machine learning
; colorectal cancer
1. Introduction
1.1. Eukaryotic DNA Replication Machinery
Eukaryotic DNA replication restricts DNA replication once per cell cycle. The replication machinery coordinates many proteins at the site of replication, forming the replisome (Leman and Noguchi [1]). The replication process is a two step process in a given cell cycle - • during the G1-phase, there is loading of the replicative helicase, MCM-(2 to 7), onto chromatin by the ORC complex, where CDC6, CDT1, and MCM-(2 to 7) assemble at replication origins, and form pre-replicative complexes (pre-RCs). • In the subsequent S-phase, kinase activition allows fork establishment through CMG complex formation.
Considering the architecture, Li and O’Donnell [2] and Parker et al. [3] elucidate that CMG complex surrounds the DNA at origins in two steps - • in the G1 phase, two MCM-(2 to 7) rings are assembled around duplex DNA at the origin, by the concerted actions of the ORC, CDC6, and CDT1, thus forming a double hexamer. •, in S phase, CDC45 and GINS are assembled onto each MCM-(2 to 7) ring for production of two CMGs that ultimately form two replication forks that travel in opposite directions. Further, EM studies have revealed a 20-subunit core replisome with the leading POL and lagging POL, primase on opposite faces of CMG, thus forming a fundamentally asymmetric replisome architecture.
1.2. GINS Complex and Cancer
Via biochemical analysis it has been shown that GINS works at the heart of the replication apparatus as a component of the CMG complex which facilitates the unwinding of duplex DNA ahead of the moving replication fork (MacNeill [4] and MacNeill [5]).
Xiang et al. [6] provide a comprehensive review regarding insight into the mechanisms and dynamics of how CMG is regulated during its assembly and activation in mammalian genomes, and how errors in CMG regulation due to oncogenic changes promote tumorigenesis. Seo and Kang [7] provide a review that emphasizes on molecular function of the CMG during replication and its relevance to cancers, based on published literature. They indicate that the CMG complex can be a potential target for a treatment of cancer and the feasibility of this replicative helicase as a therapeutic target has been tested recently.
In breast cancer cells, Nakahara et al. [8] found that GINS1 (PSF1) was over-expressed and knockdown of PSF1 expression slowed the growth of breast cancer cell lines by delaying DNA replication. Further, reduced PSF1 expression also inhibited anchorage-independent growth in breast cancer cell lines. Similar results regarding role of PSF1 in hepatocellular carcinoma tissues, was reported by Zhou et al. [9]. Chromosomal instability (CIN) is a trademark of cancer and comprises structural (S-CIN) and whole chromosomal (W-CIN). In human cancers, recent works have indicated that replication stress (RS), known to contribute to S-CIN, also affects mitotic chromosome segregation. Böhly et al. [10] showed that RS-induced increased origin firing was sufficient to trigger W-CIN and discovered that overexpression of these origin firing genes, like GINS1 and CDC45, correlated with W-CIN. In another study regarding hepatocellular carcinoma, Liang et al. [11] found that ZEB1 was a regulator of GINS1 induced epithelial mesenchymal transition (EMT), and GINS1 promoted EMT and tumor metastasis through -catenin signaling. Finally, through immunohistochemistry studies in bladder cancer (BC) tissues, Fu et al. [12] demonstrate that increase in GINS1 expression. They show that GINS1 silencing arrested the cell cycle at the phase of G0/G1 phase, which inhibited BC cell growth both in vitro and in vivo, and GINS1 knockdown also hindered the AKT/mTOR pathway. In colorectal cancer (CRC) cells treated with ETC-1922159, GISN1 was found to be down regulated along with other genes.
GISN1 works in tandem with multiple components and some combinations of GISN1 have been confirmed in wet lab. However, many of the combinations have not been explored/tested or are known. To reveal these combinations, I use a modification of a recently published machine learning based search engine, details of which are given in the next section.
1.3. Combinatorial Search Problem and a Possible Solution
In a recently published work Sinha [13], a frame work of a search engine was developed which can rank combinations of factors (genes/proteins) in a signaling pathway. Readers are requested to go through the adaptation of the above mentioned work for gaining deeper insight into the working of the pipeline and its use of published data set generated after administration of ETC-1922159, Sinha [14]. The work uses SVM package by Joachims [15] in https://www.cs.cornell.edu/people/tj/svm_light/svm_rank.html. I use the adaptation to rank 2nd order gene combinations.
2. Results & Discussion
2.1. GISN1 Related Synergies
2.1.1. GINS1 - ORC
Coulombe et al. [16] analysed the pre-RC proteomic interactome in human cells and found ORC-ubiquitin-ligase-1 (OBI1) to be associated with the ORC complex. OBI1 silencing resulted in defective origin firing, as shown by reduced CMG formation and OBI1 catalysed the multi-mono-ubiquitylation of a subset of chromatin-bound ORC3 and ORC5 during S-phase. Further, to determine which step of replication origin licensing or firing wass regulated by OBI1, they analysed the expression and chromatin association of key replication factors. Depletion of ORC1 lead to impaired recruitment of the MCM-(2 to 7) complex to chromatin, which confirmed defective origin licensing and as a consequence of this, chromatin binding of factors involved in the subsequent firing step, such as PSF1/GINS1 was reduced. Also, OBI1 knockdown impaired chromatin recruitment of replisome component PSF1/GINS1 by approximately 50%. These experiments confirm a possible synergy between ORC and GINS1. In colorectal cancer cells treated with ETC-1922159, ORC family members and GINS1, were found to be down regulated and their regulation was recorded independently. I was able to rank 2nd order combination of these ORC members along with GINS1.
Table 1 shows rankings of these combinations. Followed by this is the unexplored combinatorial hypotheses in Table 2 generated from analysis of the ranks in Table 1. The Table 1 shows rankings of ORC members w.r.t GINS1. ORC1 - GINS1 shows low ranking of 89 (laplace) and 224 (linear). ORC6 - GINS1 shows low ranking of 715 (laplace) and 419 (linear). ORC5 - GINS1 shows low ranking of 1451 (laplace) and 670 (rbf). These rankings point to the synergy existing between the two components, which have been down regulated after the drug treatment.
Further, ORC2 and ORC3 showed high ranking with GINS1, thus indicating that they might not be working synergistically with GINS1, before the drug treatment.
One can also interpret the results of the Table 1 graphically, with the following influences - • ORC members w.r.t GINS1 with GINS1 ORC-1/6/5.
2.1.2. GINS1 - MCM
As mentioned in one of the previous paragraphs, MCM family interacts with GINS in the CMG-complex formation. Brosh Jr and Trakselis [17] review the role of MCM10 in regulation of fork progression and regression and state that MCM10 crosslinks significantly with two members (PSF-1/2) i.e GINS-1/2, CDC45, and MCM-2/5/6 on the N-face. In colorectal cancer cells treated with ETC-1922159, MCM family members and GINS1, were found to be down regulated and their regulation was recorded independently. I was able to rank 2nd order combination of these MCM members along with GINS1.
Table 3 shows rankings of these combinations. Followed by this is the unexplored combinatorial hypotheses in Table 4 generated from analysis of the ranks in Table 3. The Table 3 shows rankings of MCM members w.r.t GINS1. MCM4 - GINS1 shows low ranking of 17 (laplace) and 63 (linear). MCM3 - GINS1 shows low ranking of 35 (laplace) and 90 (linear). MCM2 - GINS1 shows low ranking of 41 (laplace) and 143 (linear). MCM10 - GINS1 shows low ranking of 114 (laplace) and 139 (linear). MCM6 - GINS1 shows low ranking of 156 (laplace) and 231 (linear). MCM5 - GINS1 shows low ranking of 210 (laplace) and 509 (linear). MCM8 - GINS1 shows low ranking of 243 (laplace) and 849 (linear). MCM7 - GINS1 shows low ranking of 1383 (laplace), 184 (linear) and 34 (rbf). These rankings point to the synergy existing between the two components, which have been down regulated after the drug treatment.
Further, MCMDC2 showed high ranking with GINS1, thus indicating that they might not be working synergistically with GINS1, before the drug treatment.
One can also interpret the results of the Table 3 graphically, with the following influences - • MCM members w.r.t GINS1 with GINS1 MCM-4/3/2/10/6/5/8/7.
2.1.3. GINS1 - POL/POLR
Bell and Labib [18] elucidate that DNA synthesis is carried out by three multisubunit DNA-directed DNA polymerases, POL, POL, and POL. Further, POL and POL are connected to the CMG helicase via GINS. Later, Denkiewicz-Kruk et al. [19] concluded that the impaired interaction between GINS and POL required involvement of error-prone POL, and increased participation of recombination as a rescue mechanism for recovery of impaired replication forks. In colorectal cancer cells treated with ETC-1922159, POL family members and GINS1, were found to be down regulated and their regulation was recorded independently. Additionally, DNA-dependent RNA polymerase (POLR) family members were also observed as down regulated. I was able to rank 2nd order combination of these POL/POLR members along with GINS1.
Table 5 shows rankings of these combinations. Followed by this is the unexplored combinatorial hypotheses in Table 6 generated from analysis of the ranks in Table 5. The Table 5 shows rankings of POL members w.r.t GINS1. POL2 (or E2) - GINS1 shows low ranking of 87 (laplace) and 393 (linear). POL (or Q) - GINS1 shows low ranking of 203 (laplace) and 102 (linear). POL1 (or A1) - GINS1 shows low ranking of 377 (laplace), 412 (linear) and 1100 (rbf). POL1 (or D1) - GINS1 shows low ranking of 407 (laplace), 691 (linear) and 1255 (rbf). POL2 (or D2) - GINS1 shows low ranking of 417 (laplace) and 323 (rbf). POL2 (or G2) - GINS1 shows low ranking of 918 (laplace) and 1129 (linear). POL3 (or E3) - GINS1 shows low ranking of 1429 (laplace), 1265 (linear) and 810 (rbf). POL2 (or A2) - GINS1 shows low ranking of 1295 (linear) and 811 (rbf). These rankings point to the synergy existing between the two components, which have been down regulated after the drug treatment. Further, POL (or B) showed high ranking with GINS1, thus indicating that they might not be working synergistically with GINS1, before the drug treatment.
The Table 5 also shows rankings of POLR members w.r.t GINS1. POLR-3K - GINS1 shows low ranking of 459 (laplace), 993 (linear) and 222 (rbf). POLR-1C - GINS1 shows low ranking of 529 (laplace) and 806 (linear). POLR-1E - GINS1 shows low ranking of 670 (laplace), 588 (linear) and 888 (rbf). POLR-1B - GINS1 shows low ranking of 889 (laplace), 1019 (linear) and 280 (rbf). POLR-3E - GINS1 shows low ranking of 1209 (laplace) and 720 (rbf). POLR-2G - GINS1 shows low ranking of 1312 (laplace) and 1000 (rbf). These rankings point to the synergy existing between the two components, which have been down regulated after the drug treatment. Further, POLR-2K, POLR-3A, POLR-2F, POLR-1A, POLR-2D and POLR-1D showed high ranking with GINS1, thus indicating that they might not be working synergistically with GINS1, before the drug treatment.
One can also interpret the results of the Table 5 graphically, with the following influences - • POL members w.r.t GINS1 with GINS1 POL-2 (or E2) / (or Q) / 1 (or A1) / 1 (or D1) / 2 (or D2) / 2 (or G2) / 3 (or E3) / 2 (or A2), and GINS1 POLR-3K/1C/1E/1B/3E/2G.
2.1.4. GINS1 - TOP
Yang et al. [20] revealed through functional assays that GINS1 aggravated glioma malignant phenotypes in vitro and in vivo. Their study identified that GINS1 interacted with TOP2A and promoted glioma cell proliferation and migration through USP15-mediated deubiquitination of TOP2A protein. Day et al. [21] demostrated through biochemical and structural studies that GINS interacted with TOPBP1 through two separate binding surfaces, involving a conserved amino acids in the TOPBP1-GINI region and a surface on TOPBP1-BRCT4. These two surfaces bind to opposite ends of the A domain of the GINS subunit PSF1/GINS1. In colorectal cancer cells treated with ETC-1922159, TOP family members and GINS1, were found to be down regulated and their regulation was recorded independently. I was able to rank 2nd order combination of these TOP members along with GINS1.
Table 7 shows rankings of these combinations. Followed by this is the unexplored combinatorial hypotheses in Table 8 generated from analysis of the ranks in Table 7. The Table 7 shows rankings of TOP members w.r.t GINS1. TOP2A - GINS1 shows low ranking of 25 (laplace) and 896 (linear). TOP1MT - GINS1 shows low ranking of 366 (laplace) and 489 (linear). These rankings point to the synergy existing between the two components, which have been down regulated after the drug treatment.
Further, TOPBP1 and TOPB2 showed high ranking with GINS1, thus indicating that they might not be working synergistically with GINS1, before the drug treatment.
Also, as a synergy between TOP2A and GINS1, through USP15 was demonstrated in one of the forgoing literature, a ranking of the recorded members of USP family with GINS1 was also tabulated. The Table 7 shows rankings of USP members w.r.t GINS1, also. USP13 - GINS1 shows low ranking of 328 (laplace) and 75 (linear). USP28 - GINS1 shows low ranking of 1283 (laplace), 750 (linear) and 443 (rbf). These rankings point to the synergy existing between the two components, which have been down regulated after the drug treatment.
Further, USP36, USP1, USP39 and USP10 showed high ranking with GINS1, thus indicating that they might not be working synergistically with GINS1, before the drug treatment.
One can also interpret the results of the Table 7 graphically, with the following influences - • TOP members w.r.t GINS1 with GINS1 TOP-2A/1MT, and • USP members w.r.t GINS1 with GINS1 USP-13/28.
2.1.5. GINS1 - FANC
Although the CMG complex implies that interstrand crosslinks (ICLs) are absolute blocks to replisomes, recent studies indicate that cells can restart DNA synthesis on the side of the ICL distal to the initial encounter. Huang et al. [22] report that this restart requires ATR and is promoted by FANCD2 and phosphorylated FANCM. Following this, FANCM binds the replisome complex, with associated release of the GINS proteins. The results indicated that, there was a FANCM/FANCD2-dependent absence of GINS proteins from replisomes. Thus there might be a synergy between the FANC family and GINS. In colorectal cancer cells treated with ETC-1922159, FANC family members and GINS1, were found to be down regulated and their regulation was recorded independently. I was able to rank 2nd order combination of these FANC members along with GINS1.
Table 9 shows rankings of these combinations. Followed by this is the unexplored combinatorial hypotheses in Table 10 generated from analysis of the ranks in Table 9. The Table 9 shows rankings of FANC members w.r.t GINS1. FANCB - GINS1 shows low ranking of 37 (laplace) and 46 (linear). FANCM - GINS1 shows low ranking of 775 (laplace) and 420 (linear). FANCG - GINS1 shows low ranking of 1024 (laplace) and 927 (linear). FANCD2 - GINS1 shows low ranking of 1458 (laplace), 972 (linear) and 794 (rbf). These rankings point to the synergy existing between the two components, which have been down regulated after the drug treatment.
Further, FANCI and FANCF showed high ranking with GINS1, thus indicating that they might not be working synergistically with GINS1, before the drug treatment.
One can also interpret the results of the Table 9 graphically, with the following influences - • FANC members w.r.t GINS1 with GINS1 FANC-B/M/G/D2.
2.1.6. GINS1 - FOX
In diffuse large B-cell lymphoma (DLBCL), Chen et al. [23] found that GINS1 was upregulated and FOXP1 transcriptionally activated GINS1 expression. The FOXP1/GINS1 regulatory axis was validated in vivo xenograft lymphoma mouse model. Thus there might be a synergy between the FOX family and GINS. In colorectal cancer cells treated with ETC-1922159, FOX family members and GINS1, were found to be down regulated and their regulation was recorded independently. I was able to rank 2nd order combination of these FOX members along with GINS1.
Table 11 shows rankings of these combinations. Followed by this is the unexplored combinatorial hypotheses in Table 12 generated from analysis of the ranks in Table 11. The Table 11 shows rankings of FOX members w.r.t GINS1. FOXM1 - GINS1 shows low ranking of 21 (laplace) and 23 (linear) FOXJ1 - GINS1 shows low ranking of 454 (laplace) and 343 (linear). FOXD2-AS1 - GINS1 shows low ranking of 1437 (linear) and 313 (rbf). These rankings point to the synergy existing between the two components, which have been down regulated after the drug treatment.
Further, FOXA2 showed high ranking with GINS1, thus indicating that they might not be working synergistically with GINS1, before the drug treatment.
One can also interpret the results of the Table 11 graphically, with the following influences - • FOX members w.r.t GINS1 with GINS1 FOX-M1/J1/D2-AS1.
2.1.7. GINS1 - NOTCH
In lung adenocarcinoma, Yishan et al. [24] found that the expression of GINS1 was up-regulated. They showed that knockdown of GINS1 inhibited proliferation, migration and invasion of the A549 cells, while overexpression of GINS1 enhanced the proliferation, migration and invasion of H1299 cells. Further, knockdown of GINS1 decreased the expression levels of NOTCH1 and NOTCH3, while overexpression of GINS1 increased the levels of NOTCH1 and NOTCH3. Thus there might be a synergy between the NOTCH family and GINS. In colorectal cancer cells treated with ETC-1922159, NOTCH family members and GINS1, were found to be down regulated and their regulation was recorded independently. I was able to rank 2nd order combination of these NOTCH members along with GINS1.
Table 13 shows rankings of these combinations. Followed by this is the unexplored combinatorial hypotheses in Table 14 generated from analysis of the ranks in Table 13. The Table 13 shows rankings of NOTCH members w.r.t GINS1. NOTCH4 - GINS1 shows low ranking of 418 (laplace), 230 (linear) and 572 (rbf). NOTCH1 - GINS1 shows low ranking of 661 (linear) and 976 (rbf). These rankings point to the synergy existing between the two components, which have been down regulated after the drug treatment.
One can also interpret the results of the Table 13 graphically, with the following influences - • NOTCH members w.r.t GINS1 with GINS1 NOTCH-4/1.
3. Conclusion
Presented here are a range of multiple synergistic GINS1 2nd order combinations that were ranked via a machine learning based search engine. Via majority voting across the ranking methods, it was possible to find plausible unexplored synergistic combinations of GINS1-X that might be prevalent in CRC cells after treatment with ETC-1922159 drug.
Conflict of Interest
There are no conflicts to declare.
Author’s Contributions
Concept, design, in silico implementation - SS. Analysis and interpretation of results - SS. Manuscript writing - SS. Manuscript revision - SS. Approval of manuscript - SS
Acknowledgements
Special thanks to Mrs. Rita Sinha and Mr. Prabhat Sinha for supporting the author financially, without which this work could not have been made possible.
Source of Data
Data used in this research work was released in a publication in Madan et al. [25].
References
- Leman, A.R.; Noguchi, E. The replication fork: understanding the eukaryotic replication machinery and the challenges to genome duplication. Genes 2013, 4, 1–32. [Google Scholar] [CrossRef] [PubMed]
- Li, H.; O’Donnell, M.E. The eukaryotic CMG helicase at the replication fork: emerging architecture reveals an unexpected mechanism. Bioessays 2018, 40, 1700208. [Google Scholar] [CrossRef] [PubMed]
- Parker, M.W.; Botchan, M.R.; Berger, J.M. Mechanisms and regulation of DNA replication initiation in eukaryotes. Critical reviews in biochemistry and molecular biology 2017, 52, 107–144. [Google Scholar] [CrossRef] [PubMed]
- MacNeill, S.A. Structure and function of the GINS complex, a key component of the eukaryotic replisome. Biochemical Journal 2010, 425, 489–500. [Google Scholar] [CrossRef]
- MacNeill, S. The eukaryotic replisome: a guide to protein structure and function; Vol. 62, Springer Science & Business Media, 2012.
- Xiang, S.; Reed, D.R.; Alexandrow, M.G. The CMG helicase and cancer: a tumor “engine” and weakness with missing mutations. Oncogene 2023, 42, 473–490. [Google Scholar] [CrossRef]
- Seo, Y.S.; Kang, Y.H. The human replicative helicase, the CMG complex, as a target for anti-cancer therapy. Frontiers in molecular biosciences 2018, 5, 26. [Google Scholar] [CrossRef]
- Nakahara, I.; Miyamoto, M.; Shibata, T.; Akashi-Tanaka, S.; Kinoshita, T.; Mogushi, K.; Oda, K.; Ueno, M.; Takakura, N.; Mizushima, H.; et al. Up-regulation of PSF1 promotes the growth of breast cancer cells. Genes to Cells 2010, 15, 1015–1024. [Google Scholar] [CrossRef]
- Zhou, L.; Sun, X.j.; Liu, C.; Wu, Q.f.; Tai, M.h.; Wei, J.c.; Lei, L.; Meng, F.d.; Qu, K.; Xu, J. Overexpression of PSF1 is correlated with poor prognosis in hepatocellular carcinoma patients. The International Journal of Biological Markers 2015, 30, 56–64. [Google Scholar] [CrossRef]
- Böhly, N.; Schmidt, A.K.; Zhang, X.; Slusarenko, B.O.; Hennecke, M.; Kschischo, M.; Bastians, H. Increased replication origin firing links replication stress to whole chromosomal instability in human cancer. Cell Reports 2022, 41. [Google Scholar] [CrossRef]
- Liang, J.; Yao, N.; Deng, B.; Li, J.; Jiang, Y.; Liu, T.; Hu, Y.; Cao, M.; Hong, J. GINS1 promotes ZEB1-mediated epithelial-mesenchymal transition and tumor metastasis via β-catenin signaling in hepatocellular carcinoma. Journal of Cellular Physiology 2024, 239, e31237. [Google Scholar] [CrossRef]
- Fu, Q.; Zheng, H.; Wang, X.; Tang, F.; Yu, H.; Wang, H.; Wan, Z.; Zheng, Z.; Yang, Z.; Liu, T.; et al. GINS1 Promotes the Initiation and Progression of Bladder Cancer by Activating the AKT/mTOR/c-Myc Signaling Pathway. Experimental Cell Research 2024, p. 114125.
- Sinha, S. Machine learning ranking of plausible (un) explored synergistic gene combinations using sensitivity indices of time series measurements of Wnt signaling pathway. Integrative Biology 2024, 16, zyae020. [Google Scholar] [CrossRef] [PubMed]
- Sinha, S. Sensitivity analysis based ranking reveals unknown biological hypotheses for down regulated genes in time buffer during administration of PORCN-WNT inhibitor ETC-1922159 in CRC. bioRxiv 2017, p. 180927.
- Joachims, T. Training linear SVMs in linear time. In Proceedings of the Proceedings of the 12th ACM SIGKDD international conference on Knowledge discovery and data mining. ACM, 2006, pp. 217–226.
- Coulombe, P.; Nassar, J.; Peiffer, I.; Stanojcic, S.; Sterkers, Y.; Delamarre, A.; Bocquet, S.; Méchali, M. The ORC ubiquitin ligase OBI1 promotes DNA replication origin firing. Nature communications 2019, 10, 2426. [Google Scholar] [CrossRef] [PubMed]
- Brosh Jr, R.M.; Trakselis, M.A. Fine-tuning of the replisome: Mcm10 regulates fork progression and regression. Cell cycle 2019, 18, 1047–1055. [Google Scholar] [CrossRef] [PubMed]
- Bell, S.P.; Labib, K. Chromosome duplication in Saccharomyces cerevisiae. Genetics 2016, 203, 1027–1067. [Google Scholar] [CrossRef]
- Denkiewicz-Kruk, M.; Jedrychowska, M.; Endo, S.; Araki, H.; Jonczyk, P.; Dmowski, M.; Fijalkowska, I.J. Recombination and pol ζ rescue defective dna replication upon impaired cmg helicase—pol ε interaction. International Journal of Molecular Sciences 2020, 21, 9484. [Google Scholar] [CrossRef]
- Yang, H.; Liu, X.; Zhu, X.; Zhang, M.; Wang, Y.; Ma, M.; Lv, K. GINS1 promotes the proliferation and migration of glioma cells through USP15-mediated deubiquitination of TOP2A. Iscience 2022, 25. [Google Scholar] [CrossRef]
- Day, M.; Tetik, B.; Parlak, M.; Almeida-Hernández, Y.; Räschle, M.; Kaschani, F.; Siegert, H.; Marko, A.; Sanchez-Garcia, E.; Kaiser, M.; et al. TopBP1 utilises a bipartite GINS binding mode to support genome replication. Nature Communications 2024, 15, 1797. [Google Scholar] [CrossRef]
- Huang, J.; Zhang, J.; Bellani, M.A.; Pokharel, D.; Gichimu, J.; James, R.C.; Gali, H.; Ling, C.; Yan, Z.; Xu, D.; et al. Remodeling of interstrand crosslink proximal replisomes is dependent on ATR, FANCM, and FANCD2. Cell reports 2019, 27, 1794–1808. [Google Scholar] [CrossRef]
- Chen, Z.; Wang, T.; Li, C.; Zhang, W.; Huang, W.; Xue, J.; Wang, J.; Li, S. FOXP1-GINS1 axis promotes DLBCL proliferation and directs doxorubicin resistance. Journal of Cancer 2023, 14, 2289. [Google Scholar] [CrossRef]
- Yishan, H.; Xiaohui, X.; Xiumin, M.; Yangchun, F. GINS1 Enhances Glycolysis, Proliferation and Metastasis in Lung Adenocarcinoma Cells by Activating the Notch/PI3K/AKT/mTORC1 Signaling Pathway. Zhongguo Fei Ai Za Zhi 2024, 27. [Google Scholar]
- Madan, B.; Ke, Z.; Harmston, N.; Ho, S.Y.; Frois, A.; Alam, J.; Jeyaraj, D.A.; Pendharkar, V.; Ghosh, K.; Virshup, I.H.; et al. Wnt addiction of genetically defined cancers reversed by PORCN inhibition. Oncogene 2016, 35, 2197. [Google Scholar] [CrossRef]

Table 1.
2nd order interaction ranking between GINS1 VS ORC members.
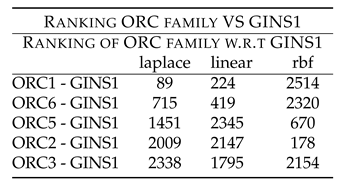 |
Table 2.
2nd order combinatorial hypotheses between GINS1 and ORC members.
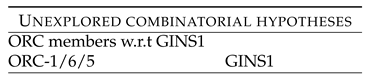 |
Table 3.
2nd order interaction ranking between GINS1 VS MCM members.
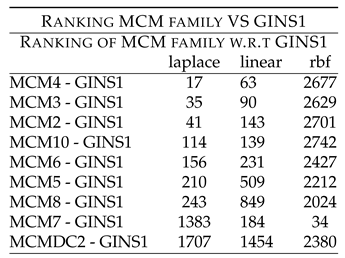 |
Table 4.
2nd order combinatorial hypotheses between GINS1 and MCM members.
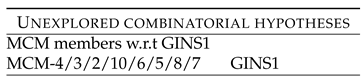 |
Table 5.
2nd order interaction ranking between GINS1 VS POL members.
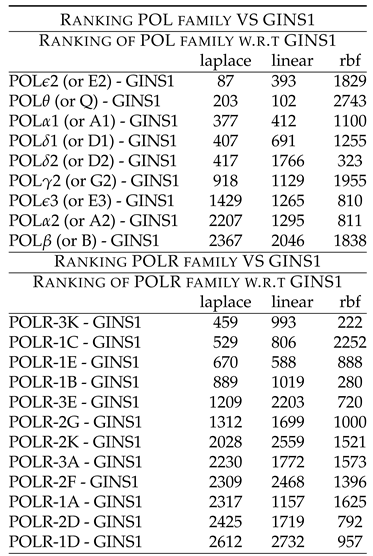 |
Table 6.
2nd order combinatorial hypotheses between GINS1 and POL members.
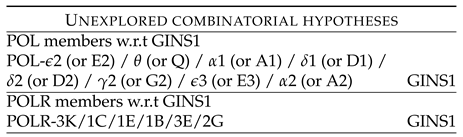 |
Table 7.
2nd order interaction ranking between GINS1 VS TOP members.
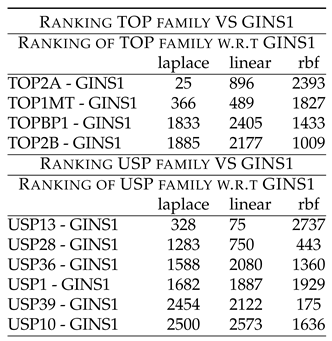 |
Table 8.
2nd order combinatorial hypotheses between GINS1 and TOP members.
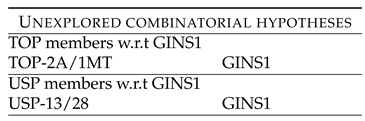 |
Table 9.
2nd order interaction ranking between GINS1 VS FANC members.
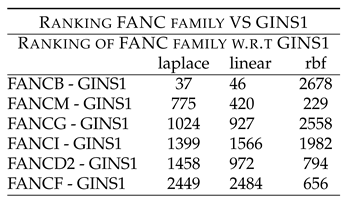 |
Table 10.
2nd order combinatorial hypotheses between GINS1 and FANC members.
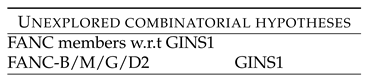 |
Table 11.
2nd order interaction ranking between GINS1 VS FOX members.
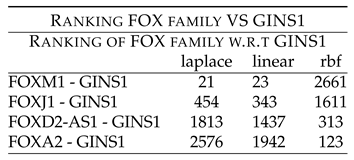 |
Table 12.
2nd order combinatorial hypotheses between GINS1 and FOX members.
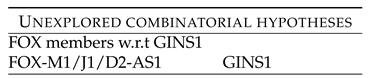 |
Table 13.
2nd order interaction ranking between GINS1 VS NOTCH members.
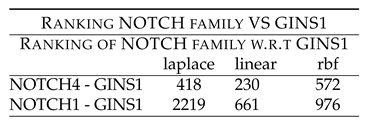 |
Table 14.
2nd order combinatorial hypotheses between GINS1 and NOTCH members.
 |
Disclaimer/Publisher’s Note: The statements, opinions and data contained in all publications are solely those of the individual author(s) and contributor(s) and not of MDPI and/or the editor(s). MDPI and/or the editor(s) disclaim responsibility for any injury to people or property resulting from any ideas, methods, instructions or products referred to in the content. |
© 2025 by the authors. Licensee MDPI, Basel, Switzerland. This article is an open access article distributed under the terms and conditions of the Creative Commons Attribution (CC BY) license (http://creativecommons.org/licenses/by/4.0/).
Copyright: This open access article is published under a Creative Commons CC BY 4.0 license, which permit the free download, distribution, and reuse, provided that the author and preprint are cited in any reuse.


