Submitted:
10 January 2025
Posted:
10 January 2025
You are already at the latest version
Abstract
The wing venation of 30 Pannonian species of the dipteran family Drosophilidae was analysed comparatively. 23 vein branching, origin and edge points were selected and used to determine 54 distances per wing. A scaling to the total wing length was carried out, and then the data of 130 wings, whose assignment to species and sex was known, were compared multivariate using principal component analysis. The relationship between species similarity in wing proportions and phylogenetic position was analysed for different Drosophilidae evolutionary hypotheses. Furthermore, we analysed how the wing proportions shift along the first two principal axes (PC1 and PC2).All species of the subfamily Steganinae show positive PC1 values, which means that within this family the proximal wing area is relatively extended compared to the rest of the wing. This is probably the original condition in the family. In the Drosophilinae genera Drosophila (ad partem), Hirtodrosophila, Scaptomyza and Chymomyza the PC1 values are negative and accordingly the wing base is relatively small. The genus Drosophila is divided into three clusters, the first consists of representatives of the melanogaster species group (subgenus Sophophora), but also includes Scaptodrosophila species. The second contains mainly species of the obscura species group (also Sophophora), but also D. suzukii, which belongs to the melanogaster species group, and D. busckii from the Dorsilopha subgenus. The two clusters most closely resemble the genus Chymomyza, while the third is similar to Scaptomyza. This third cluster contains species of the subgenus Drosophila and the genus Hirtodrosophila. Within the cluster, D. testacea and the quinaria species group are more similar to each other, D. hydei as a representative of the repleta species group lies somewhat apart. In many respects there is more agreement with the phylogenetic hypotheses of Throgmorton 1975 than with the current taxonomy of the Drosophilidae.In the genera Gitona, Chymomyza and the subgenus Sophophora, the distal wing segment is enlarged at the expense of the medial one (PC2).
Keywords:
pterometrics
; biometrics
; morphometrics
; wing proportions
; phylogeny
; Drosophilidae
; Amiota
; Cacomyza
; Chymomyza
; Drosophila
; Gitona
; Hirtodrosophila
; Leucophenga
; Phortica
; Scaptomyza
; Scaptodrosophila
Introduction
The ability to actively fly has evolved independently four times in the animal kingdom, once within the arthropods in the winged insects (Pterygota) and three times within the amniotes: in the pterosaurs (Pterosauria), the birds (Aves) and the bats and flying foxes (Chiroptera). Only one of these taxa is extinct so far.
The oldest known winged insect is Delitzschala bitterfeldensis (Brauckmann & Schneider 1996), a species that existed around 317 million years ago in the Carboniferous, almost 100 million years before the first vertebrate (a pterosaur) conquered the air in the Triassic (gliders, however, already existed in the Permian). The fact that the ability to fly developed in insects just a few million years before Delitzschala is supported by the fact that the veining of the left and right wings of an individual could still differ to the extent that it corresponds to the genus level today, i.e., it was not yet genetically stabilised to the later extent (Brauckmann et al. 2003 on Homoioptera vorhallensis: ‘In the previously used taxonomy, with such wide variability, the isolated wings of the same individual would have been assigned to different genera, those of all four specimens probably even to different families.’ [Translation from German by the authors]. However, there are also very divergent views on this, see e.g., Kukalová-Peck 2022 and Grimaldi & Engel 2005 in connection with Devonian arthropods [or in the case of Rhyniella perhaps also small Onychophora] with dicondylar mandibles, whose assignment to the insects is, in the opinion of the authors, very doubtful).
Despite all functional constraints, the wing base and venation are very diverse, but on the other hand also evolutionarily very stable, and are therefore used in taxonomy as well as in phylogenetic studies (Kukalová-Peck 2022). In some of the pterygotes, the Neoptera, evolution led to the ability to lay the wings over the body in a roof-like position (Diaphanopterodea are generally classified as Paleoptera, although they also possessed this ability [Kukalová-Peck & Brauckmann 2011]. If they were Neopterans after all, their mouthparts would have formed a rostrum independently of the Rostropaleoptera, i.e., convergently). Associated with this was the tendency to shape the fore and hind wings differently. This occurred to an extreme extent, for example, in the Coleoptera, in which the forewings were remodelled into elytra with a protective function, and in the Diptera, which likely evolved at the beginning of the Mesozoic, in which the hindwings were reduced to halteres, which – at least in Drosophila – oscillate in phase with the forewings during flight but offset by half a period (Melis et al. 2024) and support Johnston’s sensory organ of the antennae as a gravitational sensor according to the functional principle of the gyroscope (Hengstenberg 1998, Boekhoff-Falk 2005, Kamikouchi 2009).
Compared to the scorpionflies-like ancestors (the Diptera belong together with the Mecoptera to the Antliophora [Grimaldi & Engel 2005]), the venation of the forewings is often simplified and is also a family-typical feature in the Drosophilidae. Diagnostic characteristics of the latter include an incomplete subcosta and two breaks in the costa. A few cells (vein-enclosed wing areas) are formed, a costal cell, a discoid cell and a cubital cell. In some genera, a basal cell is separated from the discoidal cell by a transverse vein (Bächli & Burla 1985). As the venation is characteristic for the various dipteran families, the vein pattern within this taxon undoubtedly also has phylogenetic significance.
The question we want to investigate here is whether the wing proportions also have phylogenetic information. For this study, we use the species that were caught during other analyses (Tiefenbrunner et al. 2017, 2021, 2024) in the area of the slopes of the Leithagebirge and the Pannonian Plain (Burgenland, Austria). The prevailing Drosophilidae taxonomy, as far as these species are concerned, are summarised in the following table (according to Bächli & Burla 1985, Markow & O’Grady 2006, Yassin 2013, O’Grady & DeSalle 2018, and TaxoDros [https://www.taxodros.uzh.ch/; 02.12.2024]). The genus classification according to Bächli & Burla 1985 in Table 1 is enclosed in brackets where there are differences.
In 1975, Throgmorton created a phylogenetic tree of the Drosophilidae that is still worthy of discussion (presented in simplified form in Figure 1) and here provides the basis for answering the question of how the wing proportions have changed in the course of phylogeny.
The species of the genera Scaptodrosophila and Hirtodrosophila studied here are classified in Bächli & Burla 1985 as belonging to the genus Drosophila and Phortica variegata to the genus Amiota, an approach that we will follow in this paper (see also Figure 1).
O’Grady & DeSalle 2018 have analysed various hypotheses on the phylogeny of the genus Drosophila, which in any case is predominantly assumed to be paraphyletic in the version of Table 1. Throckmorton 1975 (Figure 1) assumes a ‘virilis-repleta radiation’, to which of the Pannonian species only D. hydei belongs and a ‘immigrans-Hirtodrosophila radiation’, to which the other species of the subgenus Drosophila (‘immigrans-tripunctata’ radiation), but also of the subgenus Dorsilopha, as well as the genera Scaptomyza and Hirtodrosophila (‘Hirtodrosophila’ radiation) belong.
The ‘Sophophora radiation’, to which the Drosophila subgenus Sophophora also belongs, as well as the genus Chymomyza, is believed to be more basal than the branch just discussed (the ‘Drosophila radiation’). Even before this, Scaptodrosophila is supposed to have split off in a radiation named after this genus and even earlier Amiota, Phortica, Leucophenga and Gitona (‘Steganinae radiation’). According to Yassin 2013, Cacoxenus also belongs to the ‘Steganinae radiation’. There is disagreement between Yassin 2013 and Throgmorton 1975 about the relationship of the genera within this radiation (or the subfamily Steganinae, respectively). Throgmorton’s view is shown here. Note that Figure 1 is a phylogenetic tree and not a cladogram; it is therefore not assumed that complete knowledge of the phylogeny would result in dichotomous branching.
As a model organism whose genetics are very well known, many morphological, ontogenetic (Alba 2021) and ecological aspects of D. melanogaster and related species have been investigated, which also concern the wings. These include, for example, the formation of pigmentation patterns (Gompel 2005, Prud’homme 2006, Werner 2010), sexual dimorphism (Gidaszewski 2009), changes in wing size and shape as an adaptation to the environment over the course of the season (Önder 2022), or as a function of developmental temperature (Torquato et al. 2014), or as a result of altitude or latitude (Pesevski & Dworkin 2021). With so many influencing variables, the phylogenetic signal in the wing proportions may become unrecognisable. Whether this is the case will be investigated here using morphometric methods.
Methods
The wings of the Drosophilidae are particularly well suited for biometric studies, as they are essentially bidimensional, the basic vein pattern is stable (where the transverse vein between basal and discoid cell is missing, its former position can nevertheless be recognised) and each cell of the wing epithelium forms exactly one trichome, so that the number of cells in an area can also be easily determined (Dobzhansky 1929), if this is the research objective. Proportional shifts can also be recognised relatively clearly when comparing species.
The wings were separated from the body under a binocular (Stemi 2000-C; Zeiss, Oberkochen, Germany), transferred to a microscope slide and embedded in a preservation fluid (Marc Andre II). The photographs were also taken using a binocular at different magnifications and the Axiocam 305 colour (D) microscopy camera with the corresponding Carl Zeiss Imaging System software.
- Software for recording wing venation; data collection
The wings of individuals collected over the course of several years in vineyards in the Pannonian region and on the edge of forests in the Leithagebirge were used. The total of 130 wings measured can be assigned to 30 Drosophilidae species (the number of genera depends on the taxonomy used; according to Table 1 there are ten). Both left and right wings of both sexes were used. In order to record the specific wing venation, vein branching points were selected, which can be found in all species, as well as prominent points of the wing base, the breaks of the costa and the base of the alula. This results in a total of 23 landmarks, most of which are located in the proximal wing section (Figure 2B). Simple software was developed using the IDE Delphi 7 Aurora (Borland, Austin, Texas, United States) to record these. On the image of the wing, the selected points are ‘clicked’ in the correct order (1 is followed by 2, etc.) and their coordinates are automatically saved (Figure 2B). In the further course of the analysis, however, the landmarks themselves were not used, as is usual in geometric morphometry.
The aim of biometrics is to determine the similarity of shapes. The coordinates themselves appear to be of little value for this purpose, as the wings may be rotated in relation to each other and may not have the same scale. Operations that in principle do not change the shape are translation, rotation and rescaling. Zelditch et al. showed in 2004 that landmarks can be used directly for shape recognition in biometrics. Traditionally, however, distances between points are used for this purpose, an approach that we follow here because this ‘automatically’ eliminates the influence of translation and rotation. The software calculates those 54 distances between the coordinates that are shown in Figure 2C. This results in a more or less dense triangular pattern, which does not, however, fill the entire wing area.
All distances were saved as a percentage of the wing length (distance between points 11 and 20 corresponds to 100%; see Figure 2B), which also avoided scaling problems and ensured better comparability. However, the wing length is also a valuable characteristic in its own right and was therefore taken into account in the analysis.
- Multivariate analysis; evaluation of the data
The 54 distances between the branching or edge points, together with the wing length (as the 55th characteristic; resulting in a total of 7150 individual data), allow multivariate comparison. A principal component analysis (PCA) was carried out to visualise the wing similarity using the ViDaX software (LMS-Data, Munich-Trofaiach), which makes it possible to use fewer objects (wings) than there are features (distances and length), as it operates with a neural network in which the number of features and the number of dimensions are not coupled. It is therefore possible to represent not only the 130 wings but also the 30 species, with the latter being represented by the mean value of all wings originating from that species.
However, to analyse which wing characters are relevant for the separation along the principal components (PC1 corresponds to the x-axis or abscissa in the following figure, PC2 to the y-axis or ordinate), the PCA option of Statgraphics™ Centurion XV (Statpoint Inc., Herndon, Virginia, U.S.A.) was used, which is more suitable in this respect.
Results and Discussion
Pterometrics and Phylogenetic Hypotheses
In order to be able to compare the diversity of wing proportions, a principal component analysis (PCA) was carried out for the 130 wings and a PCA for the 30 species, and the first two principal components (PCs) were presented graphically (Appendix 1 and Figure 2). The basis for the analysis are the 54 distances calculated from the survey data, which mainly connect vein branches or one such branch with a vein edge position, as well as the wing length as an additional feature.
For the PCA of the 130 wings (Appendix 1), it is possible to specify the explanatory value of the principal components, i.e., the proportion of the observed variance that is explained by the respective principal component. For PC1 this is 33.3%, for PC2 17.21%, cumulatively for both 50.5%. All other principal components each explain less than 9% of the variance. Based on the two figures, a clustering of the species was carried out, whereby, in order to avoid bias, this was done by the author who was not yet informed about the phylogenetic theories of the family Drososphilidae at that time.
The pterometric analysis divides the genus Drosophila into three clusters, Ia, Ib and II (Figure 3). Ia consists of the species D. melanogaster and D. simulans, which belong to the subgenus Sophophora, as well as D. (Scaptodrosophila) rufifrons and D. (Sd.) deflexa, whereby the distance of D. deflexa in Figure 2 to the second cluster (Ib) appears to be as large as that to Ia. However, it should be noted that the two principal components shown are not equivalent. In addition, it can be seen in Appendix 1 that two of the wings, namely those of the female of this species, show a much greater similarity to group Ia, so that the assignment to Ia seems justified. But there is no doubt that D. deflexa is somewhat separated within Ia.
Ib contains all species of the subgenus Sophophora not yet listed, namely D. obscura, D. subobscura, D. tristis and D. suzukii, whereby the latter is assigned to a different species group of Sophophora, namely ‘melanogaster’, in Table 1 than the other species of Ib (species group ‘obscura’) and could therefore have been expected to cluster with Ia. It is interesting to recognise that D. busckii also belongs to Ib, which according to Table 1 is a species of the subgenus Dorsilopha. In Appendix 1, the symbols representing the wings of a species are connected by lines. It can be seen that there is no overlap between Ia and Ib, which justifies the separation of the two groups.
Comparing this result with Throckmorton 1975 and Yassin 2013 (Figure 1), Ia and Ib contain, with one exception, only species of the early Scaptodrosophila and Sophophora radiations (excluding the Drosophila radiation). However, Chymomyza also belongs to the latter, which actually shows the greatest similarity in wing proportions to Ia and Ib, but is also clearly separated. Since the Sophophora radiation occurred early, this does not contradict the phylogeny of Throckmorton 1975. On the other hand, there is a clear lack of agreement with the phylogeny of Russo et al. 2013, who assume Chymomyza and Leucophenga to be closely related. According to Throckmorton, Dorsilopha, i.e., D. busckii (cluster Ib), belongs to the very late ‘Old World Hirtodrosophila Radiation’, which is not consistent with the wing similarity. Yassin and Russo et al. (both 2013) see a much earlier branching of Dorsilopha, namely immediately after that of the Sophophora radiation, which can only partially explain the similarity of the wings, as the assumed time of the split is relatively far back.
Cluster II of the genus Drosophila contains species of the subgenus Drosophila (D. funebris, D. histrio, D. immigrans, D. kuntzei, D. limbata, D. phalerata, D. testacea, D. transversa, D. hydei) on the one hand, and the genus Hirtodrosophila (D. (H.) cameraria and D. (H.) confusa) on the other. D. kuntzei, D. limbata, D. phalerata, and D. transversa are assigned to the quinaria species group (which in turn is part of the immigrans-tripunctata radiation), which is close to D. testacea as far as the similarity of the wings is concerned according to Figure 3. D. hydei belongs to the virilis-repleta radiation or repleta species group. There is no agreement as to whether D. funebris also belongs to the virilis-repleta group or to the immigrans-tripunctata radiation (which is part of the immigrans-Hirtodrosophila radiation). D. funebris is the type species of Drosophila and thus receives a lot of attention, but the ‘funebris species group’ (Table 1) seems to have developed quite independently. Figure 3 shows that its wings have less similarity to the virilis-repleta radiation and the quinaria species group within the immigrans-Hirtodrosophila radiation than to its remaining representatives D. immigrans and D. histrio.
Figure 3.
Principal component analysis of the 30 species analysed based on wing venation (54 distances between vein branches and vein edge positions) and length. PC1: x-axis; PC2: y-axis. Assignment of species to genera according to Bächli & Burla 1985 (Am.: Amiota, Ca: Cacomyza, Ch.: Chymomyza, Dr.: Drosophila, Gi.: Gitona, Le.: Leucophenga, Sc. Scaptomyza). See Table 1 & Table 2 for the abbreviation of the species names).
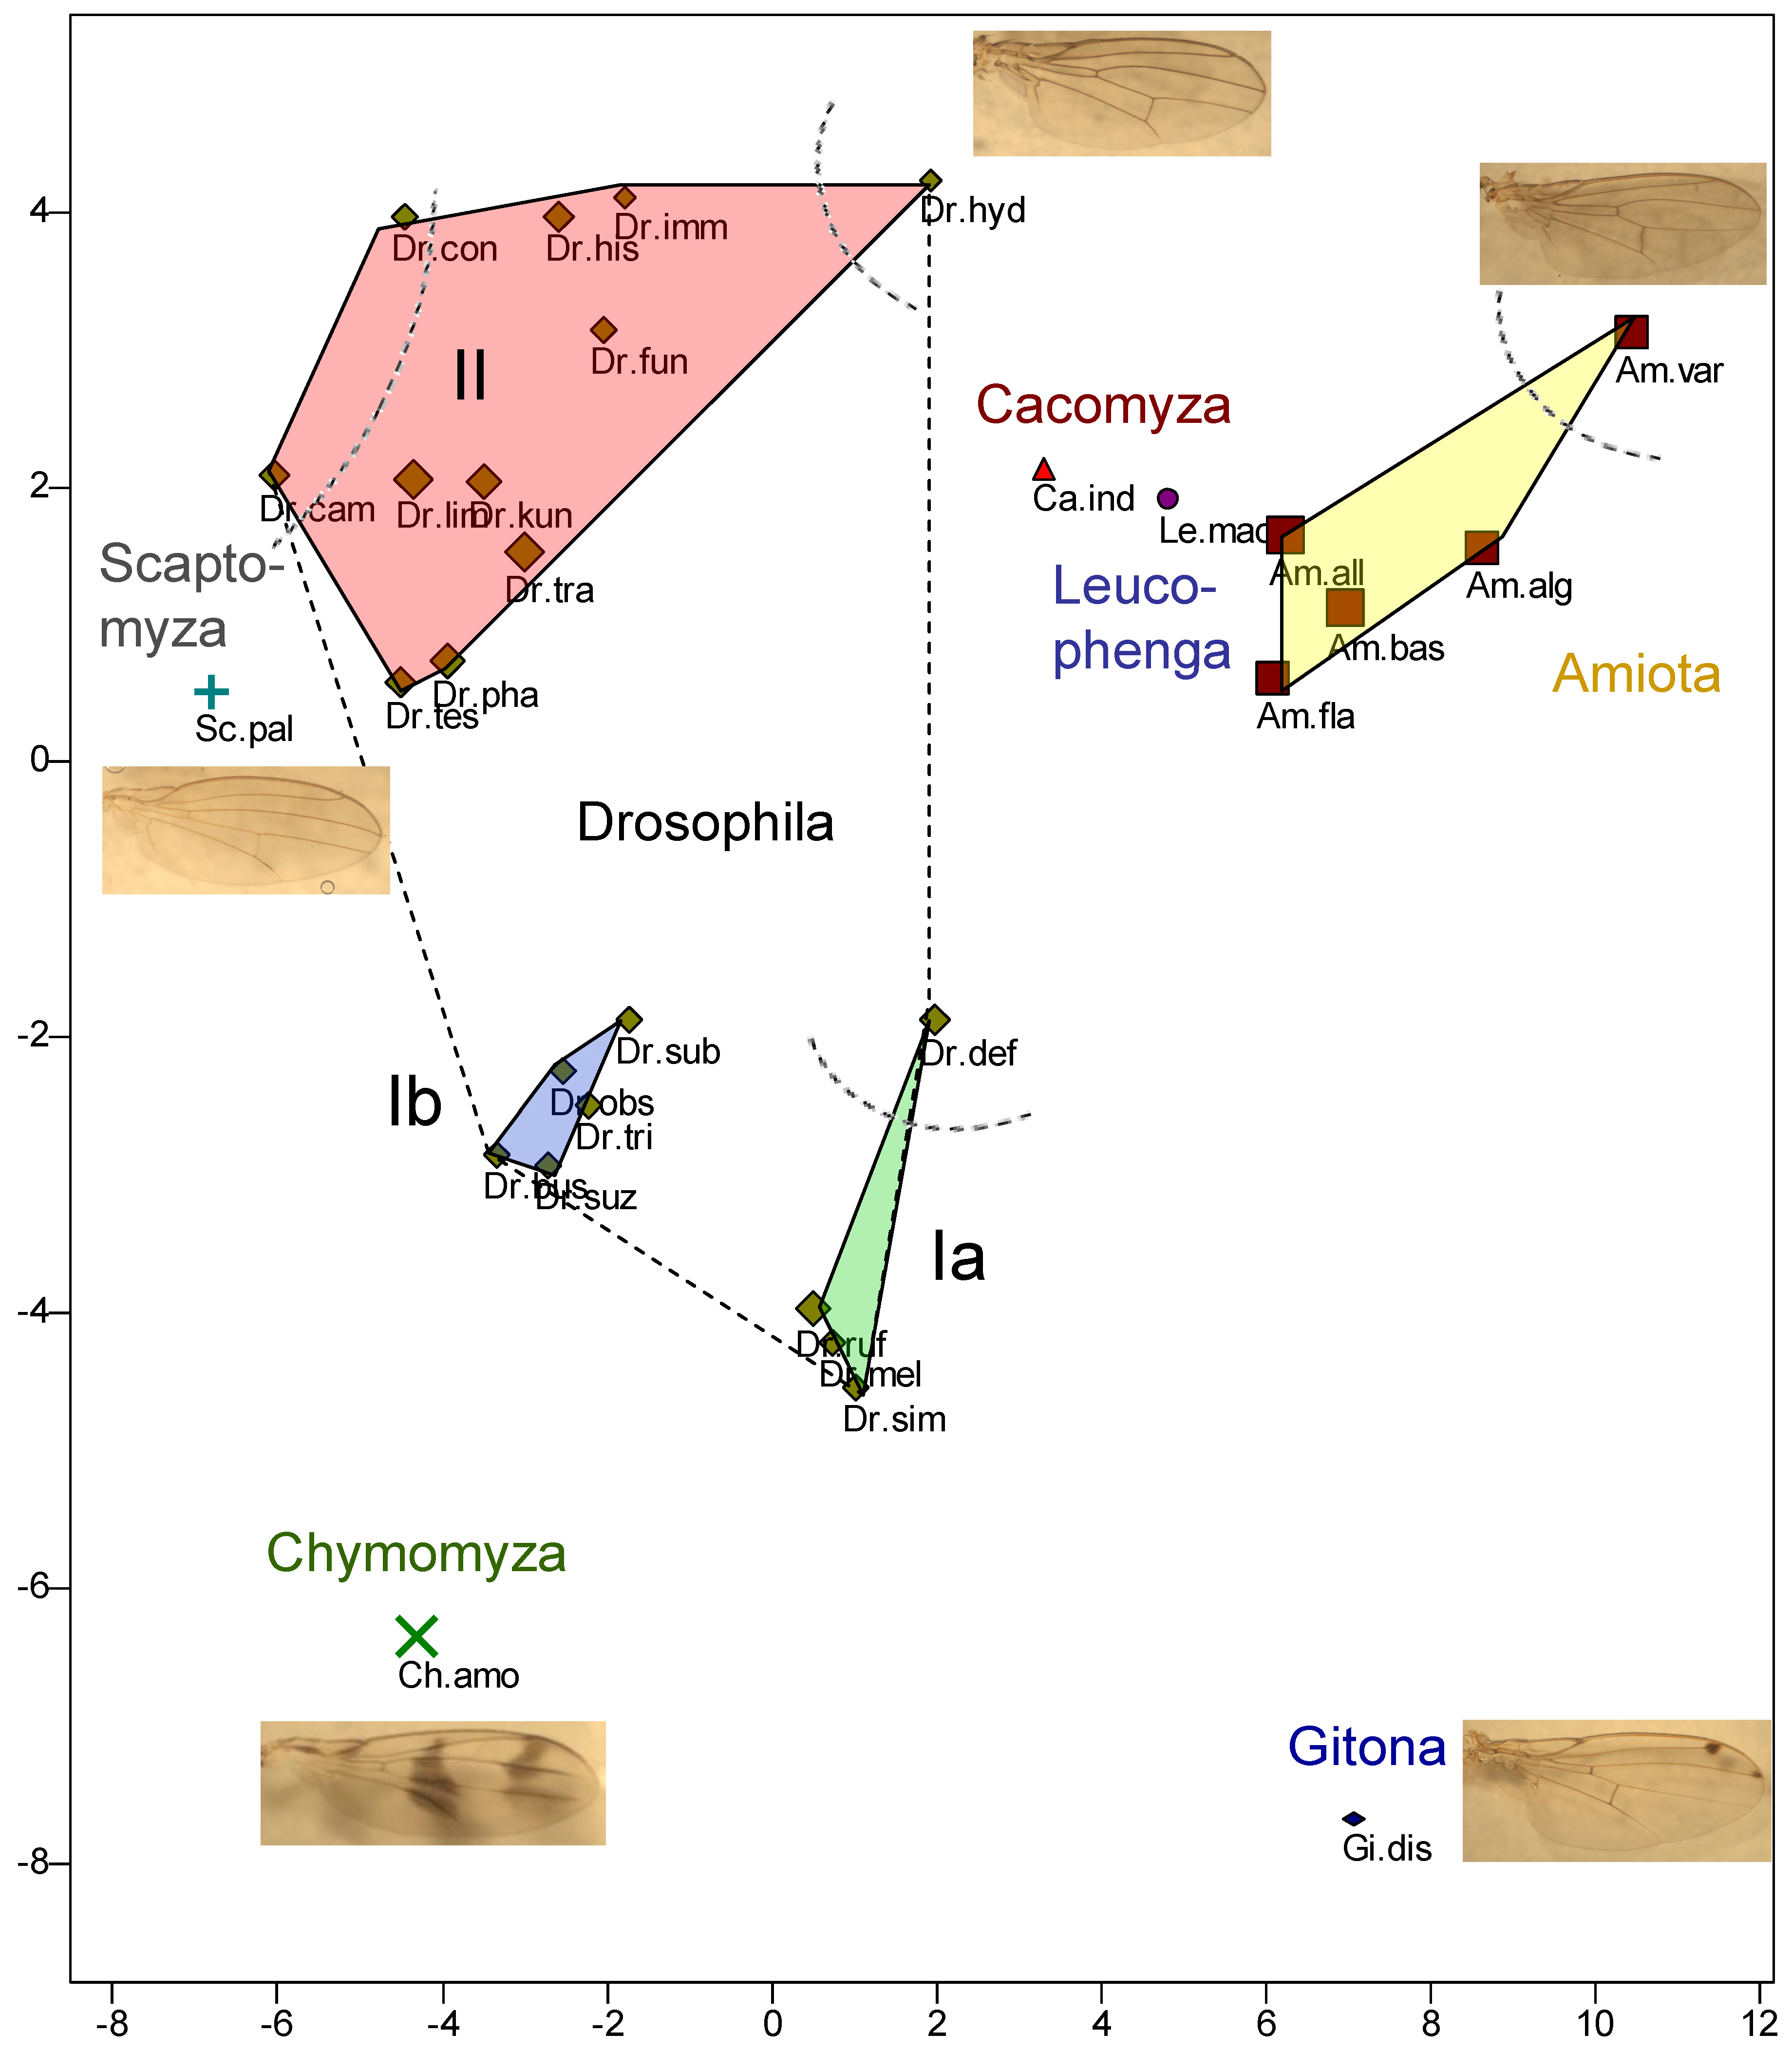
In cluster II, the areas surrounding the wing symbols of a species overlap much less than is the case with Ia or Ib (see Appendix 1). It could therefore be further subdivided. For example, the two Hirtodrosophila species on the left edge of the cluster (D. (H.) cameraria and D. (H.) confusa), which show little similarity to each other, and also D. hydei, on the right edge of cluster II, are not overlapping. The separation here is made by PC1. The overlap (see Appendix 1) of cluster II (especially of D. testacea) with Scaptomyza (S. pallida, a species in which the wings of males and females differ relatively strongly) is striking.
If we compare Cluster II with the phylogenetic assumptions of Throckmorton 1975 (Figure 1), we find that they reflect these quite well. A rather late ‘Drosophila radiation’ is assumed, which further splits into a ‘virilis-repleta radiation’ and an ‘immigrans-Hirtodrosophila radiation’, whereby the latter diverges even further and a ‘Hirtodrosophila radiation’ takes place. The latter includes Hirtodrosophila, Scaptomyza and Dorsilopha. The species S. pallida, D. (H.) cameraria and D. (H.) confusa lie on the left edge of cluster II or close to it (as already mentioned, however, D. busckii (Dorsilopha) is part of cluster Ib). All other species of the ‘immigrans-Hirtodrosophila radiation’ follow to the right in cluster II and D. hydei, the only species of the ‘virilis-repleta radiation’ represented here, which is said to have split off first as part of the ‘Drosophila radiation’, is found on the far right.
The genera not yet discussed all belong to the subfamily Steganinae and can be found to the right of the centre in Figure 3, i.e., they are separated from the Drosophilinae by PC1. PC2 splits the Steganinae into the genus Gitona (‘bottom’ in Figure 3) on the one hand and Amiota, Leucophenga and Cacomyza on the other. Within Amiota, A. (Phortica) variegata is clearly separated from the other species of the genus by PC1 and PC2. According to Yassin, Phortica is more closely related to Cacoxenus than to Amiota. However, this is not reflected in Figure 3, but rather the idea of Throckmorton 1975, who assumes a closer relationship between the two genera Amiota and Phortica. Amiota, Leucophenga and Cacomyza are only separated by PC1 and are close to each other.
In the phylogeny of Throckmorton 1975, the most ancestral radiation within the Drosophilidae is the one that separates Steganinae from the Drosophilinae, which fits well with Figure 3, PC1. Yassin 2013 sees a closer relationship between Amiota, Gitona and Cacoxenus compared to Leucophenga. However, the wing proportions do not show this because of the clearer separation of Gitona by the second principal component.
In the following, we will analyse which changes in the wing proportions have taken place in the course of evolution.
Proportional Shifts in the Drosophilidae Wing
- First principal component (PC1)
PCA is a linear method for dimension reduction. It is not possible to place the objects (the wings) in the original feature space, simply because this would have 55 dimensions in our case. We therefore try to explain the data variance as well as possible with as few orthogonal principal components or dimensions (axes) as possible. While the characters can correlate with each other, this does not apply to the PCs. In the present case, eleven dimensions would be almost as good as 55, but two to a maximum of three dimensions must suffice for a clear presentation, which means, however, that we only capture slightly more than 50% of the variance with the two-dimensional presentation (Appendix 1; strictly speaking, the presentation in Appendix 1 is three-dimensional, whereby the third dimension can be surmised from the size of the symbols. Chymomyza, for example, is in the foreground, whereas Gitona is far behind and both are therefore less similar than one might think at first glance. The first three PCs together explain about 60% of the variance).
In addition to the graphical result (Appendix 1), PCA provides a linear equation for each principal component: For each object, the position along the axis (PC) is the sum (across all features) of the products of the feature value and a constant assigned to the feature. The greater the absolute value of this constant, the more important the characteristic is for positioning along the PC. The sign indicates whether the characteristic shifts the object to higher or lower values of the principal component.
In Figure 4a, all features for PC1 whose constant reaches an absolute value greater than 0.1 are drawn as a line, yellow if the value is positive, blue if it is negative (the threshold value is chosen freely). Particularly important are the lines that frame the basal cell that lies between radius 4+5 and media, with values greater than 0.2, as well as the line that connects nodes 4 and 10 (Figure 2). In this illustration, the wing is divided into two areas, one proximal (basal) and one mediodistal. The border between the two runs from the distal end of the second costal segment to the distal area of the wing cell located between the radius 4+5 and the media and further to the distal end of the analis (Figure 4). With increasing PC1 values, the proportions shift, with the proximal area becoming longer and wider and the mediodistal area shorter. This is shown in Figure 4b & 4c by comparing two species that assume extremely different positions along PC1: A. (P.) variegata (PC1 ≈ 10) and S. pallida (PC1 ≈ -7). As Figure 3 and Appendix 1 show, the representatives of the subfamily Steganinae generally have positive PC1 values, i.e., a comparatively broad and long wing base at the expense of the peripheral wing area. The Ia Drosophila cluster and D. hydei are in the middle range near PC1 ≈ 0, while all other Drosophilinae have negative PC1 values, which are particularly negative for Scaptomyza, Hirtodrosophila and Chymomyza. The evolution of the family Drosophilidae therefore probably began with a pronounced wing base and then, in some groups, proceeded to varying degrees in the direction of a proportional reduction of this part of the wing.
- Second principal component (PC2)
If the same procedure is applied to PC2, two wing sections are obtained, too; the boundary between them is diagonal to the longitudinal axis of the wing. It runs from the edge of radius 2+3 to the distal border of the discoid cell (Figure 2) and further to the edge of the cubitus. This divides the wing into a medial and a distal section, as the wing base is hardly involved. The medial wing section ends towards the joint at the break from the second to the third costal segment, continues to the distal area of the basal cell and from there to the distal end of the analis (Figure 5a). The proximal wing area is very little involved in the wing variability described by PC2, only through a small basal area between the media and cubitus. The boundary between proximal and medial does not correspond exactly to that defined by PC1.
With increasing values of PC2, the medial wing section becomes longer, especially in the posterior region (the localisation refers to the spread wing). As a result, the distal section becomes smaller and narrower posteriorly, which also applies to a small quadrangle in the wing base (comparison of Figure 5b and 5c). This proportion shift is exemplified in D. hydei, with an extremely positive PC2 value (PC2 > 4) and in G. distigma (PC2 < -7), with a very low value. The proportion shift has apparently arisen several times independently and in parallel and, apart from Gitona, is also very large in Chymomyza, although these two genera are probably not closely related (and very different concerning PC3).
It is known from D. hydei that at least the pupa shows adaptations to strong wind conditions (Monier et al. 2024). A relatively small, distal wing section may be an advantage here. Within Drosophila, the subgenera Sophophora and Dorsilopha differ from the other species by lower PC2 values and therefore a reduced medial wing section compared to the distal one. This also applies to Scaptodrosophila.
The wing length has an influence on the position along PC2 as well. On average, it increases with larger values of the second principal component (exception: Gitona).
Wing Indices
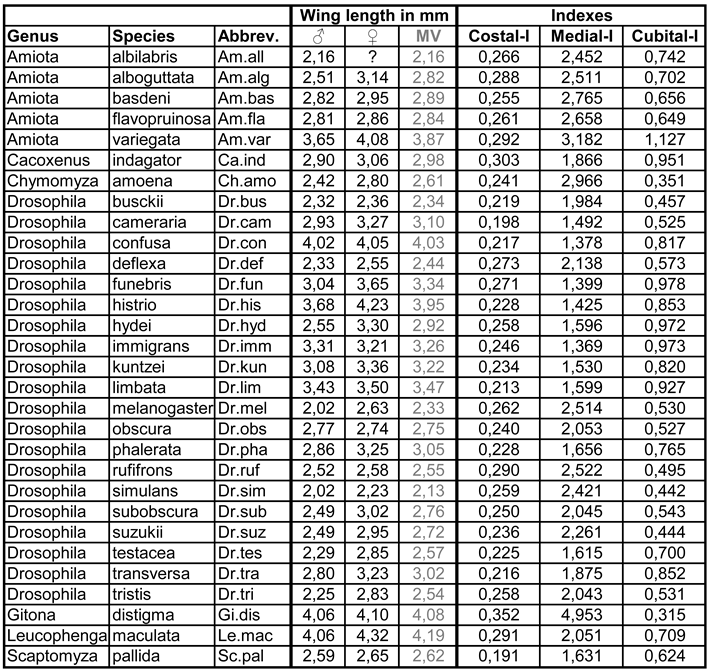
Bächli & Burla 1985 use length ratios between parts of wing veins, which they call indices, as an aid to species identification (Figure 6):
This very simple form of proportion analysis can be examined for its separation ability, as the necessary distances are measured anyway as part of the survey protocol. For this purpose, three XY plots were produced in which the position of all species was entered, with each of the two axes corresponding to a different index. There are three possible combinations: Costal versus reciprocal medial index (Figure 6b), costal versus cubital index (Figure 6c) and reciprocal medial versus cubital index (Figure 6d). The best separation (i.e., the one that is most consistent with Figure 2 and thus with the PCA) is provided by the combination of medial and cubital index (Figure 6d): Within Amiota (yellow field), A. (P.) variegata is very clearly separated from the other species of the genus, the Drosophila groups Ia (green), Ib (blue) and II (red) are clearly separated from each other, with D. hydei and the Hirtodrosophila species (D. (H.) cameraria, D. (H.) confusa) in group II lying on the edge and, in the case of D. (H.) cameraria, also close to S. pallida. Chymomyza is closest to Ia and Ib as in Figure 2.
Wing Length
The wing length is also important for the arrangement of the species along PC2 in Figure 3. For this reason, it is listed separately for the species by sex in Table 2 (the table also shows the wing indices) and sorted in ascending order according to the mean value in Appendix 2. Accordingly, D. simulans, D. melanogaster (only slightly over 2 mm) and D. busckii have the shortest wings, while A. (P.) variegata, D. histrio, D. (H.) confusa, G. distigma and L. maculata have the longest. In the last three species mentioned, the wings are almost twice as long as in D. simulans. Whether the wings of the females of D. melanogaster are actually significantly longer than those of D. simulans must first be analysed in a larger sample. The greatest difference between the sexes was found in D. hydei, but this too may be a coincidence, as the wing size also changes seasonally and the time of collection was not taken into account when selecting the wings.

Table 2.
Wing length in mm (MV = mean value) and wing indices. For a table sorted by wing length in ascending order, see Appendix 2.
Table 2.
Wing length in mm (MV = mean value) and wing indices. For a table sorted by wing length in ascending order, see Appendix 2.
 |
To summarise, the similarity of wing proportions among the species reflects surprisingly well most of the assumptions on the phylogeny of the Drosophilidae made by Throgmorton in 1975. All species of the subfamily Steganinae have positive PC1 values, which distinguishes them from the Drosophilinae, and apart from the genus Gitona, all Steganinae are similar in terms of wing proportions. The genus Drosophila breaks down into clusters corresponding to the assumed radiations and its species show similarities to species of other genera, such as Hirtodrosophila, Scaptomyza and Chymomyza, which match Throgmorton’s phylogenetic tree: Hirtodrosophila clusters with Scaptomyza and the immigrans-tripunctata radiation, while Chymomyza shows similarities to the obscura and melanogaster species groups of the Sophophora radiation. For D. busckii as part of the obscura cluster (Ib in Figure 3), however, the cladogram of Yassin 2013 is more consistent. Yassin also mentions homologisation difficulties with the genital armatures that are important for the reconstruction of the phylogeny, so that perhaps even the positioning of D. suzukii in Ib (Figure 3) could correspond to evolutionary reality.
In any case, the principal components of this pterometric analysis differ from the mostly nominal or ordinal morphological characters often used today to reconstruct phylogeny in that they are not correlated with each other, whereas this is very often the case with qualitative morphological characters to an unknown extent. It can be assumed that this coherence can certainly be a major source of error in the construction of cladograms. On the other hand, Figure 3 contains no indication of the time axis, i.e., the origin of the radiation, and thus metric wing characters alone are certainly not sufficient for a reconstruction of the phylogeny of the Drosophildae.
References
- Alba, V., Carthew, J. E., Carthew, R. W., Mani; M., Global constraints within the developmental program of the Drosophila wing, eLife 10:e66750, 1-24 (2021). [CrossRef]
- Bächli, G., Burla; H.: Drosophilidae. Insecta Helvetica, Fauna Band 7: Diptera, Schweizerische Entomologische Gesellschaft, Zürich 1985.
- Boekhoff-Falk, G., Hearing in Drosophila: Development of Johnston’s organ and emerging parallels to vertebrate ear development, Developmental Dynamics 233, 550-558, 2005. [CrossRef]
- Brauckmann, C.; Schneider, J. Ein unter-karbonisches Insekt aus dem Raum Bitterfeld/Delitzsch (Pterygota, Arnsbergium, Deutschland). N. Jb. Geol. Paläont. Mh. 1996, 17–30. [Google Scholar]
- Brauckmann C., Schöllmann L., Sippel W., Die fossilen Insekten, Spinnentiere und Eurypteriden von Hagen-Vorhalle, Geologie und Paläontologie in Westfalen 59, 1-95, 2003.
- Dobzhansky, T., The influence of quantity and quality of chromosomal material on the size of the cells in Drosophila melanogaster, Wilhelm Roux Arch. Entwickl. Mech. Org. 115, 363-379, 1929. [CrossRef]
- Gidaszewski, N.A., Baylac, M., Klingenberg, C.P. Evolution of sexual dimorphism of wing shape in the Drosophila melanogaster subgroup. BMC Evol Biol 9, 110, 2009. [CrossRef]
- Gompel, N., Prud’homme, B., Wittkopp, P. et al. Chance caught on the wing: cis-regulatory evolution and the origin of pigment patterns in Drosophila. Nature 433, 481–487, 2005. [CrossRef]
- Grimaldi, D. Engel, M.S., Evolution of the Insects, Cambridge University Press, 2005.
- Monier, M., Lorenzi, JN., Narasimha, S. et al. Adhesive and mechanical properties of the glue produced by 25 Drosophila species. Sci Rep 14, 23249, 2024. [CrossRef]
- Pesevski, M., and Dworkin, J., The influence of adaptation to life at high-altitude on condition dependent sexual shape and size dimorphism in Drosophila melanogaster, bioRxiv preprint. 2021. [CrossRef]
- Pitchers, W., Pool, J. E., and Dworkin, I., Altitudinal clinal variation in 822 wing size and shape in African Drosophila melanogaster: one cline or many? Evolution 2013, 67, 438–452. [CrossRef]
- Prud’homme, B., Gompel, N., Rokas, A. et al. Repeated morphological evolution through cis-regulatory changes in a pleiotropic gene. Nature 440, 1050–1053, 2006. [CrossRef]
- Hengstenberg, R., Controlling the fly’s gyroscopes. Nature 392, 757–758, 1998. [CrossRef]
- Kamikouchi, A., Inagaki, H., Effertz, T. et al. The neural basis of Drosophila gravity-sensing and hearing. Nature 458, 165–171, 2009. [CrossRef]
- Klepsatel, P., Galiková, M., Huber, C. D., and Flatt, T., Similarities and 773 differences in altitudinal versus latitudinal variation for morphological traits in Drosophila 774 melanogaster. Evolution 68, 1385–1398, 2014. [CrossRef]
- Kukalová-Peck, J., The Origin and Evolution of Insect Wings. https://zenodo.org/record/10720922 (version 5, 28 Feb 2024).
- Kukalová-Peck, J. & Brauckmann; C., Wing folding in pterygote insects, and the oldest Diaphanopterodea from the early Late Carboniferous of West Germany, Canadian Journal of Zoology, 68(6), 1104-1111, 2011. [CrossRef]
- Lack, J. B., Monette, M. J., Johanning, E. J., Sprengelmeyer, Q. D., Pool, J. E., Decanalization of wing development accompanied the evolution of large wings in high-altitude Drosophila. Proceedings of the National Academy of Sciences 113, 1014–1019, 2016. [CrossRef]
- Lack, J. B., Yassin, A., Sprengelmeyer, Q. D., Johanning, E. J., David, J. R., Pool, J. E., Life history evolution and cellular mechanisms associated with increased size in high-altitude Drosophila. Ecology and Evolution 6, 5893–5906, 2016. [CrossRef]
- Markow, T.A., O’Grady, P.M., Drosophila. A guide to species identification and use. Elsevier Inc., 2006.
- Melis, J.M., Siwanowicz, I. & Dickinson, M.H. Machine learning reveals the control mechanics of an insect wing hinge. Nature 628, 795–803, 2024. [CrossRef]
- Önder, B.Ş., Aksoy, C.F. Seasonal variation in wing size and shape of Drosophila melanogaster reveals rapid adaptation to environmental changes. Sci Rep 12, 14622, 2022. [CrossRef]
- Throckmorton, L.H., The phylogeny, ecology and geography of Drosophila, Handbook of genetics, 421-469, 1975.
- Tiefenbrunner, D.; Tiefenbrunner, W. Einige weinbaurelevante Neozoen und verwandte indigene Arten im Umfeld der Weingärten der Südwesthänge des Leithagebirges. Teil 1: Drosophila suzukii und andere Drosophilidae. Mitteilungen Klosterneubg. 2017, 67, 97–112. [Google Scholar]
- Tiefenbrunner, I.; Tscheik, G.; Tiefenbrunner, W. A. Comparison of the Attractiveness of Grape Juice after Different Fermentation Times for Drosophila suzukii and D. simulans in a Field Experiment. Preprints 2024, 2024020706. [CrossRef]
- Tiefenbrunner, W., Riedle-Bauer, M., Mehrjährige Untersuchung der Populationsentwicklung von Drosophila suzukii (Diptera: Drosophilidae) und anderen Drosophilidae im Weingarten und dessen Umgebung. Mitteilungen Klosterneubg. 2021, 71, 54–73.
- Torquato L.S., Mattos D., Matta B.P., Bitner-Mathé B.C., Cellular basis of morphological variation and temperature-related plasticity in Drosophila melanogaster strains with divergent wing shapes. Genetica 142(6), 495-505, 2014. [CrossRef] [PubMed]
- Werner, T., Koshikawa, S., Williams, T. et al. Generation of a novel wing colour pattern by the Wingless morphogen. Nature 464, 1143–1148, 2010. [CrossRef]
- Yassin, A., Phylogenetic classification of the Drosophilidae Rondani (Diptera): the role of morphology in the postgenomic era. Systematic Entomology, 38(2), 349–364, 2013. [CrossRef]
Figure 1.
Phylogenetic tree of the Drosophilidae according to Throgmorton 1975, simplified. Red text: Species assigned to the genus Amiota according to Bächli & Burla 1985. Blue text: Species assigned to the genus Drosophila according to this source. Sg.: subgenus; Sgr.: species group. Rd.: Radiation. The illustration is not a cladogram.
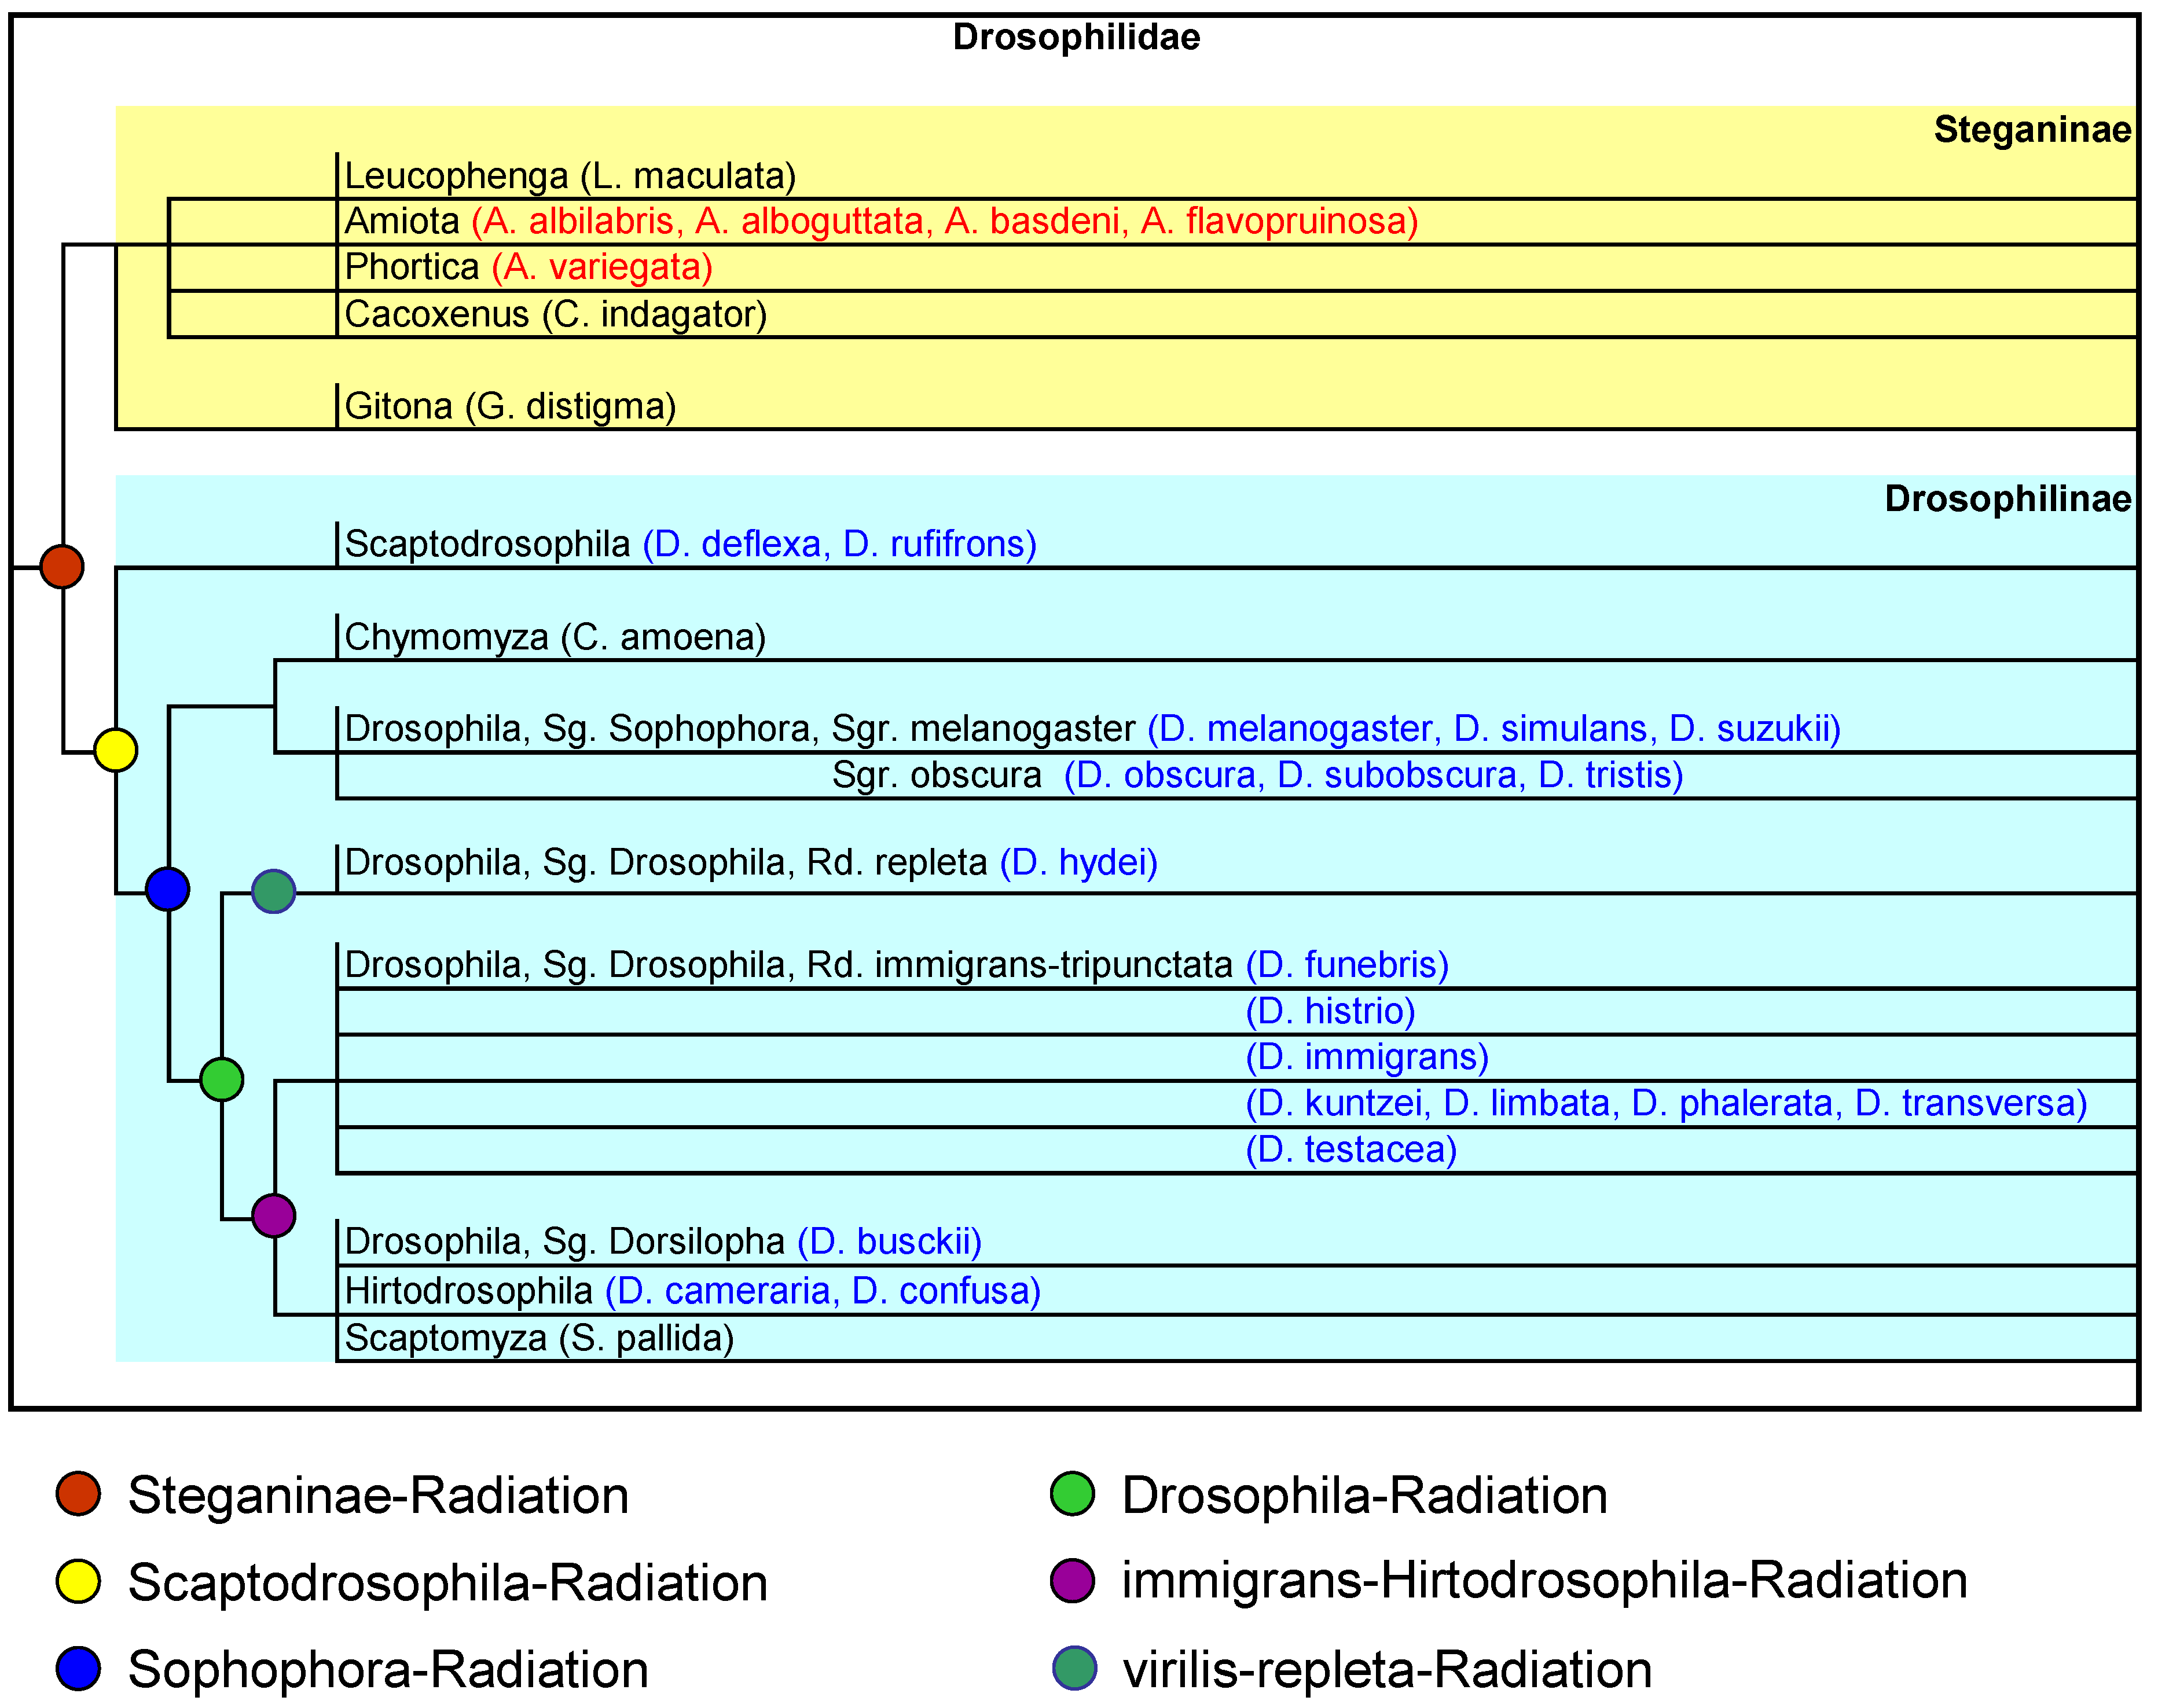
Figure 2.
A: Wing of D. cameraria (Co: Costa, Sc: Subcosta; R: Radius, M: Media; Cu: Cubitus; A: Analis, Bz: Basal cell, Dz: Discoidal cell). B: Nodes of wing venation selected for proportion analysis. C: Pattern of nodal connections (lines) used for the analysis.
Figure 2.
A: Wing of D. cameraria (Co: Costa, Sc: Subcosta; R: Radius, M: Media; Cu: Cubitus; A: Analis, Bz: Basal cell, Dz: Discoidal cell). B: Nodes of wing venation selected for proportion analysis. C: Pattern of nodal connections (lines) used for the analysis.
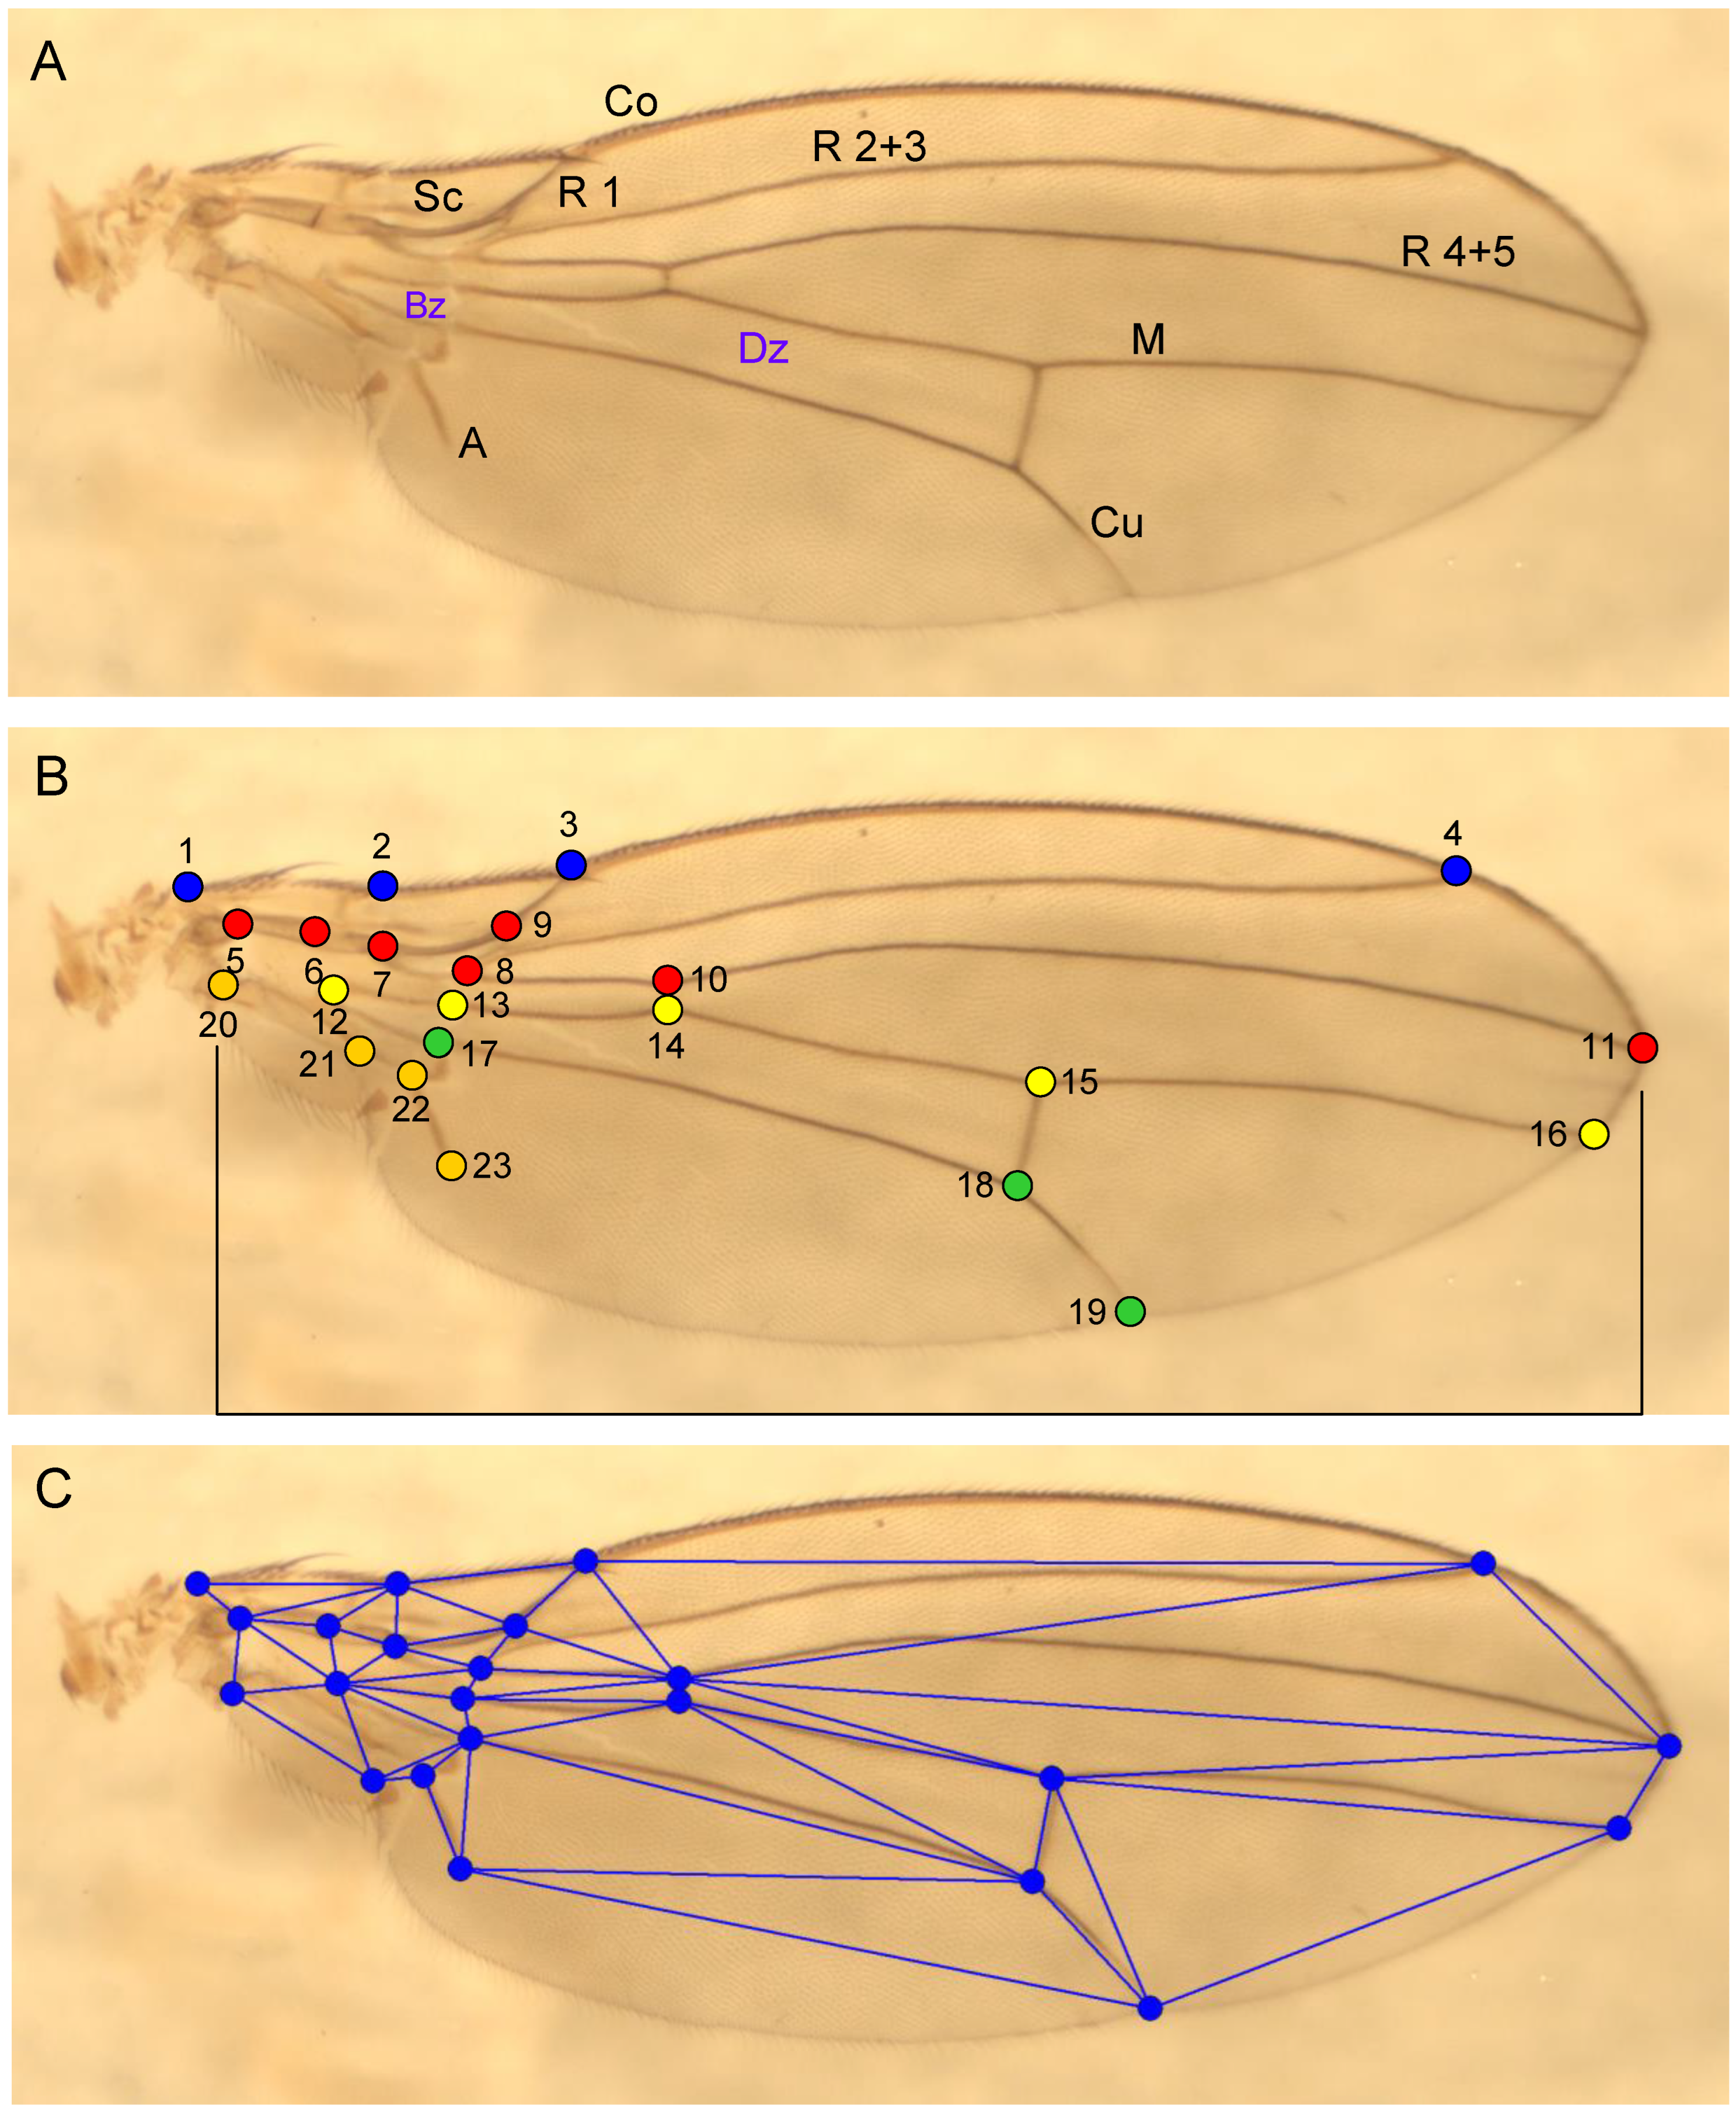
Figure 4.
Proportional shifts along the first principal axis (PC1). a: Significant distances in the wing; b & c: proximal (yellow) and mediodistal wing section (blue) in a species with a very large PC1 value (A. (P.) variegata) and one with a very small one (S. pallida).
Figure 4.
Proportional shifts along the first principal axis (PC1). a: Significant distances in the wing; b & c: proximal (yellow) and mediodistal wing section (blue) in a species with a very large PC1 value (A. (P.) variegata) and one with a very small one (S. pallida).
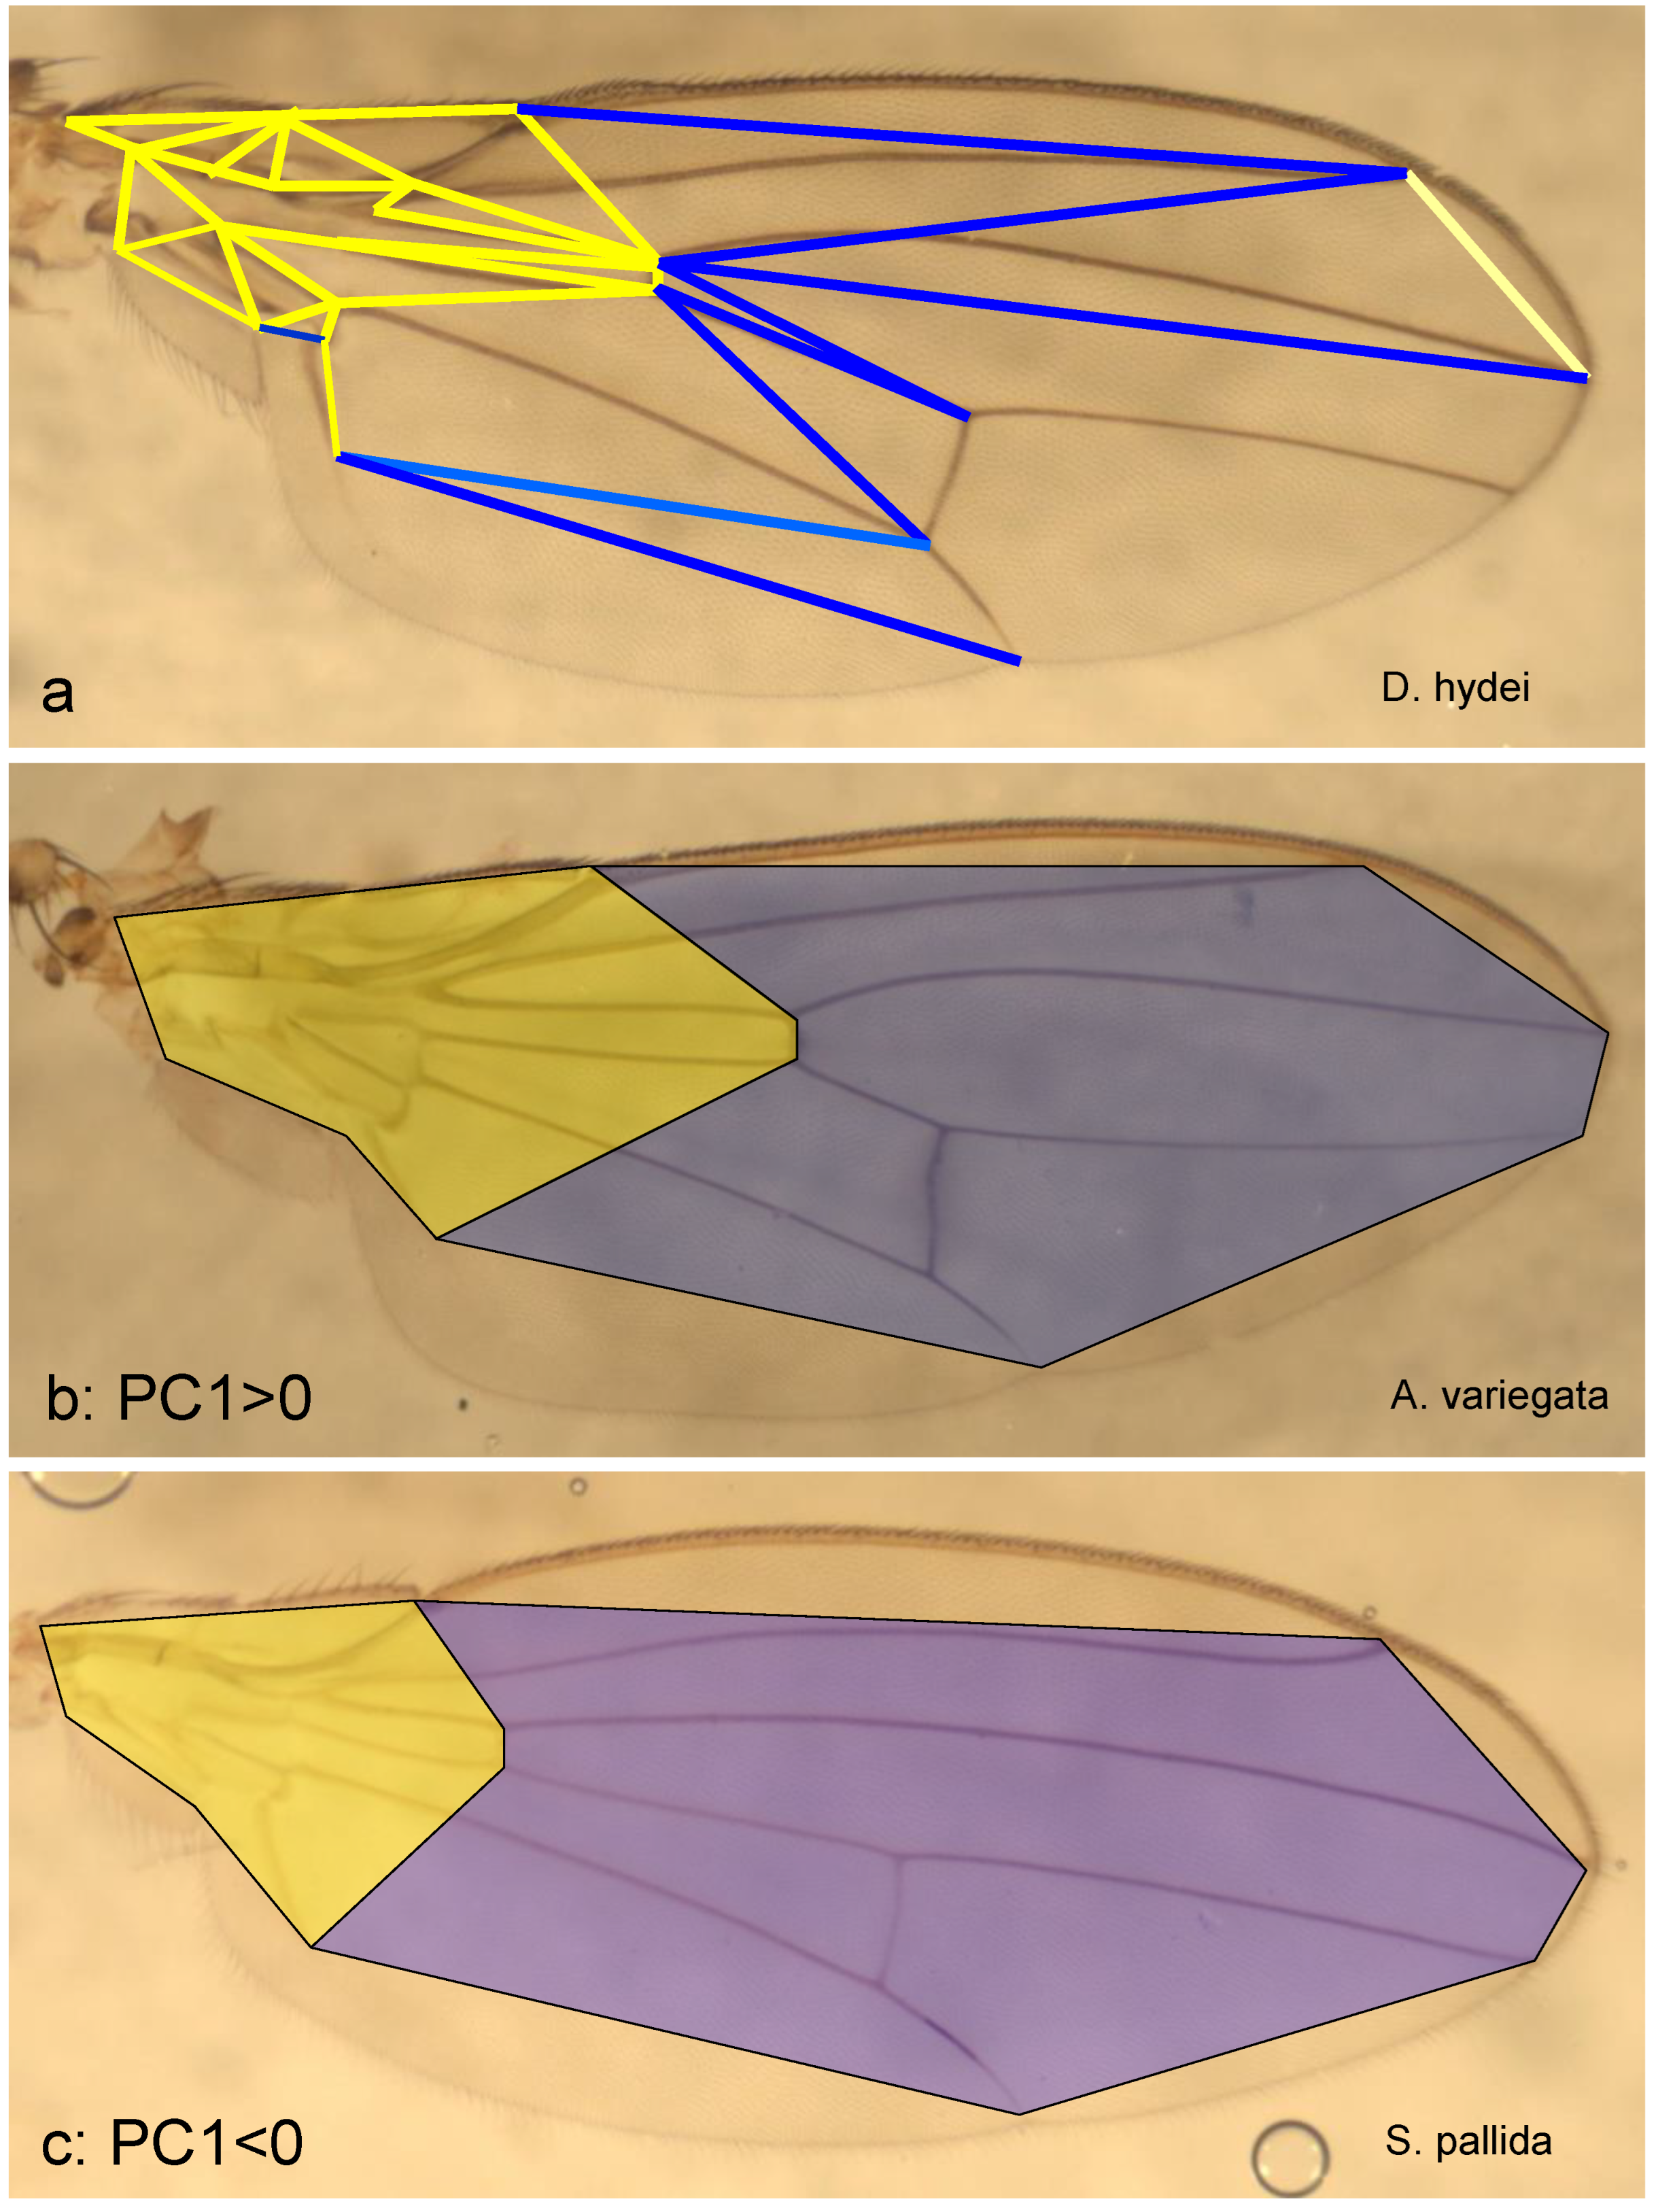
Figure 5.
Proportional shifts along the second principal axis (PC2). a: Significant stretches in the wing; b & c: medial (blue) and distal wing section (yellow) in a species with a very large PC2 value (D. hydei) and one with a very small one (G. distigma).
Figure 5.
Proportional shifts along the second principal axis (PC2). a: Significant stretches in the wing; b & c: medial (blue) and distal wing section (yellow) in a species with a very large PC2 value (D. hydei) and one with a very small one (G. distigma).
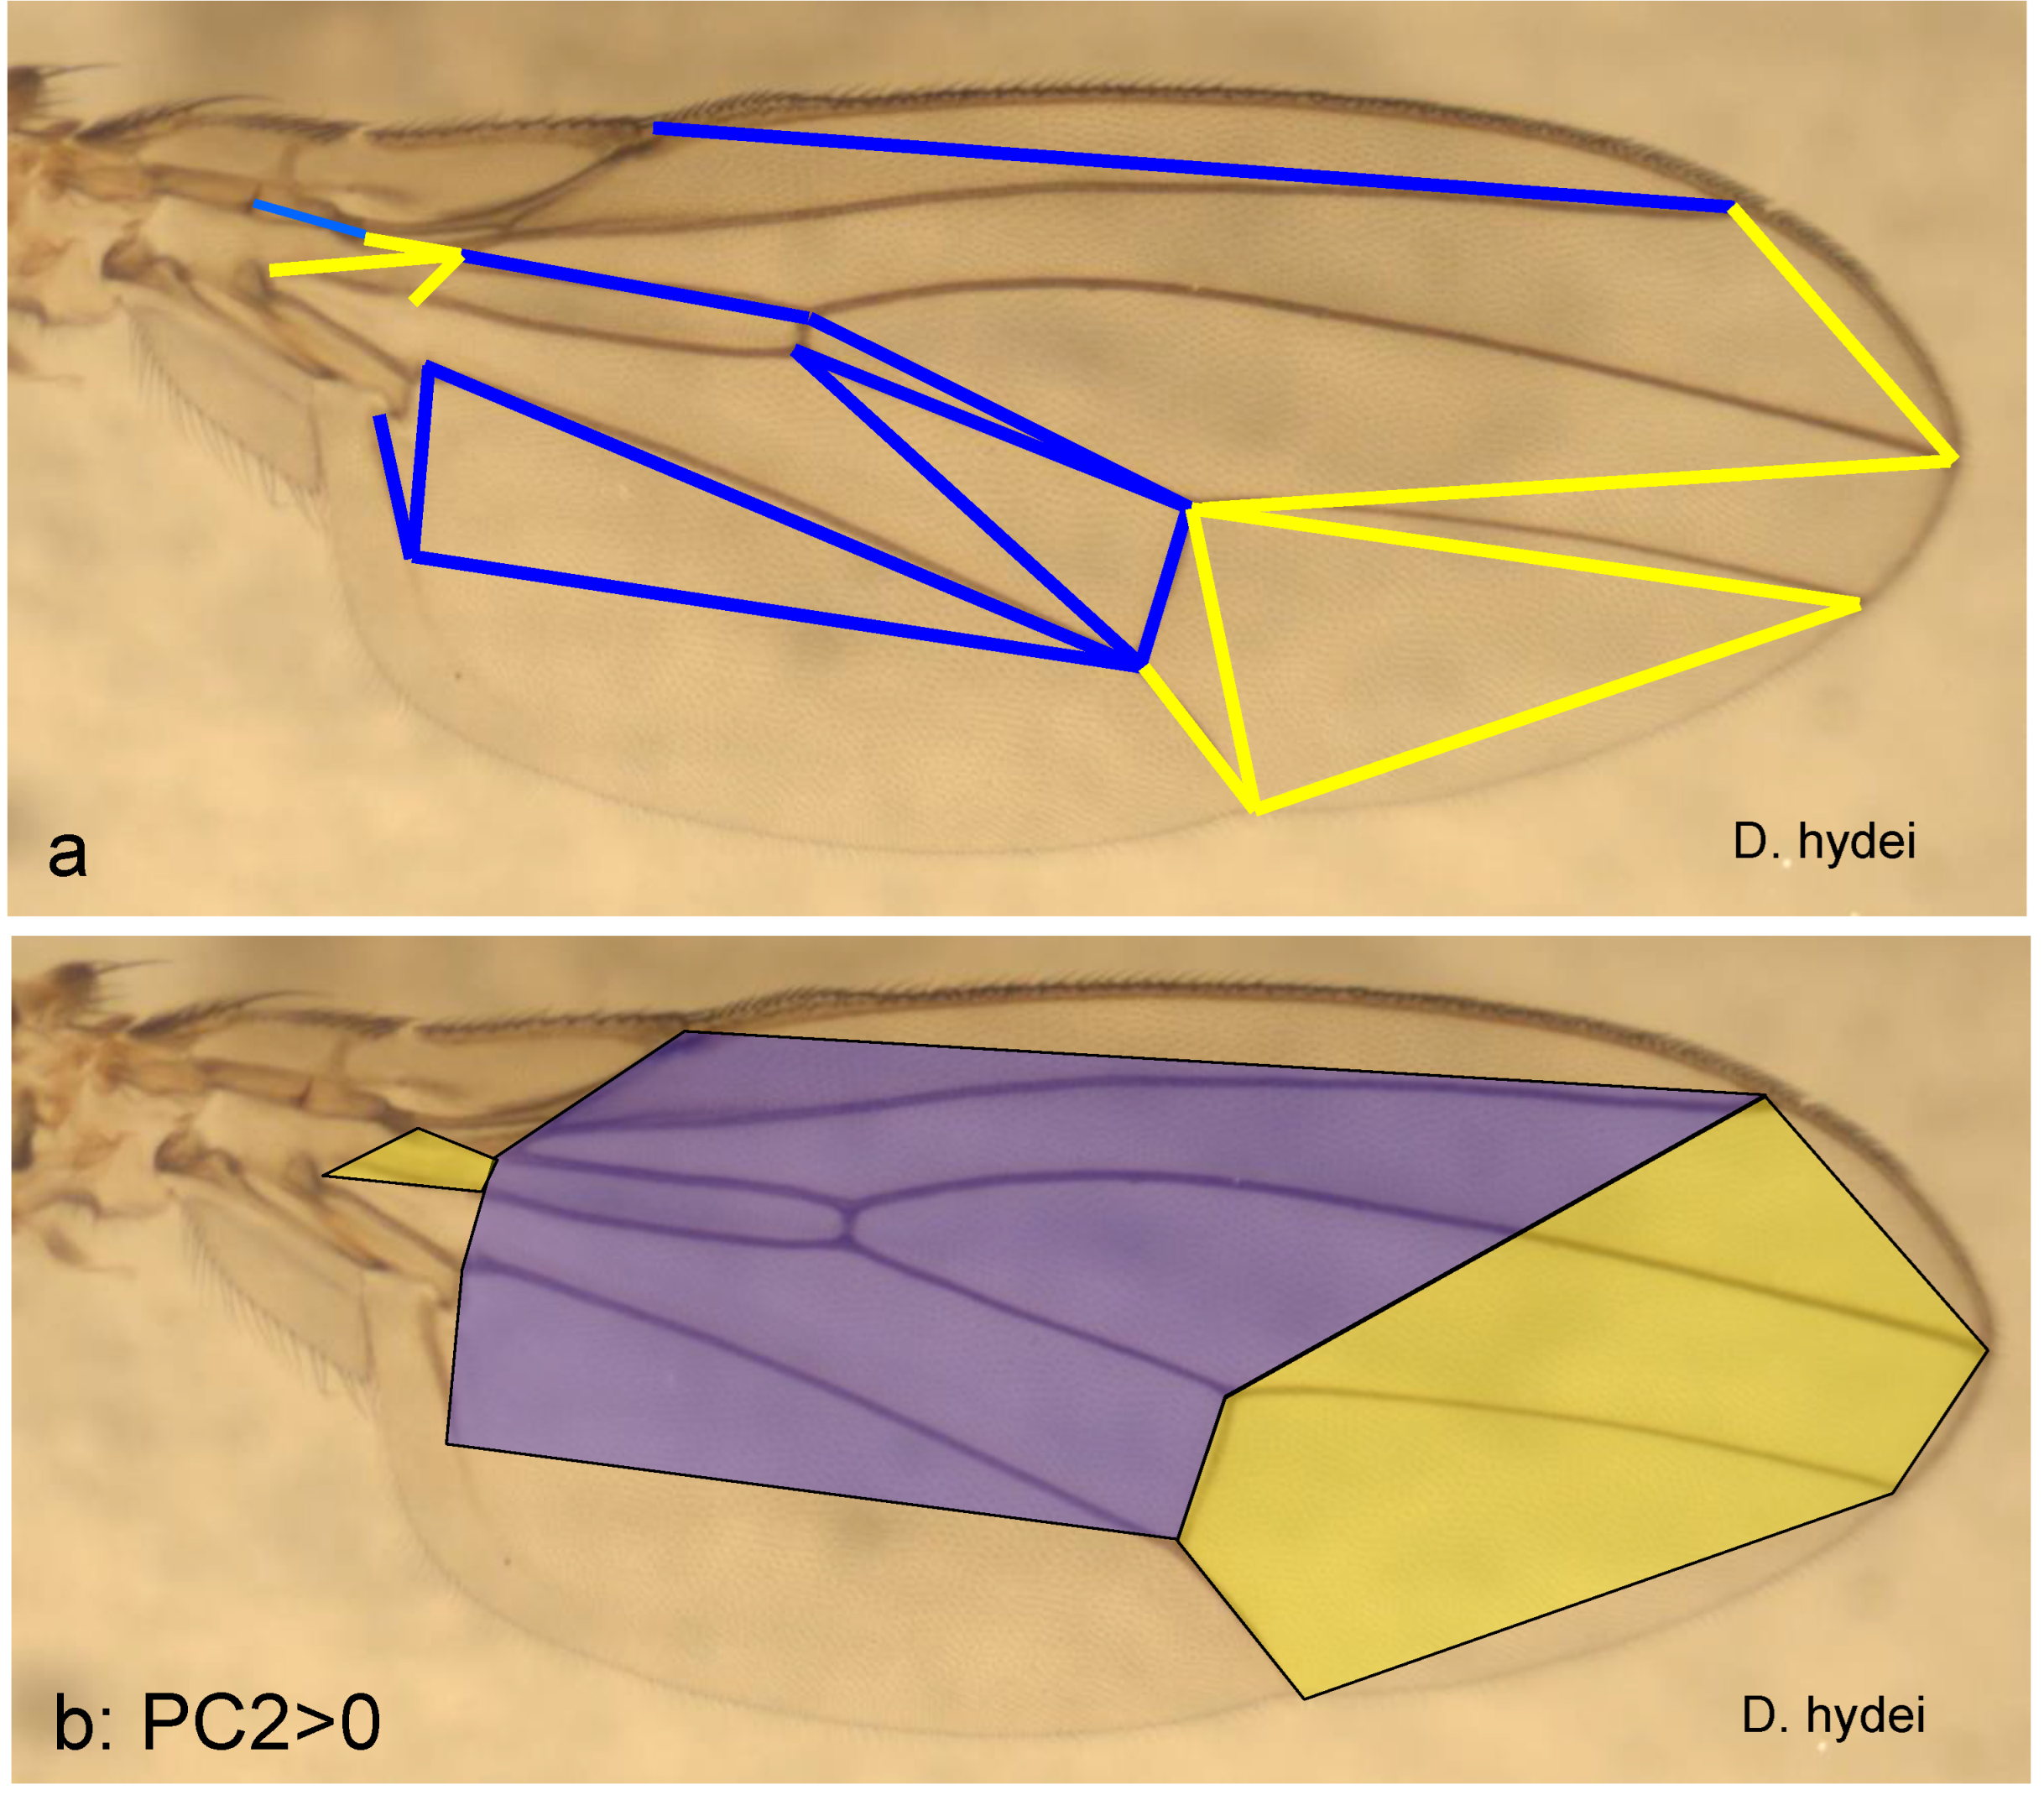
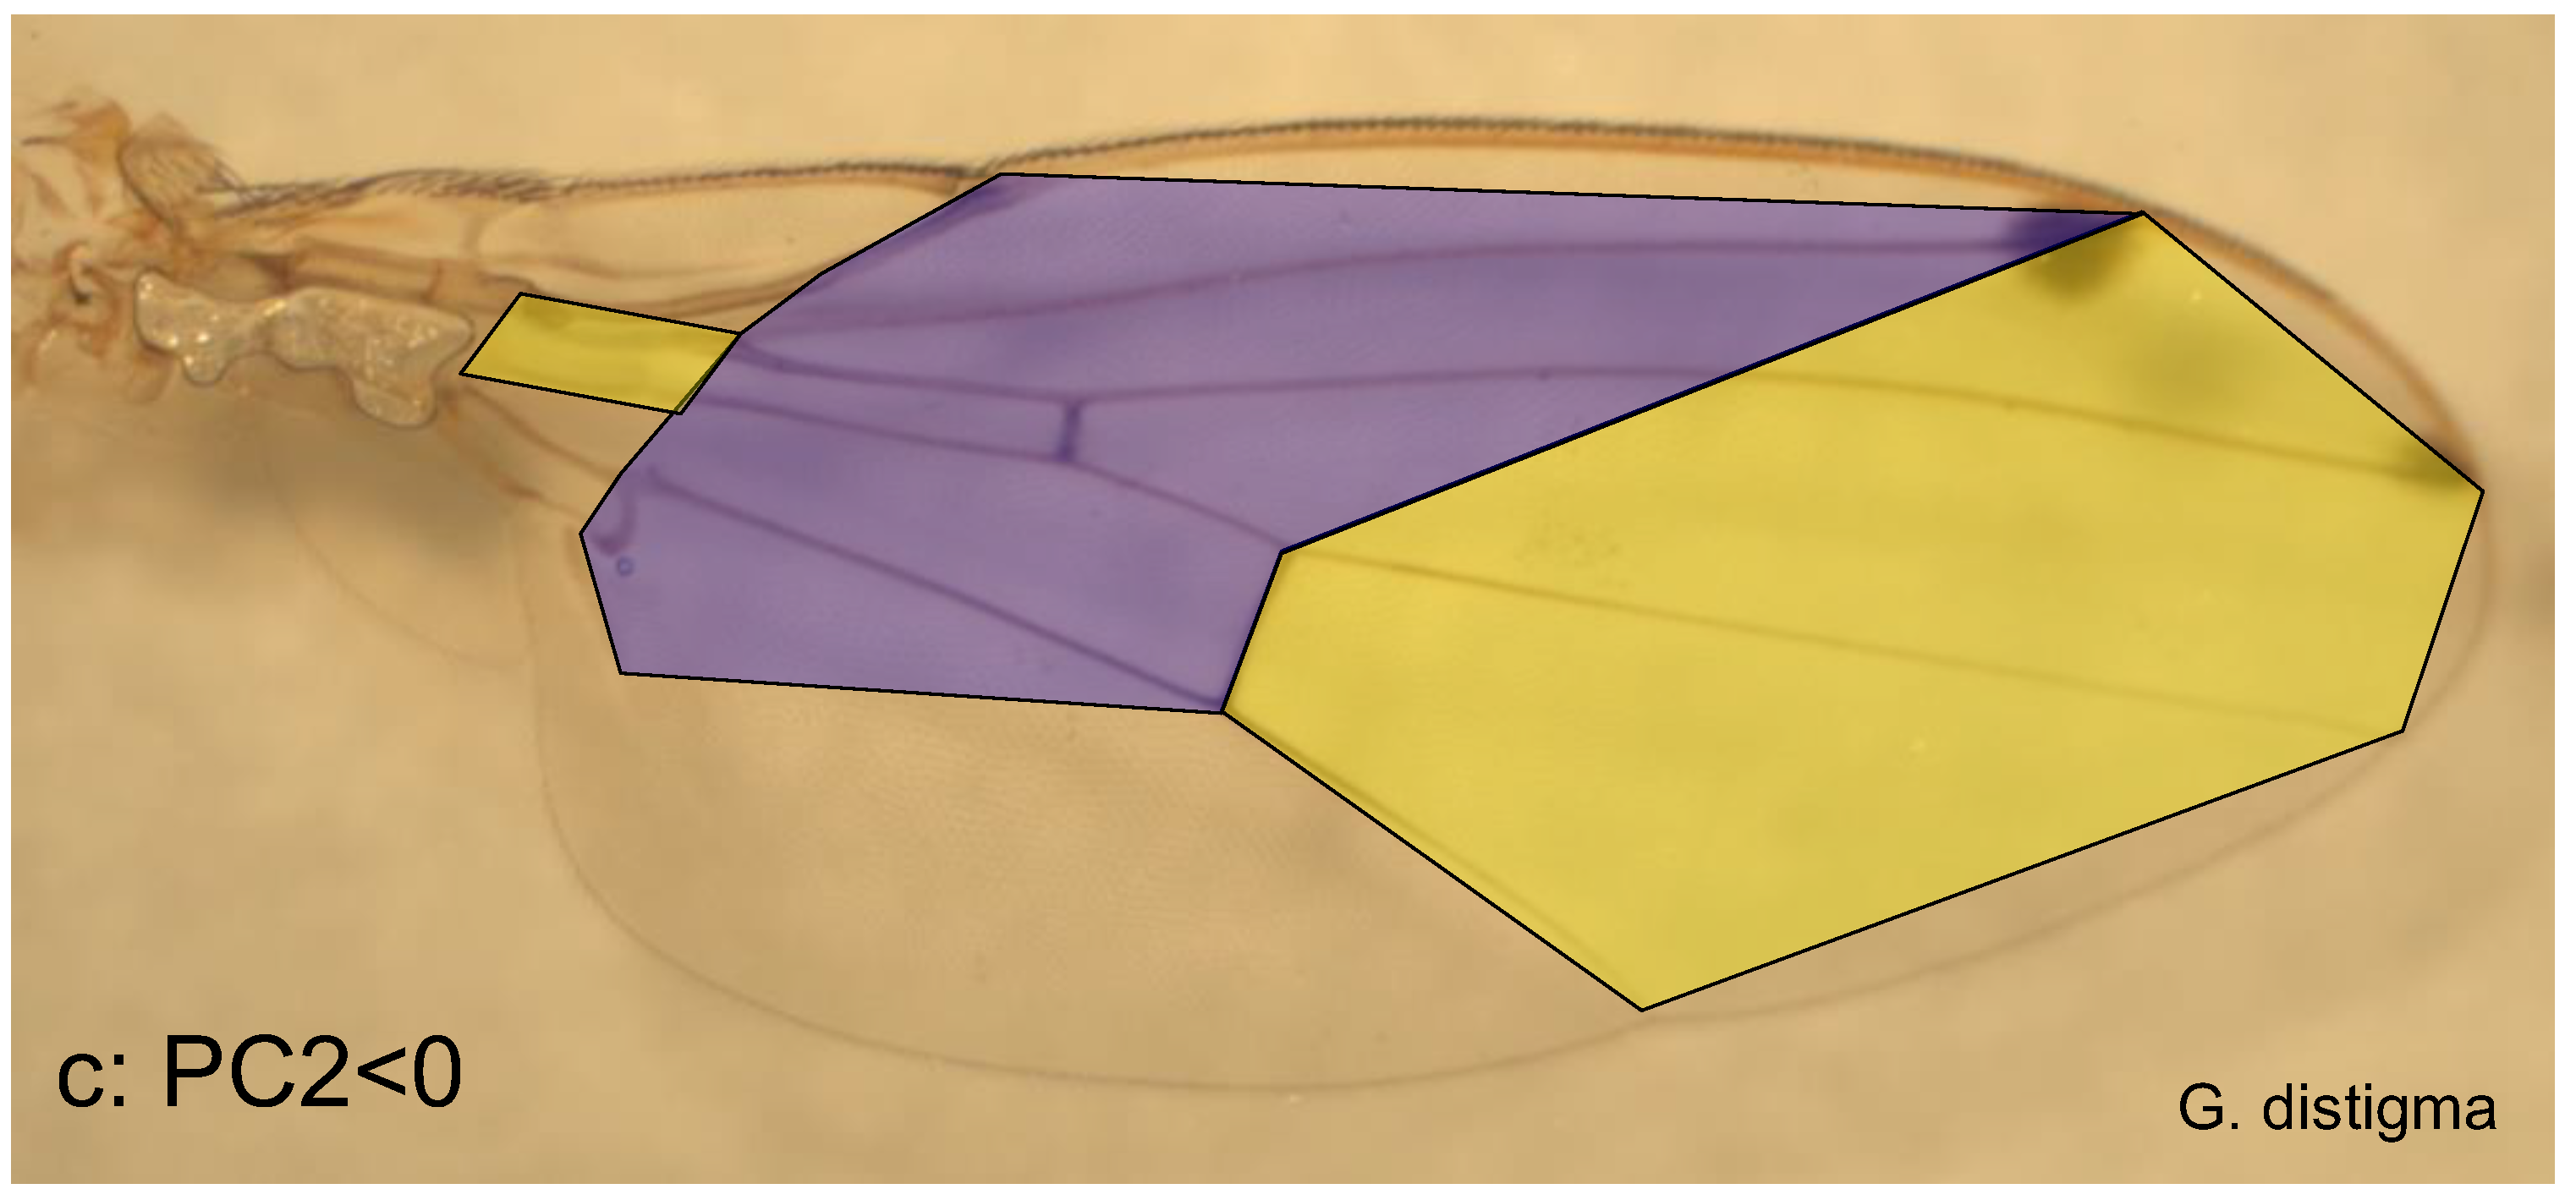
Figure 6.
a: Wing vein indices according to Bächli & Burla 1985. b: Costal versus reciprocal medial index, c: costal versus cubital index and d: reciprocal medial versus cubital index.
Figure 6.
a: Wing vein indices according to Bächli & Burla 1985. b: Costal versus reciprocal medial index, c: costal versus cubital index and d: reciprocal medial versus cubital index.
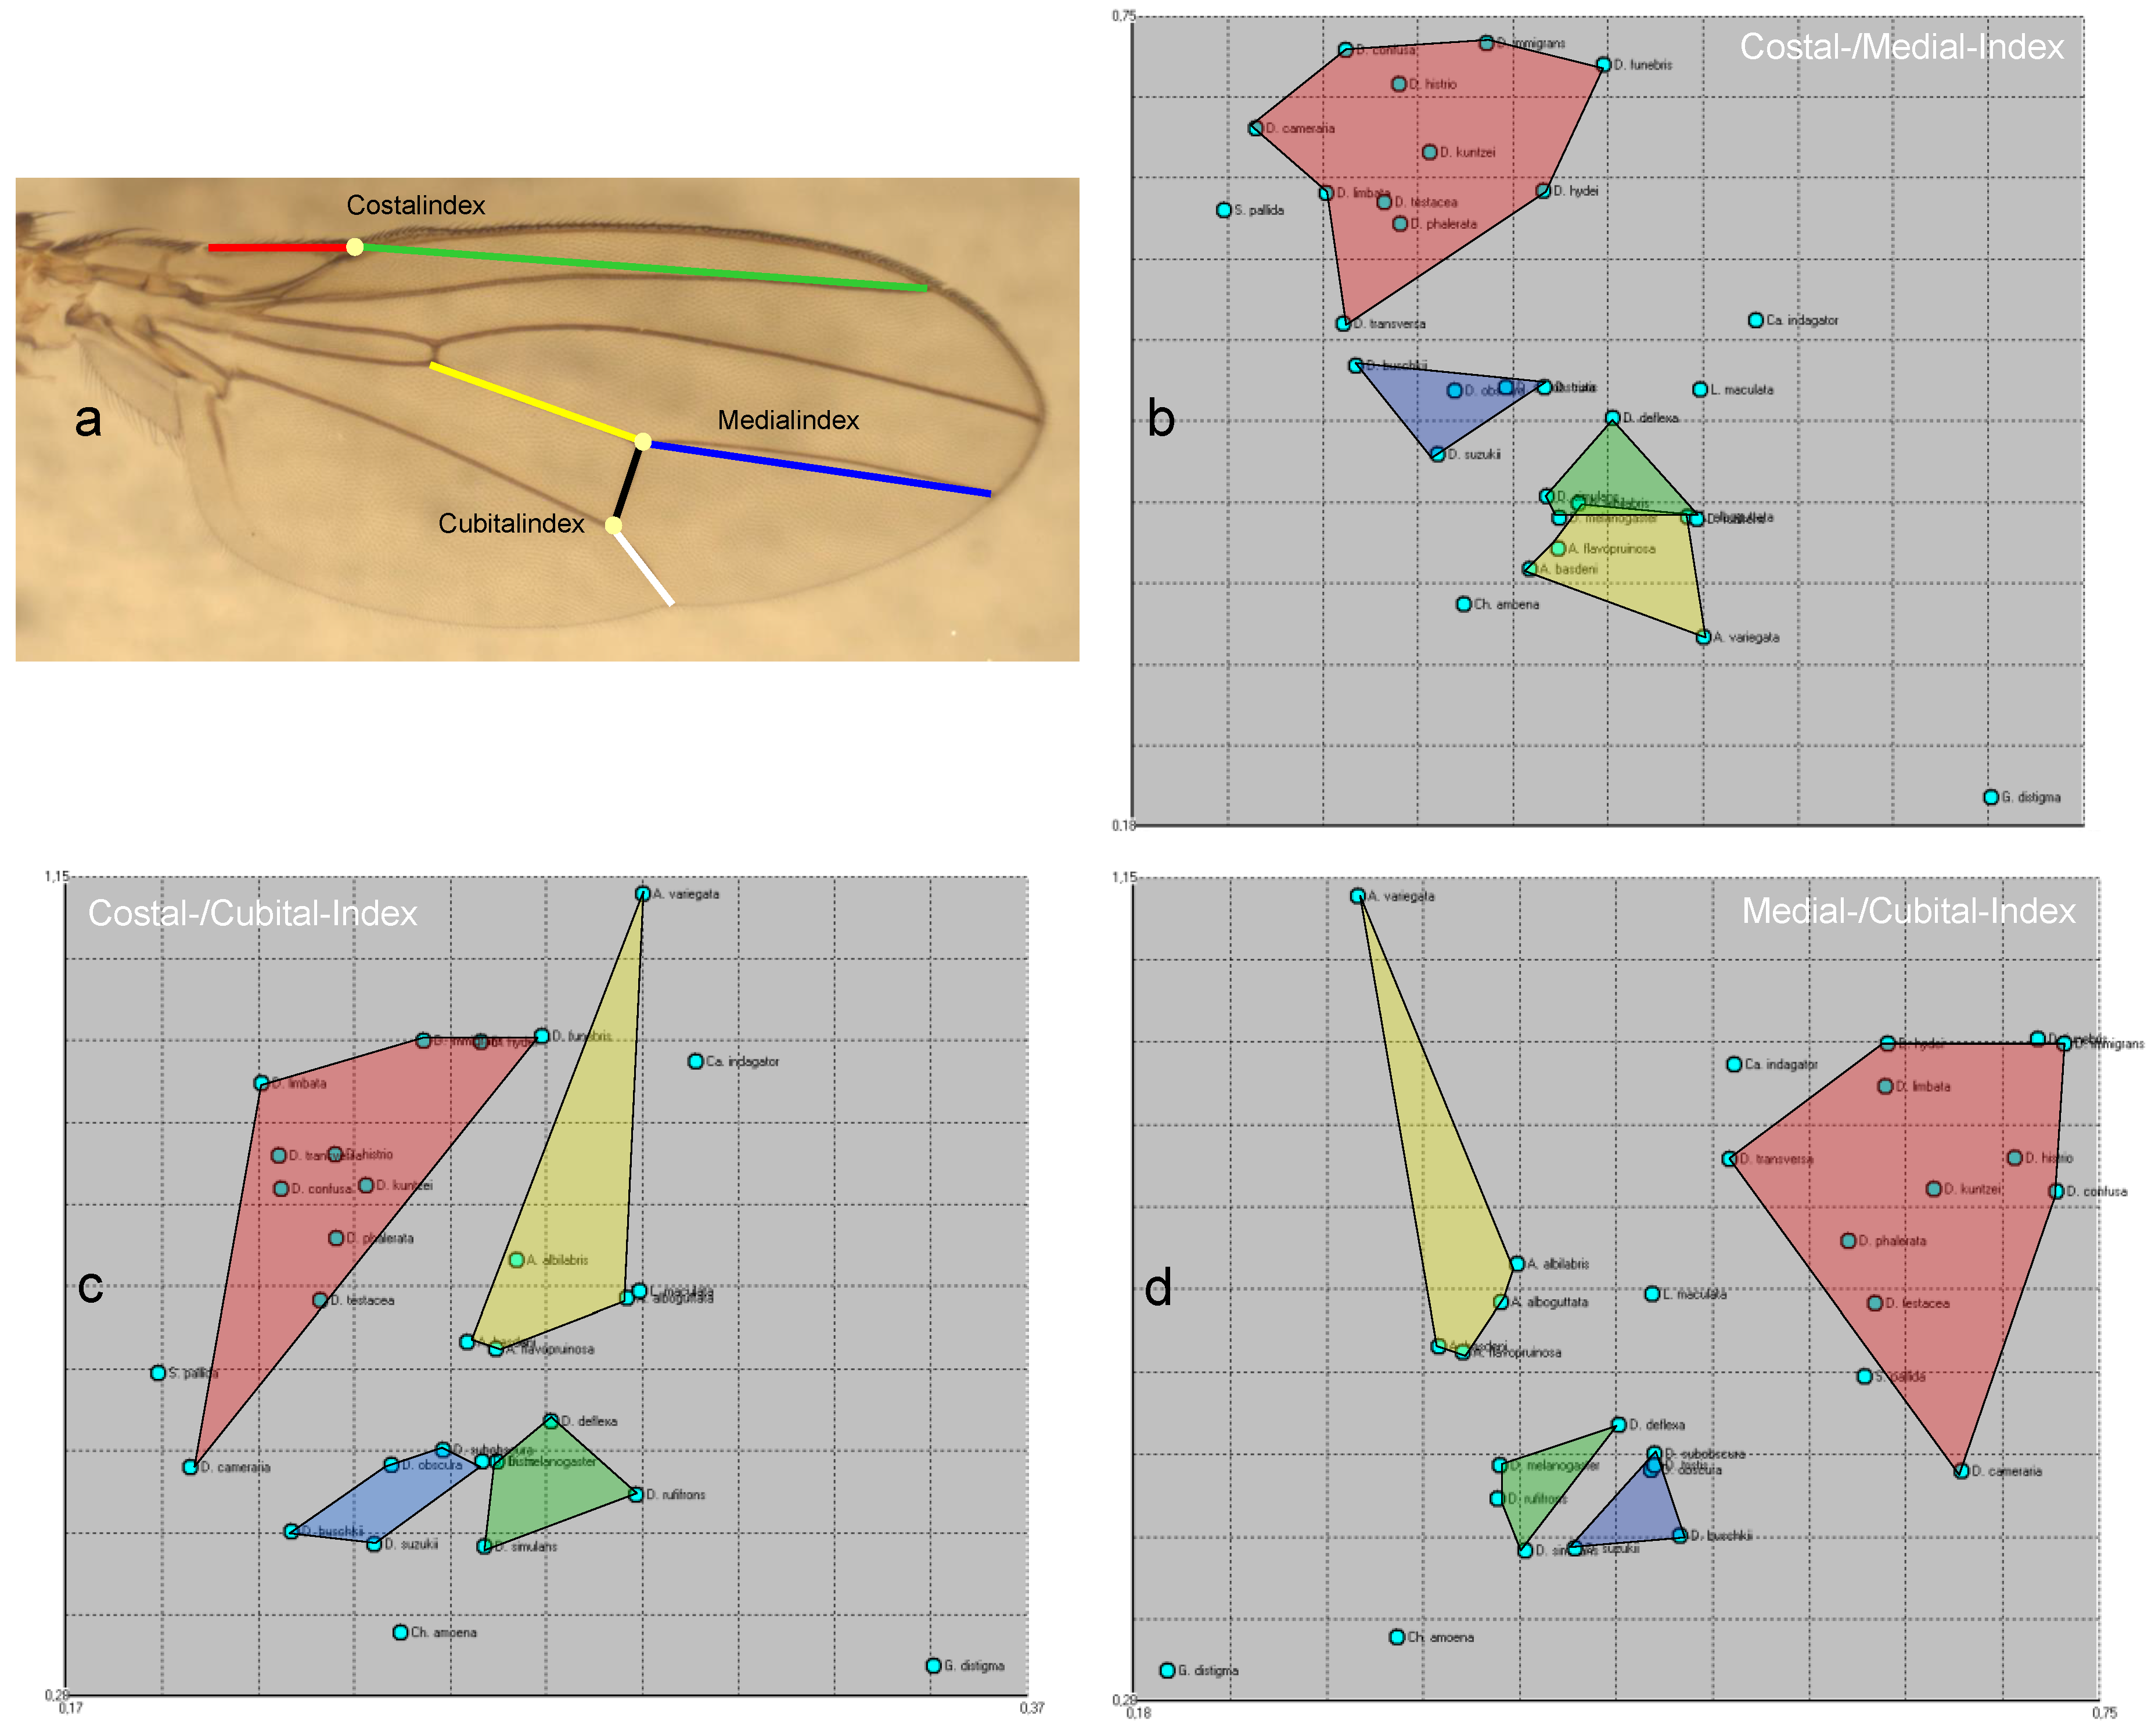
Table 1.
Taxonomy of the family Drosophilidae, considering only the Pannonian species used in this study. In brackets the genus classification according to Bächli & Burla 1985. Sgr: species group. In square brackets the abbreviation of the species names for Figure 3.
Table 1.
Taxonomy of the family Drosophilidae, considering only the Pannonian species used in this study. In brackets the genus classification according to Bächli & Burla 1985. Sgr: species group. In square brackets the abbreviation of the species names for Figure 3.
| Family Drosophilidae: | ||||||
| Subfamily Drosophilinae Rondani, 1856: | ||||||
| Tribe Colocasiomyini Okada, 1989: | ||||||
| Genus Chymomyza Czerny, 1903: | ||||||
| Ch. amoena [amo] | ||||||
| Genus Scaptodrosophila Duda, 1923: | ||||||
| Sd. (Drosophila) deflexa [def] | ||||||
| Sd. (Drosophila) rufifrons [ruf] | ||||||
| Tribe Drosophilini Okada, 1989: | ||||||
| Genus Drosophila Fallén, 1823 | ||||||
| Subgenus Dorsilopha | ||||||
| D. busckii [bus] | ||||||
| Subgenus Drosophila | ||||||
| Sgr. funebris | D. funebris [fun] | |||||
| Sgr. histrio | D. histrio [his] | |||||
| Sgr. immigrans | D. immigrans [imm] | |||||
| Sgr. quinaria | D. kuntzei [kun] | |||||
| D. limbata [lim] | ||||||
| D. phalerata [pha] | ||||||
| D. transversa [tra] | ||||||
| Sgr. testacea | D. testacea [tes] | |||||
| Sgr. repleta | D. hydei [hyd] | |||||
| Subgenus Sophophora | ||||||
| Sgr. melanogaster | D. melanogaster [mel] | |||||
| D. simulans [sim] | ||||||
| D. suzukii [suz] | ||||||
| Sgr. obscura | D. obscura [obs] | |||||
| D. subobscura [sub] | ||||||
| D. tristis [tri] | ||||||
| Genus Hirtodrosophila Duda, 1923 | ||||||
| H. (Drosophila) cameraria [cam] | ||||||
| H. (Drosophila) confusa [con] | ||||||
| Genus Scaptomyza Hardy, 1849 | ||||||
| Sc. pallida [pal] | ||||||
| Subfamily Steganinae Hendel, 1917: | ||||||
| Tribe Gitonini Grimaldi, 1990: | ||||||
| Genus Amiota Loew, 1862 | ||||||
| A. albilabris [all] | ||||||
| A. alboguttata [alg] | ||||||
| A. basdeni [bas] | ||||||
| A. flavopruinosa [fla] | ||||||
| Genus Cacoxenus Loew, 1858 | ||||||
| Ca. indagator [ind] | ||||||
| Genus Gitona Meigen, 1830 | ||||||
| G. distigma [dis] | ||||||
| Genus Phortica Schiner, 1862 | ||||||
| P. (Amiota) variegata [var] | ||||||
| Tribe Steganini Okada, 1989: | ||||||
| Genus Leucophenga Mik, 1866 | ||||||
| L. maculata [mac] | ||||||
Disclaimer/Publisher’s Note: The statements, opinions and data contained in all publications are solely those of the individual author(s) and contributor(s) and not of MDPI and/or the editor(s). MDPI and/or the editor(s) disclaim responsibility for any injury to people or property resulting from any ideas, methods, instructions or products referred to in the content. |
© 2025 by the authors. Licensee MDPI, Basel, Switzerland. This article is an open access article distributed under the terms and conditions of the Creative Commons Attribution (CC BY) license (http://creativecommons.org/licenses/by/4.0/).
Copyright: This open access article is published under a Creative Commons CC BY 4.0 license, which permit the free download, distribution, and reuse, provided that the author and preprint are cited in any reuse.


