
Submitted:
06 January 2025
Posted:
07 January 2025
You are already at the latest version
Abstract
Background/Objectives: This study aimed to determine the serum sphingolipid profile in diabetic ketoacidosis (DKA) and investigate its relationship with neutral sphingomyelinase (N-SMase), pro-inflammatory cytokines, β-hydroxybutyrate (β-OHB), and lactate levels. Methods: Thirty-three participants were divided into three groups: control (BMI ≤30, no health issues), obese (BMI >30), and DKA (BMI ≤30). Sphingomyelins (16:0-24:0 SMs) and ceramides (C16-C24 CERs) were measured using ultra-fast liquid chromatography combined with tandem mass spectrometry (LC-MS/MS). N-SMase, interleukin 1 beta (IL-1β), and tumor necrosis factor alpha (TNF-α) levels were assessed by enzyme-linked immunosorbent assay. Evaluations were done in the DKA group before and after treatment (post-DKA group). Results: β-OHB levels were significantly higher in the DKA group than in the control, obese, and post-DKA groups. Although β-OHB levels decreased in the post-DKA group, they remained elevated compared to the control and obese groups. Lactate levels were also higher in the DKA group, with a significant decrease in the post-DKA group. TNF-α and IL-1β were higher in the obese group compared to control and DKA groups, and TNF-α decreased significantly in the post-DKA group compared to DKA. N-SMase, 16:0-18:0 SMs, and C18-C24 CER levels were lower in the DKA and post-DKA groups compared to obese and control groups. Serum β-OHB and lactate levels were significantly correlated with S1P, total CER, total SM, and N-SMase values. Conclusions: The study reveals significant metabolic and inflammatory changes in DKA and post-DKA states, suggesting a relationship between sphingolipids, N-SMase, and these alterations, which could offer insights into DKA pathophysiology and therapeutic targets.
Keywords:
diabetic ketoacidosis
; sphingolipids
; neutral sphingomyelinase
; β-hydroxybutyrate
; tumor necrosis factor alpha
1. Introduction
Sphingolipids are structural elements of cell membranes and recent studies have shown that they lead to the formation of various lipid mediators [1]. Ceramide occupies a central position in the metabolism of sphingolipids. Ceramide is formed by the combination of serine and palmitoyl CoA. Ceramide is also formed by the hydrolysis of sphingomyelin by the enzyme sphingomyelinase [2]. Once ceramide is formed, it is converted to ceramide-1-phosphate by the enzyme ceramide kinase or used for sphingomyelin/glycosyphygolipid synthesis [2]. Ceramide can be broken down into sphingosine by ceramidase enzymes. Sphingosine, on the other hand, can be converted to sphingosine-1-phosphate by sphingosine kinases. A phosphorylated sphingolipid metabolite, sphingosine-1-phosphate, is an effective bioactive mediator and has recently been shown to play an active role in the inflammatory response [3].
There is an increase in plasma ceramides in morbidly obese people [4]. Several mechanisms have been identified regarding the role of ceramides in the development of insulin resistance. The mechanisms responsible are particularly relevant to the effects of insulin at the receptor and post-receptor level. Ceramides inhibit the translocation of glucose transporter type 4 (GLUT-4), reducing intracellular glucose uptake in insulin-sensitive tissues and leading to insulin resistance [5]. It is also known that in the presence of increased ceramide levels, insulin’s ability to stimulate protein kinase B is inhibited, causing insulin resistance [6].
Obesity can cause chronic inflammatory condition. In obese patients, increased adipose tissue also functions as an active endocrine organ by secreting proinflammatory cytokines such as interleukin 6 (IL-6), IL-1-beta, TNF alpha [7]. Chronic inflammation in obese patients causes lipolysis, thereby increasing fatty acid release from peripheral tissues [8]. While the resulting fatty acids are used in ceramide formation, pro-inflammatory cytokines induce ceramide formation through enzymatic and receptor pathways [9]. Ceramides are also known to increase the formation of pro-inflammatory cytokines in obesity, a precondition that can contribute to decreased insulin sensitivity [10]. Pro-inflammatory cytokines also induce recycling pathways in which ceramides are deactivated to form sphingosine [9].
Diabetic ketoacidosis is an acute and life-threatening complication of diabetes. The clinical definition of diabetic ketoacidosis can be summarized as an acute condition of uncontrolled diabetes requiring immediate insulin and intravenous fluid therapy [11]. Diabetic ketoacidosis is usually seen in patients with type 1 diabetes, but DKA can also develop in patients with type 2 diabetes. DKA can be seen in patients with type 2 diabetes in cases of severe infection, trauma, cardiovascular disease [11]. The prevalence of diabetic ketoacidosis is reported to be 3-8/1000. Diabetic ketoacidosis presents a clinical picture with hyperglycemia, ketosis and acidosis [12].
In insulin deficiency, glycogenolysis occurs in the liver, proteolysis takes place in muscle and lipolysis arises in adipose tissue. The secretion of glucose from the liver, the release of amino acids and fatty acids from muscle and adipose tissues increases [12]. Increased amino acids are used in liver gluconeogenesis while glucose uptake of peripheral tissues is also reduced due to insulin deficiency and/or resistance which also triggers hyperglycemia [11,12]. Acetyl-CoA, which is released in excess due to the oxidation of fatty acids in the liver, causes an increase in ketone production also termed ketogeneses. Beta-hydroxybutyrate constitutes 70-85% of the ketoacids produced in the liver and released into the circulation, while acetoacetate comprises 20% and acetone represents 2%. Blood ketone values are important in the evaluation of ketoacidosis [11,12].
Once considered as “metabolic waste”, ketones have become a major focus in cardiometabolic research [13]. Recent discoveries have revealed that ketones, such as acetoacetate and its precursor beta-hydroxybutyrate, are signaling molecules that elicit anti-inflammatory effects [14]. Ketogenic diet (KD) causes a decrease in TNF-alpha, IL-1-alpha, IL-1-beta, and IL-6 levels [15], while lowering ceramide levels in humans [16]. Beta-hydroxybutyrate also causes a decrease in ceramides in rat muscle cells [17].
In this context, the hypothesis of this work was that increased beta-hydroxy butyrate levels in DKA could cause quantitative changes in circulating levels of ceramides and pro-inflammatory cytokines. In the present study, beta-hydroxybutyrate levels, serum sphingolipids and proinflammatory cytokines were investigated in patients with DKA. The results were compared with those of obese and healthy individuals.
2. Materials and Methods
2.1. Study Population
This study included 33 volunteers, who applied to the Endocrinology Clinic at Antalya Research and Education Hospital. All cases of ketoacidosis had previously been diagnosed with type I diabetes. All DKA patients were using different doses of insulin prior to enrolment in the study. In the first stage of the study, 3 groups were formed. The control group, mean age of 30 ± 3.72, included 11 female and 1 male participants (n=12) without underlying health issues and a BMI of 30 or less. The obese group, mean age of 30.18 ± 8.73, included 9 female and 2 male participants (n=11) with a BMI above 30. The DKA group, mean age of 35.50 ± 17.01, included 5 female and 5 male participants (n=10) all of whom had a body mass index (BMI) of 30 or less. Individuals were excluded if they had taken fibrates, niacin, or omega-3 supplements within the last three months, had a history of psychosis or cancer, were pregnant, or had active liver disease, kidney failure, or unstable angina. The study received ethical approval from the Clinical Research Ethics Committee of Akdeniz University (Reference no: KAEK-752 Date: 27.09.2023).
2.2. Laboratory Measurements
For control and obese groups, blood samples were collected once. For the DKA group, blood samples were collected twice: at the time of admission (DKA) and before oral feeding following recovery from ketoacidosis (post-DKA). The duration of ketoacidosis was between 4-24 hours in patients diagnosed with DKA and during this period, they did not enter hypoglycemia. Blood pH and HCO3 levels were measured by blood gas analyzer (Radiometer ABL800, Kopenhag, Denmark). C-reactive protein (CRP), glucose, blood urea nitrogen (BUN), creatinine, Na+, K+, Cl-, Ca+2, total cholesterol, high-density lipoprotein cholesterol (HDL-C), triglyceride, albumin, alanine aminotransferase (ALT), aspartate aminotransferase (AST) and lipase were measured by a clinical chemistry analyzer (Beckman Coulter AU5800, Brea, California, U.S.A.). Thyroid stimulating hormone (TSH), free thyroxine (fT4) and insulin were measured by an immunoassay system analyzer (Beckman Coulter DxI 800, Brea, California, U.S.A.). Urine ketone was measured by an automated urine analyzer (DIRUI FUS-200, Changchun, China) while HbA1c was measured by an automated glycohemoglobin analyzer (Tosoh HLC-723G11, Tessenderlo, Belgium).
2.3. Measurement of Sphingomyelins and Ceramides
SMs and CERs were quantified using a multiple reaction monitoring (MRM) technique, optimized for accuracy. Ultra-fast liquid chromatography (UFLC, LC-20 AD UFLC XR, Shimadzu Corporation, Japan) in conjunction with tandem mass spectrometry (LC-MS/MS-8040, Shimadzu Corporation, Japan) was used to perform the analysis in accordance with the procedures described in earlier studies [4]. SMs and CERs standards were obtained from Avanti Polar Lipids (Alabaster, AL, USA) and included sphingosine-1-phosphate (S1P), C16 SM, C18 SM, C24 SM, C16 CER, C18 CER, C20 CER, C22 CER, and C24 CER. The internal standard used, C16 CER d18:1/16:0 (Palmitoyl-U-13C16), was supplied by Cambridge Isotope Labs (Andover, MA, USA). All standard solutions were dissolved in methanol at 40°C with sonication. A C18 HPLC column (XTerra, 2.1 mm x 50 mm, Waters, MA, USA) was used for chromatographic separation, which was carried out at 60°C and 0.45 mL/min. The gradient elution used solvent-A (water-acetonitrile-isopropanol, 8:1:1 v/v/v addition to 10 mM ammonium formate) and solvent-B (acetonitrile-isopropanol, 9:1 v/v). The flux began with 65% solvent-B (0-2 minute), increased to 90% (2.01-13 minute), peaked at 100% (13.01-20 minute), and returned to 65% (20.1-23 minute). Positive electrospray ionization (ESI) mode was the system’s mode of operation.
The precursor and product ion pairs for each sphingomyelin and ceramide were as follows: S1P, m/z 380.10 → 264.40; C16 SM, m/z 703.30 → 184.20; C18 SM, m/z 731.40 → 184.20; C24 SM, m/z 815.50 → 184.20; C16 CER, m/z 538.50 → 264.40; internal standard C16 CER*IS, m/z 554.30 → 264.30; C18 CER, m/z 566.30 → 264.40; C20 CER, m/z 594. 60 → 264.50; C22 CER, m/z 622.60 → 264.40; and C24 CER, m/z 650.40 → 264.30. A calibration range of 39 to 625 ng/mL was applied for quantification and the total analysis time per sample was 23 min.
2.4. Serum Sample Preparation for Mass Spectrometry
Sphingolipids were extracted from serum using established protocols [4]. First, 500 µL of serum that had been diluted 1:20 (v/v) with distilled water was mixed with 2 µL of internal standard solution (5 μg/mL). The mixture was vortexed, followed by the addition of 375 µL of chloroform/methanol (1:2, v/v). After sonication for 30 seconds, 100 µL of water was added, and the samples were vortexed for 5 minutes. Before centrifuging the mixtures at 2000 g for five minutes to separate the supernatant, they were allowed to stand at room temperature for thirty minutes. To further enhance phase separation, 125 µL each of chloroform and water were added, and the samples were vortexed again. The organic phase was then transferred to glass tubes and allowed to dry at room temperature with a steady nitrogen flow using a height-adjustable gas distribution device (VLM, Bielefeld, Germany). After dissolving the dried residue in 100 µL of methanol, 10 µL of injection volume was taken into the LC-MS/MS for measurement.
2.5. Measurement of Serum β-Hydroxybutyrate Levels
Serum β-hydroxybutyrate levels were measured using a colorimetric assay kit (Cayman Chem., MI, U.S.A., Catalogue number:700190). This test requires 3-hydroxybutyrate dehydrogenase’s enzymatic conversion of D-3-hydroxybutyrate to acetoacetate and NAD+ to NADH. In the presence of diaphorase, NADH reacts with WST-1 to form a colored formazan product, which is measured spectrophotometrically at 450 nm to directly determine β-hydroxybutyrate concentrations. The concentrations were calculated in mM based on a standard curve constructed with known amounts of β-hydroxybutyrate standards.
2.6. Measurement of Serum N-SMase, IL-1β, and TNF-α Levels
Levels of N-SMase, IL-1β, and TNF-α in serum were measured using enzyme-linked immunosorbent assay (ELISA) kits (BT LAB, Zhejiang, China; Cat. No. E6866Hu, E0143Hu, E0082Hu, respectively). The assays were carried out in compliance with the manufacturer’s guidelines. Serum samples were added to ELISA plates pre-coated with monoclonal antibodies (mAb) for N-SMase, IL-1β, and TNF-α. After incubation with biotinylated monoclonal antibodies, streptavidin-HRP was added. Lastly, a colored reaction was produced using tetramethylbenzidine (TMB) as a substrate, and the reaction was monitored at 450 nm using a microplate reader. N-SMase, IL-1β, and TNF-α concentrations were determined by sample absorbance values via a standard curve constructed from established reference standards.
2.7. Statistical Analysis
Software from GraphPad Prism (version 9.0.0. GraphPad Software, Inc. La Jolla, CA,U.S.A.) and Sigma Stat (version 2.03. Systat Software, San Jose, CA, U.S.A.) were used to perform statistical analyses. P values less than 0.05 was the threshold for statistical significance. The legends of the figures and tables contain information about the statistical tests that were used for each measurement.
3. Results
3.1. Laboratory Values
The laboratory values of the participants are given in Table 1. Body weight (kg) and BMI of patients in the obese group were higher than those in other groups (p< 0.001). The pH and HCO3 values of DKA patients were lower than the control, obese and post-DKA groups (p< 0.05). pH values approached normal levels following treatment in the DKA group (post-DKA group) and showed no significant difference compared to control and obese groups (p> 0.05). Although HCO3 values increased following treatment in the DKA group (post-DKA group), it was still lower than in the control and obese groups (p<0.05). Urine ketone levels were higher in the DKA group than in the control, obese and post-DKA groups (p<0.05). Urine ketone levels decreased significantly after treatment in patients in the DKA group (post-DKA group) and did not differ significantly compared to the control and obese groups. Blood glucose levels were higher in the DKA group than in the other groups (p< 0.05). Although blood glucose levels decreased significantly after treatment (post-DKA group), they were still higher than in the control and obese groups (p< 0.05). BUN, creatinine, Na+ values were higher in the DKA group vs. other groups (p< 0.05) and reached normal levels in the post-DKA group after treatment. GFR decreased in the DKA group vs. other groups (p<0.05) and returned to normal levels in the post-DKA group after treatment. CRP values were higher in the obese, DKA and post-DKA groups compared to the control group (p< 0.05). HbA1c levels were higher in the DKA group than in the control and obese groups (p< 0.05). Triglyceride and very low-density lipoprotein (VLDL) cholesterol levels were higher in the DKA and obese groups vs. the control group (p< 0.05). The increase in triglyceride and VLDL was more pronounced in the DKA group. Albumin and Cl- levels were lower in the DKA group vs. control and obese groups. In the obese group, fT4, ALT, insulin and HOMA-IR values were higher than in the control group (p< 0.05), while HDL cholesterol values were lower when compared to the control group.
3.2. Serum β-Hydroxybutyrate and Lactate Levels
Serum β-OHB levels were measured in mM and reported as mean ± SD (Figure 1A). Measured β-OHB levels were higher in the DKA group (1.26 ± 0.31) compared to the control (0.12 ± 0.05), obese (0.10 ± 0.02) and post-DKA (0.58 ± 0.32) groups (p< 0.01). Although there was a significant decrease in β-OHB levels in the post-DKA group, it was still higher than in the control and obese groups (p<0.01). Serum lactate levels were measured in mmol/L and reported as mean ± SD (Figure 1B). Lactate values were higher in the DKA group (3.15 ± 1.03) than in the control (1.03 ± 0.27), obese (1.49 ± 0.82) and post-DKA (1.30 ± 0.44) groups (p< 0.01). Lactate levels decreased in the post-DKA group and did not differ significantly from the control and obese groups.
3.3. Serum TNF-α, IL-1β and N-SMase Values
Serum TNF-α levels were measured in ng/L and reported as mean ± SD (Figure 3A). Measured TNF-α values were higher in the obese group (100.20 ± 44.50) than in the control (19.46 ± 8.78), DKA (64.50 ± 14.32) and post-DKA (34.20 ± 11.62) groups (p< 0.01). TNF-α levels were higher in the DKA group than in the control group (p<0.01) and decreased significantly after treatment (post-DKA group) (p<0.001). Serum IL-1β levels were measured in pg/ml and reported as mean ± SD (Figure 3B). IL-1β values were higher in the obese group (203.94 ± 98.07) than in the control (49.72 ± 27.10), DKA (99.33 ± 54.77) and post-DKA (124.33 ± 53.36) groups (p< 0.05). IL-1β levels did not significantly differ in the control, DKA, and post-DKA groups. Serum N-SMase protein levels were measured in ng/L and reported as mean ± SD (Figure 3C). N-SMase values were lower in the DKA (395.22 ± 100.39) and post-DKA (300.78 ± 148.04) groups compared to the control (1105.73 ± 510.37) and obese (796.00 ± 428.76) groups (p<0.05).
3.4. Serum Sphingolipid Levels
Serum sphingolipid levels are given in Table 2. The amounts of 16:0 SM, 18:0 SM and 24:0 SM were lower in the DKA and post-DKA groups than in the control and obese groups (p<0.05). The measured serum sphingomyelins did not show a significant difference between the DKA and post-DKA groups. C18 CER, C20 CER, C22 CER and C24 CER levels were lower in the DKA and post-DKA groups than in the control and obese groups (p<0.05). There was no statistically significant change in the long- and short-chain SM and CER ratios in the groups included in the study. The measured serum ceramides did not show a significant difference between the DKA and post-DKA groups. S1P amounts were lower in the DKA and post-DKA groups than in the control and obese groups (p<0.05). The measured S1P levels did not show a significant difference between the DKA and post-DKA groups.
4. Discussion
Within the scope of our study, the effects of increased beta-hydroxybutyrate and lactate levels on circulating sphingomyelins, ceramides and neutral sphingomyelinase were investigated in patients diagnosed with DKA. To the best of our knowledge this is the first sphingolipidomic study performed in DKA patients. The data obtained was compared with measurements in both obese patients and healthy controls. In addition, ceramide and pro-inflammatory cytokine levels in the blood were compared at hospitalization and after treatment in patients diagnosed with DKA.
Alterations in laboratory values in DKA patients, as reported in Table 1, manifested through 2 main pathways. The first main pathway was hyperglycemia. Serum glucose increases in DKA because of excessive glucose release through glycogenolysis and gluconeogenesis and a decrease in glucose uptake of peripheral tissues [11,12]. In case of hyperglycemia, glucosuria develops because the renal threshold (160-180 mg/dL) is exceeded [11,12]. Osmotic diuresis and loss of volume occur due to glucosuria. As glucose spills into the urine, it drags water and electrolytes, including sodium, along with it, resulting in significant sodium loss and decreased serum Na+ concentrations as reported herein [11,12]. Due to the increase in dehydration, the plasma glucose concentration increases even more, which leads to a further increase in plasma osmolality. The increase in plasma osmolality causes fluid to flow from tissues into the extracellular space (ECF) via osmosis. This dilution of extracellular sodium concentration leads to dilutional hyponatremia. For every 100 mg/dL increase in blood glucose above normal, serum Na+ concentration decreases by approximately 1.6 to 2.4 mmol/L.
The second main pathway leading to altered blood chemistry in DKA patients was lipolysis. DKA is often accompanied by increased secretion of stress hormones like epinephrine, cortisol, and glucagon [11,12]. These hormones stimulate glycolysis and lipolysis, leading to enhanced production of pyruvate, which can be converted to lactate under anaerobic conditions. We have measured increased lactate levels in DKA patients (Figure 1B). Elevated levels of stress hormones in DKA also stimulate hormone-sensitive lipase in adipose tissue [11,12]. This enzyme promotes the release of free fatty acids (FFAs), further increasing their availability in the blood. The liver takes up excess FFAs and converts them into triglycerides via esterification and enhances VLDL production, which transports triglycerides from the liver to the bloodstream [11,12]. There was an increase in both serum triglyceride and VLDL levels in patients with DKA. Acetyl-CoA, which is released in excess due to the increase in fatty acid oxidation, enters ketone production and causes an increase in acidic ketone bodies such as beta-hydroxybutyrate, as reported herein (Figure 1A). An increase in the amount of ketone bodies in the blood of DKA patients caused metabolic acidosis as evidenced with decreased blood pH and HCO3 levels. Since the number of ketones in the blood exceeds the threshold value, it is excreted from the kidneys as observed herein. Ketones are excreted in the urine along with sodium to maintain electrical neutrality, contributing to further sodium depletion [11,12].
Elevated CRP and TNF-α in DKA and obese patients (Table 1 and Figure 3) reflect the underlying inflammatory state and may contribute to insulin resistance by interfering with insulin signaling pathways [18]. The observed increase in TNF-α in DKA patients is likely to be a part of the systemic inflammatory response triggered by metabolic and hormonal disturbances. Insulin normally suppresses the production of pro-inflammatory cytokines like TNF-α [19]. As discussed above, unchecked lipolysis and increased release of FFAs in DKA can activate macrophages and other immune cells to produce TNF-α [20]. High levels of glucagon, epinephrine, and cortisol in DKA also stimulate immune system activity and promote the release of inflammatory mediators, including TNF-α [11]. Increased production of reactive oxygen species (ROS) due to hyperglycemia and ketosis [21]. can also activate signaling pathways, such as nuclear factor-kappa B (NF-κB), which upregulates TNF-α expression [22]. Ketone bodies such as β-hydroxybutyrate may directly activate monocytes and macrophages, contributing to TNF-α secretion [23].
Chronic low-grade inflammation is a defining feature of obesity, and high levels of TNF-α and CRP are caused by several reasons, including immunological activation, metabolic abnormalities, and dysfunctional adipose tissue. Adipose tissue’s resident immune cells, including macrophages, and adipocytes both generate pro-inflammatory cytokines, such as TNF-α [24]. These cytokines, in turn, stimulate the liver to produce CRP, a marker of systemic inflammation, through activation of IL-6 [24]. TNF-α directly impairs insulin signalling by increasing serine phosphorylation of insulin receptor substrates (IRS), promoting insulin resistance [25]. Insulin resistance itself enhances lipolysis and FFA release, and elevated FFAs in obesity activate toll-like receptors (TLRs) on immune cells [20], triggering inflammatory pathways like NF-κB, which increases TNF-α production.
We have measured significantly lower amounts of SMs and CERs in DKA patients (Table 2). As indicated in the introduction, ketogenic diet has been shown to lower ceramide levels in humans [16] and β-OHB also causes a decrease in ceramides in rat muscle cells [17]. As previously mentioned, insulin insufficiency causes uncontrolled lipolysis in DKA, which releases a significant quantity of FFAs into the bloodstream. The liver may mainly use these FFAs for ketogenesis, which would limit their availability for the synthesis of ceramides and sphingolipids [26].
Ceramides are synthesized through pathways involving serine palmitoyltransferase (SPT) and subsequent steps that depend on the availability of fatty acid substrates. In DKA, the metabolic priority is shifted toward ketogenesis rather than complex lipid synthesis, potentially downregulating ceramide production [26]. The impact of insulin deficiency on the distribution of sphingolipids in muscle subcellular compartments were studied in C57BL/6 mice with streptozotocin-induced diabetes [27]. In the referenced study, FFA was elevated in both the total homogenates and sarcoplasmic fraction in insulin deficiency. After insulin therapy, plasma FFA levels returned to normal levels. Insulin deficiency had a significant effect on sphingolipid content and composition in the sarcoplasmic fraction, but less in the mitochondrial fraction [27].
De novo sphingomyelin biosynthesis begins by the condensation of serine and palmitoyl CoA via the action of SPT. The 18-carbon sphingosine base forms by 16 carbons from palmitic acid and 2 from serine. The addition of a fatty acid group leads to the formation of CER followed by synthesis of SM via subjoining of a phosphocholine headgroup [28]. The rate-limiting and regulating step in the de novo synthesis of ceramides appears to be catalyzed by SPT [28]. Serine palmitoyltransferase activity is positively correlated with tissue sphingolipid levels [29] and rises in hepatomas and liver regeneration when sphingolipid levels rise [30]. The pH profile of keratinocyte SPT activity revealed an alkaline pH maximum of 8.2 ± 0.4 [31] which was equivalent to that seen in rat liver microsomes [32]. The acidic environment in DKA may thus affect SPT enzymatic activity, involved in both CER and SM formation, potentially reducing their synthesis or promoting their degradation. Indeed, we observed that total SM and CER levels were significantly inversely correlated with β-OHB and lactate levels. Restoring normal metabolic conditions with insulin therapy and hydration helped reestablish CER and SM levels.
The direct result of sphingomyelin hydrolysis by sphingomyelinases is the production of ceramide and free phosphocholine [33]. The mammalian sphingomyelinases fall into three major categories based upon their pH optimum: acid sphingomyelinase, alkaline sphingomyelinase, and the N-SMase [33]. These three groups of enzymes have different subcellular distributions. Alkaline sphingomyelinase, is expressed in the intestine and liver, plays a role in the digestion of dietary sphingomyelin [34]. The primary regulators of SM catabolism in most tissues are N-SMase and acid sphingomyelinase, which are widely expressed. N-SMase overexpression, causes degradation of sphingomyelin into ceramide [34]. We have observed decreased protein levels of N-SMase in DKA (Figure 3C) and found that protein levels of N-SMase were significantly positively correlated with total SM levels (Figure 4E). Currently, there is limited direct evidence linking increased total SM levels to upregulation of N-SMase protein levels. However, N-SMase activity can be influenced by regulatory factors such as oxidative stress, cytokines, and cellular stress responses [35]. Some studies suggest that substrate abundance like increased SM might influence enzymatic activity [35], but the relationship with protein expression levels of N-SMase is less straightforward and often depends on transcriptional and post-translational regulatory mechanisms [36]. It has been demonstrated that the chemotherapeutic drugs Daunorubicin and Camptothecin activate the promoter via certain transcription factors, hence stimulating N-SMase transcription in MCF-7 breast cancer cells and K562 leukemia cells. 147 base pairs upstream of exon 1 were found to represent the key promoter region needed for this activation. [37]. It was also shown that all-trans retinoic acid uses the similar method to cause N-SMase transcriptional activation [37].
We observed that sphingosine-1-phosphate (S1P) levels were decrease in DKA and that this decrease was significantly inversely correlated with β-OHB and lactate levels. The phosphorylation of sphingosine to S1P is catalyzed by sphingosine kinases (SphKs). Oxidative stress and decreased pH can suppress sphingosine kinase activity, reducing S1P production from sphingosine [38]. During DKA, cells prioritize ketone body production and fatty acid oxidation. This shift in lipid metabolism may also reduce the flux through sphingolipid biosynthesis pathways, indirectly affecting S1P levels. The sphingosine backbone irreversibly breaks down when S1P is cleaved by S1P lyase (SPL) [38]. Ceramide and S1P are kept in a dynamic balance within cells, which affects how the cells react to stress. By reducing the proliferative S1P signal, SPL can tip the scales in favor of cell death. Therefore, SPL is essential for preserving lipid homeostasis and proper cell fate responses [39].
In conclusion, this study highlights the significant metabolic and inflammatory alterations observed in DKA and its resolution. Elevated levels of β-OHB, lactate, and pro-inflammatory cytokines, particularly TNF-α, were prominent during DKA, with partial normalization following treatment. The study also revealed reduced levels of sphingolipids, including SMs and CERs, as well as N-SMase activity, in DKA and post-DKA states. The observed correlations between metabolic markers, sphingolipids, and N-SMase provide insights into the complex biochemical interplay underlying DKA. These findings suggest potential pathways for therapeutic intervention, emphasizing the importance of targeting sphingolipid metabolism and inflammation in managing DKA and its associated complications.
The study however also has several potential limitations. The study included only 33 participants which were initially divided into three groups. The limited sample size may reduce the generalizability of the findings and affect the statistical power. The study focuses on acute DKA and post-DKA states but does not evaluate long-term changes in sphingolipid metabolism or cytokine levels, which might provide additional insights. Variations in underlying factors such as disease duration, glycemic control, and treatment regimens among participants could introduce variability. The study identifies correlations but does not investigate mechanisms linking sphingolipid metabolism, inflammation, and metabolic markers. The study excluded participants taking specific medications or supplements but did not account for other dietary or pharmacological factors that might impact sphingolipid metabolism. Addressing these limitations in future research would strengthen the findings and expand the understanding of DKA’s biochemical and therapeutic landscape.
Author Contributions
IA, designed the study, enrolled the patients, performed the clinical evaluations and revised the manuscript critically for intellectual content; TÇ, carried out the ELISA measurements and analyzed the data; TU, enrolled the patients and performed the clinical evaluations. VZ, enrolled the patients and performed the clinical evaluations. MA, designed the study, performed LC-MS/MS analysis, obtained the funding, drafted and wrote the manuscript. All authors approved the final version of the manuscript.
Funding
This work was supported by a grant from Akdeniz University Research Foundation (grant no # TTU-2023-6470.
Institutional Review Board Statement
The study was conducted in accordance with the Declaration of Helsinki, and approved by the Akdeniz University Clinical Research Ethics Committee (KAEK-752 Date: 27.09.2023).
Informed Consent Statement
Informed consent was obtained from all subjects involved in the study.
Data Availability Statement
Data obtained and analyzed in the work are not publicly available due to ethical limitations involving human subjects but are available from the corresponding author on reasonable request.
Conflicts of Interest
The authors declare no competing interests.
Abbreviations
ALT, alanine aminotransferase; AST, aspartate aminotransferase; BMI, body mass index; CERs, ceramides; CRP, C-reactive protein; DKA, diabetic ketoacidosis; ECF, extracellular space; ELISA, enzyme-linked immunosorbent assay; FFAs, free fatty acids; fT4, free thyroxine; GLUT-4, glucose transporter type 4; IL-1β, interleukin 1 beta; IL-6, interleukin 6; IRS, insulin receptor substrates; LC-MS/MS, tandem mass spectrometry; NF-κB, nuclear factor-kappa B; N-SMase, neutral sphingomyelinase; ROS, reactive oxygen species; SMs, sphingomyelins; SphKs, sphingosine kinases; SPL, S1P lyase; SPT, serine palmitoyltransferase; TLRs, toll-like receptors; TMB, tetramethylbenzidine; TNF-α, tumor necrosis factor alpha; TSH, thyroid stimulating hormone; VLDL, very low-density lipoprotein; β-OHB, β-hydroxybutyrate;
References
- Lee, M.; Lee, S.Y.; Bae, Y.-S. Functional roles of sphingolipids in immunity and their implication in disease. Exp. Mol. Med. 2023, 55, 1110–1130. [Google Scholar] [CrossRef] [PubMed]
- Arana, L.; Gangoiti, P.; Ouro, A.; Trueba, M.; Gómez-Muñoz, A. Ceramide and ceramide 1-phosphate in health and disease. Lipids Heal. Dis. 2010, 9, 15–15. [Google Scholar] [CrossRef] [PubMed]
- Gomez-Larrauri, A.; Presa, N.; Dominguez-Herrera, A.; Ouro, A.; Trueba, M.; Gomez-Muñoz, A. Role of bioactive sphingolipids in physiology and pathology. Essays Biochem. 2020, 64, 579–589. [Google Scholar] [CrossRef]
- Özer, H.; Aslan, I.; Oruç, M.T.; Çöpelci, Y.; Afşar, E.; Kaya, S.; Aslan, M. Early postoperative changes of sphingomyelins and ceramides after laparoscopic sleeve gastrectomy. Lipids Heal. Dis. 2018, 17, 1–11. [Google Scholar] [CrossRef]
- Long, S.D.; Pekala, P.H. Lipid mediators of insulin resistance: ceramide signalling down-regulates GLUT4 gene transcription in 3T3-L1 adipocytes. Biochem. J. 1996, 319, 179–184. [Google Scholar] [CrossRef] [PubMed]
- Powell, D.J.; Hajduch, E.; Kular, G.; Hundal, H.S. Ceramide Disables 3-Phosphoinositide Binding to the Pleckstrin Homology Domain of Protein Kinase B (PKB)/Akt by a PKCζ-Dependent Mechanism. Mol. Cell. Biol. 2003, 23, 7794–7808. [Google Scholar] [CrossRef] [PubMed]
- Kawai, T.; Autieri, M.V.; Scalia, R. Adipose tissue inflammation and metabolic dysfunction in obesity. Am. J. Physiol. Physiol. 2020, 320, C375–C391. [Google Scholar] [CrossRef]
- Kojta, I.; Chacińska, M.; Błachnio-Zabielska, A.U. Obesity, Bioactive Lipids, and Adipose Tissue Inflammation in Insulin Resistance. Nutrients 2020, 12, 1305. [Google Scholar] [CrossRef]
- Delcheva, G.; Stefanova, K.; Stankova, T. Ceramides—Emerging Biomarkers of Lipotoxicity in Obesity, Diabetes, Cardiovascular Diseases, and Inflammation. Diseases 2024, 12, 195. [Google Scholar] [CrossRef]
- Hammerschmidt, P.; Brüning, J.C. Contribution of specific ceramides to obesity-associated metabolic diseases. Cell. Mol. Life Sci. 2022, 79, 1–39. [Google Scholar] [CrossRef]
- Gosmanov AR, Gosmanova EO, Kitabchi AE. Hyperglycemic Crises: Diabetic Ketoacidosis and Hyperglycemic Hyperosmolar State. 2021 May 9. In: Feingold KR, Anawalt B, Blackman MR, Boyce A, Chrousos G, Corpas E, de Herder WW, Dhatariya K, Dungan K, Hofland J, Kalra S, Kaltsas G, Kapoor N, Koch C, Kopp P, Korbonits M, Kovacs CS, Kuohung W, Laferrère B, Levy M, McGee EA, McLachlan R, New M, Purnell J, Sahay R, Shah AS, Singer F, Sperling MA, Stratakis CA, Trence DL, Wilson DP, editors. Endotext [Internet]. South Dartmouth (MA): MDText.com, Inc.; 2000–. PMID: 25905280.
- Elendu, C.; David, J.A.M.; Udoyen, A.-O.M.; Egbunu, E.O.M.; Ogbuiyi-Chima, I.C.M.; Unakalamba, L.O.M.; Temitope, A.I.M.; Ibhiedu, J.O.M.; Ibhiedu, A.O.M.; Nwosu, P.U.M.; et al. Comprehensive review of diabetic ketoacidosis: an update. Ann. Med. Surg. 2023, 85, 2802–2807. [Google Scholar] [CrossRef]
- Kolb, H.; Kempf, K.; Röhling, M.; Lenzen-Schulte, M.; Schloot, N.C.; Martin, S. Ketone bodies: from enemy to friend and guardian angel. BMC Med. 2021, 19, 1–15. [Google Scholar] [CrossRef] [PubMed]
- Bendridi, N.; Selmi, A.; Balcerczyk, A.; Pirola, L. Ketone Bodies as Metabolites and Signalling Molecules at the Crossroad between Inflammation and Epigenetic Control of Cardiometabolic Disorders. Int. J. Mol. Sci. 2022, 23, 14564. [Google Scholar] [CrossRef]
- Ciaffi, J.; Mitselman, D.; Mancarella, L.; Brusi, V.; Lisi, L.; Ruscitti, P.; Cipriani, P.; Meliconi, R.; Giacomelli, R.; Borghi, C.; et al. The Effect of Ketogenic Diet on Inflammatory Arthritis and Cardiovascular Health in Rheumatic Conditions: A Mini Review. Front. Med. 2021, 8, 792846. [Google Scholar] [CrossRef] [PubMed]
- Kang, C.M.; Yun, B.; Kim, M.; Song, M.; Kim, Y.-H.; Lee, S.H.; Lee, H.; Lee, S.-M. Postoperative serum metabolites of patients on a low carbohydrate ketogenic diet after pancreatectomy for pancreatobiliary cancer: a nontargeted metabolomics pilot study. Sci. Rep. 2019, 9, 1–11. [Google Scholar] [CrossRef] [PubMed]
- Parker, B.A.; Walton, C.M.; Carr, S.T.; Andrus, J.L.; Cheung, E.C.K.; Duplisea, M.J.; Wilson, E.K.; Draney, C.; Lathen, D.R.; Kenner, K.B.; et al. β-Hydroxybutyrate Elicits Favorable Mitochondrial Changes in Skeletal Muscle. Int. J. Mol. Sci. 2018, 19, 2247. [Google Scholar] [CrossRef]
- Chen, L.; Chen, R.; Wang, H.; Liang, F. Mechanisms Linking Inflammation to Insulin Resistance. Int. J. Endocrinol. 2015, 2015, 1–9. [Google Scholar] [CrossRef] [PubMed]
- Sun, Q.; Li, J.; Gao, F. New insights into insulin: The anti-inflammatory effect and its clinical relevance. World J. Diabetes 2014, 5, 89–96. [Google Scholar] [CrossRef]
- Alvarez-Curto, E.; Milligan, G. Metabolism meets immunity: The role of free fatty acid receptors in the immune system. Biochem. Pharmacol. 2016, 114, 3–13. [Google Scholar] [CrossRef]
- Jain, S.K.; McVie, R.; Bocchini, J.A. Hyperketonemia (ketosis), oxidative stress and type 1 diabetes. Pathophysiology 2006, 13, 163–170. [Google Scholar] [CrossRef]
- Gloire, G.; Legrand-Poels, S.; Piette, J. NF-κB activation by reactive oxygen species: Fifteen years later. Biochem. Pharmacol. 2006, 72, 1493–1505. [Google Scholar] [CrossRef]
- Neudorf, H.; Durrer, C.; Myette-Cote, E.; Makins, C.; O'Malley, T.; Little, J.P. Oral Ketone Supplementation Acutely Increases Markers of NLRP3 Inflammasome Activation in Human Monocytes. Mol. Nutr. Food Res. 2019, 63, e1801171. [Google Scholar] [CrossRef]
- Savulescu-Fiedler, I.; Mihalcea, R.; Dragosloveanu, S.; Scheau, C.; Baz, R.O.; Caruntu, A.; Scheau, A.-E.; Caruntu, C.; Benea, S.N. The Interplay between Obesity and Inflammation. Life 2024, 14, 856. [Google Scholar] [CrossRef]
- Zick, Y. Ser/Thr Phosphorylation of IRS Proteins: A Molecular Basis for Insulin Resistance. Sci. STKE 2005, 2005, pe4–pe4. [Google Scholar] [CrossRef]
- Saponaro, C.; Gaggini, M.; Carli, F.; Gastaldelli, A. The Subtle Balance between Lipolysis and Lipogenesis: A Critical Point in Metabolic Homeostasis. Nutrients 2015, 7, 9453–9474. [Google Scholar] [CrossRef]
- Zabielski, P.; Blachnio-Zabielska, A.; Lanza, I.R.; Gopala, S.; Manjunatha, S.; Jakaitis, D.R.; Persson, X.-M.; Gransee, J.; Klaus, K.A.; Schimke, J.M.; et al. Impact of insulin deprivation and treatment on sphingolipid distribution in different muscle subcellular compartments of streptozotocin-diabetic C57Bl/6 mice. Am. J. Physiol. Metab. 2014, 306, E529–E542. [Google Scholar] [CrossRef]
- Merrill, A.H.; Jones, D. An update of the enzymology and regulation of sphingomyelin metabolism. Biochim. et Biophys. Acta (BBA) Lipids Lipid Metab. 1990, 1044, 1–12. [Google Scholar] [CrossRef]
- Merrill, A.H.; Nixon, D.W.; Williams, R.D. Activities of serine palmitoyltransferase (3-ketosphinganine synthase) in microsomes from different rat tissues. J. Lipid Res. 1985, 26, 617–622. [Google Scholar] [CrossRef]
- Williams, R.; Nixon, D.; Merrill, A. Comparison of serine palmitoyltransferase in Morris hepatoma 7777 and rat liver. Cancer Res. 1984, 44, 1918–1923. [Google Scholar]
- Holleran, W.; Williams, M.; Gao, W.; Elias, P. Serine-palmitoyl transferase activity in cultured human keratinocytes. J. Lipid Res. 1990, 31, 1655–1661. [Google Scholar] [CrossRef]
- Williams, R.D.; Wang, E.; Merrill, A.H. Enzymology of long-chain base synthesis by liver: Characterization of serine palmitoyltransferase in rat liver microsomes. Arch. Biochem. Biophys. 1984, 228, 282–291. [Google Scholar] [CrossRef]
- Bienias, K.; Fiedorowicz, A.; Sadowska, A.; Prokopiuk, S.; Car, H. Regulation of sphingomyelin metabolism. Pharmacol. Rep. 2016, 68, 570–581. [Google Scholar] [CrossRef]
- Chatterjee, S. Neutral sphingomyelinase: past, present and future. Chem. Phys. Lipids 1999, 102, 79–96. [Google Scholar] [CrossRef]
- Clarke, C.J.; Hannun, Y.A. Neutral sphingomyelinases and nSMase2: Bridging the gaps. Biochim. et Biophys. Acta (BBA) - Biomembr. 2006, 1758, 1893–1901. [Google Scholar] [CrossRef]
- Shamseddine, A.A.; Airola, M.V.; Hannun, Y.A. Roles and regulation of neutral sphingomyelinase-2 in cellular and pathological processes. Adv. Biol. Regul. 2015, 57, 24–41. [Google Scholar] [CrossRef]
- Ito, H.; Tanaka, K.; Hagiwara, K.; Kobayashi, M.; Hoshikawa, A.; Mizutani, N.; Takagi, A.; Kojima, T.; Sobue, S.; Ichihara, M.; et al. Transcriptional regulation of neutral sphingomyelinase 2 in all-trans retinoic acid-treated human breast cancer cell line, MCF-7. J. Biochem. 2012, 151, 599–610. [Google Scholar] [CrossRef]
- Alemany, R.; van Koppen, C.J.; Danneberg, K.; ter Braak, M.; zu Heringdorf, D.M. Regulation and functional roles of sphingosine kinases. Naunyn-Schmiedeberg's Arch. Pharmacol. 2007, 374, 413–428. [Google Scholar] [CrossRef] [PubMed]
- Serra, M.; Saba, J.D. Sphingosine 1-phosphate lyase, a key regulator of sphingosine 1-phosphate signaling and function. Adv. Enzym. Regul. 2009, 50, 349–362. [Google Scholar] [CrossRef]
Figure 1.
Box-plot graph of serum β-hydroxybutyrate and lactate levels. DKA, diabetic ketoacidosis. The 25th percentile is indicated by the box’s boundary that is closest to zero, the median is indicated by the line inside the box, and the 75th percentile is indicated by the box’s boundary that is furthest from zero. The 90th and 10th percentiles are indicated by whiskers above and below the box. Data represents results from 9-12 measurements. A) Statistical analysis of β-hydroxybutyrate levels was performed using one-way ANOVA, with group differences assessed by Tukey’s multiple comparison test. Difference between DKA and post-DKA groups was determined by paired t test. *, p<0.01, vs. control and obese groups. **, p<0.01, vs. DKA. B) Statistical analysis of lactate levels was performed using Kruskal-Wallis test, with group differences assessed by Dunn’s multiple comparison test. Difference between DKA and post-DKA groups was determined by paired t test. *, p<0.01, vs. control and obese groups. **, p<0.01, vs. DKA.
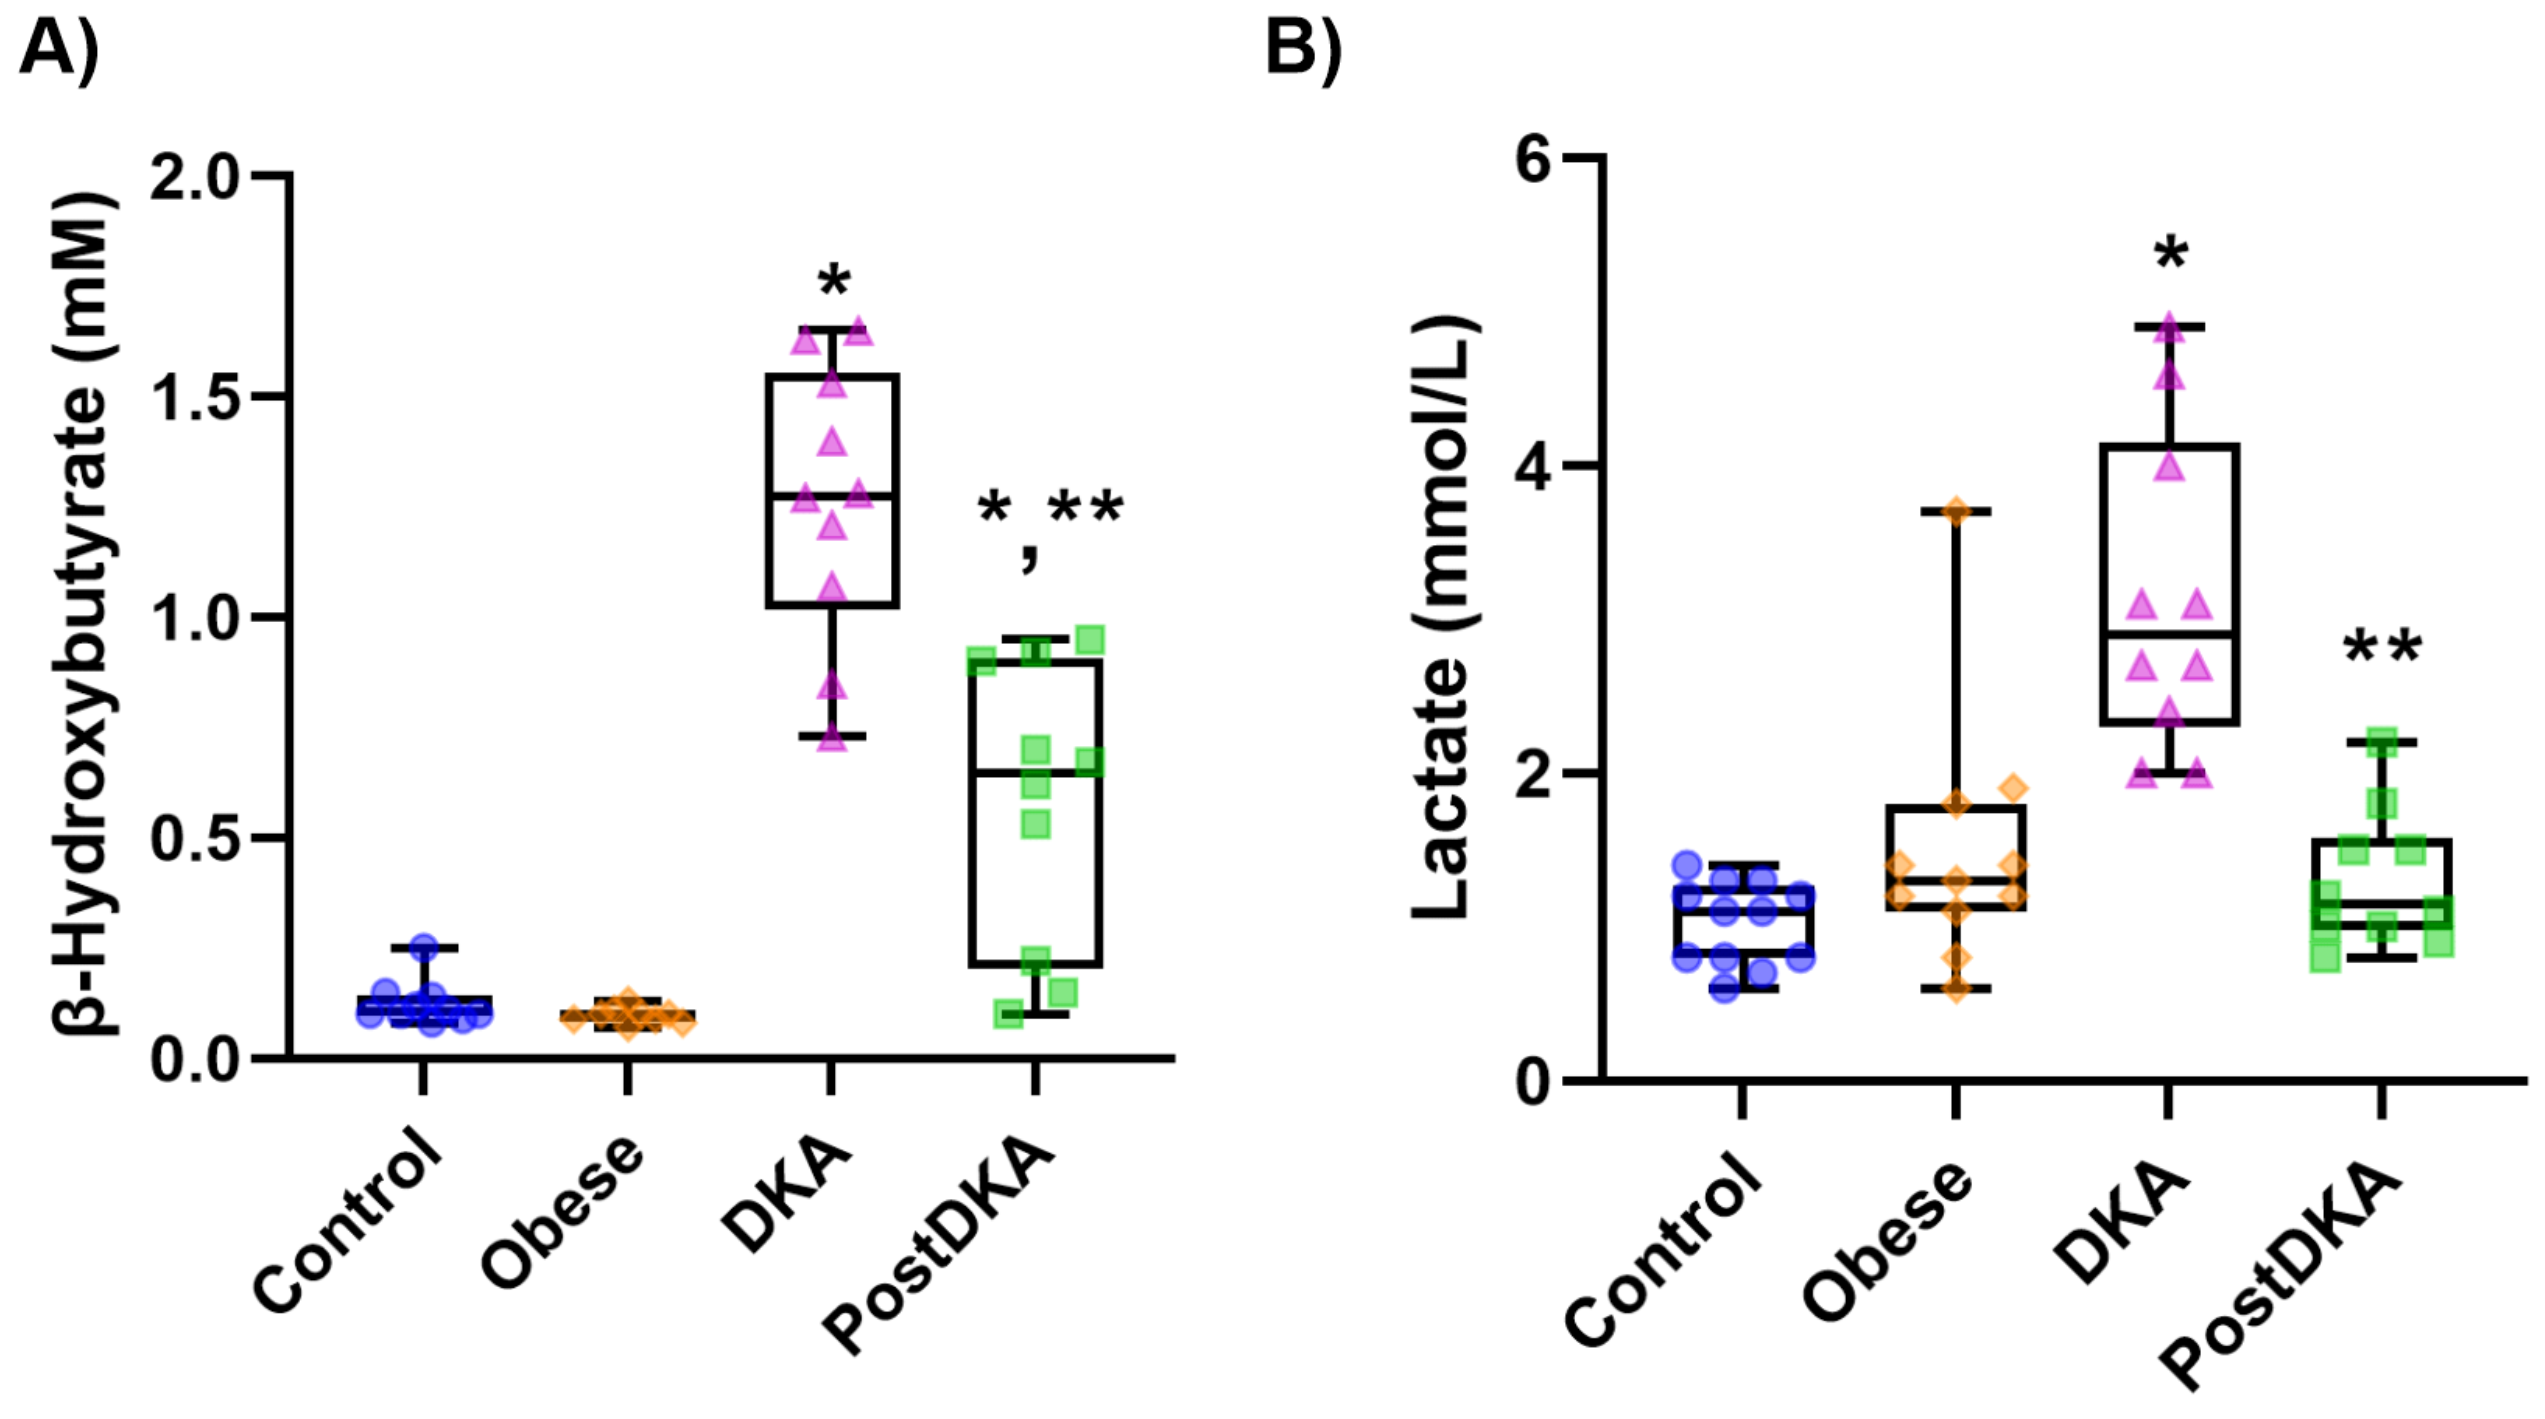
Figure 2.
Correlation coefficients and scatter plots between laboratory values and β-hydroxybutyrate and lactate levels. Linear regression analysis was used to assess correlations. Statistical significance was established at a p-value of less than 0.01.
Figure 2.
Correlation coefficients and scatter plots between laboratory values and β-hydroxybutyrate and lactate levels. Linear regression analysis was used to assess correlations. Statistical significance was established at a p-value of less than 0.01.
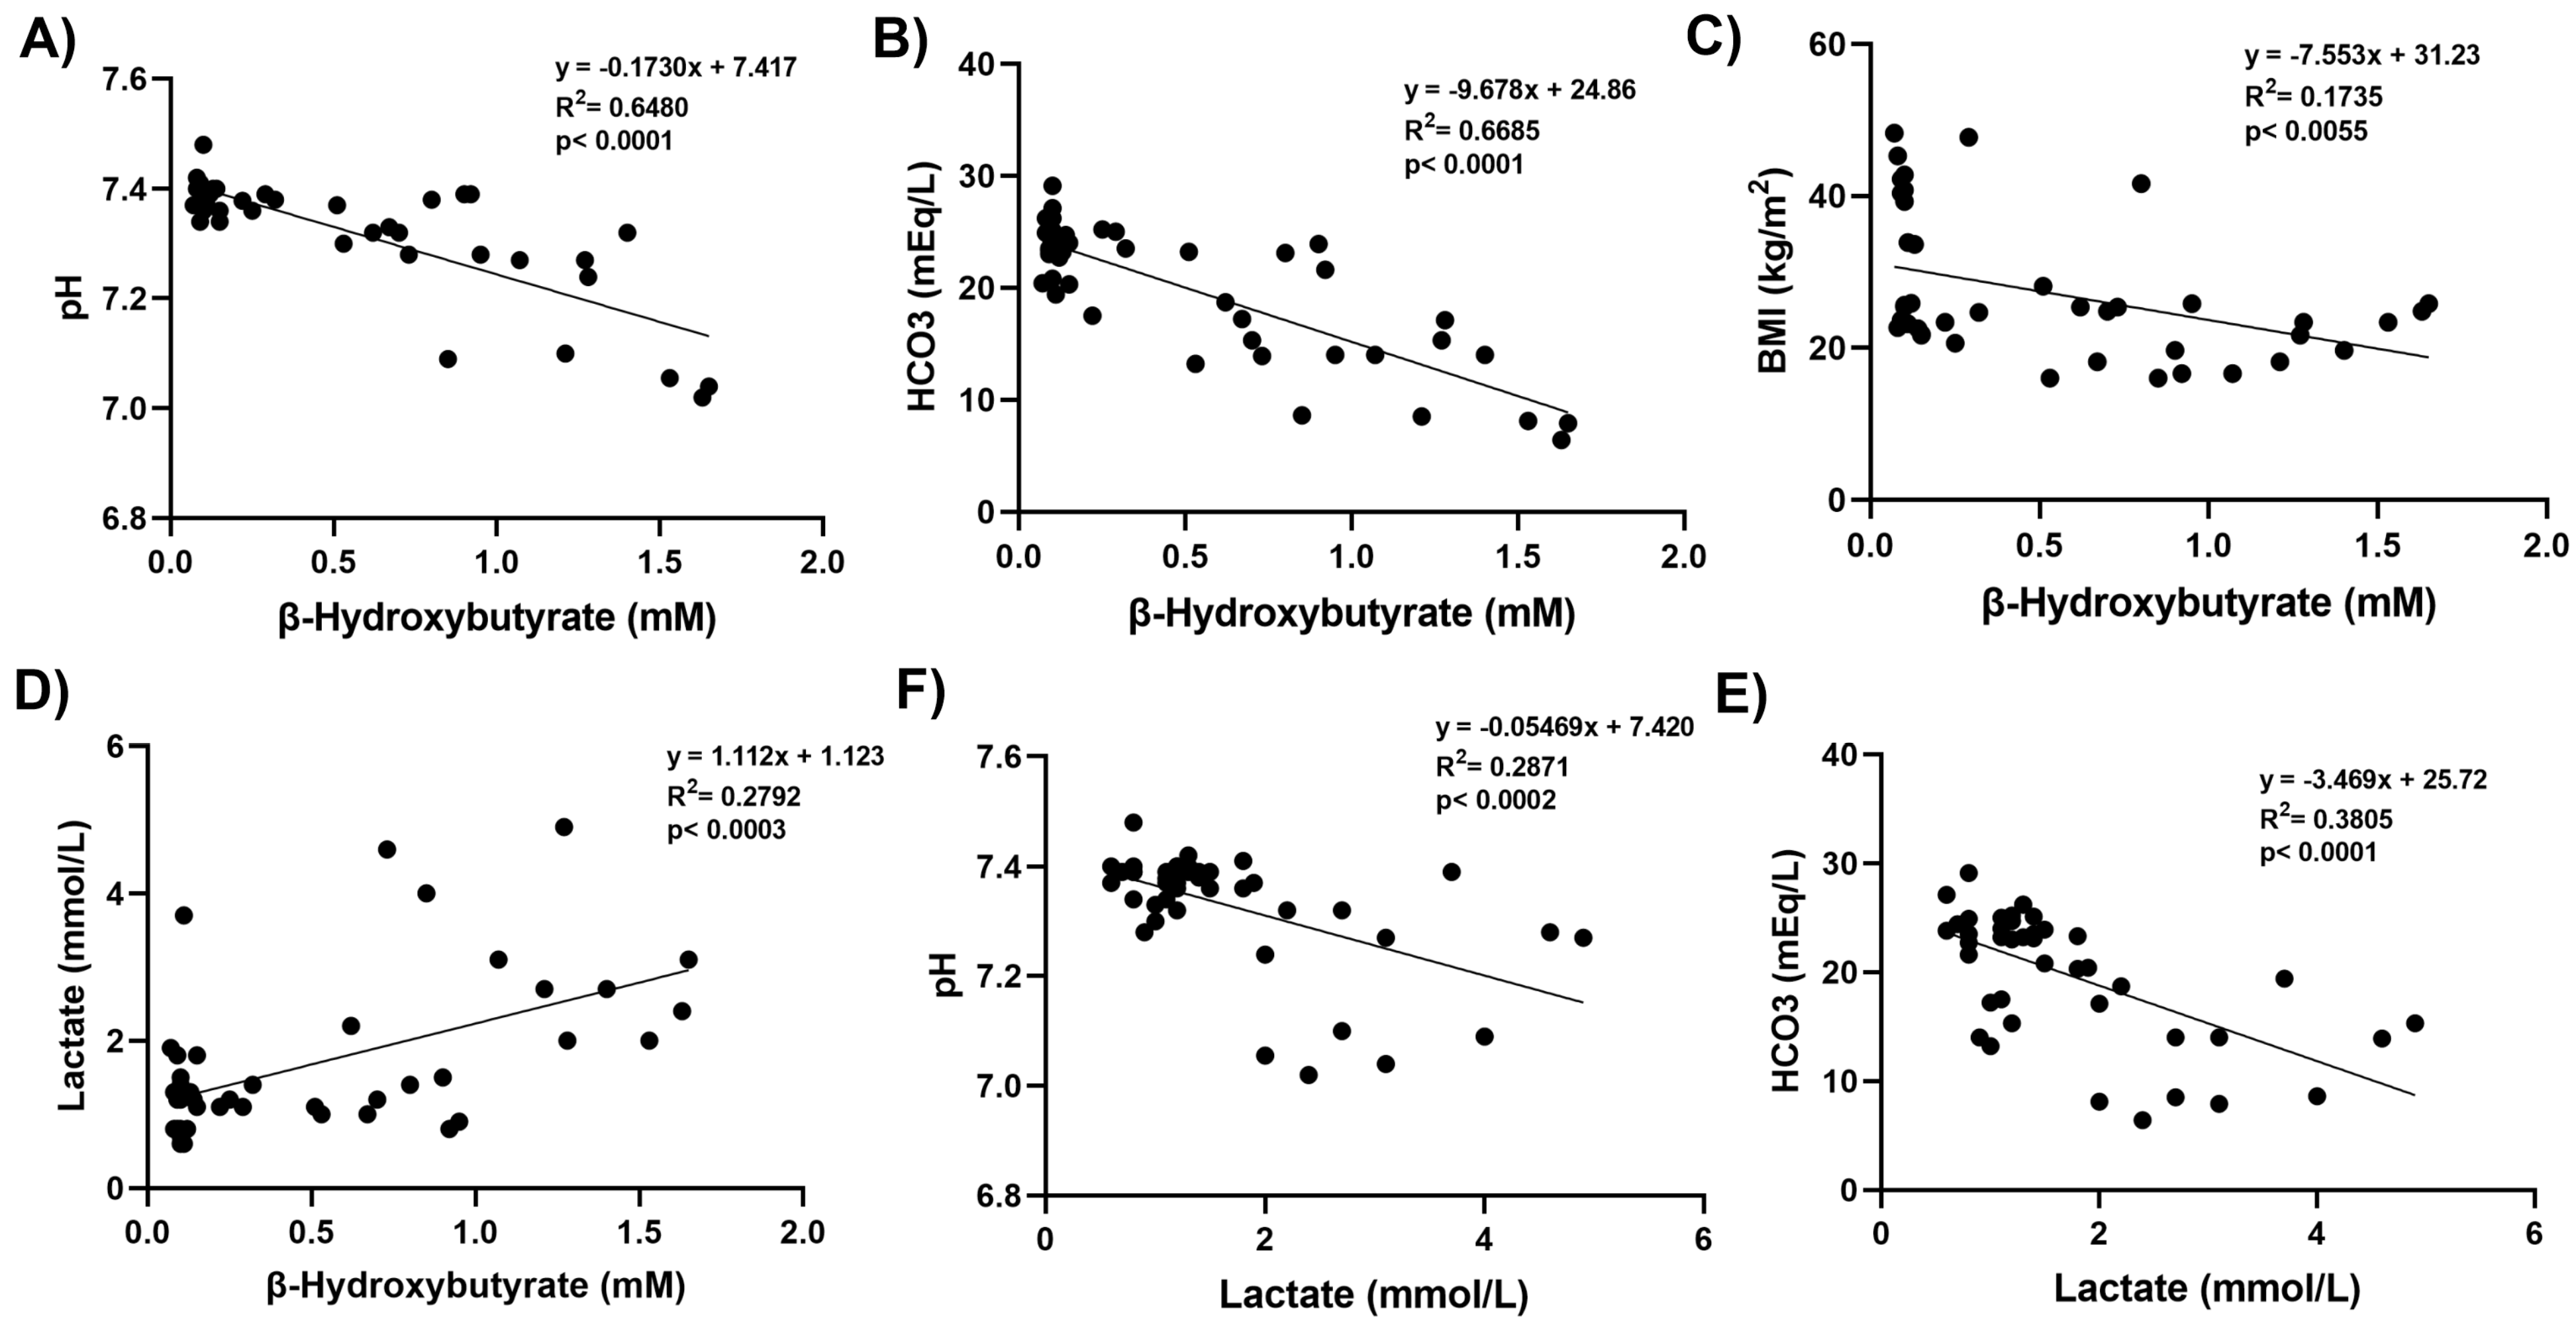
Figure 3.
Box-plot graph of serum TNF-α, IL-1β and N-SMase levels. DKA, diabetic ketoacidosis. The 25th percentile is indicated by the box’s boundary that is closest to zero, the median is indicated by the line inside the box, and the 75th percentile is indicated by the box’s boundary that is furthest from zero. The 90th and 10th percentiles are indicated by whiskers above and below the box. A) The data represent results from 10-12 independent experiments. Statistical analysis was performed using one-way ANOVA, with group differences assessed by Tukey’s multiple comparison test. Difference between DKA and post-DKA groups was determined by paired t test. *, p<0.01, vs. control, DKA and post-DKA. **, p<0.01 vs. control. #, p<0.001 vs. DKA. B) The data represent results from 10-12 independent experiments. Statistical analysis was performed using one-way ANOVA, with group differences assessed by Tukey’s multiple comparison test. Difference between DKA and post-DKA groups was determined by paired t test. *, p<0.05, vs. control, DKA and post-DKA. #, p<0.05 vs. DKA. C) The data represent results from 9-11 independent experiments. Statistical analysis was performed using Kruskal Wallis test, with group differences assessed by Dunn’s multiple comparison test. *, p<0.01, vs. control group. #, p<0.05, vs. obese group.
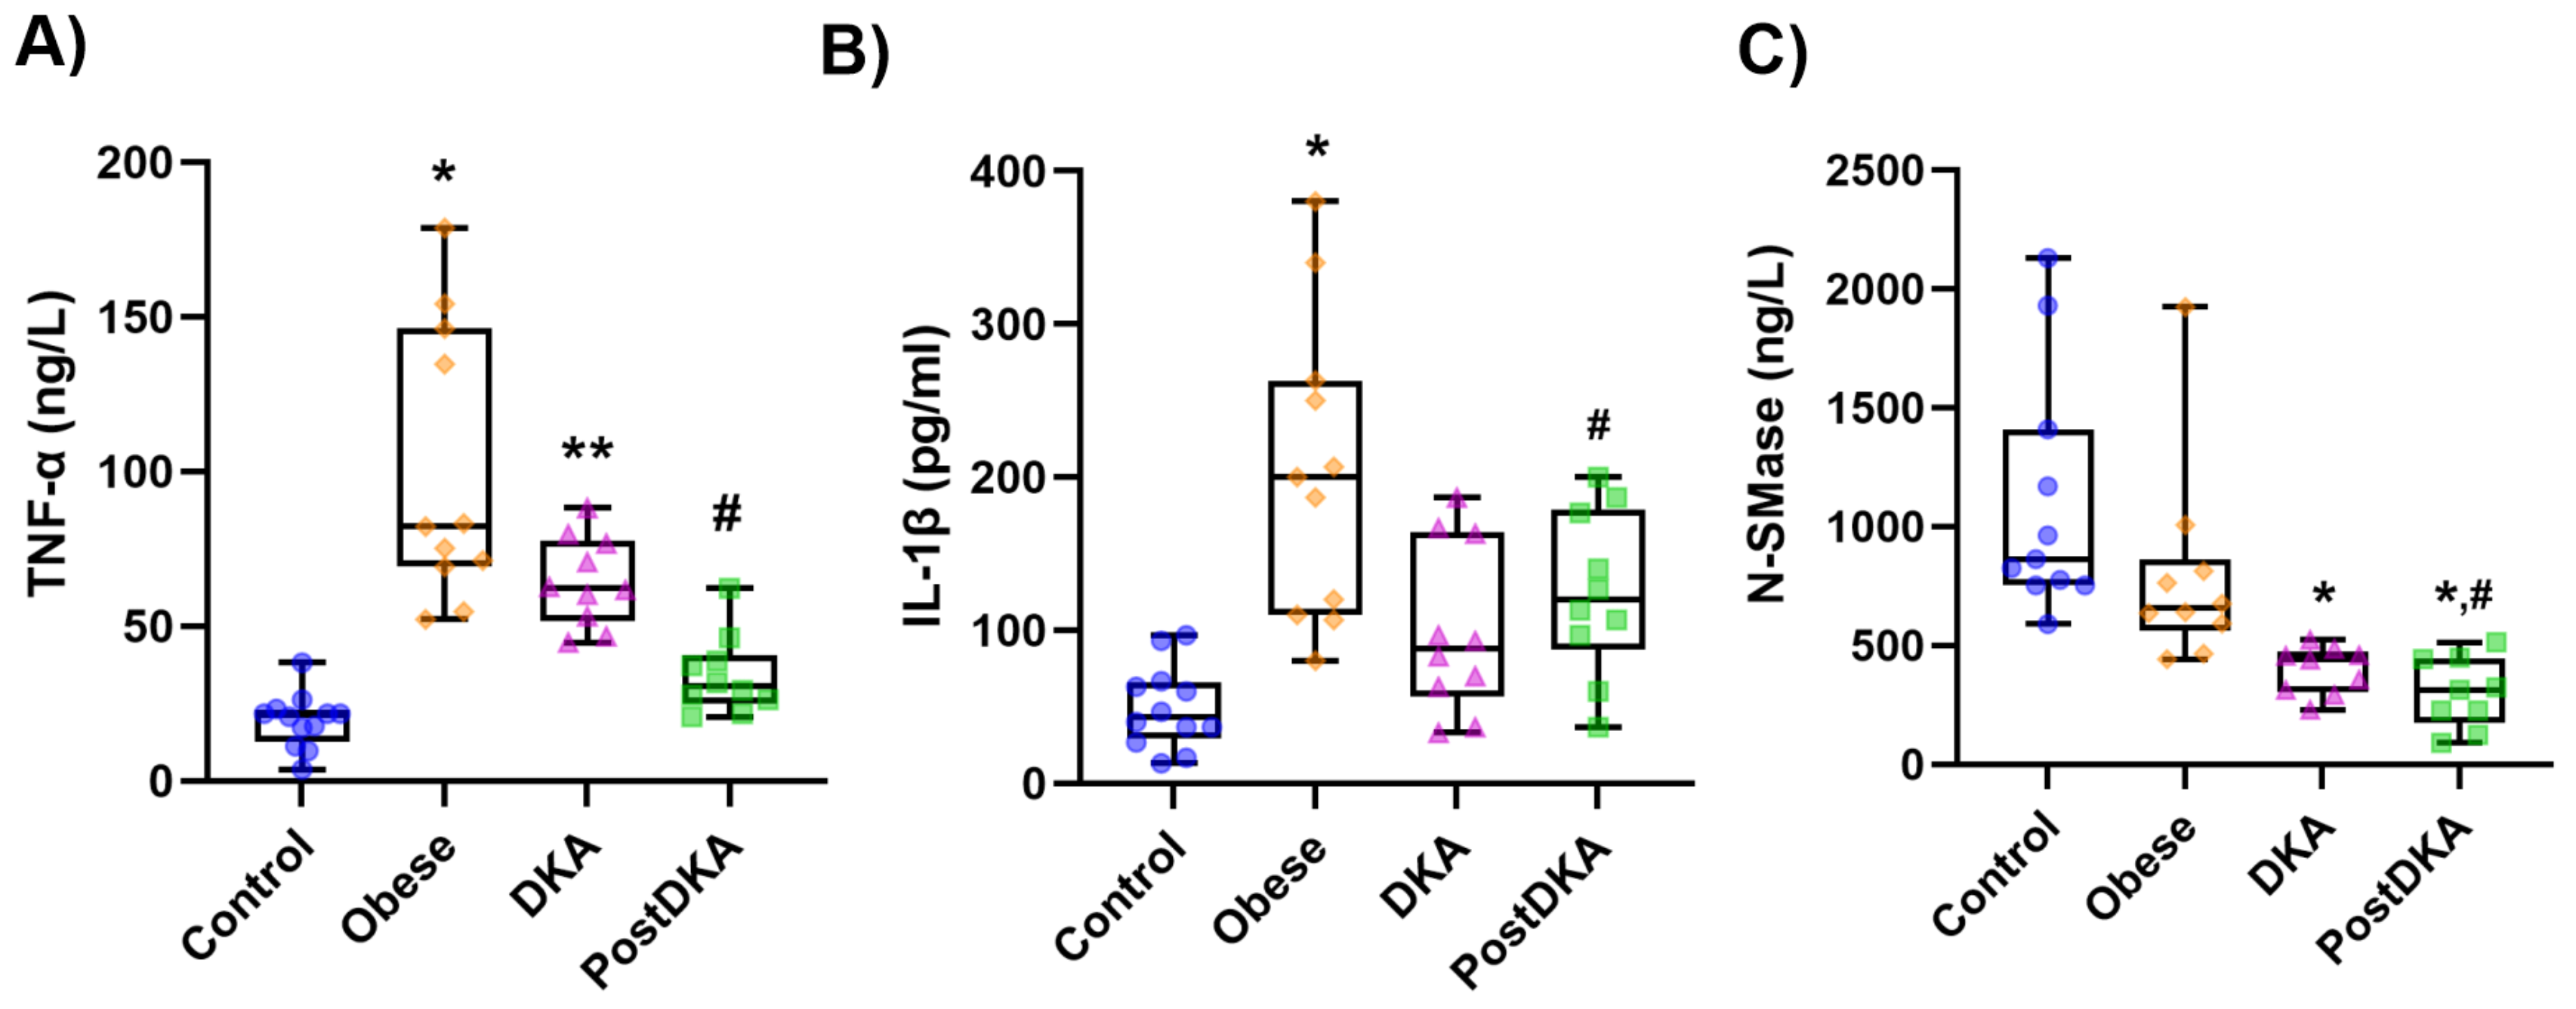
Figure 4.
Correlation coefficients and scatter plots. A-D) Linear regression analysis between S1P, total CER, total SM, N-SMase and β-hydroxybutyrate levels. E) Linear regression analysis between N-SMase and total SM. F-I) Linear regression analysis between S1P, total CER, total SM, N-SMase and lactate levels. J) Linear regression analysis between N-SMase and total CER. Statistical significance was established at a p-value of less than 0.05.
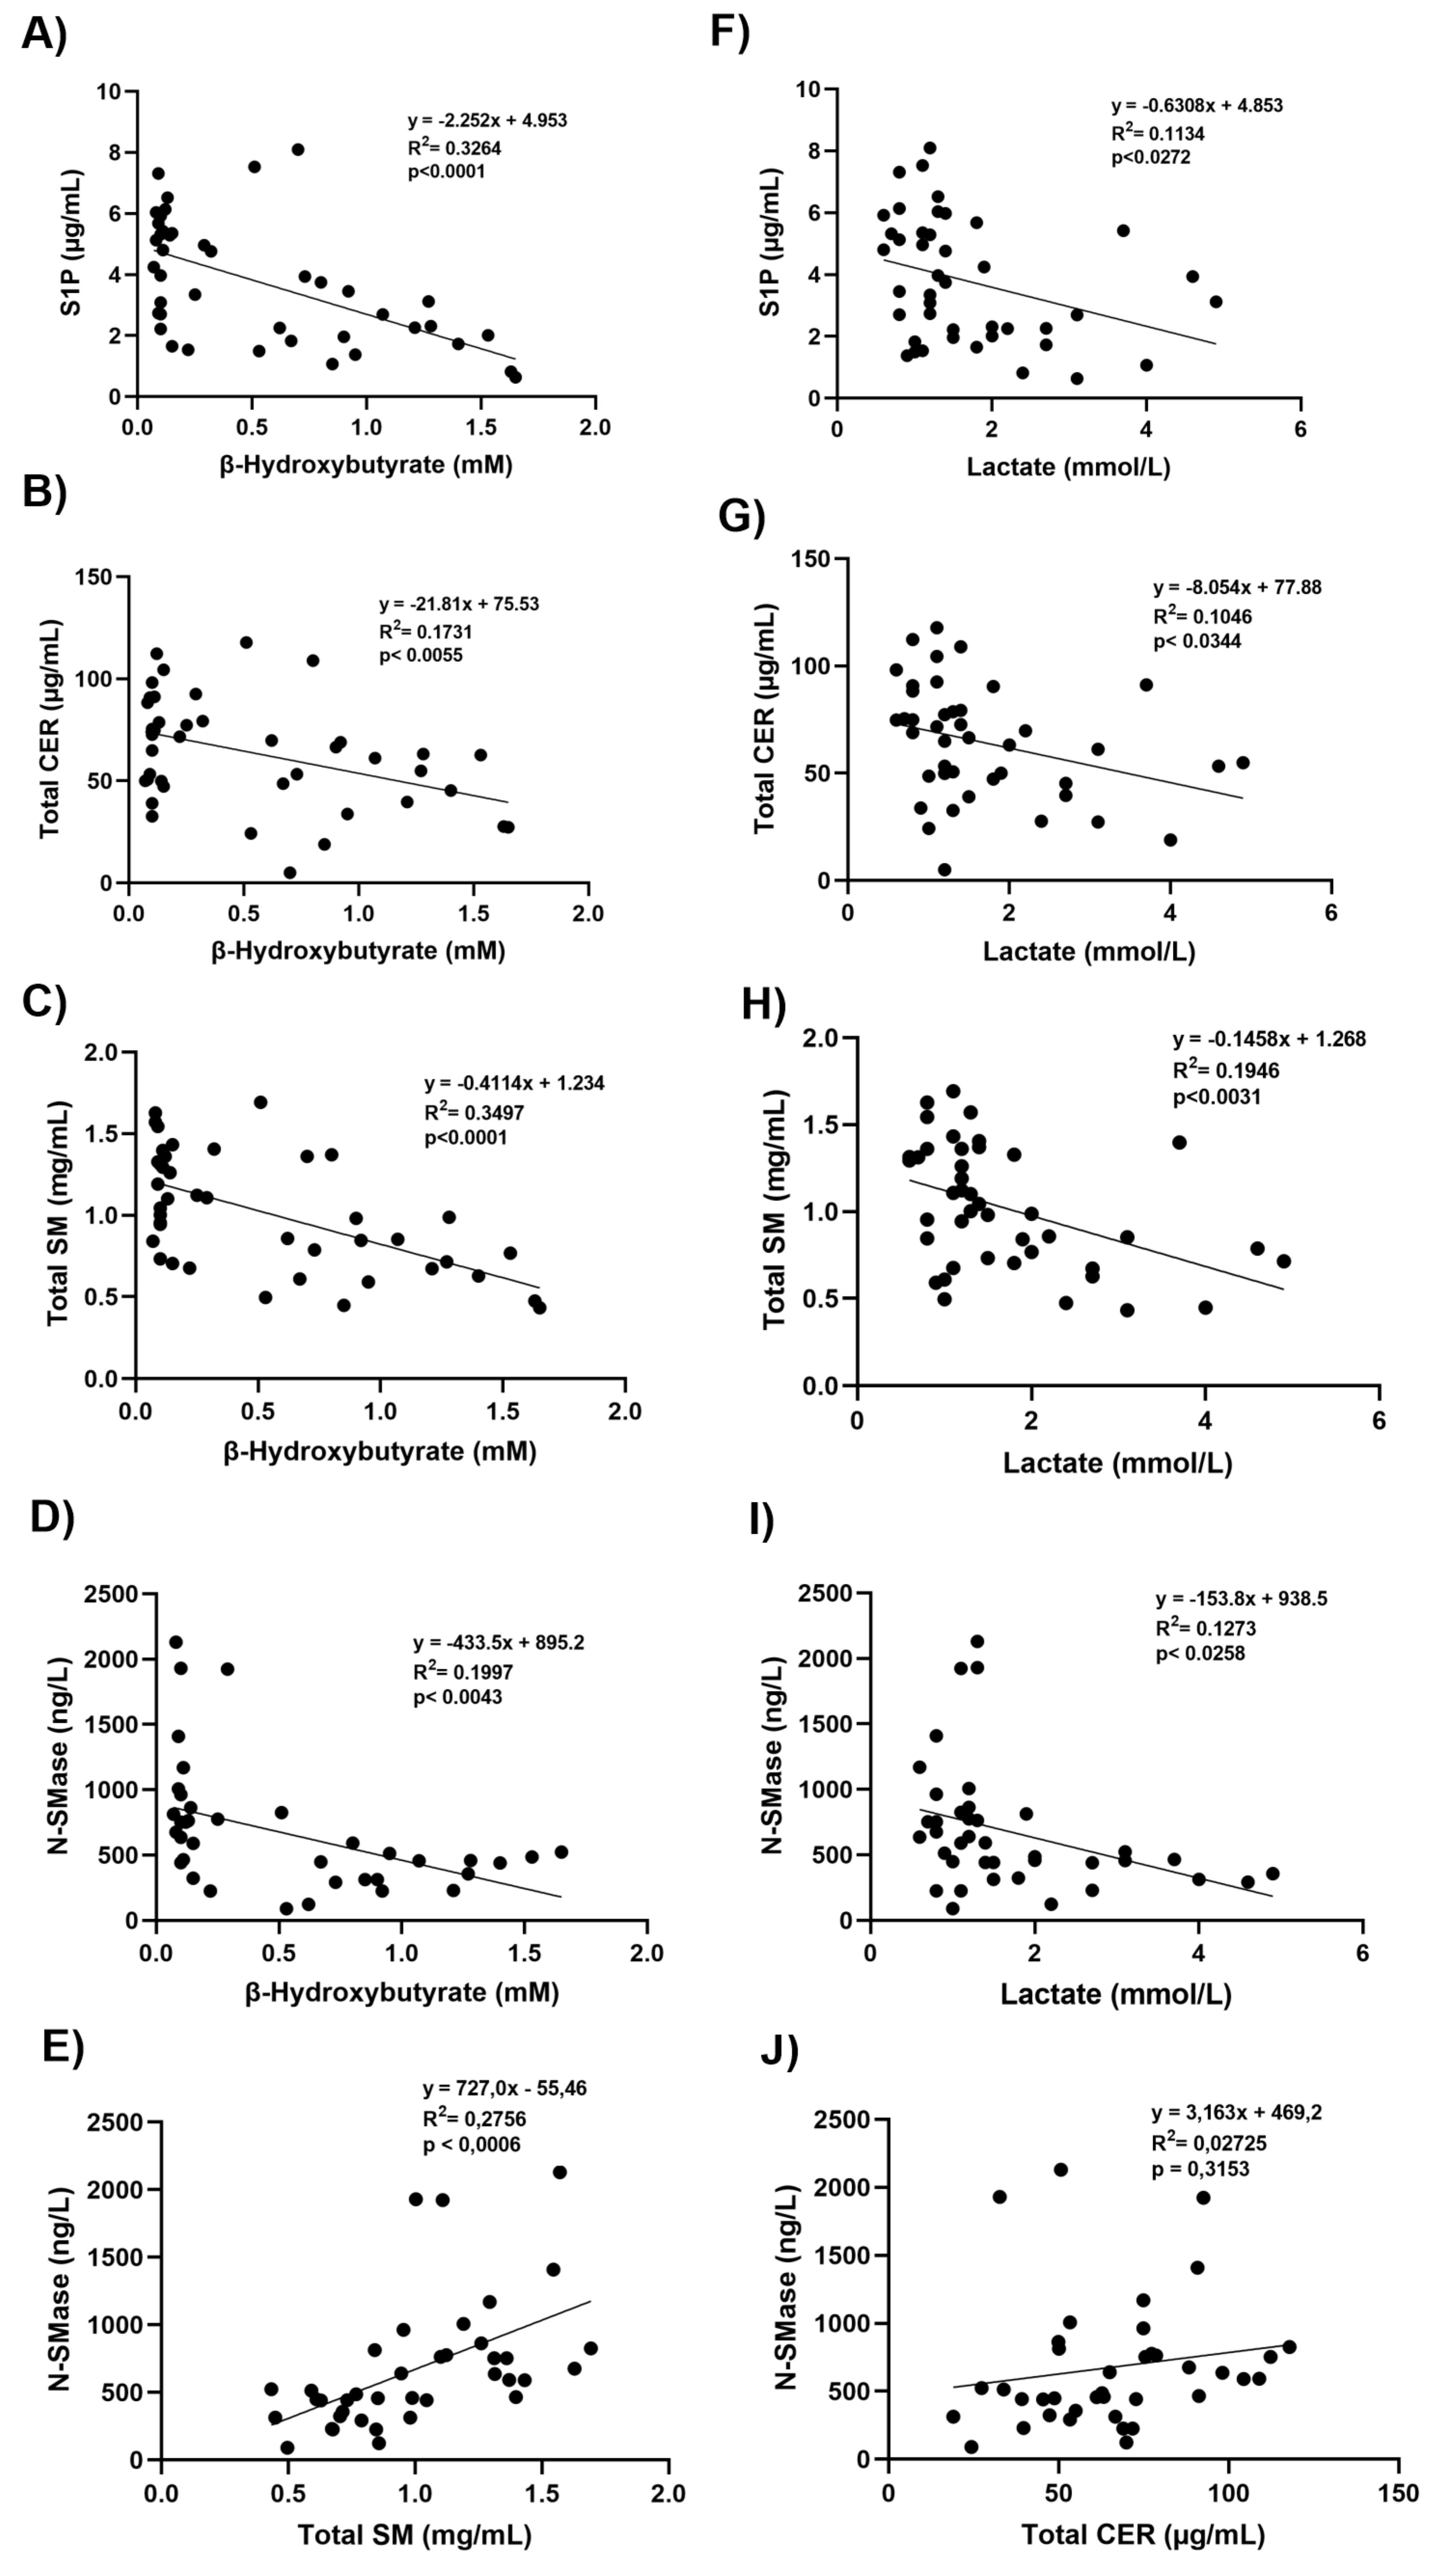

Table 1.
Laboratory values.
| Control (n=12) | Obese (n=11) | DKA (n=10) | Post-DKA (n=10) | |
|---|---|---|---|---|
| Weight (kg) | 64.28 ± 6.27 | 112.63 ± 17.96 a | 60.76 ± 11.90 | 60.76 ± 11.90 |
| Height k(cm) | 163.6 ± 7.6 | 164.73 ± 8.43 | 168.00 ± 11.87 | 168.00 ± 11.87 |
| BMI (kg/m2) | 23.97 ± 2.06 | 41.45 ± 4.77 b | 21.50 ± 3.65 | 21.50 ± 3.65 |
| pH | 7.39 ± 0.04 | 7.39 ± 0.01 | 7.17 ± 0.12 c, d | 7.34 ± 0.04 |
| HCO3 (mEq/L) | 24.71 ± 1.77 | 23.56 ± 2.19 | 11.38 ± 3.83c, d | 18.25 ± 3.46c |
| Urine ketone (mmol/L) | 0 | 0 | 2.60 ± 0.70 e, f | 0.56 ± 1.01 |
| CRP (mg/L) | 1.54 ± 1.92 | 14.22 ± 17.01 g | 40.39 ± 87.02 g | 37.29 ± 82.11 g |
| Glucose (mg/dL) | 77.67 ± 7.89 | 88.73 ± 9.96 | 446.50 ± 150.02 c, d | 182.50 ± 39.51c |
| BUN (mg/dL) | 9.58 ± 2.84 | 11.50 ± 2.32 | 21.00 ± 11.48 g, d | 9.78 ± 3.23 |
| Creatinine (mg/dL) | 0.85 ± 0.14 | 0.80 ± 0.13 | 1.18 ± 0.35 e, d | 0.89 ± 0.23 |
| GFR (ml/dk) | 96.92 ± 13.65 | 104.27 ± 16.96 | 74.00 ± 29.43 h, f | 99.44 ±26.45 |
| Na+ (mmol/L) | 139.33 ± 1.72 | 139.45 ± 2.54 | 131.70 ± 3.71 c, d | 137.8 ± 6.5 |
| K+ (mmol/L) | 4.30 ± 0.22 | 4.37 ± 0.38 | 4.30 ± 0.85 | 3.95 ± 0.48 |
| HbA1c (%) | 5.33 ± 0.26 | 5.68 ± 0.35 | 11.29 ± 1.82 c | - |
| TSH (mU/L) | 2.14 ± 1.00 | 2.37 ± 1.43 | 2.26 ± 1.82 | - |
| fT4 (ng/dL) | 0.82 ± 0.10 | 1.20 ± 0.64 g | 0.92 ± 0.15 | - |
| Total cholesterol (mg/dL) | 196.17 ± 26.77 | 171.36 ± 34.20 | 214.50 ± 168.62 | - |
| HDL-C (mg/dL) | 64.58 ± 16.43 | 44.00 ± 9.49 g | 67.70 ± 62.71 | - |
| LDL-C (mg/dL) | 117.33 ± 28.30 | 102.90 ± 24.05 | 84.80 ± 45.97 | - |
| VLDL-C (mg/dL) | 14.25 ± 5.41 | 24.45 ± 12.86 g | 89.30 ± 206.63 g | - |
| Triglyceride (mg/dL) | 71.33 ± 26.61 | 121.91 ± 64.78 g | 446.30 ± 1033.94 g | - |
| Cl- (mmol/L) | 103.50 ± 1.88 | 103.55 ± 1.92 | 99.50 ± 5.23 c | - |
| Ca2+ (mg/dL) | 9.41 ± 0.22 | 9.49 ± 0.48 | 9.09 ± 0.80 | - |
| Albumin (mg/dL) | 43.28 ± 3.61 | 42.23 ± 2.93 | 35.86 ± 6.90 e | - |
| ALT (U/L) | 13.67 ± 3.58 | 26.91 ± 11.82 g | 26.60 ± 27.79 | - |
| AST (U/L) | 16.25 ± 3.28 | 19.27 ± 4.56 | 19.33 ± 12.97 | - |
| Lipase (U/L) | 16.25 ± 6.81 | 24.45 ± 20.43 | 53.50 ± 97.22 | - |
| Insulin (mIU/L) | 6.69 ± 3.54 | 13.31 ± 5.40 i | - | - |
| HOMA-IR | 1.32 ± 0.82 | 3.03 ± 1.20 i | - | - |
All values are given as mean ± SD. BMI, body mass index; HCO3, bicarbonate; CRP, C-reactive protein; BUN, blood urea nitrogen; GFR, glomerular filtration rate; HbA1c, haemoglobin A1c; TSH, thyroid stimulating hormone; fT4, free thyroxine; HDL-C, high-density lipoprotein cholesterol; LDL-C, low-density lipoprotein cholesterol; VLDL-C, very low density lipoprotein cholesterol; ALT, alanine aminotransferase; AST, aspartate aminotransferase; HOMA-IR, homeostasis model assessment of insulin resistance; DKA, diabetic ketoacidosis. a, p<0.001, vs. control, DKA and post-DKA. Statistical analysis was performed by Kruskal-Wallis one-way analysis of variance. The difference between the groups was determined by Dunn’s multiple comparison test. b, p<0.001, vs. control, DKA and post-DKA. Statistical analysis was performed by one-way ANOVA. The difference between the groups was determined by Tukey’s multiple comparison test. c, p<0.05, vs. control and obese group. Statistical analysis was performed by one-way ANOVA. The difference between the groups was determined by Tukey’s multiple comparison test. d, p<0.05, vs. post-DKA. Statistical analysis was performed by paired t test. e, p<0.05, vs. control and obese group. Statistical analysis was performed by Kruskal-Wallis one-way analysis of variance. The difference between the groups was determined by Dunn’s multiple comparison test. f, p<0.01, vs. post-DKA. Statistical analysis was performed by Wilcoxon matched pairs signed rank test. g, p<0.05, vs. control group. Statistical analysis was performed by Kruskal-Wallis one-way analysis of variance. The difference between the groups was determined by Dunn’s multiple comparison test. h, p<0.05, vs. obese group. Statistical analysis was performed by Kruskal-Wallis one-way analysis of variance. The difference between the groups was determined by Dunn’s multiple comparison test. i, p<0.01, vs. control group. Statistical analysis was performed by unpaired t test.
Table 2.
Serum Sphingolipids Levels.
| Control (n=12) | Obese (n=11) | DKA (n=10) | Post-DKA (n=10) | |
|---|---|---|---|---|
| Sphingomyelin (µmol/mL) | ||||
| 16:0 SM (d18:1/16:0) | 1.40 ± 0.23 | 1.24 ± 0.23 | 0.71 ± 0.19 a | 0.86 ± 0.36 b |
| 18:0 SM (d18:1/18:0) | 0.13 ± 0.03 | 0.14 ± 0.05 | 0.05 ± 0.01a | 0.06 ± 0.02 a |
| 24:0 SM (d18:1/24:0) | 0.30 ± 0.08 | 0.28 ± 0.06 | 0.17 ± 0.06 c | 0.17 ± 0.07c |
| Ceramide (nmol/mL) | ||||
| C16 CER (d18:1/16:0) | 3.97 ± 0.87 | 3.62 ± 0.42 | 2.92 ± 0.98 | 3.12 ± 0.59 |
| C18 CER (d18:1/18:0) | 1.03 ± 0.31 | 1.51 ± 0.59 | 0.71 ± 0.31 d | 0.76 ± 0.29 d |
| C20 CER (d18:1/20:0) | 1.79 ± 0.38 | 1.96 ± 0.94 | 0.80 ± 0.23 a | 0.96 ± 0.36 a |
| C22 CER (d18:1/22:0) | 26.20 ± 7.37 | 29.32 ± 7.47 | 16.18 ± 6.86 c | 15.81 ± 7.30 c |
| C24 CER (d18:1/24:0) | 89.65 ± 33.67 | 90.19 ± 21.55 | 50.64 ± 20.17 c | 53.85 ± 27.74 c |
| S1P (nmol/mL) | 13.74 ± 3.81 | 12.80 ± 3.28 | 5.43 ± 2.75 a | 6.82 ± 5.34 a |
All values are given as mean ± SD. SM, sphingomyelin; S1P, sphingosine-1-phosphate; CER, ceramide; DKA, diabetic ketoacidosis. a, p<0.05, vs. control and obese groups. Statistical analysis was performed by Kruskal-Wallis one-way analysis of variance. The difference between the groups was determined by Dunn’s multiple comparison test. b, p<0.05, vs. control group. Statistical analysis was performed by Kruskal-Wallis one-way analysis of variance. The difference between the groups was determined by Dunn’s multiple comparison test. c, p<0.05, vs. control and obese groups. Statistical analysis was performed by one-way ANOVA. The difference between the groups was determined by Tukey’s multiple comparison test. d, p<0.05, vs. obese group. Statistical analysis was performed by Kruskal-Wallis one-way analysis of variance. The difference between the groups was determined by Dunn’s multiple comparison test.
Disclaimer/Publisher’s Note: The statements, opinions and data contained in all publications are solely those of the individual author(s) and contributor(s) and not of MDPI and/or the editor(s). MDPI and/or the editor(s) disclaim responsibility for any injury to people or property resulting from any ideas, methods, instructions or products referred to in the content. |
© 2025 by the authors. Licensee MDPI, Basel, Switzerland. This article is an open access article distributed under the terms and conditions of the Creative Commons Attribution (CC BY) license (http://creativecommons.org/licenses/by/4.0/).
Copyright: This open access article is published under a Creative Commons CC BY 4.0 license, which permit the free download, distribution, and reuse, provided that the author and preprint are cited in any reuse.


