Submitted:
06 January 2025
Posted:
06 January 2025
You are already at the latest version
Abstract
People, their families, and communities weigh the costs and benefits of migration to decide whether to move or stay; however, these decisions are complex and influenced by multiple factors. This study uses the Migration Transition and Aspirations-Capabilities framework to examine how domestic socioeconomic development shapes migration decisions. Applying the Generalized Method of Moments (GMM) and Quantitative Descriptive Analyses (QDA) to panel data from 109 low- and middle-income countries, it compares the impact of GDP per capita and the Human Development Index (HDI) on net migration and emigration trends. The dynamic panel regression results show that the HDI exerts a more substantial effect on positive net migration, with its impact being approximately 10.69 times greater than GDP per capita. Coefficients for HDI range from 9.144 to 13.79, while those for GDP per capita range from 0.994 to 1.785. The QDA results also suggest that migration equilibrium is reached at approximately $4,000 GDP per capita, based on emigration rates, and around $7,000 when measured by net migration rates. Additionally, countries with GDPpc between $2,000 and $4,000 experience sharp negative net migration, indicating a highly mobile population in this income range. Finally, the regression results question the theoretical assumption of non-linearity, revealing almost a linear relationship between development and migration. We project that the high emigration flows from low- and lower-middle-income countries will likely continue for the foreseeable future. In light of this, governments in countries of migrant origin must transition from restrictive migration policies and border controls to strategies that promote sustainable socioeconomic development. By improving the Human Development Index (HDI), migration can shift from necessity to a matter of choice. This approach can unlock the full developmental benefits of migration while contributing to the global objectives of the 2030 Agenda for Sustainable Development and the Global Compact for Safe, Orderly, and Regular Migration (GCM).
Keywords:
Introduction and Background
2. Review of Literature and the Study Significance
2.1. Theoretical Perspective on Migration and Development

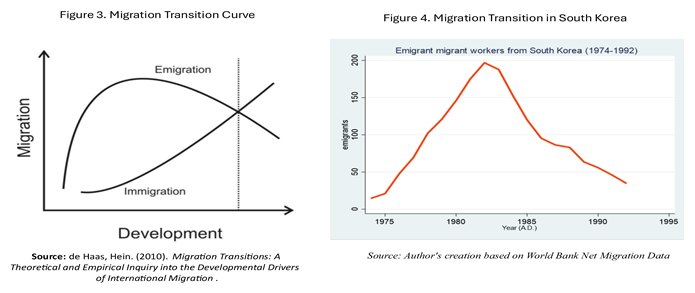
2.2.1. Migration Transition Theories
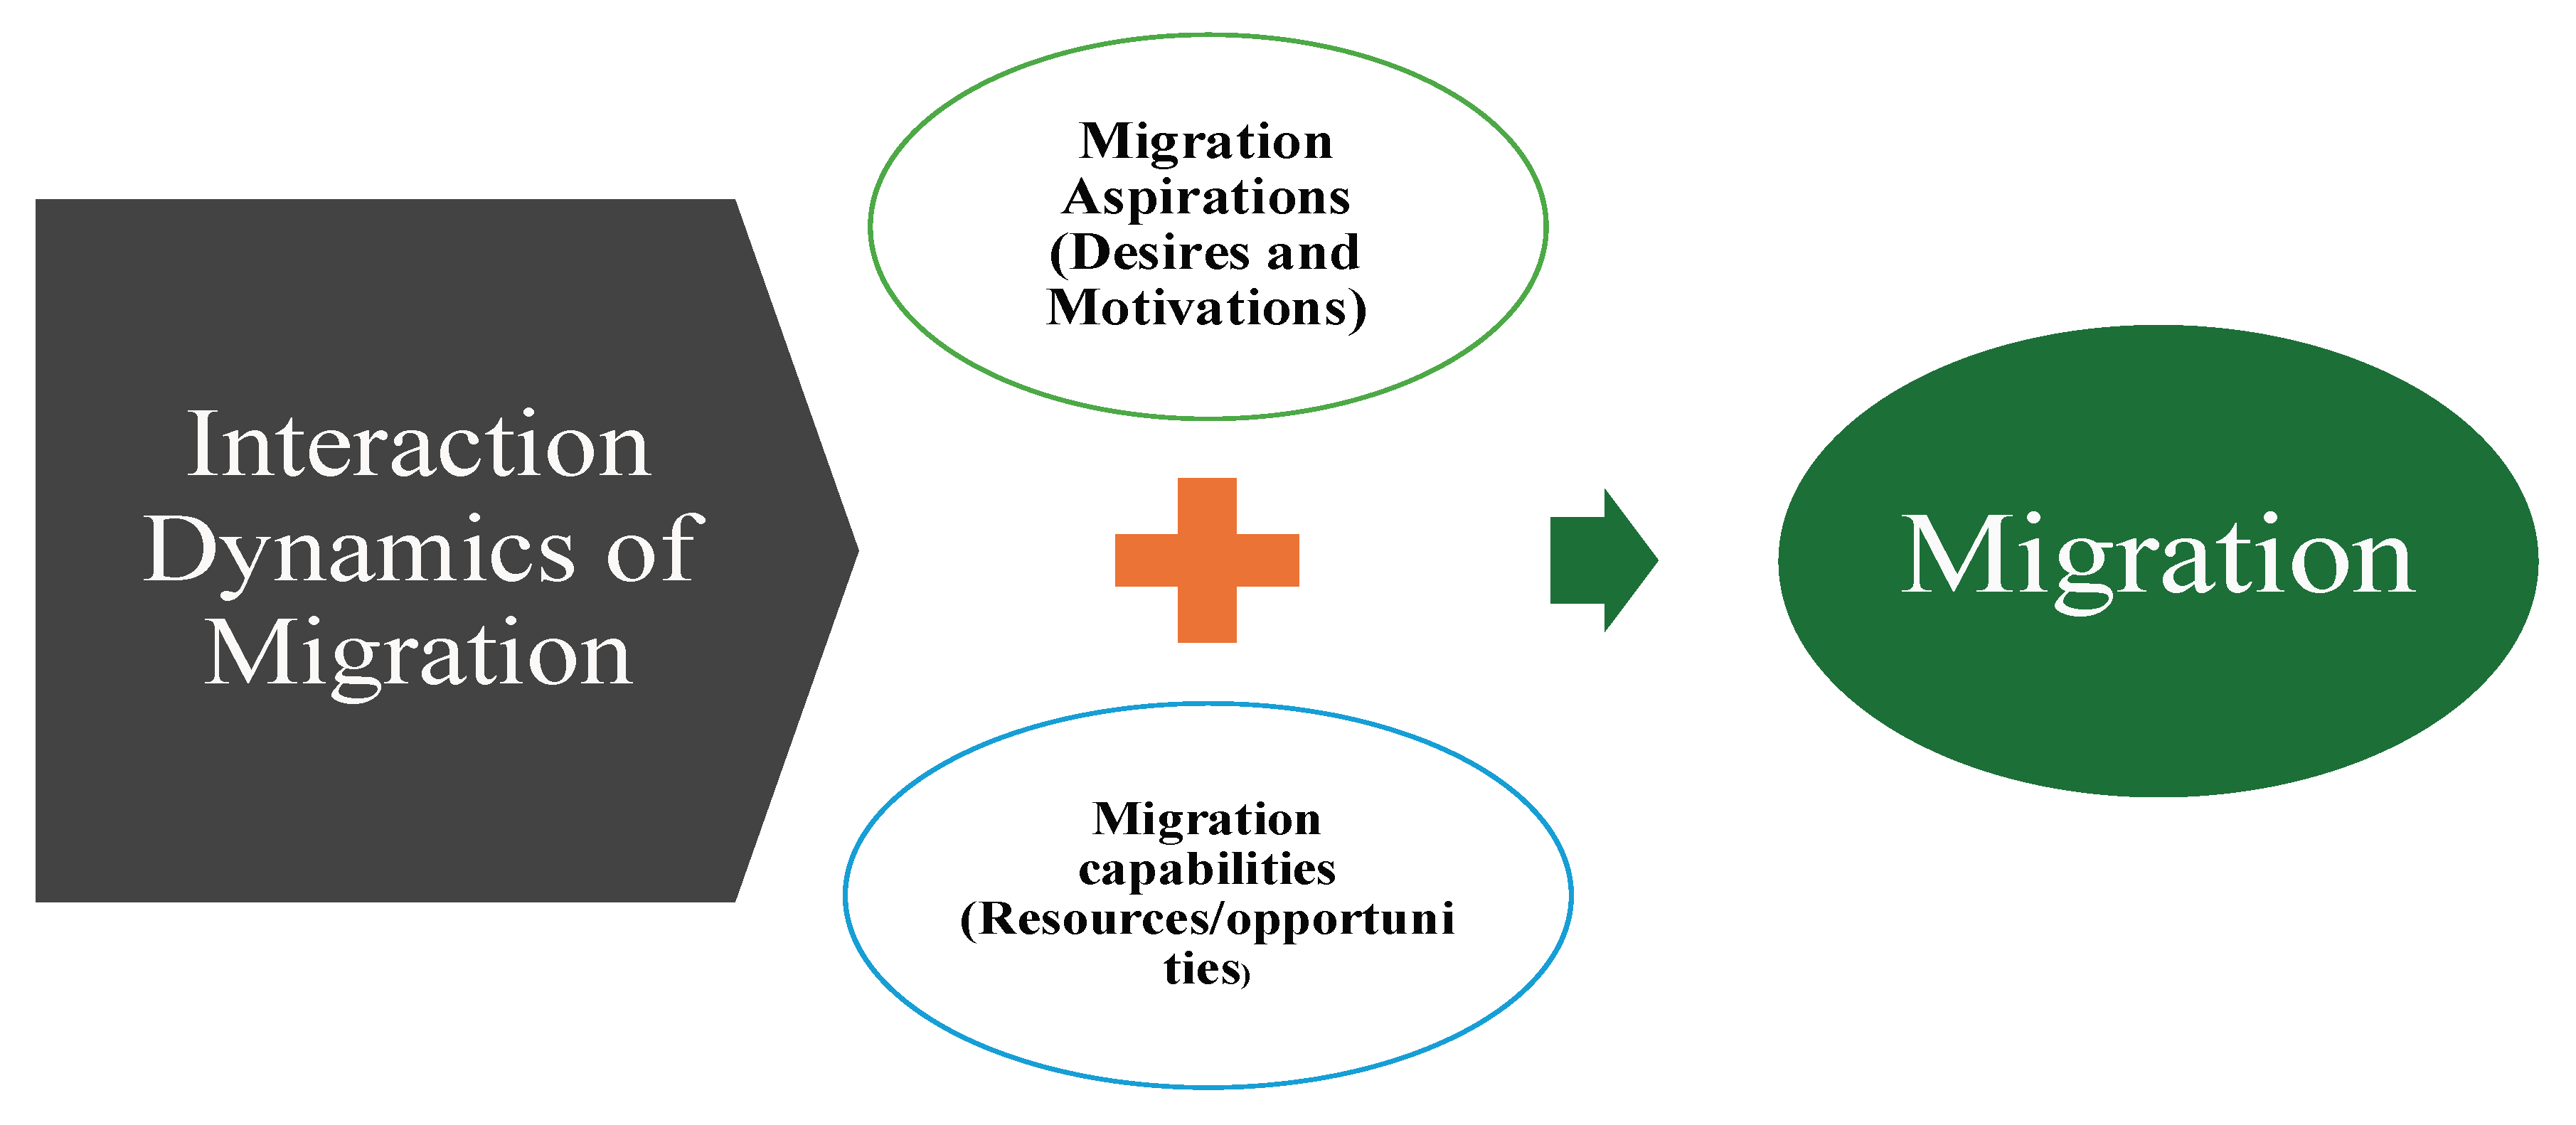
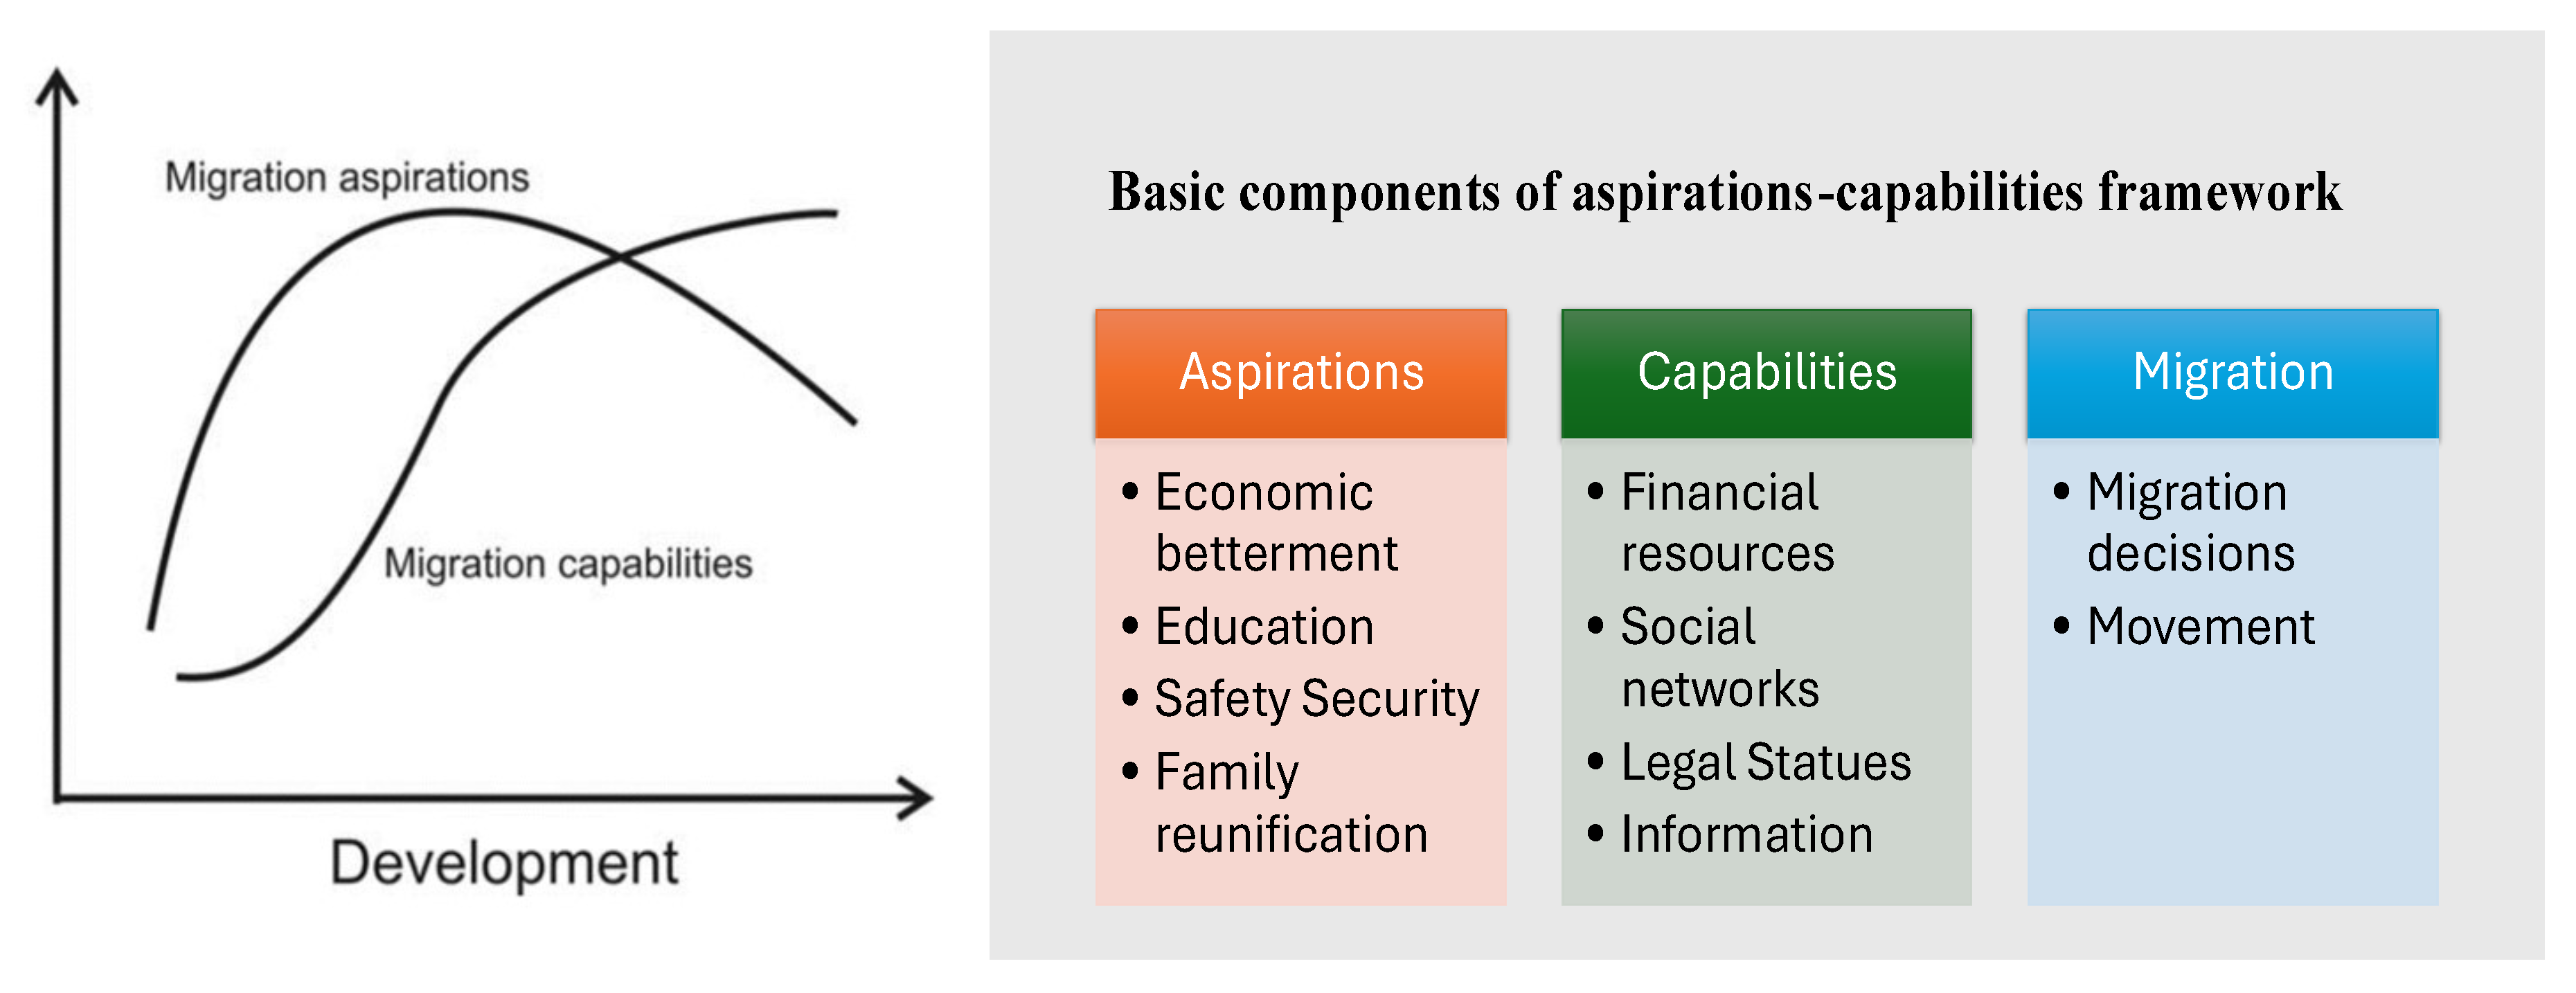
2.2.2. Migration Aspirations and Capabilities (A-C) Framework
2.2. Literature on Factors Influencing Migration Decisions
2.3. Literature on Migration Transitions
2.4. Literature on Aspirations-Capabilities Framework
2.5. Literature Gaps and Expected Contribution
3. Methodology and Estimation Strategy
3.1. Data and Sources
3.2. Variables and Selection Criteria:
3.3. Methodology and Estimation Strategy:
4. Results and Discussion:
4.1. Insights from Quantitative Descriptive Analysis (QDA).
4.2. Findings from Regression Analysis
4.2.1. The Influence of Domestic Socioeconomic Factors on Migration Decisions in LMICs: Using HDI as a Proxy for Socioeconomic Development (1)
4.2.2. Influence of Domestic Socioeconomic Factors on Migration Decisions in LMICs: Using Human Development Index (HDI) as a Proxy for Socioeconomic Development (2).
4.2.3. Influence of Domestic Socioeconomic Factors on Migration Decisions in LMICs: Using GDP per capita as a Proxy for Economic Development.

| Regression Models | GDPpc (Regression coefficients) | HDI (Regression coefficients) | HDI-GDPpc difference |
Remarks |
|---|---|---|---|---|
| Model-1 | 0.99 | 9.14 | 8.15 | While GDPpc plays a role, HDI has a significantly greater influence (10.69 times greater) on increasing net migration. Therefore, enhancing HDI status could serve as an effective strategy for shifting migration from a necessity to a choice for individuals in LMICs |
| Model-2 | 1.17 | 12.13 | 10.96 | |
| Model-3 | 1.24 | 12.91 | 11.67 | |
| Model-4 | 1.35 | 11.89 | 10.54 | |
| Model-5 | 1.79 | 13.79 | 12.11 | |
| Average difference: | 10.69 | |||
| S.N. | Subject of Analysis | Existence of | Key Findings | ||
|---|---|---|---|---|---|
| Migration Transition and equilibrium | Capability Constraints | Capability Enablers | |||
| 1 |
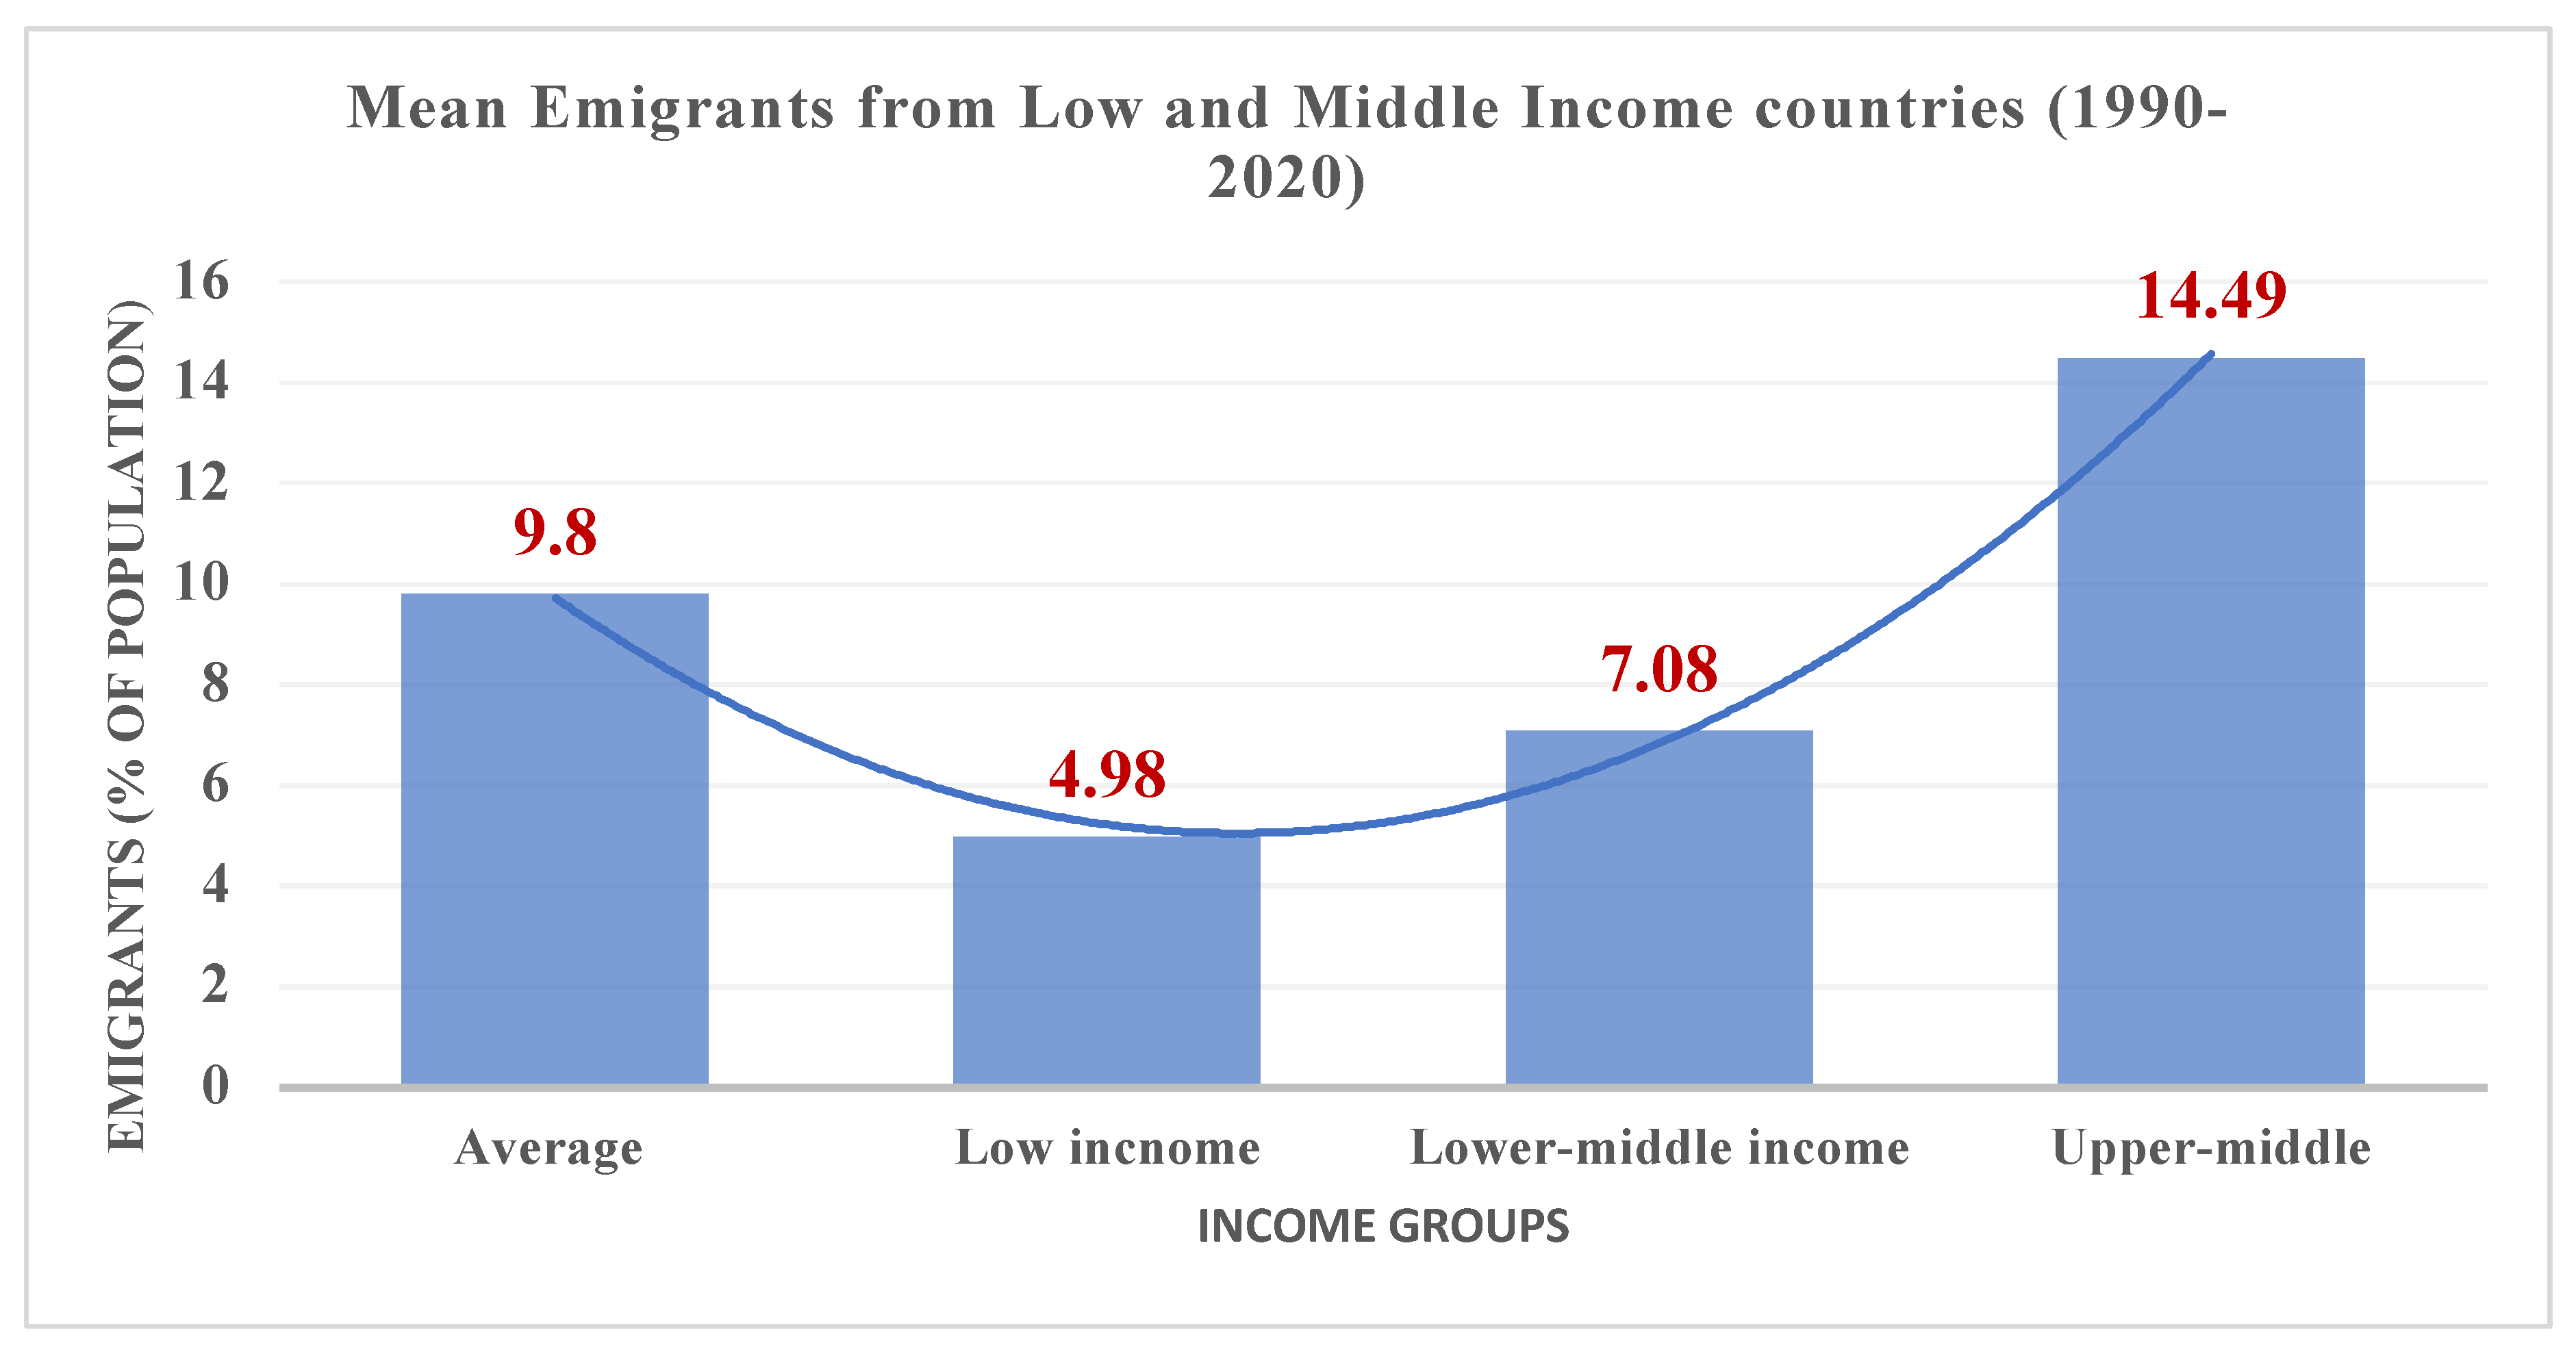
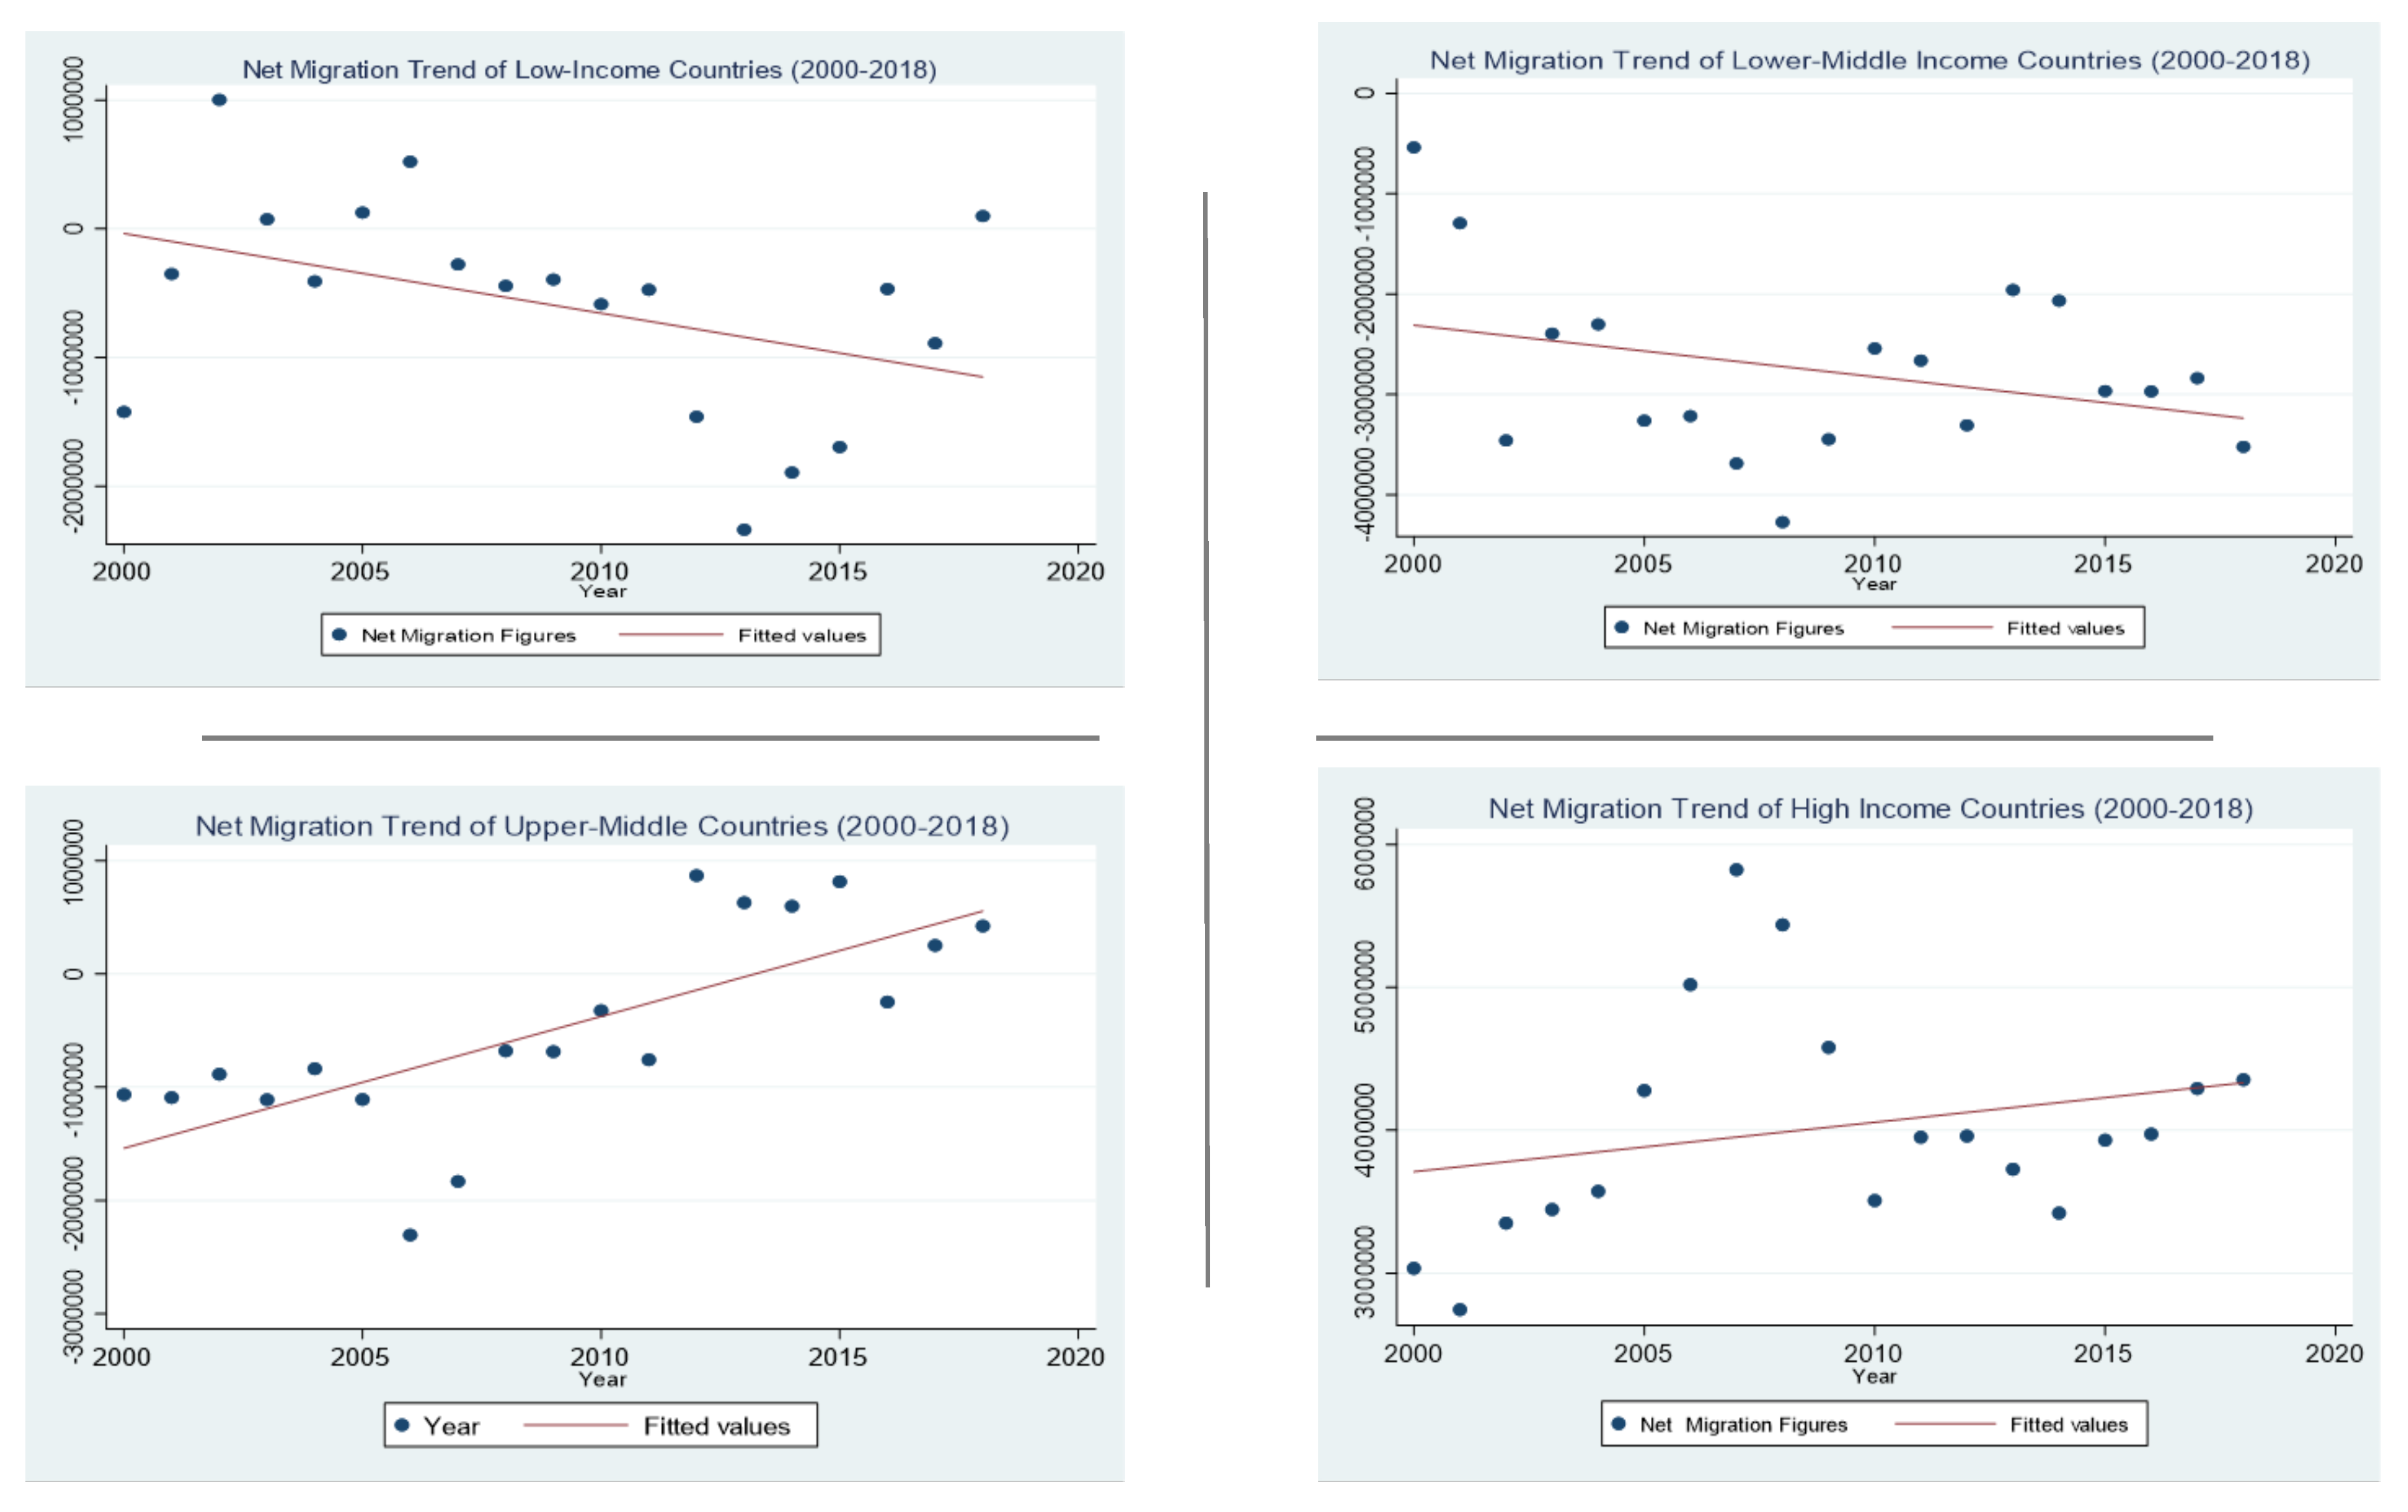
QDA-1 (Figure 8): Net Migration Trends by Income Groups (2000–2018). |
Yes. The transition begins at the upper end of the lower-middle income and equilibrium at the upper end of the upper-middle income category. |
No evidence. Persistent negative net migration in low and lower-middle-income countries. |
Yes. Increasing GDPpc at the upper end of the lower middle-income category leads to a decline in emigration. |
Differences in global wealth and levels of human development serve as key drivers of international migration. The transition begins at the upper end of the lower-middle income and equilibrium at the upper end of the upper-middle income category. |
| 2 |
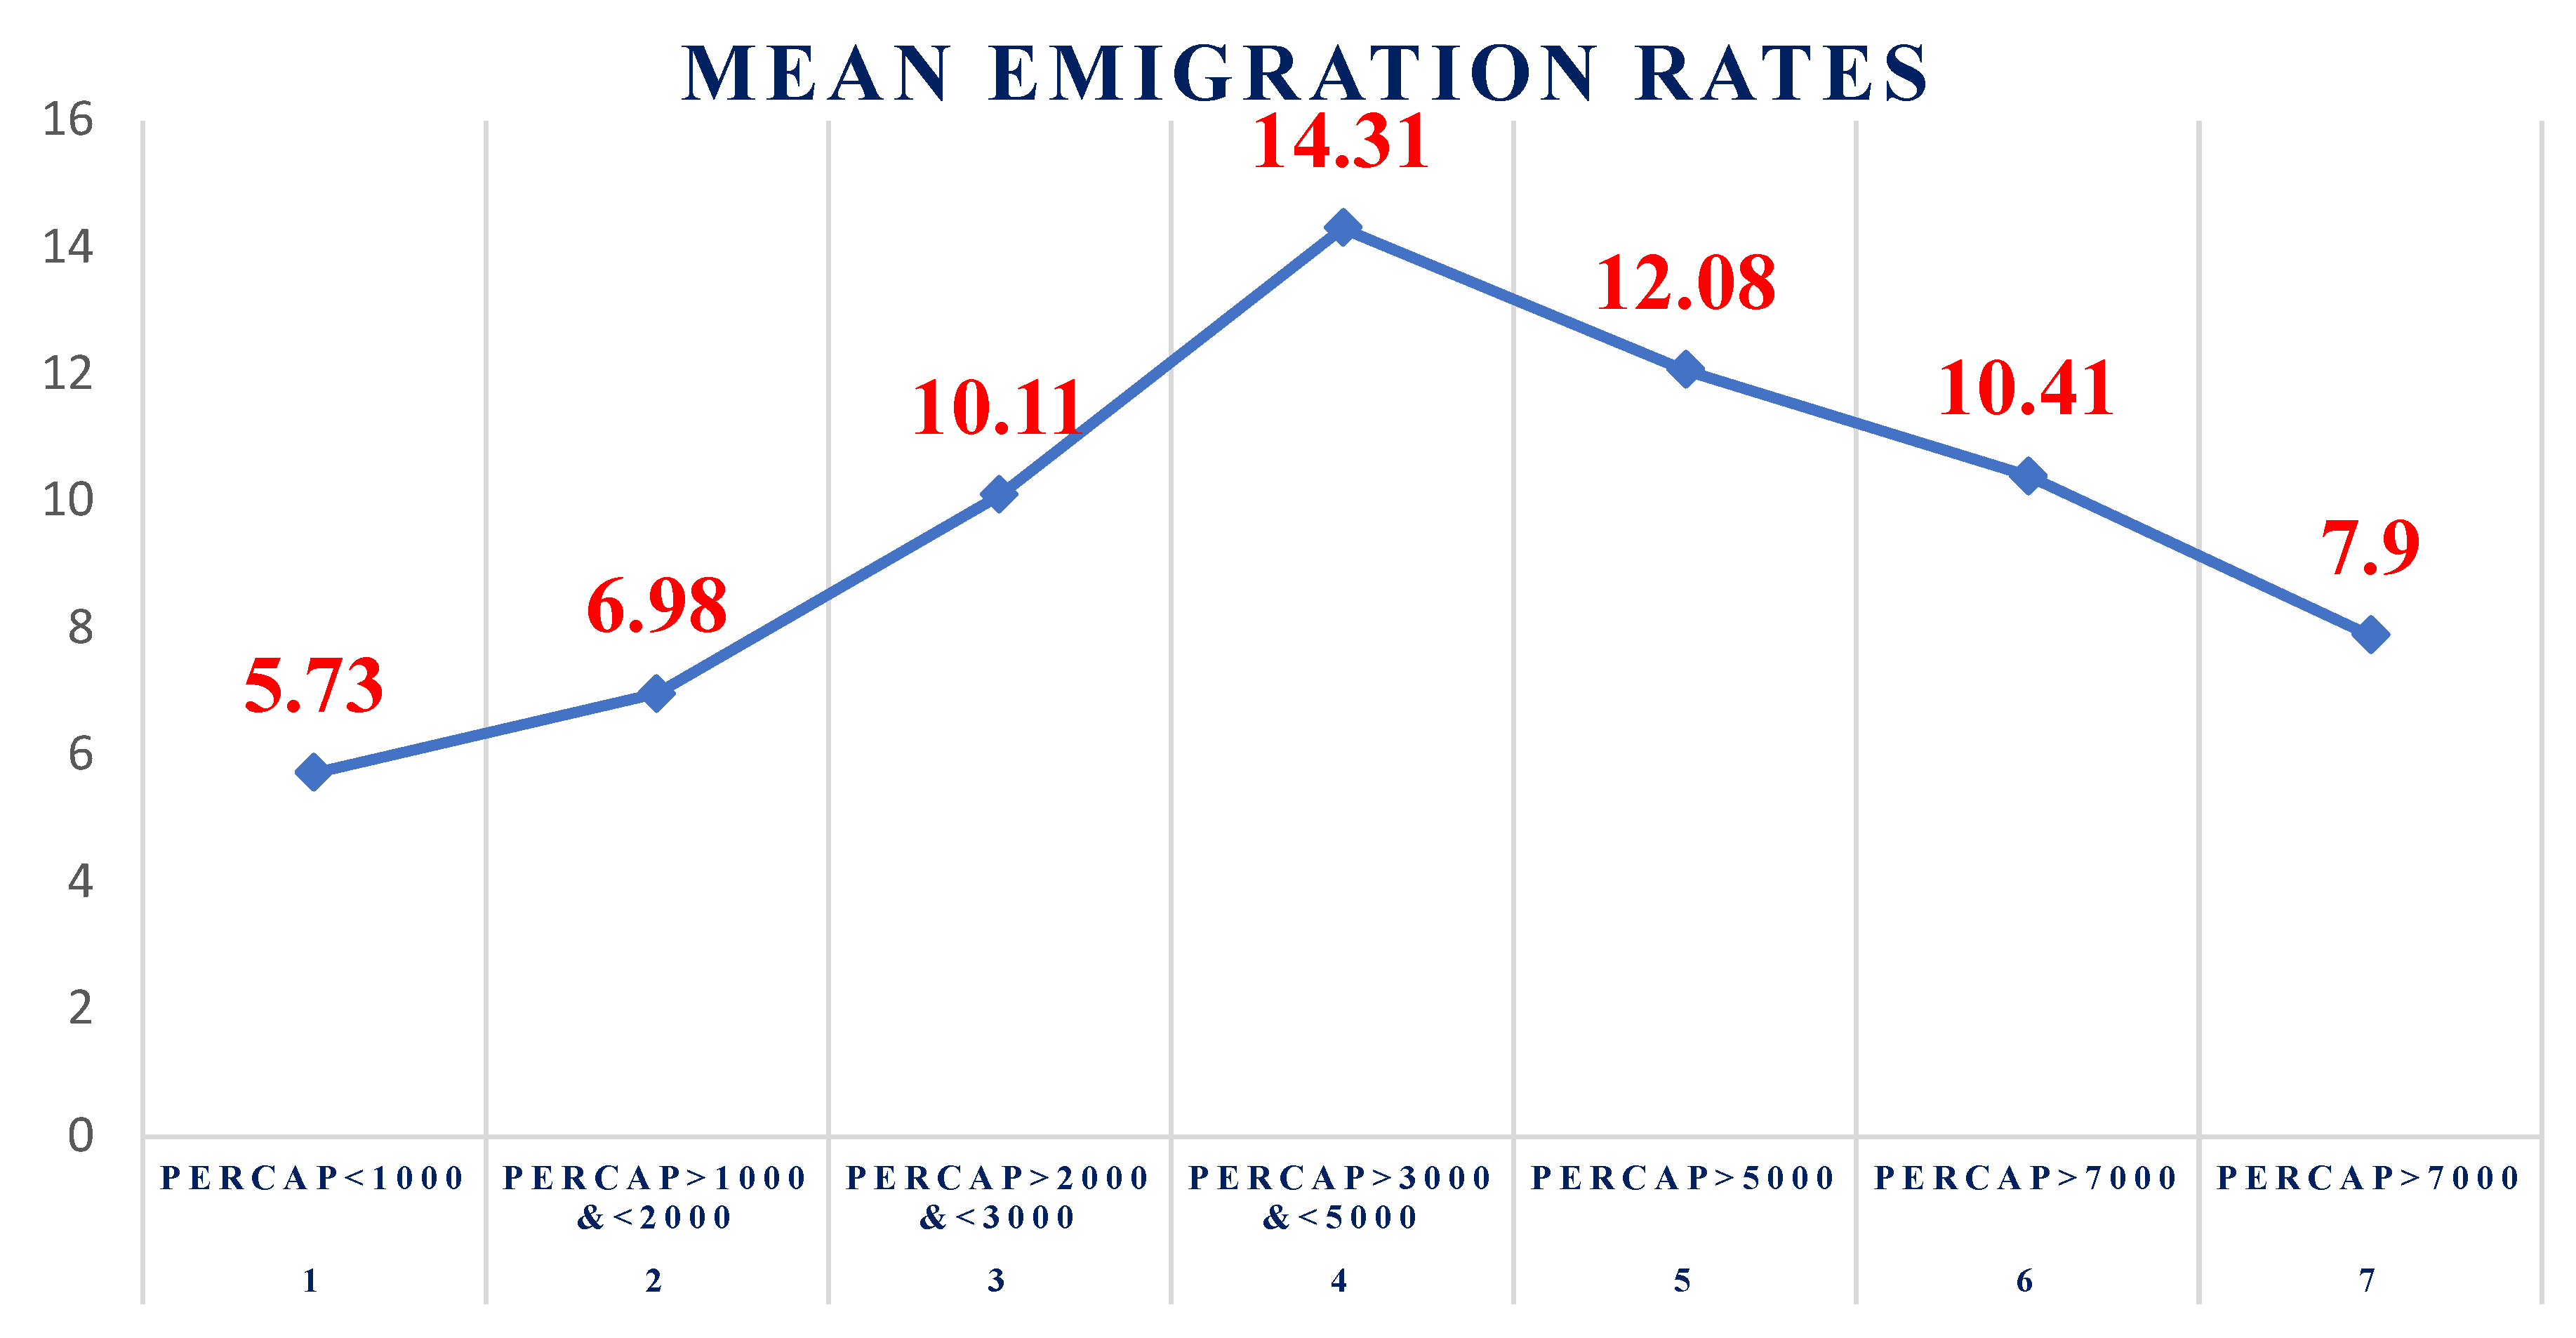
QDA-2 (Figure 9): Migration transitions: based on GDPpc and emigration rates |
Yes. Emigration reaches equilibrium at an approximate GDP per capita of $4,000. |
Yes. Emigration rates are relatively low (5.73%) in the low-income bracket (PERCAP < 1000). |
Yes. Emigration rates increase at 14.31% as income levels approach approximately GDPpc $4,000. |
In countries with low income (PERCAP < 1000, emigration rates are relatively low (5.73%). The migration equilibrium is observed at a GDP per capita of approximately $4,000, which does not align with previous findings, where it was identified as occurring at around $7,000–$8,000. |
| 3 |
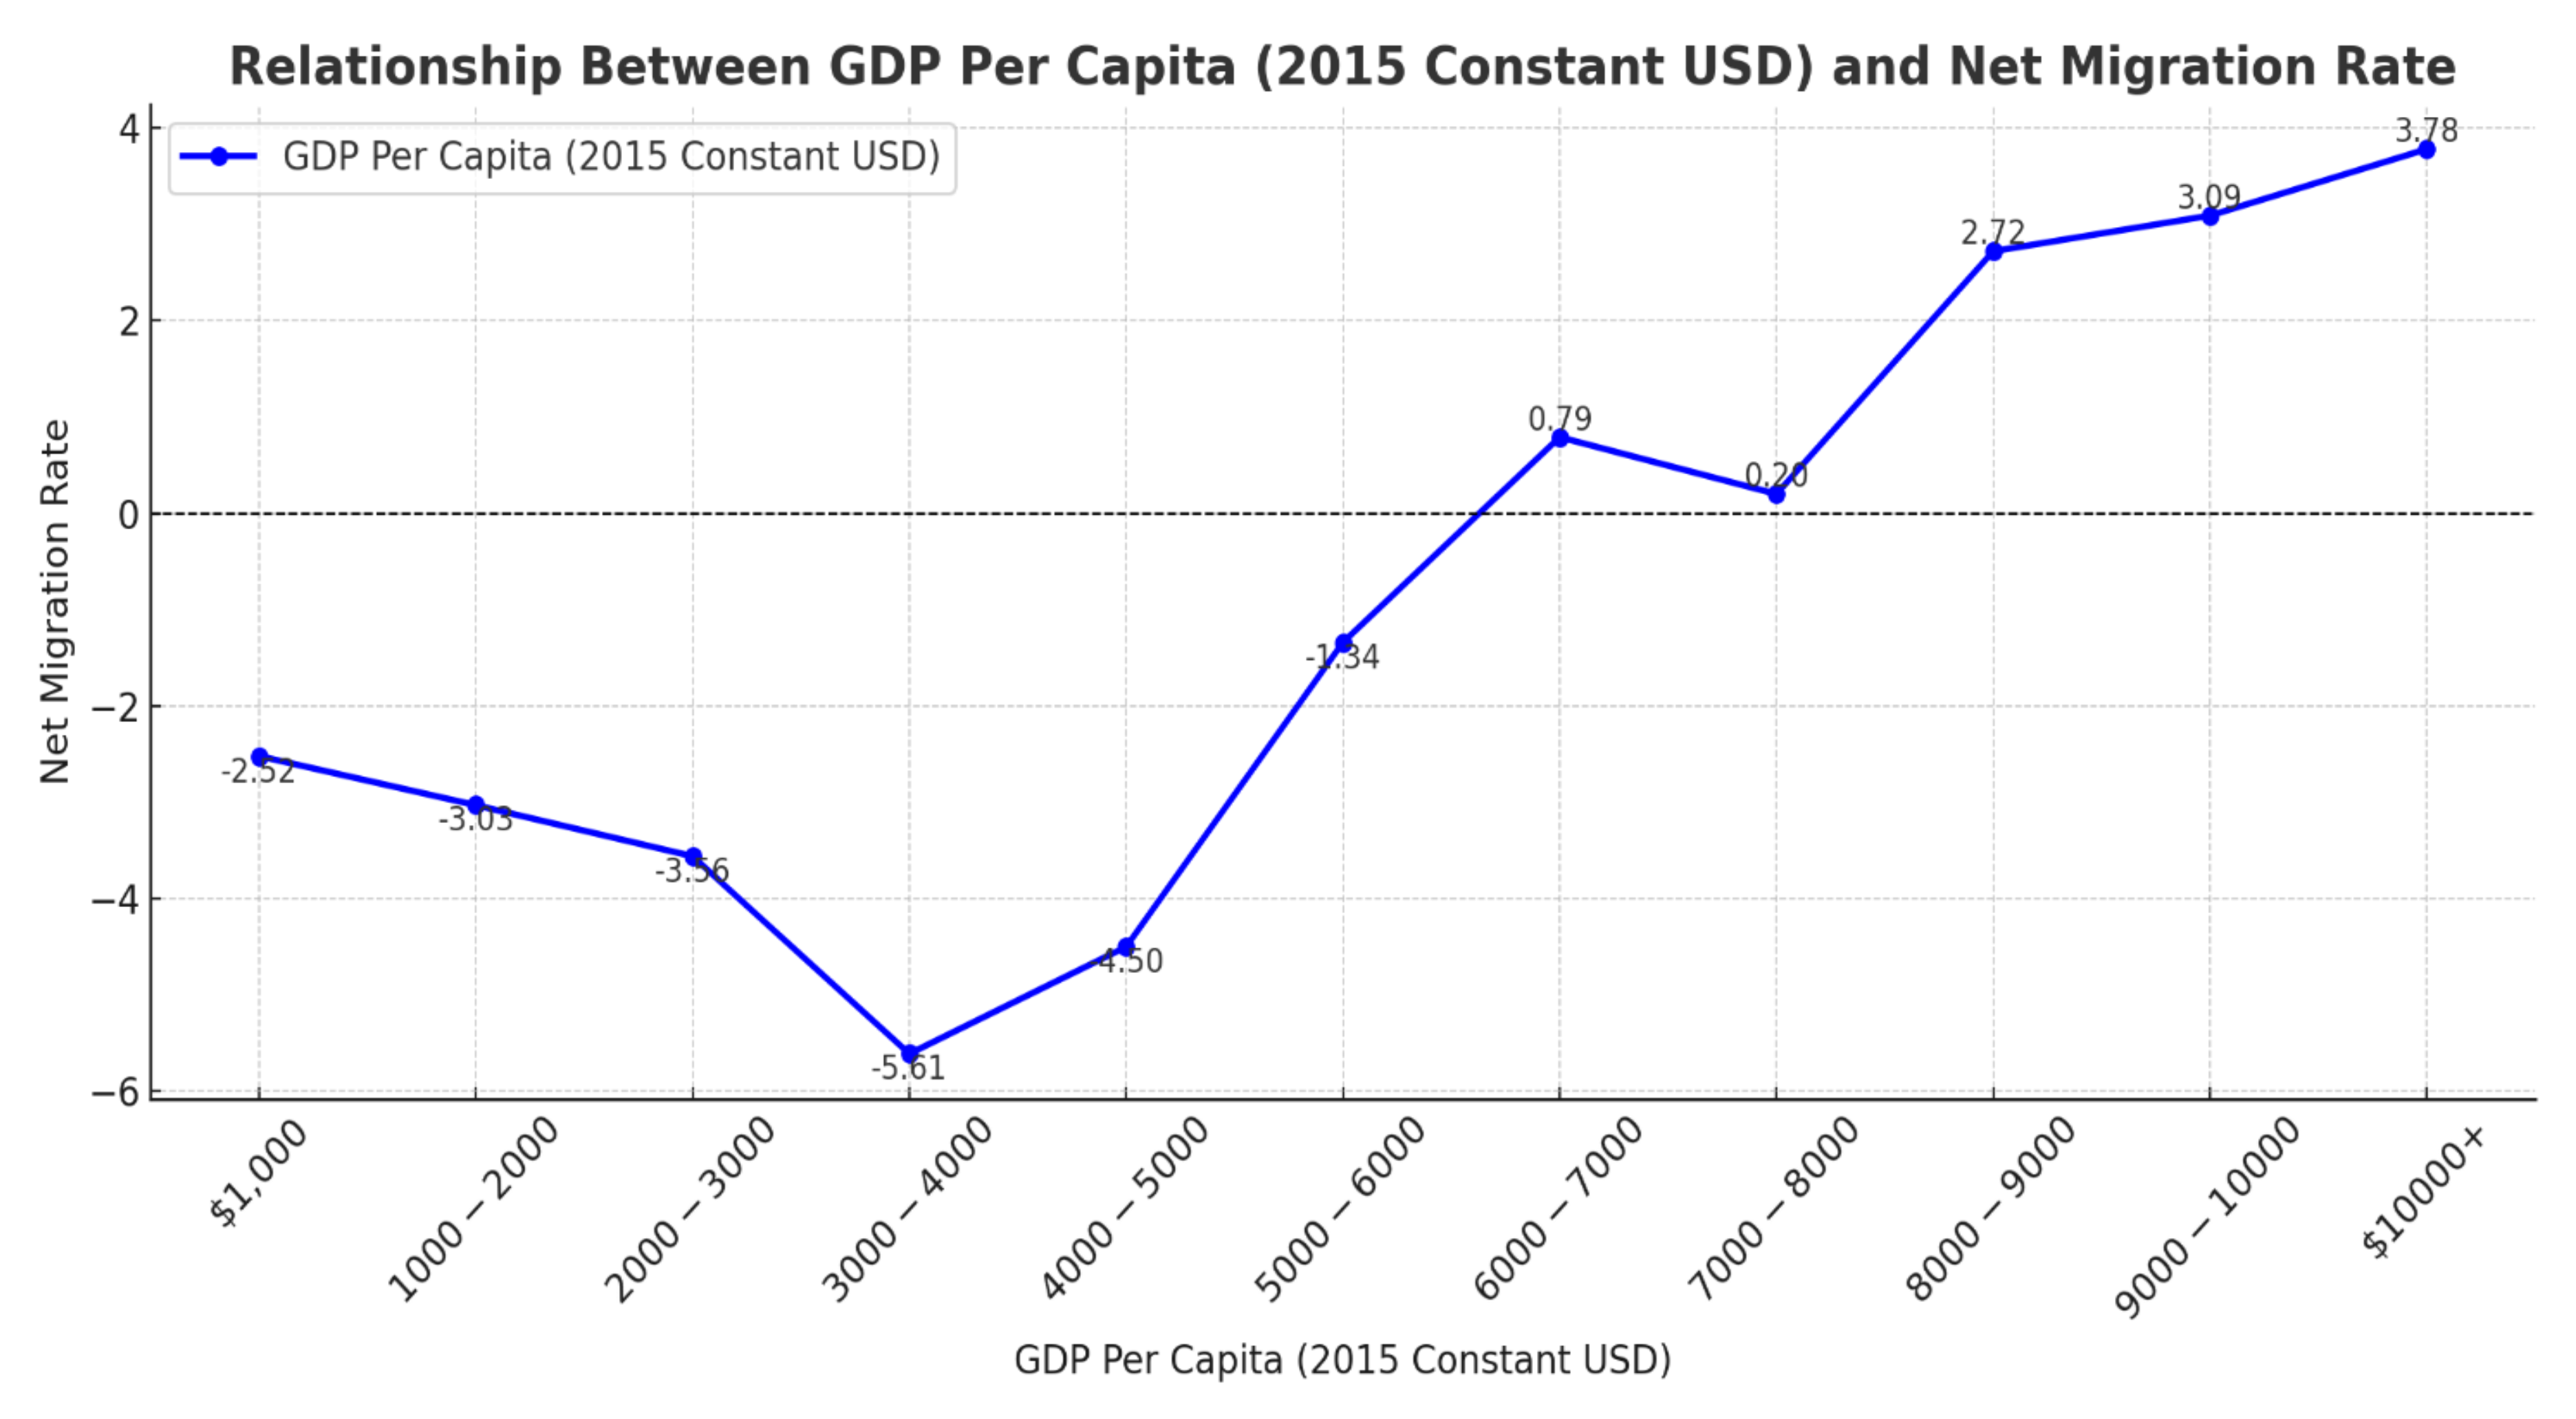
QDA-3 (Figure 10): Migration transitions in LMICs: GDPpc and net migration rates. |
Yes. Beyond $4,000, out-migration begins to decline, reaching the equilibrium stage at a GDP per capita of approximately $7,000. |
Partially yes. Countries with a GDP per capita below $2,000 exhibit negative but relatively stable net migration trends. |
Yes. Countries with a GDPpc between $2,000 and $4,000 experience a sharp decline in net migration, likely due to rising incomes enabling individuals to afford migration costs. |
Countries with a GDP per capita below $2,000 exhibit negative but relatively stable net migration trends. In contrast, countries with a GDP per capita between $2,000 and $4,000 experience a sharp decline in net migration, indicating a highly mobile population within this income range. Beyond $4,000, out-migration continues to decline, reaching an equilibrium stage at approximately $7,000 GDP per capita. |
| 4 |
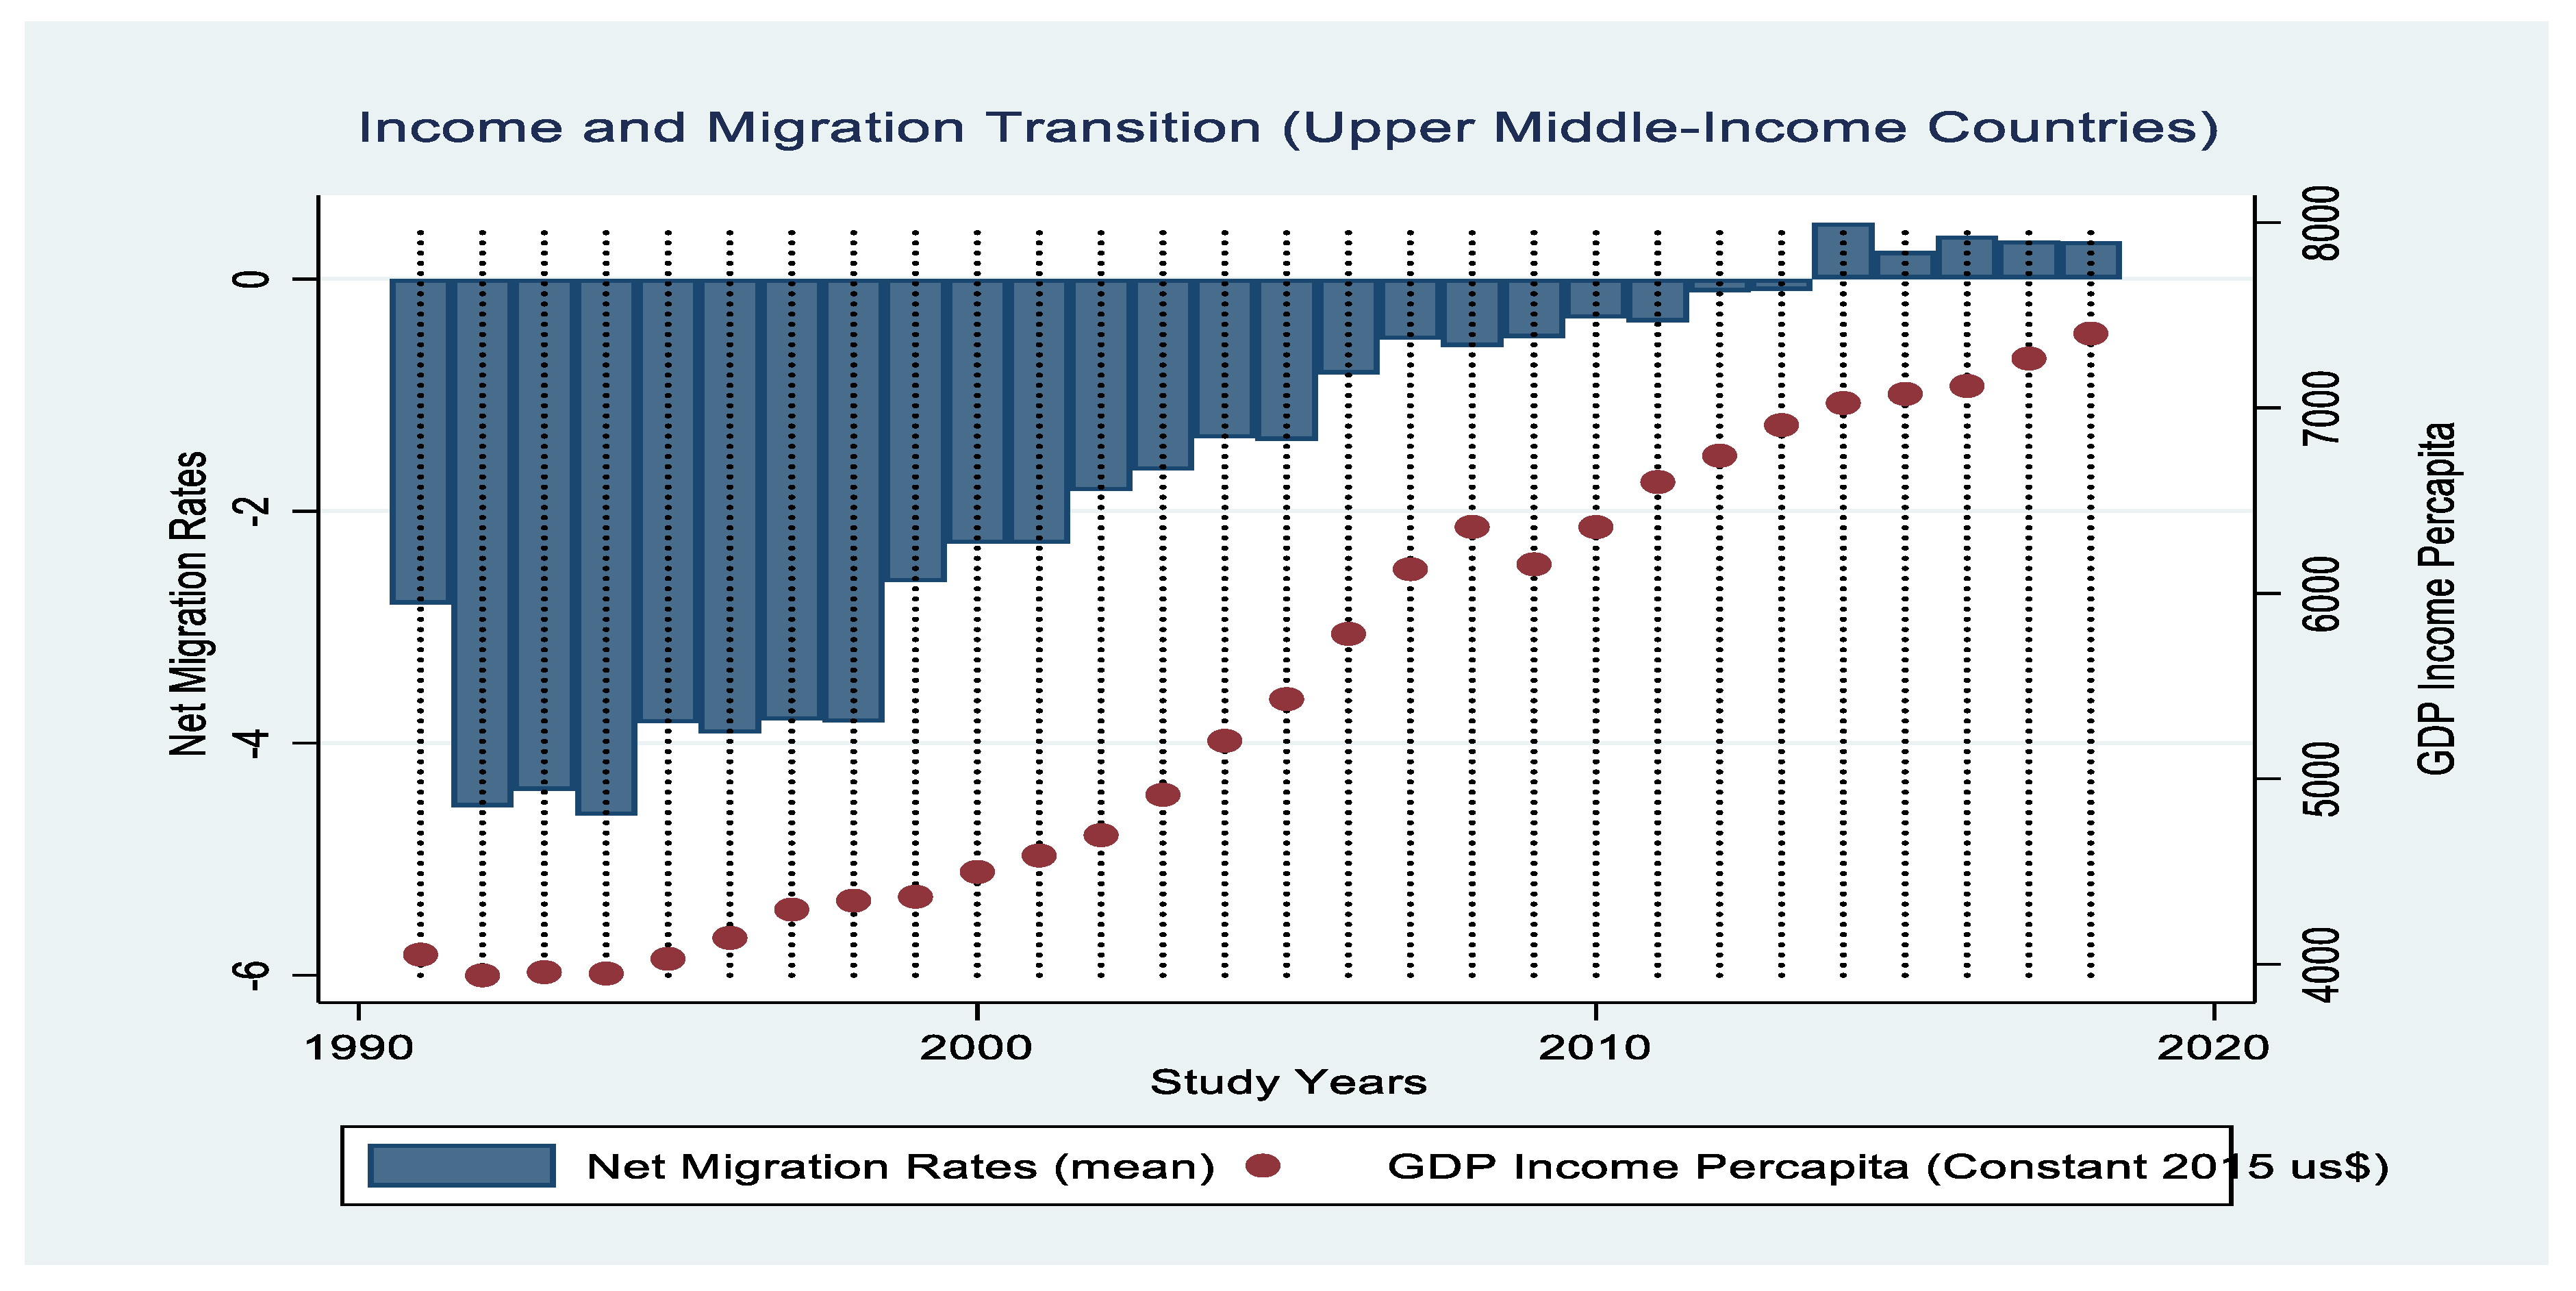
QDA-4 (Figure 11): Migration transitions in UMICs (1991-2018): How do GDPpc and HDI interact with net migration trends? |
Yes. The equilibrium point occurs at approximately a GDP per capita of $7,500 and an HDI of 0.78. |
NA | Yes. The equilibrium point occurs at approximately a GDP per capita of $7,500 and an HDI of 0.78. |
The equilibrium point occurs at approximately a GDP per capita of $7,500 and an HDI of 0.78. |
| 5 |
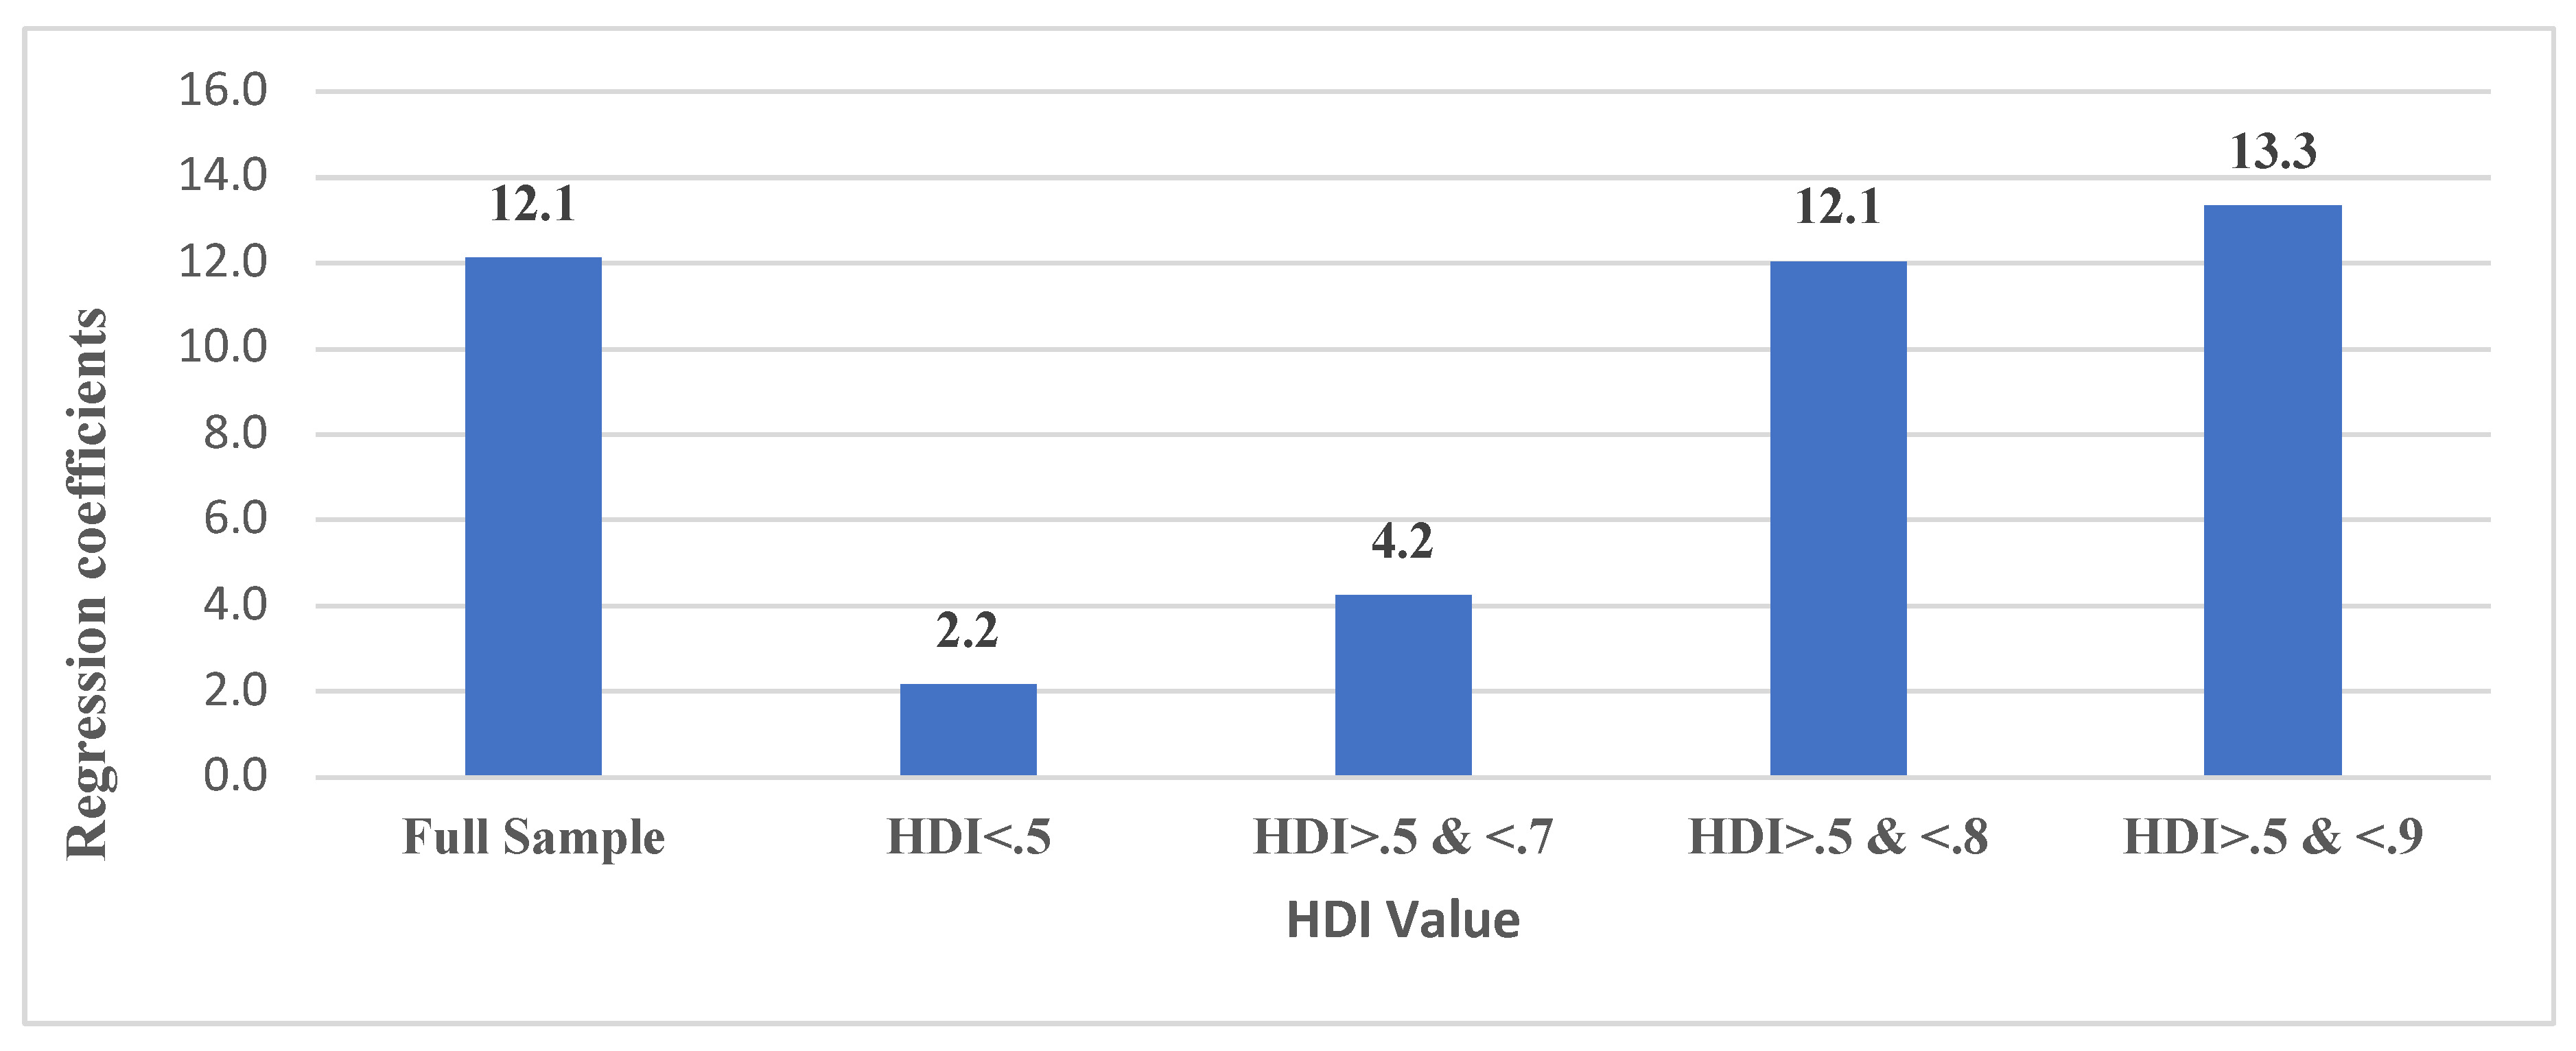
Regression Analysis (Table 1) Dependent Variable: NMR Explanatory Variable: HDI Models: accounting for different HDI thresholds. |
Yes. However, a linear relationship exists between HDI and NMR. |
Yes The lowest regression coefficient (2.2) for the subsample HDI < 0.5 indicates the state of capability constraints in low-income countries. |
Yes, The HDI brackets > 0.5 and < 0.8 and > 0.5 and < 0.9 coefficients are 12.05 and 13.34, respectively. These values indicate that HDI contributes to positive net migration. |
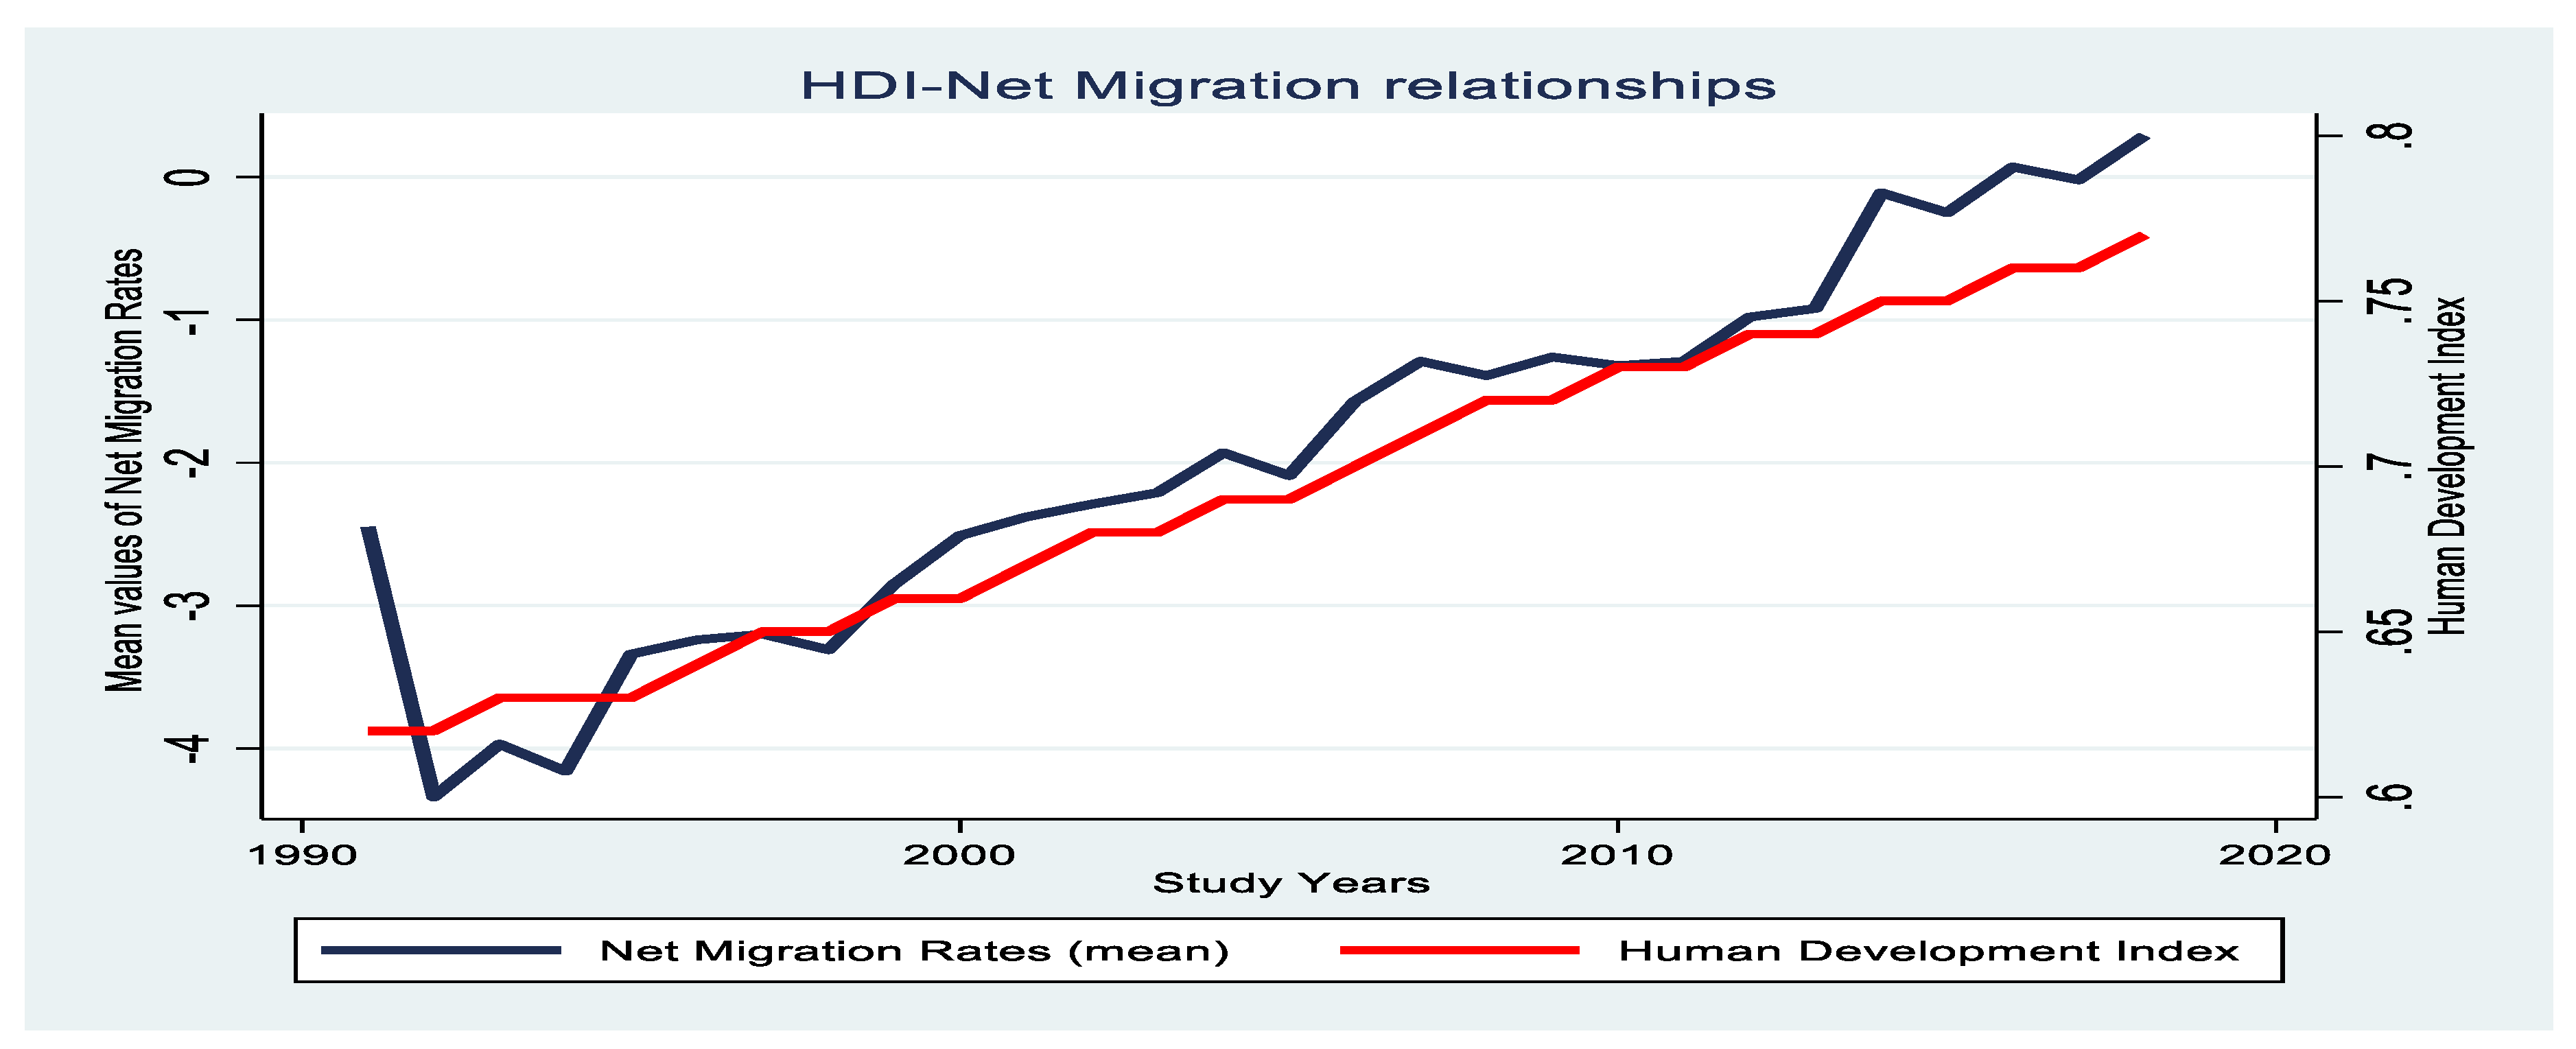
The coefficients for HDI are positive across all models, indicating that higher human development levels influence increased net migration rates and encourage people to stay or migrants to return. A linear relationship exists between HDI and NMR in LMICs, which questions previous claims that the relationship between development and migration is non-linear. |
| 6 |
Regression Analysis (Tables 2&3): Comparing the Impact of HDI and GDP per Capita on NMR |
Key Findings: The influence of HDI and GDP per capita on net migration varies significantly. HDI has a more substantial impact on positive net migration, with its effect being, on average, 10.69 times greater than GDPpc. The regression results question the theoretical assumption of non-linearity, revealing almost a linear relationship between development and migration. |
|||
5. Conclusions and Policy Implications and Limitations
5.1. Limitations and Suggestions for Future Research
Funding
Conflicts of Interest
Appendix A
| Variable name | Variable description | Obs | Mean | Std. Dev. | Min | Max |
| NMR | Net Migration Rate (NMR) of the countries | -2.47 | 6.22 | -35.72 | 31.41 | -2.47 |
| PerCap | GDPpc(constant 2015 US$) | 3281.87 | 2719.39 | 255.00 | 14223.00 | 3281.87 |
| GDPGRO | GDP growth (annual %) | 4.41 | 4.53 | -36.39 | 63.38 | 4.41 |
| UNEMP | Unemployment rates, total (% of total labor force/modeled ILO estimate) | 8.06 | 6.60 | 0.14 | 37.32 | 8.06 |
| GCF | Gross capital formation (annual % growth) | 7.36 | 22.36 | -137.64 | 435.62 | 7.36 |
| INFLATION | Inflation, consumer prices (annual %) | 7.18 | 12.05 | -16.86 | 325.00 | 7.18 |
| HDI | Human Development Index | 0.60 | 0.13 | 0.26 | 0.85 | 0.60 |
| Govt effect | Reflects perceptions of the quality of public services, the quality of the civil service | -0.50 | 0.56 | -2.26 | 1.25 | -0.50 |
| Civ Liberty | Civil Liberty Index (Proxy for Human Rights) | 0.65 | 0.22 | 0.06 | 0.97 | 0.65 |
| Civic Part | Civic Participation Index(a proxy for the level of democracy/ (VDEM) | 0.63 | 0.23 | 0.04 | 0.96 | 0.63 |
| INTERNET | Internet use (% of population) | 17.71 | 19.30 | 0.00 | 81.20 | 17.71 |
| MOBILE | Cellular Mobile Subscription (per 100 people) | 56.86 | 46.73 | 0.00 | 205.04 | 56.86 |
| ELECTRICITY | Access to electricity (% of population) | 68.56 | 31.83 | 1.28 | 100.00 | 68.56 |
| LIFEEXP | Life expectancy at birth, total (years) | 65.79 | 8.13 | 41.96 | 80.01 | 65.79 |
| REMITpGDP | Personal remittances received (% of GDP) | 5.93 | 7.44 | 0.01 | 53.83 | 5.93 |
| ECO FREEDOM | Economic Freedom Index | 55.43 | 7.78 | 21.40 | 76.30 | 55.43 |
| SecEduEnrol | School enrollment, secondary (% gross) | 66.00 | 27.32 | 6.11 | 134.44 | 66.00 |
| MMR | Maternal mortality ratio (modeled estimate per 100,000 live births) | 248.32 | 270.43 | 1.00 | 1366.00 | 248.32 |
| TFR | Fertility rate, total (births per woman) | 3.47 | 1.51 | 1.08 | 7.73 | 3.47 |
| POPGRO | Annual Population Growth of countries (%) | 1.56 | 1.18 | -2.17 | 5.63 | 1.56 |
| URBANPOP | Urban population (% of total population) | 46.86 | 19.05 | 12.98 | 91.87 | 46.86 |
| lnPOPTOTAL | Natural Logarithms of total Population of countries | 15.81 | 2.06 | 9.17 | 21.06 | 15.81 |
| Source: Author’s computation. | ||||||
Appendix B: Matrix of Correlations
Appendix B1: [Corresponding to Table 1 and Table 2: Correlation Matrix (Explanatory variable: HDI, Annual Data, 2000–2018)]
| Variables | (1) | (2) | (3) | (4) | (5) | (6) | (7) | (8) | (9) | (10) |
| (1) NMR_lag | 1.000 | |||||||||
| (2) HDI | 0.058 | 1.000 | ||||||||
| (3) UNEMP | -0.062 | 0.145 | 1.000 | |||||||
| (4) ECO_FREEDOM | -0.059 | 0.245 | 0.158 | 1.000 | ||||||
| (5) POPGRO | 0.509 | -0.527 | -0.240 | -0.178 | 1.000 | |||||
| (6) lnPOPTOTAL | 0.133 | 0.066 | -0.267 | -0.015 | -0.031 | 1.000 | ||||
| (7) INTERNET | 0.090 | 0.660 | 0.128 | 0.291 | -0.366 | 0.037 | 1.000 | |||
| (8) logMMR | 0.084 | -0.809 | -0.182 | -0.221 | 0.639 | -0.005 | -0.601 | 1.000 | ||
| (9) Civic_Part | -0.096 | -0.131 | -0.024 | 0.397 | 0.048 | -0.010 | 0.017 | 0.262 | 1.000 | |
| (10) Govt_effect | 0.071 | 0.457 | 0.126 | 0.532 | -0.302 | 0.149 | 0.416 | -0.381 | 0.246 | 1.000 |
Appendix B2:
| Variables | (1) | (2) | (3) | (4) | (5) | (6) | (7) | (8) | (9) | (10) |
| (1) NMR_lag | 1.000 | |||||||||
| (2) logPerCap | 0.243 | 1.000 | ||||||||
| (3) logUNEMP | -0.082 | 0.321 | 1.000 | |||||||
| (4) ECO_FREEDOM | -0.116 | 0.372 | 0.174 | 1.000 | ||||||
| (5) POPGRO | 0.508 | -0.338 | -0.259 | -0.277 | 1.000 | |||||
| (6) lnPOPTOTAL | 0.146 | -0.015 | -0.218 | -0.013 | -0.026 | 1.000 | ||||
| (7) INTERNET | 0.087 | 0.609 | 0.177 | 0.321 | -0.354 | 0.019 | 1.000 | |||
| (8) Civic_Part | -0.116 | -0.049 | -0.053 | 0.349 | 0.016 | -0.031 | -0.007 | 1.000 | ||
| (9) logMMR | 0.093 | -0.675 | -0.258 | -0.333 | 0.644 | -0.007 | -0.623 | 0.204 | 1.000 | |
| (10) INFLATION | 0.056 | -0.045 | 0.033 | -0.216 | 0.078 | 0.086 | -0.134 | -0.175 | 0.031 | 1.000 |
Appendix C: Dynamic Panel-Data Estimation Equations (Two-Step System GMM)
Appendix C-1: [Corresponding to Table 1 (Aggregated by Different HDI Levels)]
| xtabond2 NMR NMR_lag HDI UNEMP ECO_FREEDOM POPGRO lnPOPTOTAL INTERNET, gmm(NMR_lag HDI, lag(1 1)) iv(NMR_lag2 HDI_lag2 ELECTRICITY LIFEEXP) twostep robust | |
| xtabond2 NMR NMR_lag HDI UNEMP ECO_FREEDOM POPGRO lnPOPTOTAL INTERNET if HDI<.5, gmm(NMR_lag HDI, lag(1 1)) iv(NMR_lag2 HDI_lag2 ELECTRICITY LIFEEXP) twostep robust | |
| xtabond2 NMR NMR_lag HDI UNEMP ECO_FREEDOM POPGRO lnPOPTOTAL INTERNET if HDI>.5 & HDI<.7, gmm(NMR_lag HDI, lag(1 1)) iv(NMR_lag2 HDI_lag2 ELECTRICITY LIFEEXP) twostep robust | |
| xtabond2 NMR NMR_lag HDI UNEMP ECO_FREEDOM POPGRO lnPOPTOTAL INTERNET if HDI>.5 & HDI<.8, gmm(NMR_lag HDI, lag(1 1)) iv(NMR_lag2 HDI_lag2 ELECTRICITY LIFEEXP) twostep robust | |
| xtabond2 NMR NMR_lag HDI UNEMP ECO_FREEDOM POPGRO lnPOPTOTAL INTERNET if HDI>.5 & HDI<.9, gmm(NMR_lag HDI, lag(1 1)) iv(NMR_lag2 HDI_lag2 ELECTRICITY LIFEEXP) twostep robust |
Appendix C-2: [Corresponding to Table 2 (Employing Different Sets of Control Variables for HDI)]
| xtabond2 NMR NMR_lag HDI log UNEMP ECO_FREEDOM POPGRO lnPOPTOTAL logMMR, gmm(NMR_lag HDI, lag(1 1)) iv(NMR_lag2 HDI_lag2 ELECTRICITY LIFEEXP) twostep robust | |
| xtabond2 NMR NMR_lag HDI UNEMP ECO_FREEDOM POPGRO lnPOPTOTAL INTERNET, gmm(NMR_lag HDI, lag(1 1)) iv(NMR_lag2 HDI_lag2 ELECTRICITY LIFEEXP) twostep robust | |
| xtabond2 NMR NMR_lag HDI UNEMP ECO_FREEDOM POPGRO lnPOPTOTAL INTERNET Civic_Part, gmm(NMR_lag HDI, lag(1 1)) iv(NMR_lag2 HDI_lag2 ELECTRICITY LIFEEXP) twostep robust | |
| xtabond2 NMR NMR_lag HDI UNEMP ECO_FREEDOM POPGRO lnPOPTOTAL INTERNET logMMR, gmm(NMR_lag HDI, lag(1 1)) iv(NMR_lag2 HDI_lag2 ELECTRICITY LIFEEXP) twostep robust. | |
| xtabond2 NMR NMR_lag HDI UNEMP ECO_FREEDOM POPGRO lnPOPTOTAL INTERNET logMMR Civic_Part, gmm(NMR_lag HDI, lag(1 1)) iv(NMR_lag2 HDI_lag2 ELECTRICITY LIFEEXP) twostep robust |
Appendix C-3: [Corresponding to Table 3 (Employing Different Sets of Control Variables for GDP per capita)]
| xtabond2 NMR NMR_lag logPerCap logUNEMP ECO_FREEDOM POPGRO lnPOPTOTAL, gmm(NMR_lag logPerCap, lag(1 1)) iv(NMR_lag2 logPerCapL2 logUNEMPL1 ELECTRICITY LIFEEXP ) twostep robust | |
| xtabond2 NMR NMR_lag logPerCap logUNEMP ECO_FREEDOM POPGRO lnPOPTOTAL INTERNET, gmm(NMR_lag logPerCap, lag(1 1)) iv(NMR_lag2 logPerCapL2 logUNEMPL1 ELECTRICITY LIFEEXP) twostep robust | |
| xtabond2 NMR NMR_lag logPerCap logUNEMP ECO_FREEDOM POPGRO lnPOPTOTAL INTERNET logMMR, gmm(NMR_lag logPerCap, lag(1 1)) iv(NMR_lag2 logPerCapL2 logUNEMPL1 ELECTRICITY LIFEEXP ) twostep robust | |
| xtabond2 NMR NMR_lag logPerCap logUNEMP ECO_FREEDOM POPGRO lnPOPTOTAL INTERNET logMMR Civic_Part, gmm(NMR_lag logPerCap, lag(1 1)) iv(NMR_lag2 logPerCapL2 logUNEMPL1 ELECTRICITY LIFEEXP ) twostep robust | |
| xtabond2 NMR NMR_lag logPerCap logUNEMP ECO_FREEDOM POPGRO lnPOPTOTAL INTERNET Civic_Part logMMR INFLATION, gmm(NMR_lag logPerCap, lag(1 1)) iv(NMR_lag2 logPerCapL2 logUNEMPL1 ELECTRICITY) twostep robust |
Appendix D: [List of Selected Low- and Middle-Income Countries (109 Countries) as of 2022]
Appendix D-1: [List of Selected Upper-Middle-Income Countries (33 Countries) as of 2022]
References
- Adams Jr, R. H. (2011). Evaluating the economic impact of international remittances on developing countries using household surveys: A literature review. Journal of Development Studies, 47(6), 809–828.
- Arellano, M., & Bover, O. (1995). Another look at the instrumental variable estimation of error-components models. Journal of Econometrics, 68(1), 29–51. [CrossRef]
- Bailey, A. J. (2001). Worlds in motion: Understanding international migration at the end of the millennium. Oxford: Clark University. [CrossRef]
- Bencek, D., & Schneiderheinze, C. (2020). Higher economic growth in poor countries, lower migration flows to the OECD: Revisiting the migration hump with panel data. (No. 2145). Kiel: Kiel Institute for the World Economy (IfW). Retrieved from https://www.econstor.eu/handle/10419/231567.
- Benhamou, Z. A., & Cassin, L. (2021). The impact of remittances on savings, capital and economic growth in small emerging countries. Economic Modelling, 94, 789–803. [CrossRef]
- Blundell, R., & Bond, S. (2000). GMM estimation with persistent panel data: An application to production functions. Econometric Reviews, 19(3), 321–340. [CrossRef]
- Borjas, G. J. (1989). Economic theory and international migration. International Migration Review, 23(3), 457–485.
- Carling, J. (2002). Migration in the age of involuntary immobility: Theoretical reflections and cape verdean experiences. Journal of Ethnic and Migration Studies, 28(1), 5–42. [CrossRef]
- Carling, J. (2020). Remittances. Routledge handbook of migration and development (1st ed., pp. 114–124) Routledge. Retrieved from https://www.taylorfrancis.com/books/9781315276908/chapters/10.4324/9781315276908-10. [CrossRef]
- Castles, S., & Miller, M. J. (2009). The age of migration (4. ed., rev. and updated ed.). Basingstoke, Hampshire [u.a.]: Palgrave Macmillan. Retrieved from http://bvbr.bib-bvb.de:8991/F?func=service&doc_library=BVB01&local_base=BVB01&doc_number=018697476&sequence=000001&line_number=0001&func_code=DB_RECORDS&service_type=MEDIA.
- Clemens, M. A. (2014). Does development reduce migration? International handbook on migration and economic development (pp. 152–185) Elgar. Retrieved from http://www.econis.eu/PPNSET?PPN=815768907.
- Clemens, M. A. (2020). The emigration life cycle: How development shapes emigration from poor countries SSRN. [CrossRef]
- Dao, T. H., Docquier, F., Parsons, C., & Peri, G. (2018). Migration and development: Dissecting the anatomy of the mobility transition. Journal of Development Economics, 132, 88–101. [CrossRef]
- De Haas, H. (1998). Socio-economic transformations and oasis agriculture in southern morocco. Looking at Maps in the Dark: Directions for Geographical Research in Land Management and Sustainable Development in Rural and Urban Environments of the Third World,, 65–78.
- De Haas, H. (2007). Morocco’s migration experience: A transitional Perspective1. International Migration, 45(4), 39–70. [CrossRef]
- De Haas, H. (2010a). Migration and development: A theoretical perspective. The International Migration Review, 44(1), 227–264. [CrossRef]
- De Haas, H. (2010b). Migration transitions: A theoretical and empirical inquiry into the developmental drivers of international migration.
- De Haas, H. (2011). The determinants of international migration: Conceptualising policy, origin and destination effects.
- de Haas, H. (2014). Migration theory: Quo vadis? Zenodo. [CrossRef]
- De Haas, H. (2021). A theory of migration: The aspirations-capabilities framework. Comparative Migration Studies, 9(1), 8. [CrossRef]
- de Haas, H., & Rodríguez, F. (2010). Mobility and human development: Introduction. Journal of Human Development and Capabilities, 11(2), 177–184. [CrossRef]
- Douglas S. Massey. (1999). Why does immigration occur? Handbook of international migration, the (pp. 34) Russell Sage Foundation. Retrieved from https://www.jstor.org/stable/10.7758/9781610442893.9.
- Feld, S. (2021). International migration, remittances and brain drain : Impacts on development (1st ed.). Cham: Springer International Publishing. Retrieved from https://library.biblioboard.com/viewer/a83605dc-0611-11ec-8acb-0a9b31268bf5. [CrossRef]
- Giang, L. T., Nguyen, C. V., & Nguyen, H. Q. (2020). The impacts of economic growth and governance on migration: Evidence from vietnam. The European Journal of Development Research, 32, 1195–1229. [CrossRef]
- Haas, H. d., 1969, Castles, S., & Miller, M. J. (2019). The age of migration : International population movements in the modern world (Sixth edition. ed.). London: Red Globe Press. Retrieved from https://www.perlego.com/book/2997206/the-age-of-migration-international-population-movements-in-the-modern-world-pdf.
- Hagen-Zanker, J. (2008). Why do people migrate? A review of the theoretical literature. A Review of the Theoretical Literature (January 2008).Maastrcht Graduate School of Governance Working Paper No,.
- Hanlon, B., & Vicino, T. J. (2014). Global migration : The basics : Pbk Routledge.
- Harris, J. R., & Todaro, M. P. (1970). Migration, unemployment and development: A two-sector analysis. The American Economic Review, 60(1), 126–142.
- Harris, N. (2005). Migration and development. Economic and Political Weekly,, 4591–4595.
- Hsing, Y. (1996). Impacts of government policies, economic conditions, and past migration on net migration in the USA: 1992–93. Applied Economics Letters, 3(7), 441–444.
- IOM. (2022). World migration report 2022.
- IOM Report. (2024). World migration report 2024 (1st ed.). Bloomfield: United Nations. Retrieved from https://www.perlego.com/book/4416394/world-migration-report-2024-pdf.
- Jennissen, R. (2003). Economic determinants of net international migration in western europe. European Journal of Population, 19(2), 171–198. [CrossRef]
- Kolbe, M. (2021). International migration. In Money and Lockhart (Ed.), Introduction to international migration (1st ed., pp. 13–37) Routledge. Retrieved from https://www.taylorfrancis.com/books/9781003167631/chapters/10.4324/9781003167631-3. [CrossRef]
- Lee, E. S. (1966). A theory of migration. Demography, 3, 47–57.
- Lucas, R. E. (2006). Migration and economic development in africa: A review of evidence. Journal of African Economies, 15(suppl_2), 337–395. [CrossRef]
- Maimbo, S. M., & Ratha, D. (2005). Remittances : Development impact and future prospects (1st ed.). Herndon: World Bank. Retrieved from https://ebookcentral.proquest.com/lib/[SITE_ID]/detail.action?docID=3050812. [CrossRef]
- Massey, D. S., Arango, J., Hugo, G., Kouaouci, A., Pellegrino, A., & Taylor, J. E. (1993). Theories of international migration: A review and appraisal. Population and Development Review, 19(3), 431–466. [CrossRef]
- Mehmetoglu, M., & Jakobsen, T. G. (2022). Applied statistics using stata : A guide for the social sciences (2nd ed ed.). Thousand Oaks: SAGE. Retrieved from https://app.talis.com/textbooks/9781529786484.
- Michael A. Clemens. (2014). Does development reduce migration? Edward elgar publishing eBooks (pp. 152–185). United Kingdom: Edward Elgar Publishing. Retrieved from http://www.elgaronline.com/view/9781782548065.00010.xml. [CrossRef]
- Miller, E. (1973). Is out-migration affected by economic conditions? Southern Economic Journal, 39(3), 396–405. [CrossRef]
- Nikolova, M. (2023). The relationship between inequality and potential emigration: Evidence from the gallup world poll. The International Migration Review. [CrossRef]
- Özden, C., & Schiff, M. W. (2006). International migration, remittances, and brain drain / caglar ozden, maurice schiff, editors. Washington, DC: World Bank.
- Pan, X., & Sun, C. (2024). Internal migration, remittances and economic development. Journal of International Economics, 147, 103845. [CrossRef]
- Postel-Vinay, F., & Domingues Dos Santos, M. (2003). Migration as a source of growth: The perspective of a developing country. Journal of Population Economics, 16(1), 161–175. Retrieved from http://econpapers.repec.org/article/sprjopoec/v_3a16_3ay_3a2003_3ai_3a1_3ap_3a161-175.htm.
- Ravenstein, E. G. (1885). The laws of migration. Paper presented at the.
- Roodman, D. (2009). How to do xtabond2: An introduction to difference and system GMM in stata. The Stata Journal, 9(1), 86–136. [CrossRef]
- Schlottmann, A. M., & Herzog, H. W. J. (1982). Home economic conditions and the decision to migrate: New evidence for the U.S. labor force. Southern Economic Journal, 48(4), 950–961. [CrossRef]
- Simpson, N. B. (2022). Demographic and economic determinants of migration. IZA World of Labor. [CrossRef]
- Skeldon, R. (1997). Rural-to-urban migration and its implications for poverty alleviation. Asia Pacific Population Journal, 12, 3–16. [CrossRef]
- Todaro, M. P. (1969). A model of labor migration and urban unemployment in less developed countries. The American Economic Review, 59(1), 138–148.
- UNDP. (2024). Human development report 2023/2024.
- Wahba, J. (2021). Who benefits from return migration to developing countries? IZA World of Labor. [CrossRef]
- Zelinsky, W. (1971). The hypothesis of the mobility transition. Geographical Review, 219–249. [CrossRef]
|
Dependent Variable: Net Migration Rate (NMR) of the countries Explanatory Variable: Human Development Index (HDI) – a proxy for socioeconomic development Data: A dataset comprising 109 LMICs for the period 2000–2018 | |||||
| Econometric Model | Two-step System GMM | ||||
| (Model 1) | (Model 2) | (Model 3) | (Model 4) | (Model 5) | |
| VARIABLES | NMR | NMR | NMR | NMR | NMR |
| Full Sample | HDI<.5 | HDI>.5 & <.7 | HDI>.5 & <.8 | HDI>.5 & <.9 | |
| NMR_lag | 0.556*** | 0.510*** | 0.858*** | 0.764*** | 0.726*** |
| (0.177) | (0.179) | (0.0694) | (0.105) | (0.130) | |
| HDI | 12.13* | 2.177 | 4.239* | 12.05* | 13.34* |
| (6.908) | (7.768) | (2.460) | (6.540) | (7.874) | |
| UNEMP | 0.216* | 0.000758 | 0.0498 | 0.120** | 0.160** |
| (0.117) | (0.140) | (0.0443) | (0.0491) | (0.0745) | |
| ECO_FREEDOM | 0.190 | 0.0639 | -0.000394 | -0.0436 | 0.0273 |
| (0.162) | (0.0778) | (0.0371) | (0.0530) | (0.0591) | |
| POPGRO | 2.724** | 2.130* | 0.760* | 1.512* | 1.805* |
| (1.282) | (1.291) | (0.454) | (0.799) | (0.968) | |
| lnPOPTOTAL | 1.431** | 0.637 | 0.333 | 0.382* | 0.661* |
| (0.621) | (0.599) | (0.301) | (0.202) | (0.355) | |
| INTERNET | -0.0138 | 0.0479 | -0.00337 | -0.00817 | -0.0131 |
| (0.0123) | (0.0456) | (0.00765) | (0.00932) | (0.0119) | |
| Constant | -47.91*** | -20.79 | -9.848 | -14.97** | -25.04** |
| (16.27) | (13.06) | (8.284) | (6.455) | (12.04) | |
| Observations | 1,611 | 391 | 704 | 1,149 | 1,216 |
| Number of Group (N) | 101 | 37 | 74 | 88 | 88 |
| Number of Instruments | 71 | 71 | 71 | 71 | 71 |
| AR(1) | 0.024 | 0.000 | 0.029 | 0.092 | 0.081 |
| AR(2) | 0.135 | 0.138 | 0.839 | 0.459 | 0.354 |
| Hansen Statistic | 0.648 | 0.029 | 0.198 | 0.028 | 0.127 |
|
Dependent Variable: Net Migration Rate (NMR) of the countries Explanatory Variable: Human Development Index (HDI) – a proxy for socioeconomic development |
Data: 109 LMICs (2000–2018) Robustness Check: By employing various control variables in the estimation equations |
|||||
| Econometric Model | Two-step System GMM | |||||
| (Model 1) | (Model 2) | (Model 3) | (Model 4) | (Model 5) | ||
| VARIABLES | NMR | NMR | NMR | NMR | NMR | |
| NMR_lag | 0.546*** | 0.556*** | 0.528*** | 0.531*** | 0.515*** | |
| (0.167) | (0.177) | (0.180) | (0.175) | (0.177) | ||
| HDI | 9.144* | 12.13* | 12.91* | 11.89* | 13.79* | |
| (4.965) | (6.908) | (7.358) | (6.634) | (7.751) | ||
| UNEMP | 0.232** | 0.216* | 0.211* | 0.217* | 0.214** | |
| (0.110) | (0.117) | (0.110) | (0.114) | (0.106) | ||
| ECO_FREEDOM | 0.129 | 0.190 | 0.171 | 0.166 | 0.153 | |
| (0.116) | (0.162) | (0.136) | (0.141) | (0.117) | ||
| POPGRO | 2.768** | 2.724** | 2.949** | 3.005** | 3.101** | |
| (1.325) | (1.282) | (1.267) | (1.414) | (1.402) | ||
| lnPOPTOTAL | 1.317** | 1.431** | 1.294** | 1.360** | 1.230** | |
| (0.577) | (0.621) | (0.597) | (0.589) | (0.599) | ||
| logMMR | -0.249 | -0.216 | -0.0474 | |||
| (0.826) | (0.917) | (1.008) | ||||
| INTERNET | -0.0138 | -0.0125 | -0.0131 | -0.0133 | ||
| (0.0123) | (0.0131) | (0.0136) | (0.0130) | |||
| Civic_Part | -1.330 | -1.307 | ||||
| (3.968) | (3.899) | |||||
| Constant | -40.06*** | -47.91*** | -44.62*** | -44.73** | -43.14** | |
| (14.51) | (16.27) | (14.42) | (17.59) | (17.10) | ||
| Observations | 1,641 | 1,611 | 1,552 | 1,611 | 1,552 | |
| Number of Group (N) | 101 | 101 | 97 | 101 | 97 | |
| Number of Instruments | 71 | 71 | 71 | 71 | 71 | |
| AR(1) | 0.024 | 0.024 | 0.026 | 0.024 | 0.026 | |
| AR(2) | 0.135 | 0.135 | 0.133 | 0.131 | 0.130 | |
| Hansen Statistic | 0.648 | 0.648 | 0.393 | 0.655 | 0.394 | |
| The Influence of Domestic Socioeconomic Factors on Migration Decisions in LMICs | ||||||
|
Dependent Variable: Net Migration Rate (NMR) of the countries Explanatory Variable: GDPpc(log-transformed, constant 2015 US$) – used as a proxy for socioeconomic development. |
Robustness Check: Conducted by employing various control variables in the estimation equations Data: Analysis based on a dataset comprising 109 LMICs from 2000–2018. |
|||||
| Econometric Model | Two-step System GMM | |||||
| (Model 1) | (Model 2) | (Model 3) | (Model 4) | (Model 5) | ||
| VARIABLES | NMR | NMR | NMR | NMR | NMR | |
| NMR_lag | 0.621*** | 0.592*** | 0.576*** | 0.567*** | 0.642*** | |
| (0.138) | (0.151) | (0.150) | (0.150) | (0.145) | ||
| logPerCap | 0.994* | 1.171* | 1.244* | 1.352* | 1.785** | |
| (0.534) | (0.629) | (0.682) | (0.765) | (0.850) | ||
| logUNEMP | 0.544 | 0.558 | 0.523 | 0.485 | 0.737* | |
| (0.363) | (0.403) | (0.436) | (0.643) | (0.416) | ||
| ECO_FREEDOM | 0.127 | 0.180 | 0.170 | 0.156 | -0.00914 | |
| (0.106) | (0.127) | (0.121) | (0.127) | (0.104) | ||
| POPGRO | 1.746** | 1.901** | 2.083* | 2.221** | 0.893 | |
| (0.695) | (0.791) | (1.095) | (1.008) | (0.845) | ||
| lnPOPTOTAL | 1.286** | 1.565** | 1.513** | 1.495* | 1.542** | |
| (0.579) | (0.717) | (0.744) | (0.891) | (0.701) | ||
| INTERNET | -0.00988 | -0.0107 | -0.0120 | 0.00523 | ||
| (0.0103) | (0.0106) | (0.0120) | (0.0104) | |||
| Civic_Part | -1.305 | -3.005 | ||||
| (3.302) | (3.268) | |||||
| logMMR | -0.0899 | -0.00801 | 1.217 | |||
| (0.714) | (0.806) | (0.830) | ||||
| INFLATION | -0.0262 | |||||
| (0.0213) | ||||||
| Constant | -40.03** | -48.93** | -47.95** | -47.54** | -45.52** | |
| (16.21) | (19.60) | (20.35) | (21.55) | (18.96) | ||
| Observations | 1,666 | 1,634 | 1,634 | 1,555 | 1,453 | |
| Number of Group (N) | 103 | 103 | 103 | 97 | 93 | |
| Number of Instruments | 72 | 72 | 72 | 72 | 71 | |
| AR(1) | 0.021 | 0.024 | 0.024 | 0.027 | 0.034 | |
| AR(2) | 0.126 | 0.145 | 0.143 | 0.137 | 0.092 | |
| Hansen Statistic | 0.319 | 0.253 | 0.209 | 0.325 | 0.450 | |
Disclaimer/Publisher’s Note: The statements, opinions and data contained in all publications are solely those of the individual author(s) and contributor(s) and not of MDPI and/or the editor(s). MDPI and/or the editor(s) disclaim responsibility for any injury to people or property resulting from any ideas, methods, instructions or products referred to in the content. |
© 2025 by the authors. Licensee MDPI, Basel, Switzerland. This article is an open access article distributed under the terms and conditions of the Creative Commons Attribution (CC BY) license (http://creativecommons.org/licenses/by/4.0/).


