1. Introduction
The
indoor air radon activity concentration IRC is influenced by several factors. These include mainly geological factors, such as the rock subsoil and the soil conditions under the building, the condition of the building (type of foundation, insulation, etc.), the usage behaviour of the residents (ventilation habits, room temperature, etc.), as well as meteorological influences (outside temperature, air pressure, etc.) [
1]. Due to the influences mentioned, the IRC is subject to fundamental changes over time [
2]. Buildings therefore also have diurnal, seasonal and annual behaviour in relation to the IRC [
3]. Since this paper does not seek to determine the absolute IRC value, but rather the temporal variability of the IRC in relation to the annual mean IRC, the primary influences on the IRC value are to be found in meteorology and user behaviour.
Several studies indicate that the indoor air radon activity concentration IRC (Bq/m³) is influenced by meteorological parameters [1, 4, 5]. Miles et al showed in a study that the IRC in different houses reacts very differently to outside temperature, wind speed and wind direction [
4]. A Swiss study by Rey et al shows that the outside temperature is the parameter that most strongly affects the IRC and usually anticorrelates with the IRC. The IRC also depends on the wind, but the influence on the intensity and on the wind direction is arriving, as well as on the construction of the building. The amount of precipitation also influences the height of the IRC. External air pressure and relative humidity do not appear to be major factors influencing the IRC [
1].
A number of studies have found that IRC in a variety of countries generally follows seasonal variations. These show that the most common behavioural pattern corresponds to high IRC in winter and low concentrations in the summer months [6, 7, 8]. One reason for this is the occurrence of the chimney effect in winter due to increased heating behaviour of residents. In summer, on the other hand, high outside temperatures cause the pressure indoors to be greater than outside, thus generally reducing the amount of inert gas that can penetrate. Another reason for a lower IRC in the summer months is the ventilation behaviour of the residents. Due to the higher temperatures in the summer months, residents normally ventilate more frequently, which dilutes the radon with the outside air and consequently lowers the IRC [
1].
The level of IRC also depends on the residents’ usage behaviour [
9]. A major factor is ventilation behaviour, since intensive ventilation leads to a high rate of air exchange with the outside air and a large proportion of the radon gas can escape into the open air [
2], [
10]. The IRC can return to its initial level just two hours after ventilation [
11]. Since people tend to ventilate less at night, there is often an increase in IRC [
9]. Not only the exchange of air with the outside air, but also the exchange of air within a building, for example by opening interior doors, influences the level and the temporal course of the IRC in the respective rooms [
9].
In addition to ventilation behaviour, IRC also depends on the heating behaviour of the residents [
9]. When it is cold outside, turning up the heating creates a large temperature difference between the inside of the house and the outside. The warmer air inside has a lower density than the cold air outside and rises. The resulting drop in pressure causes cold air to flow in from the ground and the surrounding area at the foundation, which can also cause radon gas to enter the house [1, 9, 12]. Since this phenomenon is often observed with chimneys, it is commonly referred to as the ‘stack effect’ [
13].
Due to the seasonal variations in meteorological influences, the assessment of the mean annual IRC legally in Austria requires long-term measurement of the activity concentration over a period of at least six months, with at least half of the measurement time being in the winter season (specified, for example, for certain workplaces in Annex 2 to Section 5 of the Austrian Radon Protection Ordinance) [
14]. In certain cases – e.g. because of possible health risks associated with greatly increased IRC, for a rapid assessment of the effectiveness of radon remediation on a building or during real estate transactions – a short-term assessment of the annual mean IRC is desirable or necessary. Within this work, a guideline was developed to estimate the average annual IRC from three-week short-term measurements using active radon-222 measuring instruments, considering relevant influencing parameters.
2. Materials and Methods
2.1. Definitions, Quantities and Variables
This is the compilation of the terms and formula symbols used:
IRC, Bq/m³ Radon-222 activity concentration of the indoor air (Indoor Radon Concentration)
SIRC, Bq/m³ IRC mean value of the short-term measurement (Shortterm IRC)
LIRC, Bq/m³ IRC mean value of the long-term measurement (Longterm IRC)
EIRC, Bq/m³ IRC annual mean value, estimated from a short-term measurement (Estimated IRC)
cRn, Bq/m³ individual measured value of the Rn-222 activity concentration (e.g. 10-minute mean value, 1-hour mean value)
u(x) standard (measurement) uncertainty (extension factor k = 1) of the (measured) value x (in the respective unit)
urel(x) relative standard (measurement) uncertainty (extension factor k = 1) of the measured value x (related to the (measured) value x; optional in %)
x* mean value of a series of measured values x over a period (e.g. hourly mean value, three-week mean value, annual mean value)
sr(x) relative standard deviation of a series of measured values x over a period
ρ Spearman rank correlation coefficient ρ can take values between -1 (perfect anti-correlation) and +1 (perfect correlation)
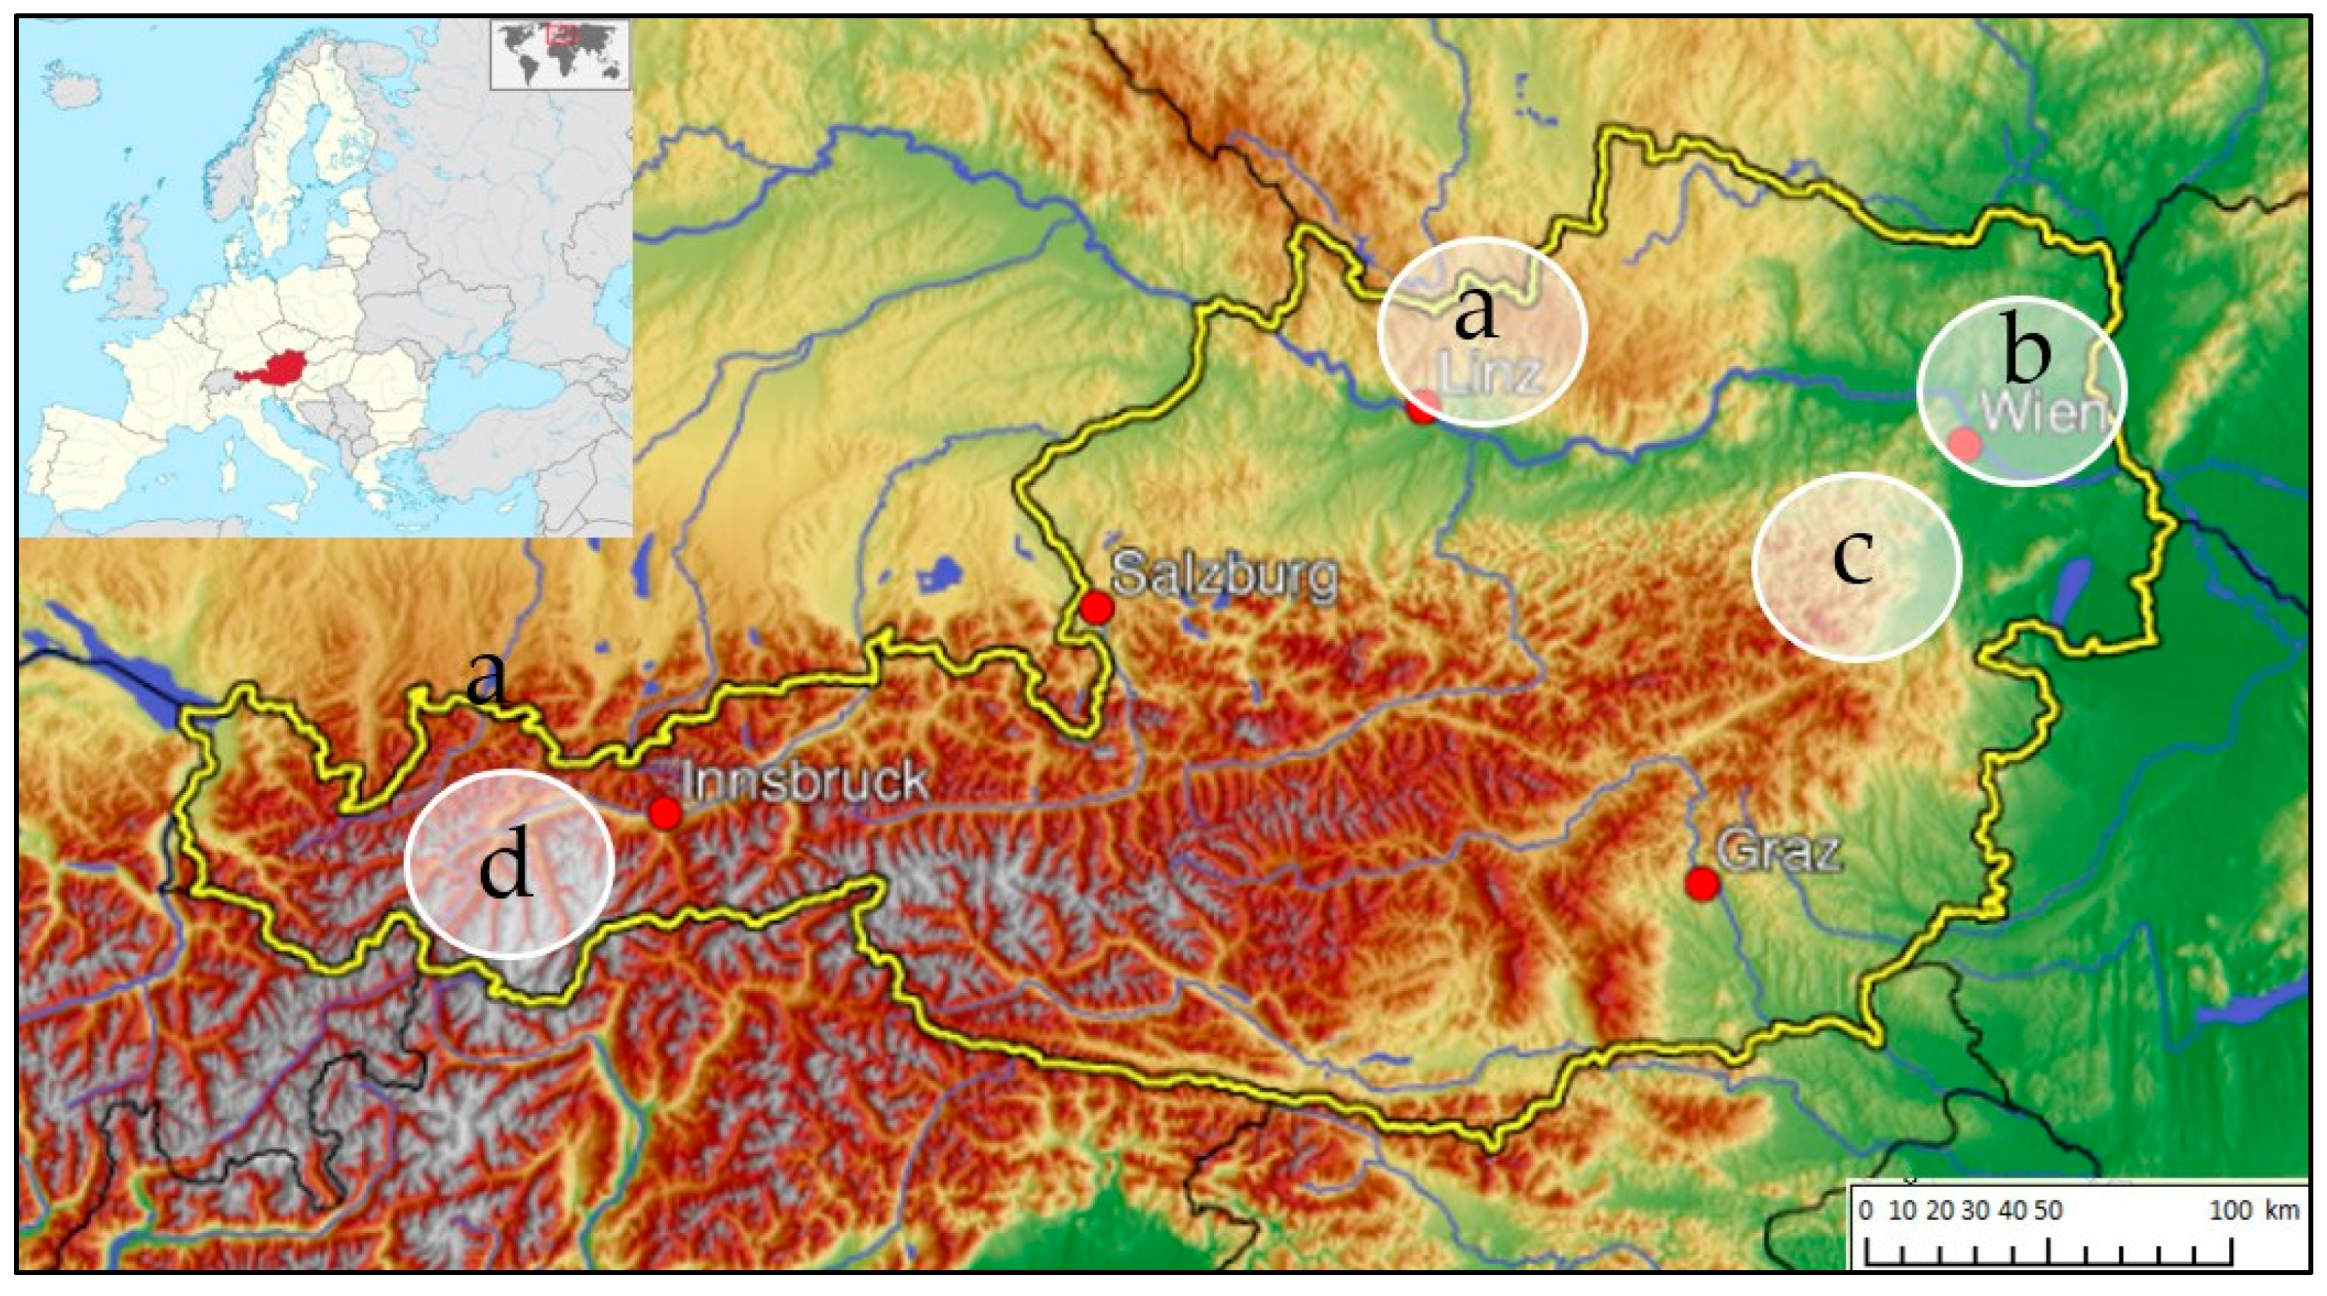
2.2. Selection of the Sites
To distinguish between temporal changes in IRC and the stochastic noise of the measuring instruments, the selected study households should exhibit a minimum radon potential. For this purpose, an indicative Rn-222 value of 100 Bq/m³ was set at the beginning of this study. In principle, higher IRC can be expected in radon protection areas, old buildings, and in living spaces in contact with the ground [
15]. These criteria were considered when selecting the houses.
Due to the necessary minimum radon potential and the limited number of available measuring devices, 24 private households were ultimately selected for the study. Ten houses are in southern Lower Austria, eight in radon-protected areas in Upper Austria, three in Tyrol, and two in the northern part of Lower Austria, and one in Vienna [
16] (
Figure 1).
The participants in the study were given a questionnaire that, in accordance with an approved template of the Austrian Agency for Health and Food Safety AGES, contains questions on relevant parameters that IRCs can strongly influence. On the one hand, building-specific data such as year of construction, type of foundation, basement, window density, etc. was collected, and on the other hand, the ventilation behaviour in each room was queried. In addition, the participants were advised to maintain their everyday usage behaviour during the measurements.
2.3. Active Radon-222 Measurement Instruments
The study investigated the diurnal and seasonal variations of IRC in the living spaces of a wide range of private households in Austria. This required active radon measuring devices that measure and record the IRC hourly. In addition to the temporal variations of the IRC, the mean IRC was also determined. For this purpose, long-term measurements were carried out with passive track etch detectors.
The Radiation Protection Laboratory of Vienna, MA 39, an accredited testing, inspection and certification body for active and passive radon measurements according to ISO/IEC 17025, supported the study with an AlphaGuard (DF2000, Bertin Instruments, model year 2020), as well as three AlphaE (Bertin Instruments). Seibersdorf Laboratories, Austria, also accredited for passive radon measurements according to ISO/IEC 17025 [
15], provided two AlphaGuards (P30, Bertin Instruments, model year 1995).
The instruments mentioned work according to the principle of an ionisation chamber. For the study, the Rn-222 activity concentrations (Bq/m³), as well as their uncertainties, were recorded and stored at the top of every hour. In addition to the IRC, the devices provided values for the room temperature (°C), air pressure (mbar), and relative humidity (%).
The Austrian Federal Office of Metrology and Surveying BEV provided a RadonEye Plus2 (RD200P2, FTLAB, model year 2019). Within the study an additional RadonEye Plus2 (RD200P2, FTLAB, model year 2022) was applied. These ionisation chamber instruments recorded the radon activity concentration (Bq/m³), the room temperature (°C) and the relative humidity (%).
To ensure the reliability of all measurement results, the applied measuring instruments used were compared with a validly calibrated reliable reference measuring device at different levels of the Rn-222 activity concentration. For this purpose, several comparative measurements were carried out with all the devices available at the time of the measurements. The measuring instruments were positioned next to each other at the same locations for several hours and the IRC was recorded hourly. Subsequently, all measured values were evaluated and subjected to a comparative analysis. A correction factor was determined for each device, which describes the deviation of the respective measured values from the results of the calibrated reference device. By applying the correction factors to the values output by the respective measuring instrument, reliable measured values of the Rn-222 activity concentration within the respective uncertainty intervals of the measuring instruments were obtained.
2.4. Passive Radon-222 Measurement Methods
The two participating accredited (ISO/IEC 17025 [
17]) laboratories, Radiation Protection Laboratory of Vienna, MA 39, and Seibersdorf Laboratories SL have each provided 49 passive track etch detectors (polyallyl diglycol carbonate PADC, also known as CR-39) for the study. The long-term measurements according to ISO 11665-4 [
18] should adhere to the Austrian requirements for an accredited radon measurement (6-month long-term measurement, at least half of the time between 15 October and 15 April [
19]). For this reason, the measurements in all participating households were started between mid-December and early January and evaluated at the end of June 2023.
Due to the large number of available detectors, an average of four track etch dosimeters could be placed in the participants’ homes. This made it possible to determine the average IRC in different rooms and on different floors of some houses. To evaluate the quality of the long-term measurements, detectors from both institutes (MA 39 and SL) were placed in some rooms.
2.5. Taking Measurements
As part of the study, at least two short-term measurements were carried out in each household, one during the winter months and one outside the heating season. For a single short-term measurement, an active measuring device was set up in one of the most frequently used rooms, preferably in living rooms and bedrooms, and connected to the local power supply. After the active measuring device was switched on, it automatically started recording and storing the Rn-222 hourly mean values and the environmental parameters.
The active measuring devices were placed according to reliable practice [
20] in a location that
- -
is not directly next to a window and is not subject to drafts,
- -
is not directly next to a wall (at least 10 cm distance),
- -
is not heated to high temperatures,
- -
is at normal breathing height (1 m to 2 m),
- -
is inaccessible to small children and pets,
- -
does not show any condensation.
The location of the measuring device was not changed during the measurement. The individual usage habits of the residents in the rooms were also maintained during the measurements (ventilation and heating habits, room usage times, etc.). In each household, the location of the measuring device was kept the same for all short-term measurements (winter and summer measurements).
2.6. Correlation Analysis of the Results of Short-Term Radon Measurements with Influencing Variables
Based on the results of the physical-statistical evaluation of metrological surveys using Spearman correlation analysis performed with SPSS® (version 29) mathematical statistical software [
21], in combination with physical considerations, influencing parameters were identified, tested in functions and finally determined which ones demonstrably significantly influence the IRC. These influencing parameters were determined or obtained in a suitable manner for the estimation of the annual mean value of the IRC during the three-week short-term measurements (data from the measuring stations of the metrological service GeoSphere Austria Data Hub, online). The values of the influencing parameters had been determined using state-of-the-art technology, either by measurements or by obtaining the data from Geosphere Austria Data Hub at or as close as possible to the measurement locations and evaluated for the period of the short-term radon measurement (mean values, standard deviation and, as far as possible and appropriate, uncertainties).
Correlation analyses were carried out with the approximately 500 hourly mean values of the three-week short-term measurements and the hourly mean values of the influencing quantities.
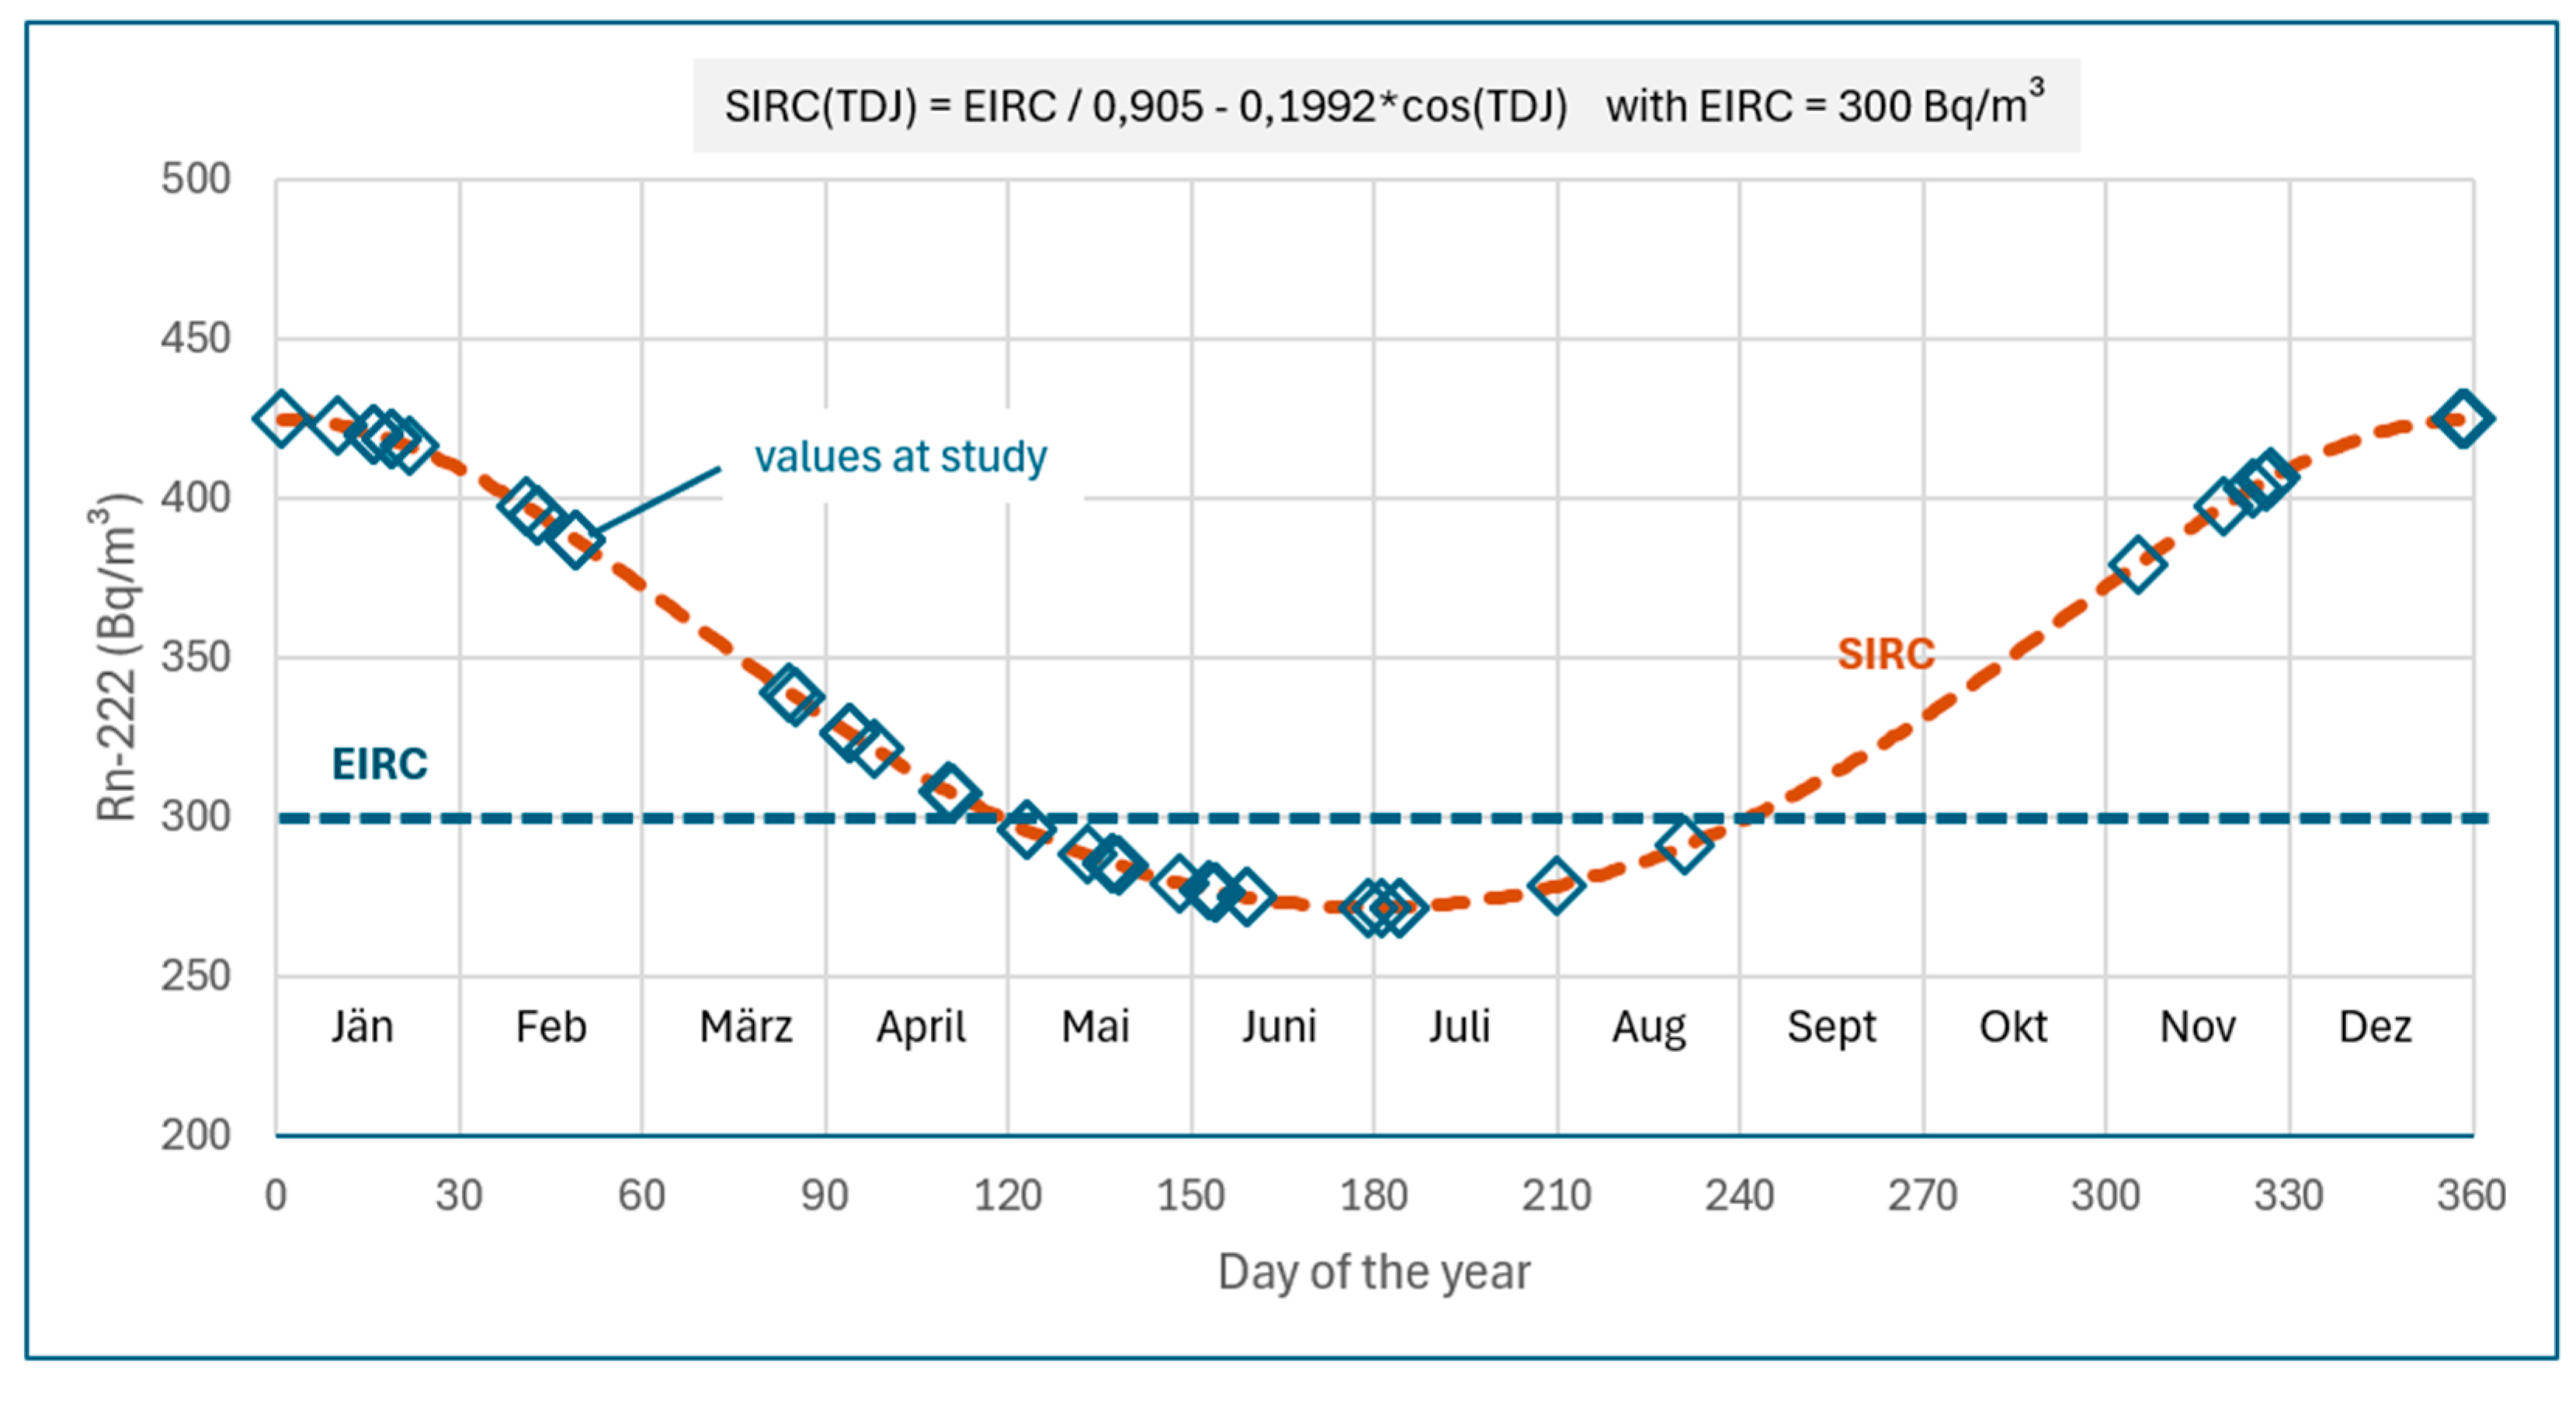
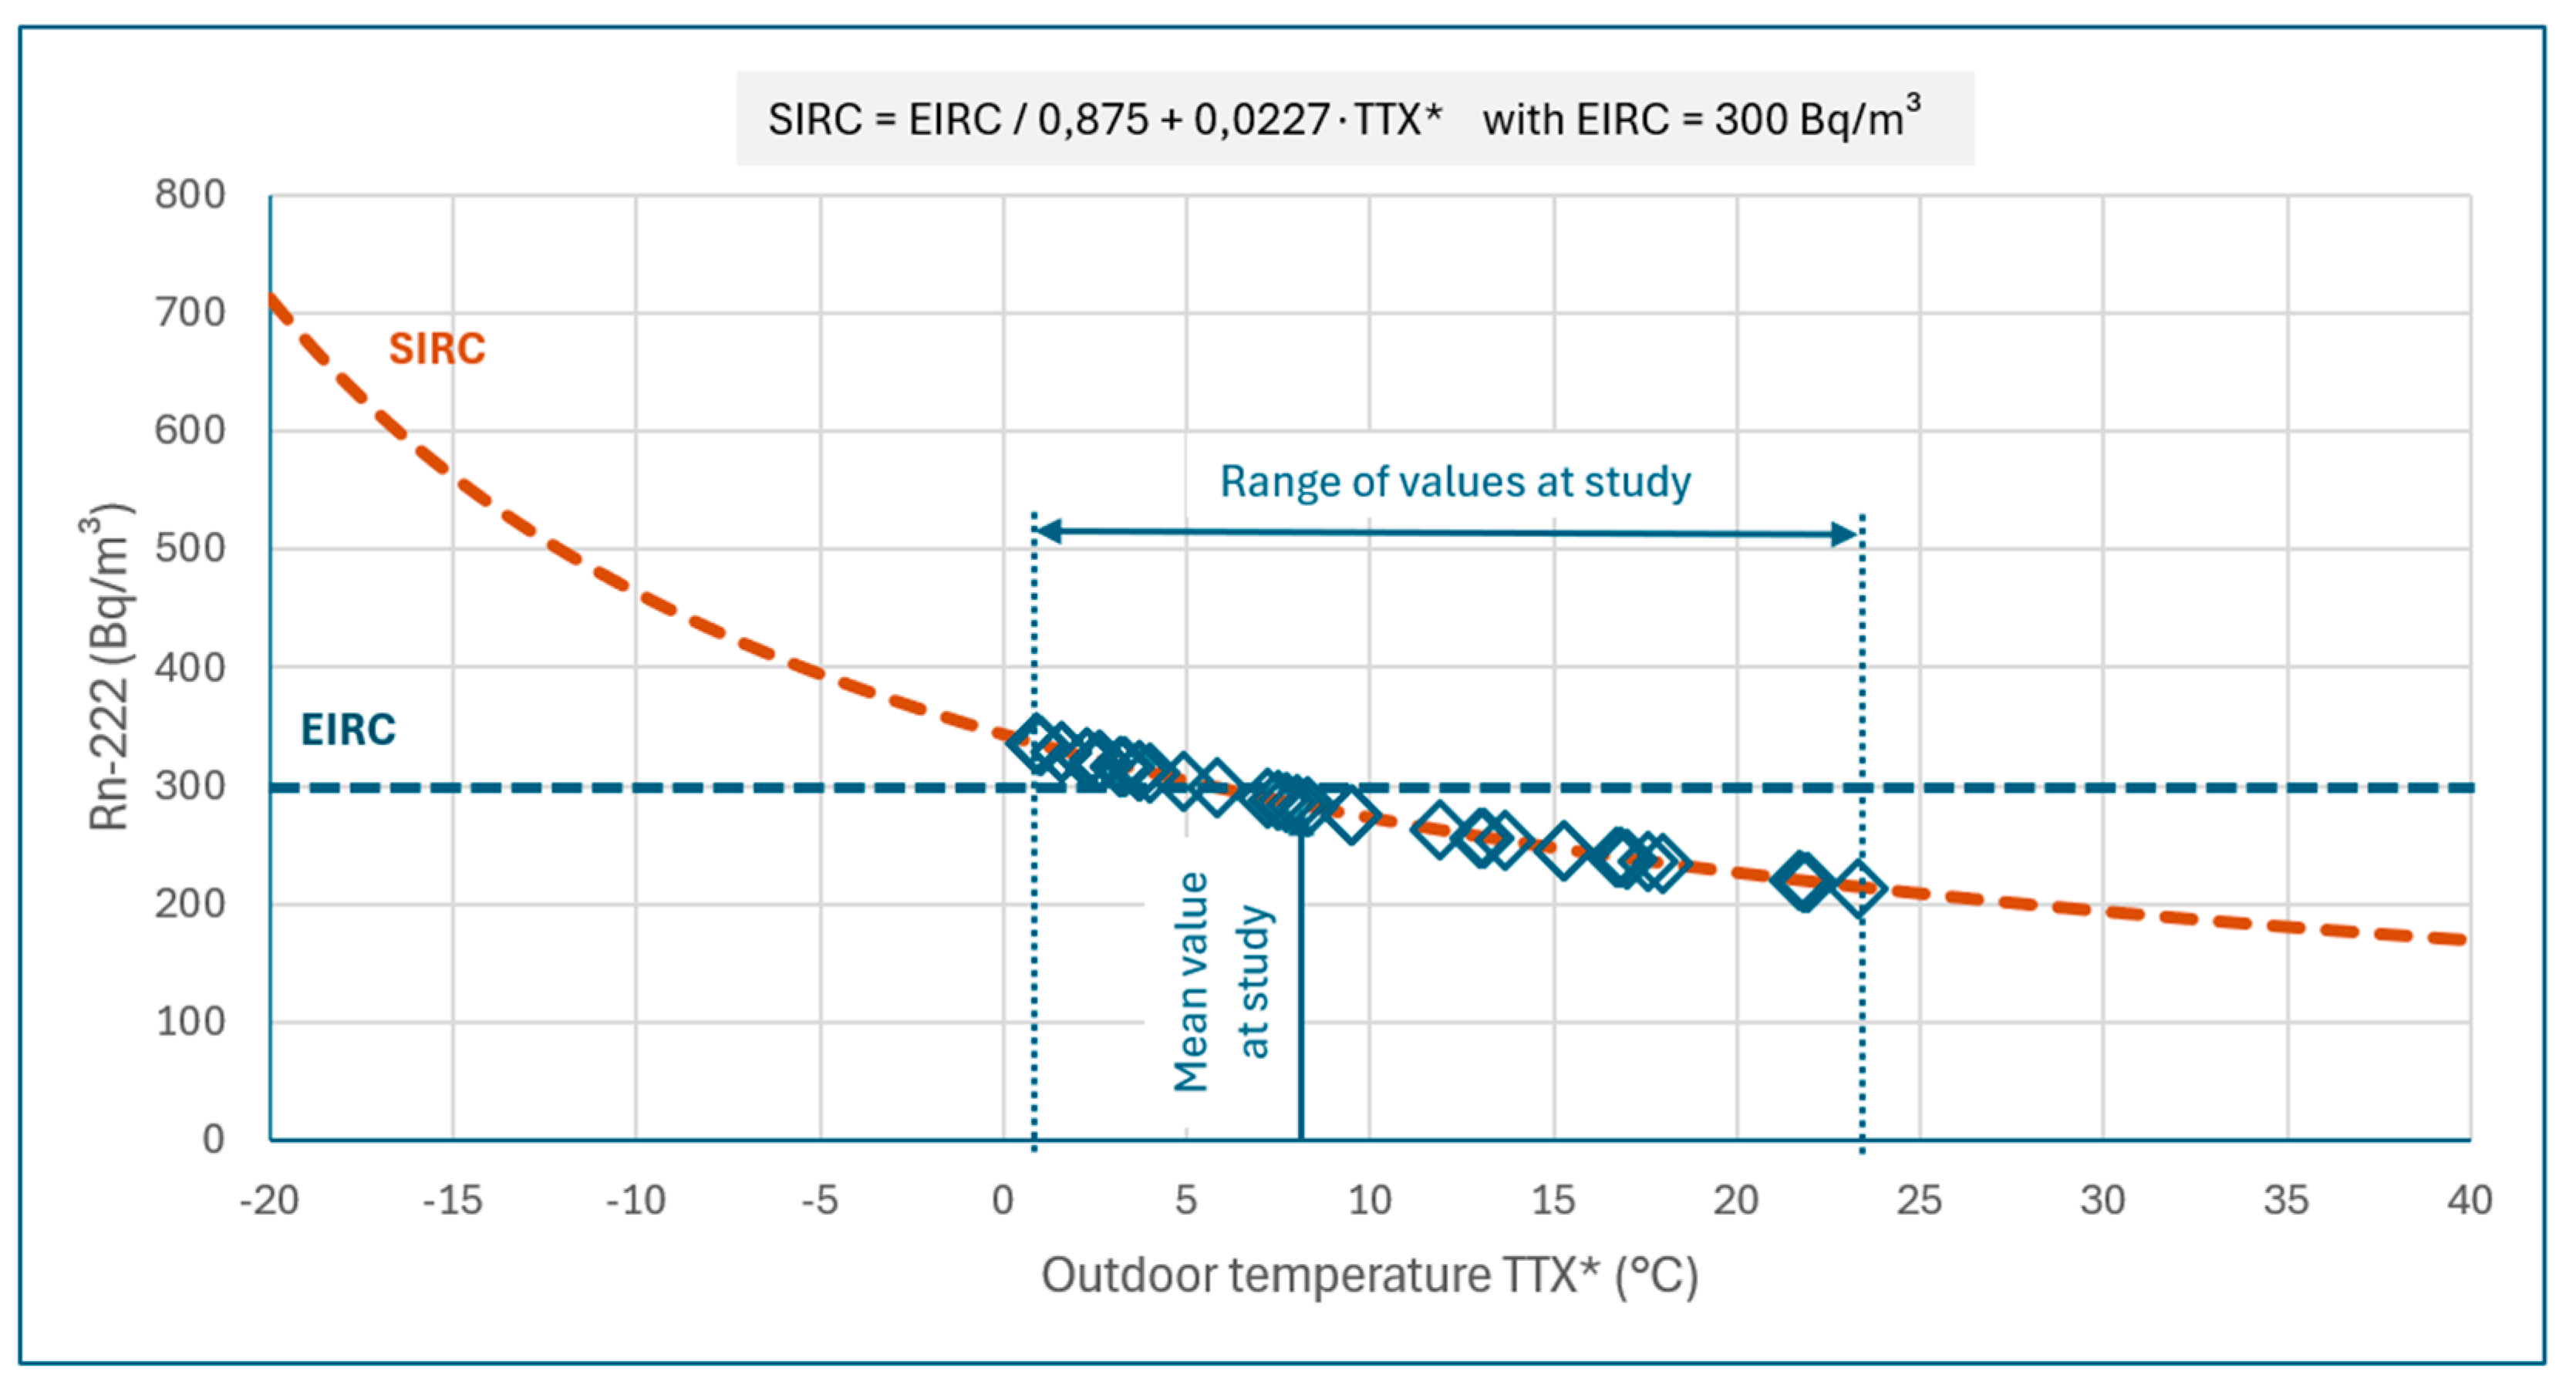
2.7. Fitting the Short-Term Measurements with the Results of the Long-Term Measurements
In a subsequent step, the most strongly correlated (or anti-correlated) influencing variables were determined, with which the mean values of the 3-weeks radon short-term measurements could be most significantly approximated to the results of the 6-month long-term measurements. The method used was least squares regression with the mathematics software SigmaPlot® (version 15) [
22].
From the 50 three-weeks short-term measurements – about 500 hourly mean values cRn* over the three-week period for each measurement – of the radon-222 activity concentration in the investigated indoor room, the three-weeks mean values SIRC of the hourly mean values cRn* of the radon activity concentration, the standard measurement uncertainties (k = 1) of the three-weeks mean value u(SIRC) were determined, considering the uncertainties u(cRn*) of the hourly mean values and the relative standard deviation sr(cRn*) of the hourly mean values cRn* of the radon activity concentration.
In this work, the influences of the building situation (e.g. hillside location, basement) and user behaviour (e.g. ventilation, holidays) were not initially considered. These influences were observed qualitatively in the hourly mean values of the IRC over the course of the day but could not yet be quantified beyond doubt with the help of the three-week mean values. These influencing factors are to be examined in more detail in a subsequent study and taken into account if necessary.
3. Results
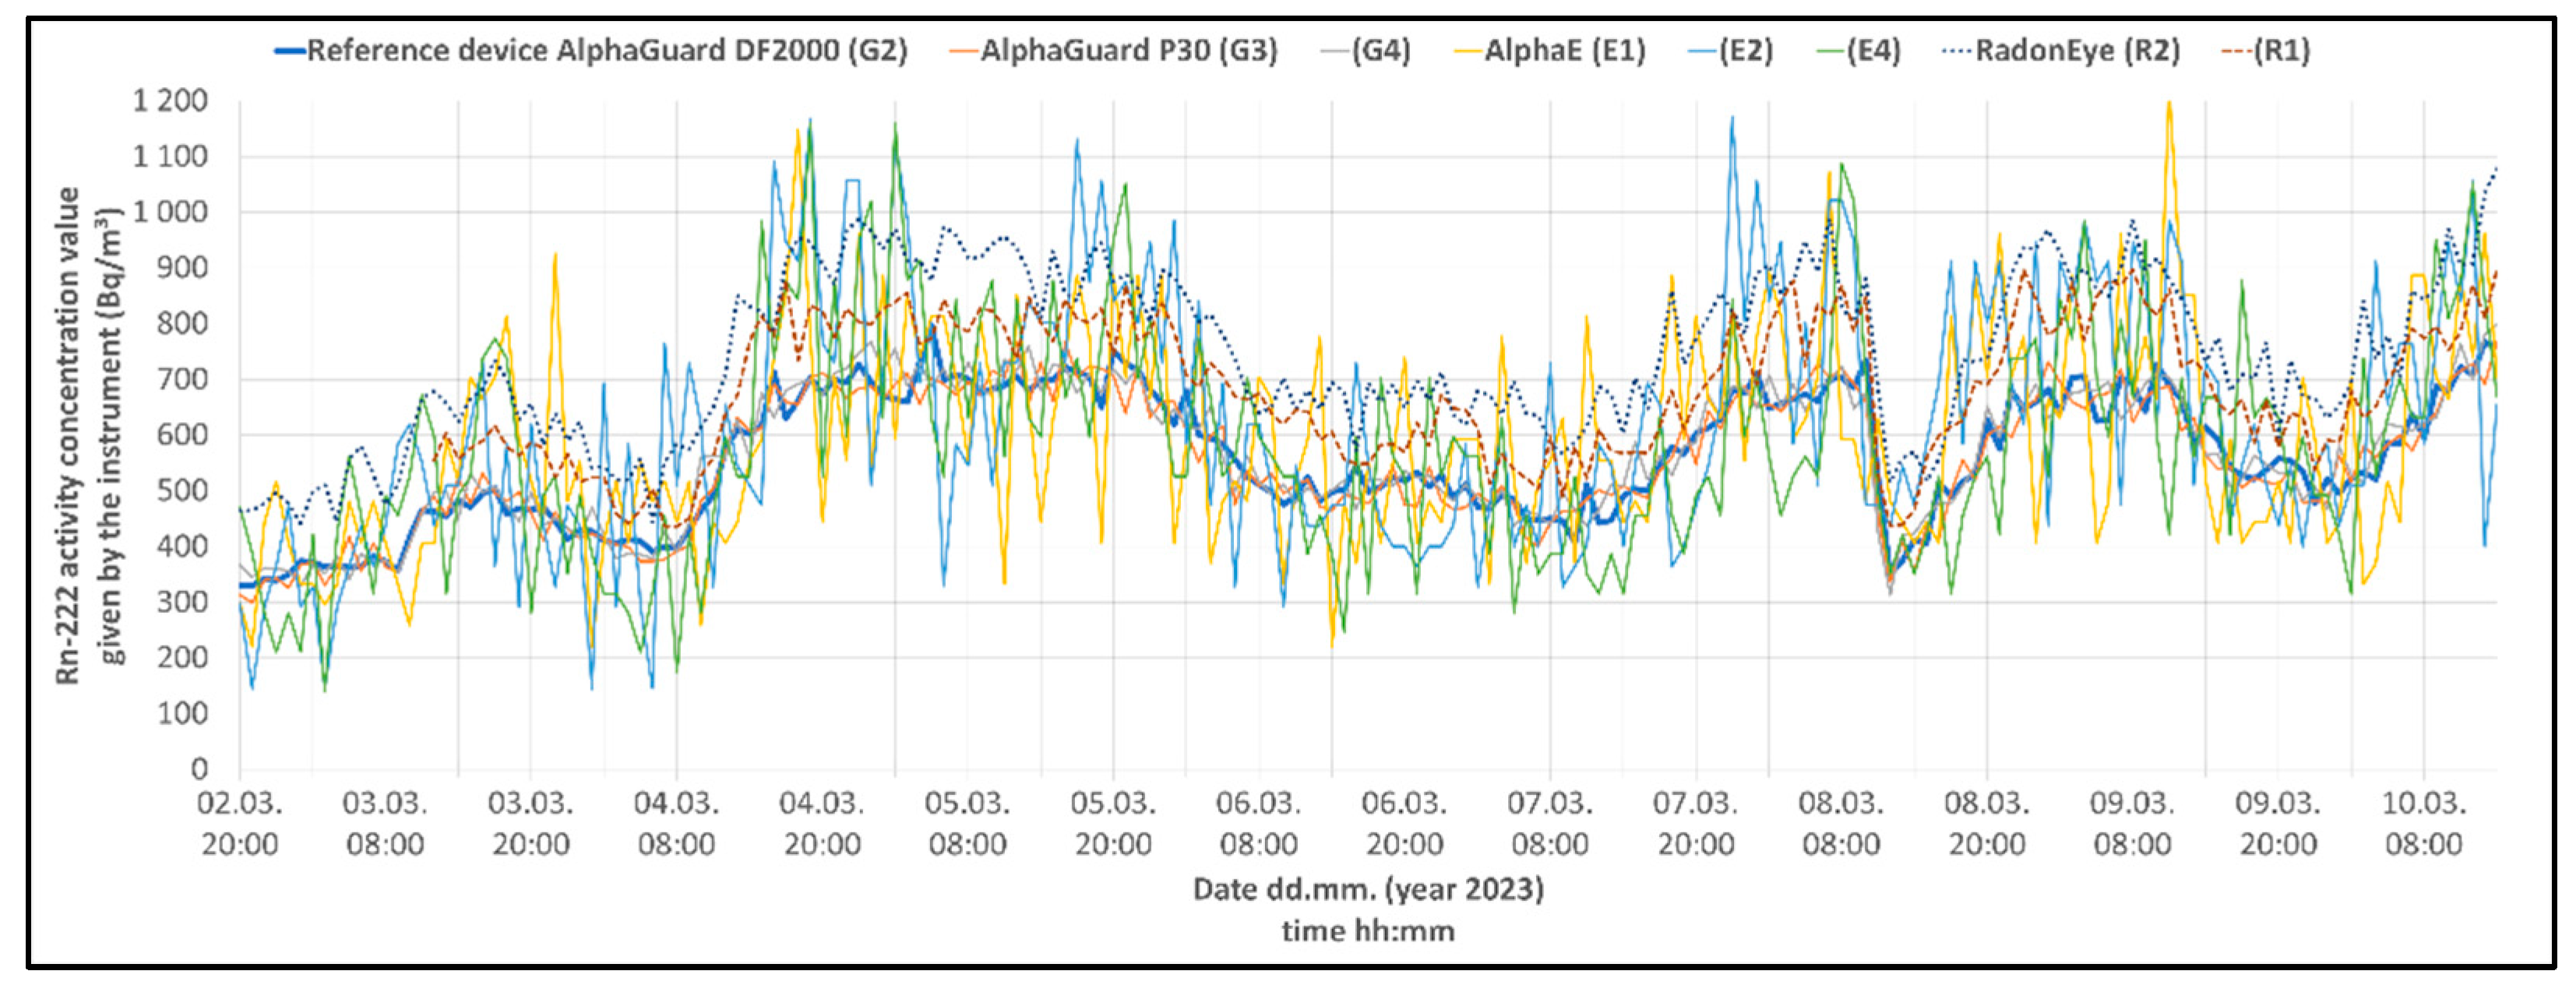
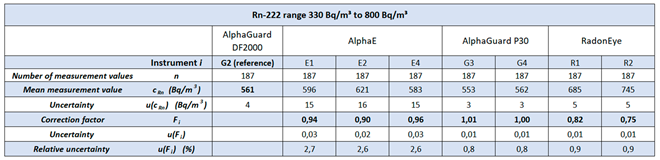
3.1. Result of the Rn-222 Measurement Instruments Comparison
The results of the necessary comparison of the used instruments carried out at higher Rn-222 activity concentrations are given here as an example of the comparison measurements performed to determine the correction factors of the used instruments at different Rn-222 measuring ranges. A sleeping room in a household in southern Lower Austria was used as the comparison location because the room had higher IRC during the winter measurements. The comparison measurement was carried out between 3 and 10 March 2023. An AlphaGuard DF2000 was used as reference device for the comparative measurement, which had a reliable and precise calibration at the time of the comparison measurement. During the comparative measurement, which lasted 186 hours (7,75 days), the reference device recorded an average IRC of about 560 Bq/m³.
Figure 2 shows the hourly IRC mean values over time, as recorded by the respective active measuring devices.
Table 1 shows that the readings of the AlphaGuard devices, including those of the two older models (P30, model year 1995), were in very good agreement with the readings of the calibrated reference device (Alpha Guard DF2000, model year 2020). The two RadonEye Plus 2 devices always showed higher values than the reference device, but their correction factors could be determined with extremely low uncertainty. The hourly mean values of the AlphaE devices showed strong fluctuations, but on average, over several hours, they showed smaller deviations than the RadonEye Plus 2 devices. As a result, the AlphaE devices had correction factors close to the ideal value 1.00, but with larger uncertainties.
The correction factors
Fi, determined at different Rn-222 ranges, were used to correct the Rn-222 activity concentration value given by the measuring device
i:
Fi ...... correction factor of measuring instrument i
cRn .... real Rn-222 activity concentration value (Bq/m³)
mRn ... reading Rn-222 activity concentration value shown by the measuring instrument (Bq/m³)
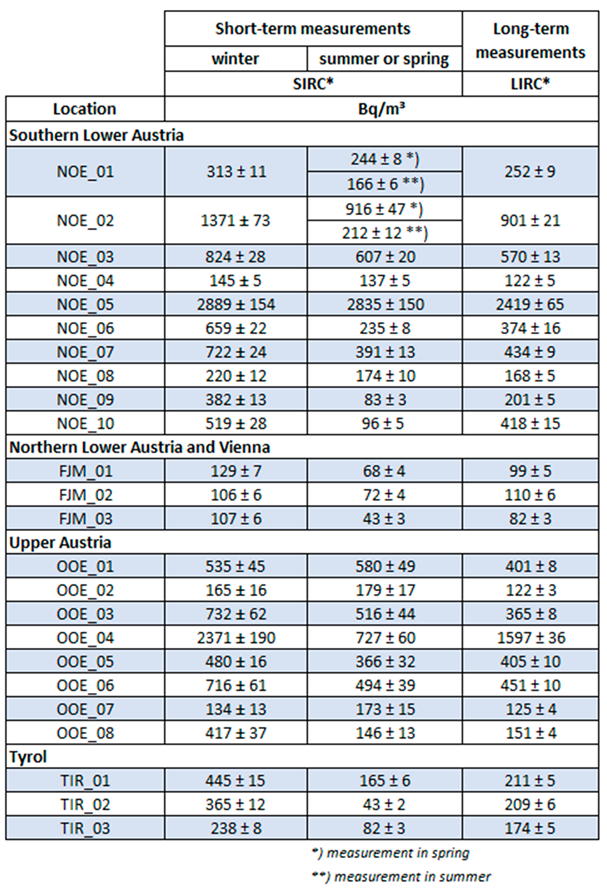
3.2. Result of the Short-Term and Long-Term Measurements
Between October 2022 and August 2023, short-term measurements were carried out by all study households during the winter months, as well as outside the heating season (summer or spring). Each series of measurements was corrected according to the device-specific correction factor (equation (1),
Table 2).
The long-term measurements (track etch detectors) were carried out in the same rooms as the short-term measurements.
In
Table 2, the IRC mean values of the two (or three) short-term measurements (3 weeks in winter and summer or spring)
SIRC* are compiled together with the results of the respective long-term measurements (6 month, from December 2022 until July 2023)
LIRC* in the investigated rooms. The results show that the short-term mean values
SIRC* can vary greatly between winter and summer (spring). Accordingly, the IRC mean values of the short-term measurements
SIRC* can also deviate greatly from the mean annual IRC of the long-term measurements
LIRC*.
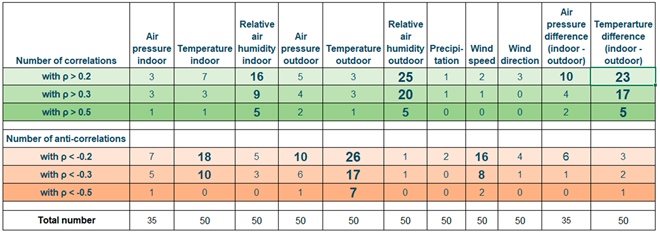
3.3. Result of the Correlation Analysis of the Short-Term Measurements
Table 3 shows a summary of the Spearman rank correlations of the measured
cRn hourly mean values with the meteorological parameters, the environmental parameters and the derived variables. The Spearman rank correlation coefficient
ρ can take values between -1 (perfect anti-correlation) and +1 (perfect correlation). The numerical entries correspond to the number of correlations of all 50 short-term measurements. Weak significant correlations (
ρ > 0.2) are marked in light green, medium significant correlations in green and strong significant correlations in dark green. Weak significant anticorrelations (
ρ < - 0.2) are marked in light red, medium significant anticorrelations in red and strong significant anticorrelations in dark red. For parameters that showed many (anti-)correlations with the
cRn, the numerical entries are marked ‘bold’ and ‘larger’. Since the RadonEye measuring devices do not record air pressure, no correlations of the
cRn with the indoor air pressure could be determined for the 15 RadonEye short-term measurments. Accordingly, it was not possible to determine the correlations with the derived variable ‘pressure difference’. As a result, only 35 instead of 50 short-term measurements were available for these two parameters.
Table 3 shows that there were many correlations between the
cRn and the parameters ‘relative air humidity indoor’, ‘relative air humidity outdoor’ and the derived variables ‘air pressure difference (indoor-outdoor)’ and ‘temperature difference (indoor-outdoor)’. Observations suggest that the correlations between the IRC and the relative humidity are not causal. Many households ventilate more frequently during the day, which means that the IRC tends to be higher at night. Similar to the diurnal course of the IRC, the relative humidity increases on cold nights due to the reduced water vapor absorption capacity of the air. In addition, the
cRn showed many anti-correlations with the parameters ‘temperature indoor’, ‘temperature outdoor’ and ‘wind speed’.
Most significant anti-correlations occurred between cRn and outdoor temperature. At least weak anti-correlations with ρ < -0.2 were found in 52%. 17 out of 50 short-term measurements (34 %) showed at least a medium anti-correlation with ρ < -0.3. In 7 out of 50 (14 %) of all short-term measurements, strong significant anti-correlations with ρ < -0.5 were even found.
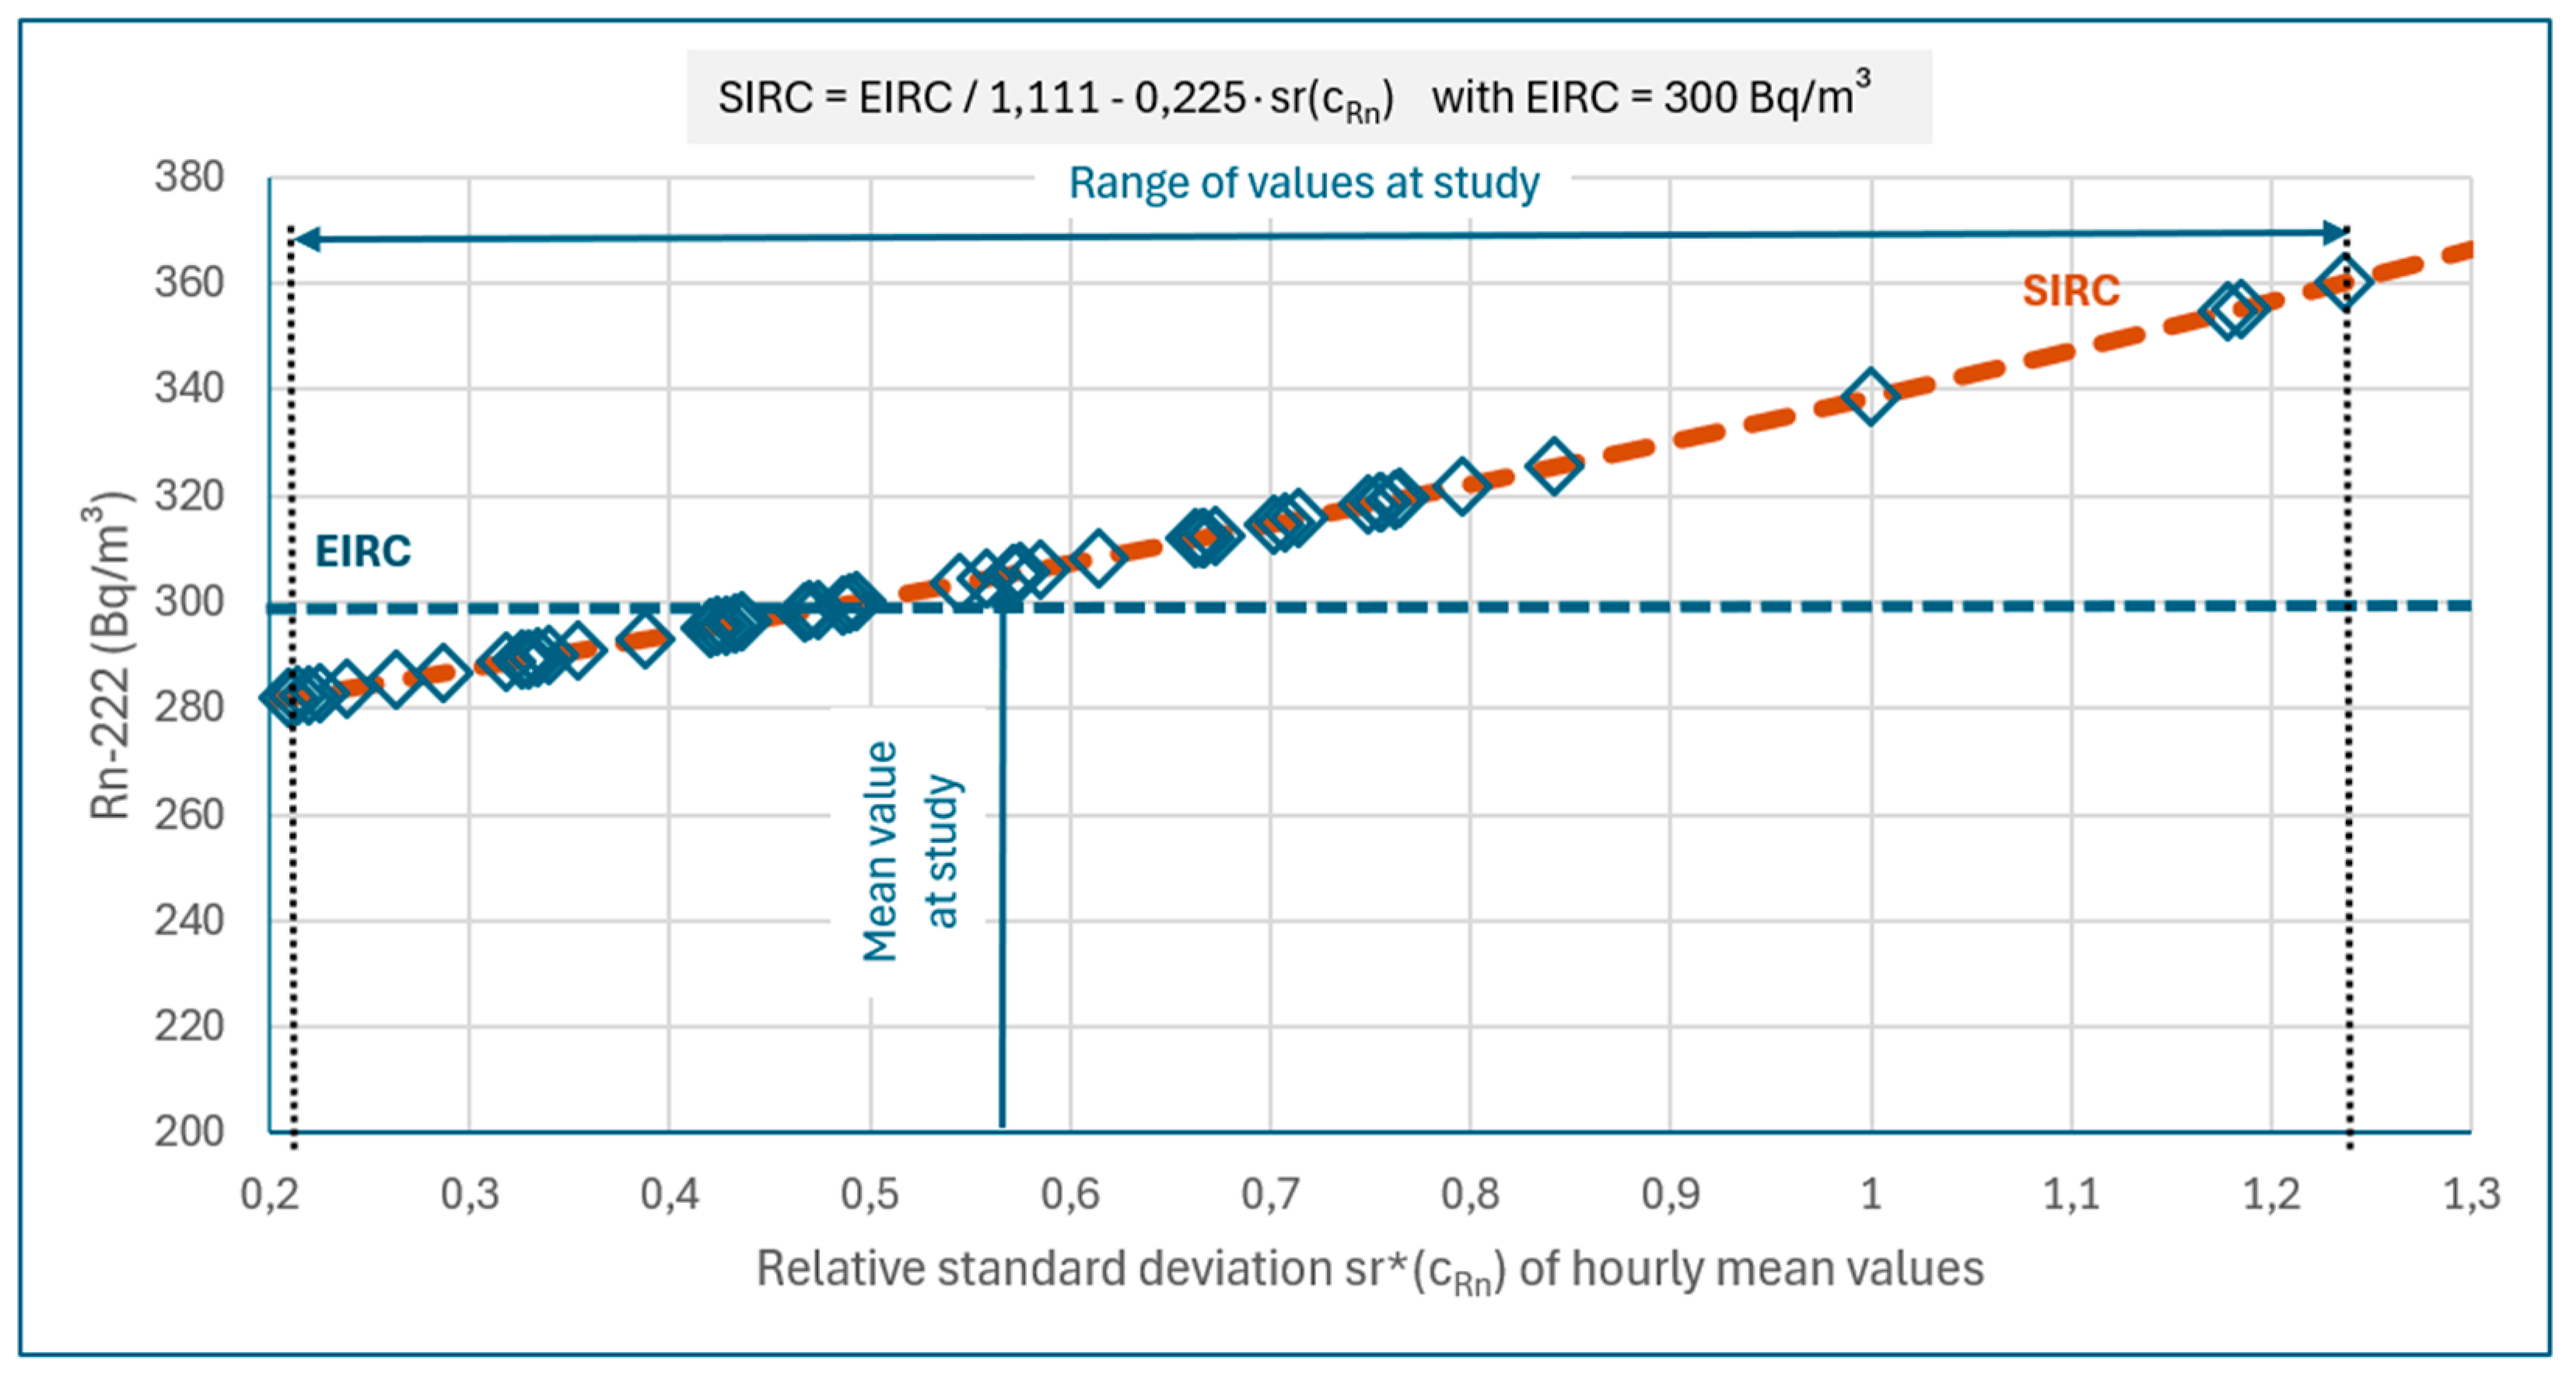
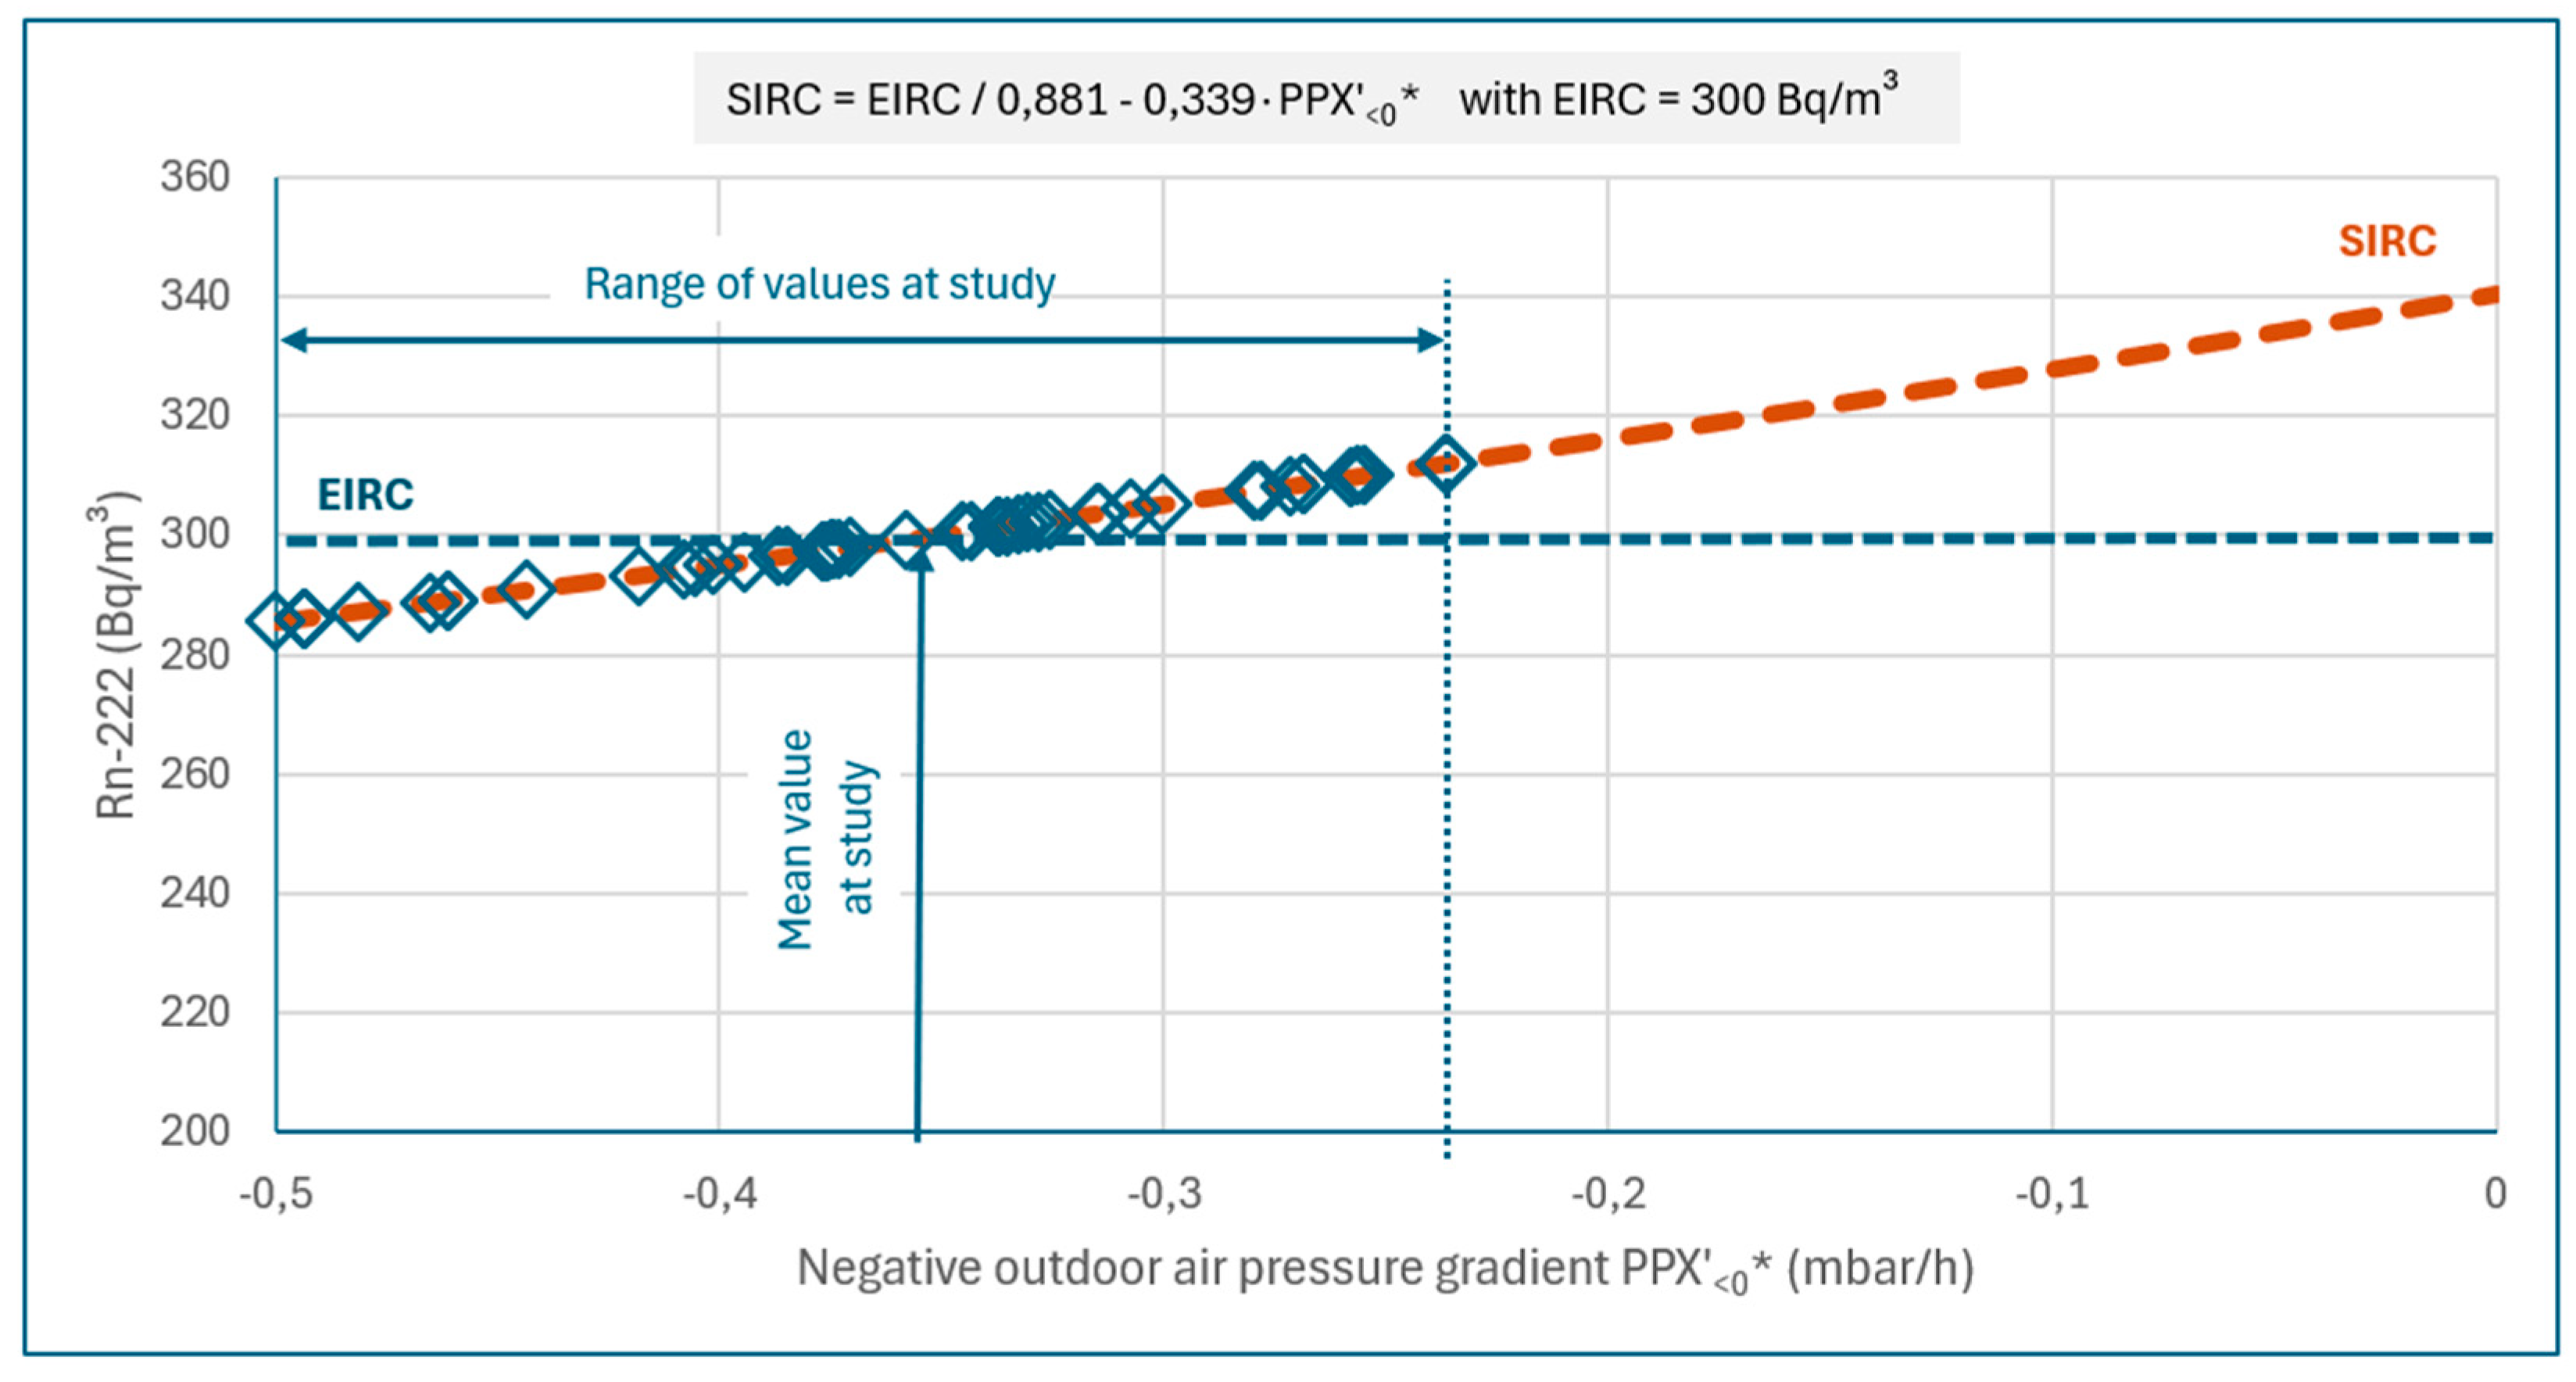
3.4. Result of the Regression Analysis to Fit the Short-Term Measurements to the Results of the Long-Term Measurements
Based on the results of the physical-statistical evaluation of metrological surveys using Spearman correlation analysis (performed with SPSS software) and on physical considerations, a set of influencing parameters were identified, tested in suitable functions and finally determined which demonstrably significantly influence the IRC. These parameters are to be measured by the measurement instruments directly or obtained in a suitable manner (e.g. including data from the online GeoSphere Austria Data Hub) in the three-week short-term measurement periods.
By applying the regression analysis – fitting short-term measurement data to long-term measurement data, considering the main influencing ambient parameters using the least-square fit method [
23] realized by SigmaPlot® mathematical software – a multiplicative model was established to estimate the annual mean value of the radon-222 activity concentration
EIRC from the data (three-week mean values) of a short-term measurement of
SIRC:
with functions
pi of the influencing parameters
TDJ day of (calendar) year (midway through 3-weeks measurement period), 1 …. 365, considering the seasonal influence – winter / spring / summer / autumn – on the IRC.
TTX outdoor temperature, °C, hourly (mean) value (from GeoSphere Austria Data Hub)
MON number of the month of the (calendar) year (midway through the 3-weeks measurement period), 1 … 12, considering strong ventilation by users during the ‘hot’ summer months of June to August
FFX relative humidity of the outside air, %, hourly (mean) value (from GeoSphere Austria Data Hub)
VVX wind speed, m/s, hourly (mean) value (from GeoSphere Austria Data Hub)
TIA difference between indoor and outdoor temperature, °C
sr relative standard deviation of the series of measured values (e.g. hourly mean values) of the radon-222 activity concentration
cRn, considering the variability of the measured radon activity concentration in the 3-weeks short-term measurement period
PPX’ change (temporal gradient) of the external air pressure in one hour, mbar/h (determined e.g. from the hourly (mean) values PPX of the GeoSphere Austria Data Hub (note: sea level correction of the air pressure values may be necessary)
PPX’<0* ….. mean value of all
PPX’ values < 0, determined in the measurement period, considering the “air pressure radon pump”
TIA’ change (temporal gradient) of the difference between indoor and outdoor temperature in one hour, °C/h, considering the change in the indoor-outdoor temperature difference
TIA’<0* mean value of all
TIA’ values > 0 during the measurement period, °C/h, considering the “temperature radon pump”
Constant factor to adjust the symmetry of all minimum and maximum values of the EIRC/LIRC ratios around the ideal value of 1.00 (EIRC = LIRC).
With the functions (3) to (12), the essential influences found in the work by means of Spearman correlation analysis and from the literature-known radioecological-physical relationships and regression calculations - both on the radon entry into the measured interior and through ventilation (dilution) with outside air - are quantitatively taken into account to determine the EIRC with formular (2).
Figure 3,
Figure 4,
Figure 5 and
Figure 6 show examples of the functional dependencies found here between the SIRC readings from the short-term measurements and the environmental parameters. It should be noted that these individual functional relationships are exemplary shown for
EIRC values of 300 Bq/m³. This value was chosen because it is the reference value for indoor radon according to the Austrian Radon Protection Ordinance.
Figure 3 shows the cosine-like dependence of
SIRC (formular 3) over the course of a calendar year. Radon measurements in the winter season overestimate, measurements in summer respectively underestimates the annual average IRC. The lower the outside temperature in relation to the (more or less remaining constant) indoor temperature, the higher the
SIRC in relation to the
EIRC (
Figure 4). The influence of the variability of the measured
cRn values, indicated be the standard deviation of the
cRn values, is shown in
Figure 5. The effect of the “air pressure radon pump” is recognisable at
Figure 6.
It should be noted that the individual dependencies shown here as examples are eventually incorporated into the product, formula (2), of the influence functions. Therefore, only the product of the individual influence functions ultimately describes the real influence of all dependencies on the result of EIRC.
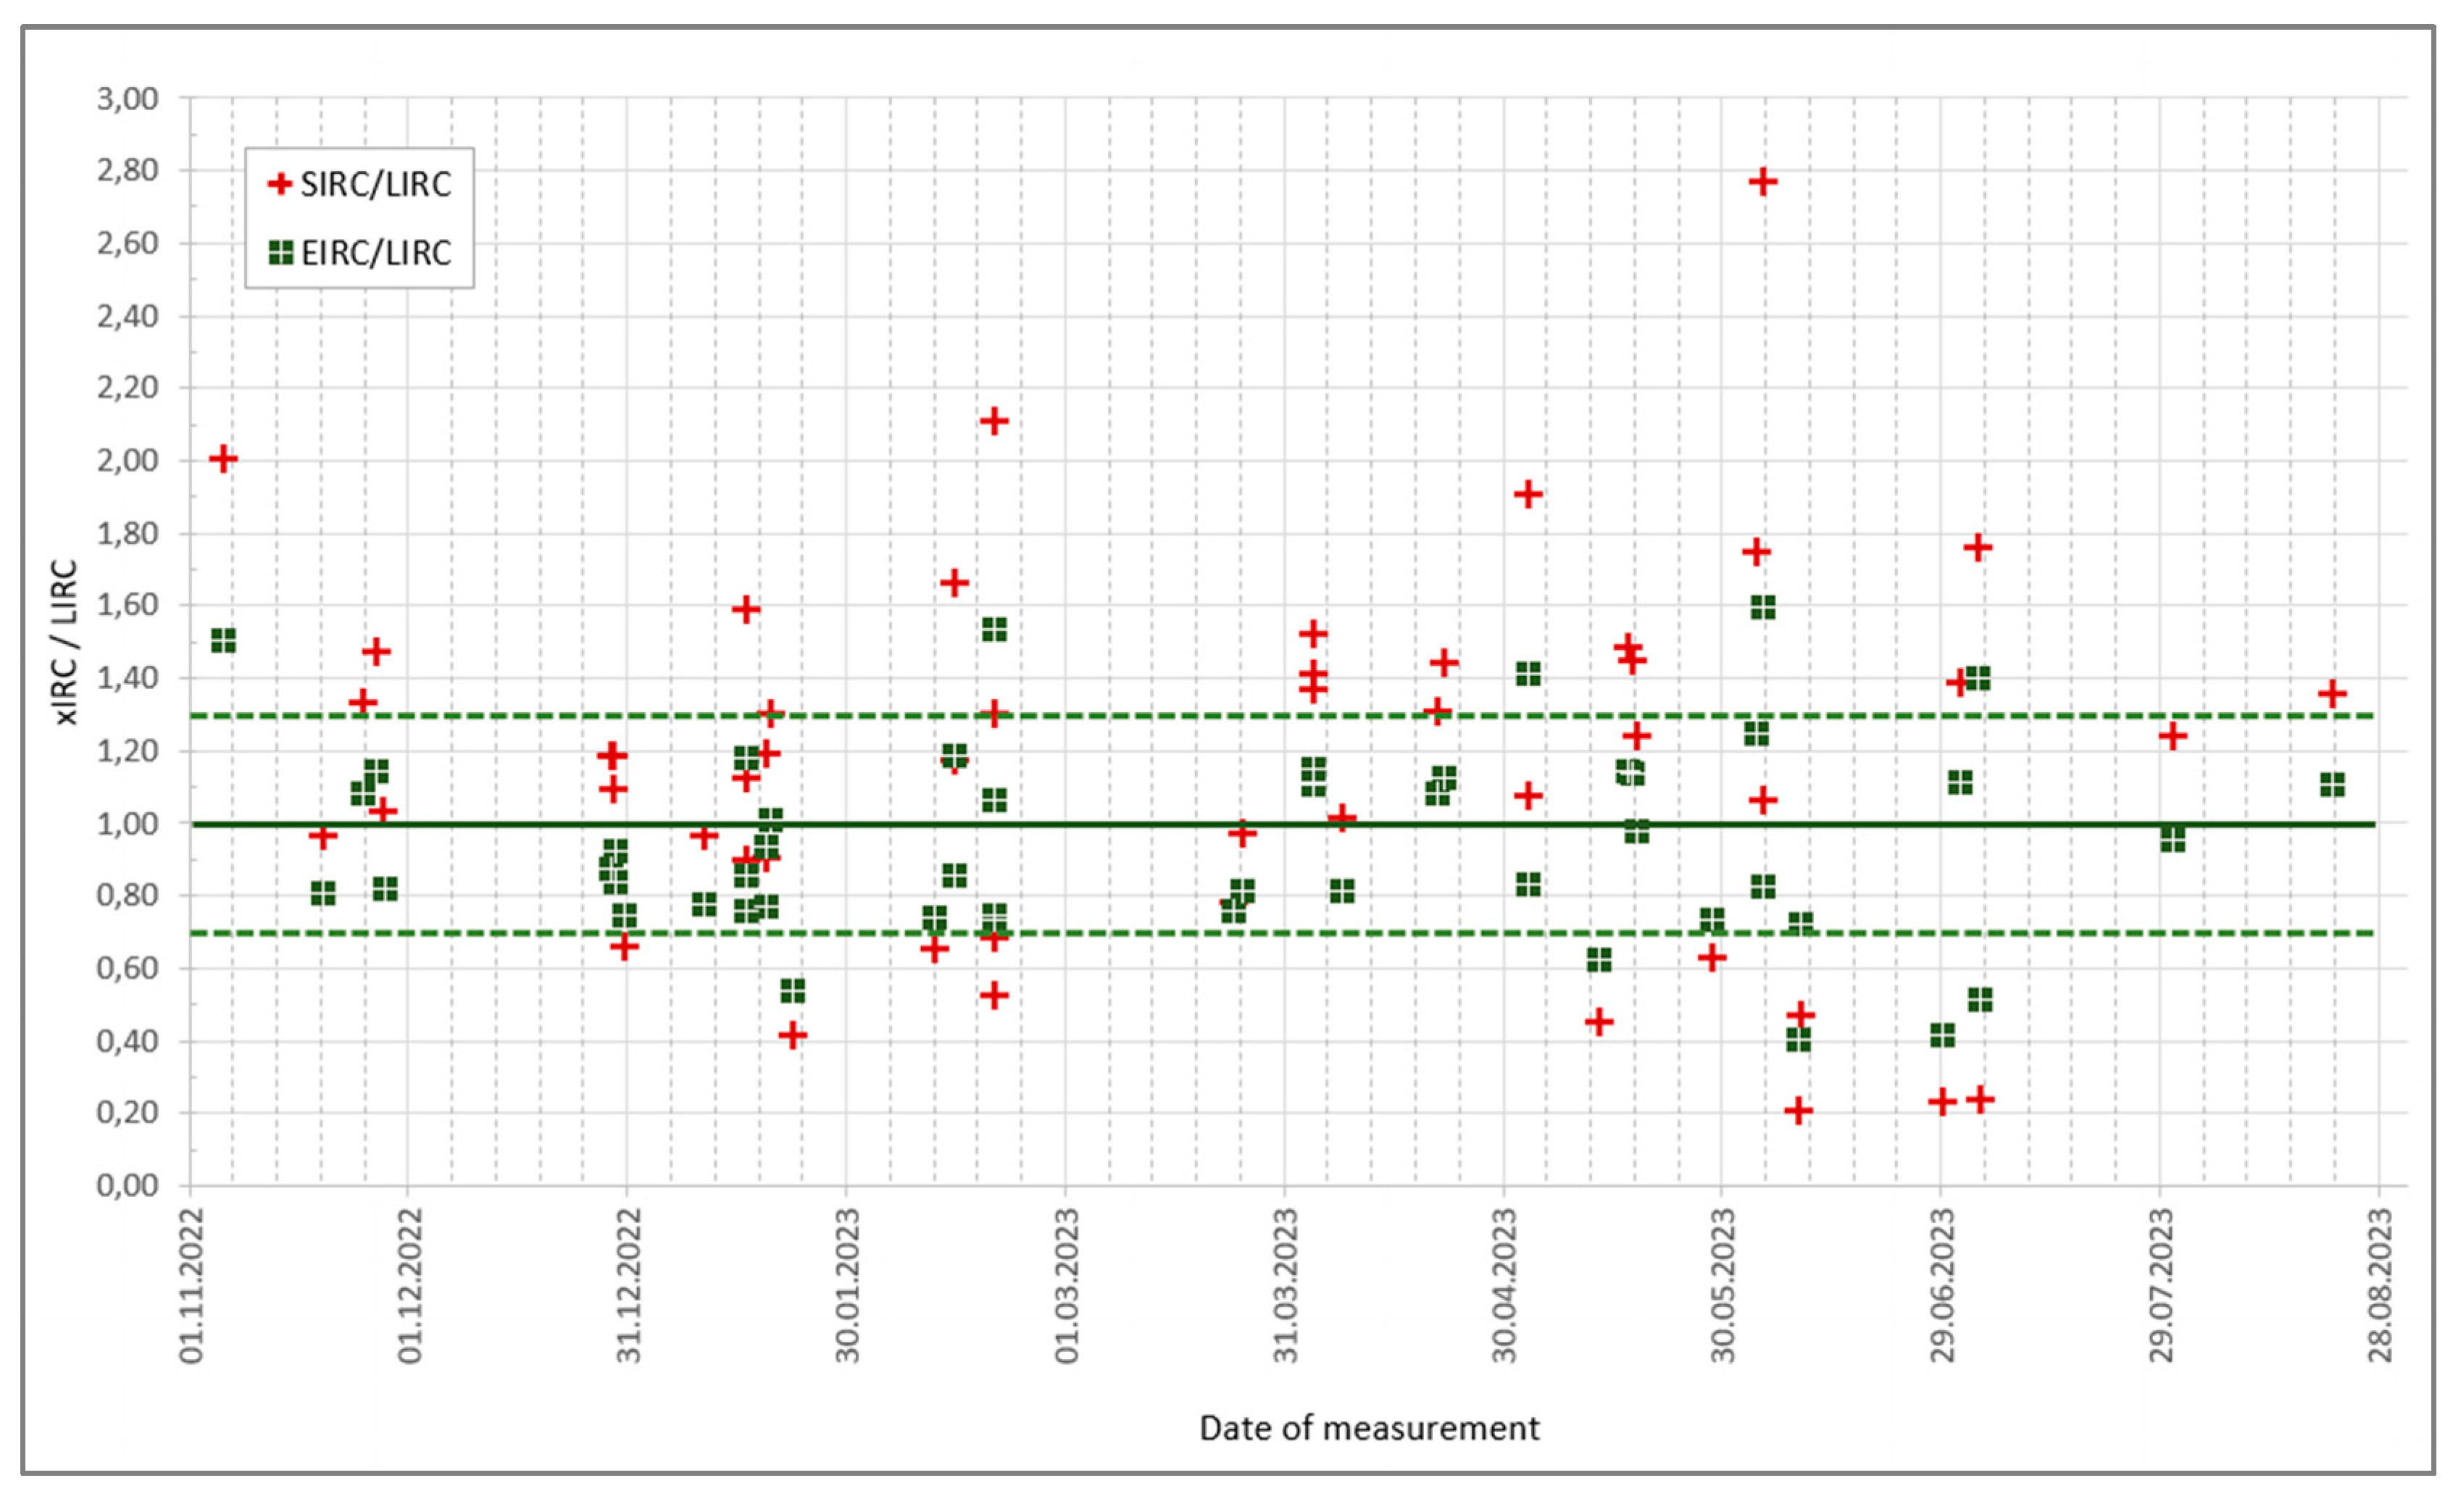
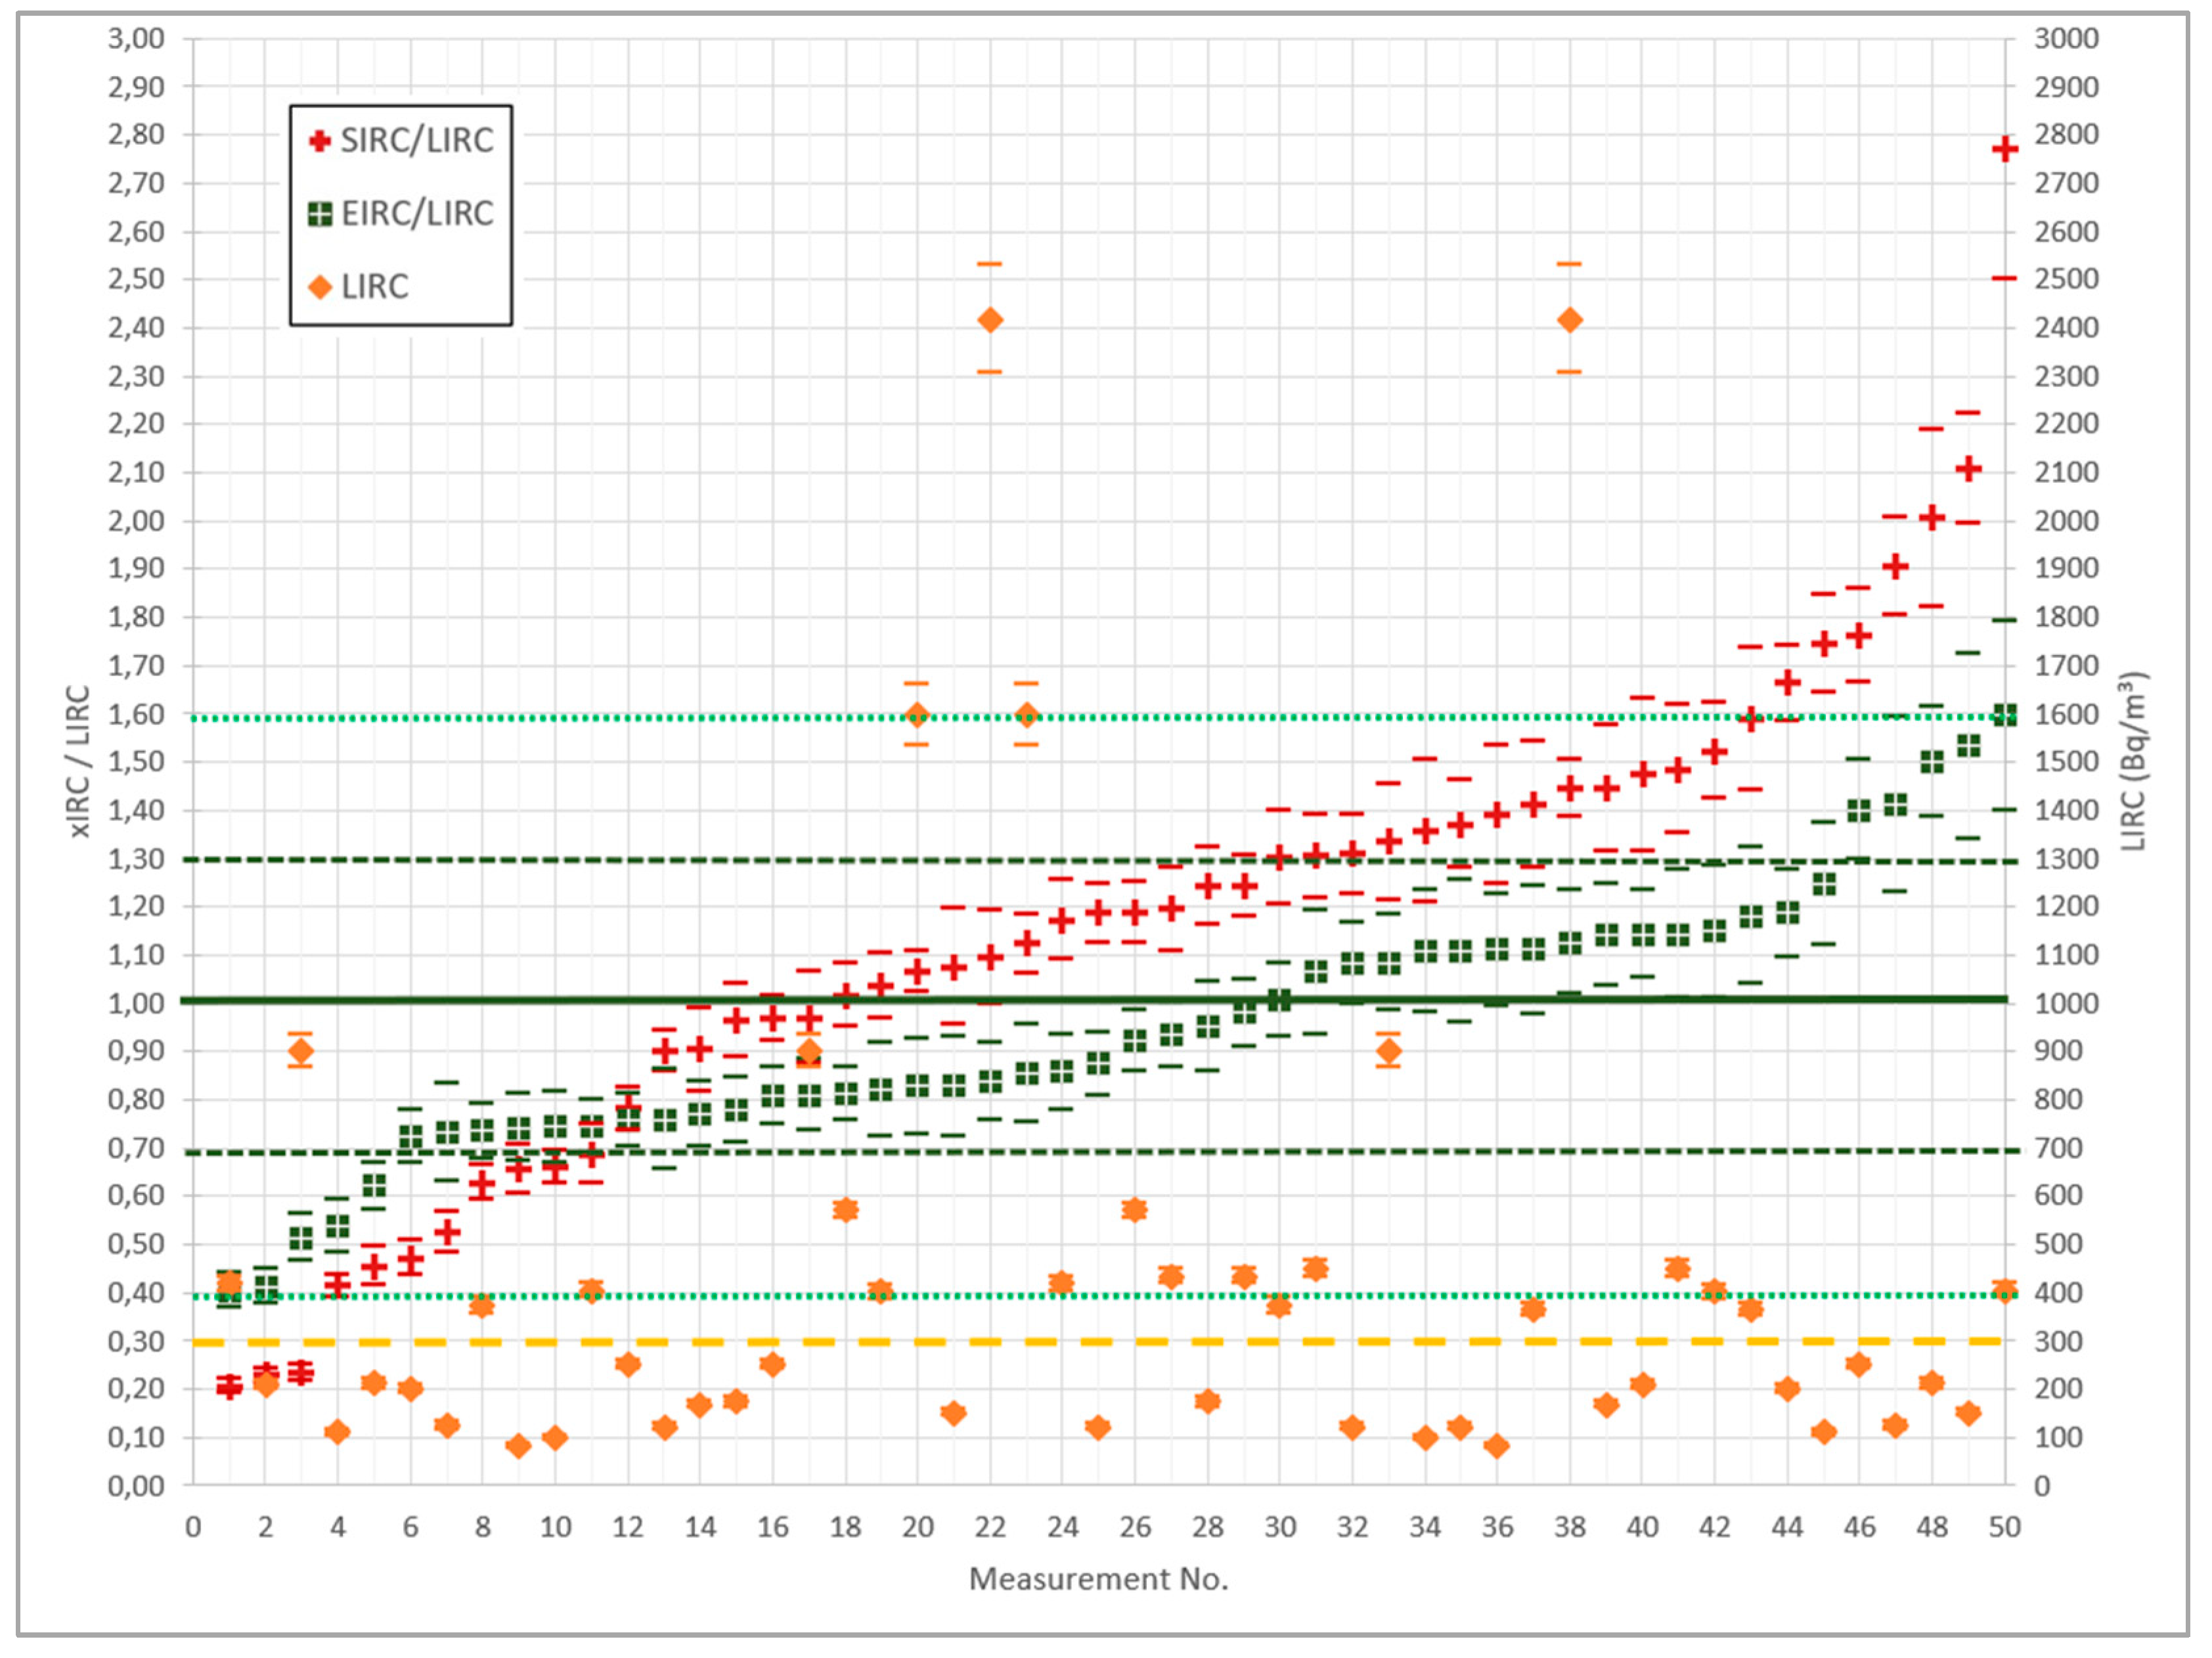
3.5. Result of the Uncertainty Analysis
The standard measurement uncertainty
u(
EIRC) of the
EIRC using formula (2) was estimated according to the state of the art (e.g. [
24]).
In doing so, the uncertainties of the mean values SIRC of the measured hourly mean values cRN* have been calculated with the uncertainties of the individual hourly mean values u(cRN*) in a suitable manner. The standard uncertainties of the individual hourly mean values – mainly caused by the uncertainty of the calibration of the radon measuring instrument used and the counting statistical uncertainty – were outputed in most cases by the radon measuring instruments together with hourly mean values: cRN* ± u(cRN*).
The relative uncertainty
urel(
) of the function
of formula (2) was estimated by adding a plausible constant (relative) contribution of 3% to the total uncertainty
urel(
EIRC):
Unlike the AlphaGuard and AlphaE devices, the RadonEye Plus 2 measuring instruments do not record the measurement uncertainty
u(
cRn*) of the IRC hourly mean values
cRn*, which is why these were estimated using formula (14).
with
f1 = 1∙Bq/m³, which factorise the estimated stochastic part of the uncertainty, because the sensitivity of the RadonEye Plus2 instrument is about 30 counts per hour at 37 Bq/m³, this means in 1 hour: ) ).
f2 = 0.05, which factorise the estimated non-stochatic part of the relative uncertainty (mainly the calibration uncertainty).
3.6. Application of the Regression Analysis on the Short-Term Measurments
In
Figure 7 and
Figure 8, the results of the regression analysis by adjusting the short-term measurement data to the long-term measurement data (least-square-fit) are shown, considering the identified influencing parameters of the 50 short-term and 24 long-term Rn-222 measurements in the 24 investigated rooms in the period from October 2022 to July 2023. In each of the 24 rooms, one long-term measurement and at least one short-term measurement each in the winter and summer seasons were carried out, with two rooms additionally being measured in spring.
Figure 3 shows the ratio values over the measurement period,
Figure 4 shows the distributions of the ratio values (sorted in ascending order).
Figure 7 shows that the application of the physical-statistical model based on Spearman’s correlation analysis and further physical considerations has significantly improved the estimation of the annual mean value (EIRC) compared to the short-term measurements (SIRC). While the ratios of 32 out of 50 short-term measurements (62%) deviate from the optimal value of 1.0 by more than ± 30%, only 10 out of 50 EIRC values (20%) are outside the ± 30% interval.
Figure 8 shows that for the 24 rooms examined, all EIRC/LIRC ratios of the 50 short-term measurements lie within the interval 0.4 to 1.6, while the SIRC/LIRC values lie in the larger interval 0.2 to 2.8. 11 of 24 long-term radon averages LIRC (46%) are greater than 300 Bq/m³ (
Figure 4; note: the 24 long-term averages of the 24 investigated rooms are distributed among the 50 short-term averages).
4. Discussion and Conclusions
The present study developed a procedure that allowed the estimation of the annual indoor radon-222 mean value from three-weeks measurements of the radon-222 activity concentration (hourly mean values) with active radon measuring devices, taking into account defined influencing parameters. The procedure was developed on the basis of measurements in 24 interior spaces in four Austrian federal states. With the developed method, the significant influences on the short-term measurements could be ‘calculated out’ and the deviations of the results of the short-term measurements from the results of the long-term measurement could be significantly reduced.
If a 3-weeks short-term measurement is used to check whether the annual average value has fallen below an annual mean radon-222 reference value, the EIRC value multiplied by the safety factor 2.5 can be used to determine with sufficient certainty whether the Radon-222 annual mean limit value is not exceeded:
If the short-term measurement SIRC directly were used for this determination, the safety factor would have to be set to 5.0:
However, these criteria only apply to the interiors examined in this study. A generalisation requires a test and validation study of the introduced method, which a study that has already been started.
When applying the results of the analyses carried out here, it should be noted that the long-term average IRC value determined by measurement (6-month measurement, of which 3 months were in the winter season) of an indoor room also represents only an more or less certain estimate of the ‘hypothetical’ annual IRC mean value.
Based on further measurements and similar physical-statistical analyses, it should be possible to test and improve the generalisation of the method to other indoor spaces and to further develop the functional relationships. To validate and improve the method presented regarding reliable application, similar measurements will be carried out in further indoor spaces (in different regions and different types of buildings) in a continuation of the investigations. Corresponding adjustments will be made in the selection of the influencing parameters and their functional relationships, or existing measurements will be evaluated in this respect.
In this research, indoor rooms with an estimated minimum (annual mean) radon concentration of 100 Bq/m³ were specifically selected. This approach enabled differentiation between temporal changes in IRC and the stochastic noise of the measuring devices. However, future investigations should also include houses with lower radon levels to examine whether the findings can be confirmed under these conditions.
The analyses conducted so far suggest that ventilation behaviour has a significant impact on the measurement results. However, the participants’ statements about whether they ventilate extensively or minimally are strongly influenced by their subjective perception. To better interpret the results, a standardized ventilation protocol could be implemented in future studies.
In further investigations, the influence of wind should be analysed in greater detail, as the previous analysis only determined the correlation between wind speed and IRC, as well as wind direction and IRC, without examining the functional relationships in depth. Regarding the impact of wind speed on IRC, wind direction and the location of the buildings should therefore be taken into account.
Furthermore, additional analyses of the existing measurements are needed to determine whether the observed correlations between IRC and air pressure are due to the stack effect or if they occurred for other reasons.
In the present study, the three-week mean values of the radon activity concentration and the influencing factors were used to determine the estimated value of the annual mean value of the radon activity concentration. In a follow-up study, which has already been started, the information from the hourly mean values of the radon activity concentration during the short-term measurement period is to be used in relation to the hourly mean values of the influencing factors to estimate the annual mean value of the radon activity concentration. In addition, it is planned to use an AI-based neural network method to directly infer the annual mean from the hourly mean values of the radon concentration during the short-term measurement period.
Acknowledgements
The authors are grateful for the valuable and crucial support of Hannah Wiedner - Radiation Protection Laboratory of the City of Vienna (Stadt Wien), MA 39, Tobias Moreau - Seibersdorf Laboratories, Austria, Robert Brettner-Messler - BEV Bundesamt für Eich- und Vermessungswesen (Federal Office for Metrology and Surveying) and Dominik Boya, Xaver Goidinger, and Johannes Toth, TU Wien. This research was funded by the Austrian Federal Ministry for Climate Action, Environment, Energy, Mobility, Innovation and Technology (BMK), grant number GZ 2023-0.312.455.
References
- Rey, J.F. Goyette, M. Gandolla, M. Palacios, F. Barazza, und J. Goyette Pernot. Long-Term Impacts of Weather Conditions on Indoor Radon Concentration Measurements in Switzerland. Atmosphere 13/1, 2022, p. 92. [CrossRef]
- radon-handbuch.pdf. Available Online https://www.bfs.de/SharedDocs/Downloads/BfS/DE/broschueren/ion/radon-handbuch.pdf?__blob=publicationFile&v=9 (8 January 2024).
- Steck, D.J. Spatial and Temporal Indoor Radon Variations. Health Phys. 62/4, pp. 351–355, 1992. [CrossRef]
- Miles, J. Temporal Variation of Radon Levels in Houses and Implications for Radon Measurement Strategies. Radiat. Prot. Dosimetry 93/4, pp. 369–375, 2001. [CrossRef]
- Park; J.; Lee; C.; Lee; H.; Kang Estimation of Seasonal Correction Factors for Indoor Radon Concentrations in Korea. Int. J. Environ. Res. Public. Health 15/10, p. 2251, 2018. [CrossRef]
- Miles, J.C.H.; Howarth, C.B.; Hunter, N. Seasonal variation of radon concentrations in UK homes. J. Radiol. Prot. 32/3, pp. 275–287, 2012. [CrossRef]
- Denman, A.R.; Crockett, R.G.M.; Groves-Kirkby, C.J.; Phillips, P.S.; Gillmore, G.K.; Woolridge, A.C. The value of Seasonal Correction Factors in assessing the health risk from domestic radon—A case study in Northamptonshire, UK. Environ. Int. 33/ 1, pp. 34–44, 2007. [CrossRef]
- Bochicchio, F.; et al. Annual average and seasonal variations of residential radon concentration for all the Italian Regions. Radiat. Meas. 40/ 2–6, pp. 686–694, 2005. [CrossRef]
- Hessisches Ministerium für Umwelt, Klimaschutz, Landwirtschaft und Verbraucherschutz. 2019_11_25_radonbroschuere_final.pdf“. Available online https://umwelt.hessen.de/sites/umwelt.hessen.de/files/2021-11/2019_11_25_radonbroschuere_final.pdf (21 January 2024).
- Gruber, V.; Baumann, S.; Wurm, G.; Ringer, W.; Alber, O. The new Austrian indoor radon survey (ÖNRAP 2, 2013–2019): Design, implementation, results. J. Environ. Radioact. 233, 2021. [CrossRef]
- us_radon_sanierungen.pdf. Available online https://www.land-oberoesterreich.gv.at/files/publikationen/us_radon_sanierungen.pdf (6 June 2023).
- Jo, J.-H.; Lim, J.-H.; Song, S.-Y.; Yeo, M.-S.; Kim, K.-W. Characteristics of pressure distribution and solution to the problems caused by stack effect in high-rise residential buildings. Build. Environ. 42/1, pp. 263–277, 2007. [CrossRef]
- Klote, J.H. A General Routine for Analysis of Stack Effect.. Zugegriffen: 11. April 2024. Available online https://nvlpubs.nist.gov/nistpubs/Legacy/IR/nistir4588.pdf (11 April 2024).
- RIS. Radonschutzverordnung - Bundesrecht konsolidiert. Available online https://www.ris.bka.gv.at/GeltendeFassung.wxe?Abfrage=Bundesnormen&Gesetzesnummer=20011323&FassungVom=2023-11-20 (20 November 2023).
- BfS. Wann ist mein Haus / meine Wohnung besonders gefährdet? Bundesamt für Strahlenschutz. Available online https://www.bfs.de/DE/themen/ion/umwelt/radon/schutz/gefaehrdung.html (6. June 2023).
- Blum, M. Neue Kurzzeitmessmethoden für die Ermittlung der Rn-222-Aktivitätskonzentration in Wohnräumen (New short-term measurement methods for determining the Rn-222 activity concentration in living spaces). Masterthesis. Faculty of Physics, TU Wien. 2024 (in German).
- ISO/IEC 17025. General requirements for the competence of testing and calibration laboratories. Edition 3, 1017. International Organization for Standardization, Geneva, Switzerland.
- ISO 11665-4. International Organization for Standardization, Geneva, Switzerland. 2021. International Organization for Standardization, Geneva, Switzerland.
- AGES - Strahlenschutz Serviceleistungen. Austrian Agency for Health and Food Safety AGES. Available online https://www.ages.at/umwelt/radioaktivitaet/strahlenschutz-serviceleistungen (6 June 2023).
- ÖNORM S 5280-1. Radon Teil 1: Messtechnische Aufgabenstellung und Beurteilung (Radon - Part 1: Measurement tasks and evaluation). Austrian Standards Institute, 2017.
- Cohen, J. Statistical power analysis for the behavioral sciences (2nd ed.). Hillsdale, N.J.: L. Erlbaum Associates, 1988.
- SigmaPlot 15, Manual, Grafity GmbH, Germany, 2020. Available online http://www.systat.de/PDFs/SigmaPlot_Handbuch_1.pdf (19 December 2024).
- Press, W.H.; Flannery, B.P.; Teukolsky, S.A.; Vetterling, W.T. Numerical Recipes. Cambridge: Cambridge University Press. 1986.
- JCGM 100:2008. Evaluation of measurement data — Guide to the expression of uncertainty in measurement (GUM 1995 with minor corrections), Bureau International des Poids et Mesures (BIPM), Sévres, 2008.
Figure 1.
Location of the measured sites in Austria – (a) Upper Austria, (b) northern Lower Austria and Vienna, (c) southern Lower Austria, and (d) Tyrol, (maps: Wikimedia Commons).
Figure 1.
Location of the measured sites in Austria – (a) Upper Austria, (b) northern Lower Austria and Vienna, (c) southern Lower Austria, and (d) Tyrol, (maps: Wikimedia Commons).
Figure 2.
Instruments comparison – course of the devices’ given hourly average values at higher Rn-222 activity concentrations.
Figure 2.
Instruments comparison – course of the devices’ given hourly average values at higher Rn-222 activity concentrations.
Figure 3.
Course of SIRC, formular (3), over the course of a year (for EIRC = 300 Bq/m³) .
Figure 3.
Course of SIRC, formular (3), over the course of a year (for EIRC = 300 Bq/m³) .
Figure 4.
Dependence of SIRC, formular (4), on the outside temperature TTX* (for EIRC = 300 Bq/m³) .
Figure 4.
Dependence of SIRC, formular (4), on the outside temperature TTX* (for EIRC = 300 Bq/m³) .
Figure 5.
Dependence, formular (9), of SIRC on the relative standard deviation of measured cRn valuies (for EIRC = 300 Bq/m³) .
Figure 5.
Dependence, formular (9), of SIRC on the relative standard deviation of measured cRn valuies (for EIRC = 300 Bq/m³) .
Figure 6.
Dependence, formular (10), of SIRC on the mean value of all PPX’ values < 0 (for EIRC = 300 Bq/m³).
Figure 6.
Dependence, formular (10), of SIRC on the mean value of all PPX’ values < 0 (for EIRC = 300 Bq/m³).
Figure 7.
Ratios SIRC (short-term measurement)/LIRC (long-term measurement) (red) and EIRC (annual mean estimated value)/LIRC (long-term measurement) (green) of the individual measurements (time of measurement = mid-way through the measurement period; uncertainty bars ± 3% to ± 11% omitted for clarity).
Figure 8.
Ratios (with uncertainty bars) SIRC (short-term measurement)/LIRC (long-term measurement) (red) and EIRC (annual mean estimate)/LIRC long-term measurement (green) – sorted in ascending order, plus LIRC (Bq/m³) of the long-term measurements (orange).
Figure 8.
Ratios (with uncertainty bars) SIRC (short-term measurement)/LIRC (long-term measurement) (red) and EIRC (annual mean estimate)/LIRC long-term measurement (green) – sorted in ascending order, plus LIRC (Bq/m³) of the long-term measurements (orange).
Table 1.
Instruments comparison – assessed correction factors of the measuring instruments.
Table 1.
Instruments comparison – assessed correction factors of the measuring instruments.
Table 2.
Results of the short-term (3 weeks) and long-term (6 month) IRC measurements.
Table 2.
Results of the short-term (3 weeks) and long-term (6 month) IRC measurements.
Table 3.
Strength of significance of the analysed correlations cRn* (hourly mean values) with influencing ambient condition factors.
Table 3.
Strength of significance of the analysed correlations cRn* (hourly mean values) with influencing ambient condition factors.
|
Disclaimer/Publisher’s Note: The statements, opinions and data contained in all publications are solely those of the individual author(s) and contributor(s) and not of MDPI and/or the editor(s). MDPI and/or the editor(s) disclaim responsibility for any injury to people or property resulting from any ideas, methods, instructions or products referred to in the content. |
© 2025 by the authors. Licensee MDPI, Basel, Switzerland. This article is an open access article distributed under the terms and conditions of the Creative Commons Attribution (CC BY) license (http://creativecommons.org/licenses/by/4.0/).