Submitted:
05 January 2025
Posted:
06 January 2025
You are already at the latest version
Abstract
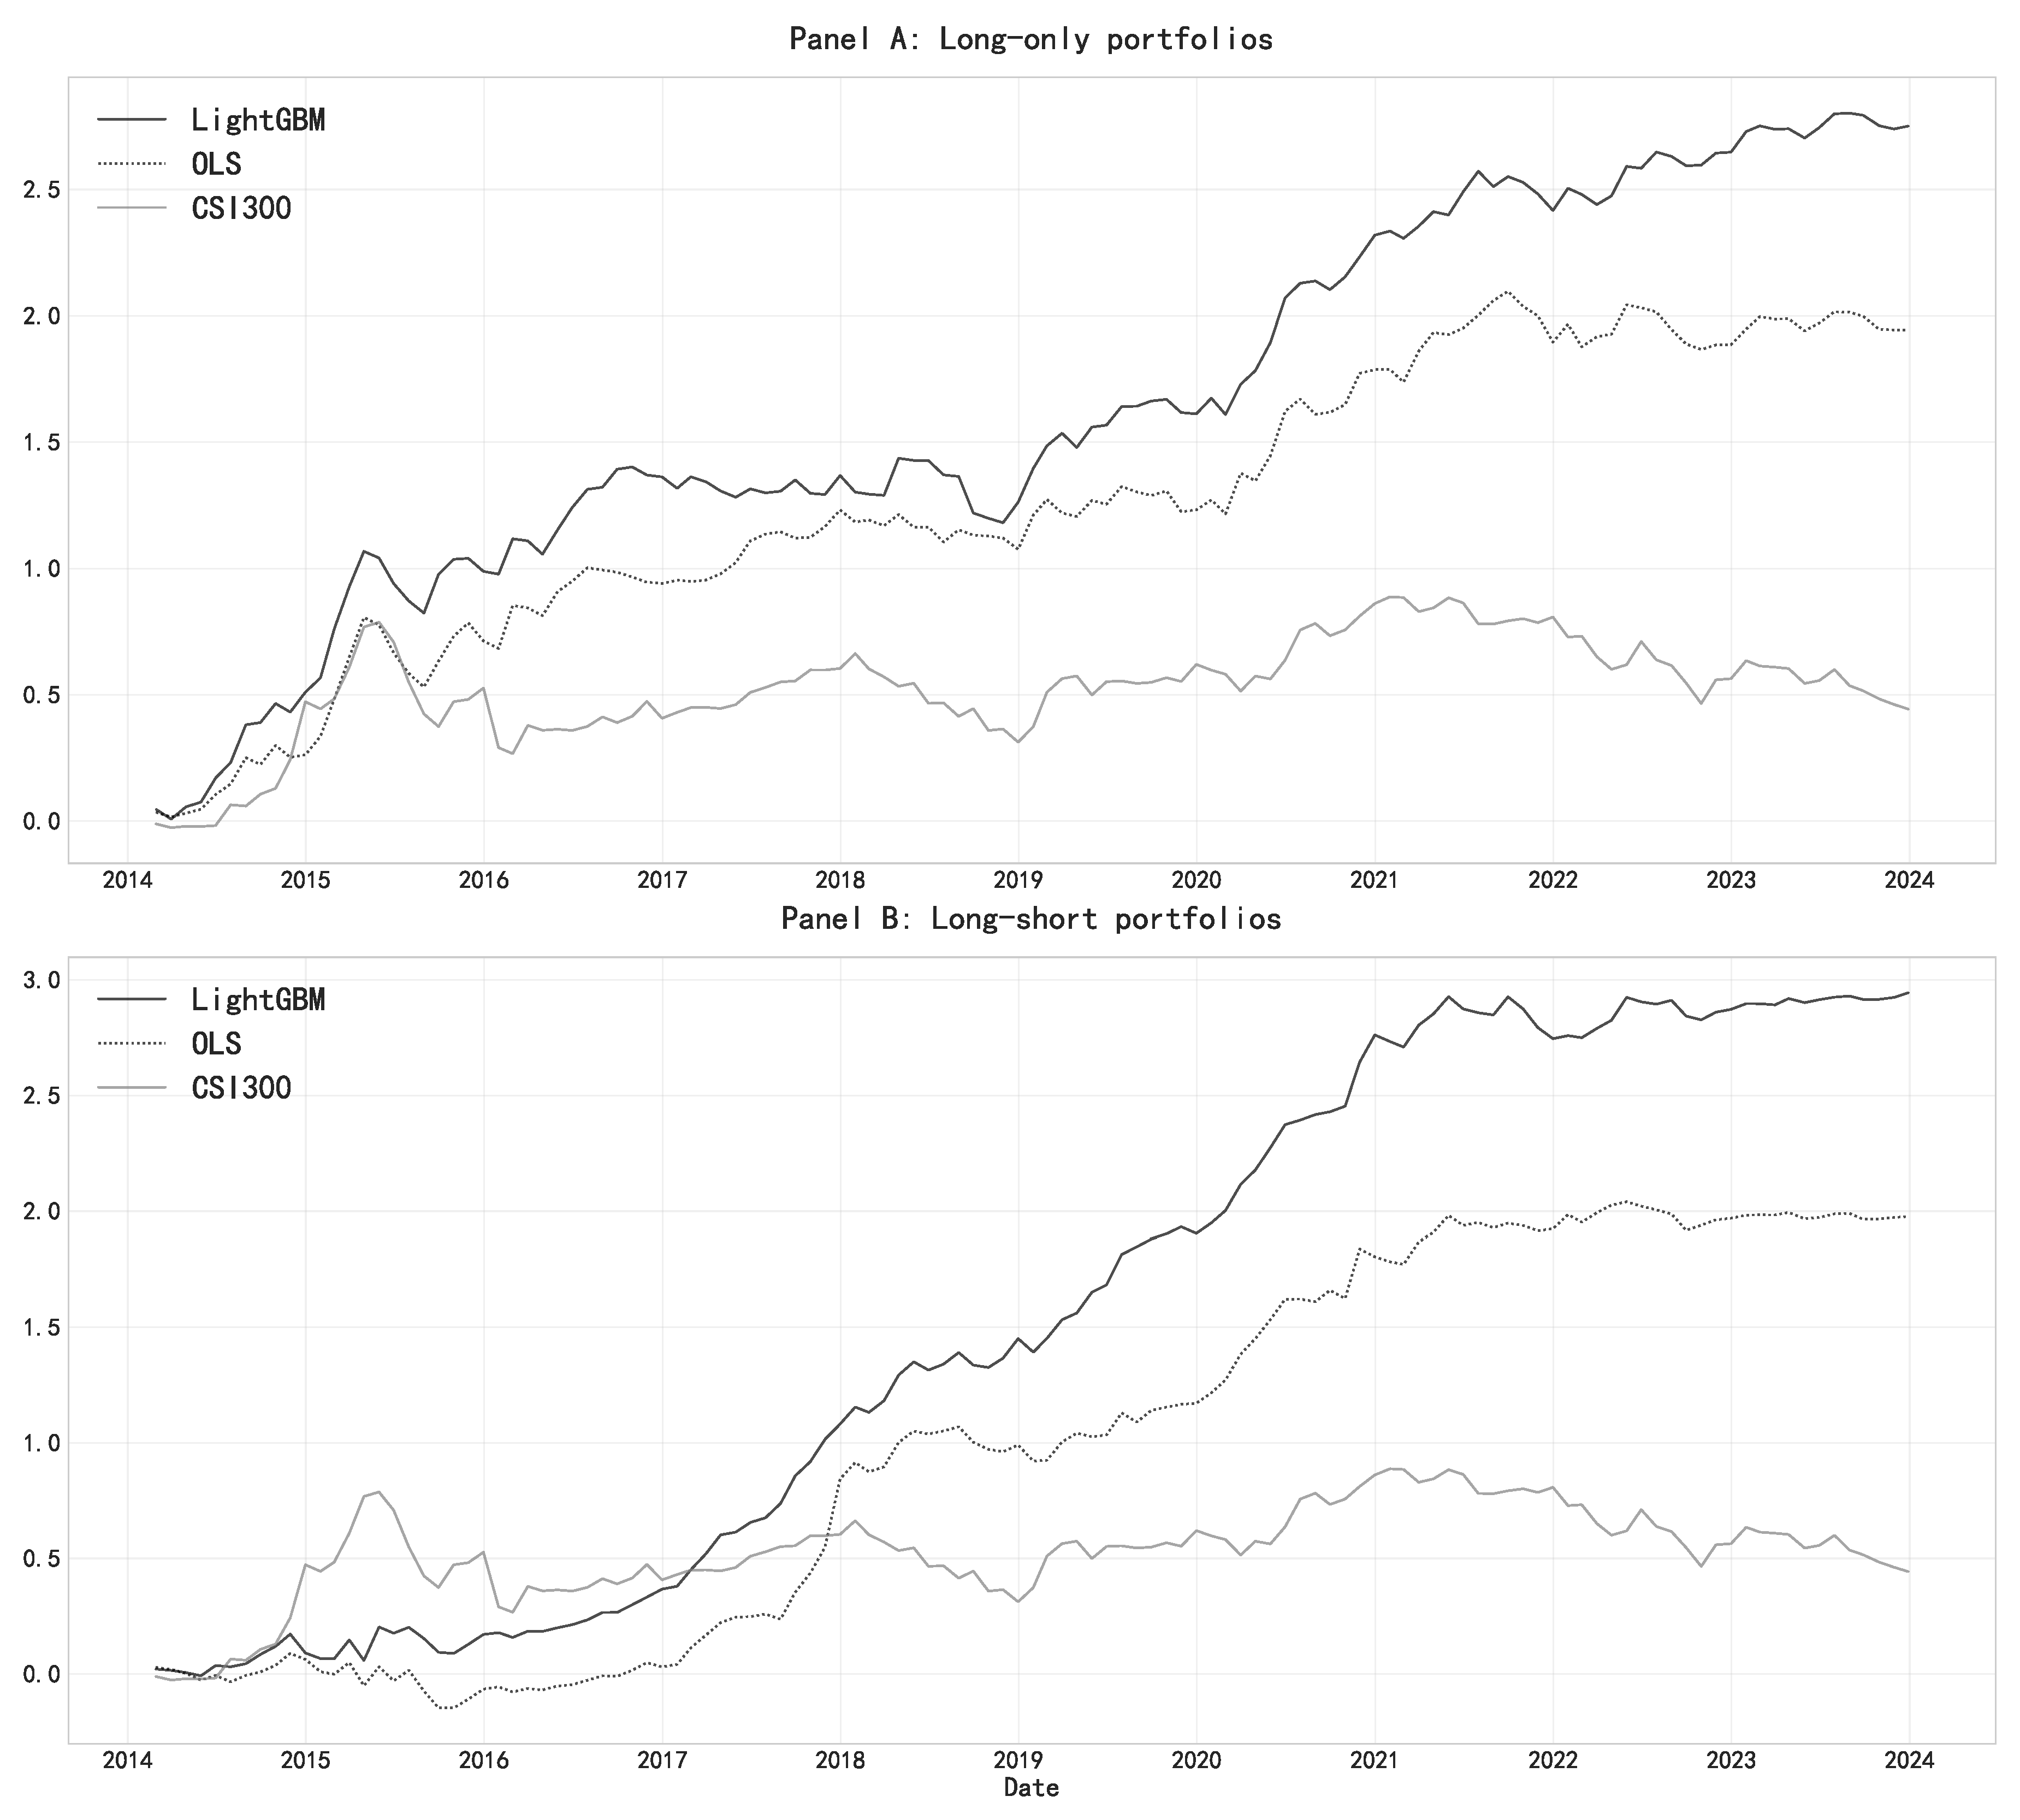
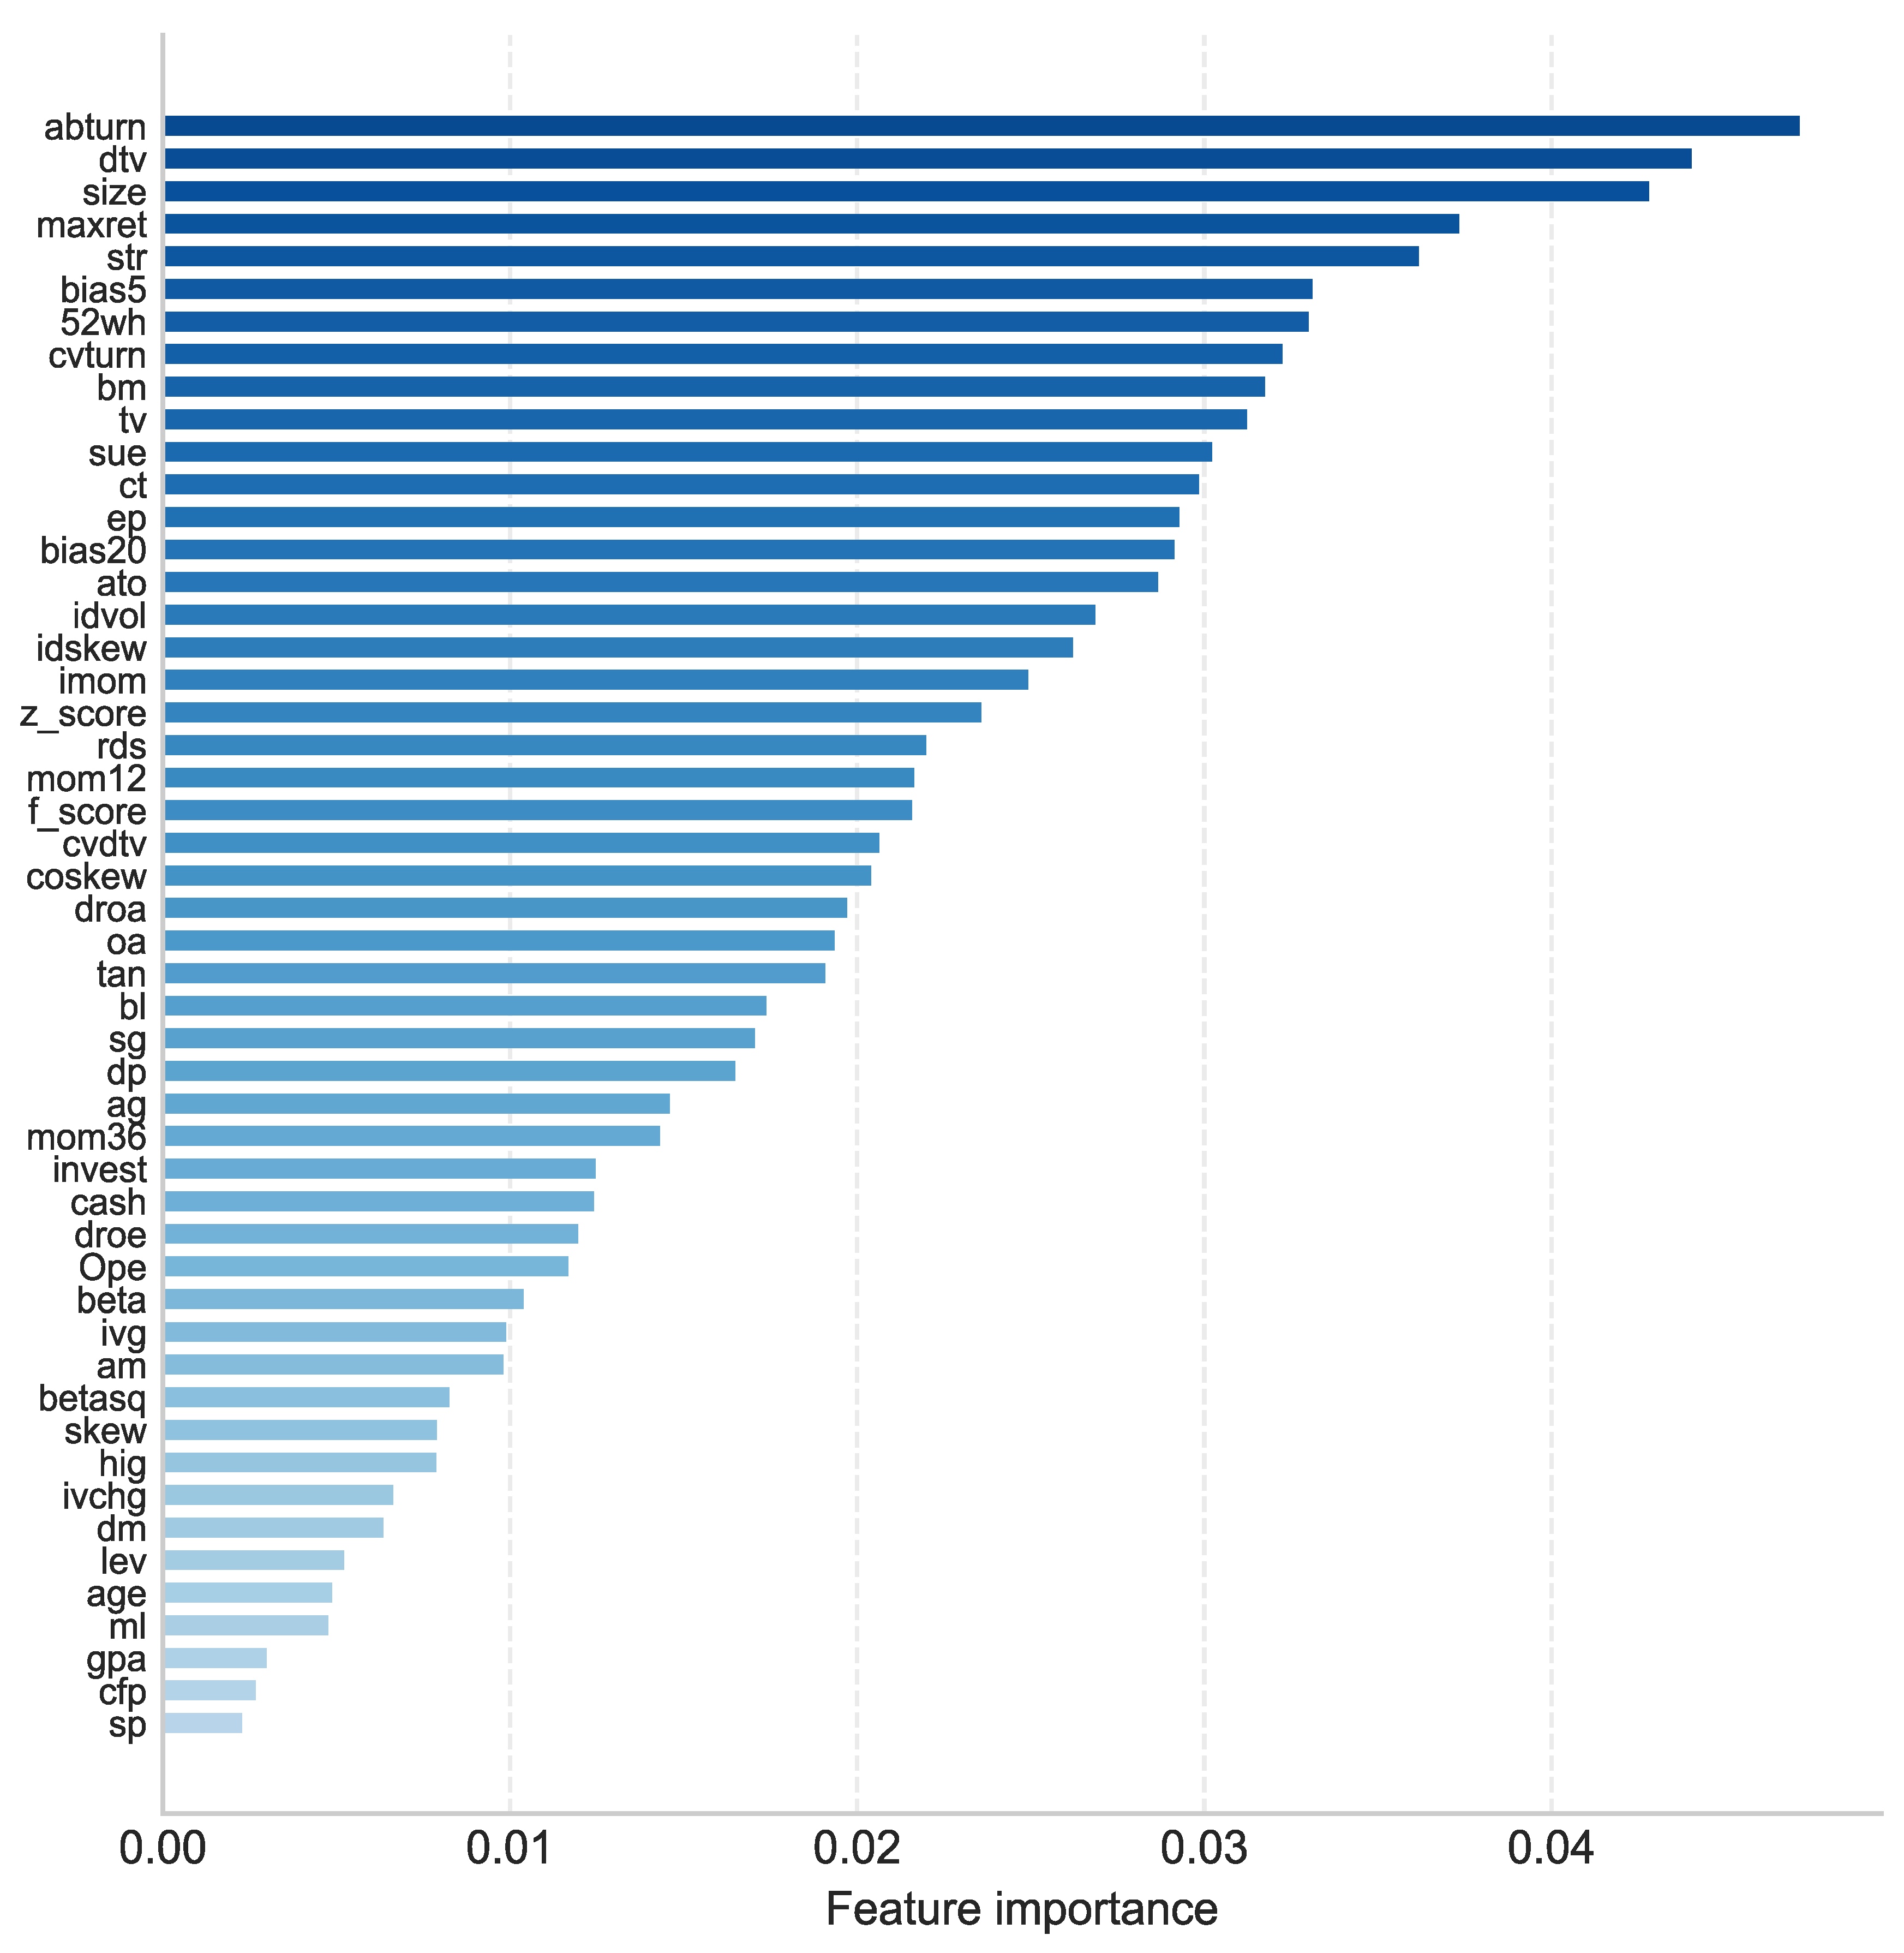
This study employs LightGBM, a gradient boosting decision tree model, to predict stock returns and identify key pricing factors in the Chinese A-share market. The empirical analysis yields two main findings. First, LightGBM demonstrates superior predictive performance, achieving a monthly out-of-sample R² of 2.13%, more than doubling the 0.95% of traditional OLS regression. This advantage translates into significant economic gains: a LightGBM-based long-short strategy generates a monthly return of 2.63% with a Sharpe ratio of 1.77, substantially outperforming both the OLS-based strategy and the market benchmark. Second, through feature importance analysis, this study finds that liquidity and volatility-related characteristics are the most influential predictors of stock returns in China, consistent with recent literature suggesting the predominant role of market microstructure factors in emerging markets. These findings highlight the potential of machine learning techniques in asset pricing and provide new insights into return prediction in the Chinese stock market.
Keywords:
1. Introduction
2. Data and Methodology
3. Results
4. Conclusions
Appendix A

| No | Acronym | Stock Characteristics | Author(s) | Year, Journal |
| 1 | abturn | Abnormal turnover | Liu et al. | 2016, JFE |
| 2 | ag | Asset growth | Cooper et al. | 2008, JF |
| 3 | age | Firm age | Jiang et al. | 2005, RAS |
| 4 | am | Asset to market equity | Bhandari | 1988, JF |
| 5 | ato | Asset turnover | Soliman | 2008, TAR |
| 6 | beta | Beta | Fama & MacBeth | 1973, JPE |
| 7 | betasq | Beta squared | Fama & MacBeth | 1973, JPE |
| 8 | bias5 | The 5-day bias | Zhang & Wu | 2009, ESA |
| 9 | bias20 | The 20-day bias | Zhang & Wu | 2009, ESA |
| 10 | bl | Book leverage | Fama & French | 1992, JF |
| 11 | bm | Book to market | Rosenberg et al. | 1985, JPM |
| 12 | cash | Cash holdings | Palazzo | 2012, JFE |
| 13 | cfp | Cash flow to price | Desai et al. | 2004, TAR |
| 14 | coskew | Skewness coefficient | Harvey & Siddique | 1999, JFQA |
| 15 | ct | Capital turnover | Hou et al. | 2020, RFS |
| 16 | cvturn | Coefficient of Variation of Share Turnover | Chordia et al. | 2001, JFE |
| 17 | cvdtv | Coefficient of Variation of Trading Volume | Chordia et al. | 2001, JFE |
| 18 | dm | Debt to market equity | Hou et al. | 2020, RFS |
| 19 | dp | Dividend to price | Litzenberger et al. | 1982, JF |
| 20 | dtv | Trading volume | Brennan et al. | 1998, JFE |
| 21 | droa | Change in return on asset | Hou et al. | 2020, RFS |
| 22 | droe | Change in return on equity | Hou et al. | 2020, RFS |
| 23 | ep | Earnings to price | Basu | 1977, JF |
| 24 | f_score | F score | Piotroski | 2000, JAR |
| 25 | gpa | Gross profit to asset | Novy-Marx | 2013, JFE |
| 26 | hig | Employee growth rate | Bazdresch et al. | 2014, JPE |
| 27 | idvol | Idiosyncratic volatility | Ali et al. | 2003, JFE |
| 28 | idskew | Idiosyncratic skewness | Boyer et al. | 2010, RFS |
| 29 | imom | Idiosyncratic momentum | Blitz et al. | 2011, JEF |
| 30 | invest | Capital expenditures and inventory | Chen & Zhang | 2010, JF |
| 31 | ivchg | Inventory changes | Hou et al. | 2020, RFS |
| 32 | ivg | Inventory growth | Hou et al. | 2020, RFS |
| 33 | lev | Leverage | Bhandari | 1988, JF |
| 34 | maxret | Maximum daily return | Bali et al. | 2011, JFE |
| 35 | mom12 | 12-month momentum | Jegadeesh | 1990, JF |
| 36 | mom36 | 36-month momentum | Jegadeesh &Titman | 1993, JF |
| 37 | ml | Market leverage | Fama & French | 1992, JF |
| 38 | oa | Operating accruals | Hribar & Collins | 2002, JAR |
| 39 | Ope | Operating profits to book equity | Fama & French | 2015, JFE |
| 40 | rds | R&D to sales | Guo et al. | 2006, JBFA |
| 41 | sp | Sales to price | Barbee et al. | 1996, FAJ |
| 42 | skew | Skew | Amaya | 2015, JFE |
| 43 | size | Size | Banz | 1981, JFE |
| 44 | sue | Standardized unexpected earnings | Foster et al. | 1984, TAR |
| 45 | str | Short term reversal | Jegadeesh | 1990, JF |
| 46 | sg | Sales growth | Lakonishok | 1994, JF |
| 47 | tv | Total volatility | Ang et al. | 2010, JF |
| 48 | tan | Debt capacity/firm tangibility | Almeida et al. | 2007, RFS |
| 49 | 52wh | The highest return in 52-week | George et al. | 2004, JF |
| 50 | z_score | Z score | Altman | 1968, JF |
References
- Carmona, P.; Climent, F.; Momparler, A. Predicting failure in the US banking sector: An extreme gradient boosting approach. International Review of Economics & Finance 2019, 61, 304–323. [Google Scholar] [CrossRef]
- Chen, X.; Mao, Z.; Wu, C. Multi-class Financial Distress Prediction Based on Feature Selection and Deep Forest Algorithm. Computational Economics 2024, 1–40. [Google Scholar] [CrossRef]
- Deng, S.; Zhu, Y.; Huang, X.; Duan, S.; Fu, Z. High-frequency direction forecasting of the futures market using a machine-learning-based method. Future Internet 2022, 14, 180. [Google Scholar] [CrossRef]
- Ferrouhi, E.M.; Bouabdallaoui, I. A comparative study of ensemble learning algorithms for high-frequency trading. Scientific African 2024, 24, e02161. [Google Scholar] [CrossRef]
- Gu, S.; Kelly, B.; Xiu, D. Empirical asset pricing via machine learning. The Review of Financial Studies 2020, 33, 2223–2273. [Google Scholar] [CrossRef]
- Ke, G.; Meng, Q.; Finley, T.; Wang, T.; Chen, W.; Ma, W.; ...; Liu, T.Y. Lightgbm: A highly efficient gradient boosting decision tree. Advances in neural information processing systems 2017, 30. [Google Scholar]
- Leippold, M.; Wang, Q.; Zhou, W. Machine learning in the Chinese stock market. Journal of Financial Economics 2021, 145, 64–82. [Google Scholar] [CrossRef]
- Lessmann, S.; Baesens, B.; Seow, H.V.; Thomas, L.C. Benchmarking state-of-the-art classification algorithms for credit scoring: An update of research. European Journal of Operational Research 2015, 247, 124–136. [Google Scholar] [CrossRef]
- Lin, W.; Hu, Y.; Tsai, C. Machine learning in financial crisis prediction: A survey. IEEE Transactions on Systems, Man, and Cybernetics 2022, 42, 421–436. [Google Scholar] [CrossRef]
- Lundberg, S. A unified approach to interpreting model predictions. arXiv 2017, arXiv:1705.07874. [Google Scholar]
- Ma, T.; Wang, W.; Chen, Y. Attention is all you need: An interpretable transformer-based asset allocation approach. International Review of Financial Analysis 2023, 90, 102876. [Google Scholar] [CrossRef]
- Nti, K.O.; Adekoya, A.; Weyori, B. Random forest based feature selection of macroeconomic variables for stock market prediction. American Journal of Applied Sciences 2019, 16, 200–212. [Google Scholar] [CrossRef]
- Petropoulos, A.; Siakoulis, V.; Stavroulakis, E.; Vlachogiannakis, N.E. Predicting bank insolvencies using machine learning techniques. International Journal of Forecasting 2020, 36, 1092–1113. [Google Scholar] [CrossRef]
- Siswara, D.; Soleh, A.M.; Wigena, A.H. Classification Modeling with RNN-Based, Random Forest, and XGBoost for Imbalanced Data: A Case of Early Crash Detection in ASEAN-5 Stock Markets. arXiv 2024, arXiv:2406.07888. [Google Scholar]
| Algorithm | OLS | LightGBM |
| 0.95 | 2.13 |
| OLS | LightGBM | |
| Long-Only | ||
| Mean | 1.83 | 2.54 |
| SR | 1.01 | 1.34 |
| Max DD | -24.13 | -22.55 |
| Long-Short | ||
| Mean | 1.82 | 2.63 |
| SR | 1.11 | 1.77 |
| Max DD | -21.09 | -16.60 |
Disclaimer/Publisher’s Note: The statements, opinions and data contained in all publications are solely those of the individual author(s) and contributor(s) and not of MDPI and/or the editor(s). MDPI and/or the editor(s) disclaim responsibility for any injury to people or property resulting from any ideas, methods, instructions or products referred to in the content. |
© 2025 by the authors. Licensee MDPI, Basel, Switzerland. This article is an open access article distributed under the terms and conditions of the Creative Commons Attribution (CC BY) license (http://creativecommons.org/licenses/by/4.0/).


