Preprint
Article

This version is not peer-reviewed.

Body Mass Index and 10-year Clinical Outcomes After Percutaneous Coronary Intervention - Interaction With Age, Sex, Diabetic Status and Clinical Presentation

A peer-reviewed article of this preprint also exists.

Submitted:

02 January 2025

Posted:

03 January 2025

You are already at the latest version

Abstract

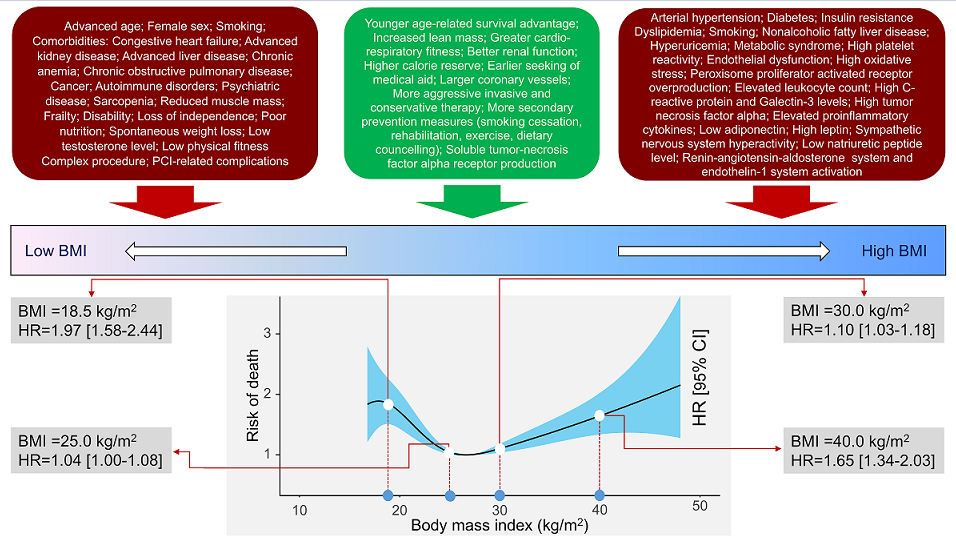
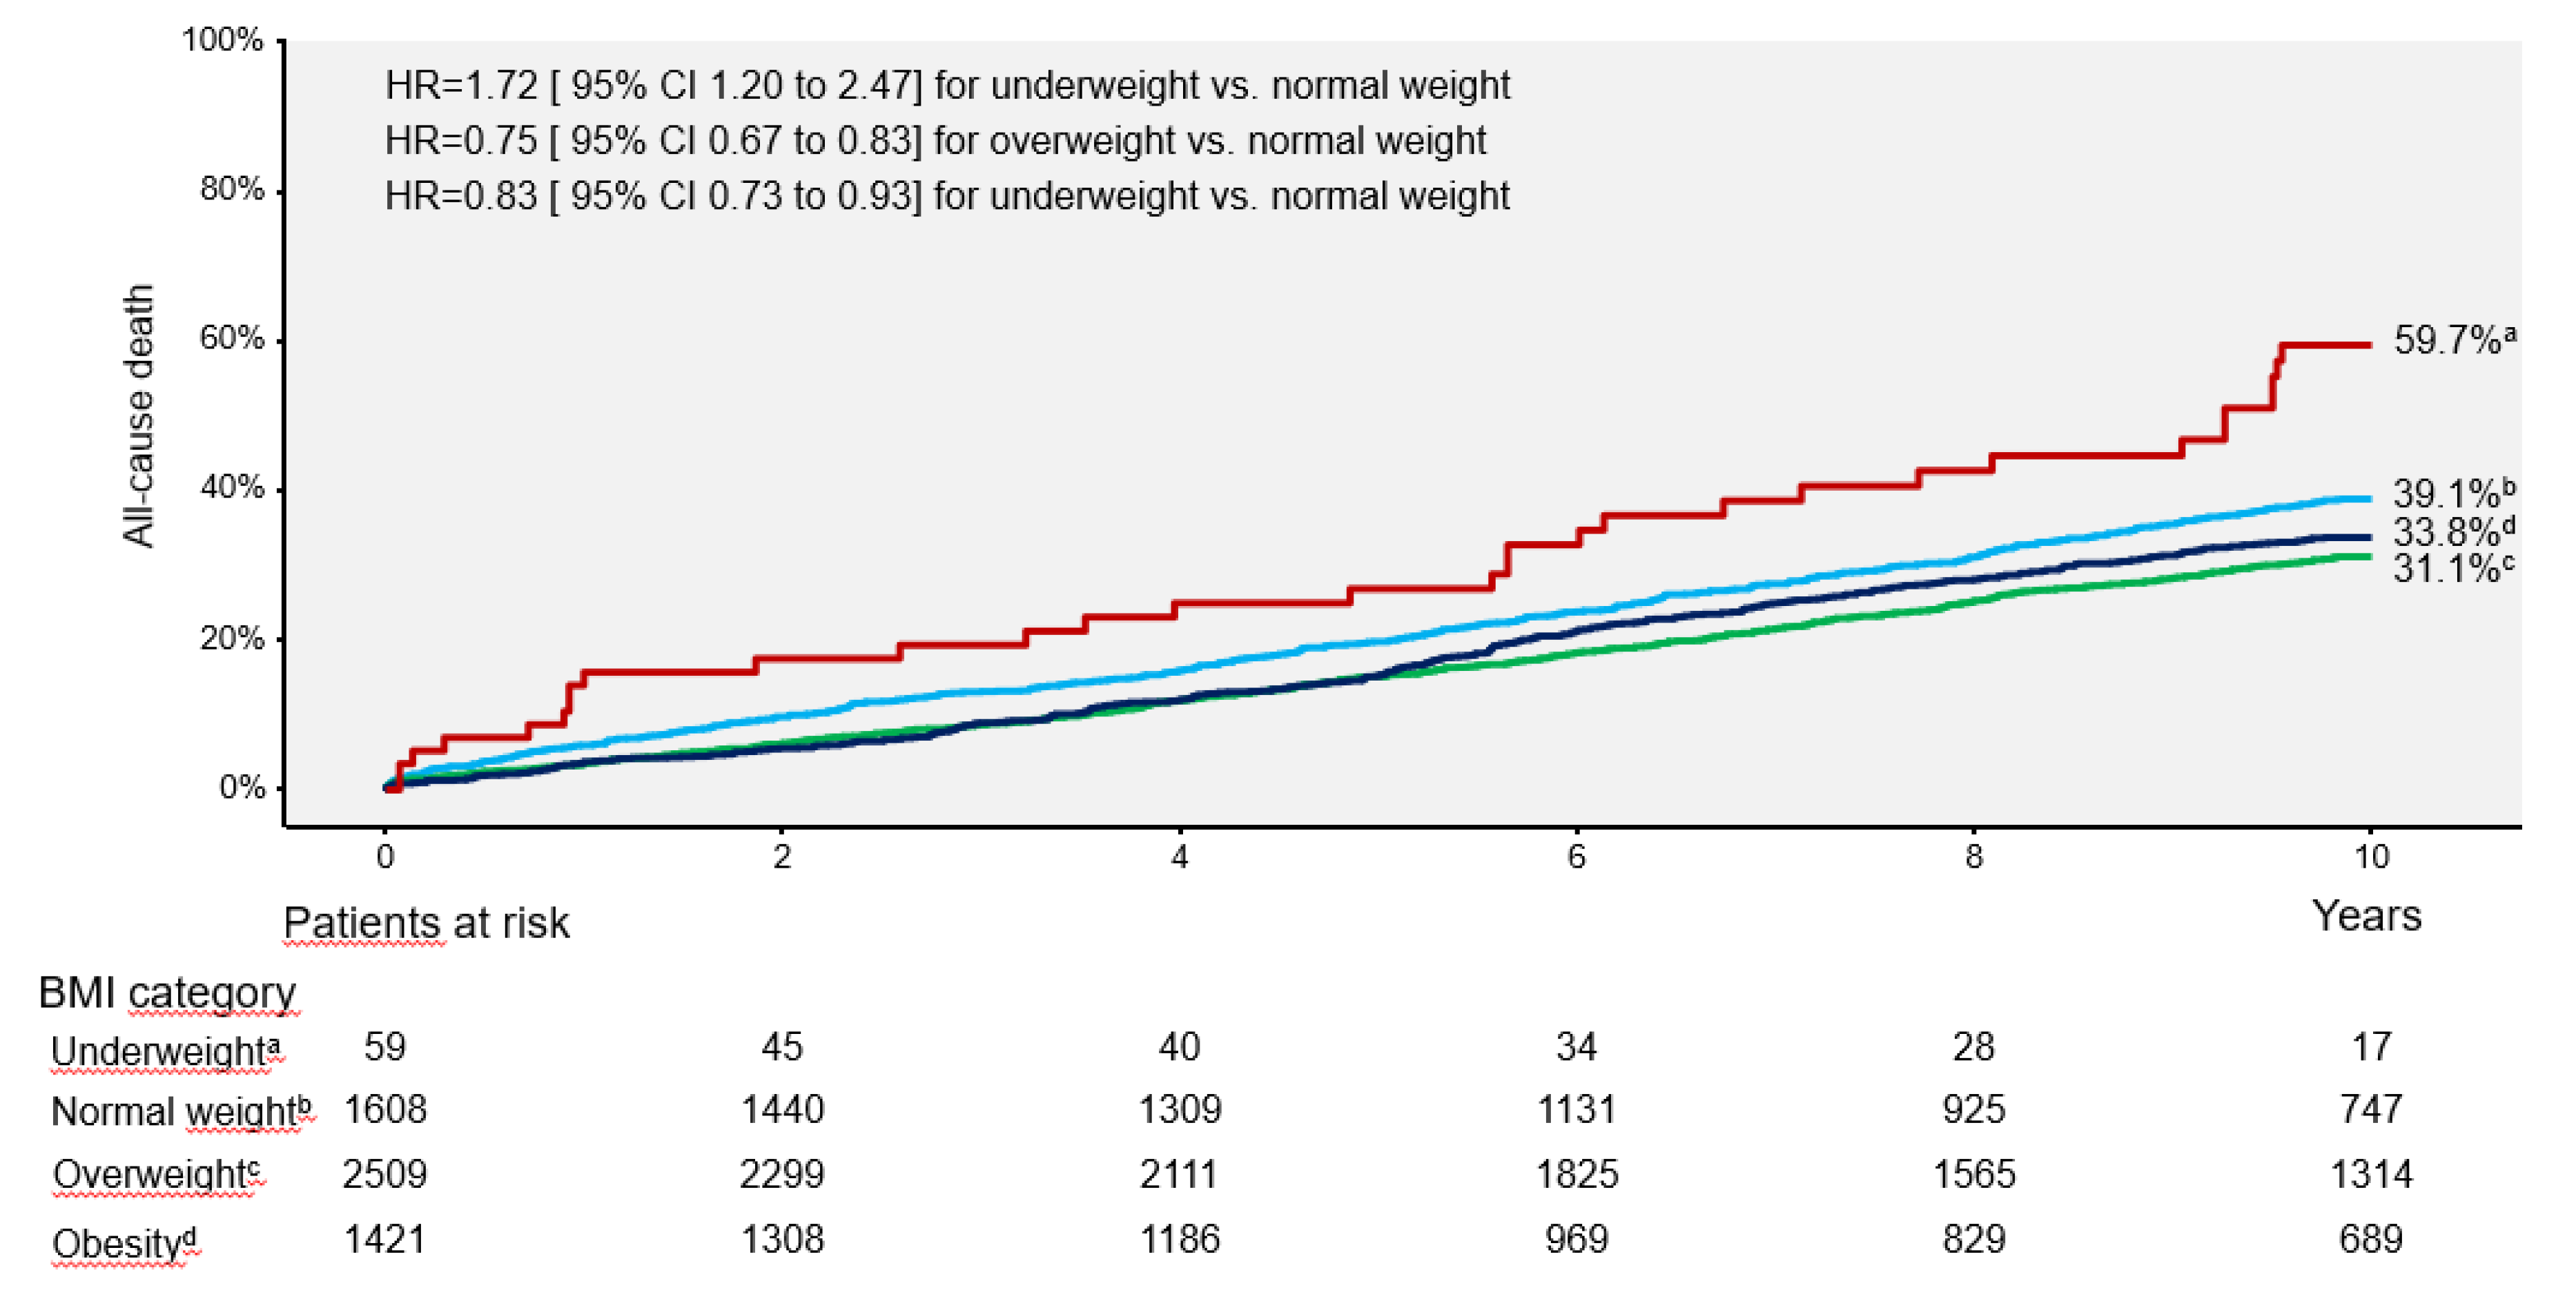
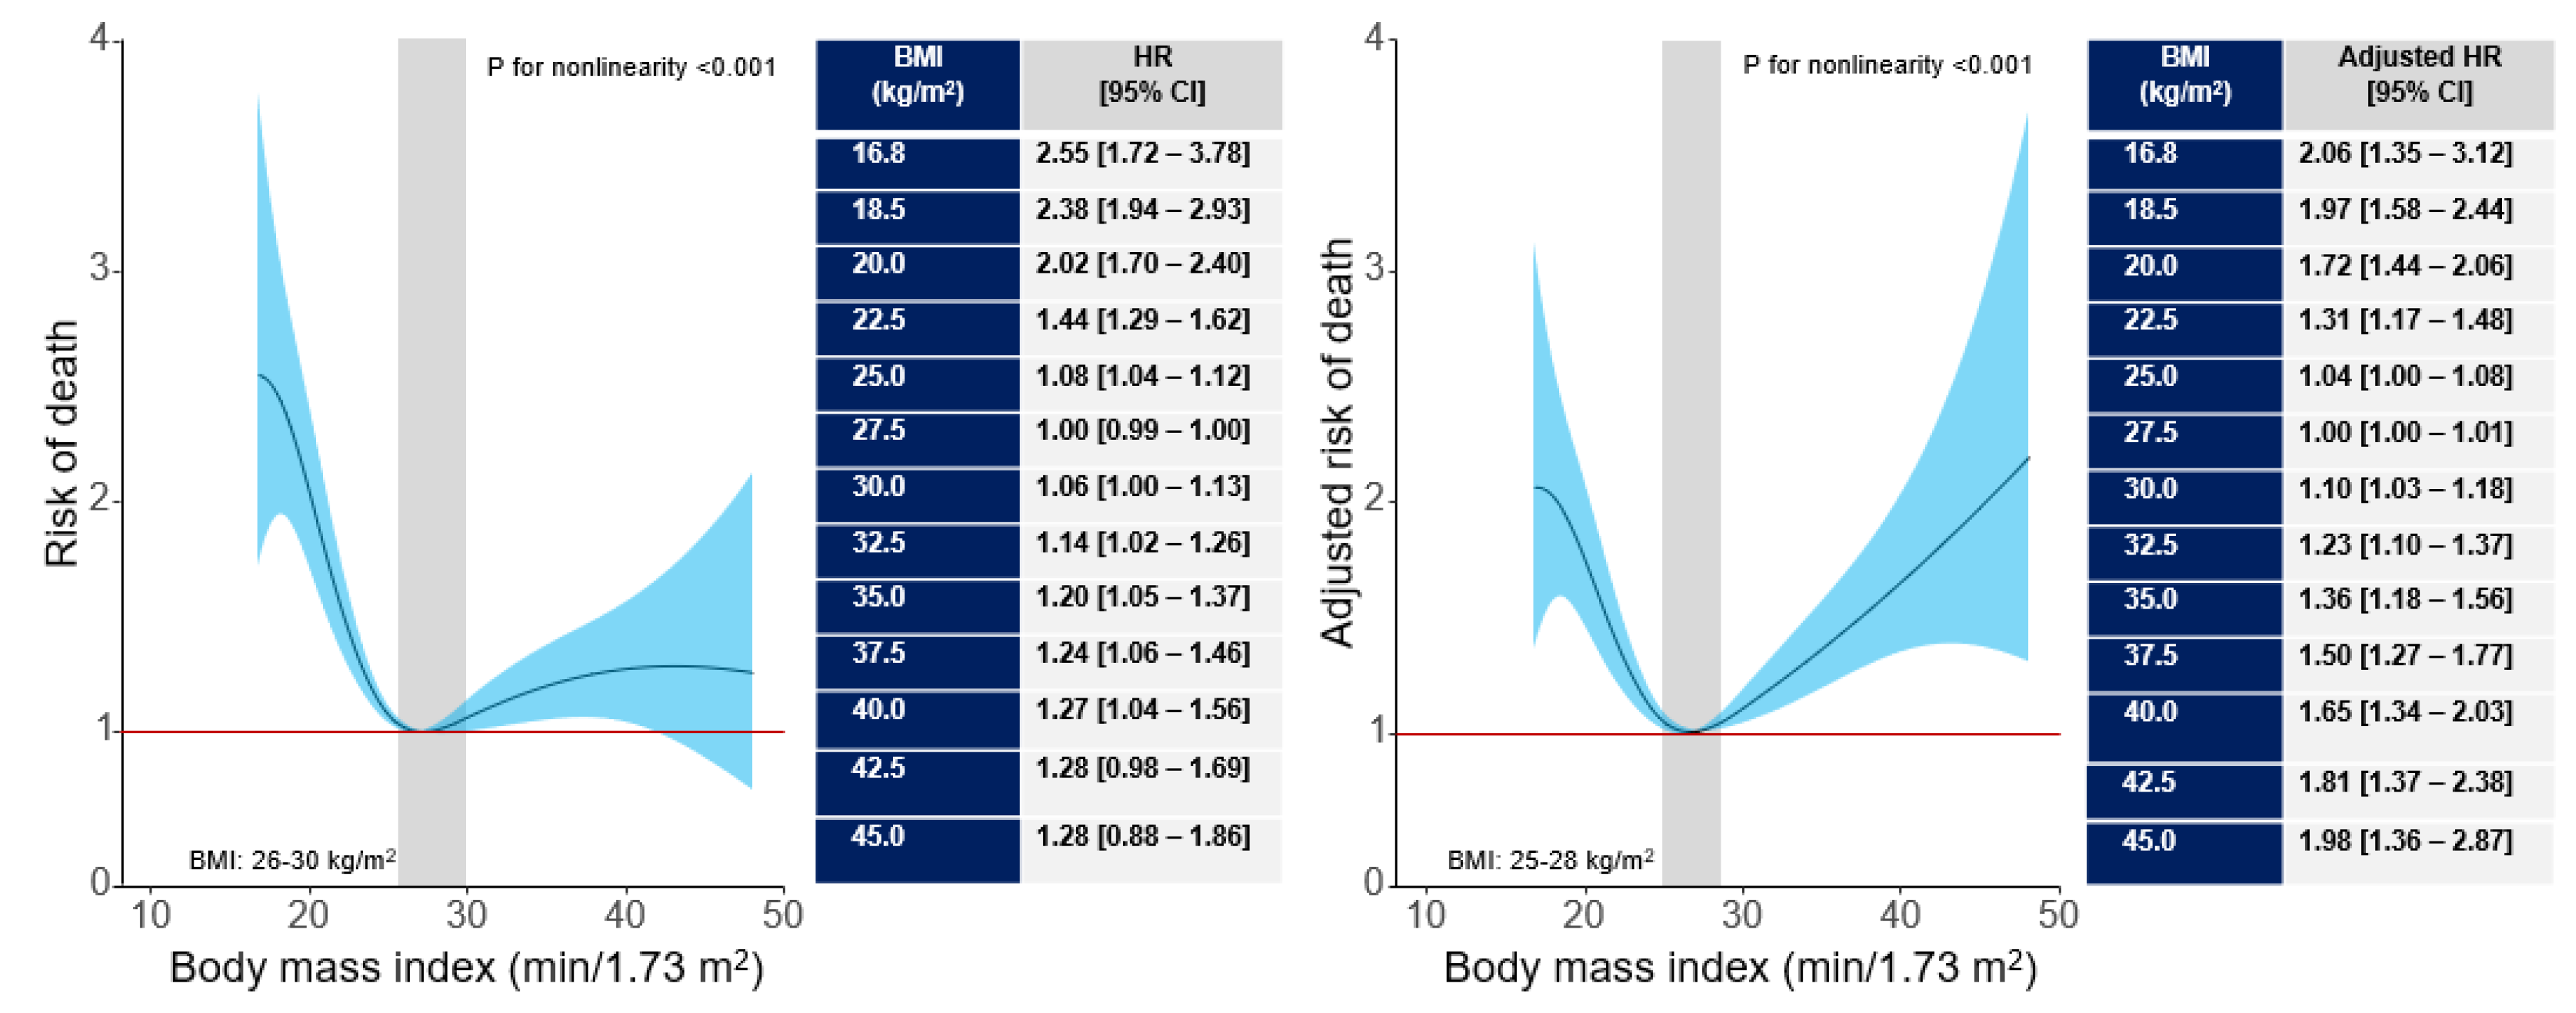
Background and Aims: The association between body mass index (BMI) and long-term outcome after percutaneous coronary intervention (PCI) remains poorly inves-tigated. We undertook this study to assess the association between BMI and 10-year out-come after PCI. Methods and Results: This study included 5597 patients with coronary artery disease undergoing PCI. Patients were categorized according to BMI values: un-derweight group (BMI <18.5 kg/m2), normal weight group (BMI between 18.5 kg/m2 and <25 kg/m2), overweight group (BMI between 25 kg/m2 and <30 kg/m2) and obesity group (BMI ≥30 kg/m2). The primary outcome was 10-year all-cause mortality. At 10 years, deaths of any cause (primary endpoint) occurred in 1754 patients: 31 deaths in the under-weight group (59.7%), 582 deaths (39.1%) in the normal weight group, 710 deaths (31.1%) in the overweight group and 431 deaths (33.8%) in the obesity group (overall P value <0.001; P for nonlinearity <0.001). Nonsurvivors had a significantly lower BMI compared with survivors (26.5 [24.2-29.9] kg/m2 vs. 27.2 [24.8-30.1] kg/m2, P<0.001). Interaction test-ing showed a BMI-by-age interaction demonstrating a stronger association between higher BMI (≥25 kg/m2) and reduced risk of all-cause mortality in patients ≥75 years of age (Pint = 0.009). The association between BMI and all-cause mortality was U-shaped (P for nonlinearity<0.001). C-statistic of the multivariable Cox proportional hazards model for mortality increased from 0.762 [0.751-0.773] with baselines variables only to 0.766 [0.756-0.777], P<0.001) after inclusion of BMI in the model (baseline variables plus BMI). Conclu-sions BMI was associated with 10-year mortality after PCI with a U-shaped relationship.

Keywords: 
;  ;  ;  ;  

1. Introduction

The prevalence of obesity has reached epidemic proportions with approximately 38% of the world population having a body mass index (BMI) of >25 kg/m2 and the projections suggest a further increase in the near future [1]. The Global Burden of Disease (GBD) 2015 Obesity Collaborators estimated that a high BMI accounted for 4 million deaths in 2015 with nearly 70% of them being related to cardiovascular disease [2]. Patients with obesity develop coronary artery disease (CAD) at a younger age [3] and have a shorter life span compared with subjects with a normal weight [4]. A meta-analysis of >300 000 patients and 18 000 registered acute coronary events showed that BMI in the overweight and obesity categories was associated with an increased risk for coronary events [5]. Obesity promotes CAD via a number of mechanisms including insulin resistance, endothelial dysfunction, sympathetic nervous system activation, atherogenic profile of plasma lipids, increased vascular resistance, increased inflammatory burden and prothrombotic state [6,7,8]. Despite this evidence, obesity has not been consistently reported as a risk factor for cardiovascular disease outcomes. In particular, an increased risk of in-hospital complications and one-year mortality after percutaneous coronary intervention (PCI) in patients with a BMI <18.5 kg/m2 has been reported and the term “obesity paradox” has been coined by Gruberg et al. [9] to describe an inverse relationship between BMI and mortality after PCI. In the past, the association between BMI and outcome after PCI has been extensively investigated, yet a number of issues need further clarification. First, the association between BMI and mortality after PCI was mostly investigated in short-term studies [7] and the inverse relationship between BMI and mortality after coronary revascularization appears to wane at long-term follow-up particularly when severe obesity is considered [10,11]. Second, the BMI-mortality association has been most commonly studied and the association of BMI with other outcomes after PCI remains poorly investigated. Third, the BMI-mortality relationship has been investigated in BMI categories defined according to the World Health Organization (WHO) recommended cut-offs. However, the cut-offs that define BMI categories associated with lower or higher mortality are unknown. Fourth, although each BMI category may have a distinct pattern of association with mortality in terms of magnitude and direction, not rarely, the BMI-mortality relationship was investigated in combined BMI categories (i.e., underweight/normal weight or overweight/obesity categories grouped together). Fifth, it is unknown whether there are differences in the association between BMI and mortality due to cardiac or noncardiac causes. We undertook this study with the following aims: first to assess the association between BMI and outcomes after PCI over a 10-year follow-up; second to assess the association between BMI and mortality after PCI across the entire spectrum of BMI and define the BMI cut-offs (and segments) associated with the lowest or highest risk of mortality; third, to investigate whether there are differences in the association between BMI and cardiac or noncardiac mortality and whether the association between BMI and mortality differs according to age, sex, diabetic status and clinical presentation.

2. Methods

2.1. Patients

This study included 5597 patients who underwent coronary stent implantation from September 2007 until August 2009 in two university hospitals in Munich Germany in the setting the Intracoronary Stenting and Angiographic Results: Test Efficacy of 3 Limus-Eluting Stents (ISAR-TEST) 4 randomized trial (NCT00598676; n=2603 patients) [12] and the Intracoronary Stenting and Angiographic Results: Test Efficacy of Sirolimus- and Probucol- and Zotarolimus-Eluting Stents (ISAR-TEST) 5 randomized trial (NCT00598533; n=3002 patients) [13]. Patients included in these trials were ≥18 years of age and presented with ischemic symptoms or evidence of myocardial ischemia (spontaneous or inducible) with angiographic documentation of coronary artery stenoses with ≥50% lumen obstruction. Patients who had a target lesion located in the left main coronary artery, cardiogenic shock, cancer (or other comorbid conditions) with a life expectancy of <12 months, known allergy to the study drugs or pregnancy (present, suspected or planned) were excluded from the study. Of the 5605 patients recruited in the source trials, 5597 patients had BMI data available and these patients were included in the current study. Written informed consent and institutional ethics committee approval were obtained in the setting of the source studies [12,13]. The study conforms to the Declaration of Helsinki.

2.2. Study Definitions and Measurements

BMI was calculated using the patient’s height and weight measured during the hospital course. CAD was diagnosed by documentation of coronary artery stenoses with ≥50% lumen obstruction in the native coronary arteries by coronary angiography in a patient with ischemic symptoms or documented spontaneous or inducible myocardial ischemia. Cardiovascular risk factors—arterial hypertension, hyperlipidemia, diabetes mellitus, and smoking—were defined as per guideline-recommended criteria at the time of patient’s inclusion in the source studies. The global left ventricular ejection fraction was measured by left ventricular angiography using the area-length method. Estimated glomerular filtration rate (GFR) was calculated using creatinine-based Chronic Kidney Disease Epidemiology Collaboration (CKD-EPI) equation [14]. Serum creatinine was measured using a kinetic colorimetric assay based on the compensated Jaffe method. Patients were categorized in groups according to the BMI values: underweight group (BMI <18.5 kg/m2), normal weight group (BMI between 18.5 kg/m2 and <25 kg/m2), overweight group (BMI between 25 kg/m2 and <30 kg/m2) and obesity group (BMI ≥30 kg/m2).

2.3. Outcomes and Follow-Up

The primary endpoint was all-cause mortality at 10 years. Other endpoints analyzed were: cardiac mortality, noncardiac mortality, myocardial infarction, definite stent thrombosis, target lesion revascularization (TLR), target vessel revascularization (TVR), and nontarget vessel revascularization (NonTVR) at 10 years. Cardiac death was defined according to the Academic Research Consortium (ARC) criteria and included any death due to proximate cardiac cause (e.g., myocardial infarction, low-output failure and fatal arrhythmia), unwitnessed death and death of unknown cause, and all procedure-related deaths, including those related to concomitant treatment [15]. All other deaths were classified as noncardiac deaths. Myocardial infarction was defined according to the 2007 Universal Definition of Myocardial Infarction criteria [16]. Definite stent thrombosis was defined according to the ARC criteria [15]. TLR was defined as a repeat stenting or balloon angioplasty of the stented lesion, including 5-mm borders adjacent to the stent. TVR was defined as a repeat coronary intervention (PCI or coronary artery bypass surgery) in any segment of the target vessel, including the target lesion. NonTVR was defined as a repeat revascularization of a coronary vessel other than the vessel that underwent index PCI.
The follow-up was performed by telephone calls or office visits at 1 and 12 months and annually up to 10 years. All events were adjudicated by an event adjudication committee blinded to clinical and laboratory data, in the setting of primary trials.

2.4. Statistical Analysis

Continuous data are shown as median with 25th-75th percentiles. The normality of distribution of continuous data was tested using the Kolmogorov-Smirnov test. Comparison of continuous data was performed using the Kruskal-Wallis rank sum test. Categorical data are shown as counts and proportions (%) and compared using the chi-squared test. The primary endpoint (10-year all-cause mortality) was shown as cumulative incidence calculated with the Kaplan-Meier method. All other outcomes are shown as cumulative incidences after accounting for competing risk of death. Comparisons between the groups according to BMI were done using the univariable Cox proportional hazards model. The association between BMI and 10-year outcomes was adjusted using the multivariable Cox proportional hazards model that included the following variables: BMI (as continuous or category variable), age, sex, diabetes mellitus, current smoking, arterial hypertension, hypercholesterolemia, previous myocardial infarction, previous coronary artery bypass surgery, presentation with acute coronary syndrome, multivessel disease, estimated glomerular filtration rate, type of coronary vessel, complexity of lesions and left ventricular ejection fraction. BMI was entered into the multivariable Cox proportional hazards model as a continuous or category variable (in different models). Missing values of baseline data were imputed by predictive mean matching. Differences in the association between BMI (dichotomized at 25 kg/m2) and outcomes in subgroups of patients according to age (<75 years vs. ≥75 years), sex (women vs. men), diabetes mellitus (with vs. without diabetes) and clinical presentation (ACS vs. no ACS) were investigated by performing the interaction testing. The unadjusted and adjusted restricted cubic spine regression analysis (with BMI knots: 18.5, 25 and 30 kg/m2) was used to assess a potentially non-linear association between BMI and 10-year mortality. The discrimination of the multivariable Cox proportional hazards model with respect to 10-year mortality was assessed by calculating the C-statistic of the model with baseline variables only and the model with baseline variables plus BMI. The C-statistics of the models with and without eGFR were compared using the CompareC package. The statistical analysis was performed using the R 4.1.0 Statistical Software (The R Foundation for Statistical Computing, Vienna, Austria). A two-sided P<0.05 was considered to indicate statistical significance.

3. Results

3.1. Baseline Data

This study included 5597 patients: 59 patients (1.1%) in the underweight group, 1608 patients (28.7%) in the normal weight group, 2509 patients (44.8%) in the overweight group and 1421 patients (25.4%) in the obesity group. Baseline data are shown in Table 1. History of arterial hypertension, previous myocardial infarction and left ventricular ejection fraction did not differ significantly across the groups. All other variables appear to differ significantly across the groups according to BMI. Procedural characteristics are shown in Table S1. Therapy at hospital discharge is shown in Table S2. There were no significant differences between the groups with respect to prescription of guideline-recommended drugs at discharge (aspirin, thienopyridines, statins, angiotensin-converting enzyme inhibitors and beta blockers).

3.2. Clinical Outcome

Clinical outcome at 10 years is shown in Table 2. Deaths of any cause (primary endpoint) occurred in 1754 patients (31.3%). Nonsurvivors had a significantly lower BMI compared with survivors (26.5 [24.2–29.9] kg/m2 vs. 27.2 [24.8–30.1] kg/m2, P<0.001). Deaths of any cause occurred in 31 patients (Kaplan-Meier estimate, 59.7%) in the underweight group, 582 patients (39.1%) in the normal weight group, 710 patients (31.1%) in the overweight group and 431 patients (33.8%) in the obesity group (overall P value <0.001; Figure 1). Cardiac and noncardiac deaths occurred in 1076 patients (61%) and 678 patients (39%), respectively (Table 2 and Figure S1). The risk of myocardial infarction appears to differ little according to BMI categories. The risk of definite stent thrombosis was higher in patients with overweight and obesity compared with patients with normal weight (reference). The risk of TLR appears not to differ in patients with underweight, overweight or obesity compared with patients with normal weight whereas the risk for TVR and NonTVR appears to be higher in patients with overweight and obesity compared with the reference group (Table 2).
Interaction testing showed a BMI-by-age interaction demonstrating a stronger association between a higher BMI (≥25 kg/m2) and reduced risk of all-cause mortality in patients ≥75 years of age (Pint = 0.009; Figure S2). There were also significant BMI-by-age and BMI-by-sex interactions showing a stronger association between a higher BMI and reduced risk of noncardiac mortality in patients ≥75 years of age (Pint =0.013) and women (Pint =0.043; Figure S3). There were no significant interactions between BMI and age, sex, diabetic status or clinical presentation with respect to the risk for cardiac mortality (Pint ≥0.160 for all comparisons), myocardial infarction (Pint ≥0.192 for all interactions), stent thrombosis (Pint ≥0.668 for all interactions), TLR (Pint ≥0.390 for all interactions), TVR (Pint ≥0.311 for all interactions) and NonTVR (Pint ≥0.268 for all interactions).
The association between BMI and all-cause mortality was adjusted in the Cox proportional hazards model (the variables that were entered into the model are listed in the Methods). When entered into the model as a continuous variable, BMI was not independently associated with the risk of all-cause (adjusted hazard ratio [HR] =1.06, 95% confidence interval [CI] 0.97 to 1.16]), cardiac (adjusted HR=0.99 [0.92–1.07]) or noncardiac (adjusted HR=1.10 [0.94–1.27]) mortality, with all 3 risk estimates calculated for 5 kg/m2 increment in the BMI scale. When BMI was entered into the model as category variable, being underweight was associated with a higher risk of all-cause (adjusted HR=1.52 [1.06–2.20]) and noncardiac (adjusted HR=2.47 [1.50–4.05]) compared with normal weight category, whereas being overweight was associated with a lower risk of all-cause (adjusted HR=0.82 [0.73–0.92]) and noncardiac (adjusted HR=0.82 [0.68–0.99]) compared with normal weight category. Full results of the multivariable Cox proportional hazards model are shown in Table S3. The association of BMI categories with all clinical outcomes (as compared with normal weight category) is shown in Table S4.
The C statistics of the multivariable Cox proportional hazards model with baseline variables only (i.e., without BMI) applied for all-cause, cardiac and noncardiac mortality were 0.762 [0.751–0.773], 0.779 [0.765–0.792] and 0.742 [0.725–0.761], respectively. The inclusion of BMI in the model alongside baseline variables was associated with a significant increase of C statistic for all-cause (0.766 [0.756–0.777], P<0.001), cardiac (0.781 [0.768–0.794], P=0.023) and noncardiac mortality (C statistic: 0.750 [0.732–0.768], P=0.0002).
The unadjusted and adjusted restricted cubic spline regression analysis showed a nonlinear relationship between BMI and all-cause, cardiac and noncardiac mortality (P for nonlinearity <0.001 for all 3 relationships). The association between BMI and all-cause and cardiac mortality was U-shaped. The association between BMI and noncardiac mortality was nonlinear but not U-shaped. BMI values 26 kg/m2 to 30 kg/m2 and 26 kg/m2 to 33 kg/m2, were associated with lowest risk of all-cause and cardiac mortality respectively. For BMI values >25 kg/m2 the association between BMI and noncardiac mortality was not significant. In adjusted analysis, BMI values 25 kg/m2 to 28 kg/m2, 25 kg/m2 to 31 kg/m2 and 24 kg/m2 to 28 kg/m2 were associated with the lowest risk of all-cause, cardiac and noncardiac mortality, respectively (Figure 2, Figures S4 and S5).

4. Discussion

In this study, we assessed the association between BMI and 10-year outcomes after PCI with mortality being the primary endpoint. The principal findings of the study may be summarized as follows: 1) BMI was associated with 10-year mortality with a U-shaped relationship. There was a steep increase in mortality with decreasing BMI values within the normal weight and underweight BMI categories and a gradual (less steep) increase in mortality with increasing BMI values in the overweight and obesity categories of the BMI spectrum. 2) BMI values between 25 kg/m2 and 28 kg/m2 appear to be associated with lowest adjusted 10-year risk of all-cause mortality. For BMI values lower than 25 kg/m2 and higher than 28 kg/m2, the risk for all-cause mortality became significant 3). The patterns of association between BMI and mortality appear to differ with respect to cardiac and noncardiac mortality. The association between BMI and cardiac mortality was U-shaped and vulnerable (was attenuated) to adjustment whereas the association between BMI and noncardiac mortality was L-shaped and resistant to adjustment for potential confounders. Patients in the underweight BMI category had a significantly higher adjusted risk of noncardiac mortality and patients in the overweight category had a significantly lower risk of noncardiac mortality, both compared with normal weight BMI category. 4) BMI in the overweight category was associated with a higher risk of definite stent thrombosis and a higher risk of NonTVR whereas patients in the underweight BMI category had a lower risk of NonTVR, compared with patients in the normal weight BMI category. There appears to be no independent association between BMI and the risk for myocardial infarction, TLR or TVR. 5) There appears to be a BMI-by-age interaction with respect to all-cause and noncardiac mortality suggesting a lower risk of all-cause and noncardiac mortality in patients ≥75 years of age and a BMI >25 kg/m2 and a BMI-by-sex interaction suggesting a lower risk of noncardiac mortality in women with a BMI >25 kg/m2. There were no interactions between BMI and age, sex, diabetes mellitus or clinical presentation with respect to other outcomes analyzed in the current study.
Many studies support the existence of an obesity paradox in the association between BMI and mortality after PCI [17] even in the current practice of coronary interventions [18,19]. Although the term “obesity paradox” is widely used, it cannot be applied to describe the entire association between BMI and the risk of mortality. Many studies have reported a U-shaped or J-shaped relationship between BMI and mortality after PCI with a higher risk of death on the lower and upper parts of BMI scale and a lower risk of death in the middle part of BMI scale corresponding to the overweight BMI category [20]. Other studies did not find a protective effect of obesity in terms of the risk of death after PCI [21,22,23,24]. The association between BMI and mortality after PCI depends on multiple factors including the degree of adjustment in multivariable analyses [25,26,27], age of the patients [28], sex [29] and whether the category of severe obesity [30] was considered.
Our study showed a U-shaped relationship between BMI and 10-year risk of all-cause mortality with the lowest risk of mortality corresponding to BMI values in the overweight category. Several aspects of this finding may need commenting. First, the association between BMI and 10-year mortality remained U-shaped but the statistical significance was attenuated after the adjustment with BMI entered in the risk models as a continuous variable. This sounds reasonable considering that the risk for mortality increased for BMI values lower than 25 kg/m2 and higher than 28 kg/m2. Other studies have also shown a non-linear U-shaped relationship between BMI and mortality with a higher mortality for BMI values lower than 27 kg/m2 and higher than 32 kg/m2 [20] Thus assessing BMI as a continuous variable and calculating the risk for a given unit over the entire BMI scale may be misleading considering that the association with mortality may differ markedly in direction and magnitude in the different parts of BMI scale. The inclusion of BMI in the risk models as a category variable and restricted cubic spline regression managed to delineate a significant association between various categories of BMI scale and the risk of mortality. Second, our study found that the association between BMI and cardiac and noncardiac mortality differs, both in the pattern and the impact of adjustment in the multivariable risk models. The association between BMI and cardiac mortality was U-shaped. The association between BMI and noncardiac mortality was L-shaped with a sharp increase in the risk for noncardiac mortality with decreasing BMI values in the normal weight and underweight categories and a relatively flat relationship between BMI and the risk of noncardiac mortality for values in the overweight and obesity categories of the BMI scale. The association between BMI and cardiac mortality remained U-shaped but was attenuated after adjustment for epidemiological and clinical variables available. Conversely, the association between BMI and noncardiac mortality remained significant after adjustment in the multivariable risk model. This may suggest that important correlates that underlay the risk for noncardiac mortality may remain unaccounted for with the epidemiological and clinical information available in patients undergoing PCI. A previous study suggested that the improved survival after PCI in patients with moderately increased BMI was mostly due to lower noncardiac mortality [31]. Third, the interaction testing showed a BMI-by-age interaction suggesting a higher risk of all-cause and noncardiac mortality in patients >75 years of age and a lower BMI. This finding strongly suggests that being old and underweight signifies an increased risk of long-term mortality (particularly noncardiac mortality) after PCI. A previous study showed that lean patients had the highest short-term and long-term mortality after primary PCI across all age groups whereas increased BMI was associated with higher mortality in patients <75 years [28]. The study suggested that BMI-mortality relationship should be age-contextualized. The interaction testing also suggested a BMI-by-sex interaction showing a stronger association between lower BMI and noncardiac mortality in women compared with men. This may imply that women with a lower BMI may be particularly at a higher risk of long-term noncardiac mortality. Although the sex-related differences in the relationship between BMI and mortality remain poorly investigated some studies have suggested a protective of moderate obesity after coronary intervention in men but not in women [29,32].
Limited and controversial evidence exists with respect to the association between BMI and long-term outcomes other than mortality after PCI [18,33,34,35]. A recent study showed that mortality and TVR were main drivers of increased risk of major adverse cardiac and cerebrovascular events observed in patients with a lower BMI after PCI [18]. Other studies did not find differences according to BMI in the risk for myocardial infarction, TLR or TVR after PCI [33,35]. There are also conflicting results with respect to the association between BMI and the risk for stent thrombosis after PCI [33,34,35,36]. Several studies did not find an increased risk for stent thrombosis according to BMI categories [33,35,36] One study reported an inverse relationship between BMI and the risk for stent thrombosis after PCI [34]. Congruent with prior studies [33,35,36], our study did not find differences in the risk for myocardial infarction, TLR or TVR according to BMI categories up to 10 years of follow-up after PCI. However, we found an increased risk for definite stent thrombosis and NonTVR after PCI in patients with overweight compared with patents in the normal weight category even after adjustment for relevant epidemiological and clinical variables. Although, the increased risk for stent thrombosis associated with higher BMI needs further confirmation, a prothrombotic state promoted by poor response to antiplatelet drugs, aspirin [37] and/or clopidogrel [38] may offer some explanation. On the other hand, higher rates of NonTVR in patients with overweight may reflect progression of atherosclerosis in non-treated coronary arteries, which may by promoted by overweight/obesity.
The study has limitations. First, although patients were obtained from two randomized prospective trials with stringent criteria for follow-up and adjudication of adverse events, the current study has a retrospective design. Second, all outcomes were analyzed based on a single assessment of BMI at the time of PCI. However, a recent study suggested that a single measurement of BMI was sufficient to predict the prognosis of patients after PCI [39]. Third, although BMI is most commonly used to assess obesity, it is considered a surrogate of body fat that is not specific for visceral fat. Some studies have suggested that a combination of BMI with waist circumference offers a better assessment of the long-term risk associated with obesity [40]. Fourth, patients were recruited for the study over a long time interval and they received a somewhat outdated therapy in terms of coronary stents and antithrombotic drugs. Notably, novel drugs used to treat obesity were not available at the time of patients’ recruitment in the study. Fifth, conditional on the inclusion criteria and outcomes of primary studies, outcomes like stroke or bleeding after PCI cannot be assessed in the setting of current study. Finally, although we adjusted for all available baseline epidemiological and clinical data, the impact of residual confounders on the BMI-outcome association cannot be refuted. Although not desirable, we believe that these limitations do not impact on the main findings of the study.
In conclusion, BMI was associated with 10-year mortality after PCI with a U-shaped relationship. The association between BMI and cardiac mortality remained U-shaped but was attenuated after adjustment whereas the association between BMI and noncardiac mortality was L-shaped and remained significant after adjustment for potential confounders. BMI in the overweight category was associated with a higher risk of definite stent thrombosis and a higher risk of NonTVR compared with patients in the normal weight category. There was a BMI-by-age interaction suggesting a lower risk of all-cause and noncardiac mortality in patients >75 years of age and a BMI >25 kg/m2 and a BMI-by-sex interaction suggesting a lower risk of noncardiac mortality in women with a BMI >25 kg/m2.

Supplementary Materials

The following supporting information can be downloaded at the website of this paper posted on Preprints.org. Table S1. Procedural data. Table S2. Drug therapy at hospital discharge. Table S3. Results of multivariable Cox proportional hazards model applied for all-cause, cardiac and noncardiac mortality. Table S4. Association of body mass index categories with clinical outcomes after adjustment in the Cox proportional hazards model. Figure S1. Kaplan-Meier curves of cardiac and noncardiac mortality in patients groups according to categories of body mass index. Figure S2. All-cause mortality in subgroups according to age, sex, diabetes mellitus and clinical presentation. Figure S3. Noncardiac mortality in subgroups according to age, sex, diabetes mellitus and clinical presentation. Figure S4. Association between body mass index (BMI) with 10-year cardiac mortality in unadjusted (left panel) and adjusted (right panel) restricted cubic spline analysis. Figure S5. Association between body mass index (BMI) with 10-year noncardiac mortality in unadjusted (left panel) and adjusted (right panel) restricted cubic spline analysis.

Funding

None.

Conflicts of Interest

None.

References

  1. World Obesity Federation. World Obesity Atlas 2023. https://data.worldobesity.org/publications/?cat=19. Accessed on August 2th, 2024.
  2. Afshin, A.; Reitsma, M.B.; Murray, C.J.L. Health Effects of Overweight and Obesity in 195 Countries. N. Engl. J. Med. 2017, 377, 1496–1497. [Google Scholar] [PubMed]
  3. Formentini, F.S.; Zaina Nagano, F.E.; Lopes Neto, F.D.N.; Adam, E.L.; Fortes, F.S.; Silva, L.F.D. Coronary artery disease and body mass index: What is the relationship? Clin. Nutr. ESPEN 2019, 34, 87–93. [Google Scholar] [CrossRef] [PubMed]
  4. Khan, S.S.; Ning, H.; Wilkins, J.T.; Allen, N.; Carnethon, M.; Berry, J.D.; et al. Association of Body Mass Index With Lifetime Risk of Cardiovascular Disease and Compression of Morbidity. JAMA Cardiol. 2018, 3, 280–287. [Google Scholar] [CrossRef]
  5. Bogers, R.P.; Bemelmans, W.J.; Hoogenveen, R.T.; Boshuizen, H.C.; Woodward, M.; Knekt, P.; et al. Association of overweight with increased risk of coronary heart disease partly independent of blood pressure and cholesterol levels: a meta-analysis of 21 cohort studies including more than 300 000 persons. Arch. Intern. Med. 2007, 167, 1720–1728. [Google Scholar] [CrossRef]
  6. Chait, A.; den Hartigh, L.J. Adipose Tissue Distribution, Inflammation and Its Metabolic Consequences, Including Diabetes and Cardiovascular Disease. Front. Cardiovasc. Med. 2020, 7, 22. [Google Scholar]
  7. Powell-Wiley, T.M.; Poirier, P.; Burke, L.E.; Despres, J.P.; Gordon-Larsen, P.; Lavie, C.J.; et al. Obesity and Cardiovascular Disease: A Scientific Statement From the American Heart Association. Circulation 2021, 143, e984–e1010. [Google Scholar] [CrossRef]
  8. Volpe, M.; Gallo, G. Obesity and cardiovascular disease: An executive document on pathophysiological and clinical links promoted by the Italian Society of Cardiovascular Prevention (SIPREC). Front. Cardiovasc. Med. 2023, 10, 1136340. [Google Scholar] [CrossRef]
  9. Gruberg, L.; Weissman, N.J.; Waksman, R.; Fuchs, S.; Deible, R.; Pinnow, E.E.; et al. The impact of obesity on the short-term and long-term outcomes after percutaneous coronary intervention: the obesity paradox? J. Am. Coll. Cardiol. 2002, 39, 578–584. [Google Scholar] [CrossRef] [PubMed]
  10. Terada, T.; Forhan, M.; Norris, C.M.; Qiu, W.; Padwal, R.; Sharma, A.M.; et al. Differences in Short- and Long-Term Mortality Associated With BMI Following Coronary Revascularization. J. Am. Heart Assoc. 2017, 6. [Google Scholar] [CrossRef]
  11. Ma, W.Q.; Sun, X.J.; Wang, Y.; Han, X.Q.; Zhu, Y.; Liu, N.F. Does body mass index truly affect mortality and cardiovascular outcomes in patients after coronary revascularization with percutaneous coronary intervention or coronary artery bypass graft? A systematic review and network meta-analysis. Obes. Rev. 2018, 19, 1236–1247. [Google Scholar] [CrossRef]
  12. Kufner, S.; Joner, M.; Thannheimer, A.; Hoppmann, P.; Ibrahim, T.; Mayer, K.; et al. Ten-Year Clinical Outcomes From a Trial of Three Limus-Eluting Stents With Different Polymer Coatings in Patients With Coronary Artery Disease. Circulation 2019, 139, 325–333. [Google Scholar] [CrossRef] [PubMed]
  13. Kufner, S.; Ernst, M.; Cassese, S.; Joner, M.; Mayer, K.; Colleran, R.; et al. 10-Year Outcomes From a Randomized Trial of Polymer-Free Versus Durable Polymer Drug-Eluting Coronary Stents. J. Am. Coll. Cardiol. 2020, 76, 146–158. [Google Scholar] [CrossRef] [PubMed]
  14. Levey AS, Stevens LA, Schmid CH, Zhang YL, Castro AF, 3rd, Feldman HI, et al. A new equation to estimate glomerular filtration rate. Ann. Intern. Med. 2009, 150, 604–612. [Google Scholar] [CrossRef]
  15. Cutlip, D.E.; Windecker, S.; Mehran, R.; Boam, A.; Cohen, D.J.; van Es, G.A.; et al. Clinical end points in coronary stent trials: a case for standardized definitions. Circulation 2007, 115, 2344–2351. [Google Scholar] [CrossRef]
  16. Thygesen K, Alpert JS, White HD, Joint ESCAAHAWHFTFftRoMI. Universal definition of myocardial infarction. Eur. Heart J. 2007, 28, 2525–2538. [Google Scholar] [CrossRef]
  17. Sharma, A.; Vallakati, A.; Einstein, A.J.; Lavie, C.J.; Arbab-Zadeh, A.; Lopez-Jimenez, F.; et al. Relationship of body mass index with total mortality, cardiovascular mortality, and myocardial infarction after coronary revascularization: evidence from a meta-analysis. Mayo Clin. Proc. 2014, 89, 1080–1100. [Google Scholar] [CrossRef]
  18. Kim, B.G.; Hong, S.J.; Kim, B.K.; Ahn, C.M.; Shin, D.H.; Kim, J.S.; et al. Association between body mass index and clinical outcomes after new-generation drug-eluting stent implantation: Korean multi-center registry data. Atherosclerosis 2018, 277, 155–162. [Google Scholar] [CrossRef]
  19. Holroyd, E.W.; Sirker, A.; Kwok, C.S.; Kontopantelis, E.; Ludman, P.F.; De Belder, M.A.; et al. The Relationship of Body Mass Index to Percutaneous Coronary Intervention Outcomes: Does the Obesity Paradox Exist in Contemporary Percutaneous Coronary Intervention Cohorts? Insights From the British Cardiovascular Intervention Society Registry. JACC Cardiovasc. Interv. 2017, 10, 1283–1292. [Google Scholar] [CrossRef] [PubMed]
  20. Mei, X.; Hu, S.; Mi, L.; Zhou, Y.; Chen, T. Body mass index and all-cause mortality in patients with percutaneous coronary intervention: A dose-response meta-analysis of obesity paradox. Obes. Rev. 2021, 22, e13107. [Google Scholar] [CrossRef]
  21. Kosuge, M.; Kimura, K.; Kojima, S.; Sakamoto, T.; Ishihara, M.; Asada, Y.; et al. Impact of body mass index on in-hospital outcomes after percutaneous coronary intervention for ST segment elevation acute myocardial infarction. Circ. J. 2008, 72, 521–525. [Google Scholar] [CrossRef]
  22. Endo, H.; Dohi, T.; Shitara, J.; Wada, H.; Doi, S.; Naito, R.; et al. Impact of body mass index on long-term outcomes in Japanese patients following percutaneous coronary intervention: The Juntendo PCI Registry. J. Cardiol. 2018, 72, 208–214. [Google Scholar] [CrossRef] [PubMed]
  23. Shahim, B.; Redfors, B.; Chen, S.; Thiele, H.; Eitel, I.; Gkargkoulas, F.; et al. BMI, Infarct Size, and Clinical Outcomes Following Primary PCI: Patient-Level Analysis From 6 Randomized Trials. JACC Cardiovasc. Interv. 2020, 13, 965–972. [Google Scholar] [CrossRef]
  24. Rao, C.; Zhong, Q.; Wu, R.; Li, Z.; Duan, Y.; Zhou, Y.; et al. Impact of body mass index on long-term outcomes in patients undergoing percutaneous coronary intervention stratified by diabetes mellitus: a retrospective cohort study. BMC Cardiovasc. Disord. 2024, 24, 113. [Google Scholar] [CrossRef] [PubMed]
  25. Ndrepepa, G.; Keta, D.; Byrne, R.A.; Schulz, S.; Mehilli, J.; Seyfarth, M.; et al. Impact of body mass index on clinical outcome in patients with acute coronary syndromes treated with percutaneous coronary intervention. Heart Vessels. 2010, 25, 27–34. [Google Scholar] [CrossRef]
  26. Witassek, F.; Schwenkglenks, M.; Erne, P.; Radovanovic, D. Impact of Body Mass Index on mortality in Swiss hospital patients with ST-elevation myocardial infarction: does an obesity paradox exist? Swiss Med. Wkly. 2014, 144, w13986. [Google Scholar] [CrossRef]
  27. Jamaly, S.; Redfors, B.; Omerovic, E.; Carlsson, L.; Karason, K. Prognostic significance of BMI after PCI treatment in ST-elevation myocardial infarction: a cohort study from the Swedish Coronary Angiography and Angioplasty Registry. Open Heart 2021, 8. [Google Scholar] [CrossRef] [PubMed]
  28. Lazzeri, C.; Valente, S.; Chiostri, M.; Attana, P.; Picariello, C.; Sorini Dini, C.; et al. Impact of age on the prognostic value of body mass index in ST-Elevation myocardial infarction. Nutr. Metab. Cardiovasc. Dis. 2013, 23, 205–211. [Google Scholar] [CrossRef]
  29. Stahli, B.E.; Gebhard, C.; Gick, M.; Herman, C.; Ferenc, M.; Mashayekhi, K.; et al. Impact of body mass index on long-term mortality in women and men undergoing percutaneous coronary intervention for chronic total occlusion. Int. J. Cardiol. 2016, 224, 305–309. [Google Scholar] [CrossRef]
  30. Younge, J.O.; Damen, N.L.; van Domburg, R.T.; Pedersen, S.S. Obesity, health status, and 7-year mortality in percutaneous coronary intervention: in search of an explanation for the obesity paradox. Int. J. Cardiol. 2013, 167, 1154–1158. [Google Scholar] [CrossRef]
  31. Wolny, R.; Maehara, A.; Liu, Y.; Zhang, Z.; Mintz, G.S.; Redfors, B.; et al. The obesity paradox revisited: body mass index and -long-term outcomes after PCI from a large pooled patient-level database. EuroIntervention 2020, 15, 1199–1208. [Google Scholar] [CrossRef]
  32. Kanic, V.; Suran, D. Sex differences in the relationship between body mass index and outcome in myocardial infarction. Am. J. Med. Sci. 2023, 366, 219–226. [Google Scholar] [CrossRef] [PubMed]
  33. Moscarella, E.; Spitaleri, G.; Brugaletta, S.; Senti Farrarons, S.; Pernigotti, A.; Ortega-Paz, L.; et al. Impact of Body Mass Index on 5-Year Clinical Outcomes in Patients With ST-Segment Elevation Myocardial Infarction After Everolimus-Eluting or Bare-Metal Stent Implantation. Am. J. Cardiol. 2017, 120, 1460–1466. [Google Scholar] [CrossRef]
  34. Schmiegelow, M.; Torp-Pedersen, C.; Gislason, G.H.; Andersson, C.; Lyngbaek, S.; Pedersen, S.; et al. Relation of body mass index to risk of stent thrombosis after percutaneous coronary intervention. Am. J. Cardiol. 2012, 110, 1592–1597. [Google Scholar] [CrossRef] [PubMed]
  35. Sarno, G.; Raber, L.; Onuma, Y.; Garg, S.; Brugaletta, S.; van Domburg, R.T.; et al. Impact of body mass index on the five-year outcome of patients having percutaneous coronary interventions with drug-eluting stents. Am. J. Cardiol. 2011, 108, 195–201. [Google Scholar] [CrossRef]
  36. Akin, I.; Tolg, R.; Hochadel, M.; Bergmann, M.W.; Khattab, A.A.; Schneider, S.; et al. No evidence of “obesity paradox” after treatment with drug-eluting stents in a routine clinical practice: results from the prospective multicenter German DES.DE (German Drug-Eluting Stent) Registry. JACC Cardiovasc. Interv. 2012, 5, 162–169. [Google Scholar] [CrossRef] [PubMed]
  37. Tamminen, M.; Lassila, R.; Westerbacka, J.; Vehkavaara, S.; Yki-Jarvinen, H. Obesity is associated with impaired platelet-inhibitory effect of acetylsalicylic acid in nondiabetic subjects. Int. J. Obes. Relat. Metab. Disord. 2003, 27, 907–911. [Google Scholar] [CrossRef]
  38. Feher, G.; Koltai, K.; Alkonyi, B.; Papp, E.; Keszthelyi, Z.; Kesmarky, G.; et al. Clopidogrel resistance: role of body mass and concomitant medications. Int. J. Cardiol. 2007, 120, 188–192. [Google Scholar] [CrossRef]
  39. Shirahama, Y.; Tabata, N.; Sakamoto, K.; Sato, R.; Yamanaga, K.; Fujisue, K.; et al. Validation of the obesity paradox by body mass index and waist circumference in patients undergoing percutaneous coronary intervention. Int. J. Obes. 2022, 46, 1840–1848. [Google Scholar] [CrossRef]
  40. Ono, M.; Kawashima, H.; Hara, H.; O’Leary, N.; Gao, C.; Wang, R.; et al. Impact of Body Composition Indices on Ten-year Mortality After Revascularization of Complex Coronary Artery Disease (From the Syntax Extended Survival Trial). Am. J. Cardiol. 2021, 151, 30–38. [Google Scholar] [CrossRef]
Figure 1. Kaplan-Meier curves of all-cause mortality in patient groups according to categories of body mass index. BMI=body mass index; CI=confidence interval HR=hazard ratio.
Preprints 144947 g001
Figure 2. Non-linear association between body mass index (BMI) with 10-year all-cause mortality in unadjusted (left panel) and adjusted (right panel) analysis. The spline curves show the risk of mortality across the whole spectrum of BMI values. The shaded areas show the BMI values associated with the lowest 10-year mortality. In unadjusted analysis, the BMI values lower than 26 kg/m2 and higher than 30 kg/m2 were associated with increased risk of mortality. In adjusted analysis, the BMI values lower than 25 kg/m2 and higher than 28 kg/m2 were associated with the increased adjusted risk of mortality. The inserted tables on the right side of each graph show hazard ratios (HR) with 95% confidence interval (CI) for all-cause mortality in various BMI values.
Preprints 144947 g002
Table 1. Baseline characteristics.
Characteristic Body mass index (kg/m2) P value
<18.5
(n=59)
18.5 to <25
(n=1608)
25 to <30
(n=2509)
≥30
(n=1421)
Body mass index (kg/m2) 17.7 [17.1–18.2] 23.4 [22.1–24.4] 27.3 [26.1–28.4] 32.2 [31.0–34.6] <0.001
Age (years) 73.4 [62.5–80.1] 70.1 [62.8–78.0] 68.2 [60.8–74.8] 65.6 [57.4–72.7] <0.001
Women 35 (59.3%) 503 (31.3%) 466 (18.6%) 325 (22.9%) <0.001
History of arterial hypertension 40 (67.8%) 1054 (65.5%) 1688 (67.3%) 995 (70.0%) 0.073
History of hypercholesterolemia 32 (54.2%) 952 (59.2%) 1666 (66.4%) 967 (68.1%) <0.001
Diabetes mellitus 9 (15.3%) 345 (21.5%) 687 (27.4%) 581 (40.9%) <0.001
 On insulin therapy 3 (5.08%) 112 (6.97%) 198 (7.89%) 222 (15.6%) <0.001
 On oral antidiabetic drugs 4 (6.78%) 176 (10.9%) 384 (15.3%) 261 (18.4%) <0.001
Serum creatinine (mg/dl) 0.87 [0.78–1.00] 0.90 [0.80–1.10] 0.98 [0.80–1.10] 0.94 [0.80–1.11] <0.001
Estimated GFR (ml/min/1.73 m2) 77.0 [58.3–91.6] 77.5 [59.8–90.1] 78.0 [61.6–91.6] 80.1 [62.1–93.2] 0.006
Current smoker 20 (33.9%) 278 (17.3%) 377 (15.0%) 262 (18.4%) <0.001
Prior myocardial infarction 18 (30.5%) 446 (27.7%) 719 (28.7%) 447 (31.5%) 0.135
Prior coronary artery bypass surgery 4 (6.8%) 124 (7.7%) 267 (10.6%) 147 (10.3%) 0.011
Diagnosis at presentation 0.038
 Chronic coronary disease 36 (61.0%) 903 (56.2%) 1517 (60.5%) 855 (60.2%)
 Acute coronary syndrome 23 (39.0%) 705 (43.8%) 992 (39.5%) 566 (39.8%)
Number of coronary arteries narrowed
1
2
3

11 (18.6%)
21 (35.6%)
27 (45.8%)

263 (16.4%)
443 (27.5%)
902 (56.1%)

358 (14.3%)
684 (27.3%)
1467 (58.5%)

208 (14.6%)
350 (24.6%)
863 (60.7%)
0.049
Left ventricular ejection fraction (%) 54.0 [40.5–60.0] 56.0 [46.0–62.0] 56.0 [48.0–62.0] 56.0 [46.0–61.0] 0.064
Data are median [25th; 75th percentiles] or number of patients (%). GFR=glomerular filtration rate.
Table 2. Ten-year clinical outcome.
Events Body mass index (kg/m2) Hazard ratio [95% confidence interval]
<18.5
(n=59)
18.5 to <25
(n=1608)
25 to <30
(n=2509)
≥30
(n=1421)
<18.5 vs.
18.5 to <25 kg/m2
25 to <30 vs.
18.5 to <25 kg/m2
>30 vs.
18.5 to <25 kg/m2
All-cause death 31 (59.7) 582 (39.1) 710 (31.1) 431 (33.8) 1.72 [1.20–2.47] 0.75 [0.67–0.83] 0.83 [0.73–0.93]
Cardiac death 14 (27.2) 355 (24.3) 441 (19.7) 266 (21.3) 1.15 [0.67–1.96] 0.78 [0.68–0.90] 0.86 [0.73–1.00]
Noncardiac death 17 (32.5) 227 (14.7) 269 (11.4) 165 (12.4) 2.33 [1.44–3.76] 0.75 [0.63–0.89] 0.82 [0.67–1.01]
Myocardial infarction 6 (10.3) 104 (6.7) 152 (6.3) 75 (5.5) 1.64 [0.72–3.73] 0.94 [0.73–1.21] 0.82 [0.61–1.10]
Definite stent thrombosis 0 (0.0) 7 (0.4) 28 (1.2) 18 (1.3) - 2.59 [1.13–5.93] 2.97 [1.24–7.09]
Target lesion revascularization 6 (11.0) 287 (18.6) 449 (18.7) 261 (19.4) 0.56 [0.25–1.26] 1.01 [0.87–1.18] 1.05 [0.89–1.24]
Target vessel revascularization 7 (12.7) 326 (20.8) 591 (24.3) 340 (24.9) 0.58 [0.27–1.22] 1.19 [1.04–1.36] 1.22 [1.05–1.42]
Nontarget vessel revascularization 5 (9.2) 393 (25.2) 739 (30.6) 429 (31.6) 0.33 [0.14–0.80] 1.25 [1.10–1.41] 1.29 [1.12–1.48]
Data are number of events with cumulative incidences calculated by Kaplan-Meier method. For outcomes other than all-cause mortality, cumulative incidences were calculated after accounting for competing risk of death. The normal weight group (BMI: 18.5 to <25 kg/m2) served as a reference.
Disclaimer/Publisher’s Note: The statements, opinions and data contained in all publications are solely those of the individual author(s) and contributor(s) and not of MDPI and/or the editor(s). MDPI and/or the editor(s) disclaim responsibility for any injury to people or property resulting from any ideas, methods, instructions or products referred to in the content.
Copyright: This open access article is published under a Creative Commons CC BY 4.0 license, which permit the free download, distribution, and reuse, provided that the author and preprint are cited in any reuse.
Prerpints.org logo

Preprints.org is a free preprint server supported by MDPI in Basel, Switzerland.

Subscribe

Disclaimer

Terms of Use

Privacy Policy

Privacy Settings

© 2025 MDPI (Basel, Switzerland) unless otherwise stated