

Submitted:
02 January 2025
Posted:
03 January 2025
You are already at the latest version
Abstract
This study evaluates urban resilience to earthquakes in Daegu Metropolitan City, South Korea, by analyzing outdoor evacuation sites through a dual-axis matrix framework to provide feasible solutions for enhancing urban resilience. Evacuation capacity was assessed using resident and de facto population data, while Geographic Information System (GIS) network analysis identified evacuation-feasible and infeasible areas. The matrix categorizes areas along two axes: capacity (X-axis) and evacuation-infeasible areas (Y-axis), facilitating targeted improvement strategies. Findings reveal that only 54 of 139 census blocks possess sufficient capacity and no evacuation-infeasible areas. For areas with adequate capacity but extensive infeasible areas, redistributing evacuation sites is recommended to improve accessibility. Areas with limited capacity but no infeasible areas require additional outdoor evacuation sites to accommodate the population. In regions constrained by both capacity and accessibility, establishing new evacuation sites within infeasible areas is essential. For critically low-capacity areas without infeasible areas, multi-use spaces, such as disaster prevention parks, are desirable to address evacuation needs. Lastly, areas lacking both capacity and accessibility urgently require new evacuation sites concentrated in infeasible areas. By simplifying complex variables into a capacity-accessibility matrix, this study integrates population dynamics, spatial accessibility, and site capacity, offering implementable solutions for earthquake preparedness in densely populated urban settings.
Keywords:
1. Background and Objective
2. Research Methodology
2.1. Study Area
2.2. Research Method
2.3. Capacity Analysis
2.4. Evacuation Feasibility Analysis
2.5. Matrix Analysis
3. Results and Discussion
3.1. Verification of Earthquake Outdoor Evacuation Site Capacity
3.2. Capacity Analysis Based on De Facto Population
3.3. Analysis of Evacuation-Infeasible Areas
3.4. Matrix Analysis
4. Conclusions
Acknowledgements
Conflicts of Interest
References
- Chen, Z., Chen, X., Li, Q. and Chen, J. (2013) The temporal hierarchy of shelters: A hierarchical location model for earthquake-shelters planning. International Journal of Geographical Information Science, Vol. 27, No.8, pp. 1612-1630. [CrossRef]
- Daegu Metropolitan City Service-Population Statistics Analysis Geographic Information System, http://s4u.daegu.go.kr/analysis#/servicePopulation/adong.
- Kaveh A., Javadi, S.M., and Moghanni R.M. (2020). Emergency management systems after disastrous earthquakes using optimization methods: A comprehensive review.
- u, J., and Wen, J. (2016). Multi-criteria satisfaction assessment of the spatial distribution of urban emergency shelters based on high-precision population estimation. International Journal of Disaster Risk Science, Vol. 7, No. 4, pp. 413-429. [CrossRef]
- Kim Sang-Gyoon, Shin Sang-young, Nam Hyeon-Jung (2022). Analyzing Accessibility of Emergency Shelters Based on Service Population: The Case of Outdoor Evacuation Places for Earthquake in Jung-gu, Seoul.
- Lee, S.H., Goo, S.H., Chun, Y.W., Park, Y.J. (2015). The spatial location analysis of disaster evacuation shelter for considering resistance of road slope and difference of walking speed by age-case study of Seoul, Korea. Journal of Korean Society for Geospatial Information System, Vol.23, No.2, pp.69-77.
- Kim, M.K., Kang, S., Kim, S.P., and Sohn, H.G. (2016). A spatial analysis of shelter capacity using floating population. Journal of the Korean Society of Surveying, Geodesy, Photogrammetry and Cartography, Vol.34, No.1, pp1-10.
- Xu, J., Yin, X., Chen, D., An, J., and Nie, G. (2016). Multi-criteria location model of earthquake evacuation shelters to aid in urban planning, International Journal of Disaster Risk Reduction, Vol.20, pp.51-62. [CrossRef]
- Deville, p., Linard, C., Martin, S., Gilbert M., Stevens, F.R., Gaughan, A.E., et al. (2014). Dynamic population mapping using mobile phone data. Proceedings of the national Academy of Sciences, Vo. 111, No. 45, pp.15888-15893. [CrossRef]
- Lee, W.K., Sohn, S.Y., and Heo, J. (2018). Utilizing mobile phone-based floating population data to measure the spatial accessibility to public transit. Applied geography, Vol.92, pp 123-130. [CrossRef]
- Wu, H., Liu, L., Yu, Y., and Peng, Z. (2018). Evaluation and planning of urban green space distribution based on mobile phone data and two-step floating catchment area method. Sustainability, Vol. 10, No. 1, 214. [CrossRef]
- Yun S.B., Kim, S., Hy, S., Noh, H., Kim, C., Wong, M.S., and Heo, J (2020). Analysis of accessibility to emergency rooms by dynamic population from mobile phone data: Geography of Social inequity in South Korea. PLOS ONE, Vol. 15, No. 4, e0231079. [CrossRef]
- Zhao, L., Li, H., Sun, Y., Huang, R., Hu, Q., Wang, J., and Gao, F. (2017). Planning emergency shelters for urban disaster resilience: An integrated location allocation modeling approach. Sustainability, Vol.9, No. 11, 2098. [CrossRef]
- Jun, S.H., Park, S.S., Shin, Y.G., Jang, D.S., Chung, H.S. (2010). Forecasting Vacant Technology of Patent Analysis System using Self Organizing Map and Matrix Analysis, the Journal of the Korea Contents Association Vol. 10., No.2, 462-480.
- Lee, H.J. (2009). A Plan of the analysis of Basic Design with Matrix form. Journal of the Korean Society of Design Culture, Vol.15, No.4, 457-465.
- Cho, H.U., Choi, S.Y. (2019). Risk-Matrix Analysis on Disasters and Accidents to Establish Investment Directions of Budgeting for Disasters and Safety Management. Journal of the Korean Society of Hazard Mitigation. Vol. 19, No37,165-179.

| School Sports Fields |
Parks | Sports Facilities |
Parking Lots | Green | Etc. | Total | |
| Number of Facilities |
357 (50.7%) |
304 (43.2%) |
10 (1.4%) |
25 (3.6%) |
5 (0.7%) |
3 (0.4%) |
704 (100%) |
| Current Capacity (People) |
3,189,504 (38.7%) |
3,895,177 (47.2%) |
668,070 (8.1%) |
69,805 (0.8%) |
244,673 (3.0%) |
183,311 (2.2%) |
8,250,540 (100%) |
| Revised Capacity (People) |
3,189,504 (46.1%) |
2,726,624 (39.4%) |
668,070 (9.7%) |
34,903 (0.5%) |
171,271 (2.5%) |
128,318 (1.9%) |
6,918,689 (100%) |
| Resident Population |
10:00 AM |
2:00 PM |
8:00 PM |
|
| Number of People | 2,346,855 | 2,563,551 | 2,537,529 | 2,648,379 |
| De Facto Population / Resident Population | 1 | 1.09 | 1.08 | 1.13 |
| Number of Census Blocks with Maximum Population |
34 | 22 | 20 | 63 |
| Number of Census Blocks with Capacity Ratio below 1 (Current) |
41 | 43 | 47 | 46 |
| Number of Census Blocks with Capacity Ratio below 1 (Revised) |
44 | 48 | 52 | 50 |
| Sufficient | Insufficient | Insufficient (1 time point) |
Insufficient (2 time points) |
Insufficient (3 time points) |
Insufficient (4 time points) |
Total | |
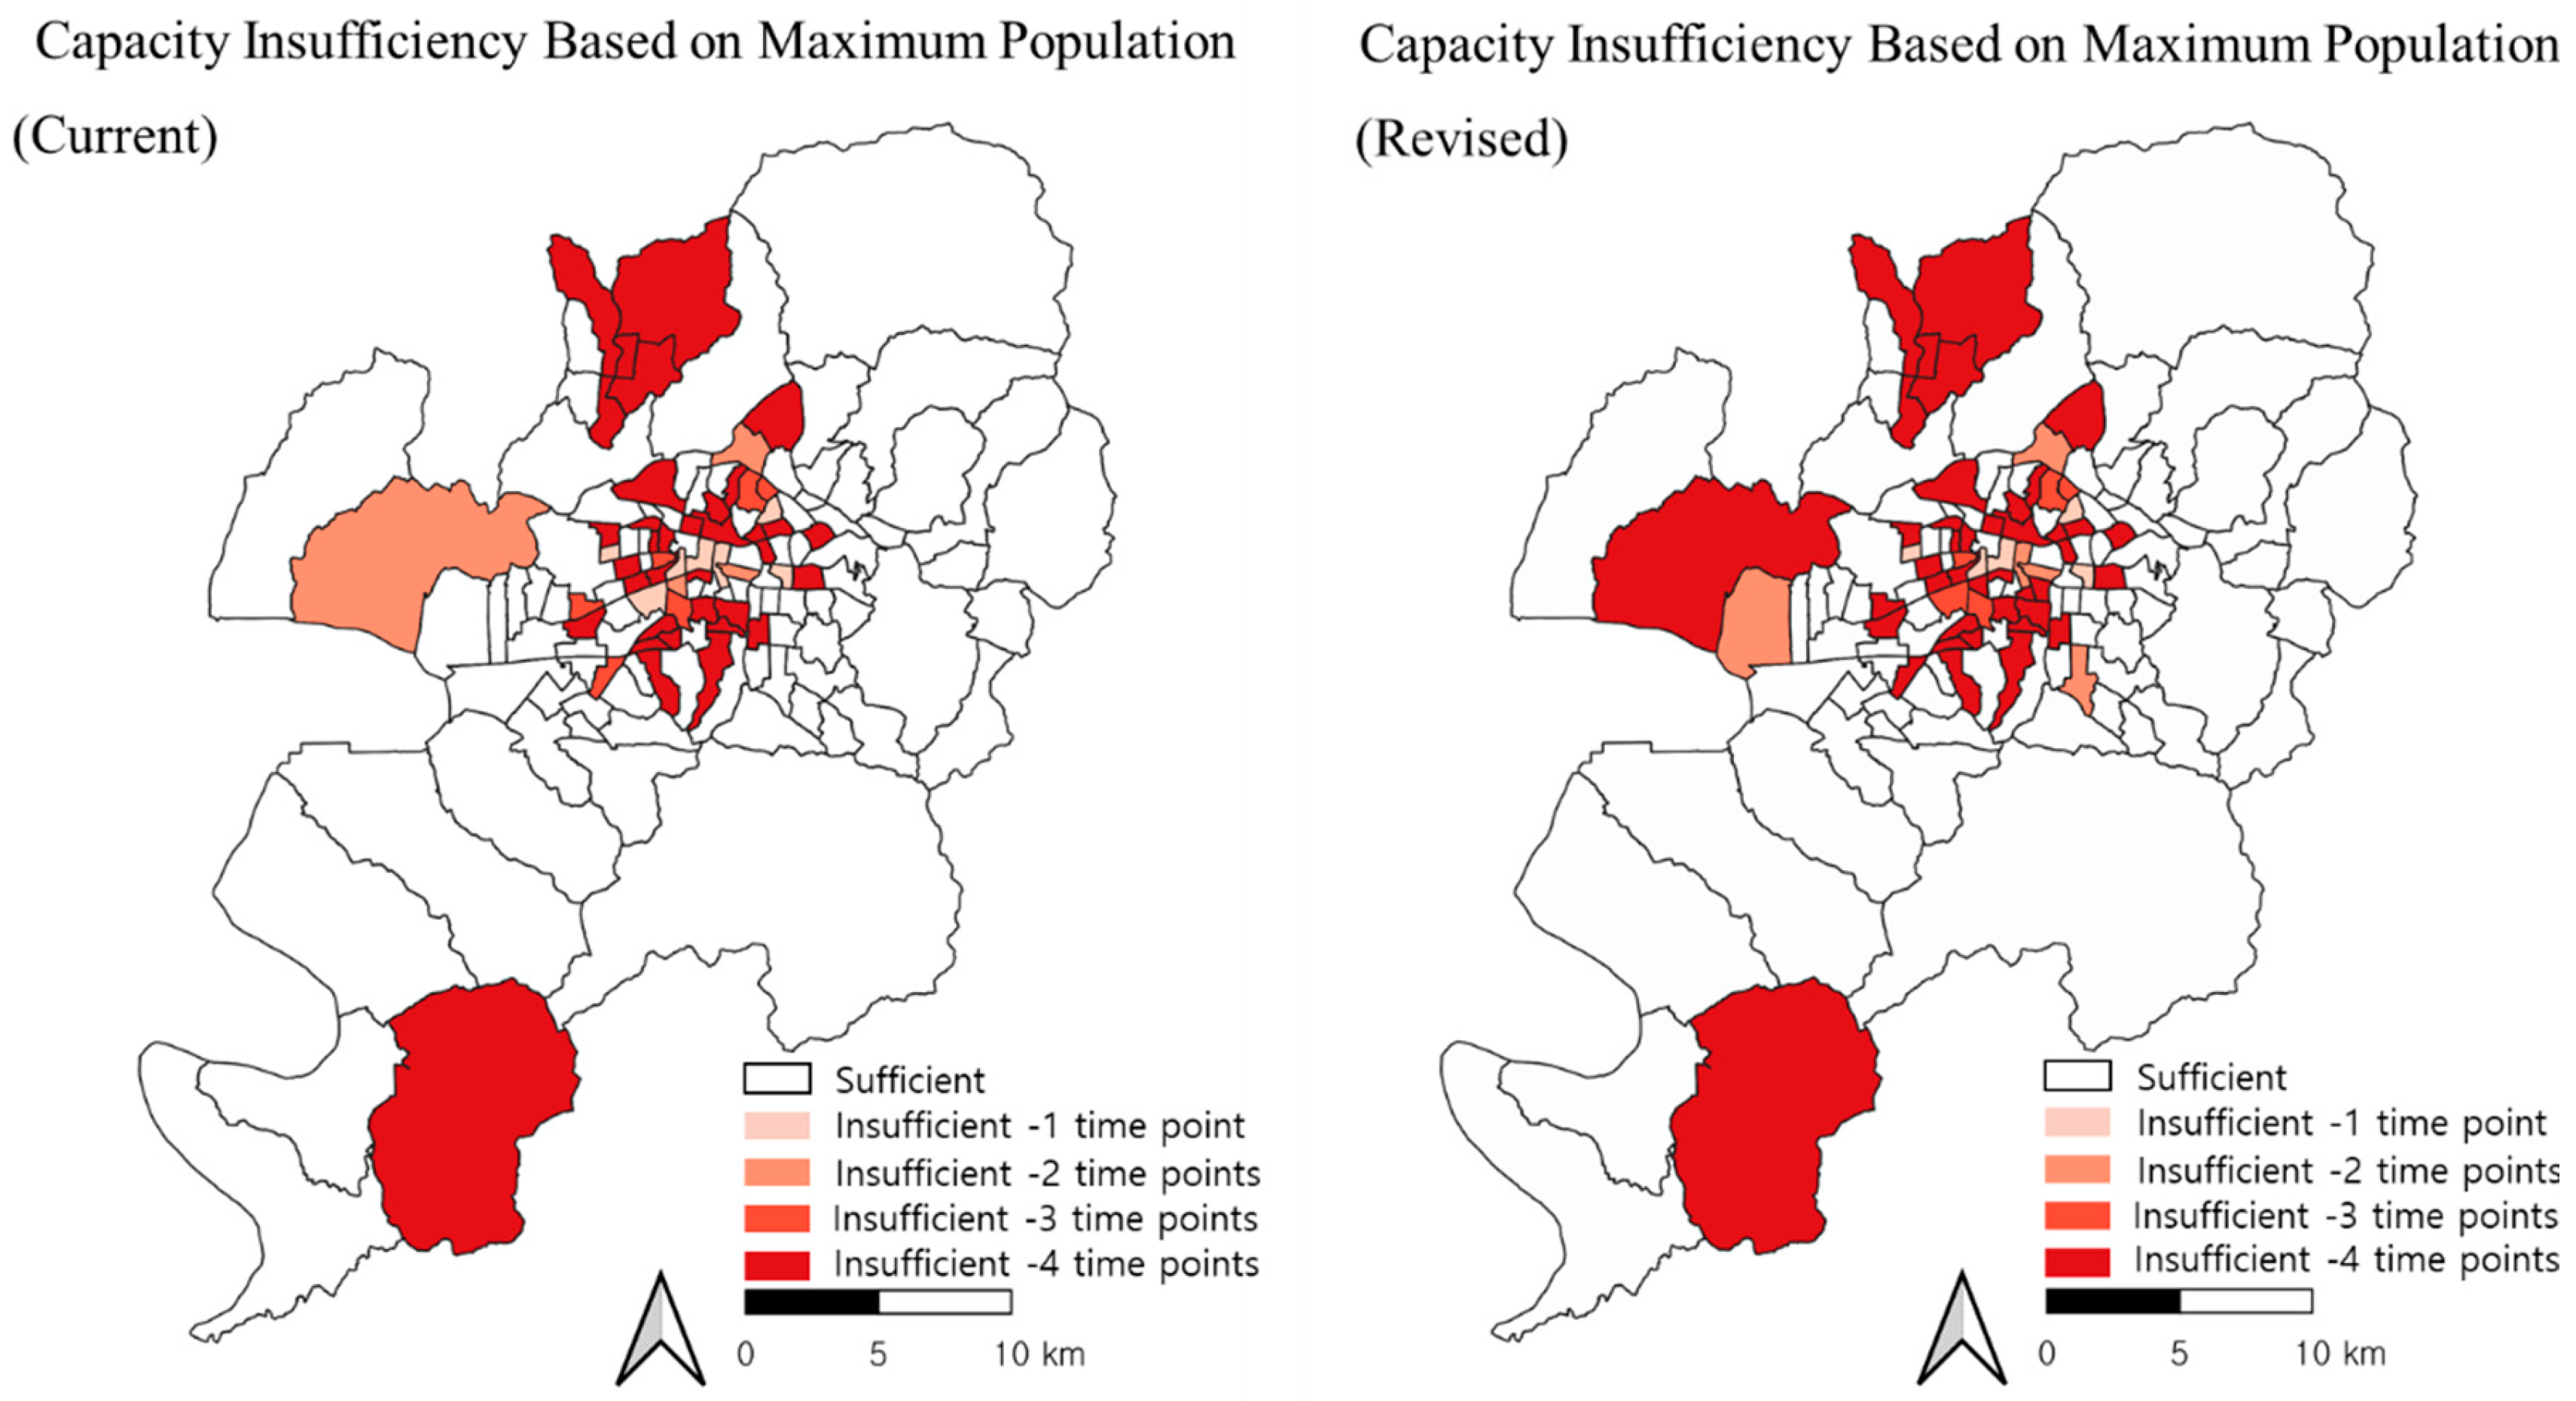
| Capacity Insufficiency Based on Maximum Population (Current) |
86 | 53 | 7 | 4 | 6 | 36 | 139 |
| Capacity Insufficiency Based on Maximum Population (Revised) |
83 | 56 | 5 | 5 | 5 | 41 | 139 |
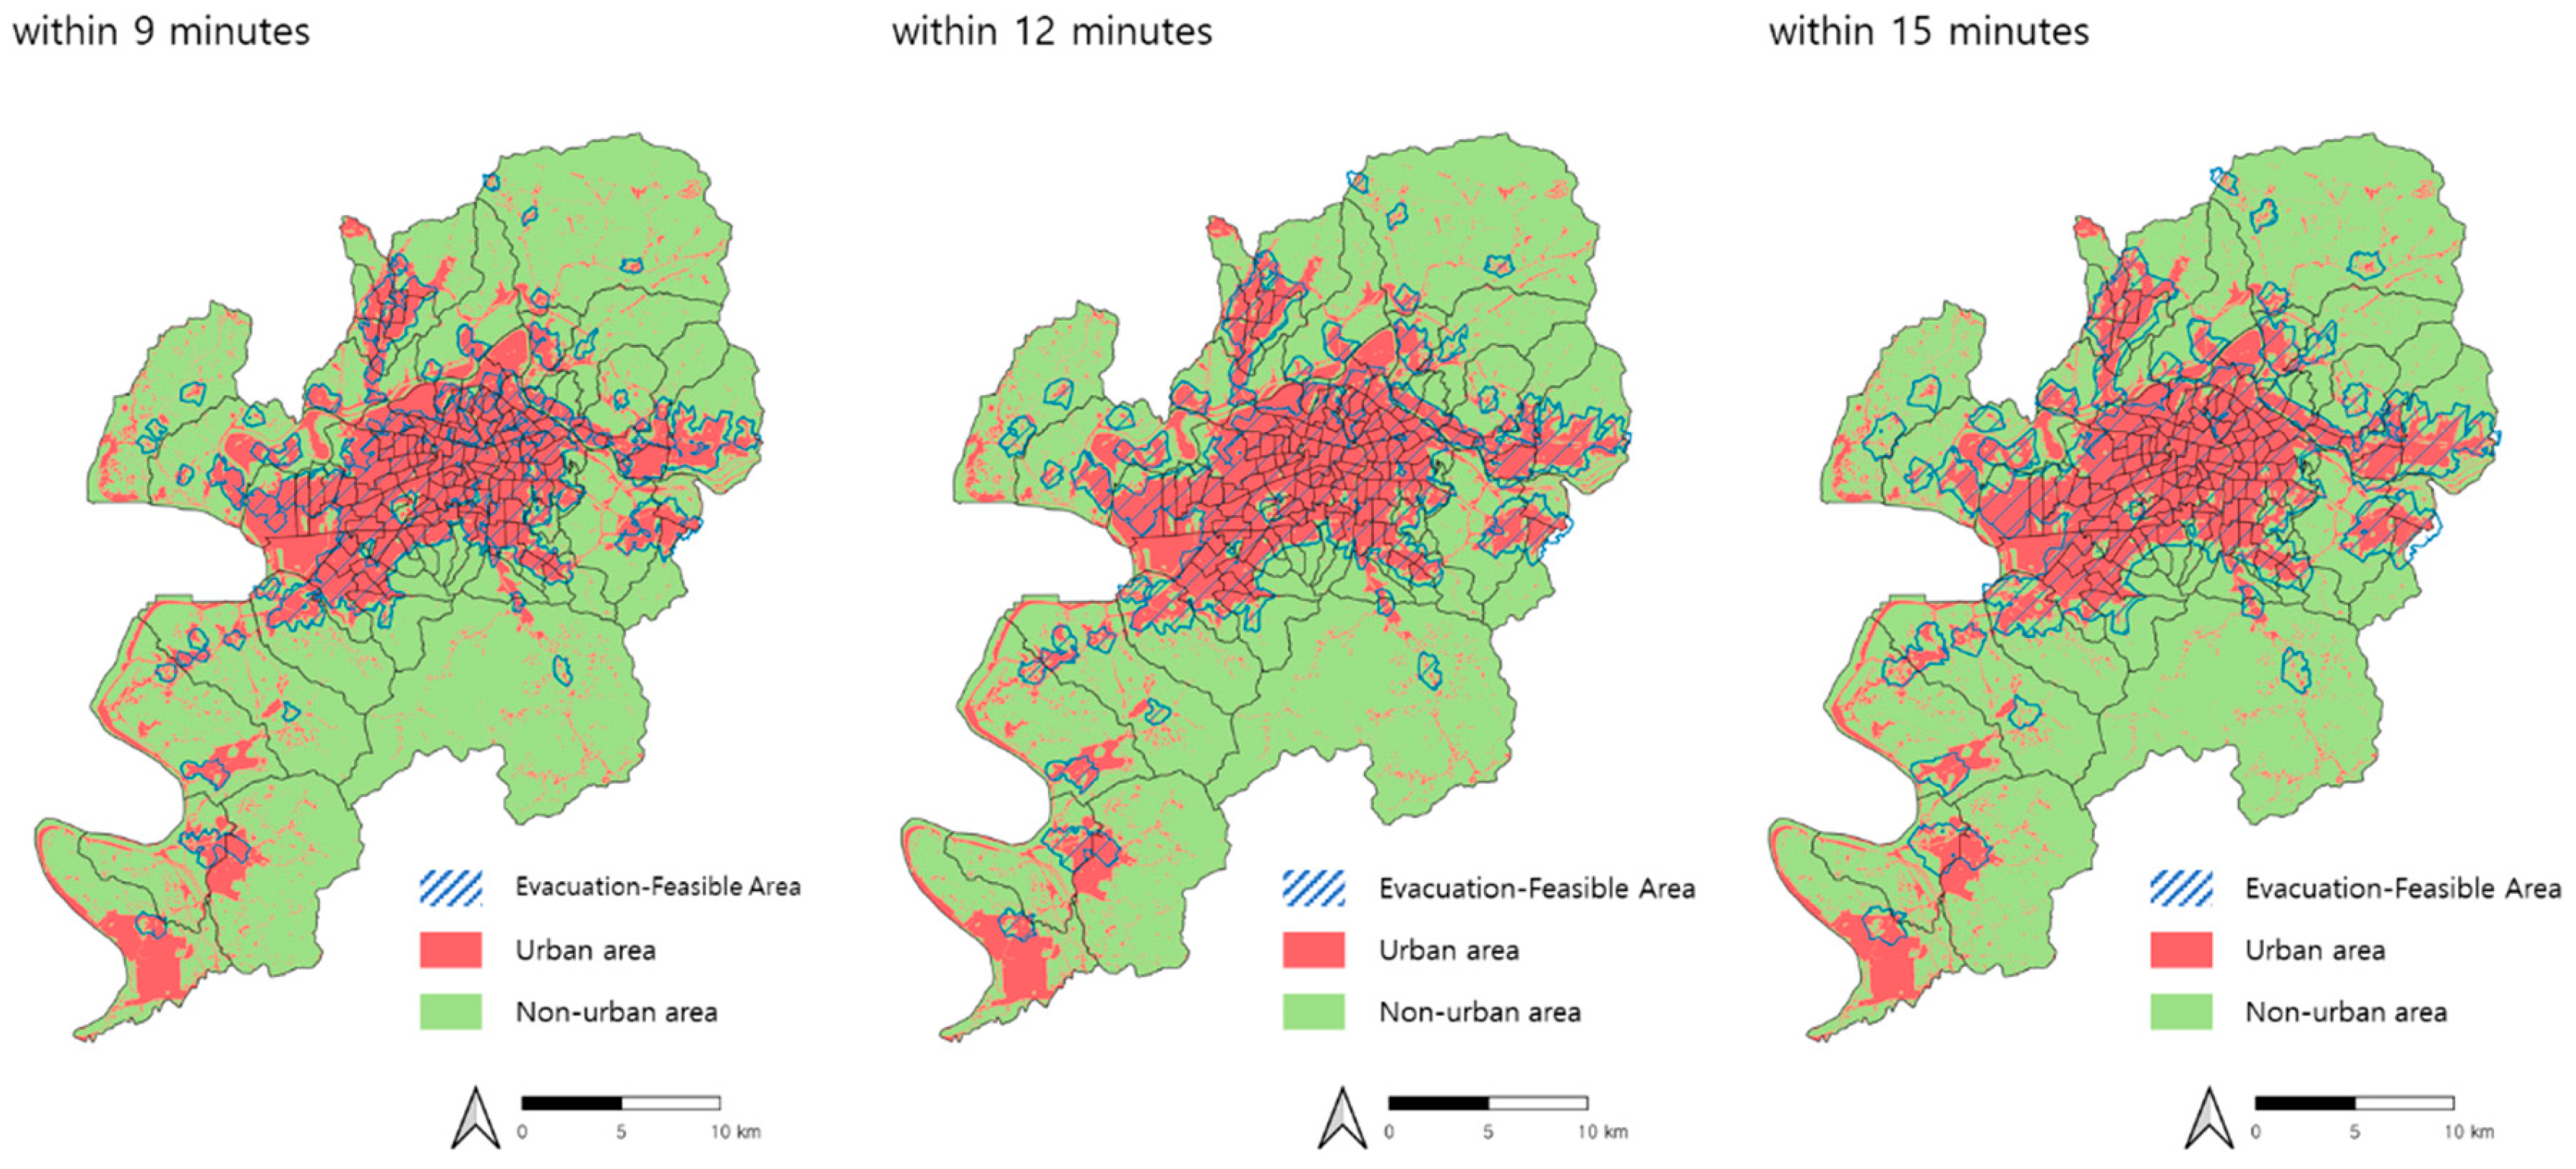
| Urban area | Non-Urban area | Total | ||
| Study area | 254.78㎢ (28.9%) | 625.30㎢ (71.1%) | 880.09㎢ (100%) | |
| Feasible within 9 Minutes | 14.8% (51.0%) | 3.0% | 17.8% | |
| Infeasible within 9 Minutes | 14.2% (49.1%) | 68.0% | 82.2% | |
| Feasible within 12 Minutes | 17.3% (59.8%) | 5.5% | 22.8% | |
| Infeasible within 12 Minutes | 11.7% (40.2%) | 65.5% | 77.2% | |
| Feasible within 15 Minutes | 19.1% (65.9%) | 8.3% | 27.4% | |
| Infeasible within 15 Minutes | 9.9% (34.2%) | 62.7% | 72.6% | |
| (Urbanized Area Ratio) | ||||
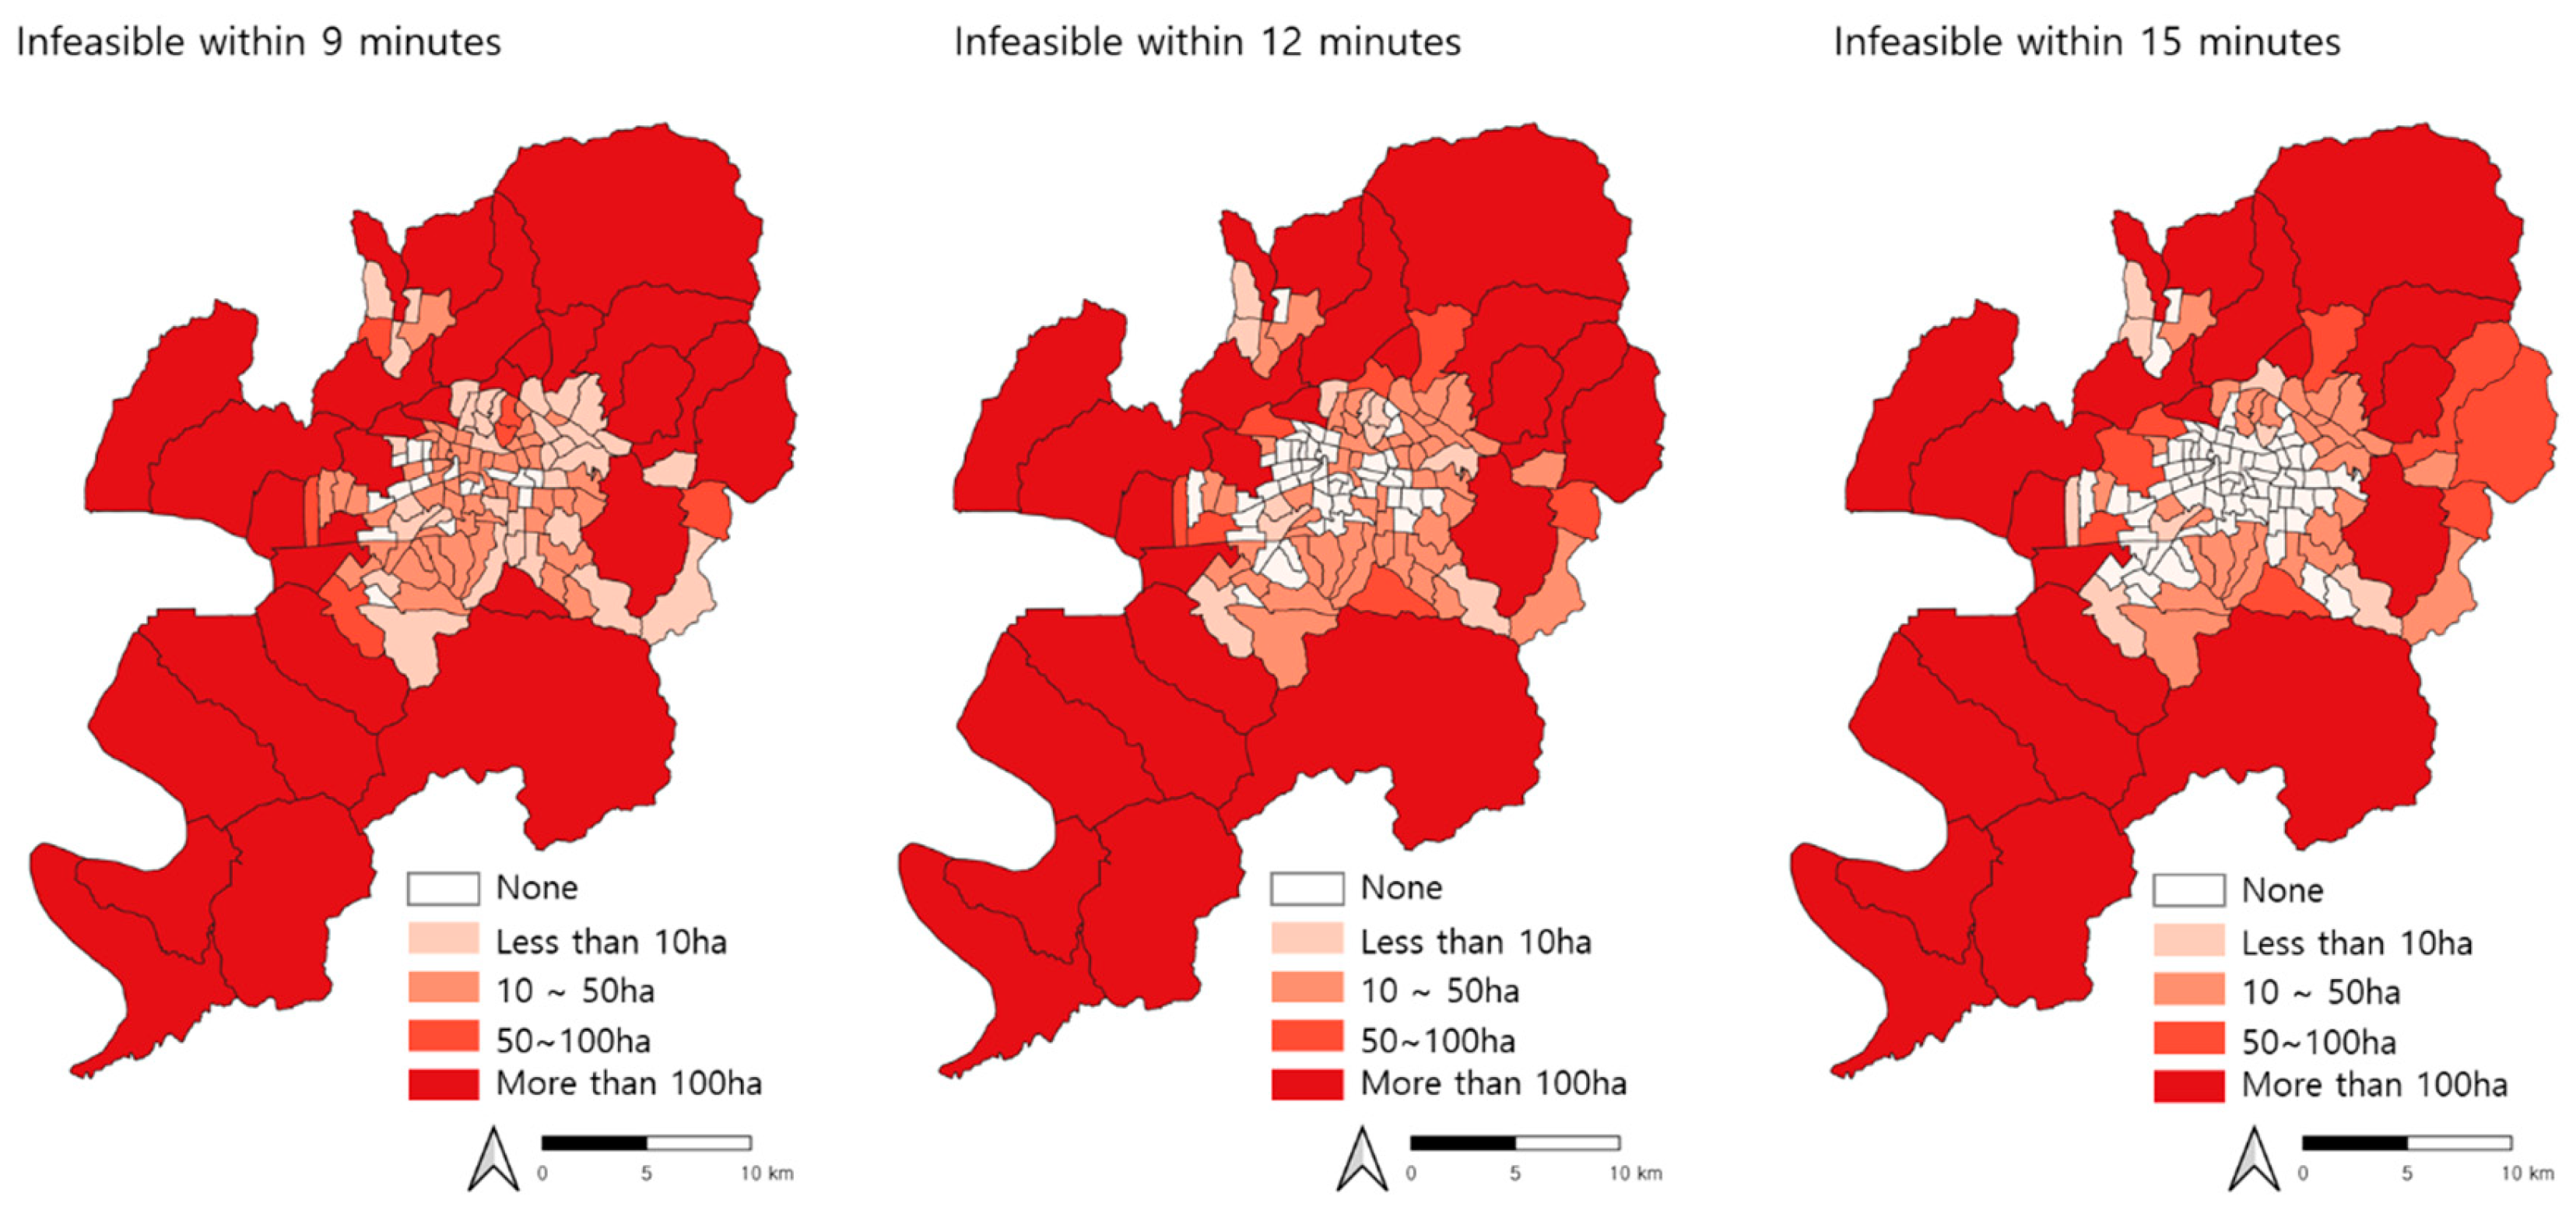
| Infeasible within 9 minutes |
Infeasible within 12 minutes |
Infeasible within 15 minutes |
|
| None | 17 | 48 | 71 |
| Less than 10ha | 53 | 49 | 31 |
| 10~50ha | 34 | 11 | 8 |
| 50~100ha | 6 | 7 | 8 |
| More than 100ha | 29 | 24 | 21 |
| Total | 139 | 139 | 139 |
| 9 minutes | 12 minutes | 15 minutes | |||||||||||||
| 1 | 2 | 3 | 4 | 5 | 1 | 2 | 3 | 4 | 5 | 1 | 2 | 3 | 4 | 5 | |
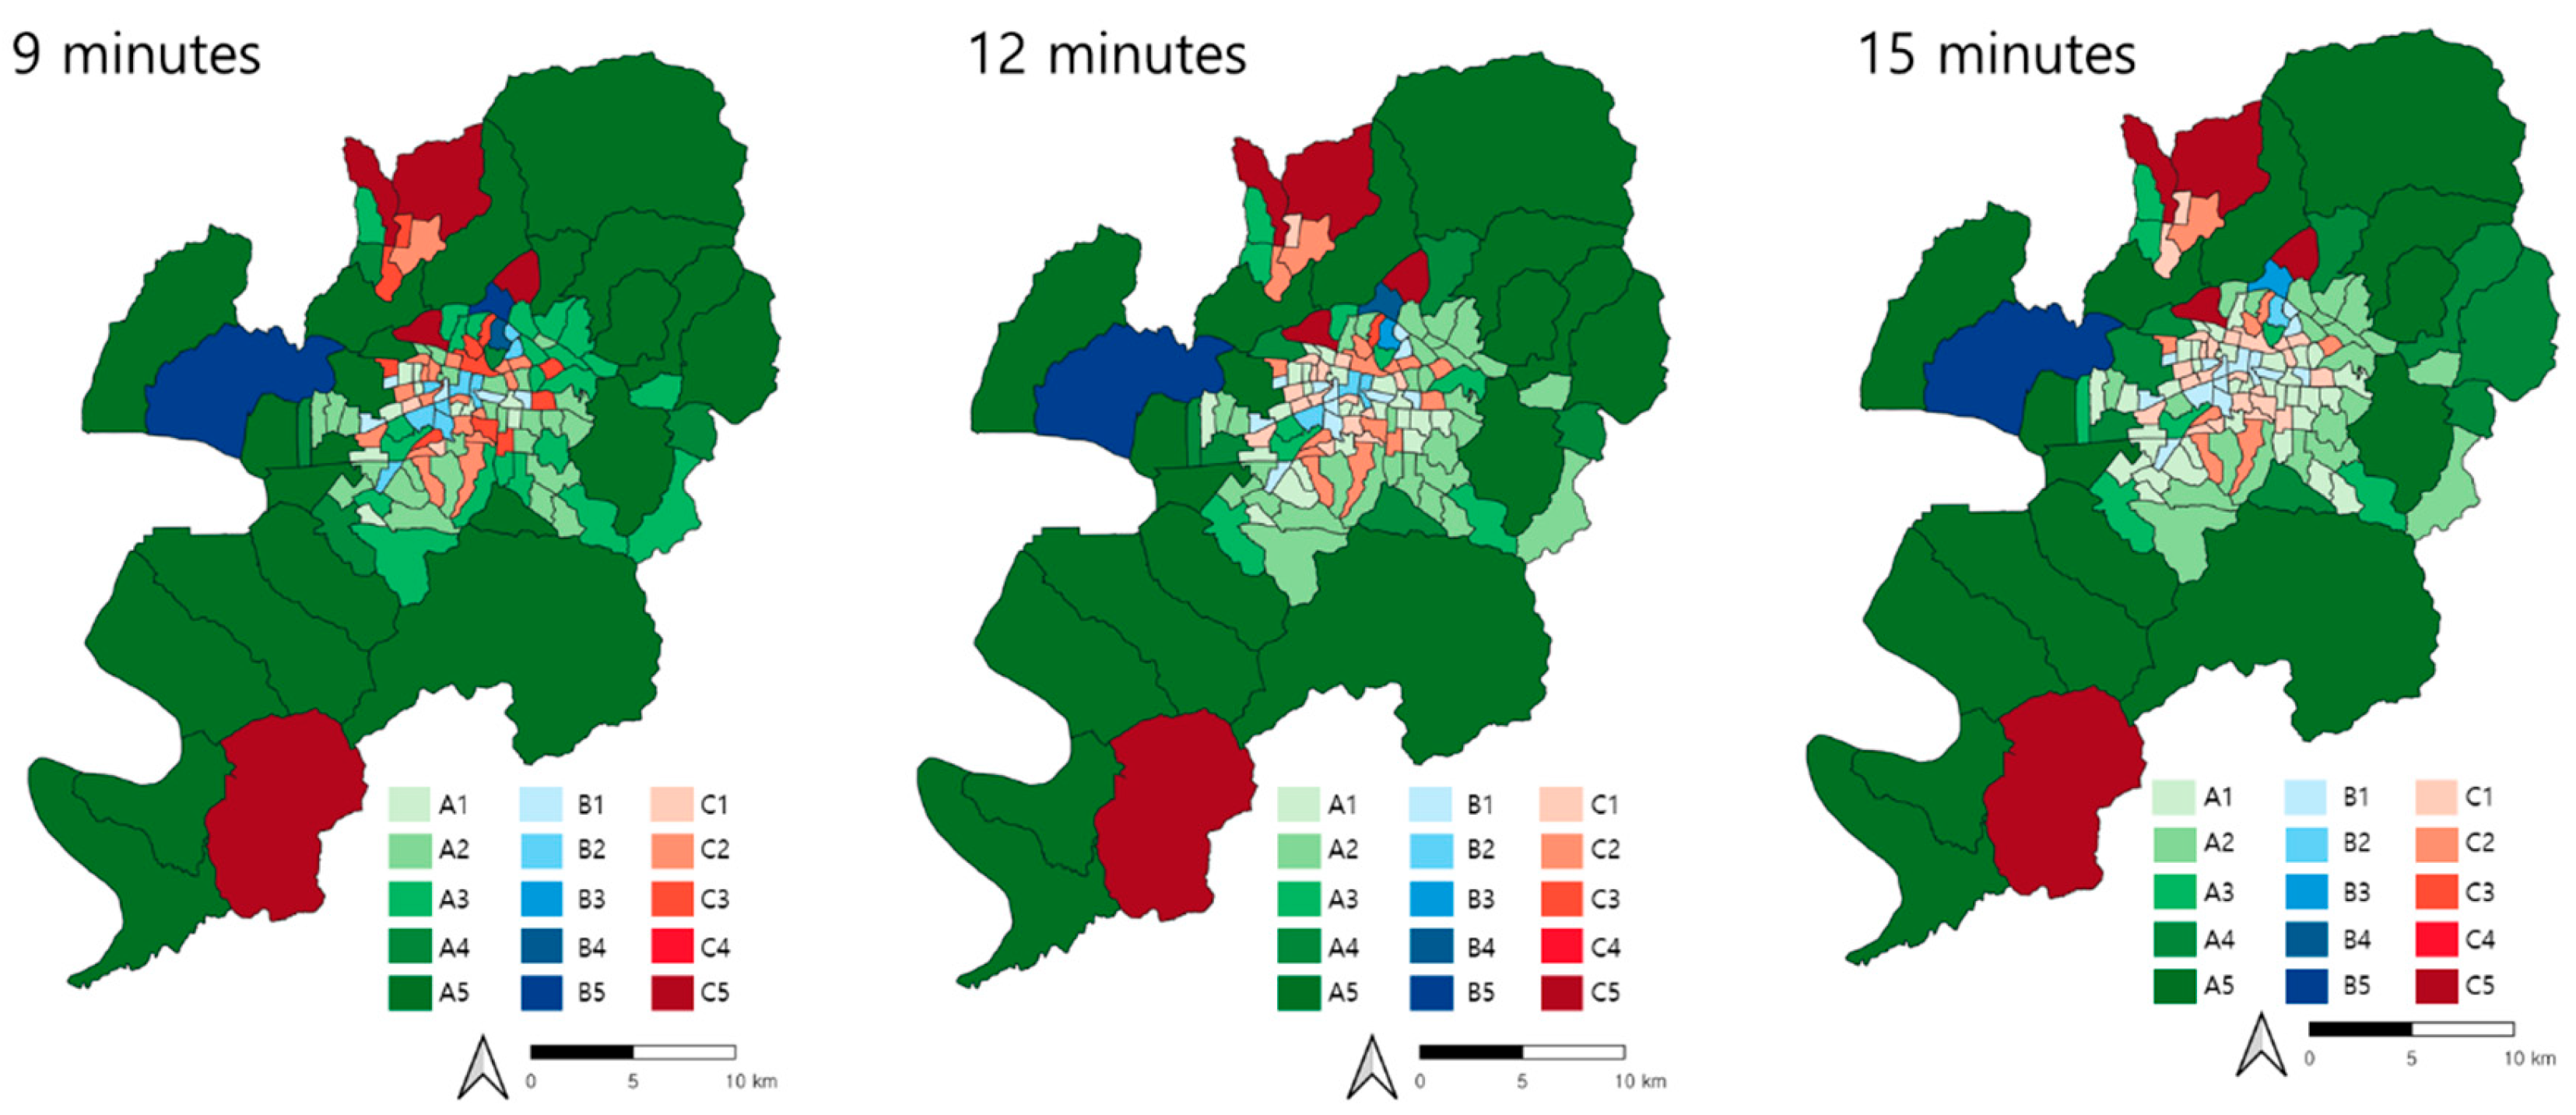
| A (86 in total) |
10 | 26 | 23 | 5 | 22 | 22 | 31 | 9 | 6 | 18 | 34 | 22 | 7 | 8 | 15 |
| B (17 in total) |
5 | 9 | 0 | 1 | 2 | 11 | 3 | 1 | 1 | 1 | 14 | 1 | 1 | 0 | 1 |
| C (36 in total) |
2 | 18 | 11 | 0 | 5 | 15 | 15 | 1 | 0 | 5 | 23 | 8 | 0 | 0 | 5 |
| 9 minutes | 12 minutes | 15 minutes | |||||||||||||
| 1 | 2 | 3 | 4 | 5 | 1 | 2 | 3 | 4 | 5 | 1 | 2 | 3 | 4 | 5 | |
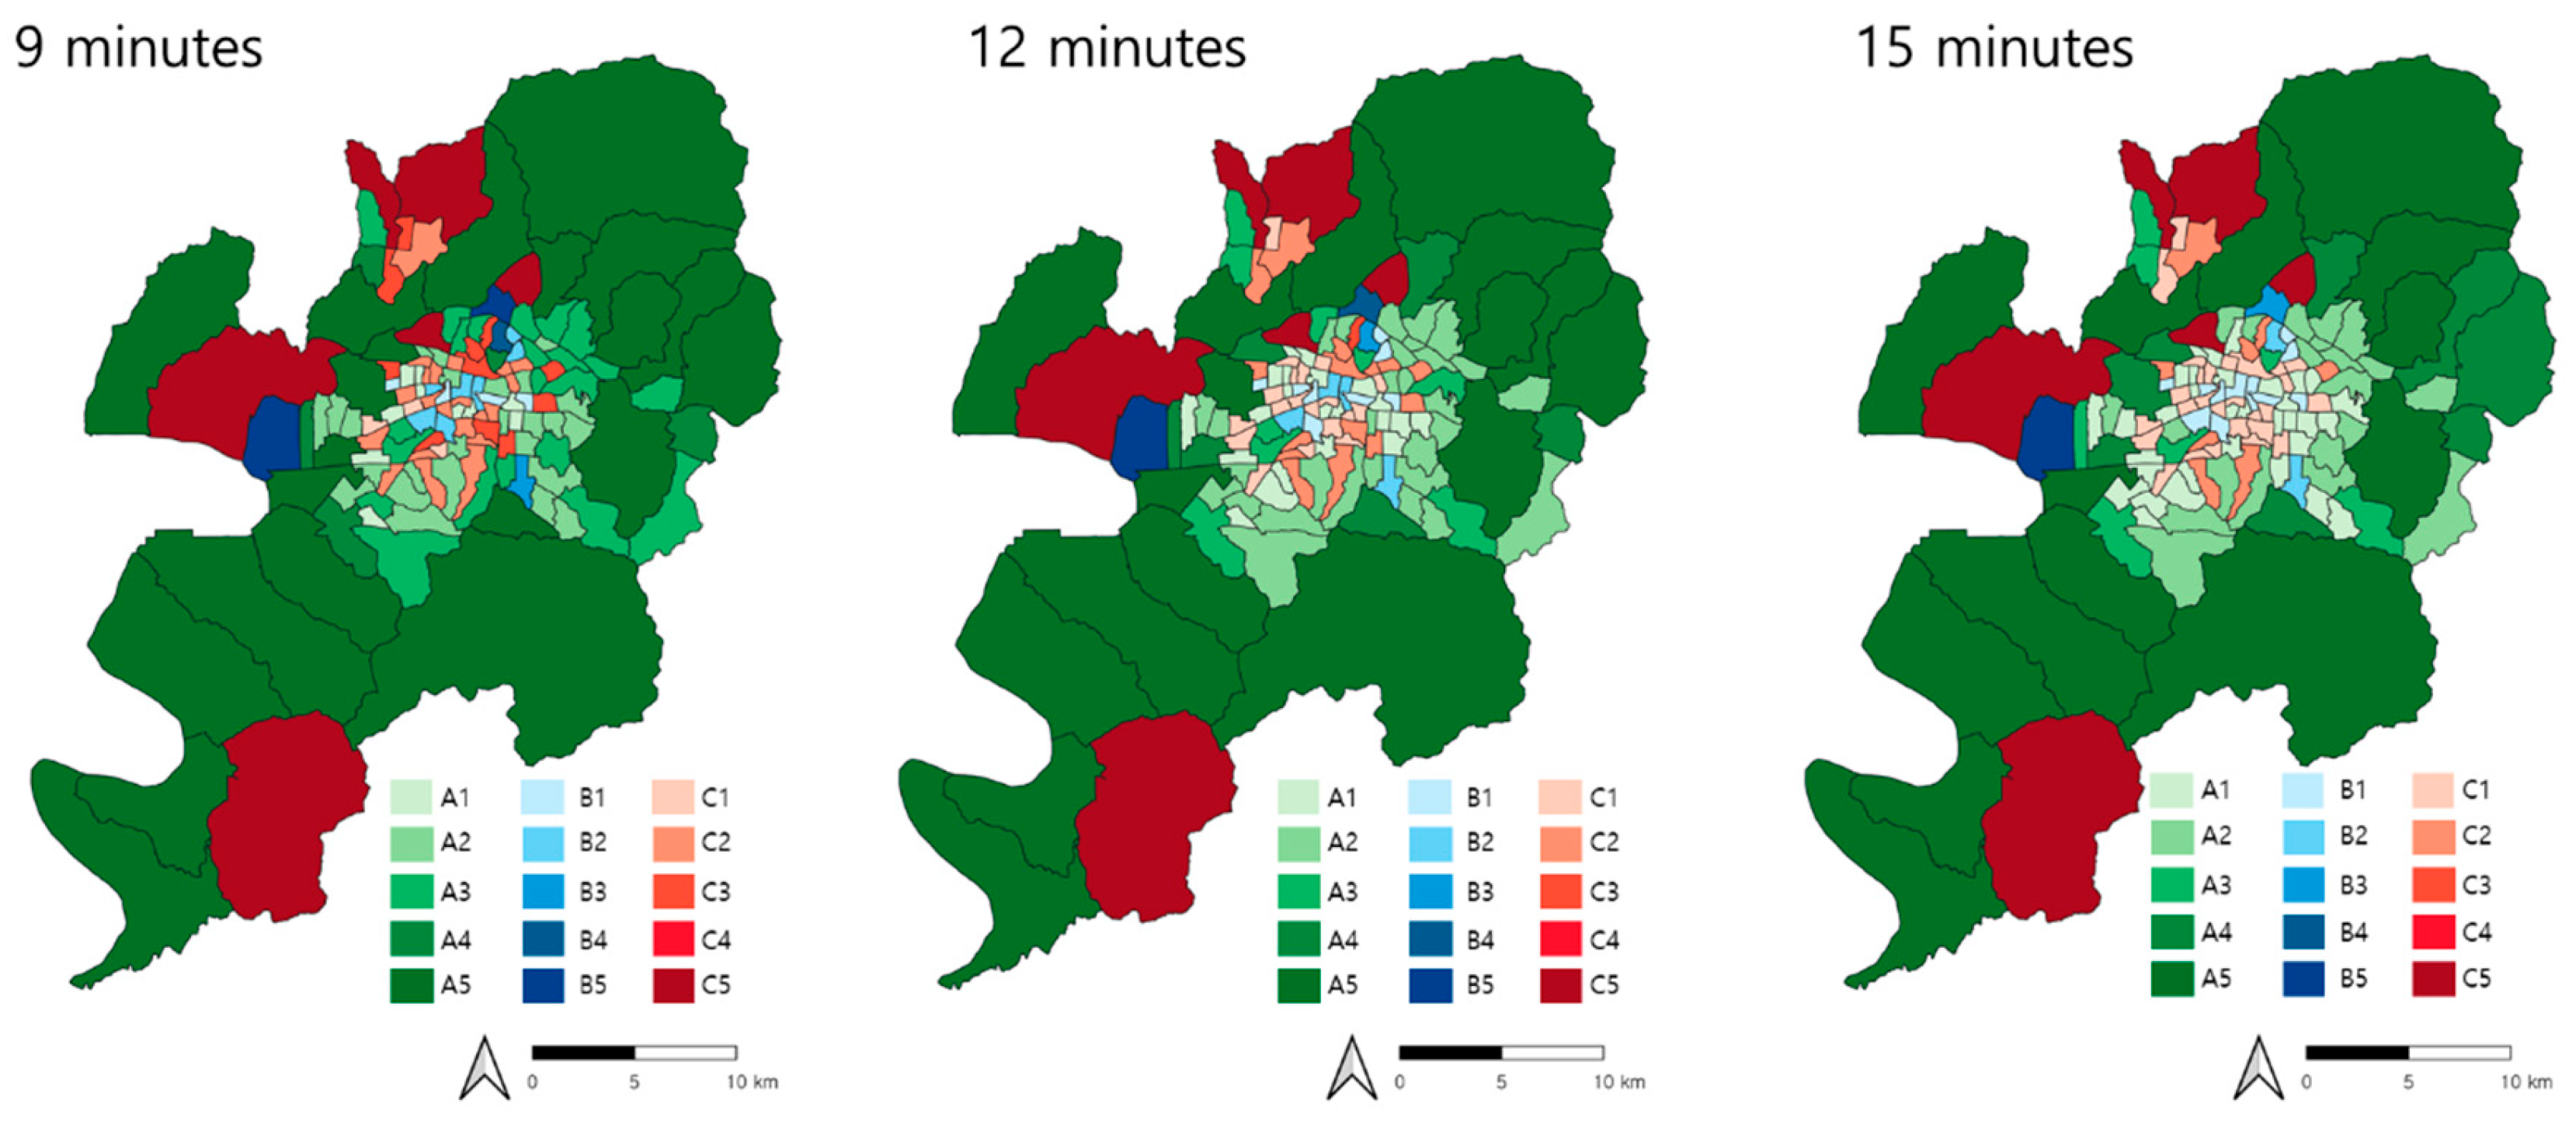
| A (83 in total) |
10 | 25 | 22 | 5 | 21 | 21 | 30 | 9 | 6 | 17 | 33 | 21 | 7 | 8 | 14 |
| B / 15 (15 in total) |
4 | 7 | 1 | 1 | 2 | 8 | 4 | 1 | 1 | 1 | 11 | 2 | 1 | 0 | 1 |
| C / 41 (41 in total) |
3 | 21 | 11 | 0 | 6 | 19 | 15 | 1 | 0 | 6 | 27 | 8 | 0 | 0 | 6 |
Disclaimer/Publisher’s Note: The statements, opinions and data contained in all publications are solely those of the individual author(s) and contributor(s) and not of MDPI and/or the editor(s). MDPI and/or the editor(s) disclaim responsibility for any injury to people or property resulting from any ideas, methods, instructions or products referred to in the content. |
© 2025 by the authors. Licensee MDPI, Basel, Switzerland. This article is an open access article distributed under the terms and conditions of the Creative Commons Attribution (CC BY) license (http://creativecommons.org/licenses/by/4.0/).


