1. Introduction
Several space weather phenomena are associated with or triggered by magnetic storms or magnetospheric substorms. The impacts of these phenomena range from mild (e.g., interference with aeromagnetic surveys) to severe (e.g., blackouts or collapses of electric power grids). Geomagnetically Induced Currents (GICs) which flow through electrically conductive infrastructure such as power transmission lines, are generated by naturally induced geoelectric fields during geomagnetic disturbances like magnetic storms. GICs can disrupt power grids, potentially causing widespread blackouts and power losses [
1,
2,
3,
4]. For instance, the Halloween storms of 2003 resulted in a one-hour power outage in Sweden. Additionally, during the same event, transformer failures in South Africa were attributed to prolonged exposure to low-intensity GICs [
5,
6]. Although GIC intensity is typically greater at high geomagnetic latitudes, where dominant auroral ionospheric currents cause significant magnetic field fluctuations on the ground, especially during disturbed periods (e.g., [
7,
8]), there has been growing scientific interest and numerous studies over the past two decades in assessing GIC risks in countries located at low and middle latitudes (e.g., [
9,
10,
11]). These risks strongly depend on factors such as ground conductivity and the topology of the power grid.
Taken together, the multiplicity of recently developed approaches in the field of nonlinear time series analysis offers great potentials for uncovering relevant yet complex processes interlinking different geospace subsystems, variables and spatio-temporal scales (for a review see [
12]). Furthermore, information theory has shown to be very useful for studies of the magnetosphere-ionosphere coupling [
13]. In particular, entropy measures like Block entropy were applied to study the complex character of the dynamics of the topside ionosphere using satellite measurements from the Swarm mission of the European Space Agency - ESA [
14,
15].
Precise computation of GICs in power grids during magnetic storms is a complex two-step process requiring detailed knowledge of transmission line design and the electrical conductivity of the local terrestrial solid crust. While such an analysis is challenging, a preliminary estimation of the geoelectric field from geomagnetic data is comparatively simpler and can be performed in the time or frequency domain [
16] [& references therein]. Proxies for GICs, such as
(e.g., [
17,
18]) or geomagnetic indices A and K (e.g., [
19,
20]), have been proposed, but each has limitations. The GIC index has gained attention in low and middle latitude studies (e.g., [
10,
11,
21]) due to its consistency, minimal input requirements, and adaptability for use with ground conductivity models and various infrastructure. Originally introduced by Marshall et al. (2010) [
16], the index is derived solely from geomagnetic field data, eliminating the need for information on ground conductivity, ionospheric current system geometry, or infrastructure details. At a single location, the GIC index effectively measures relative risk over time, assuming GIC flow at a node (in the pipeline or power transmission network) is proportional to the local geoelectric field. However, comparisons across regions with different geology reflect the “geoeffectiveness” of the driving magnetic field fluctuations (e.g. [
22]), rather than direct GIC impact, due to conductivity variations.
The magnetic storm of 17 March 2015 (aka St. Patrick’s Day storm) was the most intense space weather event during solar cycle 24 (2008–2019), when Dst reached -223 nT, known for being relatively weak in terms of solar activity compared to other cycles, including the present (2019–to date). It was triggered by a powerful coronal mass ejection (CME) and caused spectacular auroral displays, visible as far south as the central United States, and resulted in minor disruptions to satellite operations and radio communications (e.g., [
23,
24,
25]). In contrast, the magnetic storm of 11 May 2024 (aka Mother’s Day or Gannon) has so far been the most intense of the ongoing solar cycle 25 (Dst reached -412 nT) and the strongest storm over a period of more than 20 years, i.e., since the Halloween 2003 superstorm (when Dst reached -422 nT on 20 November 2003). This cycle is significantly more active than its predecessor, with higher sunspot counts and frequent solar eruptions. The 11 May 2024 storm was associated with multiple CMEs that arrived in quick succession, creating a prolonged period of heightened geomagnetic activity. The storm’s effects were even more striking than those of March 2015, with auroras visible at much lower latitudes than usual, including parts of southern Europe and the southern United States (e.g. [
26,
27]).
Here, we analyze the GIC activity indices using Block entropy around the storm events of March 2015 and May 2024, aiming to highlight possible distinct differences in the degree of order / organization of the coupled solar wind-magnetosphere-ionosphere-ground system as a storm approaches. The latter may help to improve the mitigation of space weather hazards.
Section 2 describes the data used in this study and discusses the information theory approaches applied to analyze these data. The rest of the paper deals with the obtained results (
Section 3) and their discussion (
Section 4).
2. Materials and Methods
In this study, we analyze GIC indices along with the standard SYM-H index from March 2015 and May 2024. The SYM-H index represents the Longitudinally SYM-(metric) H-(orizontal) component disturbances of the Earth’s magnetic field [
28], and is similar to the hourly Disturbance storm-time (Dst) index, although it is computed from more ground-based stations and with a finer time resolution of 1-min. Dst (and SYM-H) variation is derived to provide a quantitative measure of geomagnetic disturbances that can be correlated with other solar and geophysical parameters. (for SYM-H index, please visit:
https://wdc.kugi.kyoto-u.ac.jp, accessed on November 2024 and NASA’s OmniWeb service
https://omniweb.gsfc.nasa.gov [
29]).
The most intense period of solar cycle 24, in terms of magnetic storm activity, was the year 2015, during which the strongest storm of this solar cycle, i.e., the St. Patrick’s Day storm, occurred. A discussion of space weather effects on the ground related to the St. Patrick’s Day storm is given in Balasis et al. [
30], Tozzi et al. [
10] and Boutsi et al. [
11]. Several authors have examined the same storm event using Swarm time series and applying information theory approaches (e.g. [
14,
15,
31,
32]). The magnetic storm of May 2024, often referred to as the Mother’s Day (or Gannon) storm, was one of the most intense solar events in recent history, which provided a critical case study for analyzing the effects of extreme solar activity on Earth’s environment and technological systems.
Table 1 shows the strongest magnetic storms of 2015 and 2024, based on minimum SYM-H index values.
Here, we employ data from three magnetic observatories located in France (Chambon la Forêt - CLF), Italy (Castello Tesino - CTS), and Spain (Ebro - EBR).
Table 2 shows the geographic and the altitude-adjusted corrected geomagnetic (AACGM) coordinates of each station, estimated for the epoch 2015.0, as well as the corresponding L-shell values.
2.1. GIC Index
The GIC index is calculated using the method outlined in Marshall et al. (2010) [
16], which applies a frequency-domain filter to the geographic North (X) or East (Y) component of the geomagnetic field’s horizontal intensity. This filter function represents the "surface impedance" for a half-space uniformly conducting one-dimensional (1D) Earth model and is based on the magnetotelluric principle that relates the orthogonal electric and magnetic field components through a single-valued complex transfer function (e.g., [
33]). The GIC index for either the X or Y direction is obtained by taking the absolute value of the inverse transformation back into the time domain. As described by Marshall et al. (2010) [
16], users can choose the index (GICx or GICy) that best aligns with their specific infrastructure system.
Magnetometer datasets, sampled at 1-minute cadence, were inspected for spikes and small gaps, which were cured by minor preprocessing, including linear interpolation. As pointed out by Tozzi et al. (2019b) [
21], linear interpolation used to fill in small data gaps, does not play a significant role to the results, but if it is to affect the GIC index, it will only be to underestimate it. Next, all time series were detrended in order to remove the linear trend from the geomagnetic field data. The formulas applied to the detrended geomagnetic field data, using a 1-day moving window [
10], according to Marshall et al. (2011) [
34] are the following:
where
and
are the North and East components of the magnetic field in the frequency domain,
is the inverse Fourier Transform of the formula inside the brackets,
represents the absolute value,
is the filter function with normalized amplitude and phase characteristics,
f is frequency and
is the Nyquist frequency (
mHz for sampling rate: 1 value / min). All calculations were performed on monthly time series.
2.2. Block Entropy
In his seminal paper in the late 40s, Claude Shannon used the famous Boltzmann’s H theorem to quantify the amount of information transmitted by a telecommunication signal [
35]. Assuming a system has M distinct states and
is the probability of occurence of state i then the information carried by a signal broadcasted by the system can be computed by calculating its entropy:
A zero entropy means the system remains in only one of its states and thus its behaviour has collapsed to a single, monotonous condition, while maximum entropy () means the system exhibits fully chaotic, random behaviour. Of course, in real world applications it is practically impossible to discern in which state a system is, but what is easily done is to consider the values of one of its observable parameters and digitize them, so that when that parameter lies within a certain range of values to , the system can be considered to be in a particular state k. Thus, by computing the probability of occurence of each of these states, the Shannon entropy can be calculated.
In this simplified approach though, the temporal information of these states is ignored and only their statistical distribution is taken into consideration. A better method is to digitize the series and then examine it in terms of "blocks" of consecutive time instants, to assess what types of patterns emerge. As an example, the signal of a binary system that exhibits only two states, e.g. states 0 and 1, can be digitized in a binary sequence, which can then be parsed by blocks of length e.g. three. The new "states" of this signal are now all possible combinations of these original two states, in the 3-length blocks, e.g. the new states are 000, 001, 011 and so on. The probabilities of these new states are calculated and the entropy of block length 3, i.e. H(3) is estimated, which typically yields a much better estimation of the information content of the signal [
36,
37].
In this work, we consider as signals the time series of the GIC index of various stations, both X and Y components, which is being read in "windows" of 5000 points. For each such window, the signal is digitized in a binary sequence, using the window mean as the threshold, and then the entropy of block-length equal to six, H(6), is calculated. The window then moves by 50 points forward and the process is repeated. By this way the changes in the dynamical nature of the system can be detected. As a system transitions from its random, background noise, state to a more particular behaviour, e.g. when a magnetic storm is occurring, its entropy will decrease and this drop in entropy will be evident in the analysis of the corresponding windows.
3. Results
Magnetosphere-ionosphere coupling involves intricate interactions and feedback processes that are challenging to analyze using traditional methods. To address this, we employ Block entropy analysis, a method rooted in symbolic dynamics techniques, to examine time series data from the SYM-H index, as well as the GICx and GICy indices.
Our analysis focuses on data collected from three mid-latitude observatories (i.e., CLF, CTS and EBR) during the strongest magnetic storms of the previous and current solar cycles. By applying Block entropy, we aim to capture the underlying patterns and information transfer within these indices, shedding light on the temporal evolution and complexity of geomagnetic activity. This approach not only enhances our understanding of magnetosphere-ionosphere interactions but also provides a novel perspective for assessing the ground effects of space weather events.
Figure 1,
Figure 2 and
Figure 3 depict the temporal variation of the SYM-H index, GICx, and GICy indices (left columns) for CLF, CTS and EBR, respectively, along with their corresponding Block entropies (right columns) for March 2015. Similarly,
Figure 4,
Figure 5 and
Figure 6 show the temporal variation of the SYM-H index, GICx, and GICy indices (left columns) for CLF, CTS and EBR, respectively, along with their corresponding Block entropies (right columns) during May 2024.
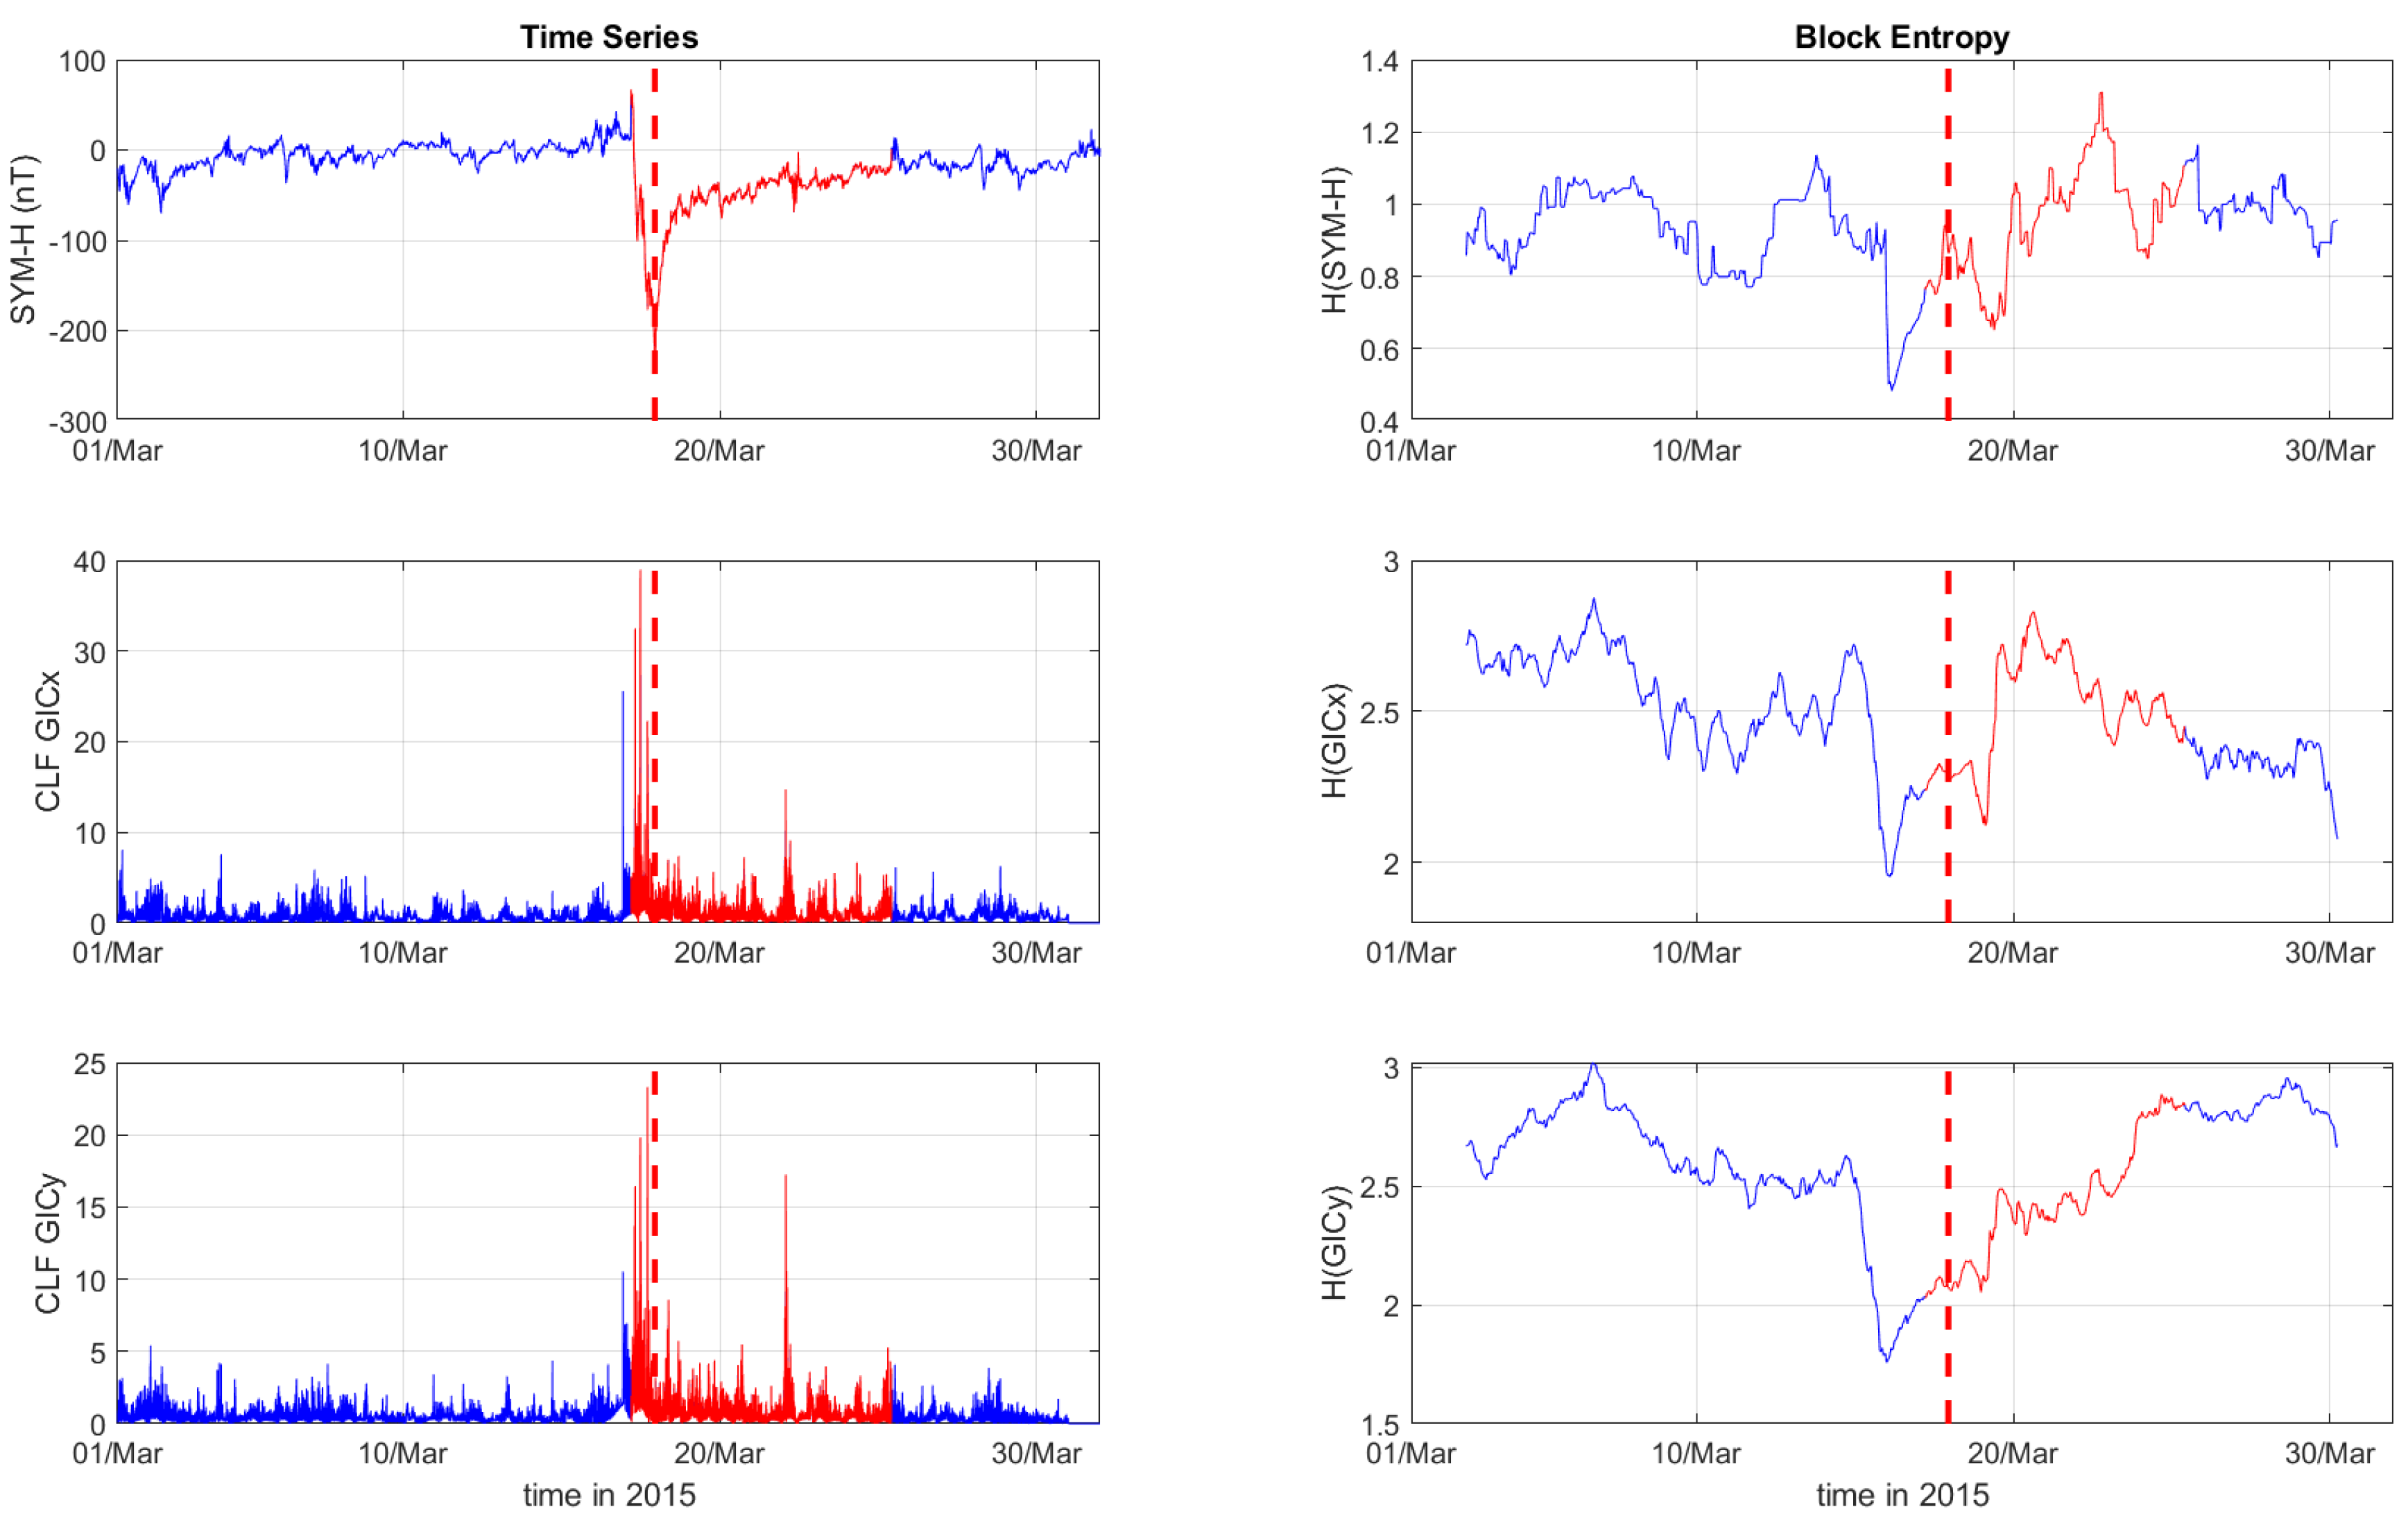
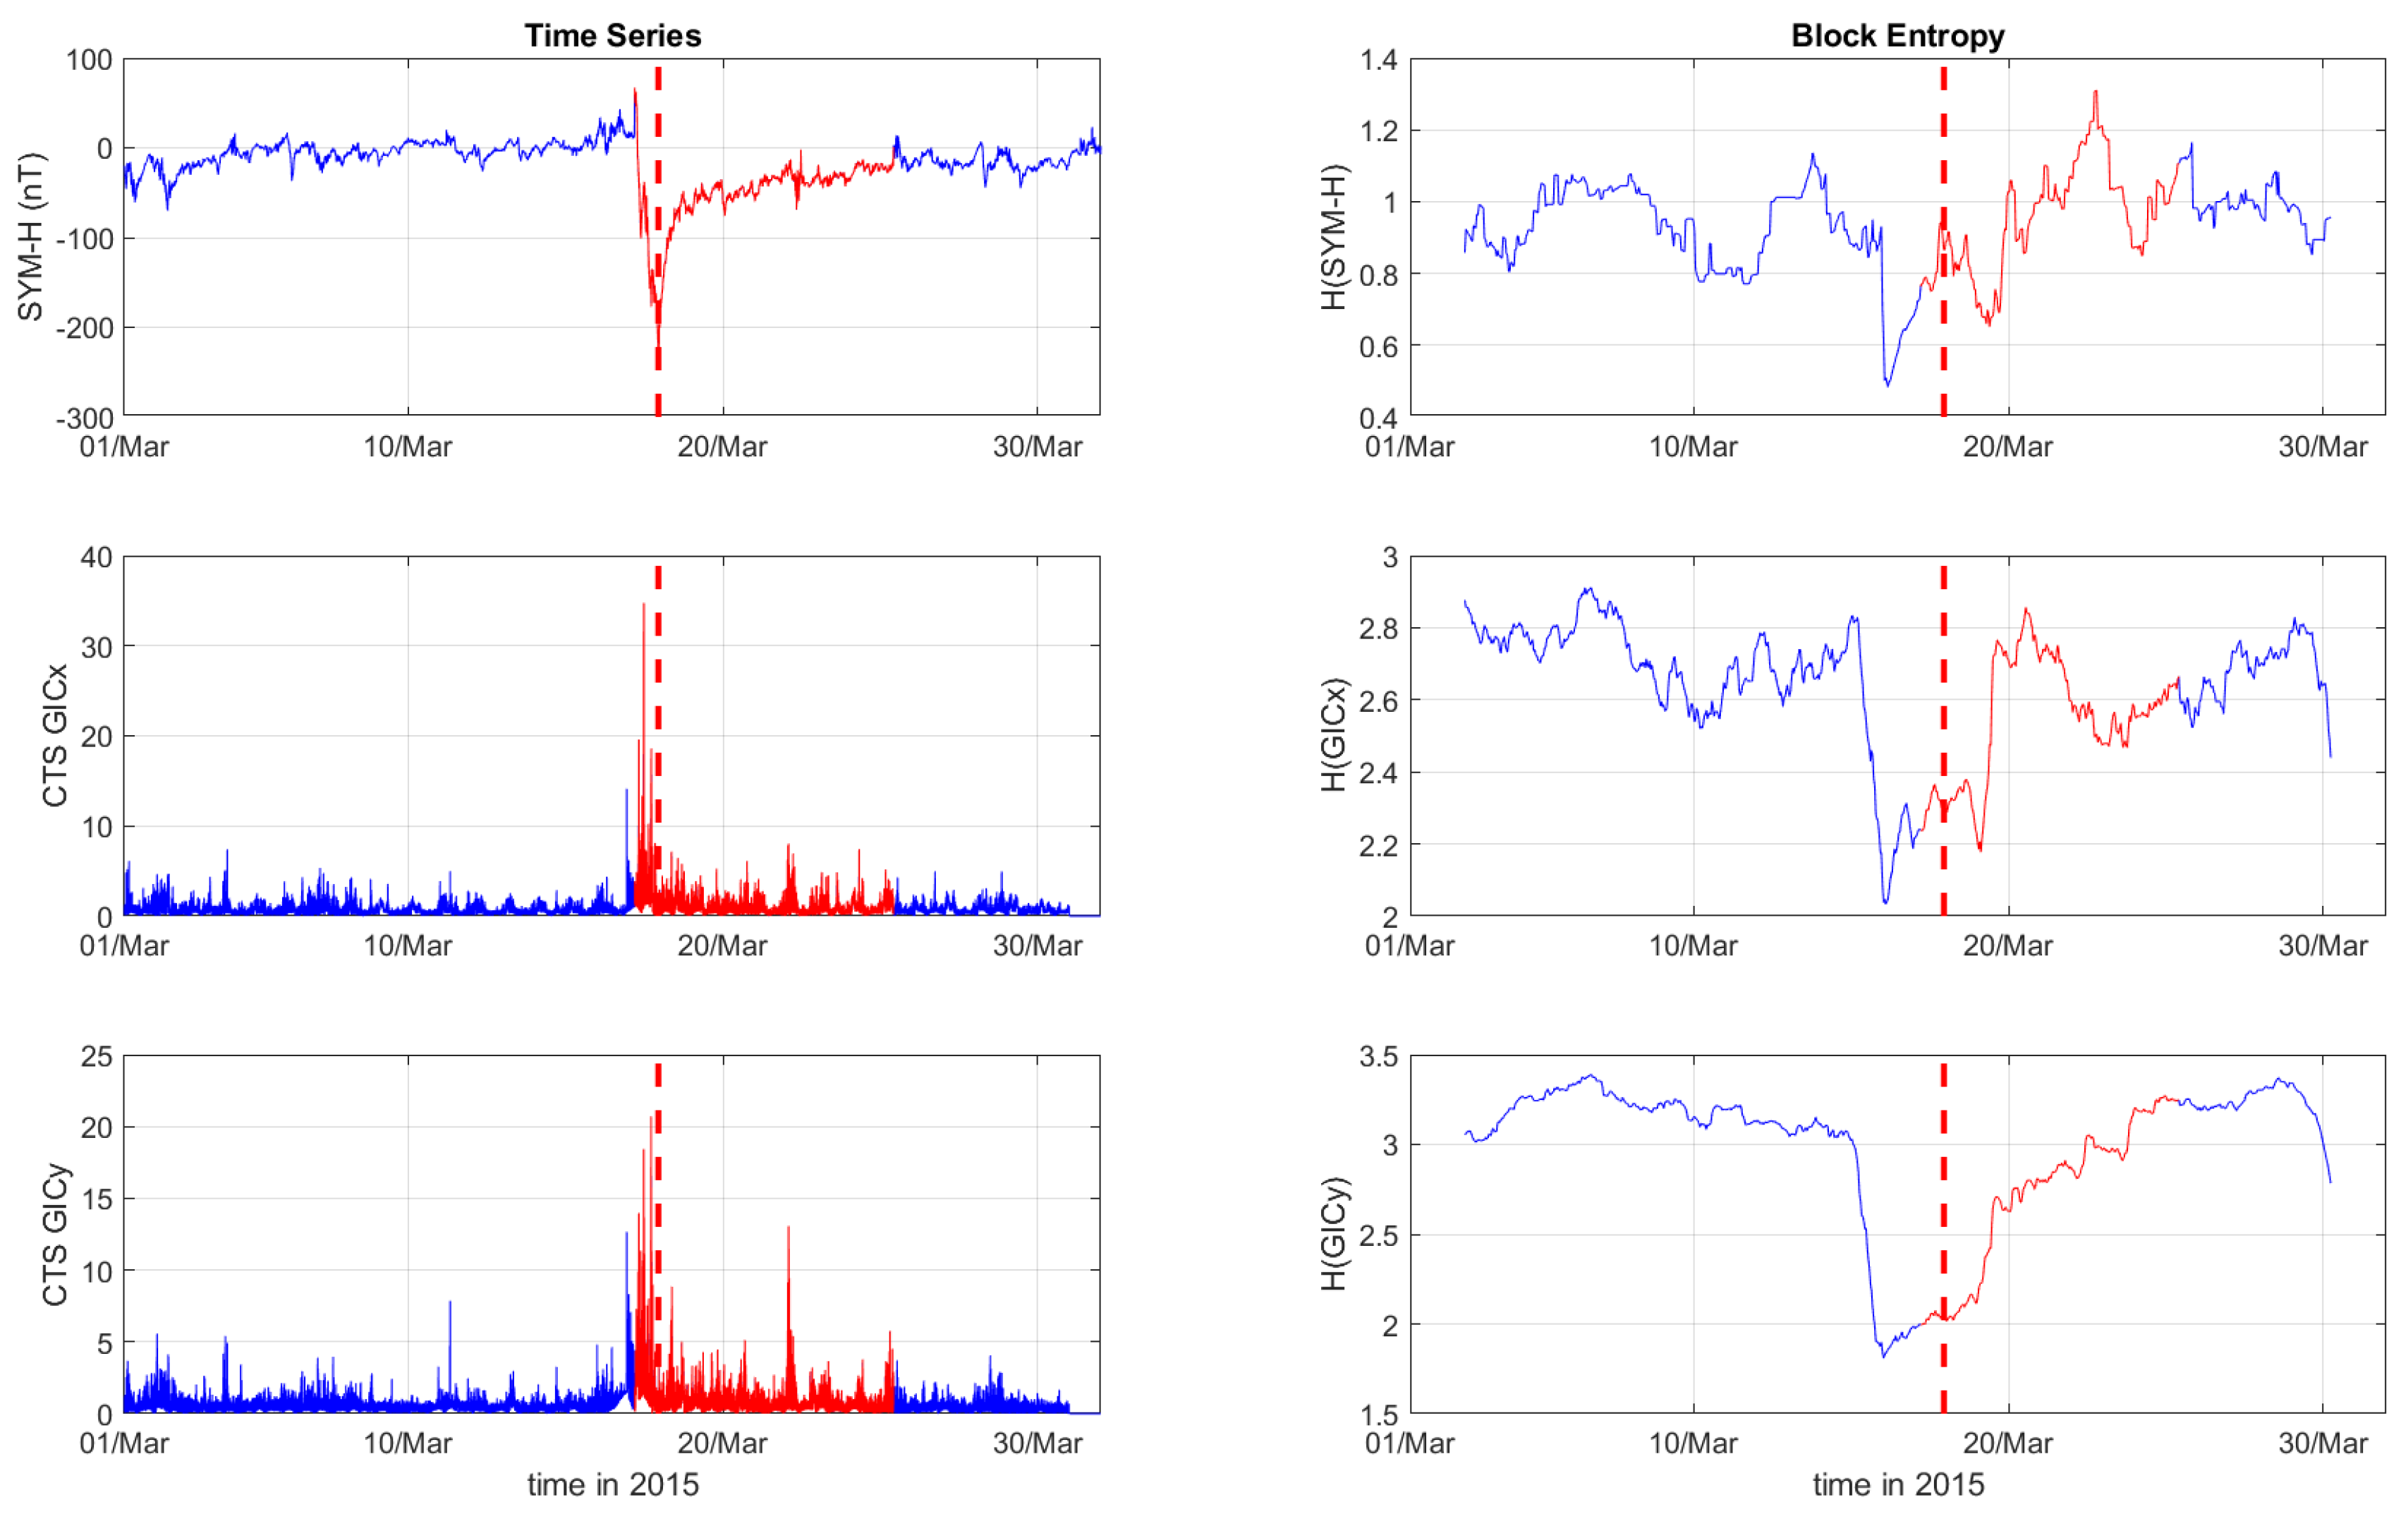
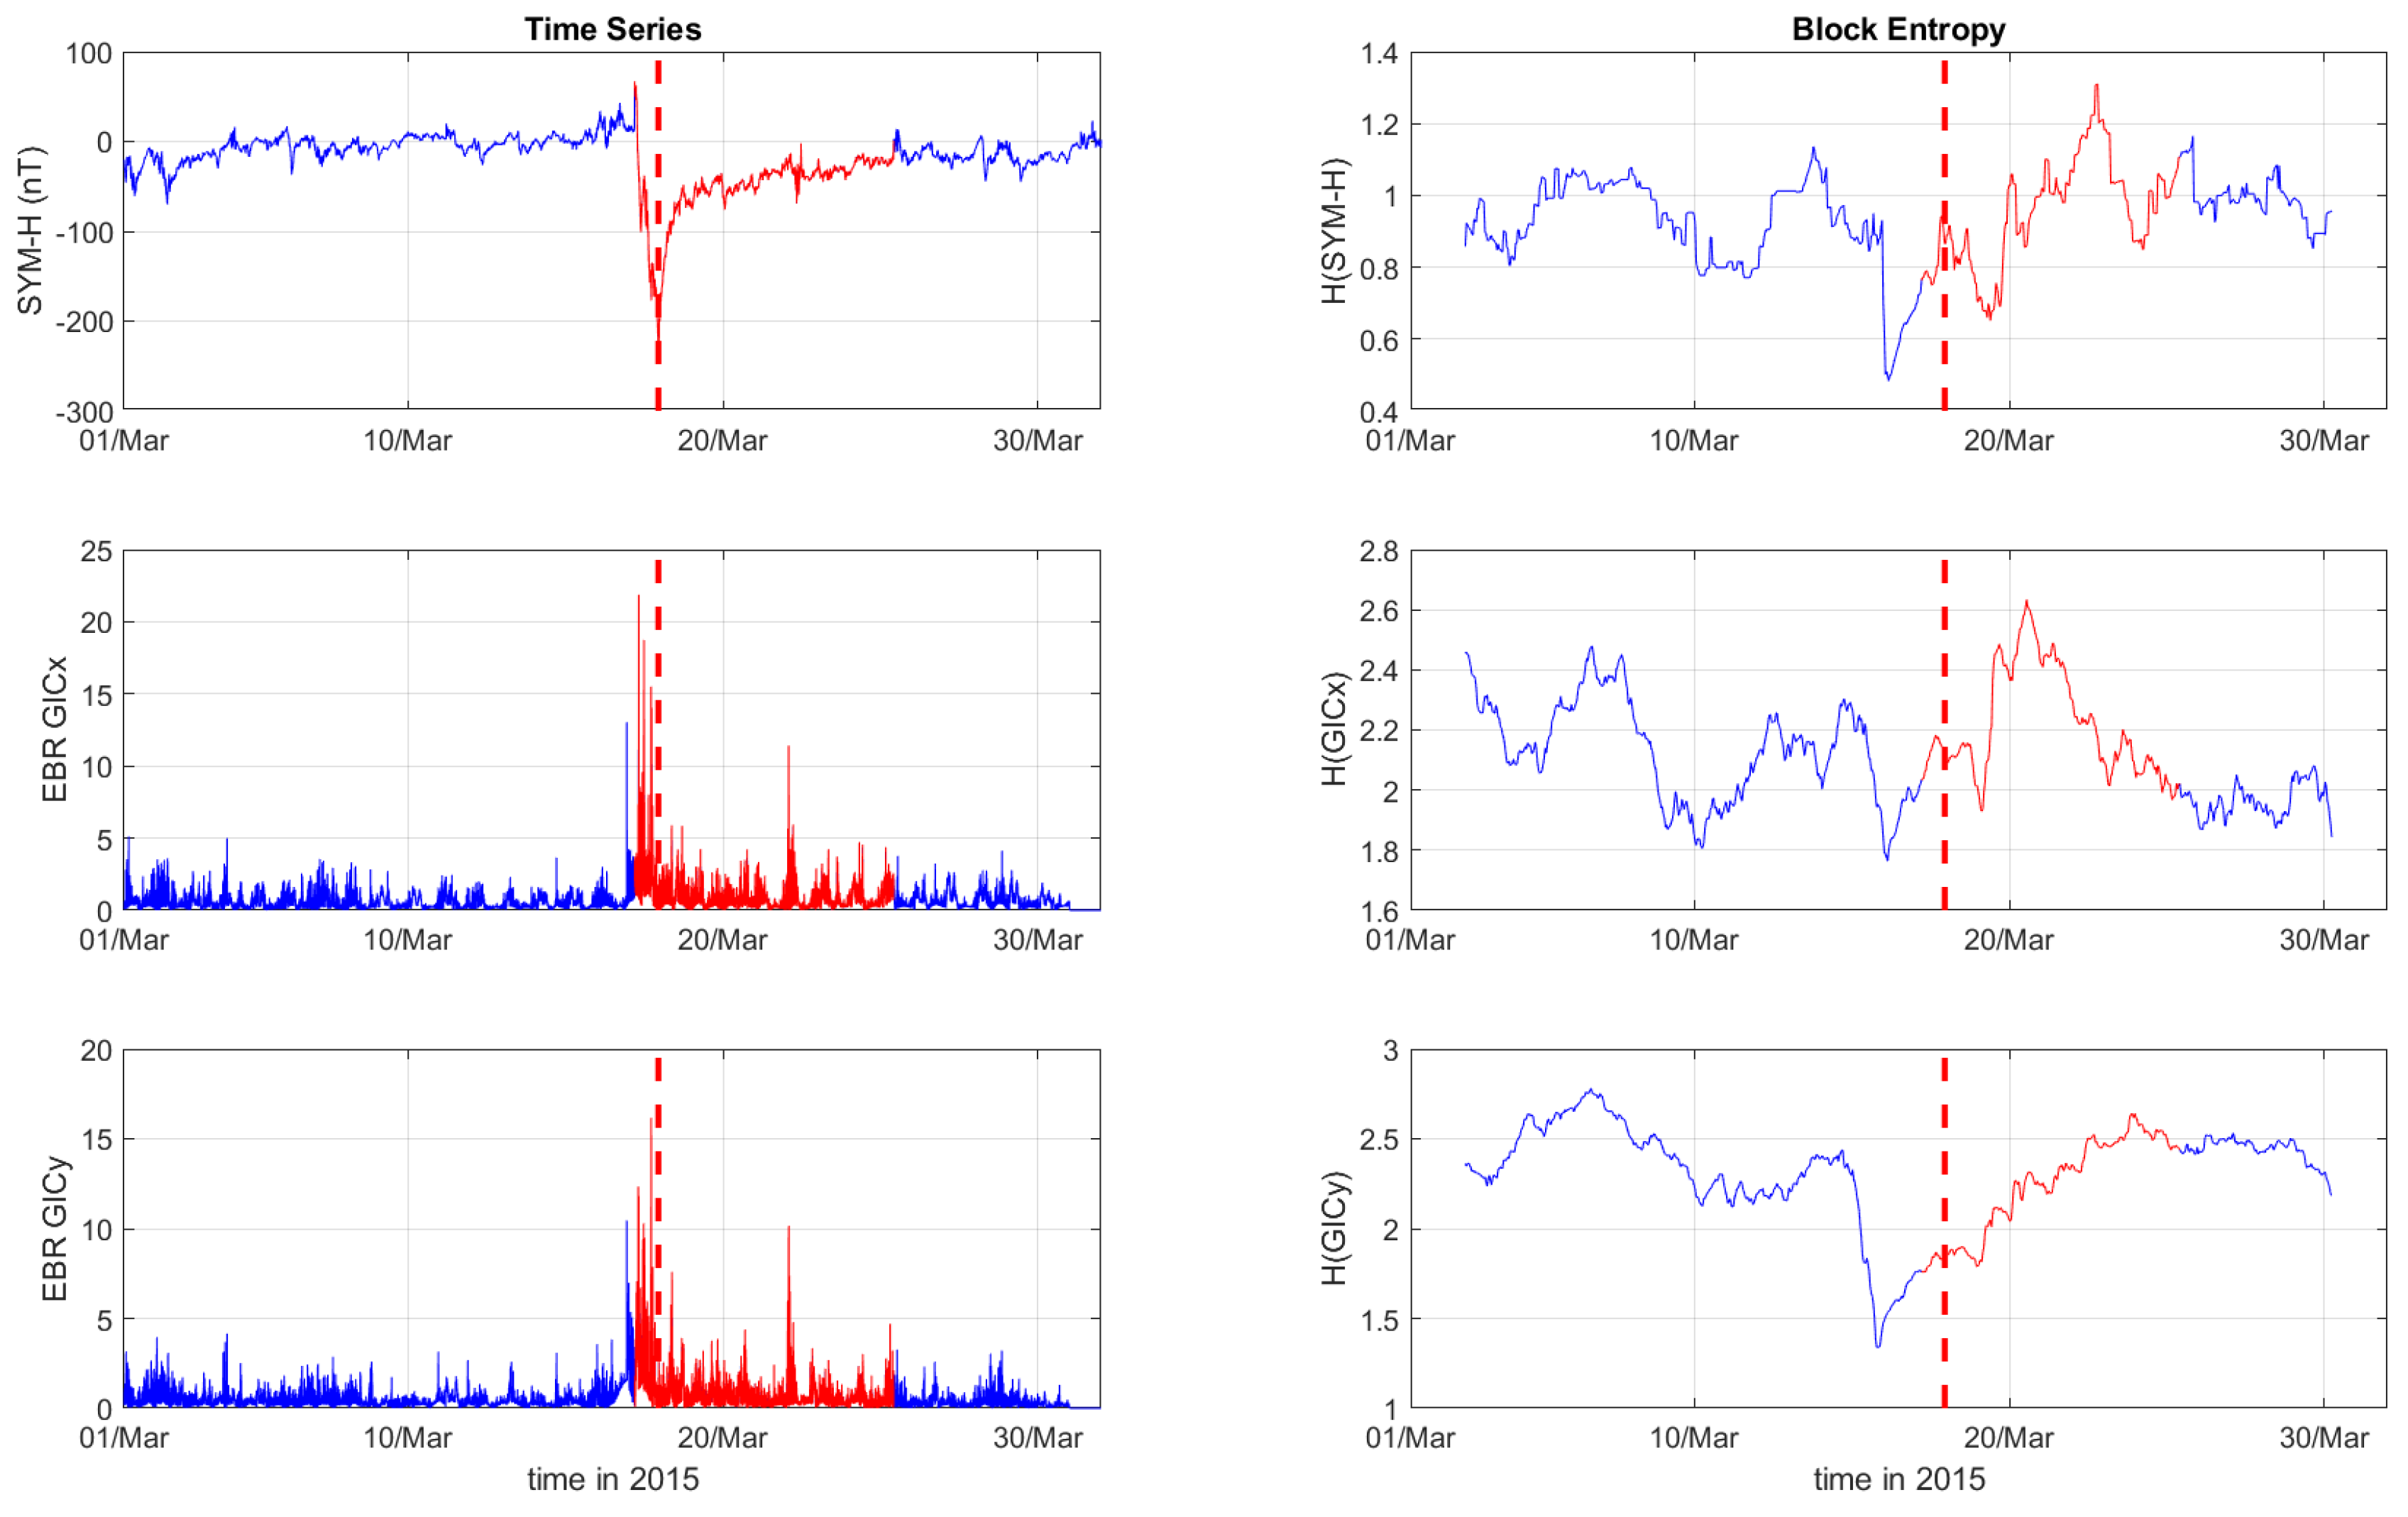
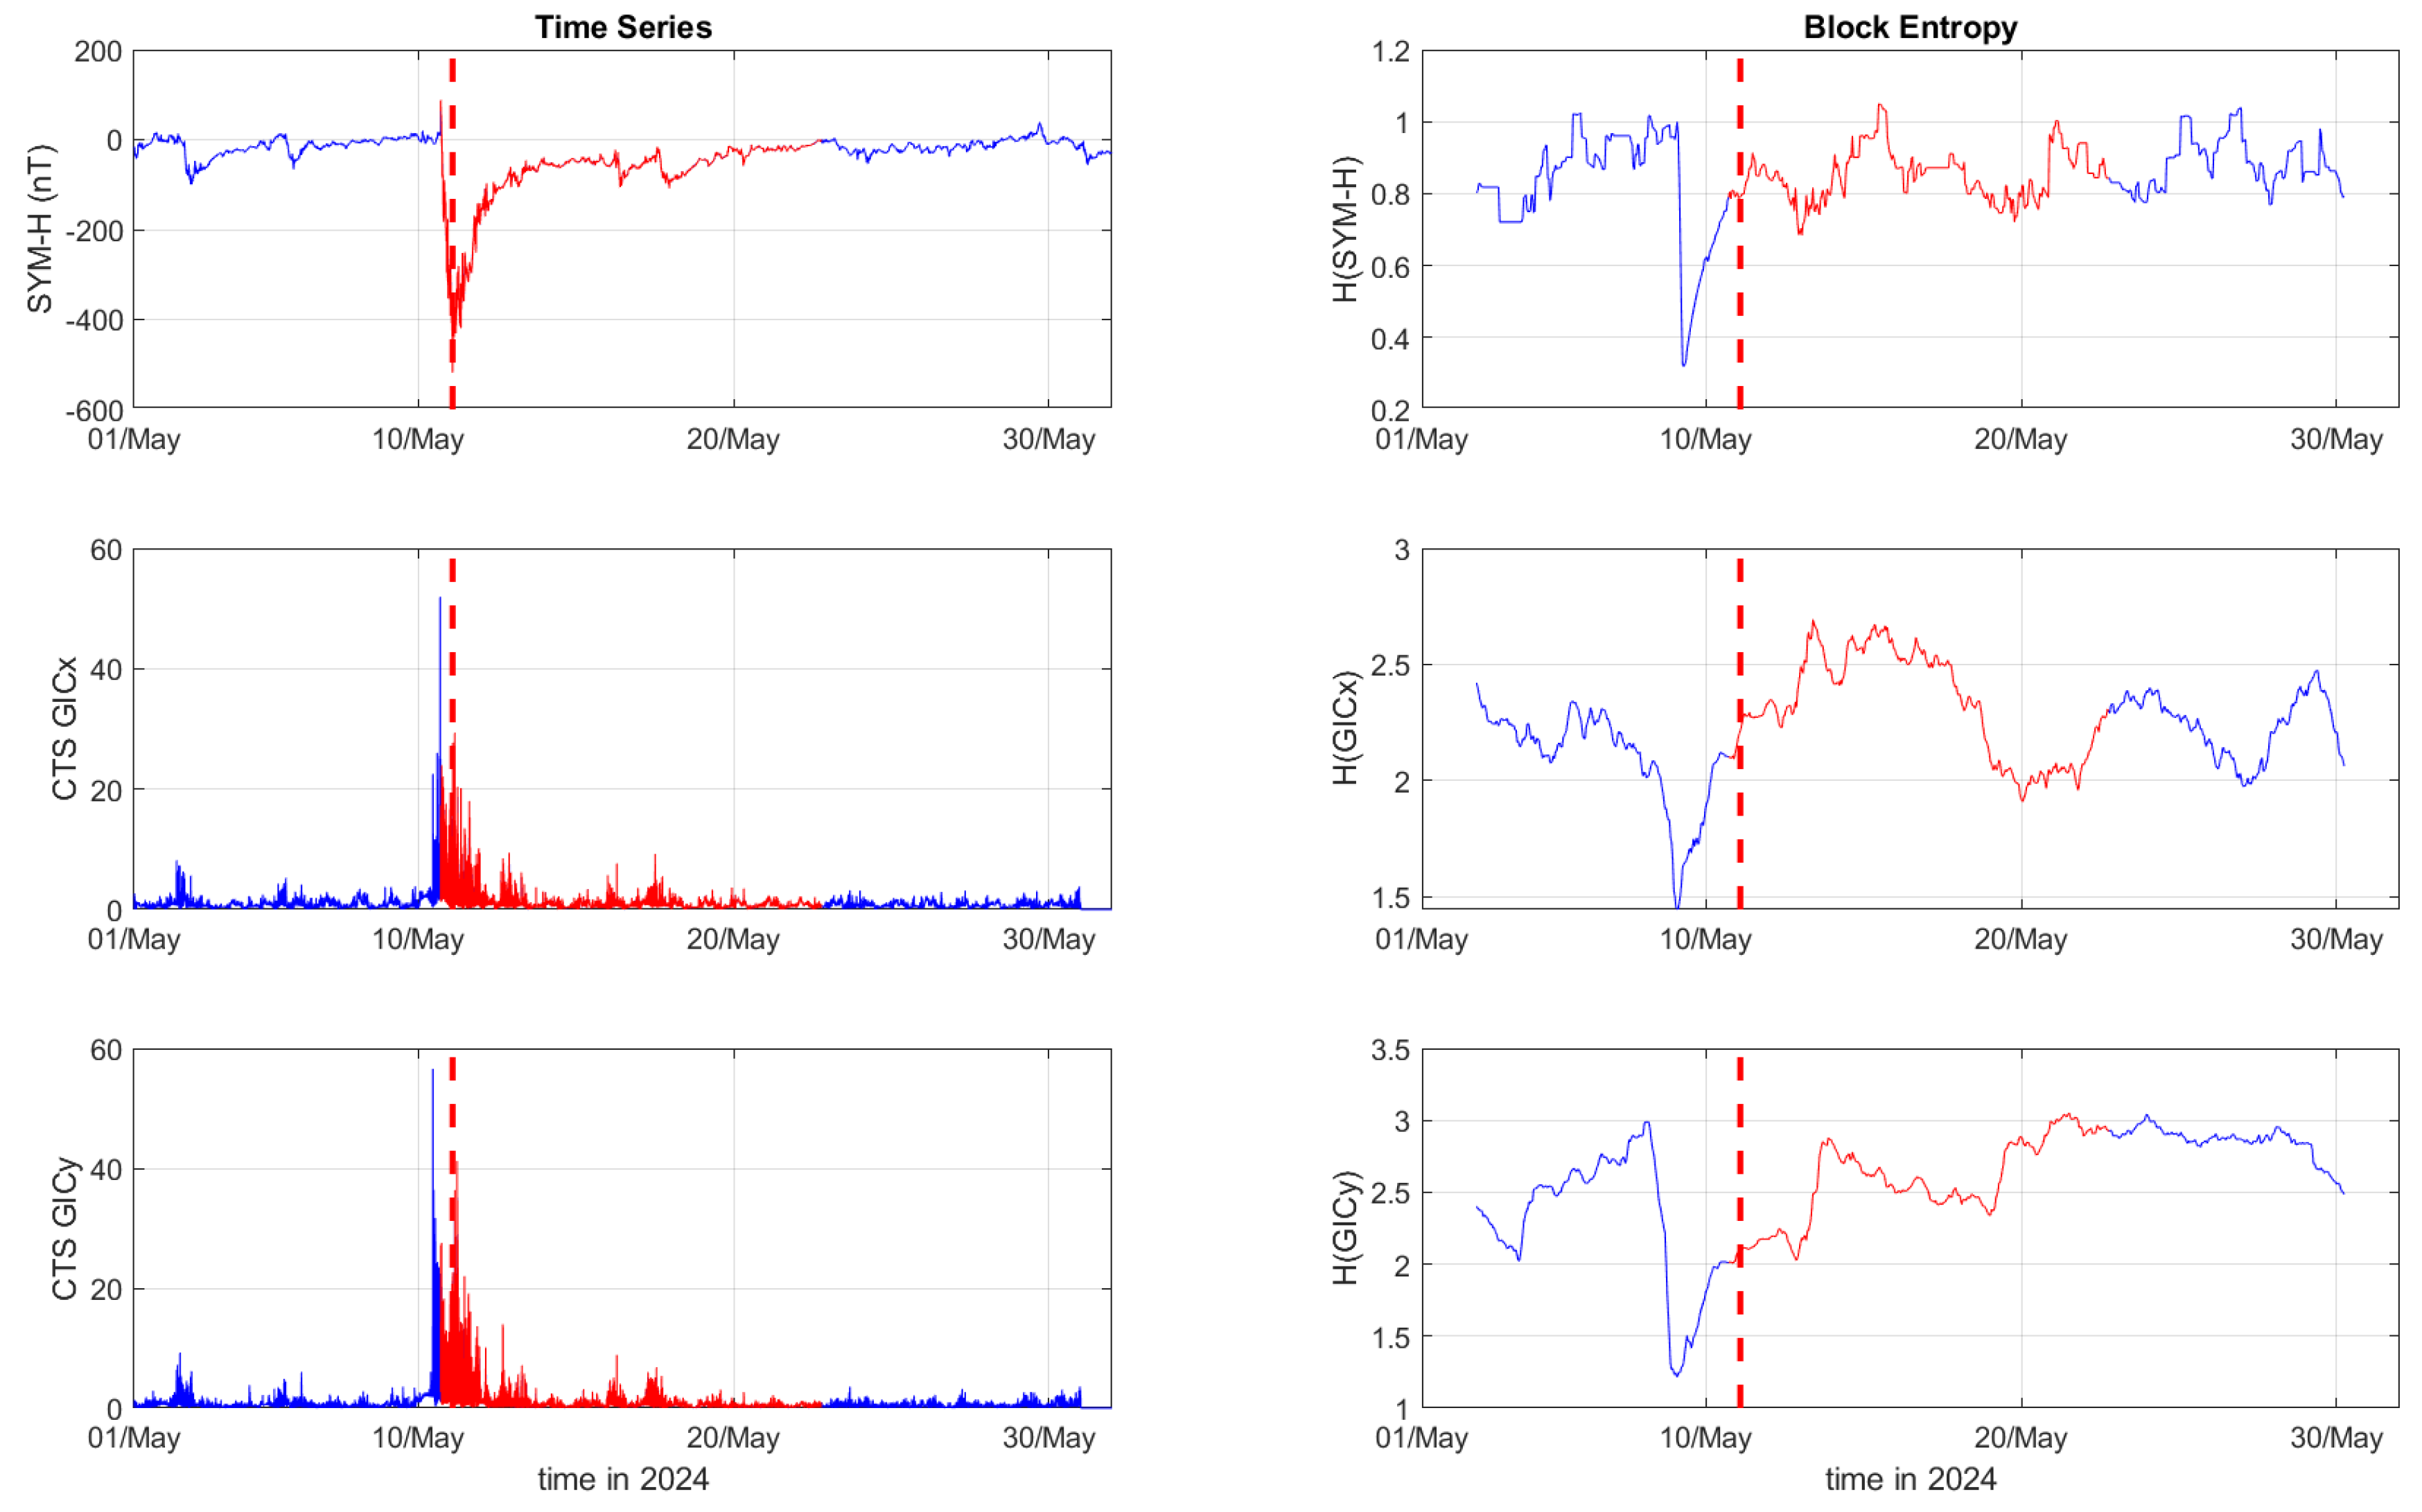
During the St. Patrick’s Day storm in 2015 (
Figure 1,
Figure 2 and
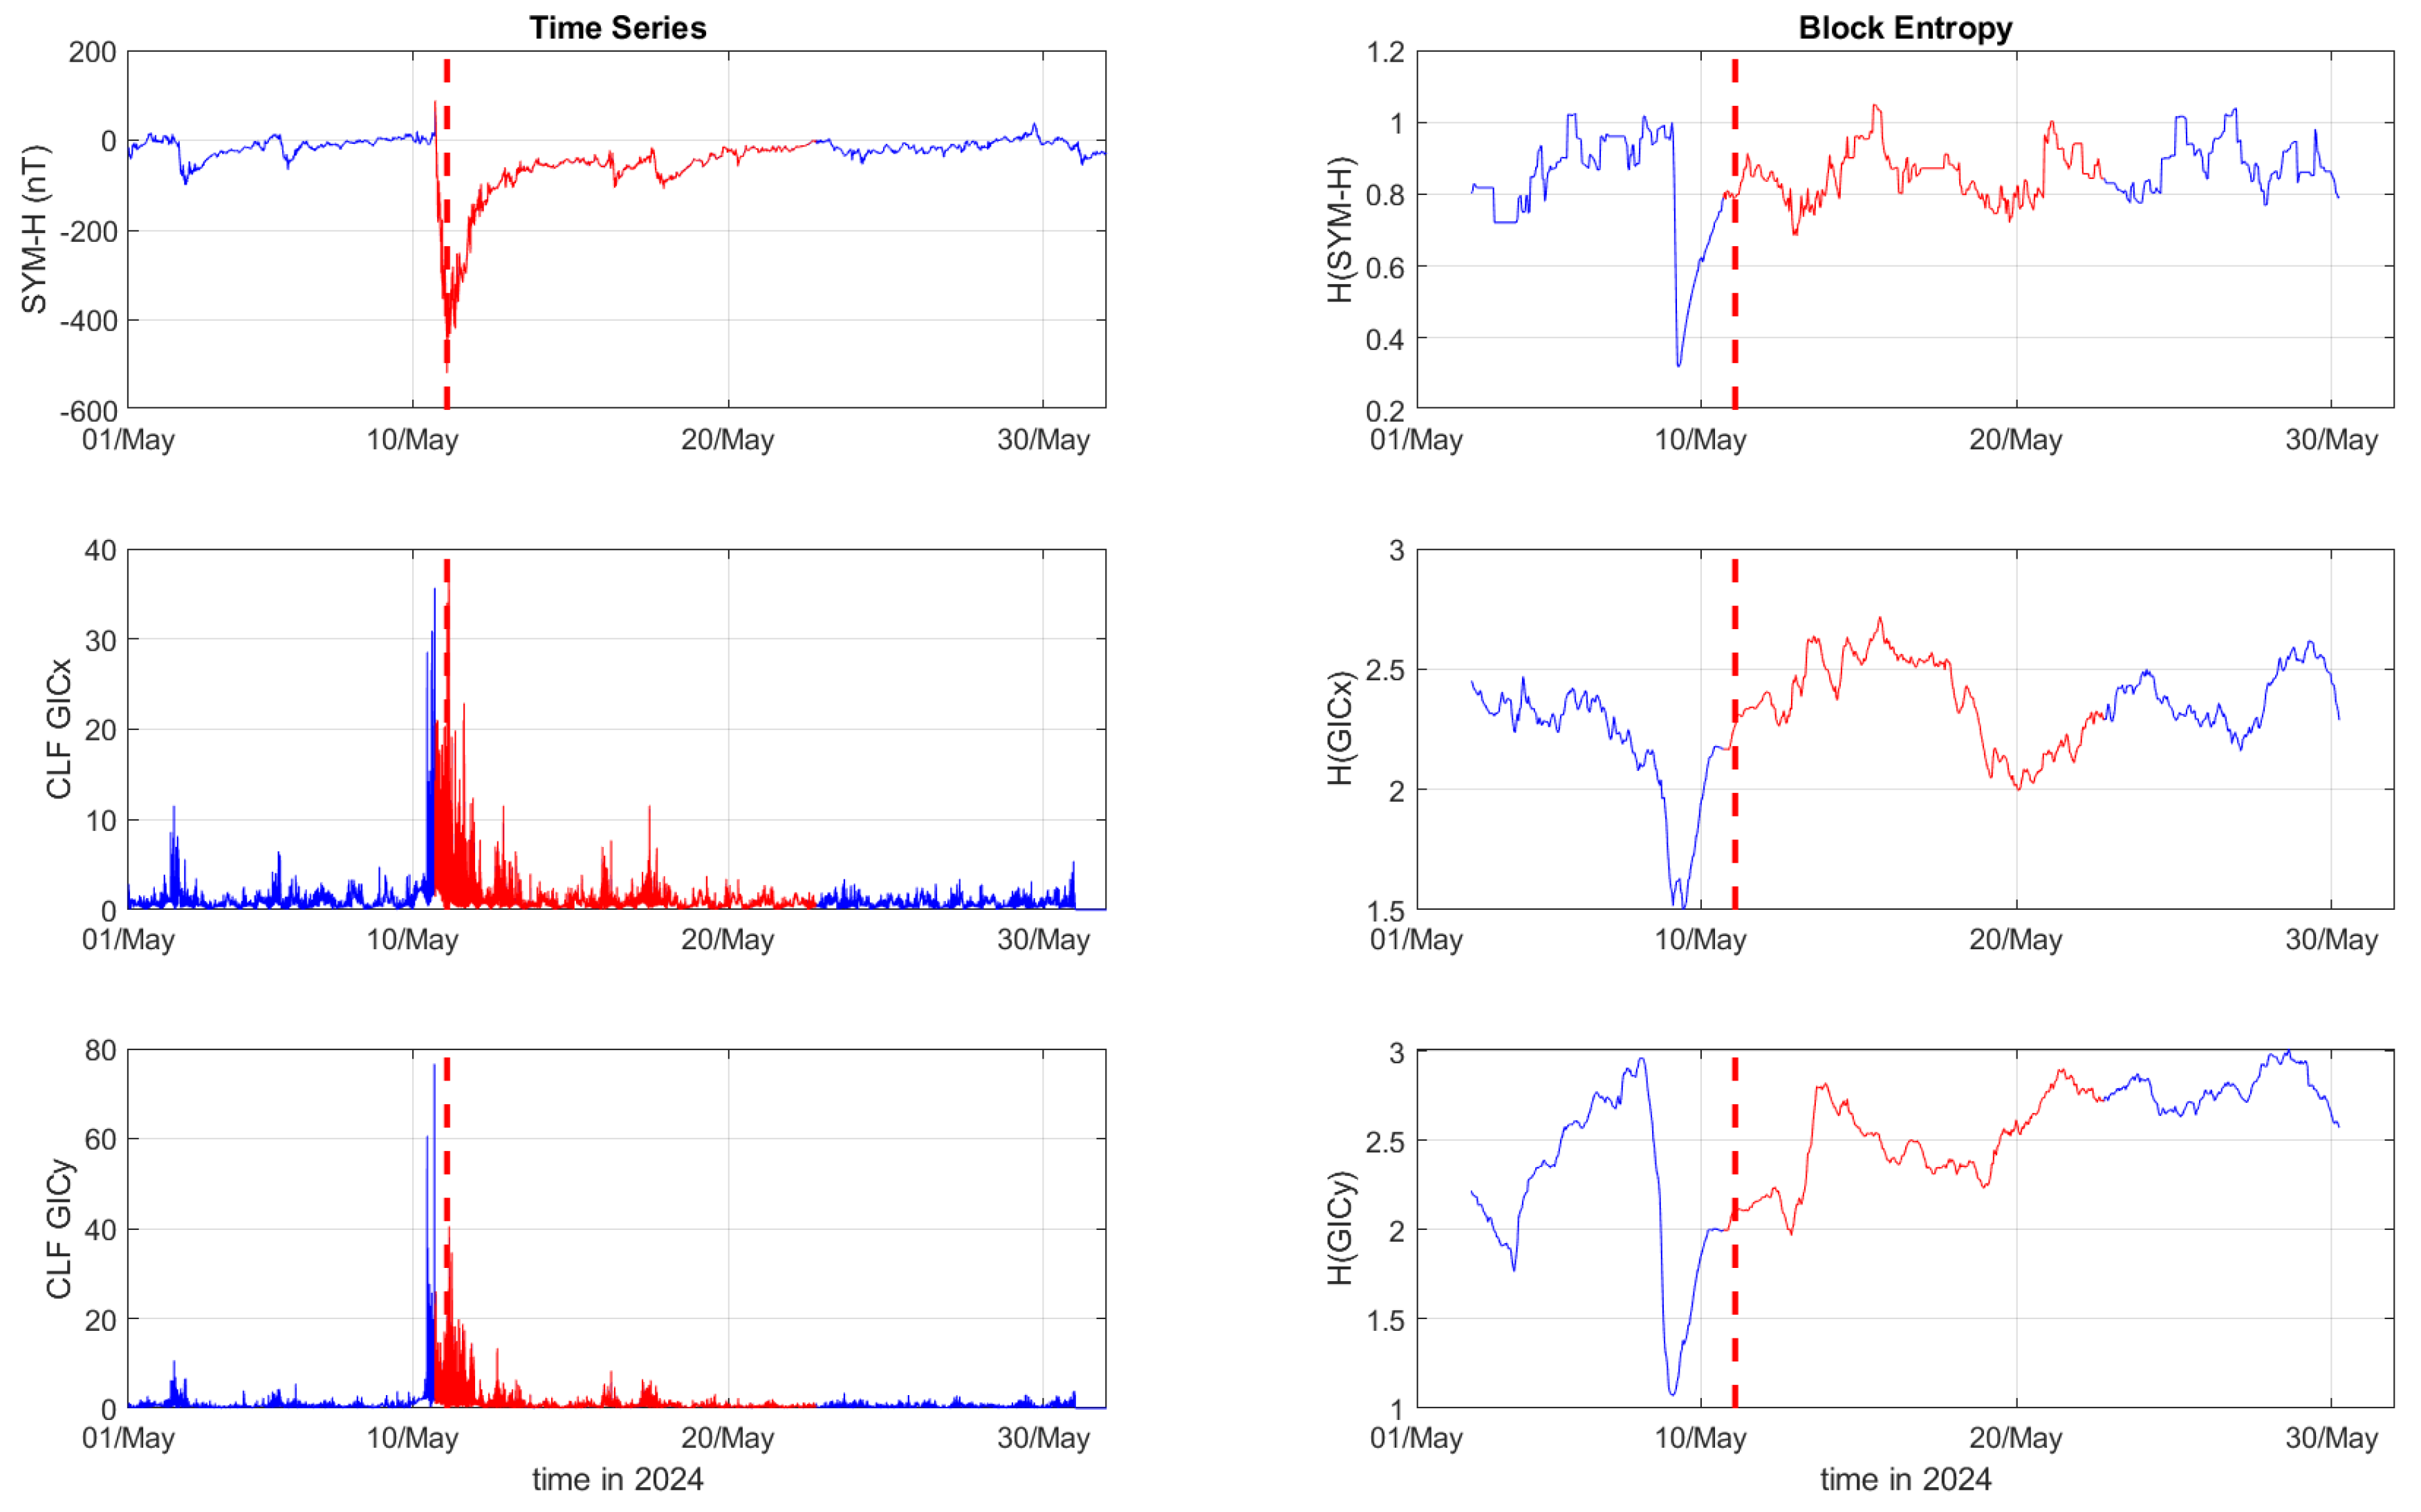
Figure 3), the SYM-H index reached a miminum of -234 nT at 22:47:00 UT. The GICy index reached the peak values of 23.3 for CLF, 20.7 for CTS and 16.2 for EBR. Similarly, the GICx index obtained the maximum values 39.0 for CLF, 34.7 for CTS and 21.9 for EBR. During the Mother’s Day (or Gannon) storm in 2024 (
Figure 4,
Figure 5 and
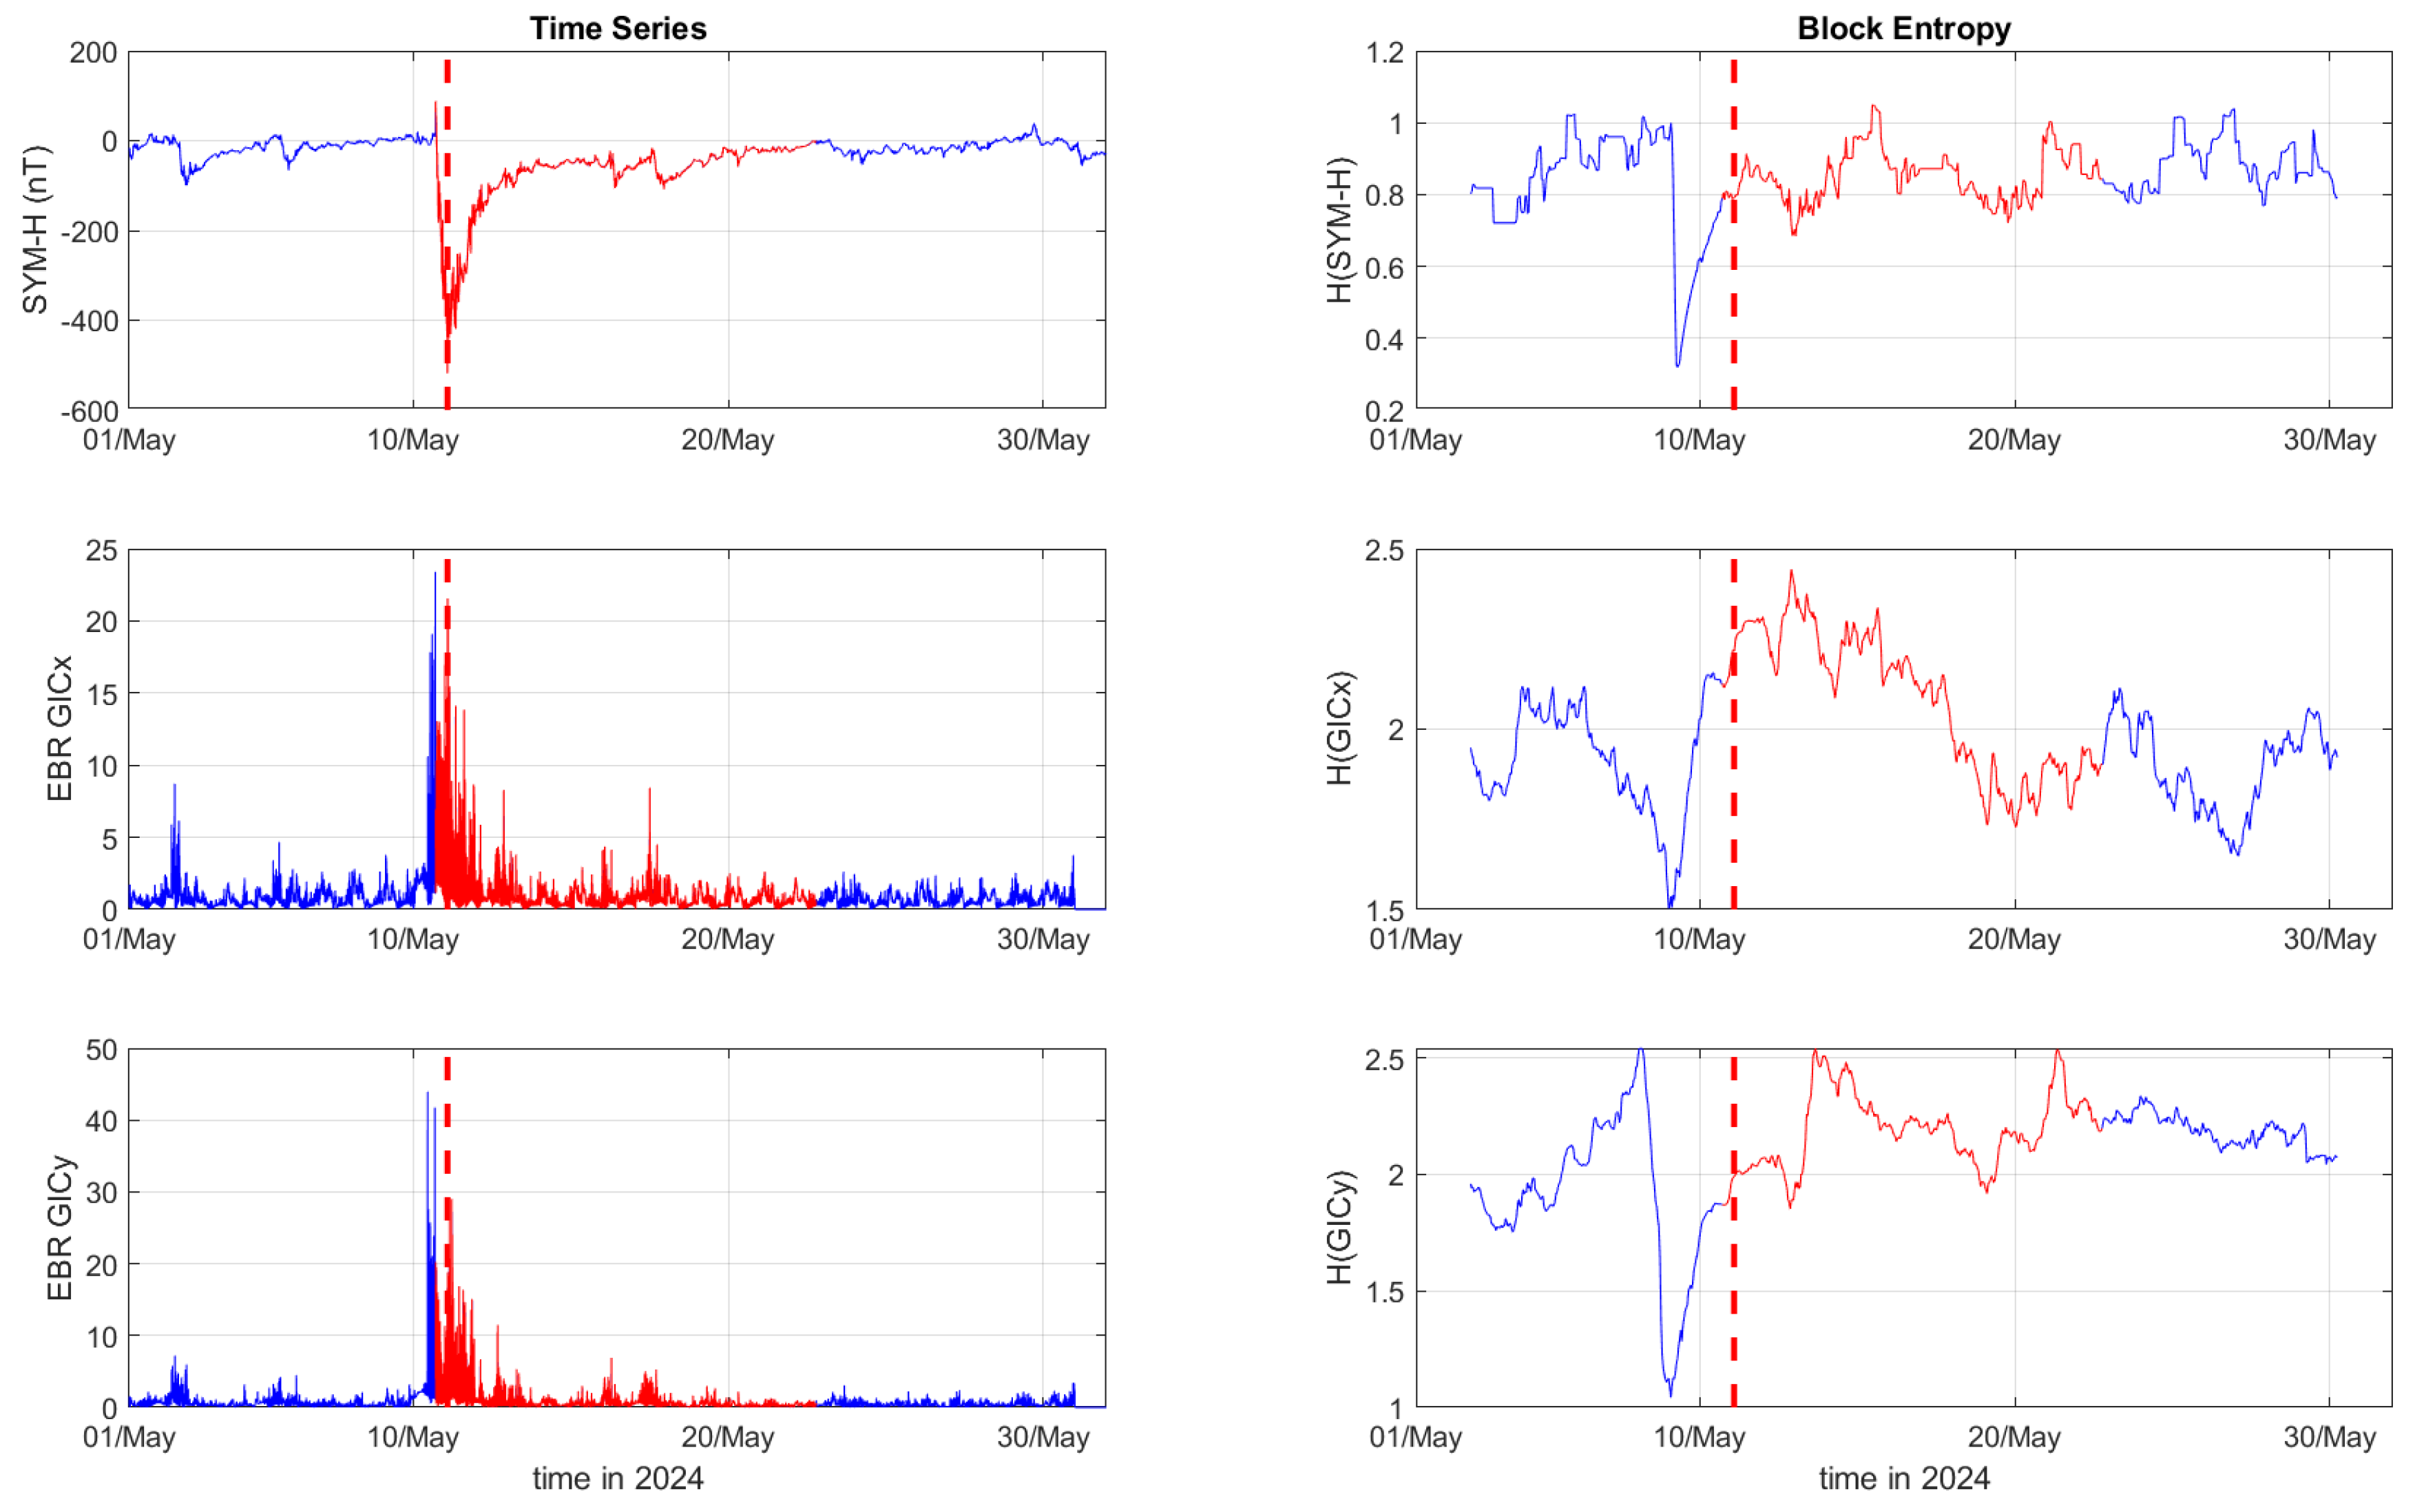
Figure 6), SYM-H index dropped to -518 nT at 02:14:00 UT on May 11. The GICy index reached the maximum values of 76.6 for CLF, 56.6 for CTS and 44.0 for EBR. Similarly, the GICx index obtained the peak values 38.5 for CLF, 51.9 for CTS and 23.4 for EBR. These observations are shown in the left panels of
Figure 1,
Figure 2,
Figure 3,
Figure 4,
Figure 5 and
Figure 6.
The right panels of
Figure 1,
Figure 2 and
Figure 3 display the Block entropies for the SYM-H, GICx, and GICy indices during March 2015. These panels highlight a characteristic drop in entropy values at 4:10 UT on March 16 preceding the intense magnetic storm on March 17, 2015, signaling the storm’s arrival before the SYM-H index reaches its minimum value. This pattern is evident in the SYM-H, GICx and GICy indices across all three locations (i.e., CLF, CTS and EBR), with a more pronounced manifestation for CLF and CTS. Similarly, the right panels of
Figure 4,
Figure 5 and
Figure 6 illustrate the Block entropies for the SYM-H, GICx, and GICy indices during May 2024. The intense magnetic storm on May 11, 2024, is marked by a distinct drop in entropy values just before the storm, at 7:10 UT on May 9. In this case, the SYM-H index exhibits a sharper and more abrupt decline in entropy, closer to the storm’s onset, with a faster recovery compared to the March 2015 storm. A similar trend is followed by the Block entropies of the GIC indices for CLF, CTS and EBR; however, for GICy, the drop in entropy values lasts longer and recovers more slowly.
4. Discussion
GICs at low and middle latitudes are associated with ionospheric source fields distinct from those observed at high latitudes, such as auroral electrojets. Kappenman (2005) [
38] identifies the source of sustained GICs at low and middle latitudes as high rates of geomagnetic field variation, typically driven by impulsive increases in solar wind dynamic pressure or ring current intensification. In these regions, the maximum time variation of the horizontal magnetic field component (
) often occurs during the abrupt storm onset rather than the main phase, resulting in heightened vulnerability during these periods [
39]. The majority of intense GICs appear to result from sudden impulses (SIs) or sudden storm commencements (SSCs) that typically precede magnetic storms. SIs are triggered by enhanced magnetopause currents caused by the compression of the magnetosphere by solar plasma arriving after extreme solar events, such as coronal mass ejections (CMEs) or corotating interaction regions (CIRs) [
40]. Notably, large voltages at middle latitudes during the recovery phase of magnetic storms are linked to Pc5 pulsations (e.g., [
21,
41]).
Marshall et al. (2011) [
34] introduced a GIC risk level scale based on GIC index thresholds derived from a relative probability model. The risk levels — “very low,” “low,” “moderate,” “high,” and “extreme” — correspond to GICy index values of “≤50”, “50-100”, “100-250”, “250-600” and “>600”, respectively. For GICx, the thresholds are halved: “≤25”, “25-50”, “50-125”, “125-300” and “>300”. Tozzi et al. (2019a) [
10] and Boutsi et al. (2023) [
11] suggest calibrating these thresholds for middle-latitude countries. However, as this is a demanding task beyond the scope of the current study, we have used the original thresholds for an initial risk level assessment, acknowledging that this approach may underestimate the actual risk.
Table 3 presents the maximum GIC index values for the two storm events. During the St. Patrick’s Day storm, most GIC index values are in the “Very Low” risk level on the GIC risk scale [
34], except for the GICx index at CLF and CTS, which exceed this level. For the Mother’s Day (or Gannon) storm, most maximum GIC index values are within the "Low" risk level, except for the GICx index at CTS, which reaches the "Moderate" level, and the GICx and GICy indices at EBR, which fall below the "Low" range.
We observe that the GIC index values are generally higher for the May 2024 storm, except for the GICx index at CLF, where the maximum value is slightly greater during the St. Patrick’s Day storm (39.0) compared to the Mother’s Day (or Gannon) storm (38.5). Additionally, GIC index values tend to decrease from north to south (CLF to EBR), with the sole exception of GICx at CTS, which reaches a peak value of 51.9. This deviation at CTS could be attributed to various factors, such as ionospheric current systems (e.g., storm-time ring currents), which might have had stronger or more focused activity near CTS during this event, amplifying the observed GIC response. Variations in the orientation and intensity of the driving geomagnetic field fluctuations at CTS could also play a role. Further analysis, including detailed modeling of local conductivity profiles and ionospheric current configurations, would be necessary to fully understand this exception.
We find that the entropy values of the SYM-H and GIC indices are higher in the time interval before the storm than during its main and recovery phases. Therefore, our findings clearly indicate a transition from a state with higher complexity or less order prior to the storm to a state with less complexity or increased order during the storm and its recovery phase. These findings align with earlier studies analyzing the entropy of geomagnetic activity indices [
42,
43] and more recent studies on the entropy analysis of Swarm magnetic and electric field data [
14,
15], as well as Swarm indices [
44].
More specifically, it becomes apparent that for the time period before the onset of each storm, all entropy values for the 2024 case are lower than their corresponding values for the 2015 storm. This is an interesting finding and might indicates that the entire magnetosphere-ionosphere coupling system was already disturbed before the storm’s onset on the 10th of May, i.e. the system was already in a preconditioned state, which could explain why the effect of the interplanetary disturbance was so pronounced (for a previous example on a similar case see [
45]), leading to the biggest drop in Dst/SYM-H indices, and thus the greatest magnetic storm of the current solar cycle. However, further analyses would be required to support this hypothesis.
Another feature of note, for the 2015 storm, is that the relative drop in Block entropy for the SYM-H index is about 50%, as it reaches values of approximately 0.5 compared to its pre-storm level which is around 1, whereas for the GIC indices the reduction is smaller percentagewise, but appears wider with respect to time, despite the fact that the same temporal window was used for the analysis of all signals. For the 2024 case, the relative reduction of entropy for the GIC indices is greater than that of the SYM-H index, showcasing that this storm was not only a more intense event in space, but that had a greater geoeffectiveness on the ground as well. For this storm too, the temporal profiles of the drop in entropy are wider than the one for the SYM-H. This latter observation could be a feature of the methodology responsible for the production of the GIC index itself, but it could also indicate that Block entropies can be utilized as a more descriptive measure of the temporal extend of geomagnetic disturbances.
Finally, the return of the Block entropy of the GIC index, especially its Y component, to pre-storm levels is a much more gradual process compared to the return of the SYM-H index itself, or its corresponding Block entropy. This also highlights how the entropy of GICy provides a better viewpoint to study the disturbance of the geomagnetic environment as it clearly shows that the effect of magnetic storms can extend to several weeks after the main phase, as the entire system slowly relaxes back to its previous state, even when the SYM-H index itself has returned to typical quiescence values.
5. Conclusions
Information theory offers a robust framework for quantifying the information content and dynamics of complex systems, such as the magnetosphere-ionosphere coupling system (see the recent reviews by Balasis et al., 2023 [
12] and McGranaghan, 2024 [
46], as well as the editorial by Wing and Balasis, 2024 [
13]).
In particular, information theory has been successfully applied to study the Earth’s magnetosphere [
12,
14,
43,
47,
48,
49,
50,
51,
52,
53,
54,
55,
56], and Sun [
57,
58,
59,
60,
61]. Information theory can help untangle the solar wind drivers of a magnetospheric phenomenon with construct such as conditional mutual information [
51,
52,
62,
63,
64].
In this study, we have analyzed 1-month-long time series for March 2015 and May 2024 of the SYM-H geomagnetic activity index and GIC indices in three middle latitude observatories, using the information theoretical measure of Block entropy.
Just by producing the GIC indices from ground-based data we can see the enhanced effect of the Mother’s Day (or Gannon) superstorm of 2024 compared to the St. Patrick’s event of 2015, as half of the indices rose to the next risk level (from "Very Low" to "Low and from "Low" to "Moderate"). Additionally, the first increase of the GIC index takes place before the storm onset (especially for the Y component), while the peak of the indices also occurs before the peak of the storm, showcasing how the GIC indices can be a valuable tool for the study of geomagnetic disturbances, related to both the ring current as well as the various ionospheric current systems.
Coupled to the above, the Block entropy analysis illustrates that before the onset of the May 2024 storm, the geomagnetic system exhibited lower entropy values compared to the March 2015 case, indicating that might the relevant current systems were already disturbed, or had not completely returned to their quiet phase, and thus were more susceptible to new disturbances. Furthermore, the entropy analysis of the GIC indices exhibit wider temporal profiles and describe from a new viewpoint the relaxation process of the system, as it gradually returns to its pre-storm phase. Therefore, this kind of analysis can provide new perspectives to scientists and space operators to better estimate the effectiveness of incoming solar events and the general susceptibility of geospace to such disruptions.
Author Contributions
Conceptualization, G.B.; methodology, G.B., A.Z.B. and C.B.; software, A.Z.B., C.P. and C.B.; investigation, A.Z.B., C.P., C.B. and E.Z.; writing—original draft preparation, G.B., A.Z.B., C.P. and C.B.; writing—review and editing, O.G. All authors have read and agreed to the published version of the manuscript.
Funding
This study has been supported as part of Swarm DISC (Data, Innovation, and Science Cluster) activities, funded by ESA contract no. 4000109587.
Institutional Review Board Statement
Not applicable.
Informed Consent Statement
Not applicable.
Data Availability Statement
Acknowledgments
The authors acknowledge the Kyoto World Data Center (WDC) for Geomagnetism and the observatories that produce and make SYM-H index available at
http://wdc.kugi.kyoto-u.ac.jp/.
Conflicts of Interest
The authors declare no conflicts of interest.
References
- Pirjola, R. Geomagnetically induced currents during magnetic storms. IEEE Transactions on Plasma Science 2000, 28(6), 1867–1873. [Google Scholar] [CrossRef]
- Daglis, I.A.; Baker, D.N.; Galperin, Y.; Kappenman, J.G.; Lanzerotti, L.J. Technological impacts of space storms: Outstanding issues. Eos Trans. Am. Geophys. Union 2001, 82, 585, 591–592. [Google Scholar] [CrossRef]
- Daglis, I.A. Geospace storm dynamics. In Effects of space weather on technology infrastructure. NATO Science Series II: Mathematics, Physics and Chemistry; Daglis, I.A., Ed.; Springer Netherlands: Dordrecht, 2004; pp. 27–42. [Google Scholar] [CrossRef]
- Baker, D.N.; Daly, E.; Daglis, I.A.; Kappenman, J.G.; Panasyuk, M. Effects of Space Weather on Technology Infrastructure. Space Weather 2004, 2. [Google Scholar] [CrossRef]
- Ngwira, C.M.; Pulkkinen, A.; McKinnell, L.A.; Cilliers, P.J. Improved modeling of geomagnetically induced currents in the South African power network. Space Weather 2008, 6(11), S11004. [Google Scholar] [CrossRef]
- Matandirotya, E.; Cilliers, P.J.; Van Zyl, R.R. Modeling geomagnetically induced currents in the South African power transmission network using the finite element method. Space Weather 2015, 13, 185–195. [Google Scholar] [CrossRef]
- Viljanen, A.; Pirjola, R. Geomagnetically induced currents in the Finnish high-voltage power system. Surveys in Geophysics 1994, 15(4), 383–408. [Google Scholar] [CrossRef]
- Pirjola, R.; Pulkkinen, A.; Viljanen, A. Studies of space weather effects on the Finnish natural gas pipeline and on the Finnish high-voltage power system. Advances in Space Research 2003, 31(4), 795–805. [Google Scholar] [CrossRef]
- Torta, J.M.; Marsal, S.; Quintana, M. Assessing the hazard from geomagnetically induced currents to the Spanish entire high-voltage power network in Spain. Earth, Planets and Space 2014, 66, 87. [Google Scholar] [CrossRef]
- Tozzi, R.; De Michelis, P.; Coco, I.; Giannattasio, F. A preliminary risk assessment of geomagnetically induced currents over the Italian territory. Space Weather 2019a, 17, 46–58. [Google Scholar] [CrossRef]
- Boutsi, A.Z.; Balasis, G.; Dimitrakoudis, S.; Daglis, I.A.; Tsinganos, K.; Papadimitriou, C.; Giannakis, O. Investigation of the geomagnetically induced current index levels in the Mediterranean region during the strongest magnetic storms of solar cycle 24. Space Weather 2023, 21, e2022SW003122. [Google Scholar] [CrossRef]
- Balasis, G.; Balikhin, M.A.; Chapman, S.C. et al. Complex Systems Methods Characterizing Nonlinear Processes in the Near-Earth Electromagnetic Environment: Recent Advances and Open Challenges. Space Sci Rev 2023a, 219, 38. [Google Scholar] [CrossRef]
- Wing, S.; Balasis, G. Preface: Information theory and machine learning for geospace research. Advances in Space Research 2024, 74(12), 6249–6251. [Google Scholar] [CrossRef]
- Papadimitriou, C.; Balasis, G.; Boutsi, A.Z.; Daglis, I.A.; Giannakis, O.; Anastasiadis, A.; De Michelis, P.; Consolini, G. Dynamical Complexity of the 2015 St. Patrick’s Day Magnetic Storm at Swarm Altitudes Using Entropy Measures. Entropy 2020, 22, 574. [Google Scholar] [CrossRef]
- Balasis, G.; Papadimitriou, C.; Boutsi, A.Z.; Daglis, I.A.; Giannakis, O.; Anastasiadis, A.; De Michelis, P.; Consolini, G. Dynamical complexity in Swarm electron density time series using Block entropy. Europhys. Lett. 2020, 131, 69001. [Google Scholar] [CrossRef]
- Marshall, R. A.; Waters, C. L.; Sciffer, M. D. Spectral analysis of pipe-to-soil potentials with variations of the Earth’s magnetic field in the Australian region. Space Weather 2010, 8, S05002. [Google Scholar] [CrossRef]
- Boteler, D.H.; Pirjola, R.J.; Nevanlinna, H. The effects of geomagnetic disturbances on electrical systems at the earth’s surface. Advances in Space Research 1998, 22(1), 17–27. [Google Scholar] [CrossRef]
- Kappenman, J.G. An introduction to power grid impacts and vulnerabilities from space weather. In Space storms and space weather hazards. NATO Science Series (Series II: Mathematics, Physics and Chemistry; Daglis, I.A., Ed.; Springer Netherlands: Dordrecht, 2001; pp. 335–361. [Google Scholar] [CrossRef]
- Mayaud, P.N. Derivation, Meaning, and Use of Geomagnetic Indices. In Geophys. Monogr. Ser.; American Geophysical Union (AGU): Washington, DC, 1980. [Google Scholar] [CrossRef]
- Matzka, J.; Stolle, C.; Yamazaki, Y.; Bronkalla, O.; Morschhauser, A. The geomagnetic Kp index and derived indices of geomagnetic activity. Space Weather 2021, 19(5), e2020SW002641. [Google Scholar] [CrossRef]
- Tozzi, R.; Coco, I.; De Michelis, P.; Giannattasio, F. Latitudinal dependence of geomagnetically induced currents during geomagnetic storms. Annals of Geophysics 2019b, 62(4), 448. [Google Scholar] [CrossRef]
- Pulkkinen, A.; Bernabeu, E.; Eichner, J.; Viljanen, A.; Ngwira, C. Regional-scale high-latitude extreme geoelectric fields pertaining to geomagnetically induced currents. Earth, Planets and Space 2015, 67, 93. [Google Scholar] [CrossRef]
- Astafyeva, E.; Zakharenkova, I.; Förster, M. Ionospheric response to the 2015 St. Patrick’s Day storm: A global multi-instrumental overview. J. Geophys. Res. Space Physics 2015, 120, 9023–9037. [Google Scholar] [CrossRef]
- Nayak, C.; Tsai, L.-C.; Su, S.-Y.; Galkin, I.A.; Tan, A.T.K.; Nofri, E.; Jamjareegulgarn, P. Peculiar features of the low-latitude and midlatitude ionospheric response to the St. Patrick’s Day geomagnetic storm of 17 March 2015. J. Geophys. Res. Space Physics 2016, 121, 7941–7960. [Google Scholar] [CrossRef]
- D’Angelo, G.; Piersanti, M.; Alfonsi, L.; Spogli, L.; Clausen, L.B.N.; Coco, I.; Li, G.; Baiqi, N. The response of high latitude ionosphere to the 2015 St. Patrick’s day storm from in situ and ground based observations. Advances in Space Research 2018, 62, 638–650. [Google Scholar] [CrossRef]
- Tulasi Ram, S.; Veenadhari, B.; Dimri, A.P.; Bulusu, J.; Bagiya, M.; Gurubaran, S. et al. Super-intense geomagnetic storm on 10–11 May 2024: Possible mechanisms and impacts. Space Weather 2024, 22, e2024SW004126. [Google Scholar] [CrossRef] [PubMed]
- Hayakawa, H.; Ebihara, Y.; Mishev, A.; Koldobskiy, S.; Kusano, K., Bechet, S. et al. The solar and geomagnetic storms in may 2024: A flash data report. arXiv preprint, 2024. [CrossRef]
- Dungey, J.W. Interplanetary magnetic field and the auroral zones. Phys. Rev. Lett. 1961, 6, 47–48. [Google Scholar] [CrossRef]
- Papitashvili, N.E.; King, J.H. (2020), "OMNI 1-min Data" [SYM-H], NASA Space Physics Data Facility, Accessed on (Nov 2024). [CrossRef]
- Balasis, G.; Daglis, I.A.; Contoyiannis, Y.; Potirakis, S.M.; Papadimitriou, C.; Melis, N.S.; GIannakis, O.; Papaioannou, A.; Anastasiadis, A.; Kontoes, C. Observation of intermittency-induced critical dynamics in geomagnetic field time series prior to the intense magnetic storms of March, June, and December 2015. J. Geophys. Res. Space Phys. 2018, 123, 4594–4613. [Google Scholar] [CrossRef]
- De Michelis, P.; Pignalberi, A.; Consolini, G.; Coco, I.; Tozzi, R.; Pezzopane, M.; Giannattasio, F.; Balasis, G. On the 2015 St. Patrick’s Storm Turbulent State of the Ionosphere: Hints From the Swarm Mission. J. Geophys. Res. Space Phys. 2020, 125, e2020JA027934. [Google Scholar] [CrossRef]
- Consolini, G.; Tozzi, R.; De Michelis, P.; Coco, I.; Giannattasio, F.; Pezzopane, F.; Marcucci, M.F.; Balasis, G. High-latitude polar pattern of ionospheric electron density: scaling features and IMF dependence. J. Atmos.-Sol.-Terr. Phys. 2021, 217, 105531. [Google Scholar] [CrossRef]
- Cagniard, L. Basic theory of the magneto-telluric method of geophysical prospecting. Geophysics 1953, 18(3), 605–635. [Google Scholar] [CrossRef]
- Marshall, R. A.; Smith, E. A.; Francis, M. J.; Waters, C. L.; Sciffer, M. D. A preliminary risk assessment of the Australian region power network to space weather. Space Weather 2011, 9, S10004. [Google Scholar] [CrossRef]
- Shannon, C.E. A mathematical theory of communication. Bell Syst. Tech. J. 1948, 27, 379–423. [Google Scholar] [CrossRef]
- Ebeling W. and Nicolis G. Word frequency and entropy of symbolic sequences: A dynamical perspective [Journal] // Chaos, Solitons Fractals. - 1992. - Vol. 2. - pp. 635–650.
- Nicolis G. and Gaspard P. Toward a probabilistic approach to complex systems [Journal] // Chaos, Solitons Fractals. - 1994. - Vol. 4. - pp. 41–57.
- Kappenman, J.G. An overview of the impulsive geomagnetic field disturbances and power grid impacts associated with the violent Sun-Earth connection events of 29–31 October 2003 and a comparative evaluation with other contemporary storms. Space Weather 2005, 3(8), S08C01. [Google Scholar] [CrossRef]
- Kappenman, J.G. Storm sudden commencement events and the associated geomagnetically induced current risks to ground-based systems at low-latitude and midlatitude locations. Space Weather 2003, 1(3), 1016. [Google Scholar] [CrossRef]
- Gosling, J.; Pizzo, V. Formation and evolution of corotating interaction regions and their three dimensional structure. Space Science Reviews 1999, 89, 21–52. [Google Scholar] [CrossRef]
- Hejda, P.; Bochníček, J. Geomagnetically induced pipe-to-soil voltages in the Czech oil pipelines during October-November 2003. Annales Geophysicae 2005, 23, 3089–3093. [Google Scholar] [CrossRef]
- Balasis, G.; Daglis, I.A.; Papadimitriou, C.; Kalimeri, M.; Anastasiadis, A.; Eftaxias, K. Dynamical complexity in Dst time series using non-extensive Tsallis entropy. Geophys. Res. Lett. 2008, 35, L14102. [Google Scholar] [CrossRef]
- Balasis, G.; Daglis, I.A.; Papadimitriou, C.; Kalimeri, M.; Anastasiadis, A.; Eftaxias, K. Investigating dynamical complexity in the magnetosphere using various entropy measures. J. Geophys. Res. Space Phys. 2009, 114, A00D06. [Google Scholar] [CrossRef]
- Balasis, G.; Boutsi, A.Z.; Papadimitriou, C.; Potirakis, S.M.; Pitsis, V.; Daglis, I.A.; Anastasiadis, A.; Giannakis, O. Investigation of dynamical complexity in Swarm-derived geomagnetic activity indices using information theory. Atmosphere 2023b, 14, 890. [Google Scholar] [CrossRef]
- Balasis, G.; Daglis, I.A.; Kapiris, P.; Mandea, M.; Vassiliadis, D.; Eftaxias, K. From pre-storm activity to magnetic storms: a transition described in terms of fractal dynamics. Ann. Geophys. 2006, 24, 3557–3567. [Google Scholar] [CrossRef]
- McGranaghan, R.M. Complexity Heliophysics: A Lived and Living History of Systems and Complexity Science in Heliophysics. Space Sci Rev 2024, 220, 52. [Google Scholar] [CrossRef]
- Balasis, G.; Donner, R.V.; Potirakis, S.M.; Runge, J.; Papadimitriou, C.; Daglis, I.A.; Eftaxias, K.; Kurths, J. Statistical mechanics and information-theoretic perspectives on complexity in the earth system. Entropy 2013, 15, 4844–4888. [Google Scholar] [CrossRef]
- Stumpo, M.; Consolini, G.; Alberti, T.; Quattrociocchi, V. Measuring Information Coupling between the Solar Wind and the Magnetosphere–Ionosphere System. Entropy 2020, 22, 276. [Google Scholar] [CrossRef]
- Johnson, J. R.; Wing, S. A solar cycle dependence of nonlinearity in magnetospheric activity. J. Geophys. Res. 2005, 110, A04211. [Google Scholar] [CrossRef]
- Johnson, J.R.; Wing, S. External versus internal triggering of substorms: An information-theoretical approach. Geophys. Res. Lett. 2014, 41, 5748–5754. [Google Scholar] [CrossRef]
- Wing, S.; Johnson, J.R.; Camporeale, E.; Reeves, G.D. Information theoretical approach to discovering solar wind drivers of the outer radiation belt. J. Geophys. Res. Space Phys. 2016, 121, 9378–9399. [Google Scholar] [CrossRef]
- Wing, S.; Johnson, J.R.; Turner, D.L.; Ukhorskiy, A.Y.; Boyd, A.J. Untangling the solar wind and magnetospheric drivers of the radiation belt electrons. J. Geophys. Res. Space Phys. 2022, 127, e2021JA030246. [Google Scholar] [CrossRef]
- Johnson, J.R.; Wing, S.; Camporeale, E. Transfer entropy and cumulant-based cost as measures of nonlinear causal relationships in space plasmas: applications to Dst. Ann. Geophys. 2018, 36, 945–952. [Google Scholar] [CrossRef]
- Runge, J.; Balasis, G.; Daglis, I.A.; Papadimitriou, C.; Donner, R.V. Common solar wind drivers behind magnetic storm–magnetospheric substorm dependency. Sci. Rep. 2018, 8, 1–10. [Google Scholar] [CrossRef]
- Manshour, P.; Balasis, G.; Consolini, G.; Papadimitriou, C.; Paluš, M. Causality and Information Transfer Between the Solar Wind and the Magnetosphere–Ionosphere System. Entropy 2021, 23, 390. [Google Scholar] [CrossRef] [PubMed]
- Osmane, A.; Savola, M.; Kilpua, E.; Koskinen, H.; Borovsky, J.E.; Kalliokoski, M. Quantifying the non-linear dependence of energetic electron fluxes in the Earth’s radiation belts with radial diffusion drivers. Ann. Geophys. 2022, 40, 37–53. [Google Scholar] [CrossRef]
- Consolini, G.; Tozzi, R.; De Michelis, P. Complexity in the sunspot cycle. A&A 2009, 506, 1381–1391. [Google Scholar] [CrossRef]
- Wing, S.; Johnson, J.; Vourlidas, A. Information theoretic approach to discovering causalities in the solar cycle. Ap J 2018, 854, 85. [Google Scholar] [CrossRef]
- Snelling, J.M.; Johnson, J.R.; Willard, J.; Nurhan, Y.; Homan, J.; Wing, S. Information theoretical approach to understanding flare waiting times. Astrophys. J. 2020, 899, 148. [Google Scholar] [CrossRef]
- Johnson, J.R.; Wing, S.; O’ffill, C.; Neupane, B. Information horizon of solar active regions. Astrophys. J. Lett. 2023, 947(1), L8. [Google Scholar] [CrossRef]
- Wing, S.; Johnson, J.R.; Dikpati, M.; Nurhan, Y.I. Information-theory-based System-level Babcock–Leighton Flux Transport Model–Data Comparisons. Astrophys. J. Lett. 2024, 977, L15. [Google Scholar] [CrossRef]
- Wyner, A.D. A definition of conditional mutual information for arbitrary ensembles. Info. Control 1978, 38, 51–59. [Google Scholar] [CrossRef]
- Wing, S.; Johnson, J.R. Applications of information theory in solar and space physics. Entropy 21 2019, 2, 140. [Google Scholar] [CrossRef]
- Manshour, P.; Papadimitriou, C.; Balasis, G.; Paluš, M. Causal inference in the outer radiation belt: Evidence for local acceleration. Geophysical Research Letters 2024, 51, e2023GL107166. [Google Scholar] [CrossRef]
Figure 1.
Time series of SYM-H, GICx and GICy index of the Chambon la Forêt station (left column) and their corresponding Block Entropies (right) for March of 2015. Red color marks the duration of the storm, while the dashed, red line corresponds to the peak of the storm.
Figure 1.
Time series of SYM-H, GICx and GICy index of the Chambon la Forêt station (left column) and their corresponding Block Entropies (right) for March of 2015. Red color marks the duration of the storm, while the dashed, red line corresponds to the peak of the storm.
Figure 2.
Time series of SYM-H, GICx and GICy index of the Castello Tesino station (left column) and their corresponding Block Entropies (right) for March of 2015. Red color marks the duration of the storm, while the dashed, red line corresponds to the peak of the storm.
Figure 2.
Time series of SYM-H, GICx and GICy index of the Castello Tesino station (left column) and their corresponding Block Entropies (right) for March of 2015. Red color marks the duration of the storm, while the dashed, red line corresponds to the peak of the storm.
Figure 3.
Time series of SYM-H, GICx and GICy index of the Ebro station (left column) and their corresponding Block Entropies (right) for March of 2015. Red color marks the duration of the storm, while the dashed, red line corresponds to the peak of the storm.
Figure 3.
Time series of SYM-H, GICx and GICy index of the Ebro station (left column) and their corresponding Block Entropies (right) for March of 2015. Red color marks the duration of the storm, while the dashed, red line corresponds to the peak of the storm.
Figure 4.
Time series of SYM-H, GICx and GICy index of the Chambon la Forêt station (left column) and their corresponding Block Entropies (right) for May of 2024. Red color marks the duration of the storm, while the dashed, red line corresponds to the peak of the storm.
Figure 4.
Time series of SYM-H, GICx and GICy index of the Chambon la Forêt station (left column) and their corresponding Block Entropies (right) for May of 2024. Red color marks the duration of the storm, while the dashed, red line corresponds to the peak of the storm.
Figure 5.
Time series of SYM-H, GICx and GICy index of the Castello Tesino station (left column) and their corresponding Block Entropies (right) for May of 2024. Red color marks the duration of the storm, while the dashed, red line corresponds to the peak of the storm.
Figure 5.
Time series of SYM-H, GICx and GICy index of the Castello Tesino station (left column) and their corresponding Block Entropies (right) for May of 2024. Red color marks the duration of the storm, while the dashed, red line corresponds to the peak of the storm.
Figure 6.
Time series of SYM-H, GICx and GICy index of the Ebro station (left column) and their corresponding Block Entropies (right) for May of 2024. Red color marks the duration of the storm, while the dashed, red line corresponds to the peak of the storm.
Figure 6.
Time series of SYM-H, GICx and GICy index of the Ebro station (left column) and their corresponding Block Entropies (right) for May of 2024. Red color marks the duration of the storm, while the dashed, red line corresponds to the peak of the storm.
Table 1.
Strongest magnetic storms of 2015 (solar cycle 24) and 2024 (solar cycle 25). Storm date, time and minimum SYM-H index value reached are given in the second, third and fourth columns, respectively.
Table 1.
Strongest magnetic storms of 2015 (solar cycle 24) and 2024 (solar cycle 25). Storm date, time and minimum SYM-H index value reached are given in the second, third and fourth columns, respectively.
| Case |
Storm Date |
Storm Time (UT) |
SYM-H (nT) |
| #1 |
17 March 2015 |
22:47:00 |
-234 |
| #2 |
11 May 2024 |
02:14:00 |
-518 |
Table 2.
Geographic and altitude-adjusted corrected geomagnetic (AACGM) coordinates of the magnetic observatories in the present study; L-shell values (in geocentric coordinates, height above sphere Re = 6371.2 km) are also shown in the last column.
Table 2.
Geographic and altitude-adjusted corrected geomagnetic (AACGM) coordinates of the magnetic observatories in the present study; L-shell values (in geocentric coordinates, height above sphere Re = 6371.2 km) are also shown in the last column.
| Station |
GLat
|
GLon
|
Alt. (m) |
MLat
|
MLon
|
L
|
| Chambon la Forêt (CLF) |
48.025 |
2.260 |
145 |
42.801 |
78.884 |
1.909 |
| Castello Tesino (CTS) |
46.047 |
11.649 |
1175 |
40.404 |
86.434 |
1.758 |
| Ebro (EBR) |
40.957 |
0.333 |
531.5 |
33.399 |
75.867 |
1.472 |
Table 3.
Maximum GIC index values calculated for each magnetic storm and their corresponding risk levels, according to Marshall et al. (2011) [
34].
Table 3.
Maximum GIC index values calculated for each magnetic storm and their corresponding risk levels, according to Marshall et al. (2011) [
34].
| |
March 2015 |
May 2024 |
| Observatory |
GICy |
GICx |
GICy |
GICx |
| |
Risk Level |
Risk Level |
Risk Level |
Risk Level |
| CLF |
23.3 |
39.0 |
76.6 |
38.5 |
| |
Very Low |
Low |
Low |
Low |
| CTS |
20.7 |
34.7 |
56.6 |
51.9 |
| |
Very Low |
Low |
Low |
Moderate |
| EBR |
16.2 |
21.9 |
44.0 |
23.4 |
| |
Very Low |
Very Low |
Very Low |
Very Low |
|
Disclaimer/Publisher’s Note: The statements, opinions and data contained in all publications are solely those of the individual author(s) and contributor(s) and not of MDPI and/or the editor(s). MDPI and/or the editor(s) disclaim responsibility for any injury to people or property resulting from any ideas, methods, instructions or products referred to in the content. |
© 2025 by the authors. Licensee MDPI, Basel, Switzerland. This article is an open access article distributed under the terms and conditions of the Creative Commons Attribution (CC BY) license (http://creativecommons.org/licenses/by/4.0/).