
Submitted:
02 January 2025
Posted:
06 January 2025
You are already at the latest version
Abstract
Research to study the role of brown algae Padina sp. as a capping agent in the synthesis ZnO nanoparticles, characteristics of ZnO nanoparticles, and the effect of cotton fabric modification through the addition of ZnO nanoparticles and/or silane compounds on antibacterial and antifungal activities has been conducted. The synthesis of ZnO nanoparticles uses green synthesis and then characterization using UV/VIS/NIR, ATR-FTIR, XRD, PSA, and SEM-EDS. In-situ depositing of ZnO nanoparticles on cotton fabrics and addition of silane compounds. Characterization of modified and unmodified cotton fabrics to determine the antibacterial and antifungal activity tests were carried out by disc diffusion method through measurement of the diameter of the inhibition zone against Pseudomonas aeruginosa, Staphylococcus epidermidis, and Malassezia furfur bacteria. Characterization of ZnO nanoparticles shows absorption at a wavelength of 357 nm; the number of waves is 450 cm-1; The peak of diffraction is at an angle of 36.14; Crystal size of 15.35 nm; Distribution of heterogeneous particles; Particle size in the range of 1.74-706 nm (PSA) and 45-297 nm (SEM); irregular particle shape. The results of the best antibacterial and antifungal activity in cotton+HDTMS+ZnO nanoparticles (K8) and cotton + ZnO nanoparticles+HDTMS/MTMS (K4).
Keywords:
Brown algae extract Padina sp.
; cotton fabric
; green synthesis
; silane compounds
; ZnO nanoparticles
1. Introduction
Cotton, spandex, polyester, and nylon are a few textile materials that can be made into goods with antibacterial and antifouling qualities [1]. Cotton is one of the natural fibres derived from plants with the main constituent of cellulose and is used as a raw material for the textile industry. Cotton fabric has the property of easily absorbing water molecules (hygroscopic) and biodegradable [2]. The hygroscopic properties of cotton fabric can facilitate sweat absorption so that cotton fabric becomes more easily dirty and easily overgrown by microorganisms. Therefore, cotton fabrics can be modified to have resistance to microorganism and antifouling attacks by using zinc oxide (ZnO) nanoparticles and silane compounds.
ZnO nanoparticles have the ability to inhibit microbial activity by damaging cell membranes and producing ROS (Reactive Oxygen Species) which results in oxidative stress in microbes [3,4]. The antimicrobial properties of ZnO nanoparticles can protect cotton fabrics from the growth of microorganisms that can reduce the quality of the fabric, such as color fading. Apart from being an antimicrobial, ZnO nanoparticles have several advantages, namely being biocompatible, photocatalytic, and inhibiting UV rays. ZnO nanoparticles have a white color that does not change the appearance of the fabric and is cheaper to produce compared to other nanoparticles, such as silver nanoparticles. The production of ZnO nanoparticles can be carried out by two approaches to nanoparticle synthesis, namely by top-down (physics) and bottom-up (chemical) approaches.
The top-down approach is carried out by breaking down large particles into small particles with a nanometre size through several methods such as the laser beam irradiation method [5] and ball milling [6]. Instead, the bottom-up approach is carried out through the process of chemical reactions from atoms into larger particles in nanometre size. The bottom-up approach can go through several ways such as coprecipitation, sol-gel, and chemical reduction methods. However, both approaches have various weaknesses. The top-down method requires considerable energy use and high costs. Meanwhile, the bottom-up approach uses several chemical reducing materials that are toxic and require considerable costs [7]. Therefore, a method of synthesis of ZnO nanoparticles was developed that requires low cost and is environmentally friendly with a bottom-up approach, namely green synthesis.
The green synthesis method of ZnO nanoparticles can be carried out with the help of ultrasonication [8] and microwave [9] which utilizes secondary metabolite compounds from plant extracts as bio reductors. The ZnO nanoparticles in this study are the result of preparation using brown algae (Padina sp.) because it comes from natural materials that are environmentally friendly. The carbohydrate content and secondary metabolite compounds of Padina sp. in the form of flavonoids, tannins, saponins, alkaloids and other metabolites that have -OH functional groups as bio reducers and capping agents that can prevent particle agglomeration during the synthesis process of ZnO nanoparticles [10,11].
ZnO nanoparticles that have antimicrobial properties can be deposited into cotton fabrics in-situ (one step) and ex-situ (two step). The application of ZnO nanoparticles in the textile industry generally uses the ex-situ method because the synthesis of ZnO nanoparticles is carried out first, then the ZnO nanoparticles are characterized and deposited into the fabric. This method has the advantage of large-scale production, namely the morphology, size, and distribution of the produced ZnO nanoparticles can be controlled. However, the disadvantage of this method is that it is a complicated and inefficient process. In contrast, in-situ methods can produce ZnO nanoparticles that have an uncontrollable morphology, size, and distribution. This method has high efficiency because the creation of ZnO nanoparticles occurs directly on the surface of the fabric. The stronger bond between the fabric fibres and the ZnO nanoparticles causes the fabric to have resistance to washing frequencies [12]. Therefore, this study uses an in-situ method for the deposit of ZnO nanoparticles on cotton fabrics.
Cotton fabrics that have been deposited with ZnO nanoparticles are characterized using UV/VIS/NIR, ATR-FTIR, XRD, and SEM-EDS instruments. Meanwhile, the ZnO nanoparticles that were synthesized independently were characterized using UV/VIS/NIR, ATR-FTIR, XRD, PSA and SEM-EDS instruments.
The functionalization of antifouling properties in cotton fabrics can be obtained through the addition of silane compounds that cause increased hydrophobicity. Octtiltrietoxilane (OTES), hexadecyltrimethoxylan (HDTMS), and methyltrimethoxylane (MTMS) compounds [13,14] which has potential in the modification of textile fabrics.
The silane compounds applied to cotton fabrics are HDTMS, MTMS and HDTMS/MTMS composites. The hydrophobicity of the fabric modification can be determined through contact angle testing. Contact angles can be measured using several methods, namely sessile drops, captive bubbles, and Wilhelmy [15]. The contact angle testing in this study uses the sessile drop method with the Optical Contact Angle Goniometer instrument. In addition, fabrics that have been modified with ZnO nanoparticles and silane compounds are tested for mechanical properties and antimicrobial activity.
There are several types of mechanical property testing, namely tensile strength, compression, shear, hardness, and others. The mechanical properties tested are tensile strength which represents the values of tensile strength, elongation, and modulus young. The analysis of antimicrobial properties was determined by the disc diffusion method using Staphylococcus epidermidis bacteria as gram-positive bacteria and Pseudomonas aeruginosa as gram-negative bacteria and Malassezia furfur fungus.
2. Results and Discussions
Green Synthesis of ZnO Nanoparticles with Brown Algae (Padina sp.)
The green synthesis process in this study used a ratio of the volume of brown algae: early precursor (Zn(NO3)2) 0.01 M:NaOH 0.1 M respectively, which is 1:20:5. The synthesis process began with the addition of chocolate algae extract and an initial precursor (Zn(NO3)2) of 0.01 M to produce a slightly cloudy brown solution caused by chocolate algae extract. Synthesis reactions require heating treatment and controlled time for the reaction to be stable. The green synthesis process can be reviewed before and after the addition of NaOH by marking the presence of white deposits of ZnO nanoparticles. Then, pH measurements can be made on Padina sp., solution (Zn(NO3)2) 0.01 M, brown algae extract Padina sp + solution (Zn(NO3)2) 0.01 M (before adding NaOH), and after adding NaOH. The pH value obtained consecutively was 7.58; 5,35; 6,33; and 10.69 (around 10-11). The addition of NaOH can cause an increase in pH which has a role as a settling agent in the deposition reaction of Zn2+ ions in the initial precursor (Zn(NO3)2) to Zn(OH)2 and then to ZnO nanoparticles.
The green synthesis process of ZnO nanoparticles uses natural material extracts, namely Padina sp. as a bio reducer and capping agent with the possibility of a reaction to reduce Zn2+ ions to Zn+ to Zn0 and then nucleation, growth, and autooxidation into ZnO nanoparticles [16]. The green synthesis process that occurred in this study began with the interaction of biomolecular compounds of brown algae extract Padina sp. with Zn2+ ions from the initial precursor (Zn(NO3)2). After the addition of NaOH, a deposition reaction occurs which is characterized by the formation of metal hydroxides and biomolecular compounds that play a role in binding to the Zn2+ ion cluster which causes the particle surface to be enveloped by negative ions which results in a repulsive force between similar charges so as to prevent particle aggregation [17]. Biomolecular compounds can bind covalently which can be reviewed in Figure 1 [18].
The Zn2+ ion reacts with the hydroxide ions from NaOH to form a milky white suspension mixture. White deposits can be obtained and separated due to the properties of ZnO nanoparticles that are insoluble in water. However, when in the suspension mixture, the compound formed is Zn(OH)2. Meanwhile, the excess OH- ion will react with Zn(OH)2 to form a [Zn(OH)4]2- complex. The H2O molecules present in the mixture and the energy obtained when the solution is stirred using a magnetic stirr, the [Zn(OH)4]2- complex is dissociated again to form Zn2+ and OH- ions which further form solids (powders) of ZnO nanoparticles during the heating process (drying) marked by the release of water vapor [19] . Furthermore, the calcination process of ZnO nanoparticles can improve the crystallinity to be better [20]. The green synthesis process can be reviewed on the reaction scheme shown in Figure 2 [10,17,19,22].
Modification of Cotton Fabric with ZnO Nanoparticles and Silane Compounds
The curing process is carried out on cotton fabrics that are modified with ZnO nanoparticles to bind the material or ZnO nanoparticles to the surface of the fabric to make it stronger and more durable [23]. The results of the modification of ZnO nanoparticles and/or silane compounds did not show a significant qualitative difference because the color of the white cotton fabric was the same as the color of the ZnO nanoparticle deposits and silane compounds which had clear visuals. The results of the modification of cotton fabric can be detailed in Figure 3. After modification, the modified cotton fabric will be characterized and tested for contact angle, mechanical properties, and antimicrobial activity.
Analysis of ZnO Nanoparticle Function Cluster, Cotton Fabric Without and With Modification
Based on the results of UV/VIS/NIR tests in the wavelength range of 200-800 nm, the spectra of ZnO nanoparticles, cotton fabrics, and cotton fabrics + ZnO nanoparticles showed absorption peaks at wavelengths of 327 nm and 357 nm respectively, showing no absorption peaks, and 329 nm. The peak absorption of ZnO nanoparticles is in the wavelength range of 300-380 nm [10]. The peak absorption results can have different values in the research that has been carried out, namely 320 nm [24], 327 nm [25], 355 nm [26], 357 nm [27] and 365 nm [8].
The peak uptake of ZnO nanoparticles varies due to the influence of diverse particle sizes. Particles that are not necessarily uniform certainly have absorption peaks at different wavelengths. The decreasing particle size causes a decrease in absorption and a blue shift (a shift in wavelength from long to short). In addition, there is a decrease in the UV A/UV B ratio and the effect of quantum size on absorbance with changes in particle size [28].
The difference in absorption peaks in cotton fabrics and cotton fabrics deposited with ZnO nanoparticles is found at the wavelength of 329 nm which is estimated to be the wavelength of ZnO nanoparticles. The presence of absorption peaks at these wavelengths indicates that ZnO nanoparticles have been deposited in cotton fabrics. The value of one of the peaks of absorption of ZnO nanoparticles (327 nm) is different from the ZnO nanoparticles deposited in cotton fabrics (329 nm) due to the presence of cotton fabrics which can cause the signal captured by the detector to be less noisy although the difference is not too significant.
Tests that have been carried out with the ATR-FTIR spectrophotometer instrument produce spectral data that shows the interpretation of the functional cluster. The ATR-FTIR K0 spectra shows the peak absorption position at 3323, 3257, 2884, 1637, 1425, 1363, 1312, 1015, and 898 cm-1. Meanwhile, the ATR-FTIR K1 spectra in Figure 11 shows the peak absorption positions of 3323, 3250, 2886, 1636, 1423, 1382, 1312, 1021, 900, and 452 cm-1. Wide absorption peaks in regions 3323, 3257, and 3250 cm-1 with an area range of 3500-3200 cm-1 indicate the presence of vibration stretching of the O-H group from cellulose (cotton) [29].
The peak absorption position in the 2884 and 2886 cm-1 regions showed the presence of vibration stretching of the C-H group derived from polysaccharides in cellulose and brown algae extract compounds used as capping agents in the process of depositing ZnO nanoparticles in situ [30]. The peak absorption in the region of 1637 and 1636 cm-1 is characterized as a water molecule found in cotton fabric (cellulose). Small absorption peaks in the 1425 and 1423 cm-1 regions indicate the presence of CH2 symmetric bending of cellulose. The position of the absorption peak in the regions (1353 and 1382 cm-1) and 1312 cm-1 respectively shows the presence of bending vibration of the C-H and C-O groups. Wide absorption peaks in the 1015 and 1021 cm-1 regions showed a vibration relationship between C-O and O-H stretching in polysaccharides from cellulose. In addition, the peak of uptake in the regions of 898 and 900 cm-1 is characterized as a β-glycosidic relationship with monosaccharides [31].
The ATR-FTIR spectra shows the peak absorption positions of 2362, 2338, 908, 669, and 450 cm-1. The peak of absorption in the region of 2362 cm-1 indicates the presence of a C=O functional group [32]. The position of the absorption peak in the area of 2338 cm-1 indicates the vibration of the stretching of the Amina group (C=N) [33]. In addition, the absorption peak in the area of 908 cm-1 shows the presence of C-H out of plane bending [34]. The peak of absorption in the region of 669 cm-1 is characterized as a Zn-OH functional group [35]. The position of the absorption peak in the region of 450 cm-1 is characterized as a Zn-O functional group that enters the wave number range of the Zn-O functional group, which is 650-400 cm-1 [33,36].
The K0 and K1 spectra have almost the same spectrum, but in K1 there is a differentiating absorption peak at 452 cm-1 which is characterized as the Zn-O functional group. This value indicates that the ZnO nanoparticles deposited in cotton fabrics have been successfully carried out. The comparison of the spectral range of K0, K1, and ZnO nanoparticles at magnification of the 450 and 452 cm-1 regions can be reviewed in Figure 4.
The ZnO nanoparticles formed have a Zn(OH)2 component with the identification of the Zn-OH functional group which indicates that the drying process needs to be studied further so as to produce ZnO nanoparticles that are close to high purity. The peak of uptake found in the spectrum of ZnO nanoparticles indicates the presence of an analyzed organic functional group. This is in accordance with the role of biomolecular compounds contained in chocolate algae extract as a capping agent. The biomolecular compounds that can be predicted, namely alkaloids, are indicated by the identification of C=O, C-H, and C=N functional groups. Biomolecular compounds that play a definite role in green synthesis need to be further studied using compound Eludation such as GC-MS, 13C-NMR, and 1H-NMR analysis.
Analysis of Diffraction Patterns and Crystal Size of ZnO Nanoparticles
Tests that have been carried out with XRD spectrometer instruments produce diffraction pattern data so that the crystal size can be clearly known. The test was carried out on ZnO nanoparticles and cotton fabrics deposited with ZnO (K1) nanoparticles using an angle range of 2θ in the range of 3-90° and 4-80°, respectively. The results of XRD analysis were processed using the X’pert HighScore Plus program to match with the XRD database, namely the Crystallography Open Database (COD) and the OriginLab version 2023b program to determine the FWHM value that can be used in determining crystal size with the Debye-Scherrer equation shown in equation 1 [9]. The diffraction pattern of ZnO nanoparticles and cotton fabrics deposited with ZnO (K1) nanoparticles can be reviewed in Figure 5 and Figure 6.
With:
D = Crystal size (nm)
k = Form factor constant (0.91 for hexagonal shapes)
λ = Wavelength (Cu-Kα1= 0,15406 nm)
β = FWHM (Full Width at Half Maximum) (radian)
θ = X-ray diffraction angle (radian)
Based on Figure 5, the diffraction pattern of ZnO nanoparticles that has been confirmed with COD data 96-900-4180 shows matched peaks at 2θ = 31.63°; 34.3°; 36.14°; 47.42°; 56.52°; 62.76°; 66.28°; 67.87°; 68,92°; 72,54°; 76,84°; and 89.47° with Miller index values (H k L) respectively (1 0 0), (0 0 2), (1 0 1), (1 0 2), (1 0 2), (1 1 0), (1 0 3), (2 0 0), (1 1 2), (2 0 1), (0 0 4), (2 0 2), and (2 0 3). Based on matching with the COD database, the crystal structure of ZnO nanoparticles from green synthesis using Padina sp. forms the hexagonal crystal structure of wurtzite (zincite). In addition, the crystal size of the ZnO nanoparticles from the Debye-Scherrer equation is 15.35 nm at the peak position of the crystal with a miller index value (1 0 1). The resulting peaks have values that are not too different significantly from the COD database. Some unmatched peaks indicate the presence of impurities from compounds derived from the algae extract of Padina sp. so that there can be a decrease in the crystallinity of ZnO nanoparticles. This can occur due to the influence of temperature during the calcination process. Successive increases or decreases in calcination temperature can increase or decrease the crystallinity and crystal size in ZnO nanoparticles [37].
Meanwhile, the diffraction pattern of cotton fabric deposited with ZnO nanoparticles in Figure 15, shows peaks at 2θ = 14.37°; 16.15°; 22.40°; 25.96°; and 34.11° identified as crystalline cellulose. The peaks cannot be identified with the COD database due to the number of phases being more than one. In addition, the ZnO nanoparticles in cotton fabrics are shown at a peak of 35.98°. The peaks are not crystalline (amorphous) and shift somewhat because the identified phases are not dominant compared to the peaks that show crystalline cellulose. The crystal size of ZnO nanoparticles in cotton fabrics can be determined using the Debye-Scherrer equation assuming the phase in which crystals are formed so that a crystal size of 20.43 nm is obtained.
Results of Particle Size and Distribution Analysis of ZnO Nanoparticles
Analysis of particle size and distribution using the Particle Size Analyzer (PSA) instrument has been carried out. The analysis began with the dispersion of ZnO nanoparticles with a concentration of 0.1% (b/v) using ethanol and then sonicated for 30 minutes. The results of the PSA data of ZnO nanoparticles are reviewed in Table 2.
Based on Table 2, PSA data can be obtained which includes PDI (Polydispersity Index) of 0.537 and nanoscale particle size in the range of 1.74-706 nm and microscale particle size in the range of 3,860-5,710 nm. The polydispersity index value is in the range of 0-1 which indicates the particle size distribution. A PDI value close to zero indicates a homogeneous particle distribution while a polydispersity index value of > 0.5 indicates that the particles have a high level of heterogeneity [38]. The results of the PSA data showed that the particles were still not homogeneously distributed which could be reviewed at a PDI value of > 0.5 and the size of the ZnO particles was in the nano and micro regions. The dominant particle size is on the nanoscale (1-1000 nm) with a total percentage of 91.2%. However, the ZnO particles that are still present at the microscale (3,860 and 5,710 nm) have a percentage of 4.1 and 4.7%, indicating that the particles formed are agglomerating. This is suspected to be due to the effectiveness of Padina sp. As a capping agent is still low. Conversely, a strong capping agent role can limit the growth of ZnO clusters and prevent aggregations from being large. The formation of nanoparticles can be affected by the pH of the reaction solution, the concentration of seaweed, the concentration of metal salts (precursors), the time and temperature of the reaction, as well as the temperature and time of drying and calcining [37,39].
The difference occurred between the results of particle measurements using PSA instruments and crystal measurements using the Debye-Scherrer equation. This is because the Debye-Scherrer equation used is an estimate of the size of the crystal material and not the size of the particle. One particle is made up of a number of tiny crystals. A particle that is nanometre in size by having one crystal in one particle indicates that the crystal size is equal to the particle size [39]. On the other hand, the results of measuring ZnO particles using Padina sp. extract in this study with the PSA instrument showed particles that were nanometre and micrometre in size so that the crystals obtained became heterogeneous and did not necessarily indicate the particle size.
Analysis of Morphology, Particle Form, and Elemental Composition of ZnO Nanoparticles
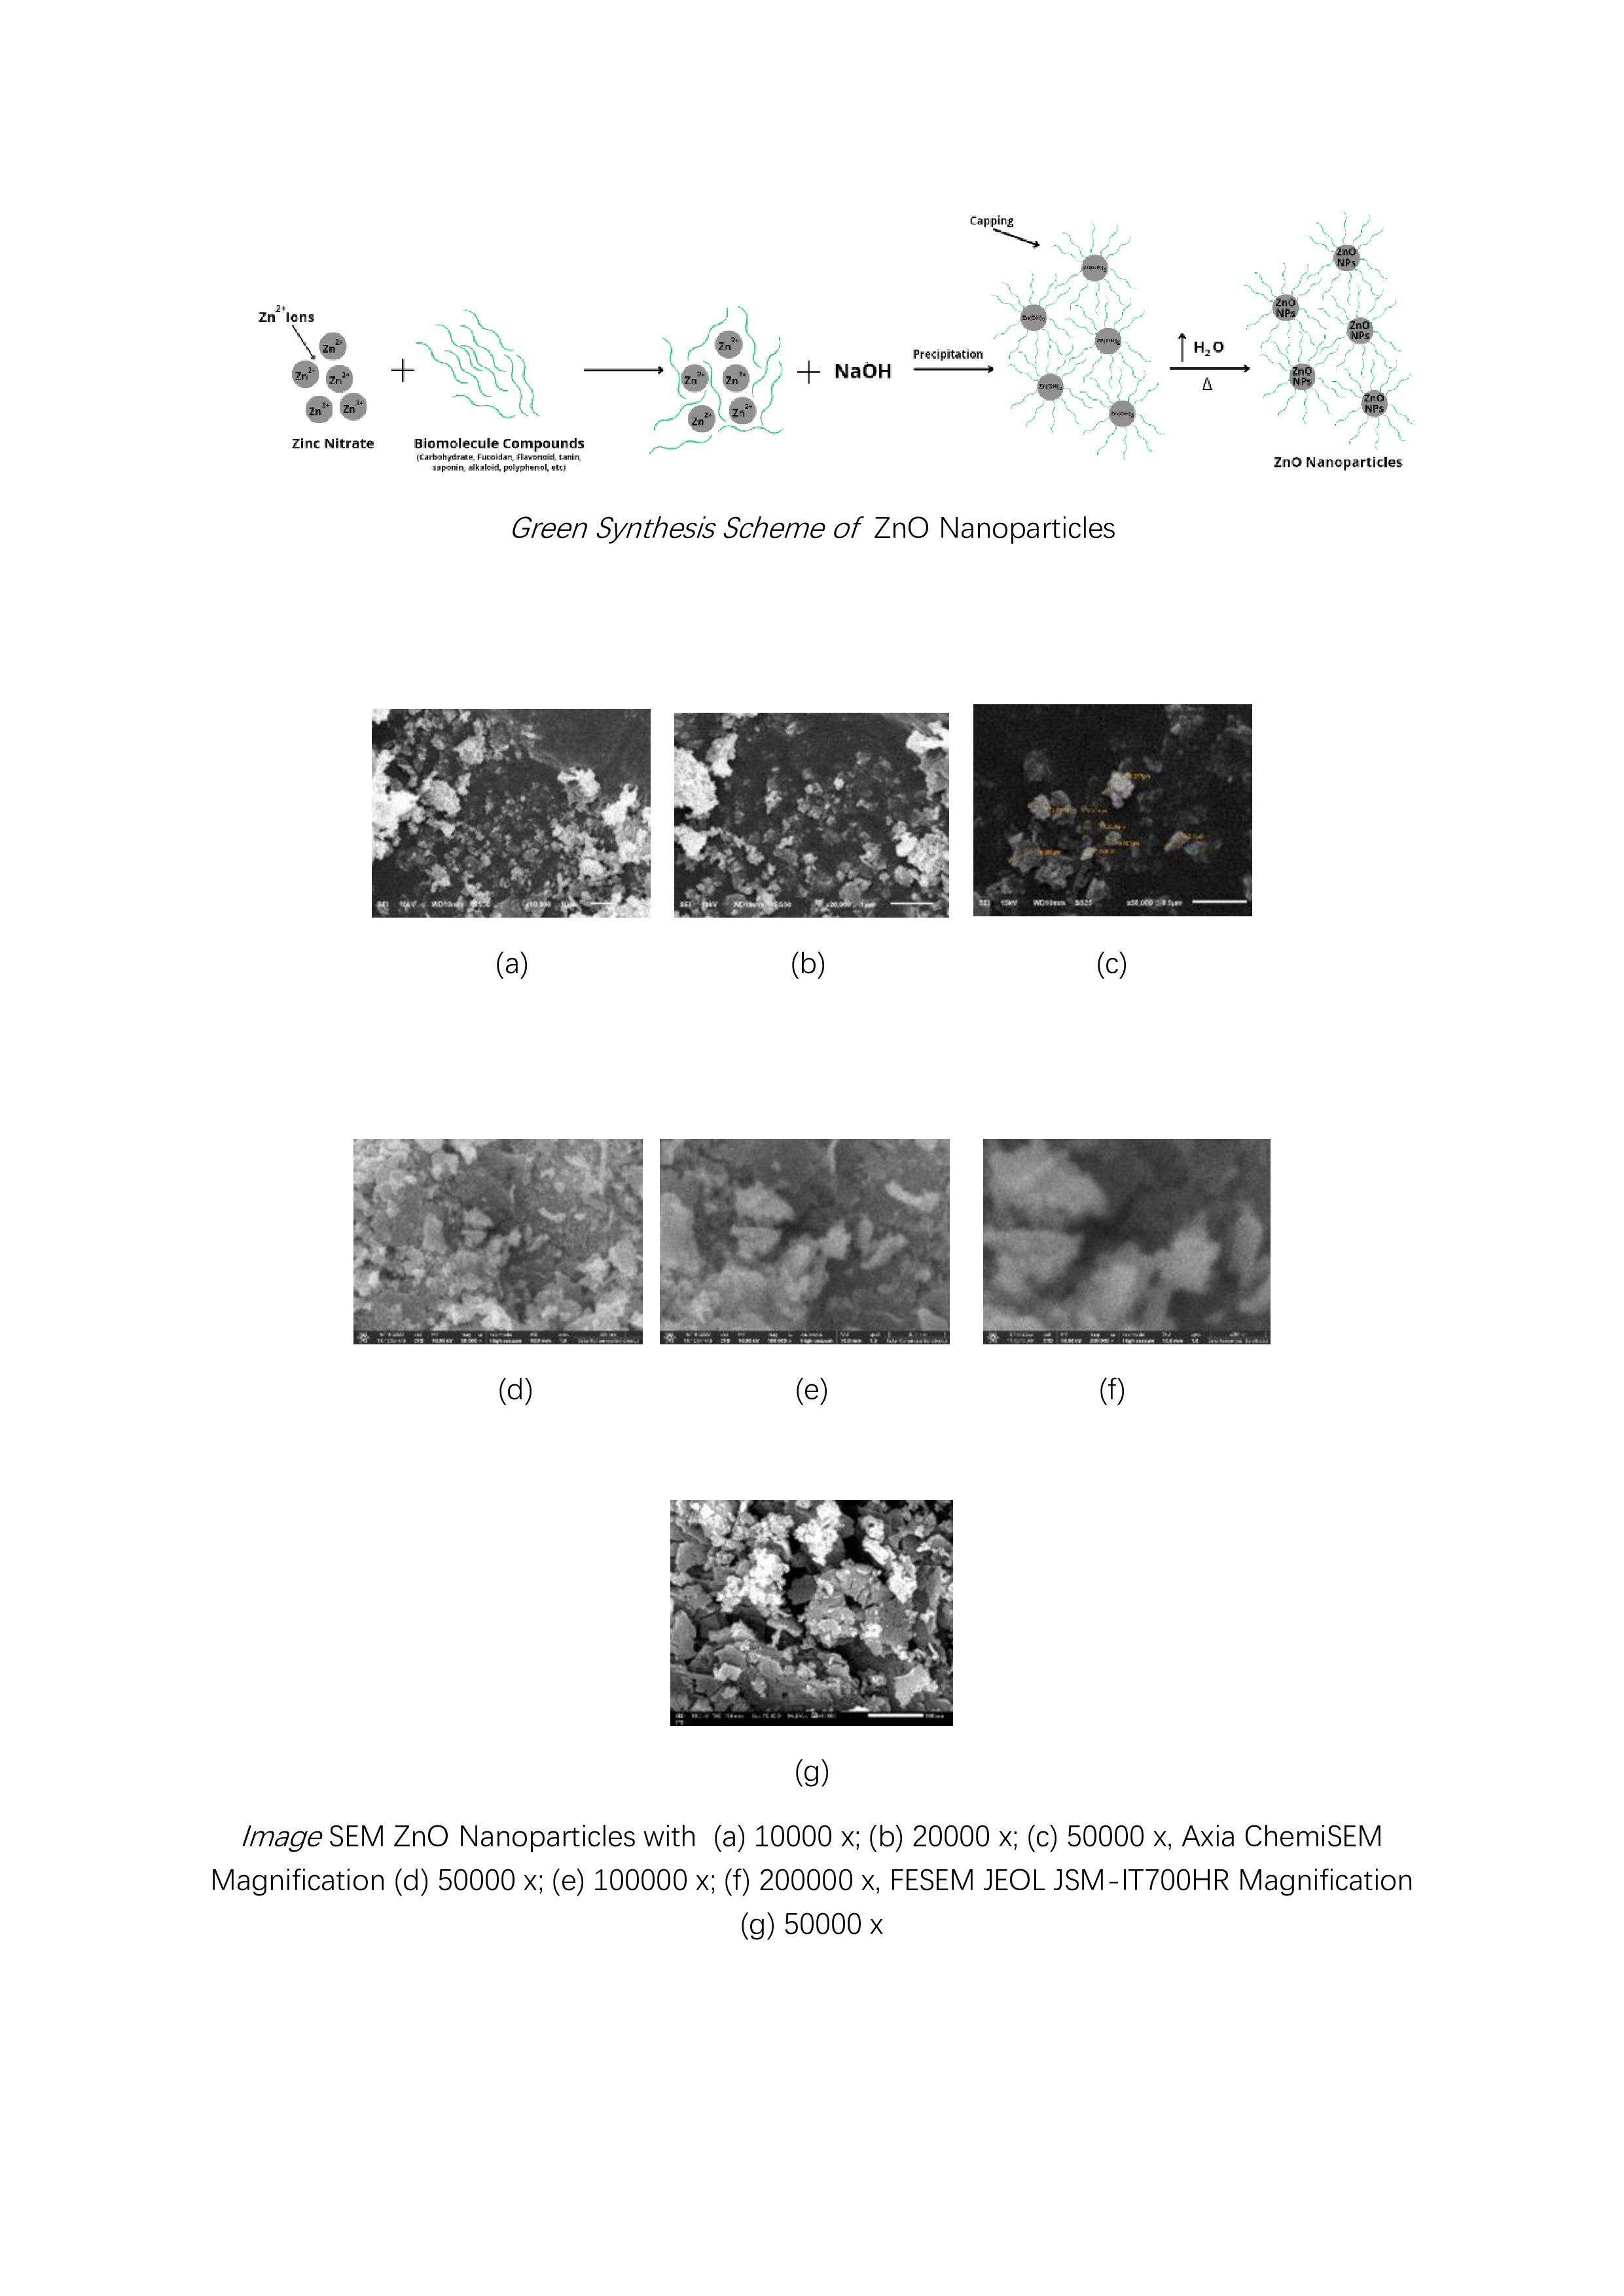
The results obtained were in the form of SEM images that could inform the shape and morphology of the surface of ZnO nanoparticles, cotton fabrics (K0), cotton fabrics deposited with ZnO nanoparticles (K1), and cotton fabrics deposited with ZnO nanoparticles and silane compounds (HDTMS/MTMS) (K4). In addition, the elemental composition of each sample tested can be determined by EDS analysis. Testing was carried out with several SEM instruments (Thermo Fisher Scientific Axia ChemiSEM, Phenom Pro X G6, and JEOL JSM-6510LA) and FESEM (JEOL JSM-IT700HR) with coating by a sputter coater that uses conductive target materials such as Au and Au/Pd to increase the conductivity of the sample in minimizing electron charging effect which can have an impact on the quality of SEM image resolution. The results of SEM and EDS images on ZnO, K0, K1, and K4 nanoparticles with varying magnifications can be reviewed in Figures 16–23.
SEM image results with magnification of 10000 x, 20000 x, and 50000 x using JEOL JSM-6510LA; 50000 x, 100000 x, and 200000 x magnification using Axia ChemiSEM; and 50000 x magnification using FESEM JEOL JSM-IT700HR at an accelerating voltage (AV) of 10 kV is shown in Figure 16.
Particle measurements using SEM can be done directly from the tool or using image processing software such as ImageJ. A particle measurement with a magnification of 50000 x in Figure 7 (c) yields a particle size in the range of 45 - 297 nm. Meanwhile, at smaller magnifications such as 10000 x (a) and 20000 x (b) have particles with varying sizes from the nanometre and micrometre scales and show an uneven distribution of particles. In addition, the 50000x magnification shown in Figure 7 (c), (d), and (g) with the difference in the SEM instrument model shows a heterogeneous particle distribution. This is due to the ZnO particles that have undergone agglomeration events so that the results of particle size and distribution analysis using SEM are in accordance with the PSA results. The use of different SEM instrument models aims for further confirmation at the same or different magnifications. The FESEM result (g) produces an image that has a better resolution compared to (c) and (d) even though the AV used is the same.
Analysis of particle shape can be observed at high magnifications such as 100000 x (e) and 200000 x (f) showing irregularly shaped particles such as rod-like and leaf-like. The irregular shape of the particles can be caused by several factors such as precursor concentration, pH conditions, heating temperature during the reaction, stirring speed, reaction time, and other factors. Therefore, it is necessary to further study the factors that affect the irregularity of particle shape.
Figure 8 shows the EDS results of ZnO nanoparticles at magnification of 20000 x. Based on the EDS results on ZnO nanoparticles, it can be analyzed qualitatively in the presence of several identified elements, namely C, O, and Zn. Mass percentage (%) in the identified elements is 6.6, 17.9, and 75.5 respectively. Meanwhile, the known atomic percentages (%) were 19.4, 39.6, and 41 respectively. The presence of element C in ZnO nanoparticles indicates that there is still a capping agent derived from biomolecular compounds.
SEM Photos and Composition of Cotton Fabrics (K0)
Morphological analysis on cotton fabrics using SEM Phenom Pro X G6 with magnifications of 1000 x, 2000 x, and 5000 x which can be shown in Figure 18. The shape of the cotton fabric observed in SEM is in accordance with the theory, namely cotton fibres in the form of ribbons or tubes that collapse and twist. The surface of the raw cotton fibre has a clean area and very few contaminants are observed. This was confirmed by the EDS analysis, which only contained elements C and O derived from the constituent of cotton fabrics, namely cellulose. The results of the EDS analysis can be reviewed in Figure 9 which has a mass and atomic percentage. The percentage of masses (%) identified were 47.6 and 52.4 respectively. Meanwhile, the atomic percentage (%) is known to be 54.8 and 45.2 respectively.
SEM Photos and Composition of Cotton Fabrics After Modification with ZnO (K1) Nanoparticles
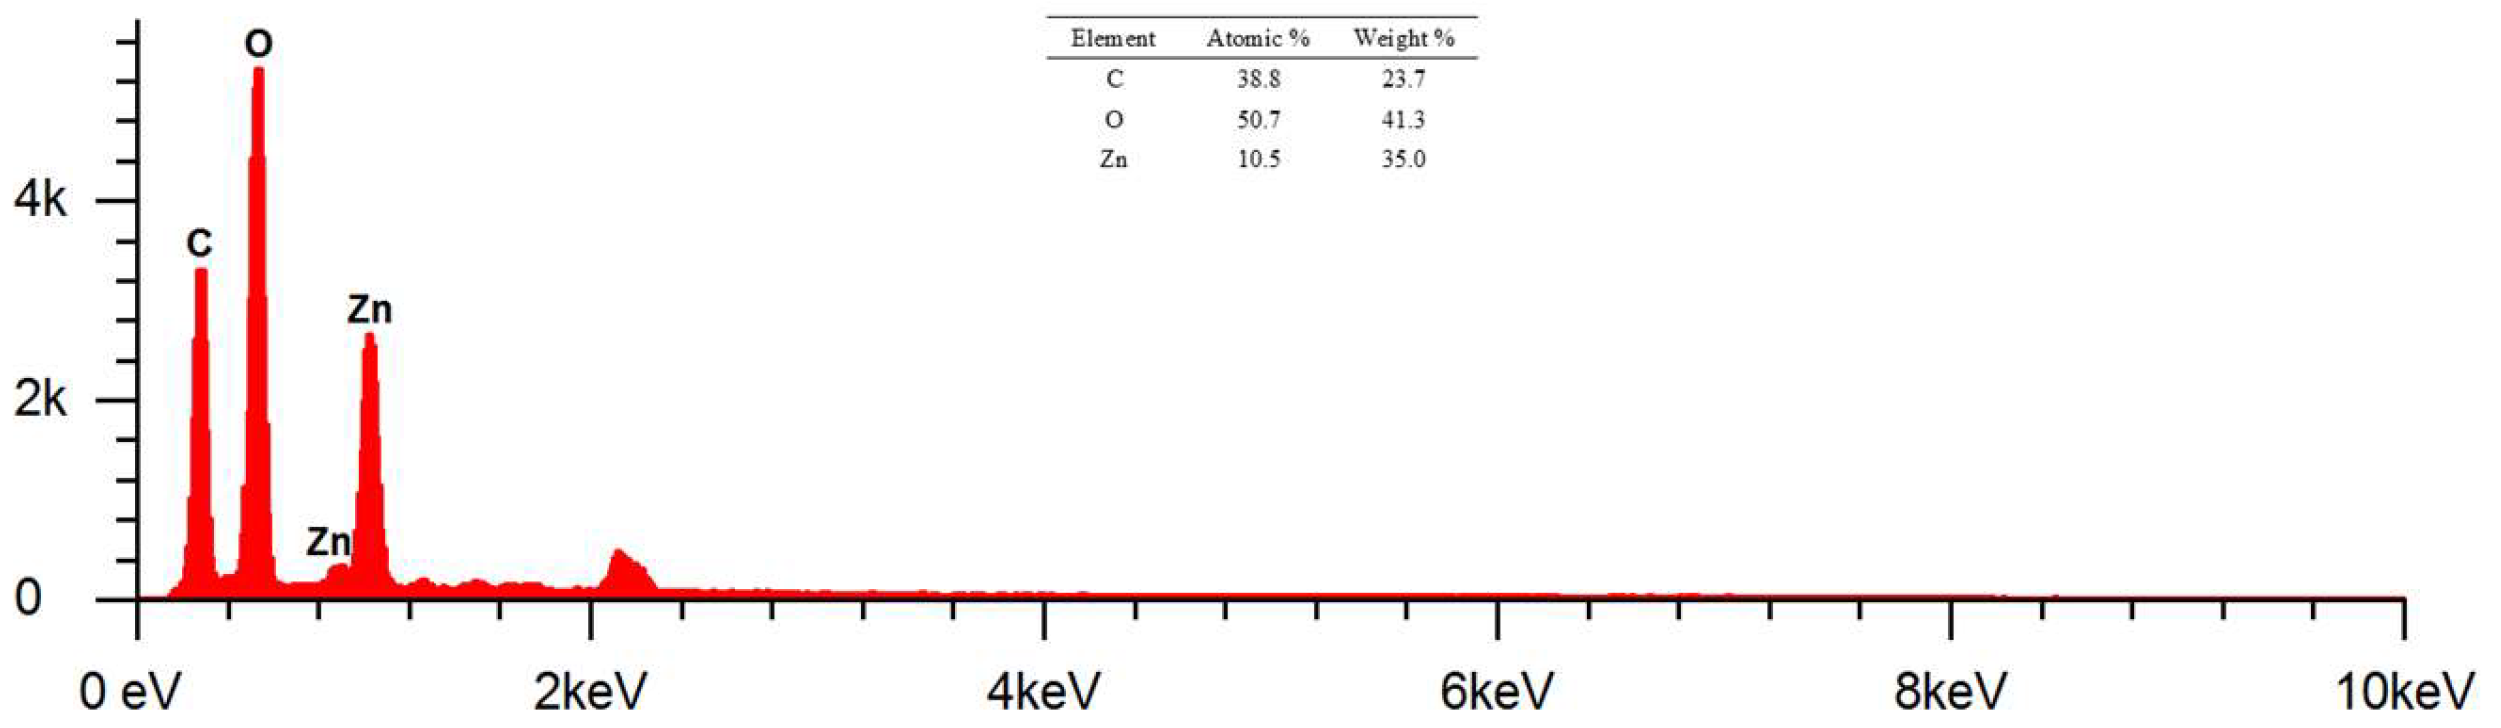
The morphological analysis of cotton fabrics deposited with ZnO nanoparticles using Axia ChemiSEM at magnifications of 1000 x, 3000 x, and 5000 x can be shown in Figure 20. The surface of cotton fabrics that have been deposited with ZnO nanoparticles looks rougher than cotton fabrics without modification. ZnO nanoparticles deposited on cotton fabrics can be confirmed by EDS results and those shown in Figure 11.
The results of EDS at magnification of 1000 x showed the presence of elements C, O, and Zn. The identified mass percentages (%) were 23.7, 41.3, and 35 respectively. Meanwhile, the atomic percentages (%) can be known as 38.8, 50.7, and 10.5 respectively. The presence of the Zn element indicates that the deposition of ZnO nanoparticles on cotton fabrics by in-situ method has been successfully carried out. Element C in K1 shows the presence of cellulose as a constituent of cotton fabrics and biomolecular compounds that act as capping agents in in-situ deposits of ZnO nanoparticles. Based on the mass percentage from smallest to largest respectively, namely elements C, Zn, and O. The sum of the mass percentage of the element Zn is smaller than O because the Zn of the deposited ZnO nanoparticles is unevenly deposited and is less dominant than cotton fabrics composed of elements C and O.
Figure 12.
EDS Results of Cotton Fabric + Nanoparticles ZnO (K1) Magnification 1000x.
SEM Photos and Composition of Modified Cotton Fabrics with ZnO Nanoparticles and HDTMS/MTMS
Morphological analysis of cotton fabrics deposited with ZnO nanoparticles and silane compounds (HDTMS/MTMS) (K4) using Axia ChemiSEM at magnifications of 1000 x, 2000 x, 5000 x, and 17500 x can be shown in Figure 13.
Based on the SEM image in Figure 13, the surface of K4 is characterized by the presence of ZnO nanoparticles that have an uneven distribution, but are more homogeneous or uniform with particles in the form of micro-nanoflowers. This can be shown in SEM images with a magnification of 17500 x.
ZnO deposited in cotton fabric has a smaller number of agglomerated particles compared to K1. The growth of ZnO clusters in K4 is easier to control than K1 due to the addition of silane compounds as coupling agents by increasing the adhesion force and interface interaction of ZnO nanoparticles or matrix polymers such as cotton fabrics. Coupling agents have the ability to balance the hydrophilic and hydrophobic properties of a polymer or membrane material, thereby increasing the hydrophobic properties of the material. Increased hydrophobic properties can reduce the water absorption in ZnO nanoparticles so that agglomeration events in ZnO nanoparticles can be minimized [40].
ZnO particles in the form of micro-nanoflowers can be measured with the help of ImageJ software at magnifications of 17500 x. Particle sizes are obtained in the range of 224 - 1688 nm. Higher magnification can make it easier to measure ZnO nanoparticles, but the resolution of the SEM image is reduced so that the resulting image becomes opaquer. In addition, the nanoparticles of ZnO and silane compounds (HDTMS/MTMS) deposited on cotton fabrics can be confirmed by the results of EDS at the magnification of 17500 x shown in Figure 14.
The EDS results at 17500 x magnification using AV of 15 kV showed the presence of elements C, O, Zn, Si, and Au. The percentage of masses (%) identified were 61.7, 32.9, 4.5, 0.7, and 0.2 respectively. Meanwhile, the atomic percentages (%) can be known as 45.9, 32.5, 18, 1.2, and 2.4 respectively. The presence of the element Zn indicates that the deposition of ZnO nanoparticles on cotton fabrics has been successfully carried out. Element C in K1 shows the presence of cellulose as the dominant constituent of cotton fabrics and biomolecular compounds that act as capping agents in ZnO nanoparticle deposits. In addition, the element Si shows the presence of silane compounds as a coupling agent that can increase the hydrophobicity of cotton fabrics. Meanwhile, the analyzed Au element comes from the Au target material in increasing the conductivity of cotton fabric samples. The peaks of Zn and Au in the energy range of 8 - 10 keV respectively show X-Ray characteristics at Kα and Lα energies. This is due to the use of AV of 15 kV so that the peaks can be analyzed.
Antibacterial Activity of Cotton Fabric Without and With Modification
Antibacterial activity can be seen from the clear zone that forms or what is known as the inhibition zone around the cotton fabric sample. The formed resistance zone can be measured to find out the magnitude of the diameter through three sides, namely horizontally, vertically, and diagonally. The effectiveness of antibacterial activity can be observed through the formation of inhibitory zones. Bacterial growth inhibitory responses are classified into 4 groups, namely weak (≤ 5 mm in diameter), medium (5-10 mm in diameter), strong (10-20 mm in diameter), and very strong (≥ 20 mm in diameter) [41].
Antibacterial testing is carried out on cotton fabrics without modification as well as after modification (K0 - K10). In addition, tests were also carried out on ZnO nanoparticles dispersed in aqua bide with a concentration of 1000 ppm (Z). The use of positive control (K+) such as ciprofloxacin has an inhibitory zone with a large diameter against gram-positive (Staphylococcus epidermidis) and gram-negative (Pseudomonas aeruginosa) test bacteria [42]. Meanwhile, the negative control (K-) used is aqua bides. Positive and negative controls are used as a comparison of sample test results. Antibacterial testing is carried out for 48 hours with measurement time every 3 hours.
Measurement of Inhibition Zone Against Pseudomonas Aeruginosa Bacteria
Antibacterial testing on modified cotton fabrics by measuring the inhibition zone against Pseudomonas aeruginosa bacteria. The results of the sample inhibition zone measurements compared to the positive and negative controls can be reviewed in Figure 15.
Based on Figure 16 of the antibacterial test samples, the results are almost the same, so some samples look like they overlap except for the K8 and Z samples which showed maximum values at the 42nd hour of 3.93 mm and 2.79 mm, respectively. Based on the graph, the formation of a large inhibition zone diameter in the test sample tends to be at the 42nd hour. After the 42nd hour, the test sample has experienced resistance to the test bacteria indicated by the instability events up and down the diameter of the inhibition zone of the test sample. However, before the 42nd hour the test sample also had values that tended to go up and down. This can be caused by the medium used, environmental conditions during testing such as temperature and humidity, stability of antibacterial substances, condition of cotton fabric samples, incubation time, metabolic activity, and number of bacteria.
The K8 modified cotton fabric sample type has the largest value when compared to other modifications and without modification (K0). This shows that the K8 sample type has the highest antibacterial activity against the bacterium Pseudomonas aeruginosa. Meanwhile, ZnO nanoparticles have the second largest antibacterial activity. The incubation time from the 0th hour to the 9th hour does not show an inhibition zone so it begins with the 9th hour. In addition, the best incubation time is at the 42nd hour as evidenced by the results of measuring the diameter of the maximum inhibition zone.
Measurement of Inhibition Zones Against Staphylococcus epidermidis Bacteria
Measurements of the inhibitory zone on modified cotton fabrics against Staphylococcus epidermidis bacteria can be reviewed in Figure 16. In addition, measurements were also made on unmodified cotton fabrics (K0), ZnO nanoparticles (Z), positive (K+), and negative (K-) controls.
Inhibition zone measurements were also taken three times per sample and Figure 16 shows one of the samples having a large inhibition zone. Results of measuring the diameter of the inhibitory zone of Staphylococcus epidermidis bacteria in Z, K0-K10, and K+ samples. In addition, K- was also measured, but the inhibition zone did not form an inhibition zone. The incubation time is marked with the symbol t in hours.
Figure 16.
Graph of the Relationship Between Staphylococcus epidermidis Bacterial Inhibition Zone Diameter and Incubation Time.
Figure 16.
Graph of the Relationship Between Staphylococcus epidermidis Bacterial Inhibition Zone Diameter and Incubation Time.
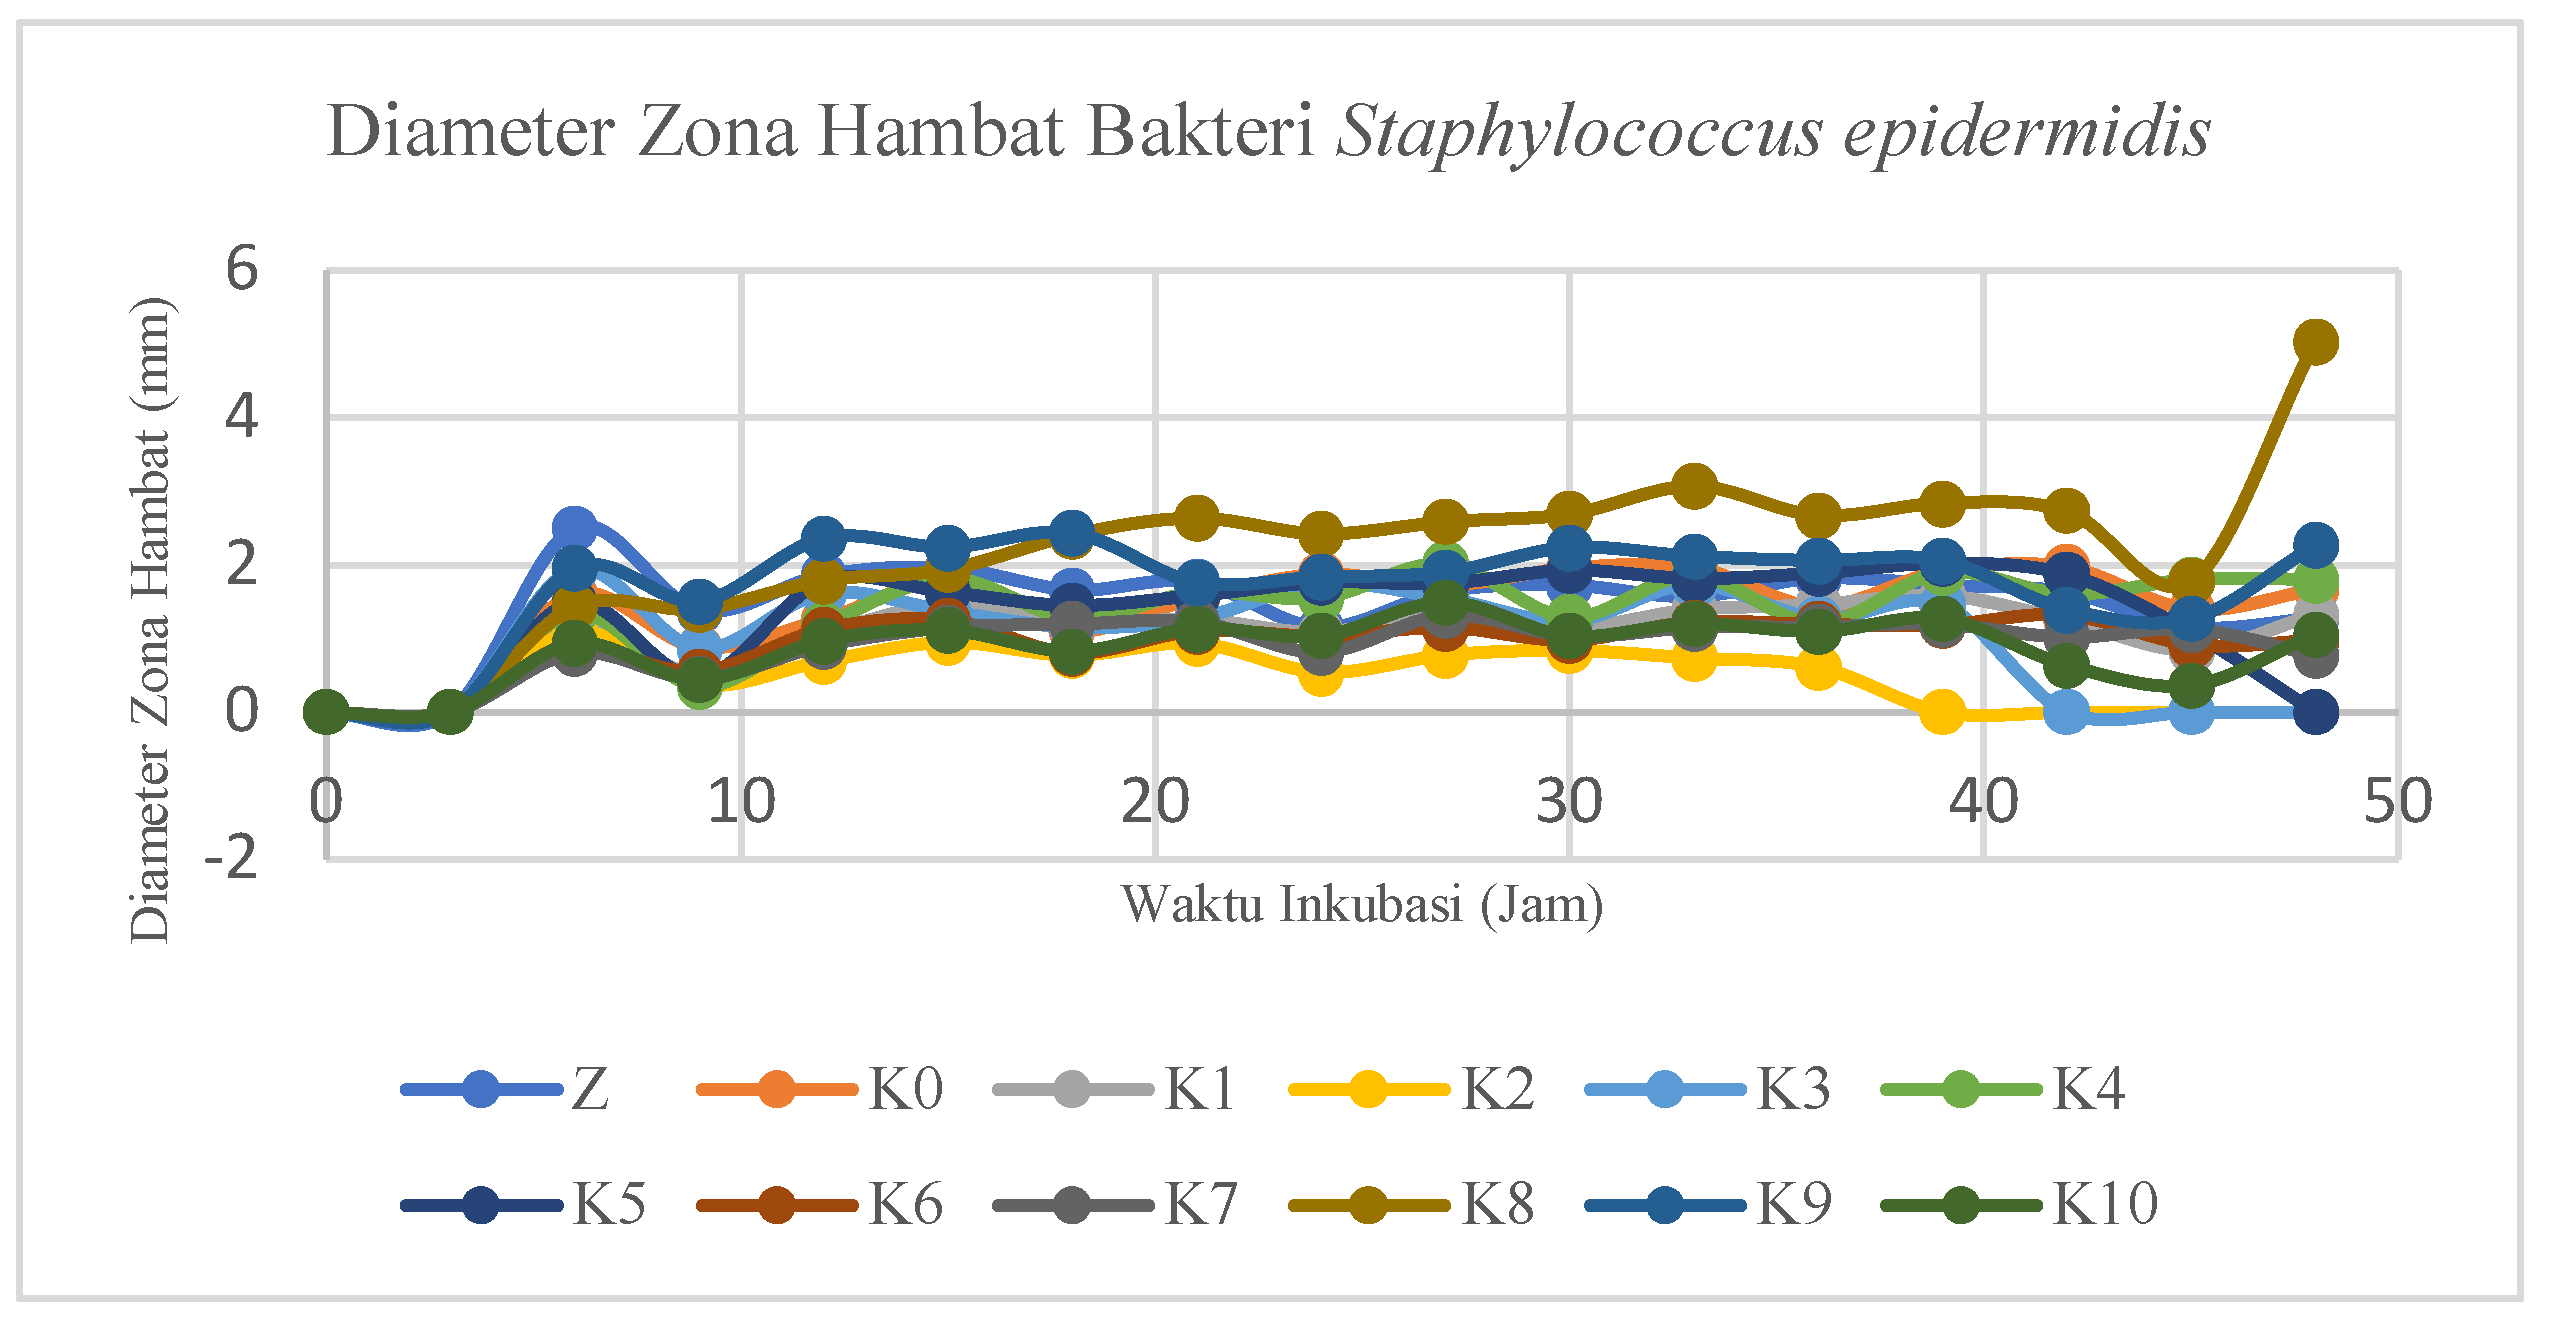
Based on the results of the ANOVA test, a post-hoc ANOVA follow-up test was then carried out, namely the Tukey HSD (Honestly Significant Difference) test to determine the variation in sample type and the best incubation time in the antibacterial test against Staphylococcus epidermidis bacteria. Based on the results of the Tukey HSD antibacterial test against Staphylococcus epidermidis bacteria, it was shown that the K8 modified cotton fabric sample type had the largest value when compared to other modifications and without modification (K0). This shows that the K8 sample type has the highest antibacterial activity against Staphylococcus epidermidis bacteria. Meanwhile, the K9 sample type showed almost the same results as K8 so it did not differ significantly. ZnO nanoparticles have the third largest value which proves the existence of antibacterial activity against Staphylococcus epidermidis bacteria. In addition, based on the results of the Tukey HSD test, the best incubation time was at the 48th hour followed by the results of measuring the maximum diameter of the inhibition zone. The incubation time of the 6th, 15th, 30th, 27th, 33rd, 39th, and 42nd hours showed results close to the 48th time, resulting in almost the same antibacterial activity.
Antifungal Activity of Cotton Fabric Without and With Modification
Measurement of antifungal activity inhibition zones that have similarities with the working principle of antibacterial activity measurement. Antifungal testing is carried out on cotton fabrics without modification as well as after modification (K0 - K10). In addition, tests were also carried out on ZnO nanoparticles dispersed in aqua bide with a concentration of 1000 ppm (Z). The use of positive control (K+) such as ketoconazole has an inhibitory zone with a large diameter against the fungus Malassezia furfur [43]. Meanwhile, the negative control (K-) used is aqua bides. Positive and negative controls are used as a comparison of sample test results. Antifungal testing is carried out for 48 hours with measurement time every 6 hours. The measurement of the inhibition zone for antifungal activity can be reviewed in Figure 17.
Based on Figure 17, the antifungal test samples showed almost the same results, so some samples looked like overlapping and stagnant increases except for the K4 and K8 samples which showed maximum values at the 42nd and 48th hours respectively of 16.47 mm and 16.78 mm. The stagnant state can be affected by the medium used, environmental conditions during testing such as temperature and humidity, stability of antifungal substances, condition of cotton fabric samples, incubation time, metabolic activity, and number of fungi.
Positive control (K+) can be included in the graph because the value of the inhibition zone formed does not have much difference from the K4 and K8 samples. The maximum resistance zone that can be formed at K+ is 14.07 mm at the 42nd hour measurement. The value of the maximum inhibition zone of positive control is smaller than that of the test sample due to the improper quality, particle size and concentration of K+, so it is necessary to further study the particle size and the minimum inhibition concentration of the positive control. The decrease in the value of the inhibition zone occurs at the 48th hour which indicates that the medium has the potential to rise or decrease after 48 hours so that the antifungal measurement is better than 48 hours to find out the best inhibition zone.
Based on the results of the Tukey HSD antifungal test against Malassezia furfur fungus, it shows that the K4 modified cotton fabric sample type is the largest value when compared to other modifications and without modification (K0). This shows that the K4 sample type has the highest antifungal activity against Malassezia furfur fungus. Meanwhile, K4 is the type of sample that has the second largest inhibition zone value, showing almost the same results statistically as K8 so that it does not differ significantly. The Tukey HSD test was then carried out on the variation of incubation time, showing the best incubation time, which was at the 42nd hours followed by the 48th hour. This is in accordance with the results of the measurement of the diameter of the maximum resistance zone that occurred in K4 and K8 respectively. Simplification of the Tukey HSD antifungal test against Malassezia furfur fungus on sample type variations can be reviewed in Table 3.
Description: The average value of the diameter of the inhibition zone followed by different superscript letters shows significantly different results (significant), while the same superscript letters show significantly different results (insignificant) with a significance level of 95%
The fungal growth inhibitory response of Z, K+, and K0-K10 samples except K4 and K8 was classified in the weak group. Meanwhile, the K4 and K8 samples could be classified in the strong and medium groups respectively because the cotton cloth had been modified with ZnO nanoparticles and/or silane compounds that provided interactions between compounds on antifungal activity in the fungus Malassezia furfur. Therefore, further research is needed on the interaction of ZnO nanoparticles and/or silane compounds on antifungal activity in Malassezia furfur fungi.
4. Materials and Methods
The instruments used in this study are UV/VIS/NIR Spectrophotometer (Shimadzu UV-3600 Plus), ATR-FTIR (Shimadzu IRSpirit QATR-S), XRD Spectrometer (Rigaku MiniFlex 600 and Shimadzu LabX XRD-6000), PSA (Microtrac Nanotrac Wave II), SEM-EDS (Thermo Fisher Scientific Axia ChemiSEM, Phenom Pro X G6, and JEOL JSM-6510LA), FESEM (JEOL JSM-IT700HR), Sputter Coater (Cressington Sputter Coater 108auto/SE, Quorum SC7620, JEOL JEC-3000FC, and Smart Coater DII-29030SCTR), Optical Contact Angle Goniometer (DataPhysics OCA 25), Universal Testing Machine (UTM) (Tensilon RTI-1225), ultrasonic cleaner (GT Sonic), Laminar Air Flow (LAF), glassware, micropipette, magnetic stirrer, blender, test sieve 80 mesh, oven, muffle furnance, centrifuges, vacuum filters, pH meters, refrigerators, shakers, analytical scales, HDPE plastic bottles, thermometers, statives, clamps, hair dryers, cooler boxes, digital capillary, hole punches, autoclaves, incubators, petri dishes, Ose wire, and drigalski.
The materials used in this study are cotton fabric, brown algae plants (Padina sp.), Zn(NO3)26H2O solids (Sigma Aldrich), methyltrimethoxylane (MTMS > 98%, Sigma Aldrich), hexadecyltrimethoxylicylan (HDTMS > 85%, Sigma Aldrich), ethanol 96% (Merck Millipore), NaOH, aquabides, acetone, Staphylococcus epidermidisae bacteria (FNCC 0048 strain), Pseudomonas aeruginosa bacteria (FNCC 0063 strain), Malassezia furfur fungus, Nutrient Agar (NA) (Oxoid), Nutrient Broth (NB) (Merck Millipore), Potato Dextrose Agar (PDA) (Oxoid), and Whatman filter paper no. 41.
5. Conclusions
The role of brown algae Padina sp. in the synthesis of ZnO nanoparticles by green synthesis as a capping agent, it is shown by the absorption at a wavelength of 357 nm; Zn-O functional group in the wave number region of 450 cm-1; The peak of diffraction is at an angle of 36.14° with a miller index (1 0 1) indicating a crystal size of 15.35 nm; Heterogeneous and uneven particle distribution; Particle size in the range of 1.74-706 nm (PSA) and 45-297 nm (SEM); As well as irregular particle shapes such as rod-like and leaf-like. There was a significant difference in antibacterial activity between modified and unmodified cotton fabrics against Pseudomonas aeruginosa and Staphylococcus epidermidis. Cotton fabrics with the addition of HDTMS compounds and modification of ZnO (K8) nanoparticles showed the best results in inhibiting bacterial growth with the best time variation of each bacterium at the 42nd and 48th haours respectively. There was a significant difference in antifungal activity between modified and unmodified cotton fabrics against Malassezia furfur. Cotton fabrics with ZnO nanoparticle modification and the addition of HDTMS and MTMS silane composites (K4) showed the best results in inhibiting fungal growth with the best time variation at 42 hours. Further research is needed on the potential of Padina sp extract. in the synthesis of ZnO nanoparticles with the analysis of secondary metabolite compound content using GC-MS instruments and phytochemical tests. In addition, further research is needed on the influence of external stabilizers to reduce agglomeration during nanoparticle synthesis. Further research is needed on the deposit method of ZnO nanoparticles and silane compounds in cotton fabrics.
Author Contributions
E.R. proposed the concept. R.J performed the experiments. E.R., H., P.T. and A.K. wrote the manuscript. D.S. conducted the characterization. All authors participated in data analysis and manuscript discussion.
Funding
This research was funded by Indonesia Collaboration Research (Riset Kolaborasi Indonesia/RKI) funding with no. Contract T/18.1.1/UN34.9/PT.01.03/2024.
Acknowledgments
This research was conducted with the support of several parties. Therefore, the author(s) would like to express their gratitude to Yogyakarta State University for the Indonesia Collaboration Research funding with no. Contract T/18.1.1/UN34.9/PT.01.03/2024.
Conflicts of Interest
The authors declare no conflicts of interest.
References
- Purnaningrum, R. Sudut Kontak dan Aktivitas Antibakteri Kain Nylon 6,6 dengan Modifikasi Penambahan Nanopartikel Perak dan Senyawa Silan; Universitas Negeri Yogyakarta, 2017. [Google Scholar]
- Haryono, A.; Harmami, S.B. Aplikasi Nanopartikel Perak pada Serat Katun Sebagai Produk Jadi Tekstil Antimikroba. Jurnal Kimia Indonesia 2010, 5, 1–6. [Google Scholar]
- Sabir, S.; Arshad, M.; Chaudhari, S.K. Zinc Oxide Nanoparticles for Revolutionizing Agriculture: Synthesis and Applications. Sci. World J. 2014, 2014, 1–8. [Google Scholar] [CrossRef] [PubMed]
- Sun, Q.; Li, J.; Le, T. Zinc Oxide Nanoparticle as a Novel Class of Antifungal Agents: Current Advances and Future Perspectives. J. Agric. Food Chem. 2018, 66, 11209–11220. [Google Scholar] [CrossRef] [PubMed]
- Al-Nassar, S.I.; Hussein, F.I.; M, A.K. The effect of laser pulse energy on ZnO nanoparticles formation by liquid phase pulsed laser ablation. J. Mater. Res. Technol. 2019, 8, 4026–4031. [Google Scholar] [CrossRef]
- Wirunchit, S.; Gansa, P.; Koetniyom, W. Synthesis of ZnO nanoparticles by Ball-milling process for biological applications. Mater. Today: Proc. 2021, 47, 3554–3559. [Google Scholar] [CrossRef]
- Ramadhani, Z.F. Modifikasi Kulit Kambing Pikel dengan Nanopartikel Perak Hasil Preparasi Menggunakan Tumbuhan Alga Merah (Gracilaria Sp.) dan Biodegradasinya; Universitas Negeri Yogyakarta, 2021. [Google Scholar]
- Bayrami, A.; Alioghli, S.; Pouran, S.R.; Habibi-Yangjeh, A.; Khataee, A.; Ramesh, S. A facile ultrasonic-aided biosynthesis of ZnO nanoparticles using Vaccinium arctostaphylos L. leaf extract and its antidiabetic, antibacterial, and oxidative activity evaluation. Ultrason. Sonochemistry 2019, 55, 57–66. [Google Scholar] [CrossRef]
- Sari, R.N.; Irianto, H.E.; Ayudiarti, D.L. Using Oven Microwave for Synthesis ZnO Nps using Sargassum sp. and Padina sp. Extract. J. Pengolah. Has. Perikan. Indones. 2019, 22, 375–390. [Google Scholar] [CrossRef]
- Barzinjy, A.A.; Azeez, H.H. Green synthesis and characterization of zinc oxide nanoparticles using Eucalyptus globulus Labill. leaf extract and zinc nitrate hexahydrate salt. SN Appl. Sci. 2020, 2, 1–14. [Google Scholar] [CrossRef]
- Nurrahman, N.W.D.; Tuah, U.H.; Sudjarwo, G.W.; Putra, O.N. Skrining Fitokimia Metabolit Sekunder Alga Cokelat (Padina australis) dari Kepulauan Poteran Madura. J. Pharm. Care Anwar Med. 2018, 2, 13–22. [Google Scholar] [CrossRef]
- Água, R.B.D.; Branquinho, R.; Duarte, M.P.; Maurício, E.; Fernando, A.L.; Martins, R.; Fortunato, E. Efficient coverage of ZnO nanoparticles on cotton fibres for antibacterial finishing using a rapid and low cost in situ synthesis. New J. Chem. 2017, 42, 1052–1060. [Google Scholar] [CrossRef]
- Ou, J.; Wang, F.; Li, W.; Yan, M.; Amirfazli, A. Methyltrimethoxysilane as a multipurpose chemical for durable superhydrophobic cotton fabric. Prog. Org. Coatings 2020, 146. [Google Scholar] [CrossRef]
- Zhang, J.; Raza, S.; Wang, P.; Wen, H.; Zhu, Z.; Huang, W.; Mohamed, I.M.A.; Liu, C. Polymer Brush-Grafted ZnO-Modified Cotton for Efficient Oil/Water Separation with Abrasion/Acid/Alkali Resistance and Temperature “Switch” Property. Journal of Colloid and Interface Science 2020, 580, 822–833. [Google Scholar] [CrossRef] [PubMed]
- Wenten, I.G.; Himma, N.; Anisah, S.; Prasetya, N. Membran Superhidrofobik Pembuatan, Karakterisasi, dan Aplikasi; Departemen Teknik Kimia ITB, 2015. [Google Scholar]
- Mohammadi, C.; Mahmud, S.; Abdullah, S.M.; Mirzaei, Y. Green Synthesis of ZnO Nanoparticles Using the Aqueous Extract of Euphorbia petiolata and Study of Its Stability and Antibacterial Properties. Moroccan Journal of Chemistry 2017, 5, 476–484. [Google Scholar]
- Yunita, Y.; Nurlina, N.; Syahbanu, I. Sintesis Nanopartikel Zink Oksida (ZnO) dengan Penambahan Ekstrak Klorofil Sebagai Sumber Capping Agent. Positron 2020, 10, 123–130. [Google Scholar] [CrossRef]
- Javed, R.; Zia, M.; Naz, S.; Aisida, S.O.; Ain, N.U.; Ao, Q. Role of capping agents in the application of nanoparticles in biomedicine and environmental remediation: recent trends and future prospects. J. Nanobiotechnology 2020, 18, 1–15. [Google Scholar] [CrossRef] [PubMed]
- Sari, R.N.; Saridewi, N.; Shofwatunnisa. Biosintesis dan Karakterisasi Nanopartikel ZnO dengan Ekstrak Rumput Laut Hijau Caulerpa sp.; Fakultas Sains dan Teknologi UIN Syarif Hidayatullah Jakarta, 2017. [Google Scholar]
- K, S.K.; M, P.N.P.; Vasundhara, M. Enhanced photocatalytic activity in ZnO nanoparticles developed using novel Lepidagathis ananthapuramensis leaf extract. RSC Adv. 2023, 13, 1497–1515. [Google Scholar] [CrossRef] [PubMed]
- A Barzinjy, A. Characterization of ZnO Nanoparticles Prepared from Green Synthesis Using Euphorbia petiolata Leaves. Eurasian Journal of Science & Engineering 2019, 4, 74–83. [Google Scholar]
- Singh, B.N.; Rawat, A.K.S.; Khan, W.; Naqvi, A.H.; Singh, B.R. Biosynthesis of Stable Antioxidant ZnO Nanoparticles by Pseudomonas aeruginosa Rhamnolipids. PLOS ONE 2014, 9, e106937. [Google Scholar] [CrossRef]
- Verbič, A.; Šala, M.; Jerman, I.; Gorjanc, M. Novel Green In Situ Synthesis of ZnO Nanoparticles on Cotton Using Pomegranate Peel Extract. Materials 2021, 14, 4472. [Google Scholar] [CrossRef]
- Jayachandran, A.; Aswathy, T.R.; Nair, A.S. Green synthesis and characterization of zinc oxide nanoparticles using Cayratia pedata leaf extract. Biochem. Biophys. Rep. 2021, 26, 100995. [Google Scholar] [CrossRef] [PubMed]
- Nagajyothi, P.; An, T.M.; Sreekanth, T.; Lee, J.-I.; Lee, D.J.; Lee, K. Green route biosynthesis: Characterization and catalytic activity of ZnO nanoparticles. Mater. Lett. 2013, 108, 160–163. [Google Scholar] [CrossRef]
- Talam, S.; Karumuri, S.R.; Gunnam, N. Synthesis, Characterization, and Spectroscopic Properties of ZnO Nanoparticles. ISRN Nanotechnol. 2012, 2012, 1–6. [Google Scholar] [CrossRef]
- Shamhari, N.M.; Wee, B.S.; Chin, S.F.; Kok, K.Y. Synthesis and Characterization of Zinc Oxide Nanoparticles with Small Particle Size Distribution. Acta Chim. Slov. 2018, 65, 578–585. [Google Scholar] [CrossRef]
- Goh, E.; Xu, X.; McCormick, P. Effect of particle size on the UV absorbance of zinc oxide nanoparticles. Scr. Mater. 2014, 78-79, 49–52. [Google Scholar] [CrossRef]
- Kannan, P.; Banat, F. Investigating the residual characteristics of dryer lint for developing resource recovery strategies. SN Appl. Sci. 2020, 2, 1–9. [Google Scholar] [CrossRef]
- Hospodarova, V.; Singovszka, E.; Stevulova, N. Characterization of Cellulosic Fibers by FTIR Spectroscopy for Their Further Implementation to Building Materials. Am. J. Anal. Chem. 2018, 9, 303–310. [Google Scholar] [CrossRef]
- Portella, E.H.; Romanzini, D.; Angrizani, C.C.; Amico, S.C.; Zattera, A.J. Influence of Stacking Sequence on the Mechanical and Dynamic Mechanical Properties of Cotton/Glass Fiber Reinforced Polyester Composites. Mater. Res. 2016, 19, 542–547. [Google Scholar] [CrossRef]
- Kalimuthu, R.; Sellan, K.M.; Antony, D.; Rajaprakasam, S.; Chokkalingam, V.; Chidambaram, P.; Kanagarajan, S. Nanopriming Action of Microwave-Assisted Biofunctionalized ZnO Nanoparticles to Enhance the Growth under Moisture Stress in Vigna radiata. ACS Omega 2023, 8, 28143–28155. [Google Scholar] [CrossRef]
- Mohamed, H.E.A.; Afridi, S.; Khalil, A.T.; Zia, D.; Shinwari, Z.K.; Dhlamini, M.S.; Maaza, M. Structural, Morphological and Biological Features of ZnO Nanoparticles Using Hyphaene thebaica (L.) Mart. Fruits. J. Inorg. Organomet. Polym. Mater. 2020, 30, 3241–3254. [Google Scholar] [CrossRef]
- Delcourt, N.; Rébufa, C.; Dupuy, N.; Boukhdoud, N.; Brunel, C.; Abadie, J.; Giffard, I.; Silva, A.M.F.-D. Infrared spectroscopy as a useful tool to predict land use depending on Mediterranean contrasted climate conditions: A case study on soils from olive-orchards and forests. Sci. Total. Environ. 2019, 686, 179–190. [Google Scholar] [CrossRef] [PubMed]
- Abd-Elkader, O.H.; Deraz, N.M.; Aleya, L. Rapid Bio-Assisted Synthesis and Magnetic Behavior of Zinc Oxide/Carbon Nanoparticles. Crystals 2023, 13, 1081. [Google Scholar] [CrossRef]
- Sangeetha, G.; Rajeshwari, S.; Venckatesh, R. Green synthesis of zinc oxide nanoparticles by aloe barbadensis miller leaf extract: Structure and optical properties. Mater. Res. Bull. 2011, 46, 2560–2566. [Google Scholar] [CrossRef]
- Baharudin, K.B.; Abdullah, N.; Derawi, D. Effect of calcination temperature on the physicochemical properties of zinc oxide nanoparticles synthesized by coprecipitation. Mater. Res. Express 2018, 5, 125018. [Google Scholar] [CrossRef]
- Taurina, W.; Sari, R.; Hafinur, U.C.; Isnindar, S.W. Optimasi Kecepatan dan Lama Pengadukan Terhadap Ukuran Nanopartikel Kitosan-Ekstrak Etanol 70% Kulit Jeruk Siam (Citrus nobilis L. var Microcarpa). Traditional Medicine Journal 2017, 22, 16–20. [Google Scholar]
- Sari, R.N.; Chasanah, E.; Nurhayati, N. Nanopartikel Seng Oksida (ZnO) dari Biosintesis Ekstrak Rumput Laut Coklat Sargassum sp. dan Padina sp. J. Pascapanen dan Bioteknol. Kelaut. dan Perikan. 2018, 13, 41–60. [Google Scholar] [CrossRef]
- Batu, M.S. Pengaruh Penambahan Asam Sulfosuksinat Terhadap Sifat dan Kinerja Membran Komposit Kitosan-Montmorillonit Termodifikasi Silan untuk Aplikasi DMFC; Institut Teknologi Sepuluh Nopember, 2016. [Google Scholar]
- Mahmudah, F.L.; Atun, S. Uji Aktivitas Antibakteri dari Ekstrak Etanol Temukunci (Boesenbergia pandurata) Terhadap Bakteri Streptococcus mutans. Jurnal Penelitian Saintek 2017, 22, 59–66. [Google Scholar] [CrossRef]
- Masadeh, M.M.; Alzoubi, K.H.; Al-Azzam, S.; Al-Buhairan, A.M. Possible involvement of ROS generation in vorinostat pretreatment induced enhancement of the antibacterial activity of ciprofloxacin. Clin. Pharmacol. Adv. Appl. 2017, 9, 119–124. [Google Scholar] [CrossRef] [PubMed]
- Paralikar, P. Fabrication of ketoconazole nanoparticles and their activity against Malassezia furfur. Nusant. Biosci. 1970, 7. [Google Scholar] [CrossRef]
Figure 1.
Covalently Bonded Biomolecular Compounds with Nanoparticles.
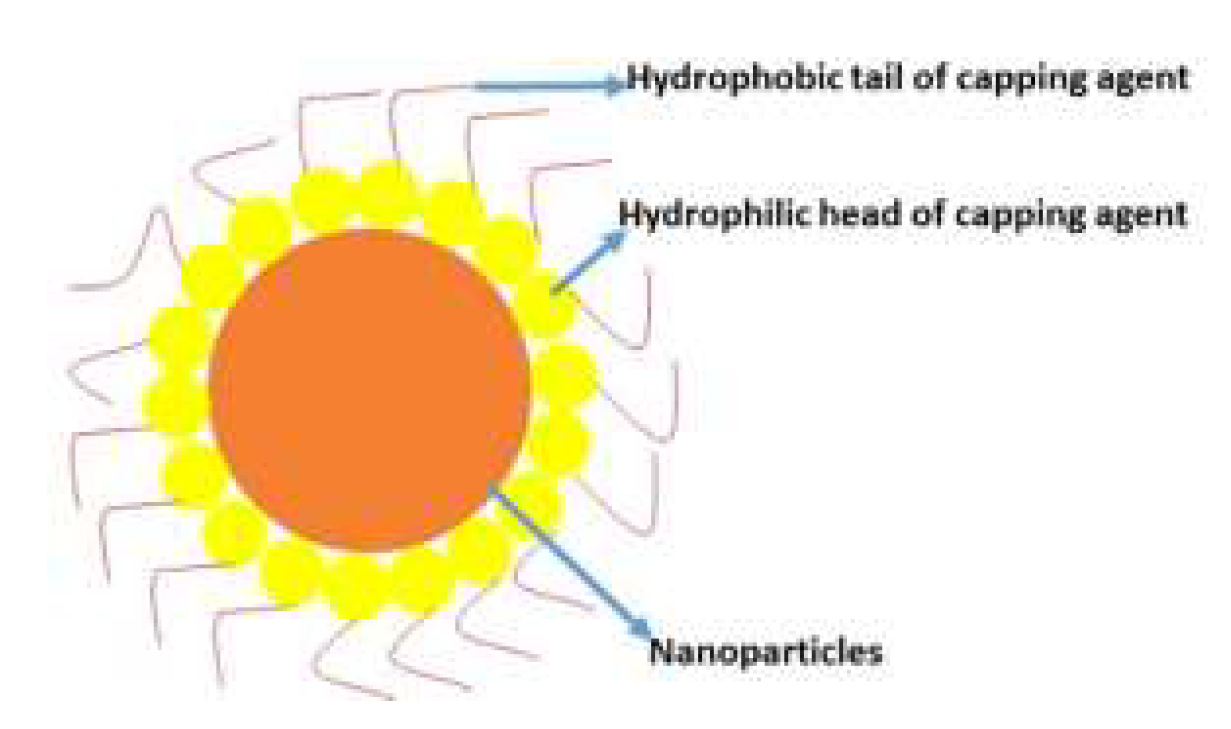
Figure 2.
Green Synthesis Reaction Scheme of ZnO Nanoparticles.
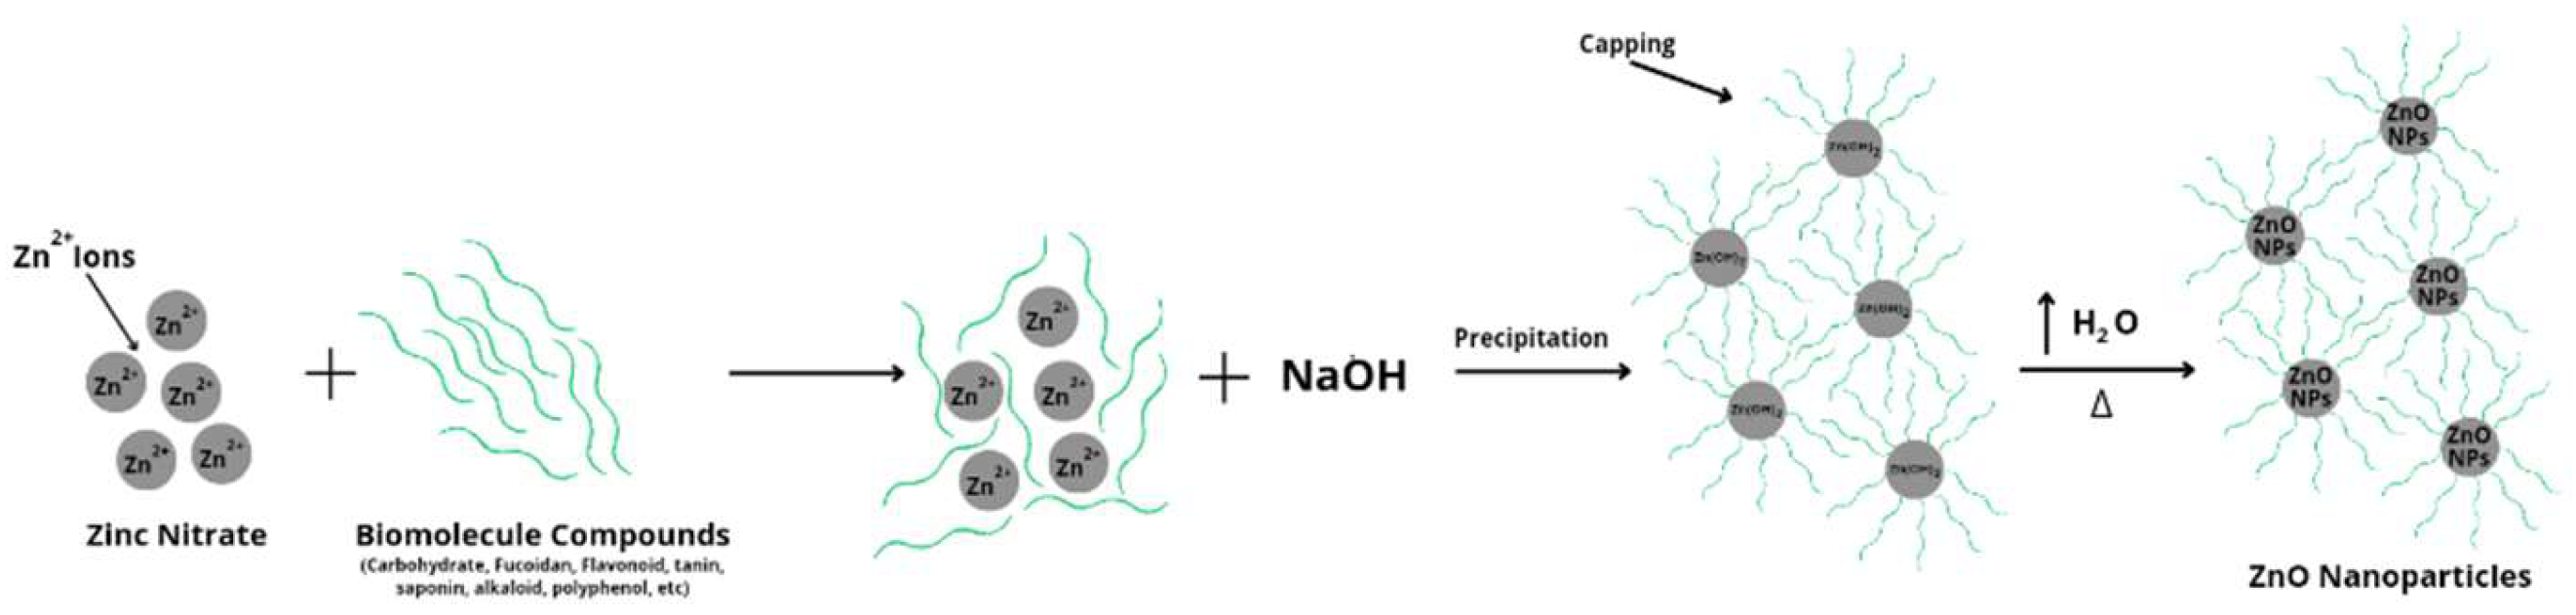
Figure 3.
Results of Modification of Cotton Fabric with ZnO Nanoparticles and/or Silane Compounds.
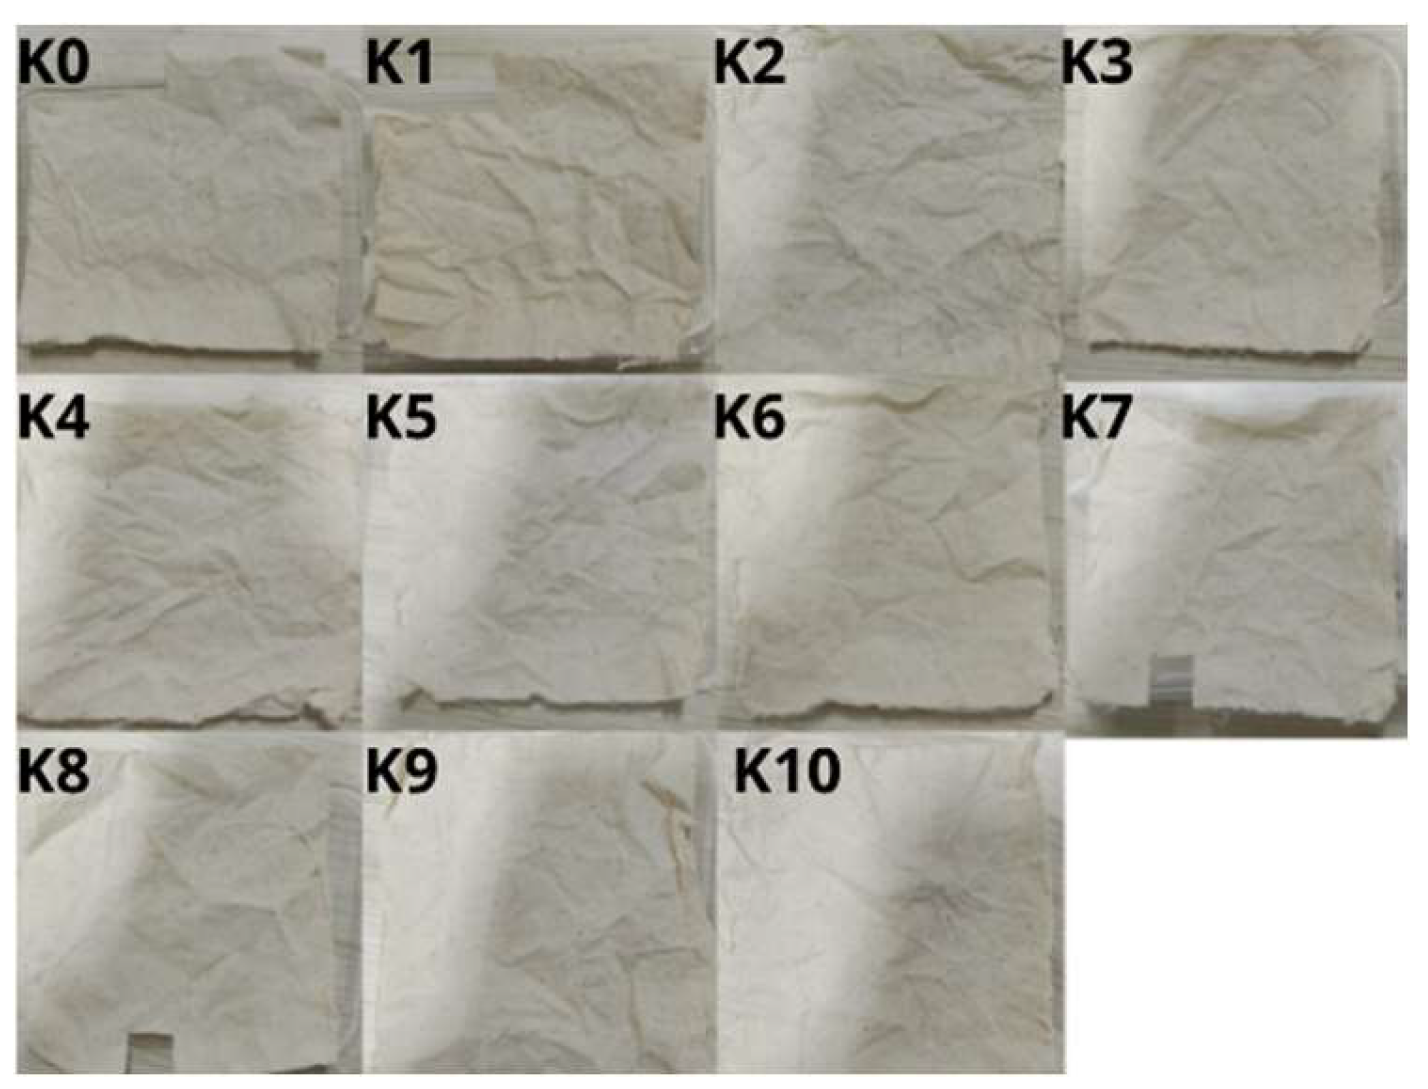
Figure 4.
Comparison of Spectral K0, K1, and ZnO Nanoparticles (a) Stacked Lines by Y Offset (b) Magnification of 450 and 452 cm-1 Area.
Figure 4.
Comparison of Spectral K0, K1, and ZnO Nanoparticles (a) Stacked Lines by Y Offset (b) Magnification of 450 and 452 cm-1 Area.
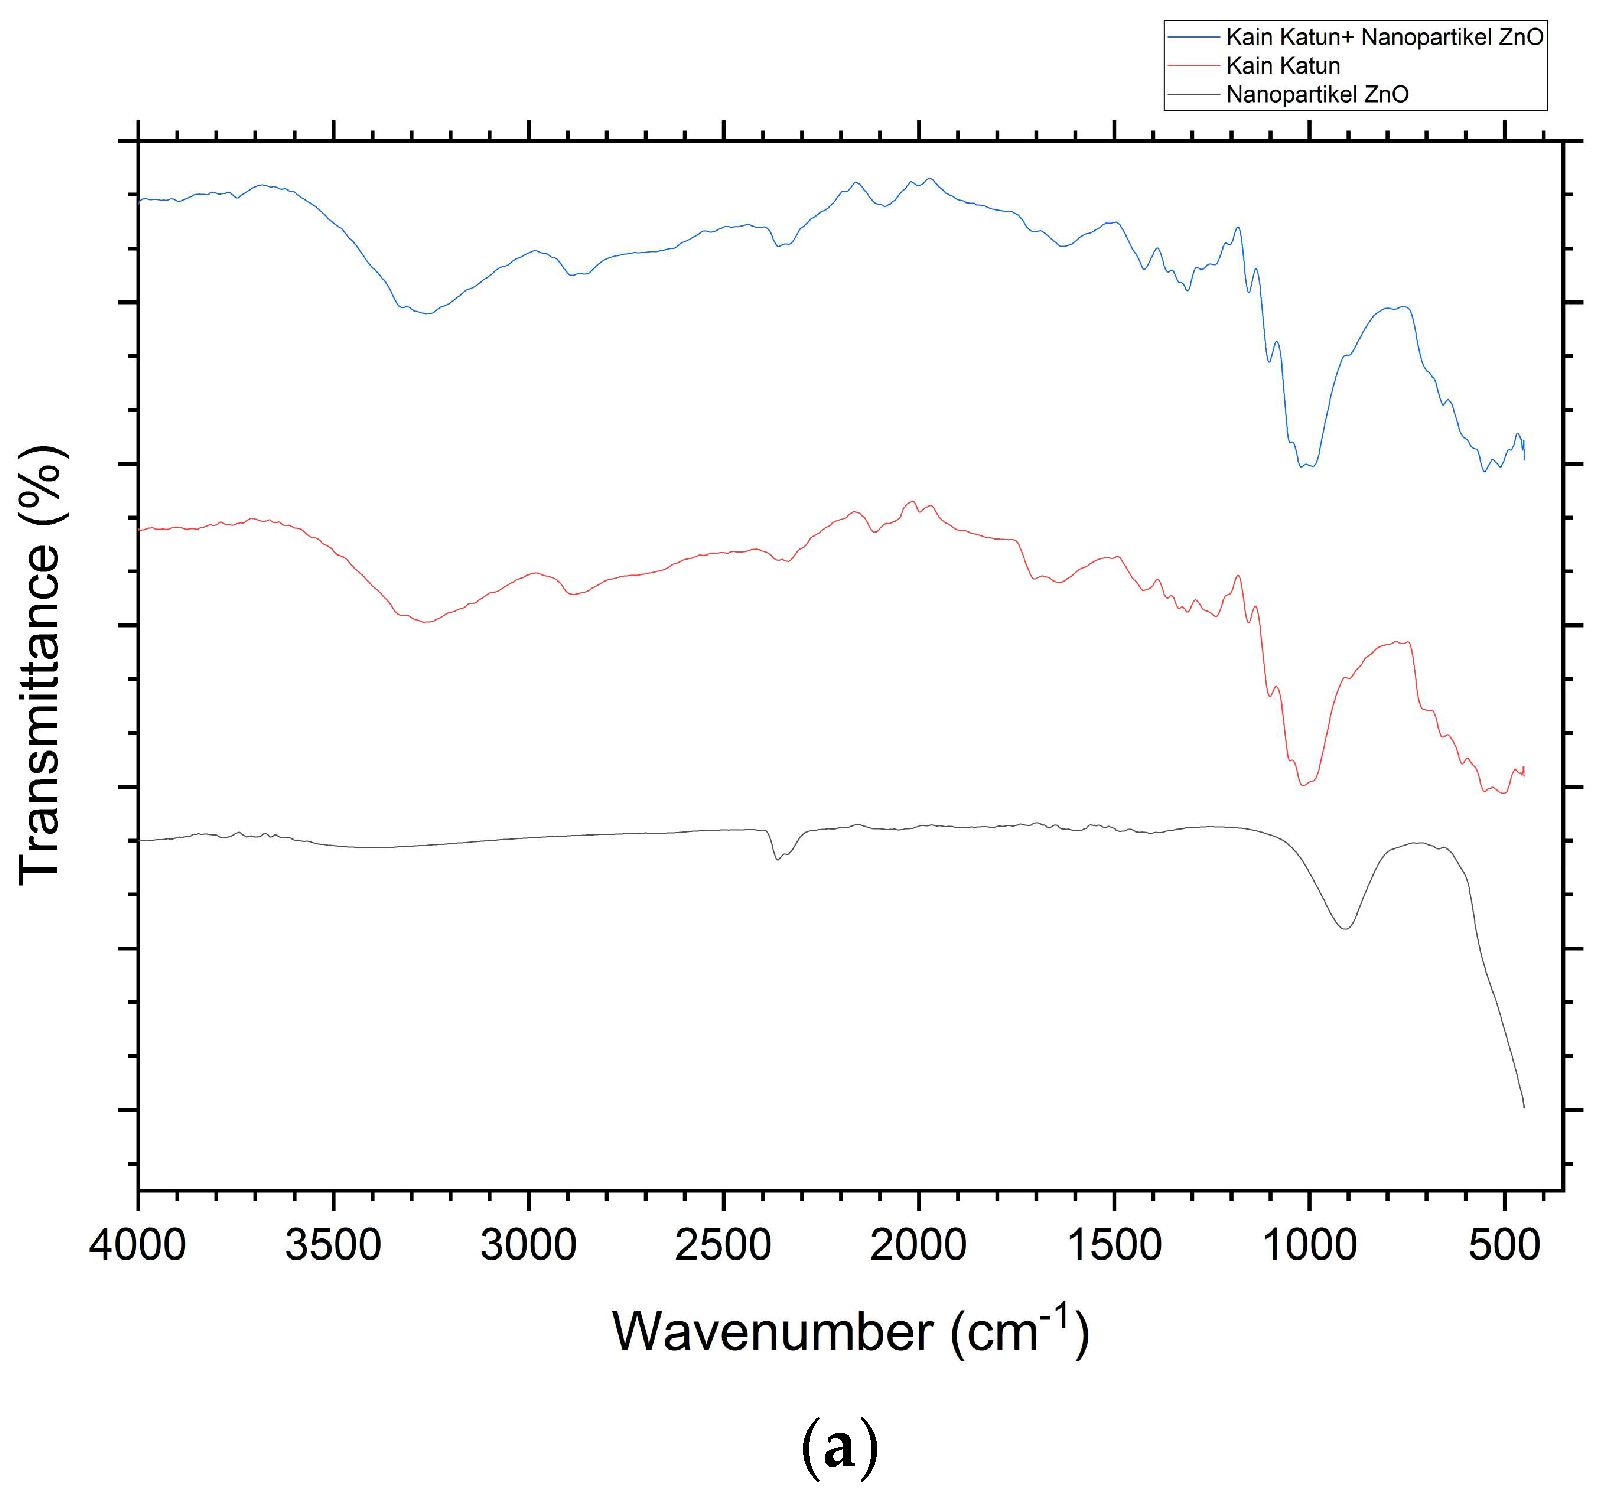
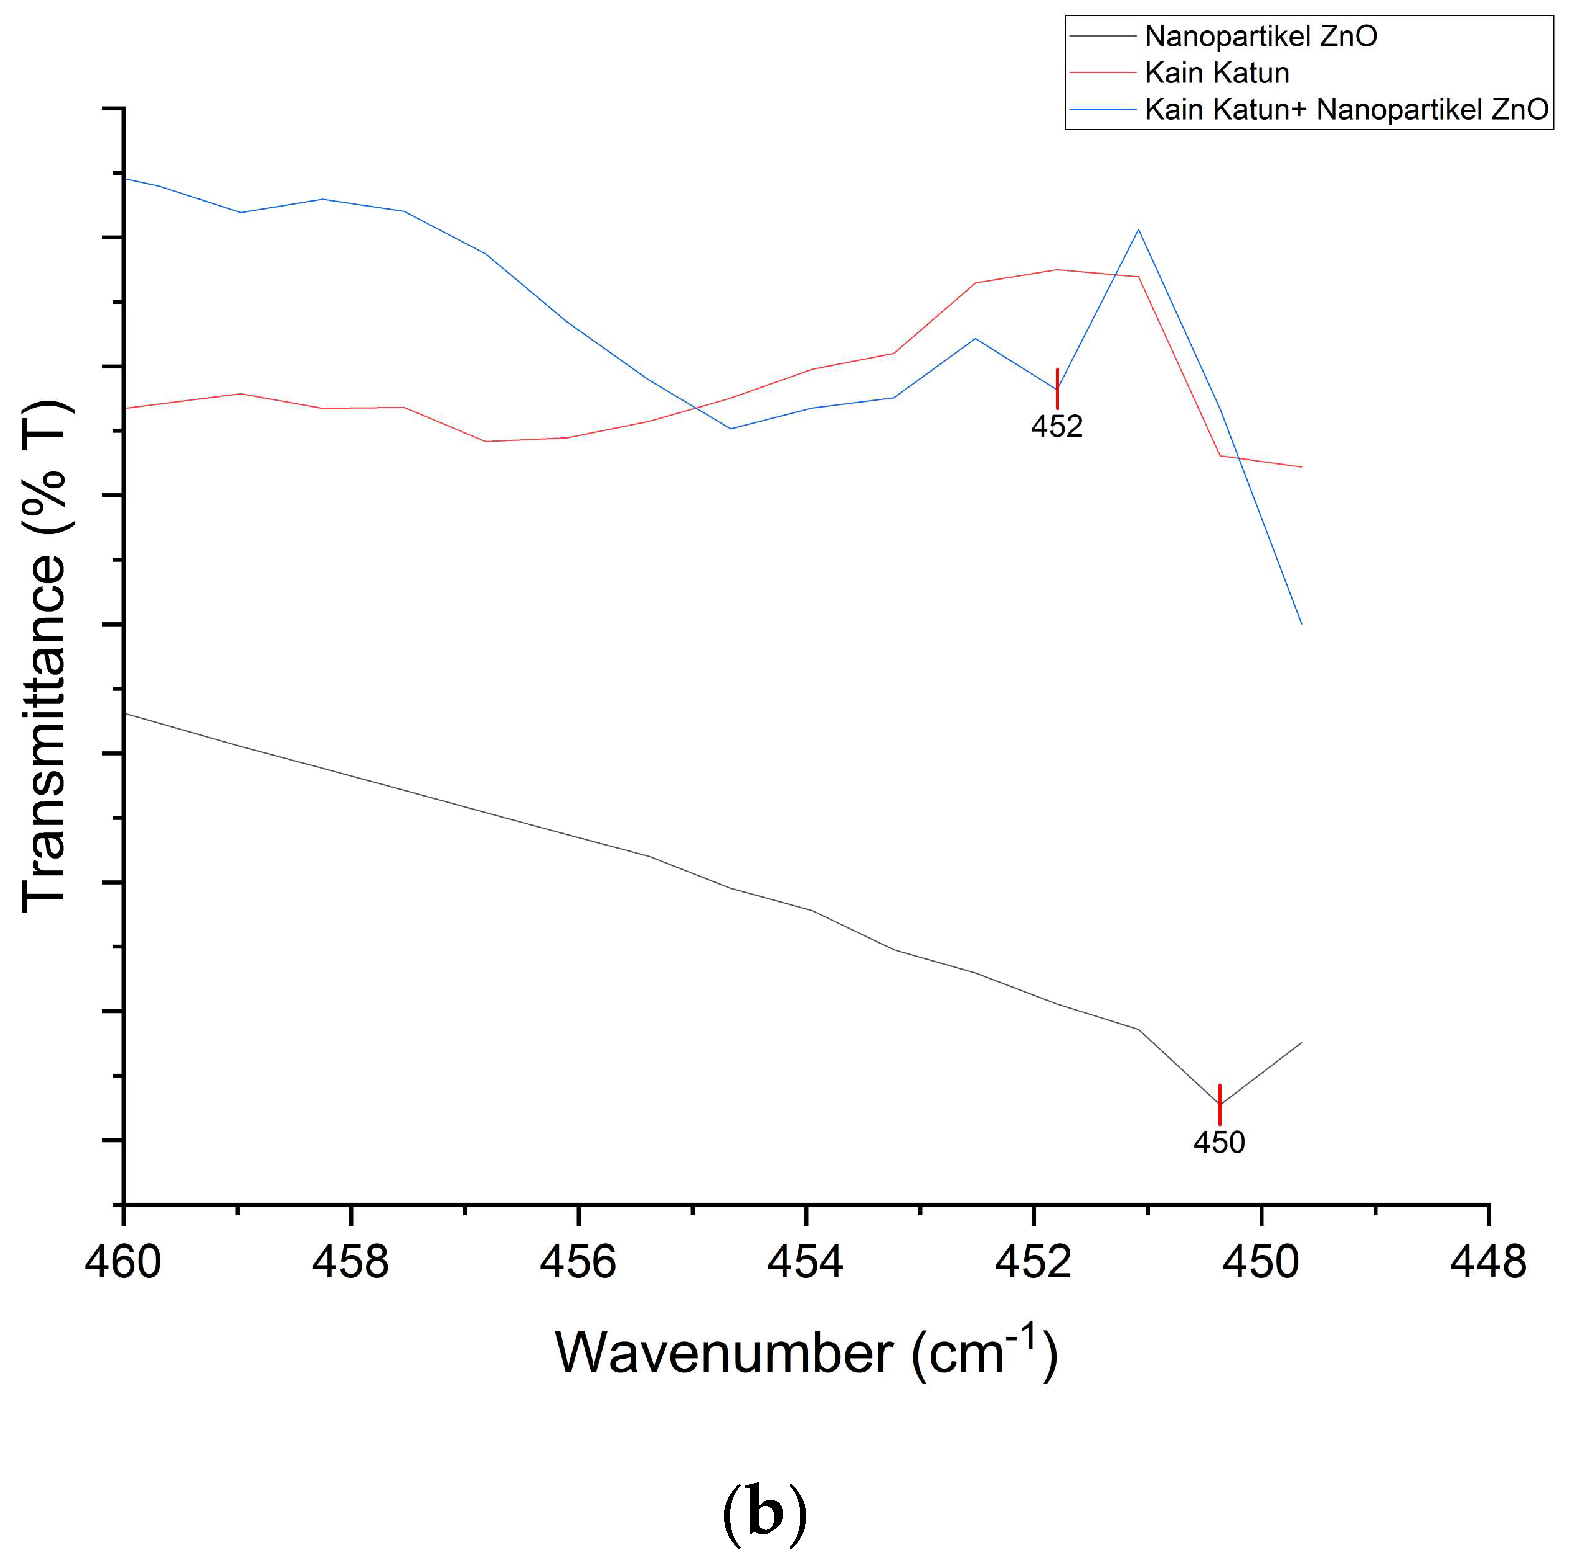
Figure 5.
Difractogram of ZnO Nanoparticles (a) Before (b) After Compared with COD Database 96-900-4180.
Figure 5.
Difractogram of ZnO Nanoparticles (a) Before (b) After Compared with COD Database 96-900-4180.
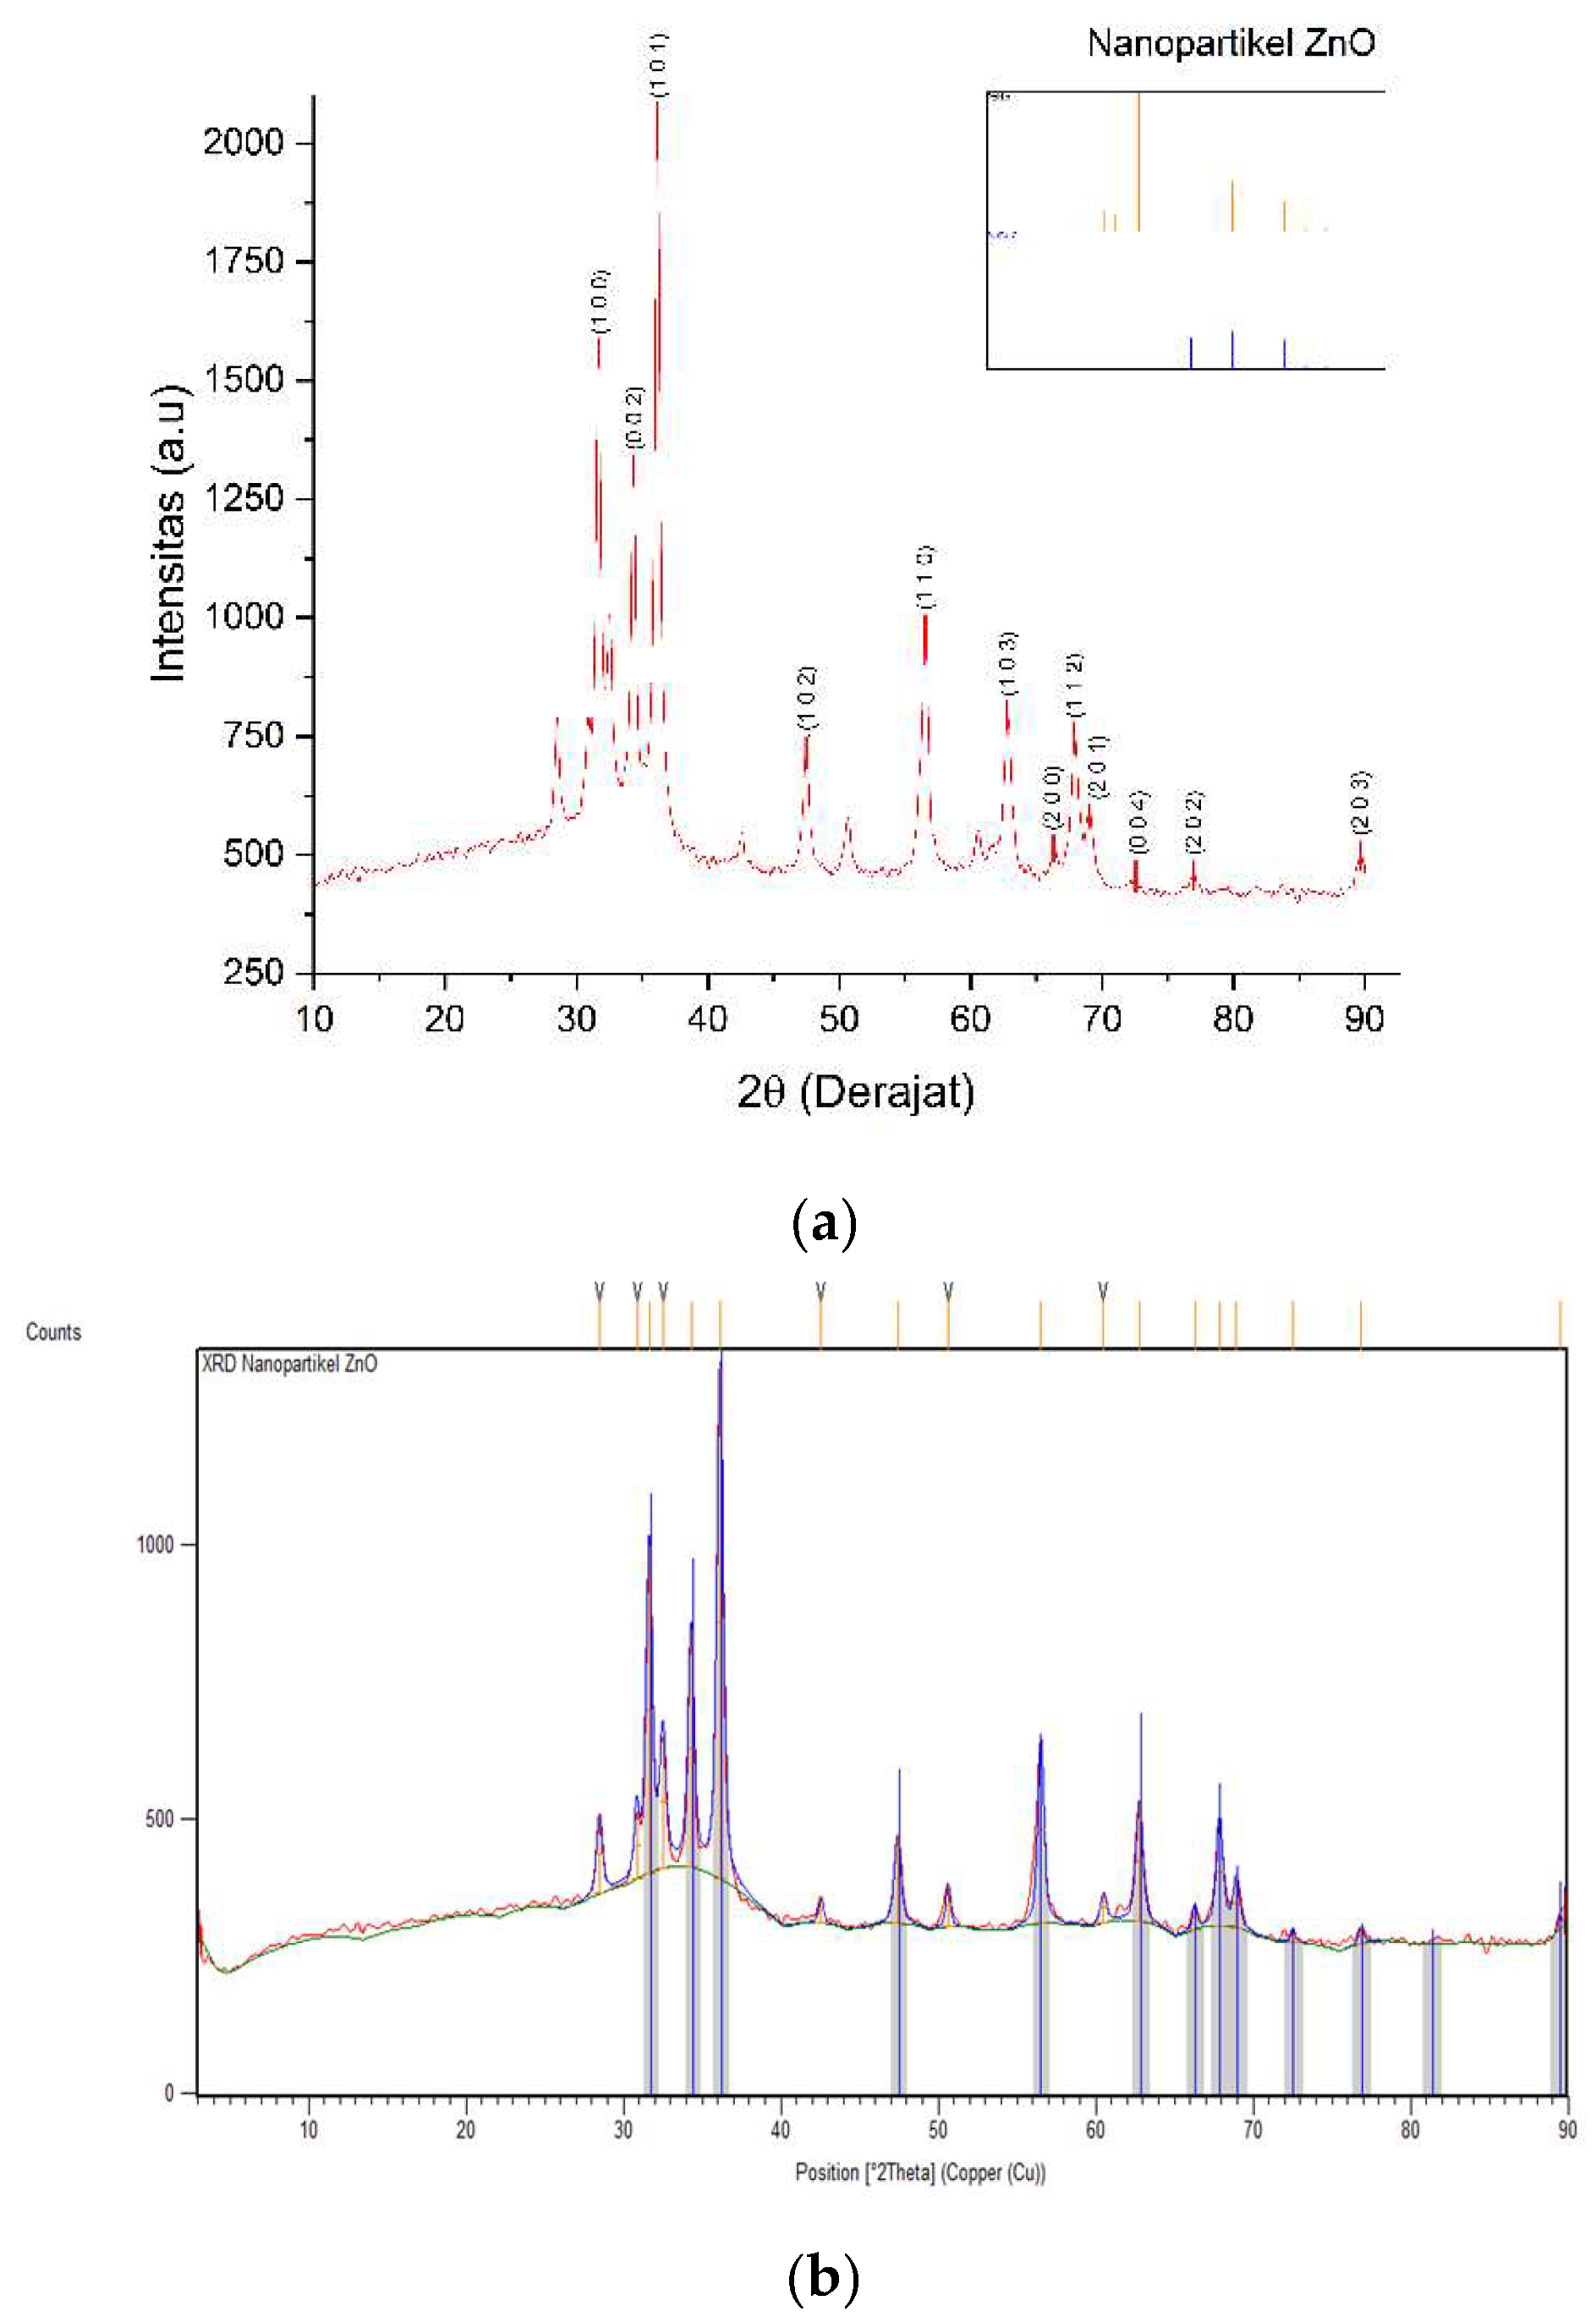
Figure 6.
Difractogram of Cotton Fabric Deposited Nanoparticles ZnO (K1).
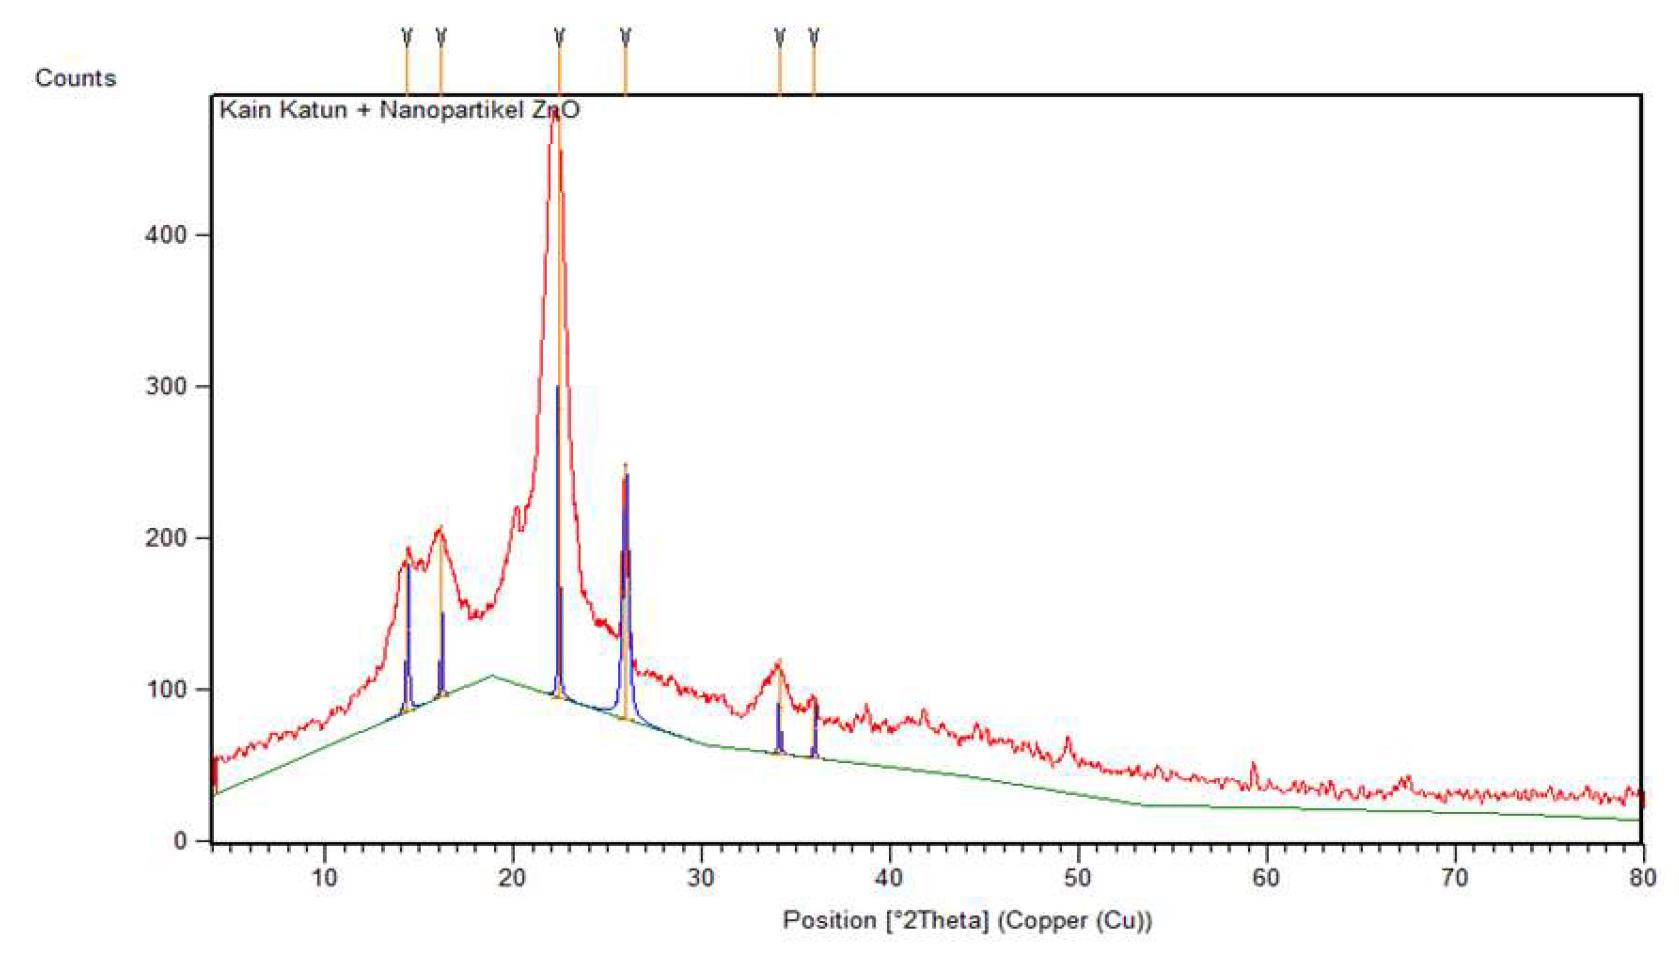
Figure 7.
Image SEM ZnO Nanoparticles with JEOL JSM-6510LA Magnification (a) 10000 x; (b) 20000 x; (c) 50000 x, Axia ChemiSEM Magnification (d) 50000 x; (e) 100000 x; (f) 200000 x, FESEM JEOL JSM-IT700HR Magnification (g) 50000 x.
Figure 7.
Image SEM ZnO Nanoparticles with JEOL JSM-6510LA Magnification (a) 10000 x; (b) 20000 x; (c) 50000 x, Axia ChemiSEM Magnification (d) 50000 x; (e) 100000 x; (f) 200000 x, FESEM JEOL JSM-IT700HR Magnification (g) 50000 x.
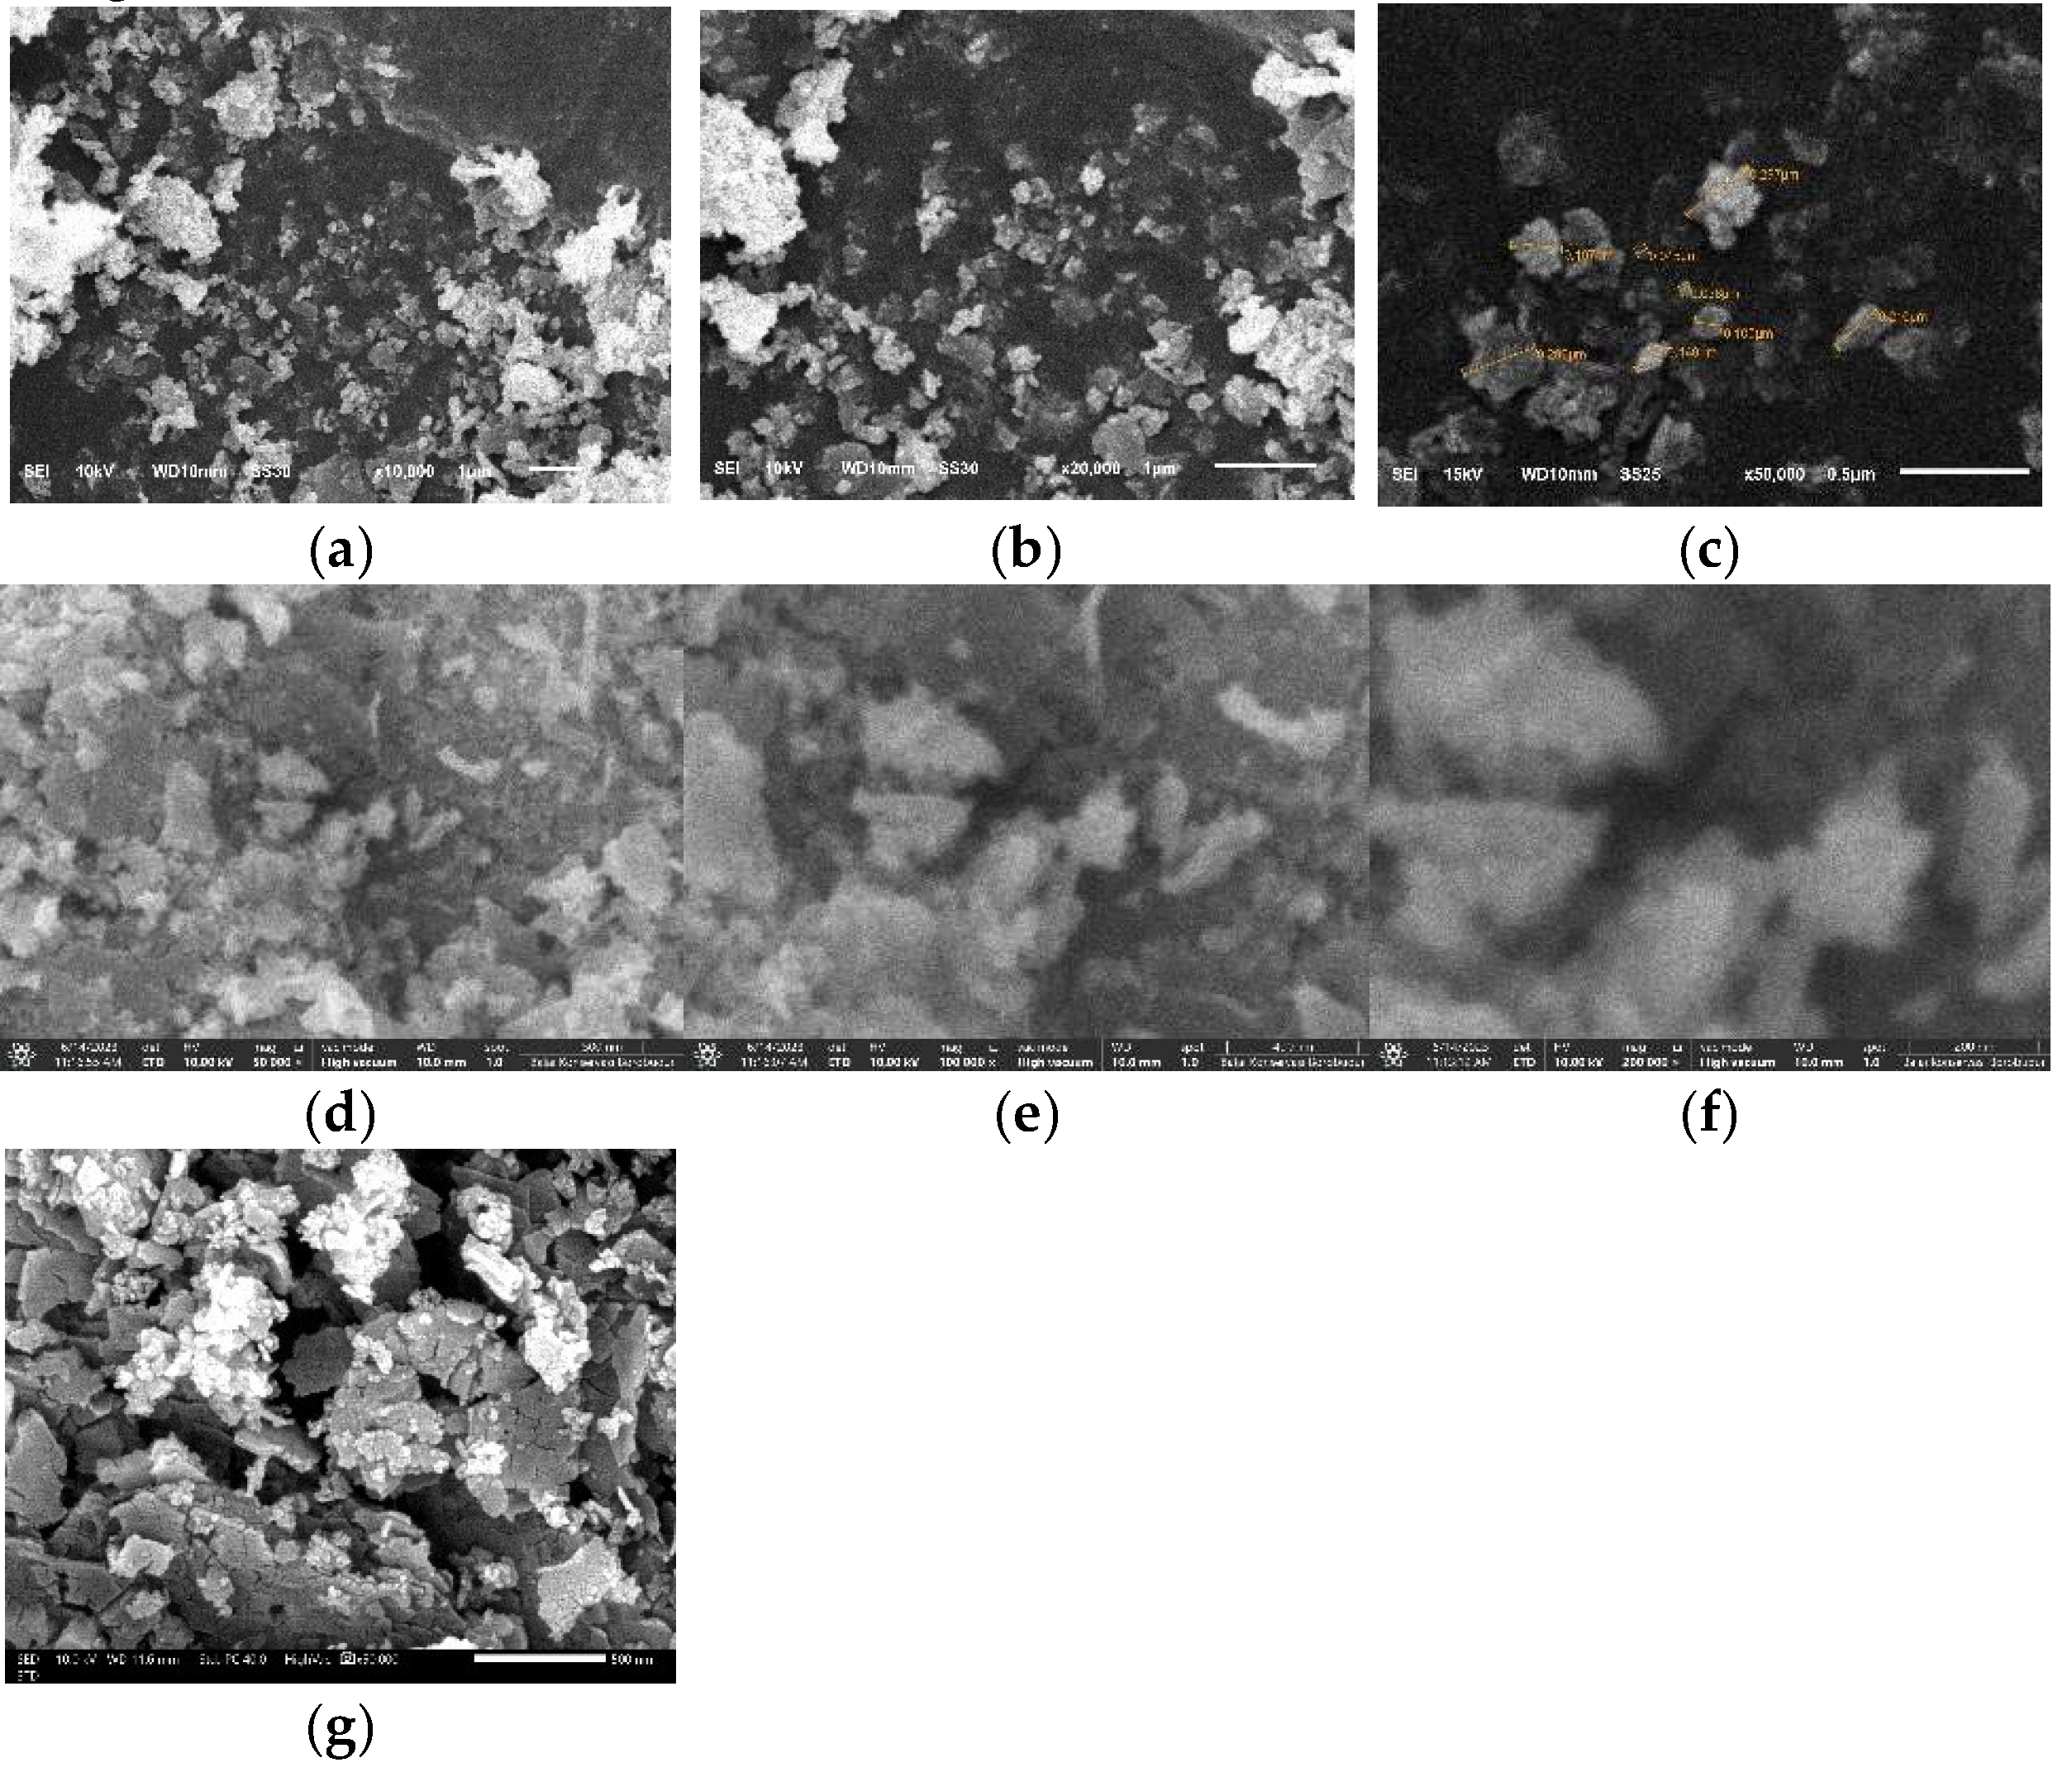
Figure 8.
EDS Results of ZnO Nanoparticle.
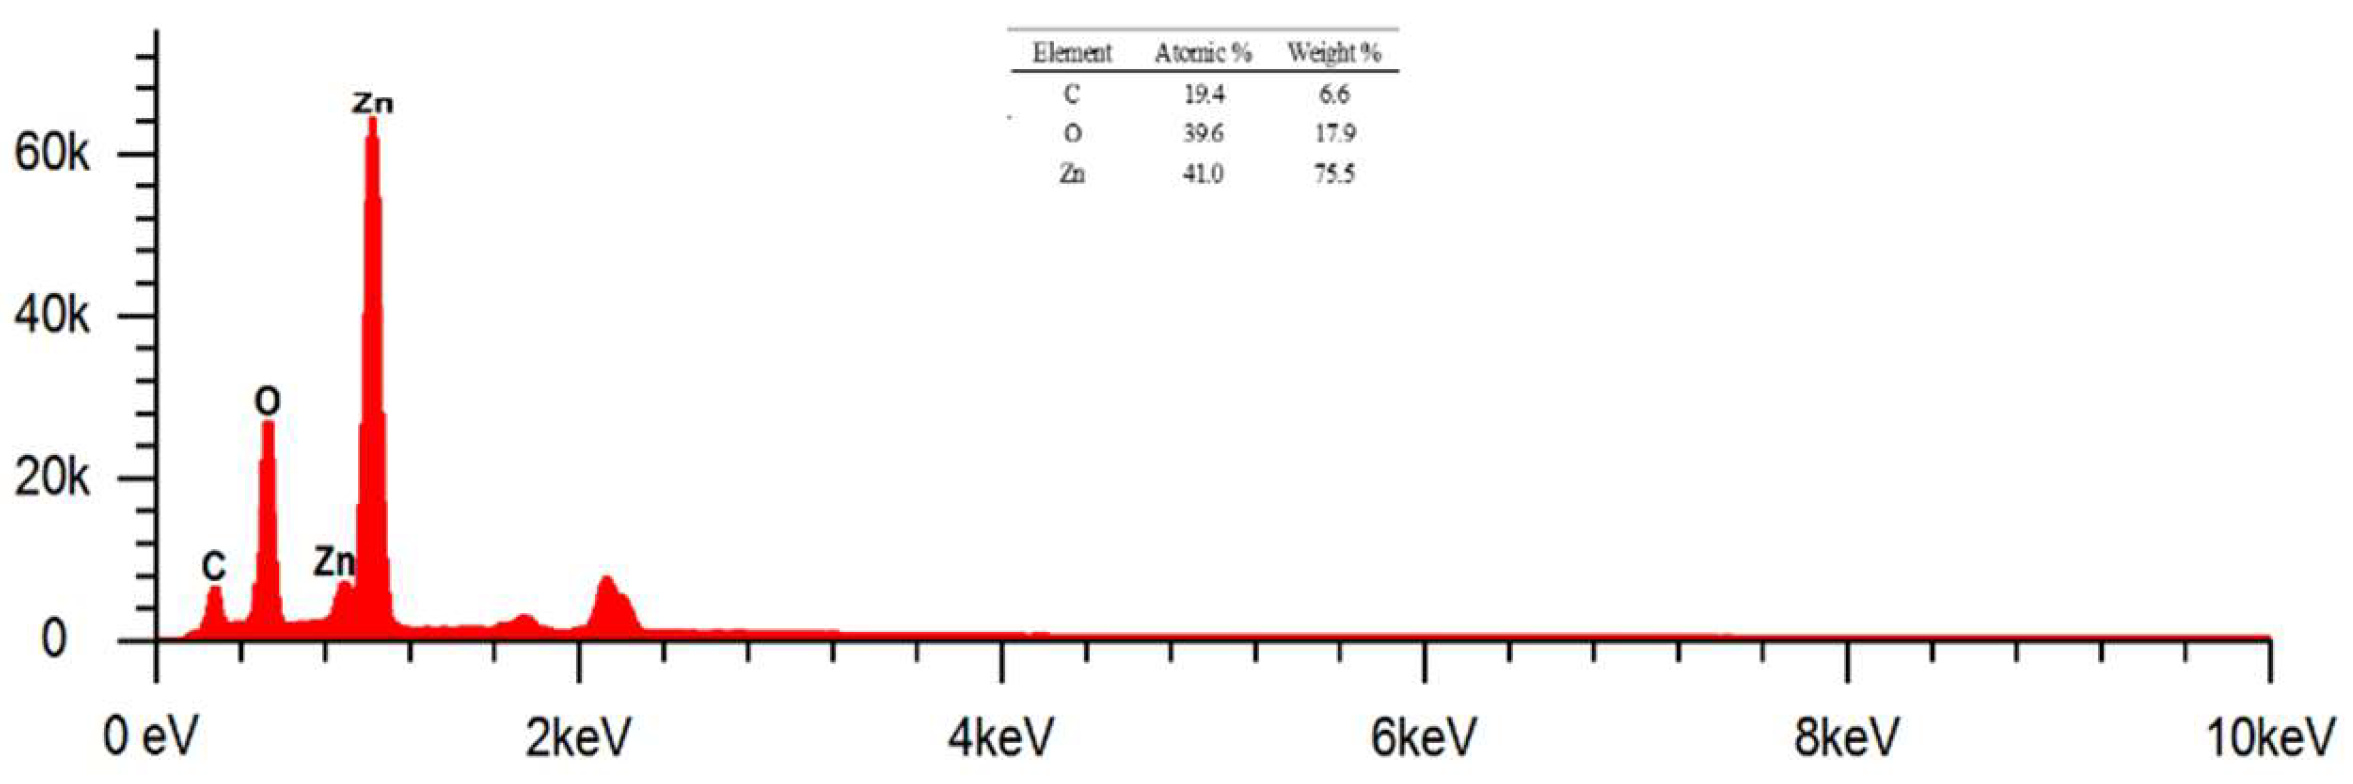
Figure 9.
SEM Image of Cotton Fabric with Phenom Pro X G6 Magnification (a) 1000 x; (b) 2000 x; (c) 5000 x.
Figure 9.
SEM Image of Cotton Fabric with Phenom Pro X G6 Magnification (a) 1000 x; (b) 2000 x; (c) 5000 x.
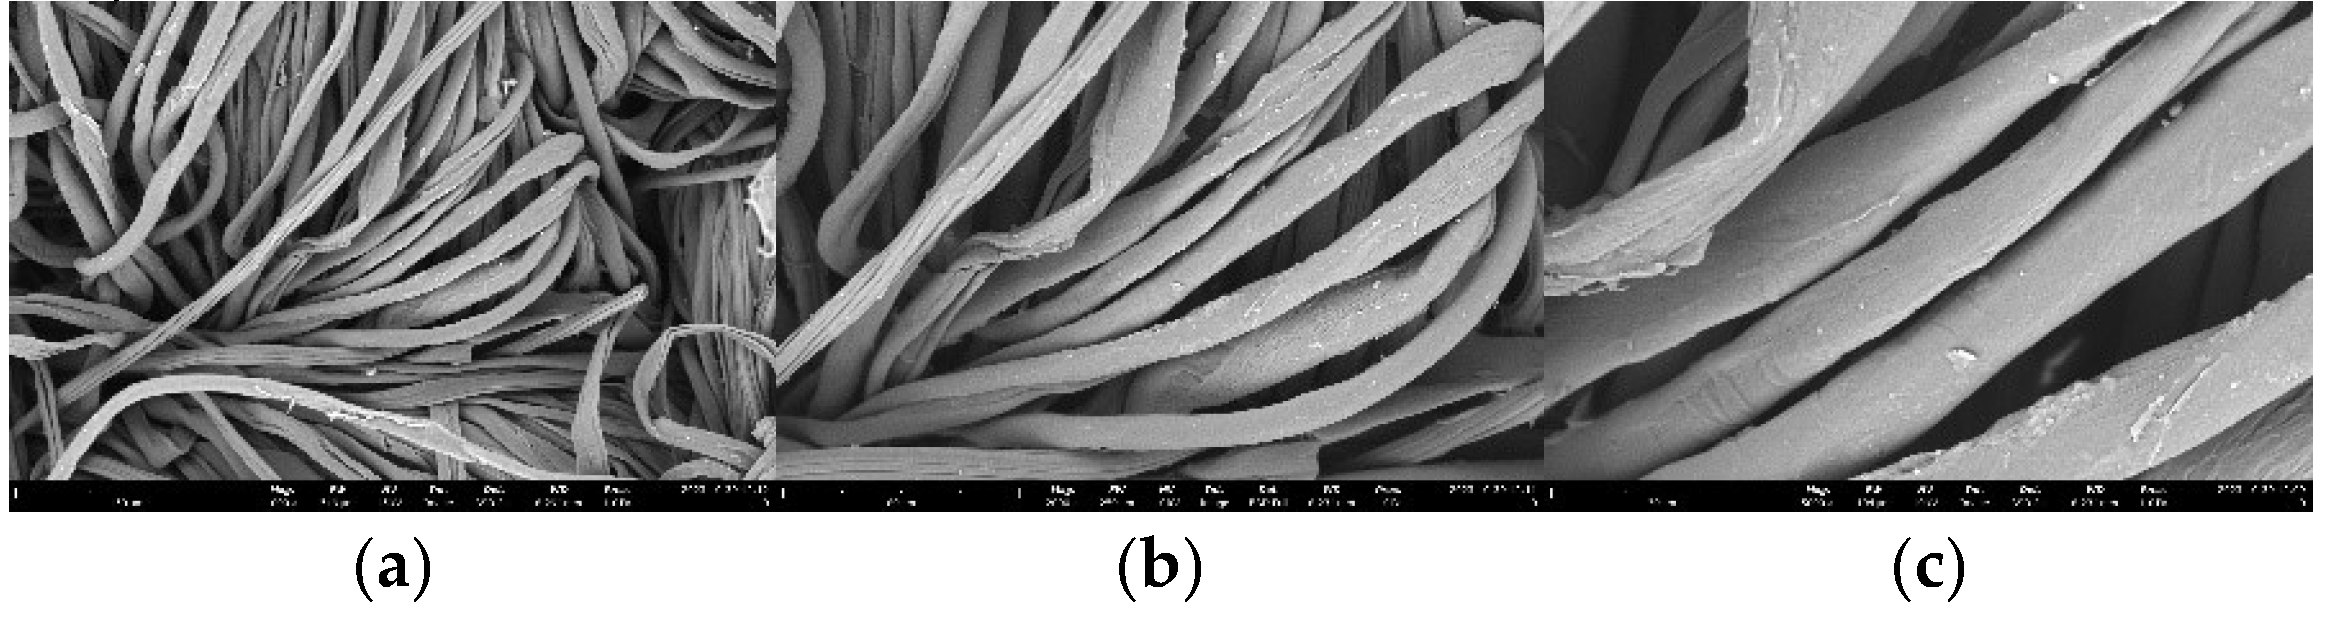
Figure 10.
EDS Region Results Cotton Fabric Enlargement 5000 x.
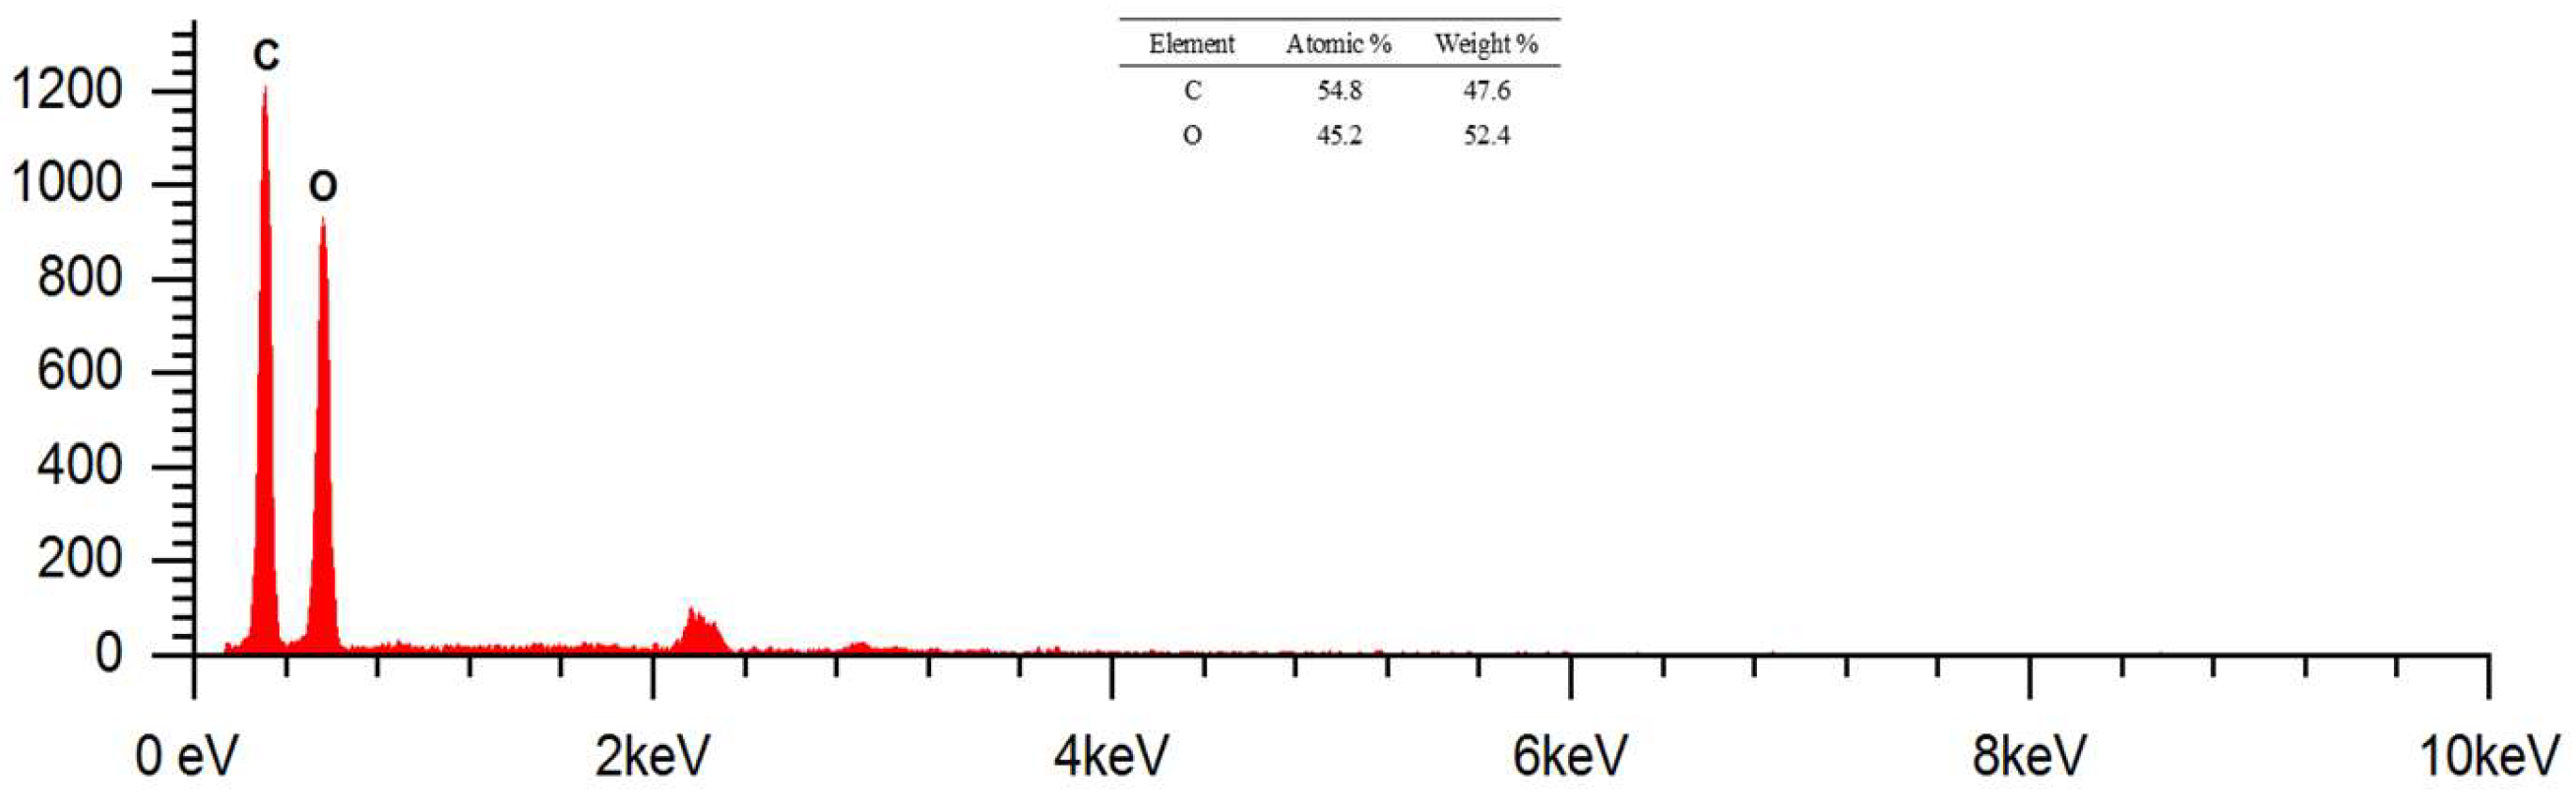
Figure 11.
SEM Image of Cotton Fabric + ZnO Nanoparticles (K1) with Axia ChemiSEM magnification (a) 1000 x; (b) 3000 x; (c) 5000 x.
Figure 11.
SEM Image of Cotton Fabric + ZnO Nanoparticles (K1) with Axia ChemiSEM magnification (a) 1000 x; (b) 3000 x; (c) 5000 x.
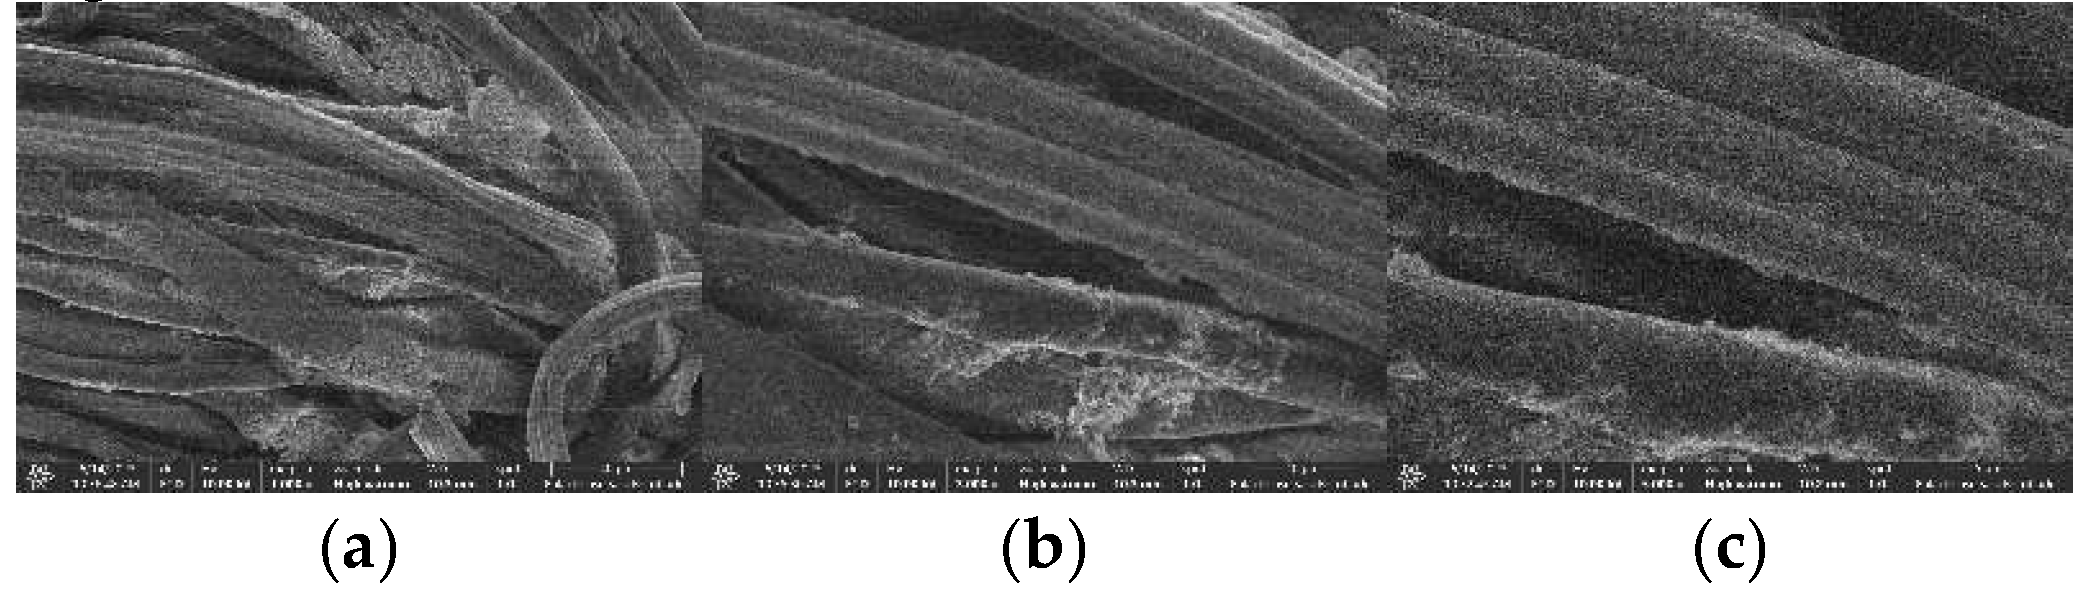
Figure 13.
SEM Image Cotton Fabric + Nanoparticles ZnO + HDTMS/MTMS (K4) with Phenom ProX G6 Magnification (a) 1000 x (b) 2000 x (c) 5000 x (d) 17500 x.
Figure 13.
SEM Image Cotton Fabric + Nanoparticles ZnO + HDTMS/MTMS (K4) with Phenom ProX G6 Magnification (a) 1000 x (b) 2000 x (c) 5000 x (d) 17500 x.
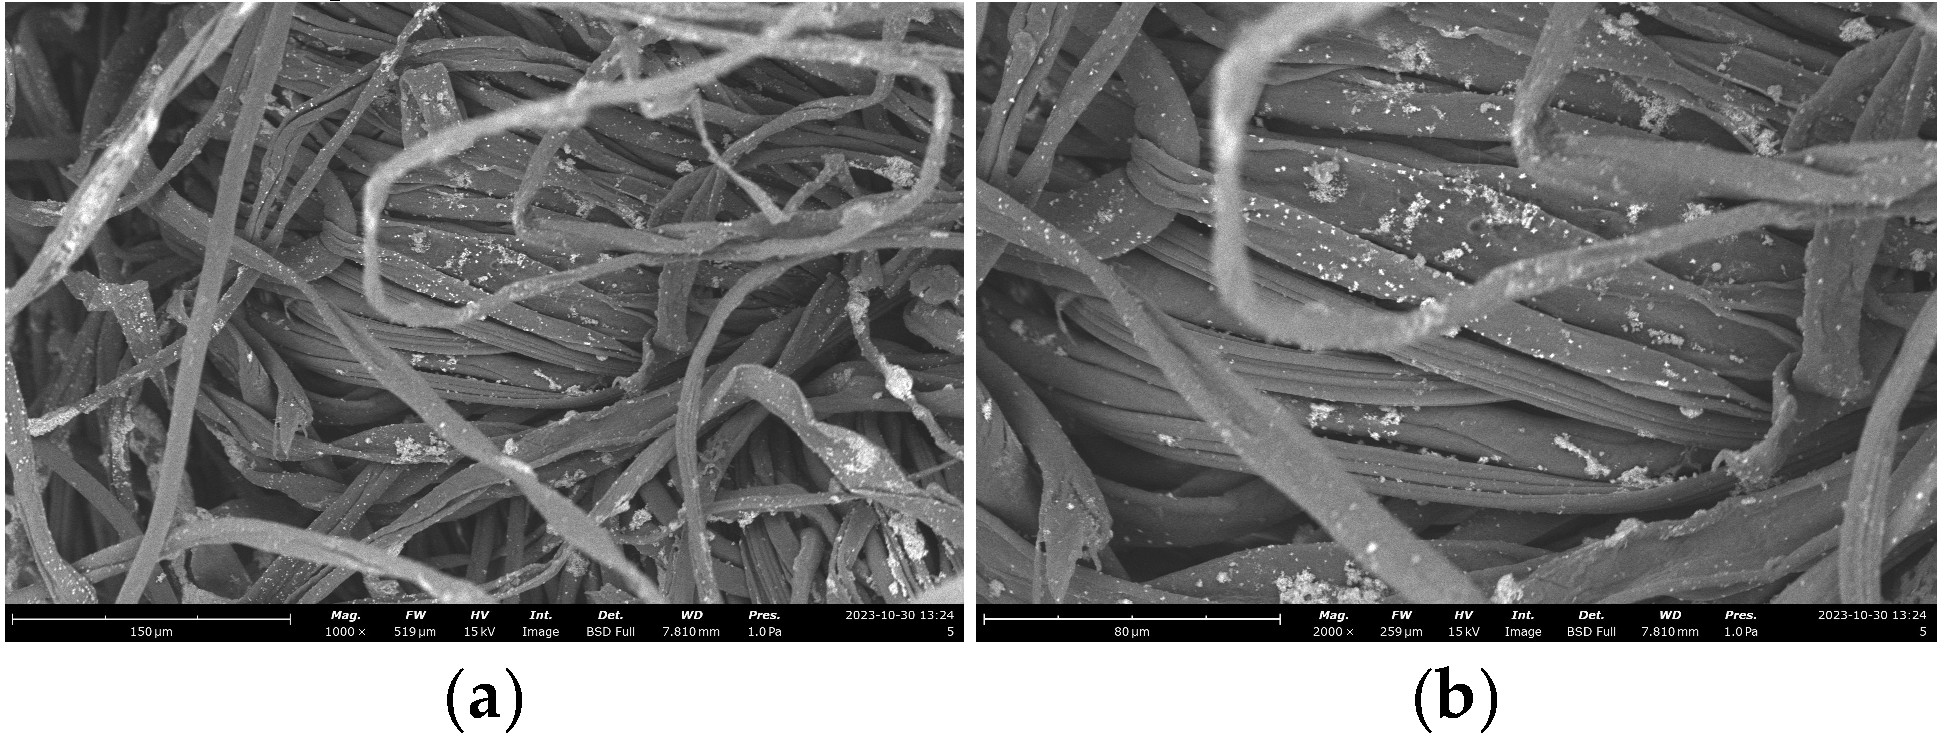
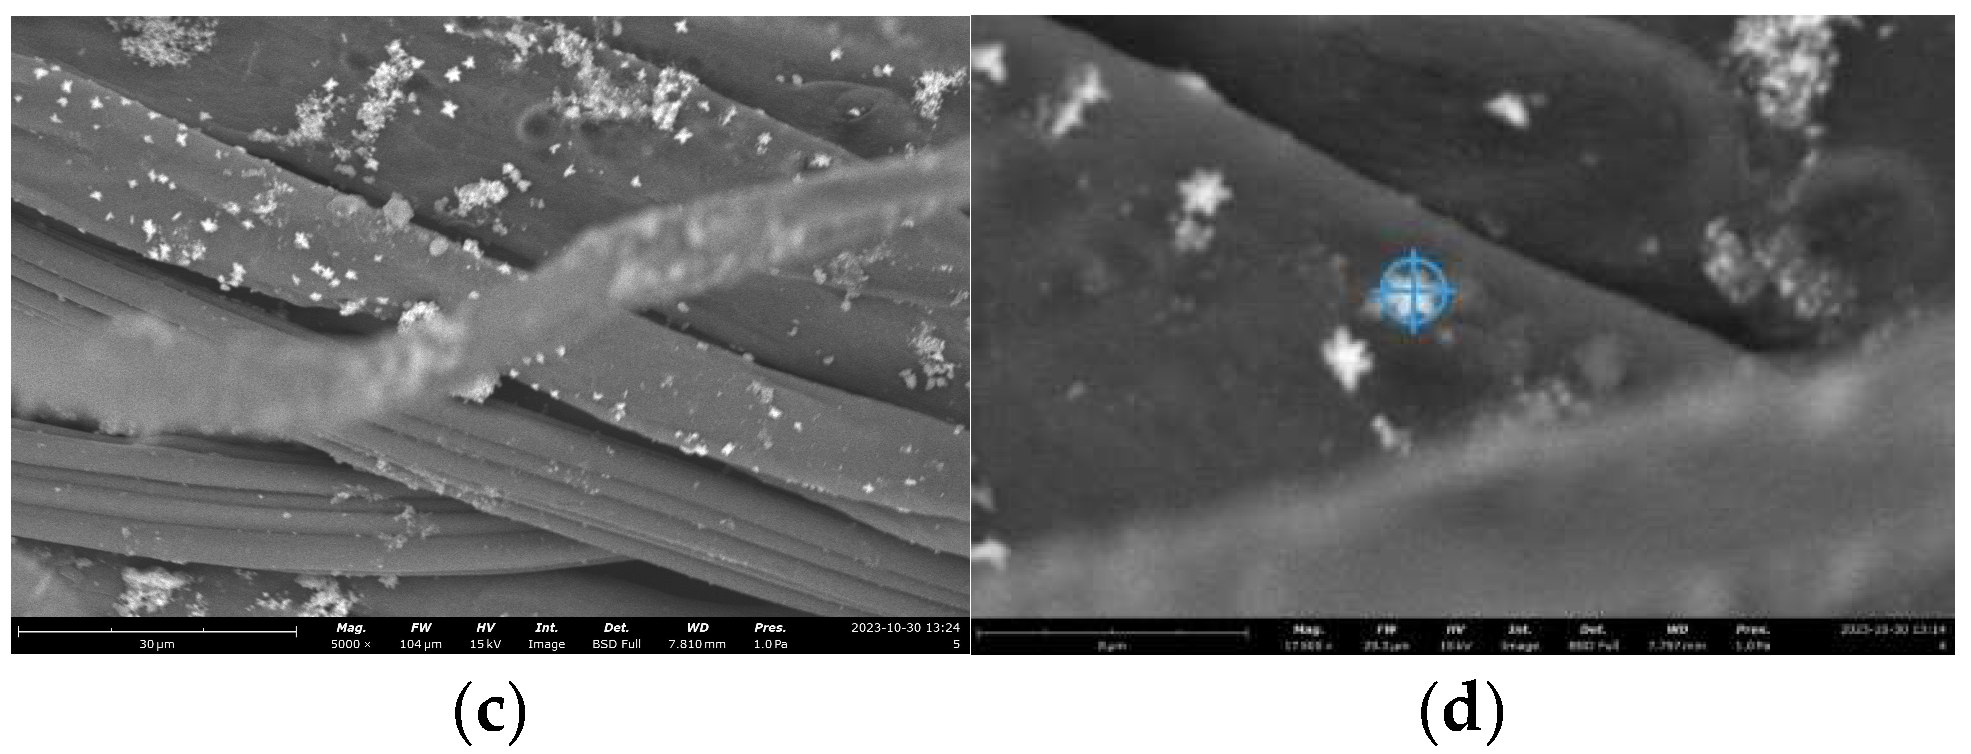
Figure 14.
EDS Results Spot Cotton Fabric + Nanoparticles ZnO + HDTMS/MTMS (K4) Magnification 17500 X.
Figure 14.
EDS Results Spot Cotton Fabric + Nanoparticles ZnO + HDTMS/MTMS (K4) Magnification 17500 X.
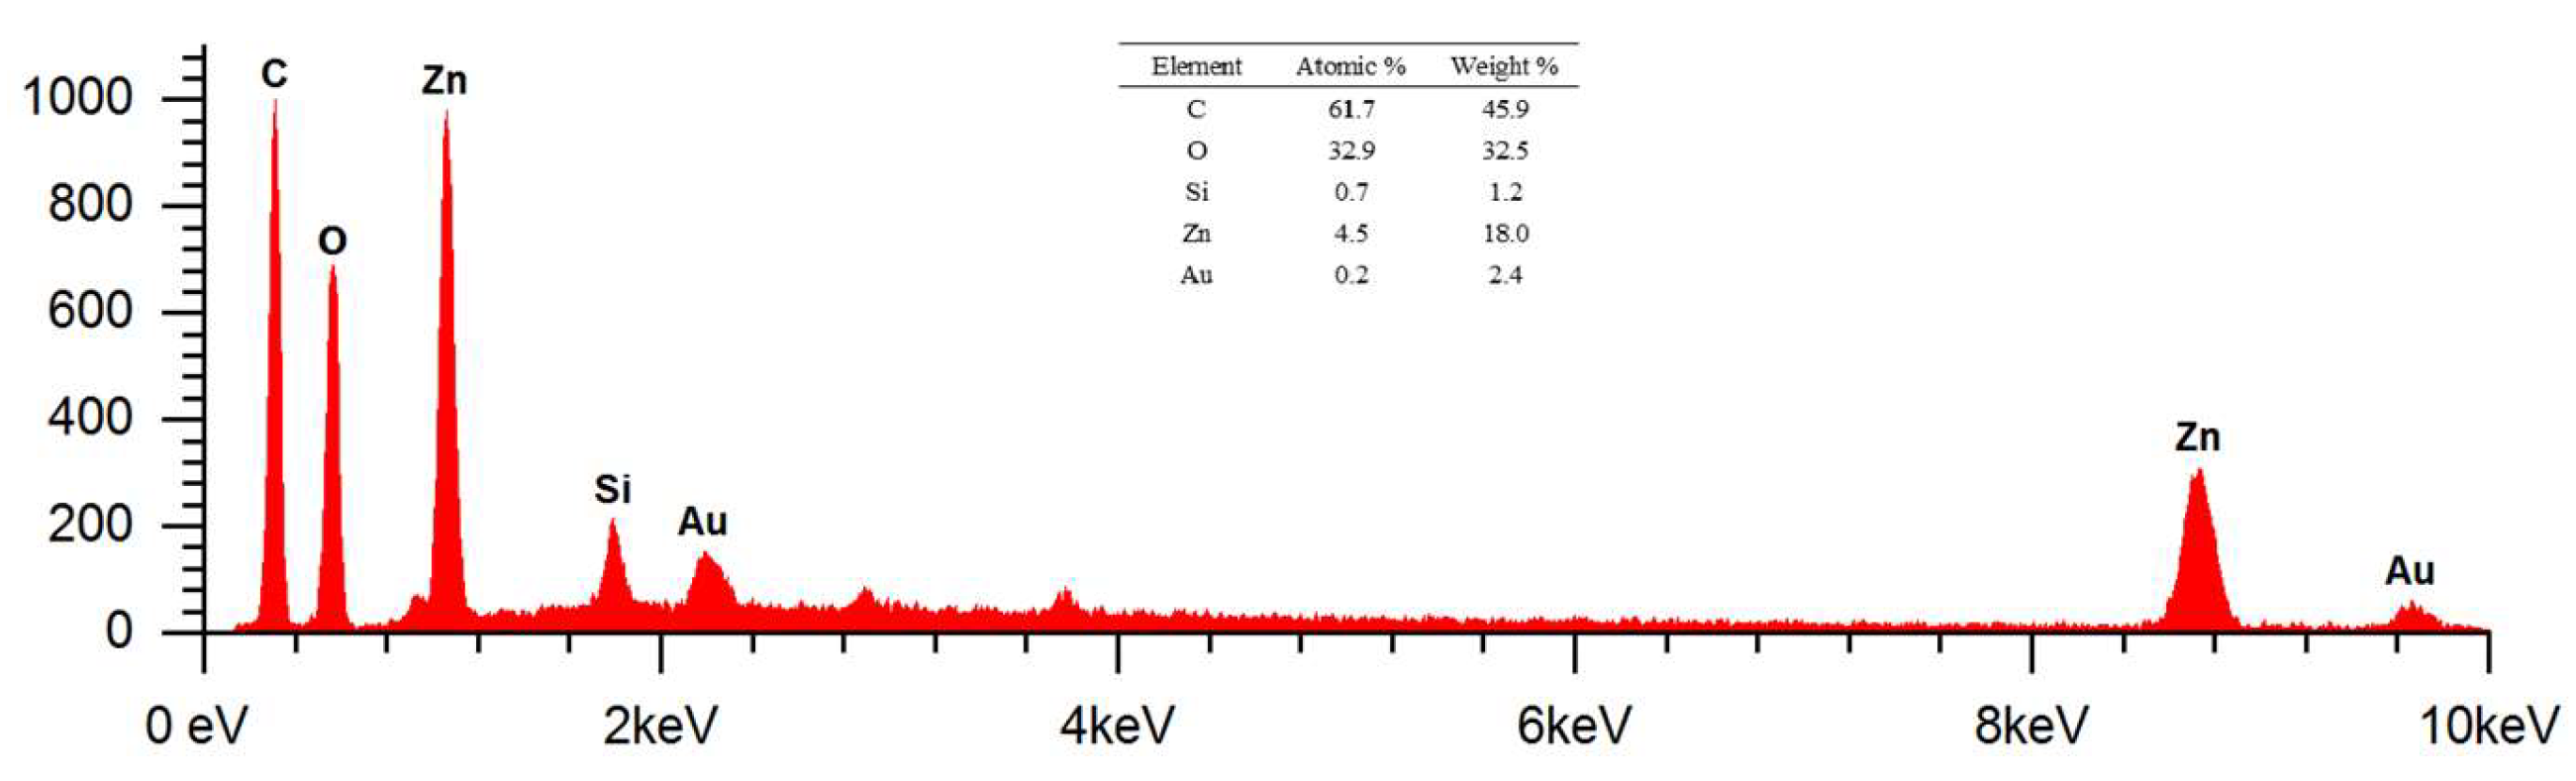
Figure 15.
Graph of the Relationship Between Pseudomonas Aeruginosa Bacterial Inhibition Zone Diameter and Incubation Time.
Figure 15.
Graph of the Relationship Between Pseudomonas Aeruginosa Bacterial Inhibition Zone Diameter and Incubation Time.
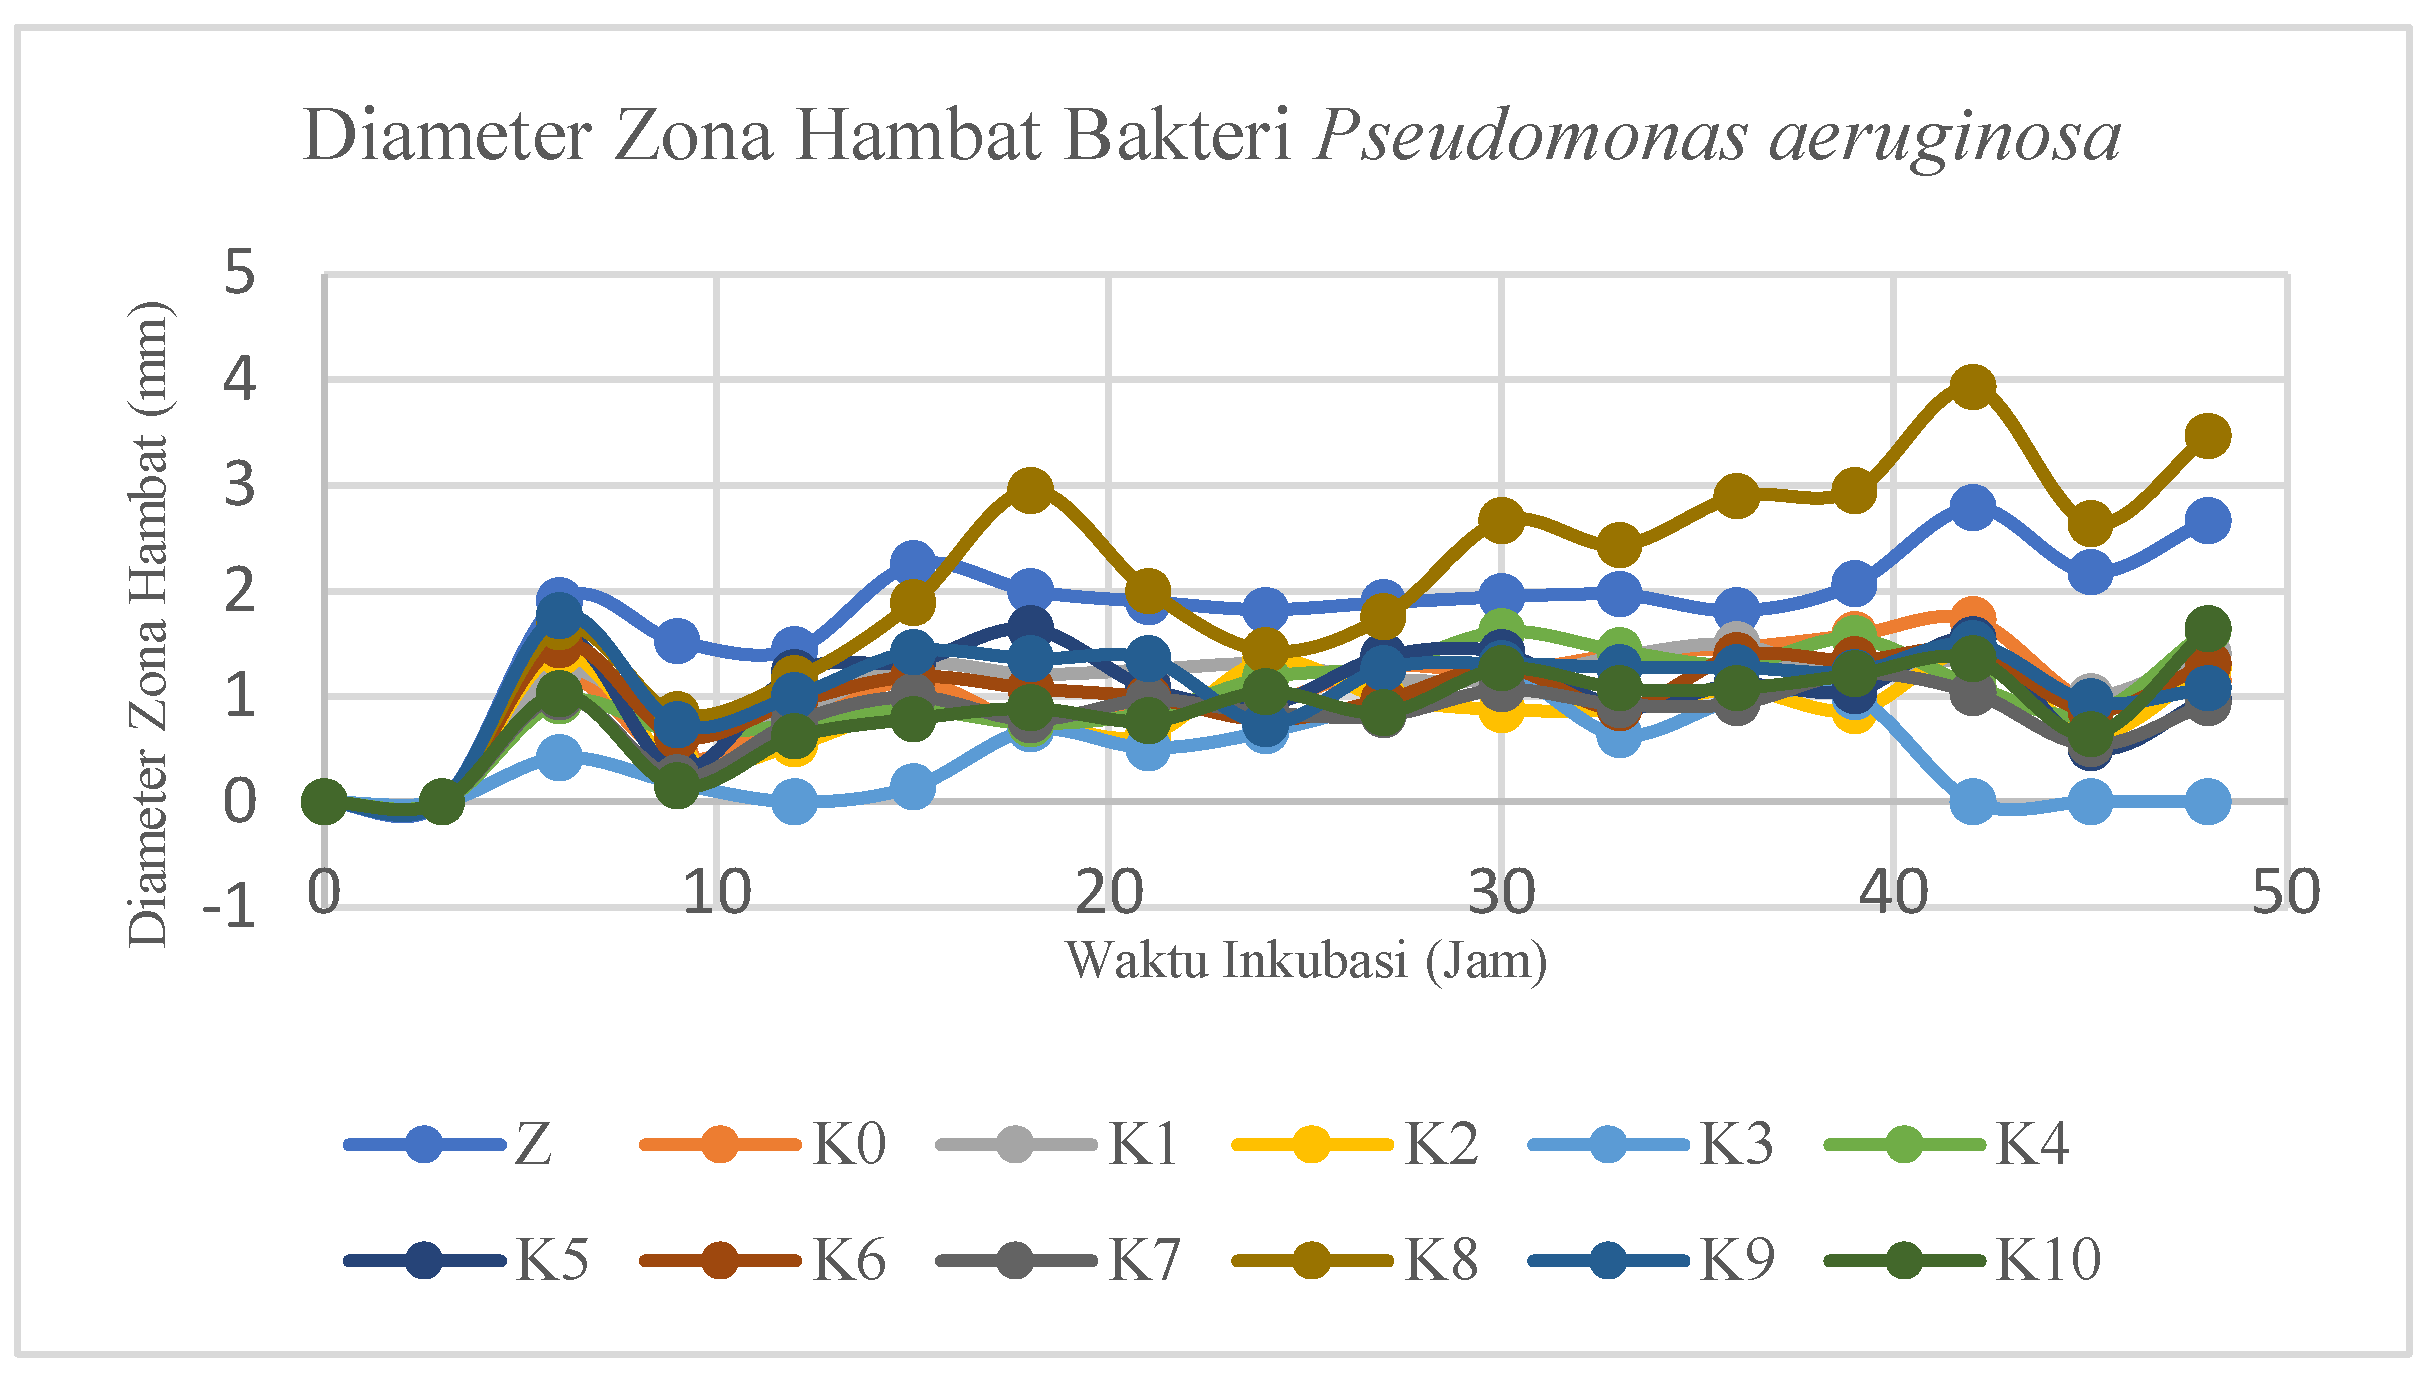
Figure 17.
Graph of the Relationship Between Diameter of the Inhibition Zone of Malassezia furfur Fungus and Incubation Time.
Figure 17.
Graph of the Relationship Between Diameter of the Inhibition Zone of Malassezia furfur Fungus and Incubation Time.
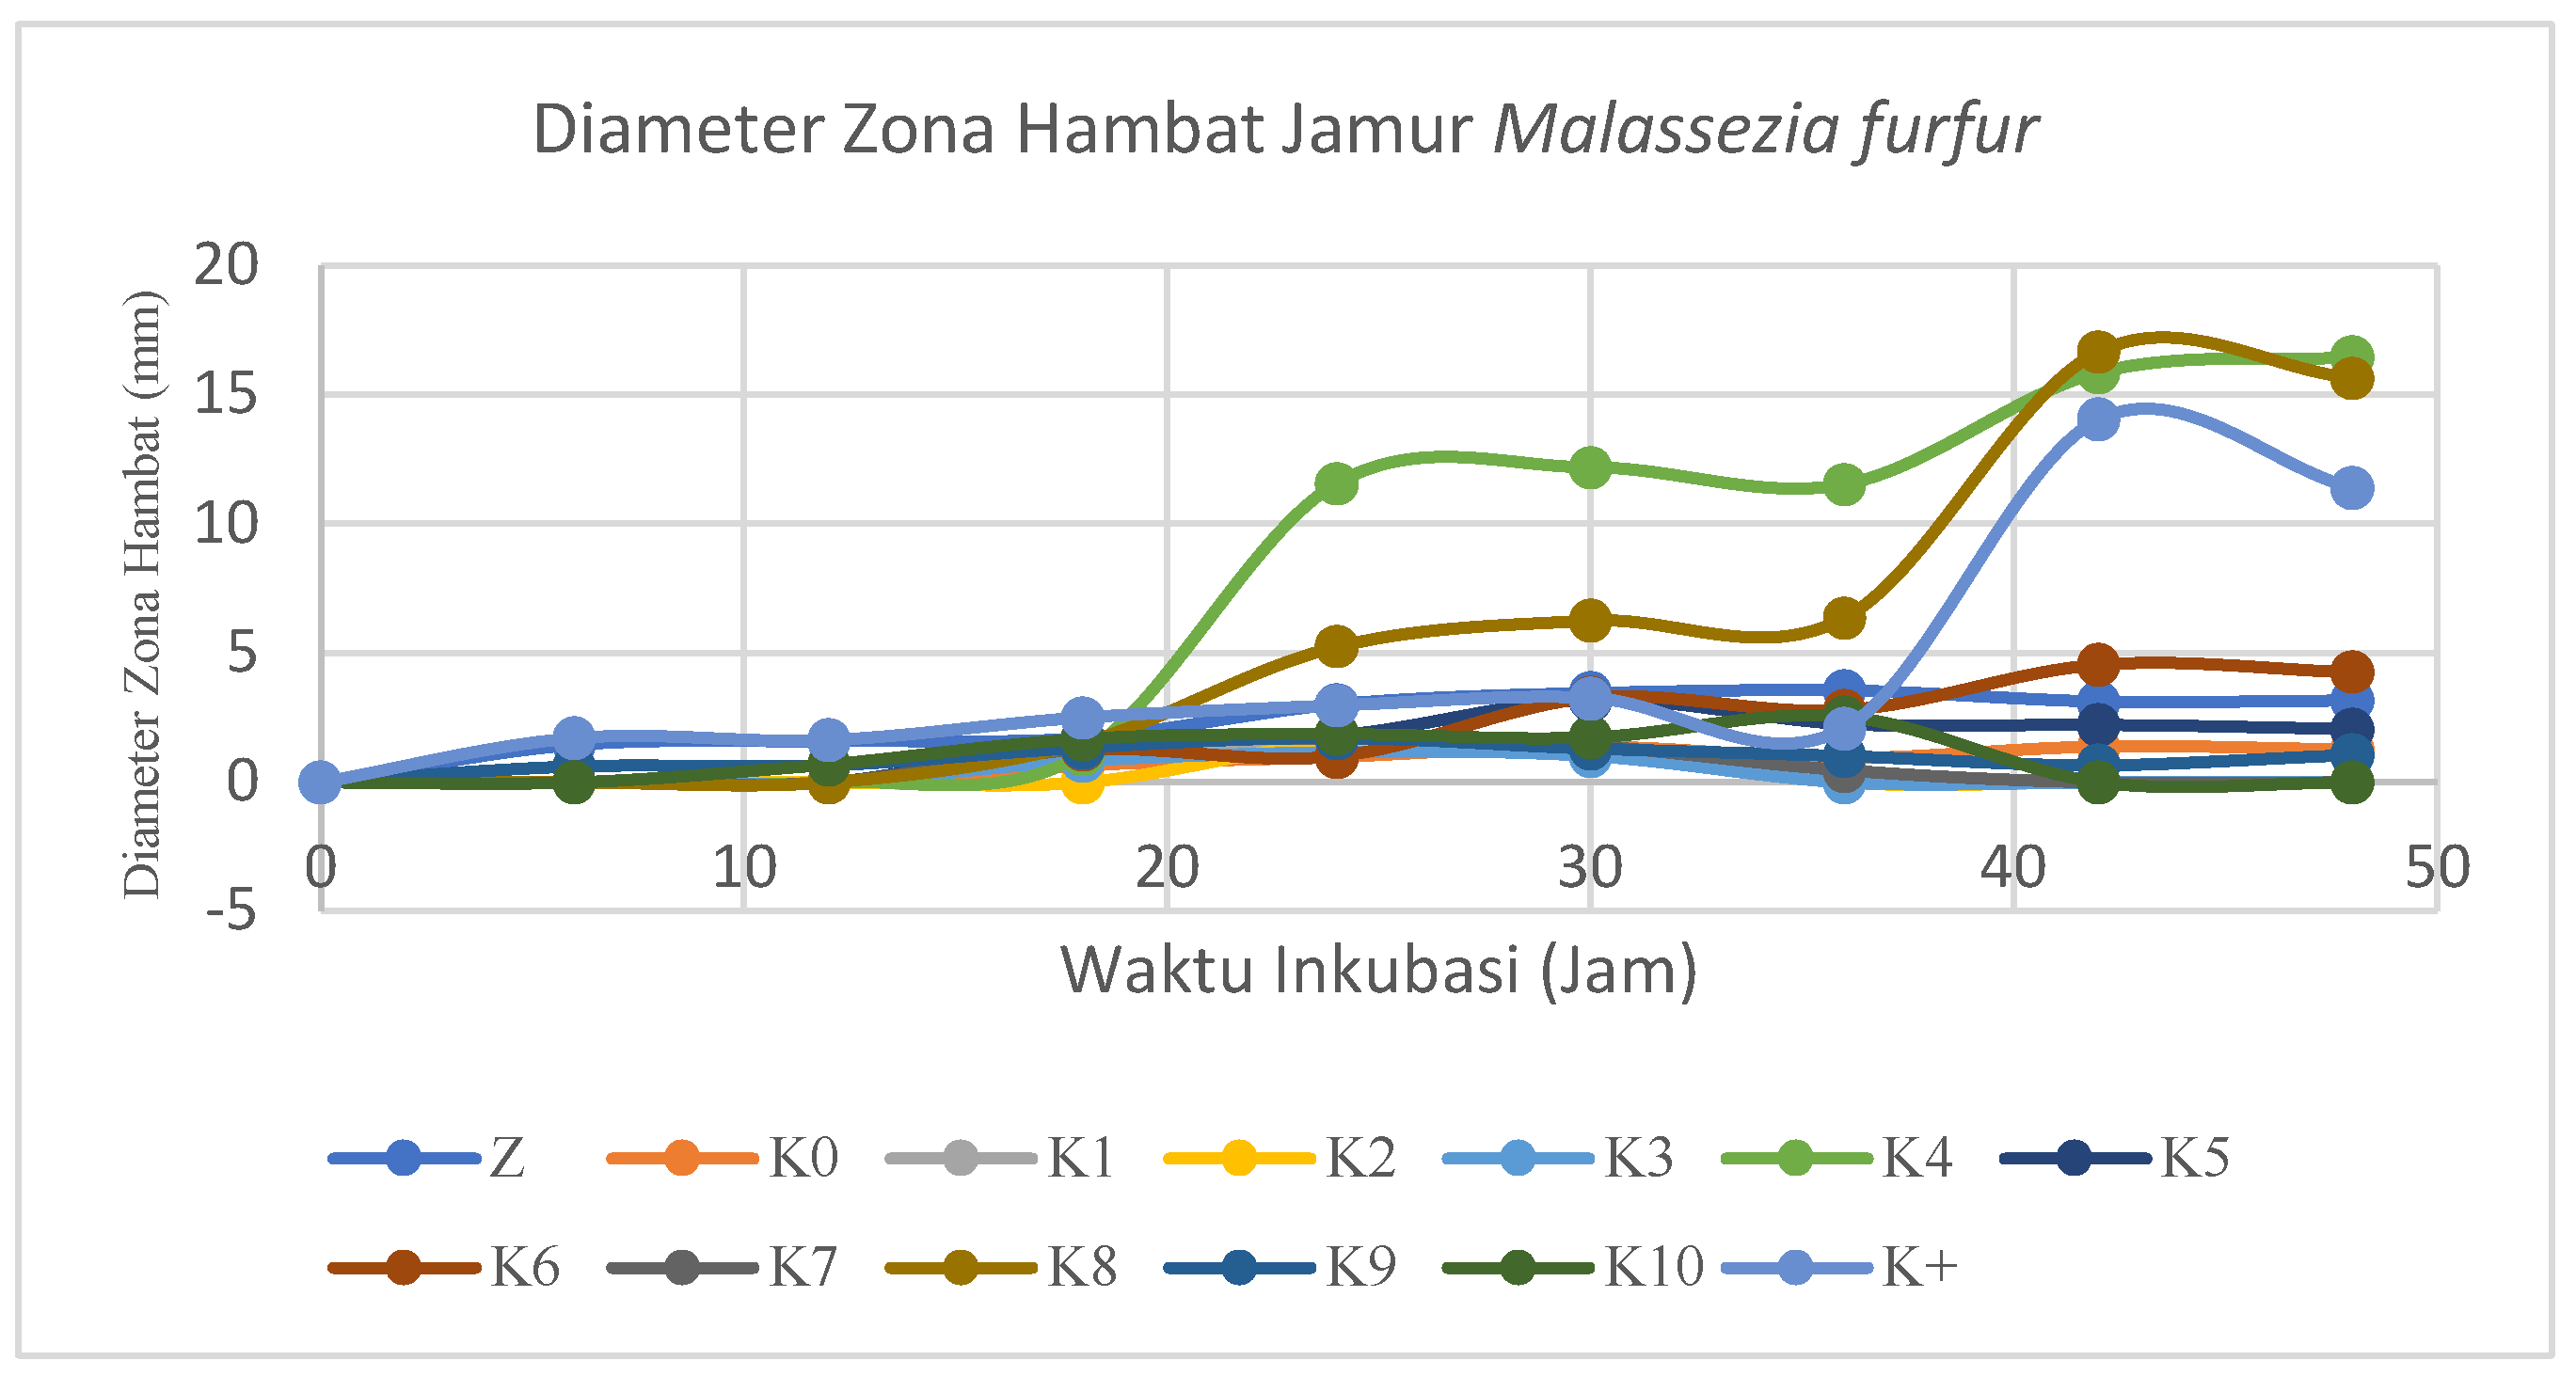

Table 2.
ZnO Nanoparticle PSA Data Results.
| Polydispersity Index (PDI) | Particle Size (nm) | Vol % |
| 0,537 | 1,74 | 1,4 |
| 24,54 | 3,3 | |
| 164 | 20,5 | |
| 706 | 66 | |
| 3.860 | 4,1 | |
| 5.710 | 4,7 |
Table 3.
Simplification of Tukey HSD Test Results for Malassezia furfur Fungus on Sample Types.
| Sample Type | Average Diameter of the Resistance Zone (mm) ± SD |
|---|---|
| Malassezia Furfur | |
| ZnO NPs | 2,64 ± 0,887a |
| K0 | 1,10 ± 0,287a |
| K1 | 1,31 ± 0,255a |
| K2 | 1,39 ± 0,177a |
| K3 | 1,00 ± 0,160a |
| K4 | 11,45 ± 5,529c |
| K5 | 2,19 ± 0,558a |
| K6 | 2,86 ± 1,486ab |
| K7 | 1,22 ± 0,539a |
| K8 | 8,62 ± 6,109bc |
| K9 | 1,05 ± 0,395a |
| K10 | 1,70 ± 0,656a |
| K+ | 4,96 ± 4,883ab |
| K- | 0 ± 0 |
Disclaimer/Publisher’s Note: The statements, opinions and data contained in all publications are solely those of the individual author(s) and contributor(s) and not of MDPI and/or the editor(s). MDPI and/or the editor(s) disclaim responsibility for any injury to people or property resulting from any ideas, methods, instructions or products referred to in the content. |
© 2025 by the authors. Licensee MDPI, Basel, Switzerland. This article is an open access article distributed under the terms and conditions of the Creative Commons Attribution (CC BY) license (http://creativecommons.org/licenses/by/4.0/).
Copyright: This open access article is published under a Creative Commons CC BY 4.0 license, which permit the free download, distribution, and reuse, provided that the author and preprint are cited in any reuse.


