
Submitted:
31 December 2024
Posted:
02 January 2025
You are already at the latest version
Abstract
A firewall is a device that is used generally to prevent cyberattacks and protect internal assets by blocking unauthorized access. Information security managers have many difficulties in managing firewall policy due to errors or anomalies in the policy that are caused by frequent internal and external requests. This paper intends to develop an anomaly classification model to detect anomalies and measure priority of resolution in firewall policy, and a visualized tool that supports information security managers to manage their firewall policy efficiently. This model and tool help information security managers to resolve anomaly in firewall policy and enable efficient firewall policy management and protect internal assets effectively.
Keywords:
anomaly classification
; measuring priority
; firewall policy management model
; decision support tool
; visualization tool
1. Introduction
A firewall is a security device that has been used since the 1990s to prevent network attacks and plays a very important role in network security by blocking unauthorized users. As IT technology develops and network attacks become more advanced and intelligent, a lot of advances in firewall functions or development of security equipment including firewalls are in progress. However, according to a report by Network World, which surveyed network company executives, 88% of respondents said they would prioritize adopting a firewall to defend against cyberattacks [1]. This shows that the firewall is still an important device. However, it is difficult to effectively respond to external attacks only by introducing a firewall, and for this purpose, the firewall policy must be properly configured. NIST’s SP 800-41 Rev.1 states that the information security manager should manage the organization’s firewall policy considering all assets identified through risk analysis [2]. In addition, the firewall policy is not fixed and can be changed depending on the situation and is frequently changed due to the addition, replacement, or removal of equipment, or requests from inside or outside the organization. However, information security managers are unable to perform risk analysis every time the asset status changes due to excessive work and are experiencing difficulties in firewall policy management due to problems arising from frequent changes in firewall policy [3].
The purpose of this study is to develop an anomaly classification model that detects and quantifies problems in firewall policy (hereafter anomalies) and presents resolution priorities to improve the difficulty of firewall policy management felt by information security managers. Earlier studies have suggested solutions to the degree of detecting, classifying, and deleting anomalies or changing the order of rules, and the market has developed functions including these contents and included them in firewalls. However, information security managers did not use it because they did not know that there was a policy inspection function in the firewall, or normal rules were misclassified as anomalies. In addition, according to a survey conducted by the authors on firewall policy management for public institutions, firewall policy is systematically and complexly connected to each other, and information security managers cannot easily change rules because they do not know how a changed rule will affect the organization’s service. Therefore, by developing a visualization tool capable of performing the anomaly classification model proposed in this study, the case of misclassifying the normal rule as anomaly was classified as an exceptional rule and an anomaly was detected by excluding it from the anomaly detection algorithm. Next, the properties of the anomaly were defined and an index capable of quantitatively measuring the anomaly was developed. By analyzing the risk level of the anomaly through the proposed indicator and sorting it in order of risk level, it presents rules that need to be addressed urgently to the information security manager to help solve problems within the firewall policy efficiently.
2. Literature Review
2.1. Firewall
A firewall is a device that blocks unauthorized network packets by comparing the configured firewall policy with network packets. A firewall is a key element of network security and is widely used by most companies, public institutions, and governments [4].
The NIST 800-41 guide describes the technologies used in firewalls and classifies the types of firewalls according to their functions. Types of firewalls include packet filtering, state-based monitoring, application-proxy gateway, circuit-level gateway, and VPN [2]. Recently, as network attacks have become more intelligent, firewalls have also been advanced, and next-generation firewall is spreading in the market. A next-generation firewall has functions covering all types of firewalls, from existing packet filtering methods to VPNs, and is a firewall that can be applied to data centers and clouds [5]. This study aims to study the most basic packet filtering method of a firewall. According to Garcia-Alfaro et al. (2013), the packet filtering firewall has the advantage of being fast because it analyzes only low-layer information [6]. However, there is a problem in that it cannot analyze stream-type data, which is higher layer data like a stateful firewall. The packet filtering method has problems that cannot be identified in the upper layer than the network layer among the 7 OSI (Open System Interconnection) layers, but the firewall policy is based on the packet filtering method and is suitable for detecting problems within the policy and suggesting solutions.
The authors analyzed the functional specifications of representative firewalls of Korean domestic and foreign companies to check if there is function that detect anomaly and resolve the anomaly in firewall policy. In Korean domestic, the most commonly used 3 firewall venders were selected: SECUI, AhnLab, and WINS. The most popular SECUI is a next-generation firewall that can use packet filtering and user ID-based authentication simultaneously. As detailed functions, it is mentioned that it provides overlapping and unused rule checking functions, but no other anomalies are mentioned [7]. In the case of AhnLab, the representative product is a next-generation firewall that maximizes firewall processing performance with its own developed packet processing technology. As detailed functions, it provides duplicate object and rule filtering and provides a function to verify unused rules through various policy validation [8]. In the case of WINS, an intelligent next-generation firewall focused on threat tracking is the representative product. As a detailed function, there is a function to track the security policy usage status, so it is judged that overlapping and unused rules can be checked [9].
In the case of foreign companies, the functions of representative firewall products of companies included in the Leaders group of the 2021 Magic Quadrant for Network Firewalls issued by Gartner were analyzed [10]. Gartner’s Magic Quadrant categorizes the major players in a fast-growing market into four categories: Leaders, Visionaries, Challengers, and Niche Players. The Leaders category accounts for a large portion of the current market and there are companies that can lead the field through R&D investment in the future. Therefore, we investigated whether the representative firewall of companies distributed in the Leaders category has the function to check for anomalies. Although many companies were included in the Leaders category, we analyzed the product brochures of the representative firewalls of the top three companies, Palo Alto Networks, Fortinet, and Check Point Software Technologies [11–13]. As a result, the Hit Count function that can check whether the rule is being used existed in all three companies’ firewalls. However, it was difficult to check other functions. In the case of Palo Alto Networks, it allows information security managers to manage firewall policy through an integrated policy editor and reduces user errors through rule configuration recommendations, so it can be expected that it will be possible to detect anomalies, but it is hard to find anomaly detecting functions [11]. In the case of Fortinet, it is described that it can manage the firewall policy in an automation-oriented centralized way, but it is difficult to confirm because it is not mentioned how to manage the anomaly [12]. Lastly, in the case of Check Point Software Technologies, it is mentioned that integrated policy management is possible like the firewall of Palo Alto Networks or Fortinet, but it was not possible to confirm how to manage anomaly [13].
Through market research on firewalls by domestic and foreign companies, domestic companies provide a checking function for overlapping rules and unused rules, but it is difficult to check for other anomalies. On the other hand, it was difficult to find information related to the function of managing anomalies of representative foreign companies, and it can be assumed that the anomaly should be resolved by the information security manager himself.
2.2. Firewall Policy
The traffic consists of various information such as sequence number, protocol information, source IP, destination IP, source port, destination port, and packet arrival time and so on. The firewall policy consists of protocol, source IP, destination IP, source port, and destination port among traffic information, and additionally includes whether to block the packet. The firewall policy is divided into blacklist-based and whitelist-based according to the filtering method. The biggest difference between the two methods is the handling method for cases that are not included in the policy. A blacklist-based firewall policy allows all packets not included in the policy but rejects all packets in the case of a whitelist-based firewall policy. Most firewall policy adopt a whitelist basis to prevent unexpected attacks from the outside [2]. NIST’s 800-41 guideline also recommends reducing risk by blocking unknown access through ’deny by default’ based on a whitelist when configuring a firewall policy [2]. Therefore, this paper conducted a study to optimize the firewall policy for the whitelist-based firewall.
Firewall policy management is the main task of information security managers, and firewall policy configuration must be properly set to protect internal assets [2,14]. However, since the information security manager mainly performs more than one task, it is difficult to manage the firewall policy manually.
2.3. Firewall Policy Management
Research on firewall policy management has been going on for about 20 years. Al-Shaer and Hamed (2004) proposed a model to improve the complexity of the firewall policy by removing overlapping rules or anomalies in the firewall policy for effective firewall use [14]. Voronkov et al. (2020) defined four factors, such as cognitive errors of information security managers, the number of conflicts between rules, explanation of each rule, and the structural complexity of networks, to increase the usability of firewall rules through earlier studies [15]. Then, interviews were conducted with experts to verify the four factors. Al-Haj and Al-Shaer (2011) designed a set of three metrics to measure the security level of a firewall [16]. While they suggested metrics to measure the security level of a firewall, this study focuses on presenting indexes to measure the potential risk of anomalies in the firewall policy. Chomsiri et al. (2020) proposed a model in which firewall rules are arranged in order of high frequency at regular intervals in order to increase the processing speed of the firewall after eliminating conflicts between firewall rules [17]. The optimal rule alignment period was calculated based on five factors such as the number of rules, network speed, data size, transmission speed, and time required for firewall rule alignment, and then it was verified through testing. Hu et al. (2012) designed a framework to classify and manage anomalies in firewall policy [18]. Through this framework, the firewall policy was reordered to resolve anomalies. And the policy was optimized by classifying useless rules into four categories: removable, strong irremovable, weak irremovable and correlation. Yoon et al. (2010) tried to solve the structural complexity that exists in the firewall policy due to the complexity of the network [19]. They optimized the firewall policy by calculating the complexity of the network, deriving an optimal route from A to B, and applying it to the firewall policy. Wool (2010) improves on previous work on the complexity of firewall policy [20]. Previous work did not reflect that the greater the number of interfaces, the greater the complexity. For example, a firewall with more interfaces with the same number of rules is more complex. Togay et al. (2022) developed an anomaly classification algorithm that reduced processing time compared to earlier studies and shortened the time it takes to classify anomalies that exist in more than 1,000 firewall rules [21]. Even in NIST’s SP 800-41 Rev. 1, it is mentioned that there is no right answer to configure a firewall policy, so it is necessary to analyze all network traffic and configure the firewall policy in detail [2]. It is recommended to reduce unnecessary rules by commenting on each rule so that others can find out why the rule was configured. Prior research on firewall policy management was summarized in Table 1.

Table 1.
Research on firewall policy management
| Methodology | Theme | |||
|---|---|---|---|---|
|
Classification of anomaly |
Usability of firewall policy |
Easing complexity of policy |
Improving process performance |
|
| Delphi | Hu et al. (2012) Kim et al. (2021) Togay et al. (2022) |
Voronkov et al. (2020) |
||
| Development of automated tool |
Hu et al. (2012) Kim et al. (2021) Togay et al. (2022) |
Chomsiri et al. (2020) |
||
| Visualization | Hu et al. (2012) Kim et al. (2021) Togay et al. (2022) |
|||
| Improvement of algorithm |
Al-Shaer & Hamed (2004) |
Voronkov et al. (2020) |
Yoon et al. (2010) Garcia-Alfaro et al. (2013) Wool (2010) |
Chomsiri et al. (2020) |
2.4. Anomaly in Firewall Policy
In this section, the five types of anomalies in the firewall policy defined by Al-Shaer and Hamed (2004), such as shadowing, correlation, generalization, redundancy, and irrelevance, are summarized with formulas and examples [15].
-
Shadowing anomalyShadowing anomaly occurs when the former rule includes the latter rule and each rule’s action is different. Example of shadowing anomaly could be found in Table 2.
Table 2.
Example of shadowing anomaly
| No | Source IP | Destination IP | Source port | Destination port | Action |
|---|---|---|---|---|---|
| 1 | 192.168.0.* | 20.198.162.* | 80 | 443 | Deny |
| 2 | 192.168.0.30 | 20.198.162.76 | 80 | 443 | Allow |
-
Correlation anomalyCorrelation anomaly occurs when two rules include each other for different conditions. Example of correlation anomaly could be found in Table 3.
Table 3.
Example of correlation anomaly
| No | Source IP | Destination IP | Source port | Destination port | Action |
|---|---|---|---|---|---|
| 1 | 192.168.0.* | 20.198.162.76 | 80 | 443 | Deny |
| 2 | 192.168.0.30 | 20.198.162.* | 80 | 443 | Allow |
-
Generalization anomalyGeneralization anomaly occurs when the latter rule includes the former rule and each rule’s action is different. Example of generalization anomaly could be found in Table 4.
Table 4.
Example of generalization anomaly
| No | Source IP | Destination IP | Source port | Destination port | Action |
|---|---|---|---|---|---|
| 1 | 192.168.0.* | 20.198.162.* | 80 | 443 | Allow |
| 2 | Any | Any | 80 | 443 | Deny |
-
Redundancy anomalyRedundancy anomaly occurs when one of the two rules is included in the other and each rule’s action is the same regardless of the order. Example of redundancy anomaly could be found in Table 5.
Table 5.
Example of redundancy anomaly
| No | Source IP | Destination IP | Source port | Destination port | Action |
|---|---|---|---|---|---|
| 1 | 192.168.0.* | 20.198.162.* | 80 | 443 | Allow |
| 2 | 192.168.0.* | 20.198.162.76 | 80 | 443 | Allow |
-
Irrelevance anomalyIrrelevance anomaly was defined by Al-Shear & Hamed (2004). Irrelevance anomaly is a rule in which no packets are filtered by this rule. That is, it means an unused rule and corresponds to a rule in which the value of the counter variable in Table 6 is zero. However, the rule classified as irrelevance anomaly was excluded from this study. It is too hard to get network traffic data for security reason. Example of irrelevance anomaly could be found in Table 6.
Table 6.
Example of irrelevance anomaly
| No | Source IP | Destination IP | Source port | Destination port | Action | Counter |
|---|---|---|---|---|---|---|
| 1 | 10.10.10.6 | 10.10.10.1 | 80 | 443 | Allow | 0 |
Al-Shear & Hamed (2004) was summarized the classification of anomalies within the firewall policy [15]. However, in practice, there are rules that are classified as anomaly but are necessary. Therefore, in this study, we would like to propose a method that can be distinguished by excluding rules added by necessity.
2.5. Difficulties in Managing Firewall Policy
We conducted a survey to check how to manage firewall policy and face difficulties with firewall policy management in the field. The questionnaire consists of the model of the firewall, the interval of firewall inspection and purpose of the inspection, the existence and use of a function capable of detecting anomalies in the firewall policy, the type of anomaly using the detection function, and difficulties in resolving the anomaly. Information security managers working in public institutions and information security service company employees who manage firewalls in public institutions were selected for the survey.
A total of 63 valid questionnaires were collected from the survey, the main result was that information security managers did not use the anomaly detection function because of the case where the normal rule was misclassified and too many problems occurred despite the presence of the anomaly detection function in the firewall policy. In addition, respondents know that there is an anomaly in the firewall policy, but respondents were worried about the side effect that may occur by modifying the firewall policy to solve the anomaly. The results of survey on the difficulties of managing firewall rules targeting information security managers were summarized into the following five difficulties in managing firewall policy.
- Unnecessary rules: There are multiple managers of firewall policy management, overlapping rules due to the lack of skill or mistakes of the managers, or rules that are not related to the organization.
- Excessive allowance rule: Risk analysis is not performed properly, so more than the permitted range is permitted, resulting in exposure to risks.
- Number of rules to manage: Too many firewall rules to manage, making it difficult to manage manually.
- Frequent requests: Requests related to the addition, replacement, or removal of equipment occur frequently, making it difficult to manage manually (ex. registering personal equipment due to telecommuting).
- Problems in rules that are difficult to solve: There is anxiety that problems may arise when modifying rules due to complexly connected rules.
To solve these problems, Hu et al. (2012) tried to help information security managers by classifying anomalies and resolving anomalies through rule reordering and redundancy elimination strategies. Liu (2008) made it possible for the user to check what effect occurs within the policy as the rule is changed to solve the problem within the policy [21]. However, neither study considered exceptional rules that may affect each solution, and information security managers cannot determine which anomalies need to be addressed urgently. In this study, we developed indicators based on the causes classified as anomalies. By quantitatively measuring the risk of anomalies based on indicators, it is intended to help solve problems within rules by showing high-risk anomalies to information security managers and informing solutions.
3. Methodology
3.1. Anomaly Classification Model
In this study, the tool to classify anomalies and measure priorities for resolution consists of two steps. In the first step, when the firewall policy is loaded into the visualization tool, the anomaly detection algorithm automatically classifies the exceptional rules configured for necessity, excludes them from the detection algorithm, and classifies the anomalies. In the second step, the cause of the detected anomaly is analyzed, the risk is quantitatively measured based on the criteria proposed in this study, and the result is visually displayed to information security managers. Our research model was shown in Figure 1.
3.2. Improved Anomaly Detection Algorithm
Existing studies tried to classify and solve anomalies in firewall rules, but in fact, rules according to necessity exist in firewall policies. Rules configured by necessity in the firewall policy can be divided into exceptional allowance rules and exceptional denial rules. An exceptional allowance rule refers to a policy that permits a specific internal/external IP or port to use a specific service. For example, a permission rule for administrators and a rule for allowing internal employees’ personal devices for work correspond to the exceptional allowance rule type. An exceptional denial rule refers to a policy that blocks specific internal and external IPs or ports to protect internal assets. For example, a rule to block IPs suspected of being harmful overseas and a rule to block NetBIOS ports registered as harmful ports in CVE correspond to the exceptional denial rule type. Although the two types of exceptional rules are normal rules, they are the factors that are misclassified as an anomaly. In this study, in order to determine whether each rule corresponds to an exceptional rule, we try to classify it by analyzing the comment written when configuring the firewall policy. The classification criteria for the exceptional rules were summarized in Table 7.
Table 7.
Classification criteria for exceptional rules
| Classification criteria | Exceptional allowance rule | Exceptional denial rule |
|---|---|---|
| Word | "Allow" | "Deny" |
3.3. Measuring Priority of Anomaly Resolution
In this study, to measure the priority of solving anomalies, an index was developed using the causes of anomalies. Through the definition of anomalies defined in earlier studies, two factors that cause anomalies can be summarized. The first is a field, which is a basic component of firewall policy. An anomaly occurs when one or more fields among the source IP, destination IP, source port, and destination port of the two rules are included in either one. The second is a rule’s action. An anomaly occurs according to the action of the rule and determines the type of anomaly. Also, the rule that permits excessively is the factor of increasing potential risk. We want to measure the risk of an anomaly through the factors that cause the anomaly and the factors that potentially increase the risk.
3.3.1. Measuring Risk of Anomaly
In this section, we will define score metrics to measure the potential risk caused by the existence of anomalies in the firewall policy and present a method for quantitatively measuring the potential risk. The potential risk of rule refers to the cause of the anomaly. An anomaly occurs when two rules collide, so to find the potential risk due to the presence of an anomaly, you must measure the potential risk of each rule associated with the anomaly. Thus, we define anomaly risk as the sum of the potential risks of rules associated with an anomaly. The score metrics for each rule include causal field of anomaly, whether allow or not, and excessive access. First, the causal field of anomaly was selected as an indicator because the more fields that cause anomalies among policy fields, the more dangerous it can be. As for the measurement method, one point is given to each field that causes an anomaly among source IP, destination IP, source port, and destination port. Next, whether allow or not was selected as an indicator because it can be said to be potentially more dangerous than when the access control of the rule is “allow” compared to “deny”. As for the measurement method, 1 point is given if the access permission of the rule is “allow”, and 0 point is given if “deny”. Lastly, excessive access was selected as an indicator because the potential risk is higher for rules that allow access to multiple IPs among the rules classified as anomalies. As for the measurement method, 1 point is given if the source IP, destination IP, source port, and destination port fields have multiple values among rules in which access is allowed or not is “allow”, and 0 point if they have a single value. The measurement score of anomaly attributes were summarized in Table 8.
Table 8.
Measurement score of anomaly attributes
| Elements of anomaly | Subject | Attribute | Score |
|---|---|---|---|
| Source IP | Non Causal field | 0 | |
| Causal field | 1 | ||
| Destination IP | Non Causal field | 0 | |
| Causal field | 1 | ||
| Causal field of anomaly | Source port | Non Causal field | 0 |
| Causal field | 1 | ||
| Destination port | Non Causal field | 0 | |
| Causal field | 1 | ||
| Whether allow or not | A rule action | Deny | 0 |
| Allow | 1 | ||
| Excessive access | A field in a rule whose action is allow | Single | 0 |
| Multiple | 1 |
Definition 1.
, , and are the and rules denotes the number of firewall policy.
Definition 2.
, The anomaly occurs when and collide. is the combination of and that causes an anomaly. denotes the number of combinations of
Definition 3.
, is an anomaly type of . The anomaly type is one of Shadowing (), Correlation (), Generalization (), and Redundancy (). denotes the number of anomalies of type k. k and N(k) denote the anomaly type number and the number of types of anomaly, respectively.
Definition 4.
is a function that measures the anomaly risk of . is the sum of the causal field of anomaly and whether allow or not and excessive access.
Definition 5.
is the sum of and .
Definition 6.
When measuring anomaly resolution priority based on rule number, is the sum of all associated with .
3.3.2. Measuring the Solvability of an Anomaly
Firewall policy is systemically related to each other, and anomaly occurs when two or more rules collide [21]. To solve the anomaly, the relationship between two or more rules must be identified and changed so as not to create a side effect. The more firewall rules there are, the more difficult it is to understand the relationship, and the difficulty of solving it varies depending on the type of anomaly. In this section, considering the complexity of the rule and the type of anomaly, we measure the possibility of solving the anomaly and set the priority among the anomalies. Rule complexity is calculated through the number of firewall rules, the number of objects, and the number of firewall interfaces defined by Wool (2010) [19]. However, in this study, since the relationship between rules is checked, it is not related to the object, and since the policy within a single firewall is detected, the interface is also irrelevant. Therefore, in this study, we check how connected one rule is with the overall firewall policy. In addition, is sought by checking how many different types of anomalies a single rule has.
The difficulty of solving the anomaly according to the type of anomaly is as follows. First, in the case of the redundancy anomaly , it can be easily solved because the overlapping rules, unused rules, and processing results are the same. In the case of shadowing anomaly and generalization anomaly , since all the conditions in one rule are included in the other rule, we only need to check two rules and solve one of them, so the difficulty of solving can be considered normal. In the case of correlation anomaly , since it is an inclusive relationship for each different condition, in order to solve this anomaly, it is necessary to identify the conditions corresponding to the inclusion relationship, so it is very hard to solve.
Definition 7.
, is the difficulty score of the solution according to the type k of anomaly.
The measurement score of anomaly resolution difficulty is summarized in Table 9.
Table 9.
Measurement score of anomaly resolution difficulty
| Type of anomaly | Notation | Difficulty | Score |
|---|---|---|---|
| Correlation | Hard | 3 | |
| Shadowing | Normal | 2 | |
| Generalization | Normal | 2 | |
| Redundancy | Easy | 1 |
is the difficulty score in all anomaly types associated with multiplied by the number of that type.
is a scale to measure the possibility of solving an anomaly when an anomaly occurs. As the value of both and increases, the possibility of solving the anomaly decreases, so is a reverse of the multiplication of and .
The solvability values of and included in the same anomaly are the same.
3.3.3. Measuring Priority
In this study, in order to determine the priority of solving, the risk of the proposed anomaly and the possibility of resolving the anomaly are sorted in the order of high score and displayed to the information security managers. The ranking of the score will allow the information security managers to know which anomaly or rule has a high risk and will seek a solution to reduce the risk. However, each information security manager may have different criteria for solving the problem. There may be information security managers who wants to solve the higher-risk first, and there may be information security managers who want to solve the easier one first. Therefore, is defined as the sum of and multiplied by respective weights. The weights are determined according to the importance of the information security manager for the two indicators, and are set to and .
4. Verification of the Model
4.1. Data for Verification
To verify proposed model and visualization tool, we used the external firewall data of a public institution in Korea. The fields of firewall data consist of source IP, destination IP, source port, destination port, whether to allow access, and rule comment. The total number of firewall rules was 808, and there were multiple IPs or ports in one rule. In addition, a number of rules whose field range is “any” among source IP, destination IP, source port, and destination port have been identified. In fact, there were cases where the scope of the field was “any” due to necessity, but it was also confirmed that the scope of the rule applied to the service user was set excessively. According to NIST SP 800-41 Rev. 1, it is recommended to identify assets through risk analysis, set firewall rules appropriately, and manage them periodically [2]. In reality, risk analysis is not conducted periodically, and it is confirmed that it is difficult to manage periodically due to too many rules. In the Rule Comment, there were various types of comments such as NetBIOS port blocking rule registered in CVE, permitting rule for receiving information from higher authorities, and permitting rule for service administrators.
4.2. Visualization Tool
We developed a visualization tool, including the proposed anomaly classification model to help information security managers efficiently manage firewall policy. The visualization tool proceeds as shown in Figure 2.
First, information security managers use visualization tools to load their firewall policy. The loaded data fetches the following firewall policy fields: Source IP, Destination IP, Source Port, Destination Port, Action, Rule Type, and Rule Comment. Next, the tool classifies the exceptional rule based on the rule comment and excludes it from the anomaly detection algorithm. In addition, by applying the proposed measurement index to the anomaly detection result, the score is measured, and the result is displayed to the information security managers.
4.2.1. Classifying Exceptional Rule and Detecting Anomaly
Based on the rule comment, verification data was classified into 79 general rules, 160 exceptional allowance rules, and 569 exceptional denial rules. There were too many exceptional rules especially exceptional denial rules. After checking the results, most of the exceptional denial rules had policies to block harmful IPs and policies to block access to sites not related to work. Most of the exceptional allowance rules were permissive rules for service administrators, temporary permissive rules for vulnerability checks, or permissive rules for updates or patches.
As a result of analysis of verification data before classifying exceptional rules based on rule comment, a total of 53,404 anomalies were detected, and for each type, 251 cases of shadowing, 51,658 cases of correlation, 221 cases of generalization, and 1,274 cases of redundancy were detected. The result of anomaly detection before and after considering the exceptional rules was summarized in Table 10.
Table 10.
Anomaly detection before and after considering the exceptional rules
| Item | Shadowing | Correlation | Generalization | Redundancy | Total |
|---|---|---|---|---|---|
| Before | 251 | 51658 | 221 | 1274 | 53404 |
| After | 0 | 0 | 0 | 11 | 11 |
As a result of analysis of verification data after classifying exception rules, a total of 11 anomalies were detected, and a reduction of 99.97% compared to before classification of exceptional rules. As for the types of anomalies detected, 11 cases were detected only in redundancy, and no other types of anomalies were detected. Through this result, among the verification data analysis results before and after the classification of exceptional rule, the result after the classification of exceptional rule is better, and there are numerous exceptional rules in the firewall policy. Since the only type of anomaly detected is redundancy, there are not many problems that are difficult to solve in the verification data, and the firewall policy is managed relatively well.
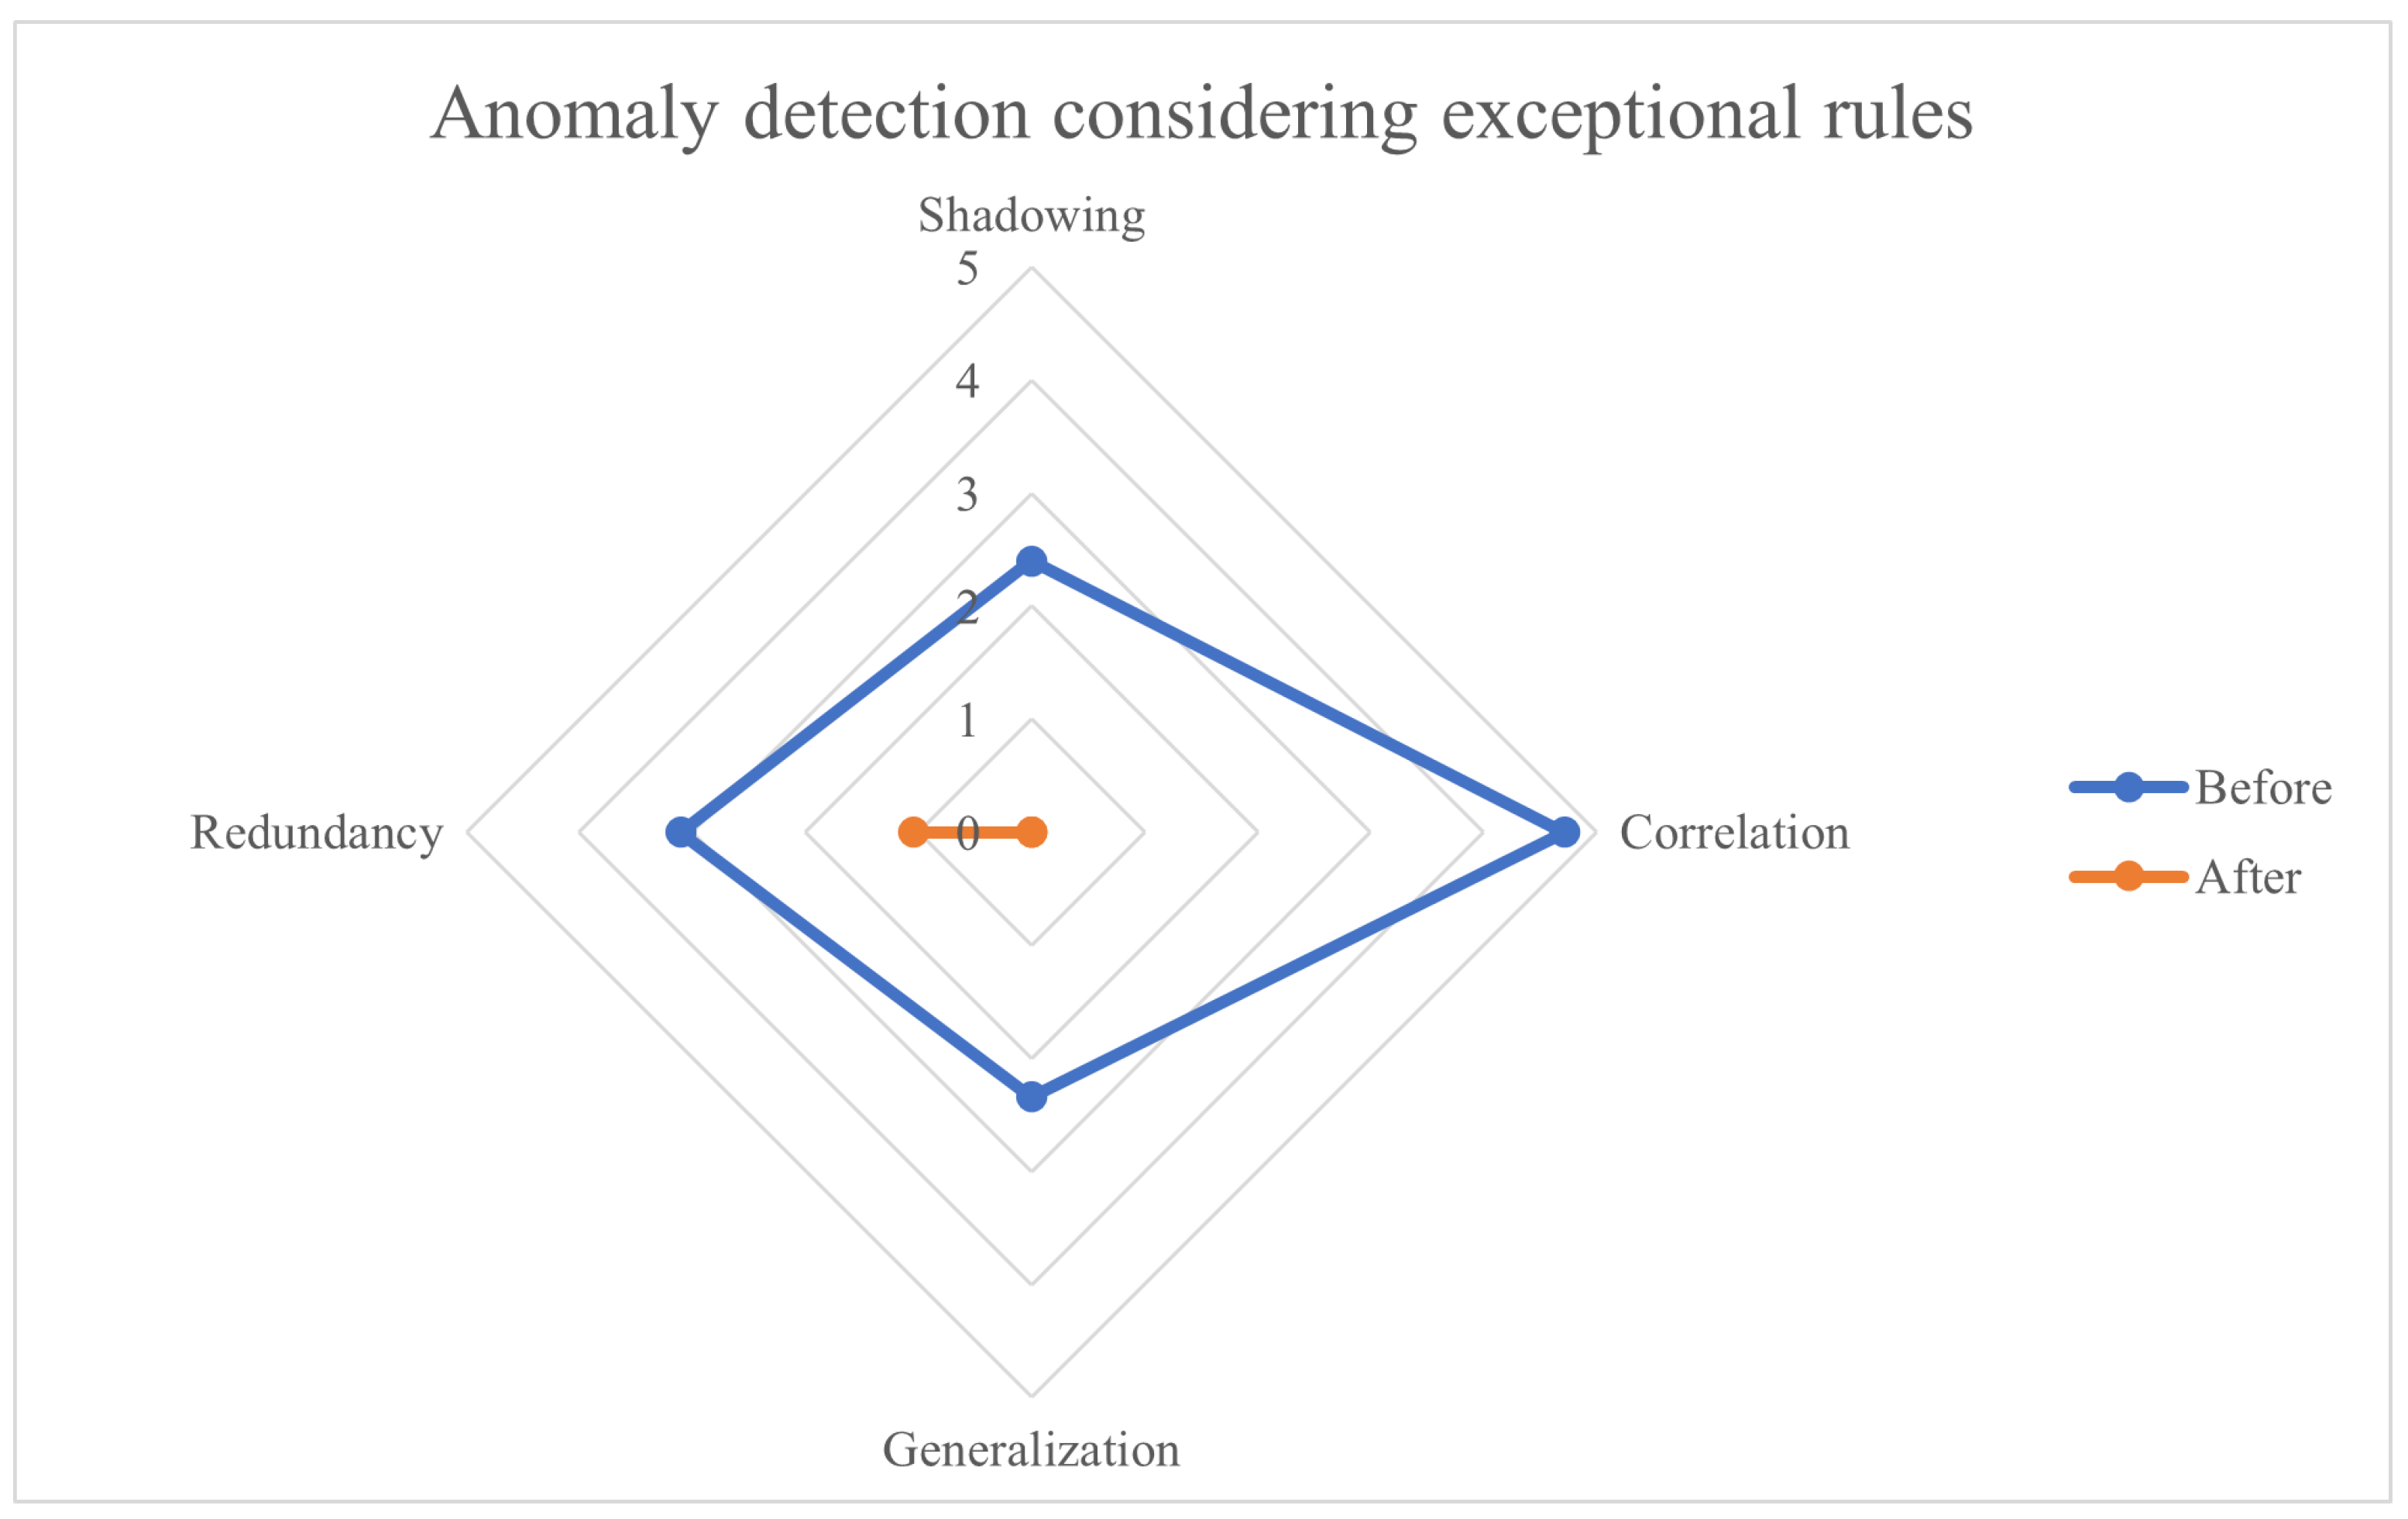
We provide a radar chart showing the anomaly detection results before and after considering exceptional rules. However, the number of cases of correlation anomaly is extremely high, the radar chart is not visible to recognize problems. As shown in Figure 3, the visibility of the radar chart was increased by taking the logarithmic value of the anomaly detection results. In addition, by checking the anomaly detection results before and after considering the exceptional rules, information security managers can perform what-if analysis and increase work efficiency.
4.2.2. Prioritizing Anomaly and Rule
Based on the anomaly detection results, we intend to apply the priority measurement index proposed in this study. Table 11 shows the results of analyzing the priorities based on anomalies, and Table 12 shows the results of analyzing the priorities based on rule numbers.
Table 11.
Results of analyzing the priorities based on anomaly
| Priority | Rule i | Rule j | Causal factor | Type of anomaly | |
|---|---|---|---|---|---|
| 1 | 793 | 699 | dst_ip, dst_port | Redundancy | 15 |
| 2 | 694 | 695 | src_ip | Redundancy | 14 |
| 3 | 694 | 695 | src_ip | Redundancy | 14 |
| 4 | 694 | 695 | src_ip | Redundancy | 14 |
| 5 | 694 | 695 | src_ip | Redundancy | 14 |
| 6 | 694 | 695 | src_ip, dst_port | Redundancy | 10 |
| 7 | 694 | 695 | src_ip, dst_port | Redundancy | 10 |
| 8 | 694 | 695 | dst_ip, dst_port | Redundancy | 10 |
| 9 | 694 | 695 | dst_ip, dst_port | Redundancy | 10 |
| 10 | 602 | 597 | dst_ip, dst_port | Redundancy | 10 |
When the measurement index proposed in this study was applied to the detected anomalies and the scores were compared to prioritize, the redundancy caused by the collision of No. 793 and No. 699 scored the highest with 15 points. And the anomaly of and the anomaly of were the same except for the priority 1. This was caused by a many-to-many relationship method anomaly detection algorithm, but it is necessary to produce a result value based on the rule number. Except for rules related to priority 1, rules of other priorities should have been classified as exceptional rules, but they were misclassified as an anomaly because they did not include the word “allow” or “deny” in the rule comment. Therefore, only was the only rule applicable to the anomaly. As such, rule comments perform an important role in classifying anomalies. There is no significant difference between the values of risk of anomaly. This is because all anomaly types in Table 11 are redundancy. If different types of anomaly is included, the result will be different.
Table 12.
Results of analyzing the priorities based on rule number
| Priority | Rule # | Type of anomaly | ||||||
|---|---|---|---|---|---|---|---|---|
| 1 | 793 | 0 | 0 | 0 | 1(15) | 15 | 808 | 411.5 |
| 2 | 694 | 0 | 0 | 0 | 1(14) | 14 | 808 | 411 |
| 3 | 695 | 0 | 0 | 0 | 1(14) | 14 | 808 | 411 |
| 4 | 704 | 0 | 0 | 0 | 1(14) | 14 | 808 | 411 |
| 5 | 705 | 0 | 0 | 0 | 1(14) | 14 | 808 | 411 |
| 6 | 594 | 0 | 0 | 0 | 1(10) | 10 | 808 | 409 |
| 7 | 596 | 0 | 0 | 0 | 1(10) | 10 | 808 | 409 |
| 8 | 597 | 0 | 0 | 0 | 1(10) | 10 | 808 | 409 |
| 9 | 598 | 0 | 0 | 0 | 1(10) | 10 | 808 | 409 |
| 10 | 602 | 0 | 0 | 0 | 1(10) | 10 | 808 | 409 |
5. Conclusion
Due to the development of the internet, network attacks are becoming more frequent, and their damage is gradually increasing. Therefore, the algorithm for detecting anomalies in the firewall policy has been improved so that the policy configuration of the firewall, which is the most common and effective in defending against network attacks, can be made safer and more efficient.
The implications of this study are as follows. First, we improved the anomaly classification model by considering the exceptional rules. The exceptional rules configured by the information security managers for operational need, but they causes normal rules to be misclassified as anomalies. In this study, based on the rule comment among the components of the firewall policy, it was classified into an exceptional allowance rule and an exceptional denial rule, and excluded from the anomaly detection algorithm. In addition, through the analysis of verification data, the detection results of anomalies before and after the classification of exceptional rules were significantly reduced, and the misclassification of normal rules as anomalies was improved. This is expected to make the firewall policy analysis tool more sophisticated and more usable.
Second, it is possible to identify the priority of urgent resolution among the detected anomalies by proposing an index that can quantitatively measure anomalies through the correlation between the components of the firewall policy and the cause of the anomaly. Earlier studies have detected anomalies and reported them to information security managers, but they do not know which of the detected anomalies needs to be resolved first. In this study, by analyzing the causes of anomalies, quantitatively measuring anomalies according to indicators, and arranging them in the order of high scores, information security managers can directly prioritize solving anomalies. In addition, the proposed measurement method can be applied not only to anomalies but also to rule numbers.Thus, we can see not only anomalies, but also which rules urgently need to be addressed.
Finally, the information security manager can load the firewall policy, select a rule to be excluded from the anomaly detection, detect the anomaly, check the result, and solve anomaly through the visualized tool, so it has the advantage of being visual and intuitive. As a result, through the model of this study, information security managers can increase the reliability of anomaly detection results and improve work efficiency by effectively managing firewall policy using the measured anomalies or rule scores.
The limitations of this study are, first, that as firewall technology develops, equipment is being replaced from packet filtering-based firewalls to state-based firewalls and further, next-generation firewalls. However, since the anomaly classification algorithm in this study focuses on packet filtering-based firewall policy, additional research is needed to apply it to stateful firewalls or next-generation firewalls. Second, since the method of classifying exceptional rules is based on rule comments, rule comments must be written correctly. This is also recommended by NIST SP 800-41 Rev. 1 [2]. Finally, the measurement indexes proposed in this study are not specific. The indexes proposed to measure anomalies classify anomalies in a dichotomous way, such as yes or no. In fact, in the case of excessive access among anomaly measurement indicators, even if one IP is allowed, the IP may cause fatal damage, and even if multiple IPs are allowed, it may not be dangerous.
Future research will improve the proposed model and visualization tool to enable information security managers to efficiently manage rules regardless of work experience. First, we will present specific solutions for correcting anomalies rather than providing simple solutions. Second, we will examine the exceptional rule cases to improve accuracy and reliability of classification exceptional rule algorithm. Third, we want to specify the measurement standards of the indicators presented in this study so that they can be measured more realistically. Finally, a chart as shown in Figure 3 is provided so that information security managers can check before and after modification of anomalies. Information security managers can reduce concerns about possible accidents when correcting anomalies. Also, it can provide what-if analysis by comparing AS-IS and TO-BE.
By enabling information security managers to check whether the rules are modified or deleted when resolving anomalies, it can reduce concerns about contingencies, secure the justification of firewall policy management, and increase the transparency of firewall policy management for effective firewall policy management.
References
- Network World, 2020 State of Network, 2020.
- NIST, SP 800-41 Rev.1: Guidelines on Firewalls and Firewall Policy, 2009.
- Boan News, A survey on the recognition and selection criteria of firewall policy management solutions, Available online: https://www.boannews.com/media/view.asp?idx=111134&kind=0=0 (accessed on Nov 15, 2022).
- Kim, T., Kwon, T., Lee, J., & Song, J. F/Wvis: Hierarchical visual approach for effective optimization of firewall policy, IEEE Access, 2021, 9, 105989-106004. [CrossRef]
- NIST, SP 800-215: Guide to a Secure Enterprise Network Landscape, 2022.
- Garcia-Alfaro, J., Cuppens, F., Cuppens-Boulahia, N., Martinez, S., & Cabot, J. Management of stateful firewall misconfiguration, Computers & Security, 2013, 39, 64-85. [CrossRef]
- SECUI, Bluemax NGF Brochure. Available online: https://www.secui.com/network/bluemaxngf (accessed on July 11, 2022.).
- AhnLab, TrusGuard Brochure. Available online:https://www.ahnlab.com/kr/site/product/productView.do?prodSeq=10 (accessed on July 11, 2022.).
- WINS, Features of NGFW. Available online:http://www.wins21.co.kr/product/product_030101.html (accessed on July 11, 2022.).
- Gartner Research, 2021 Gartner Magic Quadrant for Network Firewalls, 2021.
- PaloAlto Networks, Firewall features overview DataSheet. Available online:https://www.paloaltonetworks.com/resources/datasheets/firewall-feature-overview-datasheet (accessed on July 11, 2022.).
- Fortinet, Next-Generation Firewall. Available online:https://www.fortinet.com/kr/products/next-generation-firewall (accessed on July 11, 2022.).
- Check Point Software Technologies, Next Generation Firewalls. Available online:https://www.checkpoint.com/quantum/next-generation-firewall (accessed on July 11, 2022.).
- Al-Shaer, E. and Hamed, H. Modeling and management of firewall policies, IEEE Transactions on Network and Service Management, 2004, 1(1), 2-10. [CrossRef]
- Voronkov, A., Martucci, L. A. and Lindskog, S. Measuring the usability of firewall rule sets, IEEE Access, 2020, 8, 27106-27121. [CrossRef]
- Al-Haj, S. and Al-Shaer, E. Measuring firewall security, 2011 4th Symposium on Configuration Analytics and Automation, 2011, 1-4.
- Chomsiri, T., He, X., Nanda, P. and Tan, Z. Hybrid tree-rule firewall for high speed data transmission, IEEE Transactions on Cloud Computing, 2020, 8(4), 1237-1249. [CrossRef]
- Hu, H., Ahn, G. J., and Kulkarni, K. “Detecting and resolving firewall policy anomalies,” IEEE Transactions on Dependable and Secure Computing, 2012, 9(3), 318-331. [CrossRef]
- Yoon, M., Chen, S. and Zhang, Z. Minimizing the maximum firewall rule set in a network with multiple firewalls, IEEE Transactions on Computers, 2010, 59(3), 218-230. [CrossRef]
- Wool, A. Trends in Firewall Configuration Errors: Measuring the Holes in Swiss Cheese, IEEE Internet Computing, 2010, 14(4), 58-65. [CrossRef]
- Togay, C., Kasif, A., Catal, C., and Tekinerdogan, B. A firewall policy anomaly detection framework for reliable network security, IEEE Transactions on Reliability, 2022, 71(1), 339-347, 2022. [CrossRef]
- Liu, A. X. Firewall policy change-impact analysis, ACM Transactions on Internet Technology, 2008, 11(4), 1-24. [CrossRef]
Figure 1.
Anomaly classification model
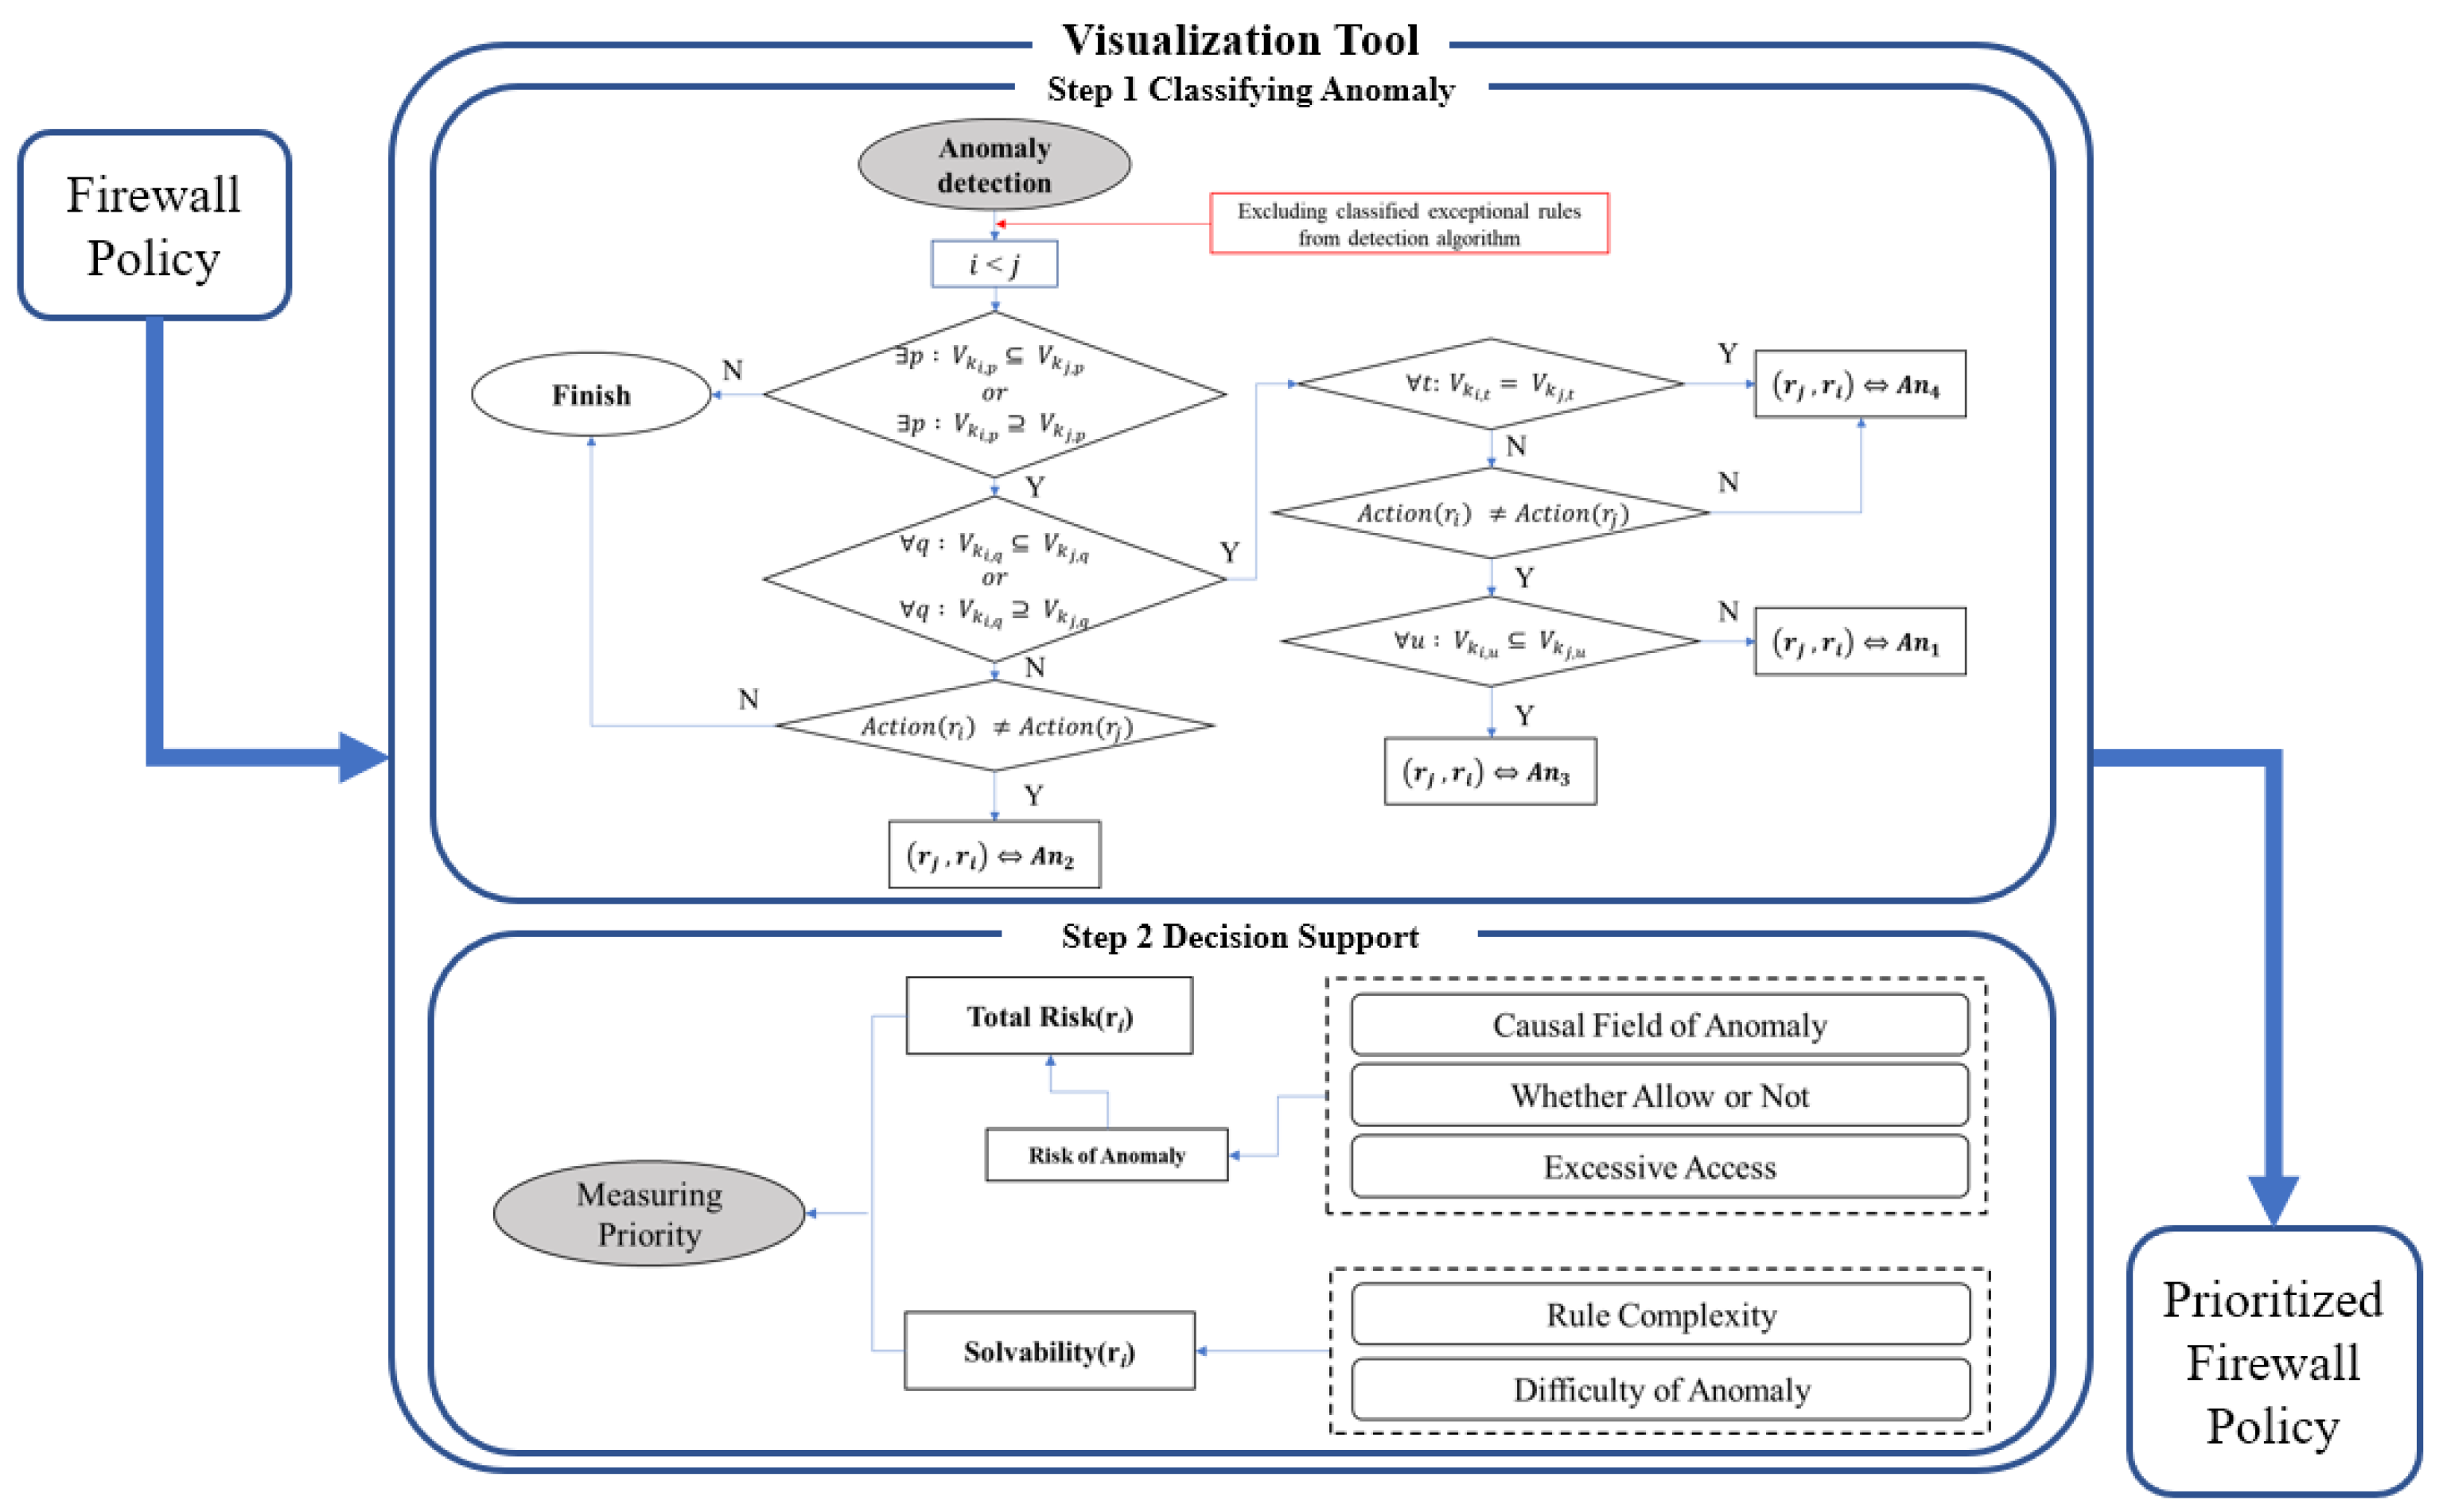
Figure 2.
Process of visualization tool
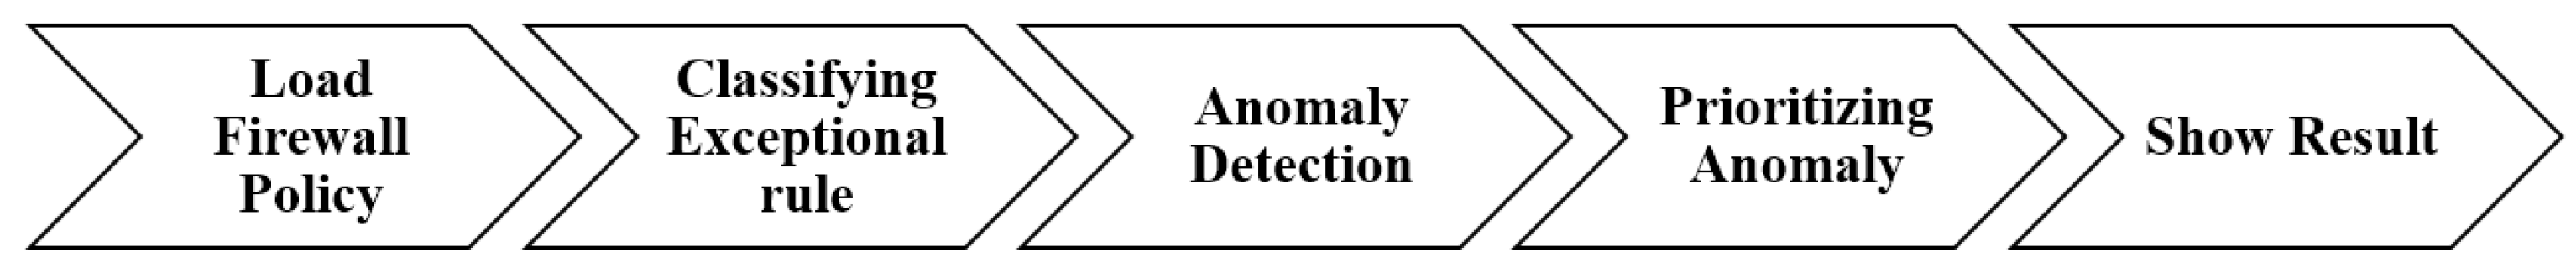
Figure 3.
Validation data before and after considering the exceptional rules
Disclaimer/Publisher’s Note: The statements, opinions and data contained in all publications are solely those of the individual author(s) and contributor(s) and not of MDPI and/or the editor(s). MDPI and/or the editor(s) disclaim responsibility for any injury to people or property resulting from any ideas, methods, instructions or products referred to in the content. |
© 2025 by the authors. Licensee MDPI, Basel, Switzerland. This article is an open access article distributed under the terms and conditions of the Creative Commons Attribution (CC BY) license (http://creativecommons.org/licenses/by/4.0/).
Copyright: This open access article is published under a Creative Commons CC BY 4.0 license, which permit the free download, distribution, and reuse, provided that the author and preprint are cited in any reuse.


