Submitted:
01 January 2025
Posted:
02 January 2025
You are already at the latest version
Abstract
Accurate semantic segmentation of concrete bridge cracks is crucial for road health monitoring. Currently, crack images are primarily obtained through manual field inspections. As an automated robotic technology, Unmanned aerial vehicles (UVAs) can provide high-resolution images, offering a new, efficient, and cost-effective method for rapid semantic segmentation of cracks. However, the fine local structures, elongated continuous global forms, and the imbalance between crack pixels and background pixels make it challenging for traditional convolutional networks to perform this task effectively. To address these challenges, we have introduced FissureNet, a network based on an enhanced DeepLabv3+ model. Initially, the network utilizes a lightweight architecture to replace the original backbone, thereby reducing model complexity. Subsequently, inspired by the biological movement of a snake swaying side to side, we introduced dynamic strip convolution (DPconv), where the convolution kernels can twist like a snake to better fit our target crack objects. Enriched with examples of bio-inspired applications of biomimetics in the computer field . All atrous convolution branches in the original atrous spatial pyramid pooling (ASPP) module have been replaced with our newly proposed DPconv. This convolution adaptively focuses on small local structures. Moreover, we have incorporenabling more precise extraction of crack features.ated a multi-perspective feature extraction strategy, introducing a vision transformer (VIT) to capture global features. This strategy is combined with traditional convolution to form a hybrid structure that intensifies focus on features from both global and local perspectives, enhancing the continuity of narrow crack segmentation. Lastly, an attention gata mechanism introduced in the decoding phase improves feature extraction near crack edges and significantly reduces the disparity between crack and background pixel counts. Empirical validation on the SDNET2018 dataset has demonstrated that FissureNet outperforms several classical methods in terms of accuracy and continuity in segmenting concrete bridge cracks.
Keywords:
robotic technology
; biomimics
; Transformer
; attention gate mechanism
1. Introduction
Concrete bridges, as an essential component of transportation infrastructure, facilitate connectivity for road, rail, and pedestrian traffic. This accessibility enhances the movement of people and goods, linking regional economies and fostering the development of trade and commercial activities [1,2]. Over time, concrete bridges are subject to deterioration due to environmental factors, traffic loads, and wear and tear, which can lead to cracking and compromise the structural integrity and load-bearing capacity of the bridges [3,4]. In the past decade, researchers have developed various automatic and semi-automatic monitoring solutions, including the use of infrared sensors, acoustic detection, and image recognition technologies. However, these advanced monitoring systems are often expensive and face challenges related to environmental adaptability and maintenance in practical applications.
Today, Unmanned aerial vehicles (UAVs) possess the ability to autonomously fly and perform tasks, navigating via predefined flight paths and independently completing specific tasks such as photography, surveillance, or measurement in certain cases, making them an efficient type of automated robot. The high-resolution images captured by UAVs successfully address the data source issue for crack segmentation.Therefore, how to quickly and accurately segment cracks has become a major challenge.Therefore, how to quickly and accurately segment cracks has become a major challenge.
Early concrete crack detection methods primarily relied on image processing and machine learning algorithms, capable of detecting cracks in less complex background conditions. Fujita et al. [5] proposed a robust automatic crack detection method from noisy concrete surface images, employing median filtering for preprocessing and utilizing multiscale line filters with Hessian matrices to highlight cracks while accommodating variations in crack width. Li et al. [6] presented a crack detection algorithm that extracts crack features and performs automatic segmentation of noise using fully convolutional networks and a naive Bayes data fusion model. Liangfu et al. [7] introduced a sparse coding method for bridge crack classification, employing an improved whitened principal component analysis technique for dimensionality reduction and accelerating feature learning on high-resolution crack images. Lee et al. [8] developed a crack detection technique based on digital image processing, enabling automatic measurement of crack characteristics, including width, length, direction, and pattern. Wang et al. [9] proposed a fast concrete crack detection method based on L2 sparse representation, utilizing discrete cosine transform to extract frequency domain features of these regions, suppressing noise, and rapidly computing their sparse coefficients on an overcomplete dictionary, thereby enhancing crack detection accuracy.
While the aforementioned models have achieved commendable results, the problem remains challenging due to the following difficulties: (1) Fragile, minute local structures, as shown in Figure 1, where some cracks are so fine that they make it difficult for models to precisely detect subtle changes [10]. (2) Cracks that are long and traverse the entire image. Due to this structural characteristic, standard convolutional kernels struggle to effectively capture fine local features and overall continuity [11]. (3) The imbalance between crack pixels and background pixels, which can severely impact the learning efficacy of models, leading to inaccurate or incomplete crack detection [12]. To address these issues, this paper improves neural network models by using the DeepLabV3+ model as the base architecture and MobileNetV2 as the feature extraction backbone to reduce network parameters [13,14]. In the atrous spatial pyramid pooling (ASPP) module, our proposed dynamic strip convolution replaces the original atrous convolution branches to enhance feature extraction of fine cracks [15]. Additionally, a vision transformer (VIT) is introduced to improve the continuity of crack segmentation and to form a hybrid network with CNNs, enhancing the feature extraction capability for connected and long-range cracks. In the decoding section, an attention gate mechanism is designed to mitigate the impact of the imbalance between crack pixels and background pixels [16].
2. Research Method
2.1. FissureNet Modeld
Crack detection tasks are pixel-level image semantic segmentation tasks, in which encoder-decoder semantic segmentation network architectures are currently widely applied [17]. Such network structures divide the semantic segmentation task into two parts: the encoder and the decoder. The encoder extracts features from dam surface images, while the decoder classifies pixels based on the extracted features. Classic encoder-decoder network models include the U-Net model [18], Seg-Net model [19], PSP-Net model [20], and the DeepLab series models [21,22,23]. The traditional DeepLabV3+ network currently stands out as a highly effective semantic segmentation model.
While the traditional DeepLabV3+ network aims to capture multi-scale features effectively, it integrates an structure within the feature extraction framework. However, the dilated convolutions in ASPP do not adequately capture the subtle features of fine cracks, impairing the ability of the model to precisely delineate crack edges, leading to segmentation gaps [24,25]. Furthermore, while dilated convolutions expand the receptive field and gather extensive contextual information, they disproportionately emphasize background areas in highly imbalanced datasets, overlooking the detailed features of the minority class, namely the cracks. Moreover, although DeepLabV3+ excels in extracting local features of cracks, it often overlooks the global characteristics of the cracks. This focus on local details fails to fully capture the overall continuity of crack patterns [26].
In response to the issues discussed, this paper introduces enhancements to the DeepLabV3+ network model, resulting in the upgraded model named FissureNet, as depicted in Figure 2.
The encoder now utilizes the more streamlined MobileNetV2 as the main network for crack feature extraction, aiming to reduce the number of model parameters. The traditional atrous convolutions in the ASPP module have been substituted with our dynamic strip convolution pyramid (DSCP) [27]. Influenced by the rapid development of biomimics in recent years. The DSCP is a new convolution method that we are inspired by the motion of the swing of snake [28]. Following this modification, a multi-level feature fusion (MFF) module that combines VIT with conventional convolutions is integrated. Additionally, a strip attention gate (AG) module has been designed for the decoder [29]. This algorithm applies learned weights to selectively enhance information across different feature maps, facilitating improved capture of semantic information regarding cracks.
2.2. Network Lightweighting
In order to save time and reduce computational cost, this study aims to replace the traditional Xception backbone feature extraction network of DeepLabV3+ with MobileNetV2, as a substitution for the original excessively parameterized feature extraction network [30]. The objective of the Xception backbone feature extraction network in DeepLabV3+ is to enhance the performance of model, while MobileNetV2 achieves model compression and lightweightness through depthwise separable convolution operations. The main idea behind MobileNetV2 is to split the standard convolution into two operations, which are depthwise convolution and pointwise convolution. In depthwise convolution, different convolutional kernels are applied to each input channel, while pointwise convolution utilizes 1×1 convolutional kernels. This design reduces the computational cost while ensuring accuracy. The new backbone network configuration is shown in Table 1.
Where t represents the expansion factor, which denotes the magnification rate of the convolutional kernels in 1×1 convolution of the first layer. And indicates the number of repetitions for the Layer Type, while represents the stride and only takes effect in the first convolutional operation.
The essence of the Inverted-Residual block layer in this structure lies in the profound operation of separable convolution, encompassing three main processes,which are channel expansion, feature extraction, and channel compression, as depicted in Figure 3. The Expansion layer employs a 1×1 convolutional kernel to map the low-dimensional space to a higher-dimensional space. The Depthwise convolution employs distinct convolutional kernels for each input channel, while the Projection layer utilizes a 1x1 convolutional kernel to map the high-dimensional features back to a lower-dimensional space. This design not only ensures accuracy but also significantly reduces computational complexity. The diagram of the Inverted-Residual structure is illustrated in Figure 3.
2.3. Dynamic Strip Convolution Pyramid
2.3.1. Dynamic Strip Convolution
Influenced by the rapid development of bionics in recent years, algorithms that have evolved from biological actions such as bee colony algorithm and ant colony algorithm have developed greatly. We were also inspired to observe that the snake was moving. Numerous convolution methods currently exist, yet they often fail to effectively extract features from cracks. As depicted in Figure 4, the fixed shapes and sizes of kernels in traditional convolution do not readily adapt to the irregular and elongated features of cracks. Dilated convolution, although it increases the receptive field, can introduce additional background noise, particularly in datasets with a significant imbalance between cracks and background. Deformable convolution enhances flexibility through its adaptive offsets; however, the uncertainty of these offsets may lead to instability and overfitting during training.
In order to improve the problems mentioned above, we propose DSCP by imitating the biological behavior of snake swing. In this section, we discuss how to implement dynamic strip convolution(DPconv) to extract local features of bridge cracks. A 1×9 planar convolution kernel, denoted as K, which can be represented as
To better align the convolution with the specific shape of bridge cracks, inspired by deformable convolutions , a deformable offset has been introduced. However, due to the uncertainty of offset and the typically slender nature of bridge cracks, arbitrary offsets might misalign the convolution sampling points from the desired feature areas. Consequently, scaling of the offset has been implemented to address this issue.The center coordinate of a convolution kernel is known as . Each convolution kernel sampling point has an offset. The P can be derived as
the offsets are linearly scaled without altering their trend of variation.The offset can be represented as
where c assumes the discrete values 0, 1, 2, 3 and 4 each representing the horizontal distance from the center of the convolution kernel.The belongs to the set of positive integers , and the range of is constrained to .
An iterative method is used to select grid coordinates within the convolution kernel K. Each coordinate, , is determined incrementally from the central coordinate . Beginning at the center, the placement of subsequent grids is based on the offsets from preceding ones.The position is modified from by the offset , as depicted in Figure 5. This strategy maintains a continuous focus, avoiding excessive spread of the perceptual field due to significant deformative offsets.The specific changes in the coordinates of the convolution kernel depicted in Figure 5. The can be expressed as
where is typically a decimal value, while coordinates are usually in integer form, bilinear interpolation is employed, which is represented as
where K denotes the decimal locations specified in equation 4, lists all integer spatial positions, and H represents the bilinear interpolation kernel. This setup allows for the precise mapping of decimal coordinates K to integer grid positions using H, the interpolation function.
2.3.2. DSCP Module
In this study, convolution branches in the original ASPP module are replaced with dynamic strip convolution branches. Each branch consists of a DPconv in the x-direction connected to a DPconv in the y-direction. This setup effectively captures crack features from different orientations. Additionally, as the parameter increases, the offset at each convolution kernel corresponding position also increases, thereby expanding the receptive field of the kernels, as illustrated in Figure 6.
Crack features extracted from multiple branches are combined with DPconv in two orientations. The dynamic adjustment of convolution positions enables the capture of richer local features, particularly for complex crack structures, allowing our network to better adapt to irregular crack shapes. The structure diagram of the DSCP module is shown in Figure 7.
2.4. Multi-Level Feature Fusion
In crack images, , the features typically show as elongated and continuous structures that span the image. Standard convolutional neural networks struggle with segmentation tasks, particularly in accurately delineating these cracks. However, the Transformer architecture excels in modeling long-distance dependencies and understanding the overall connections within crack images. This enhances image analysis. In our research, we combine features extracted locally through convolution with those extracted globally via the VIT. This combination improves the consistency of segmentation boundaries. Local features capture detailed crack outlines, while global features provide a broader context, leading to smoother and more coherent segmentation boundaries.
2.4.1. Vision Transformer
Figure 8 illustrates the architecture of VIT. Initially, the image is divided into patches, which are the inputs for the network. These patches are converted into one-dimensional vectors using linear transformation. These vectors are processed by the Transformer encoder that employs self-attention mechanisms. The encoder includes several identical Transformer modules, each featuring a normalization layer, multi-head attention, another normalization layer, and an MLP structure. Finally, the classification output is derived by processing the CLS Token through an MLP module, which is built from a series of linear layers and activation functions followed by an additional linear layer.
2.4.2. MFF Module
The capabilities of various hierarchical features are exploited by effectively merging VIT with CNN to create a composite network module termed MFF. The structure of this module is shown in Figure 9.
The module comprises two parts, the feature extraction unit and the feature fusion unit. Initially, the input undergoes feature extraction using a 3×3 convolution followed by a 1×1 convolution to capture local details. Then, N Vision Transformer networks are utilized for global feature extraction. These global features merge with local ones in the feature fusion unit. Subsequently, a 1×1 convolution adjusts the channels, merging the input features of this module to enrich semantic content and improve continuity in crack segmentation. The formula is
where denotes the global features extracted; refers to the local features extracted; is the output from the combination of both local and global features. The operations and represent the 3x3 convolution and 1x1 convolution respectively. indicates the feature output from N Vision Transformer networks; is the initial input features of this module.
2.5. Striped Attention Gating Module
In the decoding section of our enhanced DeepLabV3+ network model, linear interpolation is utilized for upsampling to generate high-resolution images, complicating the recovery of detailed image features. In images of cracks, a substantial imbalance exists between crack pixels and background pixels. Consequently, the network for extracting crack features must prioritize crack pixels. By incorporating our tailored attention mechanism, the model gains heightened sensitivity to crack pixels, thus improving its crack detection capabilities. Figure 10 depicts the configuration of the attention module.
where is derived from the convolutional layers in the encoder, and is derived from the upsampling process in the decoder. The aim is to harmonize the channel count of these feature maps using a 1×1 convolution. This step is followed by their combination to enhance the overall feature representation. Subsequently, bridge cracks are often characterized by extended, narrow structures. Using a large square window tends to include unwanted information from unrelated areas. Thus, this research employs a uniquely shaped convolutional kernel—a linear kernel. This kernel facilitates the simultaneous gathering of both wide-ranging and focused information. It uses average pooling with kernels sized W×1 and H×1 horizontally and vertically, respectively, to extract feature information. This method helps establish connections over long distances among spaced-out areas, encoding the linear regions to enhance local detail capture and improve the continuity of linear segmentation. Vertical pooling is executed with an H×1 kernel, summing and averaging each column from the input feature map y to generate the output , presented as a row vector with dimensions C×1×W, expressed as
In a similar fashion, each pixel values of row in the feature map y are aggregated and averaged. After applying horizontal pooling with a 1×W kernel, the output emerges as a column vector. This vector, measuring C×H×1, is defined as
where c represents the total number of channels while H and W indicate the height and width of the feature map. i and j specify the positions of the i-th row and j-th column within the feature map. Next, using a 3×3 convolution, the pooled map is scaled to match the resolution of the input, forming the expanded feature maps and . These maps are then added together. The can be expressed as
Finally, the combined map passes through a 1×1 convolution and a Sigmoid layer. The ultimate output, denoted as z, is derived by performing an element-wise multiplication with the initial input. The z can be derived as
where refers to the operation of element-wise multiplication, signifies the Sigmoid activation function, and f indicates a 1×1 convolution.
3. Experimental Results
3.1. Dataset
This study uses the SDNET2018 dataset, which contains over 56,000 images of concrete structures like bridge decks, walls, and pavements. These images support the development and testing of algorithms for detecting cracks in concrete. And The dataset was captured using a DJI M300RTK drone equipped with a ZENMUSE H20 camera. The pixel resolution of the images was 5184 × 3888. Since the size of each single image was too large, we used LabelMe [44] for semantic annotation, and then cropped the image to a size of 512 × 512. As shown in Figure 11, the images were annotated at the pixel level, classifying each pixel into crack regions (white) and background (black).
To enhance data variability, we applied horizontal flipping and rotations at 90 and 180 degrees, ensuring that the labels were transformed accordingly to match the modified images. The dataset was divided into training (70%) and testing (30%) sets.
3.2. Experimental Configuration
This model is developed with PyTorch, a prominent framework in deep learning. Table 2 provides a detailed summary of the setup used in the experiments.
During training, the Adam optimizer adjusts the network’s predictive weights. We configure the batch size at 8 and the number of epochs at 100, with a learning rate of 0.0005.
3.3. The Evaluation Metrics
To objectively evaluate the effectiveness of the model in detecting road cracks, key metrics such as the Recall, Parameter, Precision, and Mean Intersection Over Union (MIoU) were selected.Their respective formulas can be expressed as
where a different pixel categories with background as a separate category. Let denote the count of accurately classified pixels, and the count of pixels from class k incorrectly labeled as class l.
The F1 derived from the Precision and Recall in segmentation tasks, acts as an indicator of accuracy. The formula is outlined as
where and represent the values of the previously mentioned metrics, Precision and Recall.
3.4. Improved Model Performance Evaluation
3.4.1. Fusing Experiment
To validate the modifications proposed in this paper, including the replacement of the feature extraction backbone network with MobileNetV2, improvements to the ASPP module resulting in the DSCP module, and the introduction of the MFF and AG modules, evaluations were conducted on the SDNET2018 dataset. Table 3 presents the qualitative comparison results of various module combinations on the SDNET2018 dataset. The baseline model DeepLabV3+ is denoted by DL, and the MobileNetV2 network is represented by MV.
3.4.2. Comparison and Analysis of Performance Among Different Models
In the realm of semantic segmentation, we have evaluated our newly developed method against traditional techniques. (1) U-Net, a balanced architecture, utilizes successive layers. (2) FCN, a flexible semantic segmentation framework, processes images of varying dimensions. (3) SPSNet employs spatial pyramid pooling and attention mechanisms for segmenting images. (4) Adaptive thresholding serves as a conventional technique for detecting cracks in digital imagery.
Throughout the training phase, we monitored the Mean Intersection over Union (MIoU) metrics for each model. As shown in Figure 12, MIoU values tend to increase with more iterations.
Notably, in MIoU comparisons, our FissureNet significantly outperforms U-Net, FCN, and SPSNet.As shown in Figure 13, the loss values of the five models gradually stabilize with the increase in the number of iterations during the training process.
The smallest loss value is exhibited by the FissureNet model, which also demonstrates stronger convergence. As shown in Figure 14, the best performance across the four dimensions of MIoU, F1, Precision, and Recall is exhibited by the FissureNet model.
As shown in Figure 15, superior crack segmentation accuracy and excellent continuity in segmenting consecutive lines are exhibited by our model compared to the other four methods. UNet lacks precision in segmenting fine details. While FCN can approximate the contours of cracks, its segmentation continuity is poor. SPSNet, despite extracting crack information from multiple scales, is affected by background noise, leading to compromised segmentation accuracy. The least effective approach is the traditional digital image processing methods. This is because traditional methods struggle to capture the semantic information of images. Although they can perform pixel-level segmentation, they face challenges integrating the semantic information of different objects, thus failing to provide higher-level semantic understanding.
As shown in Table 4, we evaluated five crack detection models on the same test dataset.Among the deep learning network methods, FCN exhibits the poorest performance. There is a significant performance gap between traditional methods and deep learning approaches. From Table 4, it can be observed that our modified FissureNet algorithm, based on the improved Deeplabv3+ architecture, outperforms other compared algorithms in terms of accuracy-related metrics, despite not having the optimal parameter count. This indicates that the improved Deeplabv3+ algorithm enhances crack detection accuracy within an acceptable parameter range, enabling the network to better fulfill the task of bridge crack detection.
4. Conclusion
This article presents an innovative approach to the segmentation of bridge cracks, proposing the FissureNet algorithm, which is based on an enhanced version of the DeeplabV3+ network. By replacing the original backbone network and implementing lightweight operations, the algorithm reduces parameter volume and enhances computational efficiency. Additionally, inspired by the related algorithms in the field of biomimics, we observe the biological movement of snakes and propose DPconvs, a new Convolution method. And replacing all the dilated convolution branches in the original ASPP module with our DPconvs allows the model to better focus on the fine details of small cracks.To address the challenges posed by connected and long-range bridge cracks in traditional CNNs for image segmentation tasks, we introduce the Transformer structure. By fusing local and global features from different levels, we are able to capture long-range dependencies between different parts of crack images more effectively. This improvement allows our model to comprehensively understand crack images and enhance feature extraction capabilities for connected and long-range cracks, thereby improving the performance of crack detection algorithms. Finally, in the decoding section, we design a slender attention gate mechanism, enabling the model to better utilize semantic information from cracks and enhance perception of crack edge regions, thereby further improving crack segmentation accuracy. Experimental results demonstrate that the enhanced algorithm surpasses the original algorithm in crack identification capability while also reducing parameter volume.In comparison to the previous version of the DeeplabV3+ network, the has reached an impressive 84.3%, representing a notable improvement of 5.1%. The MIoU value has reached 85.7%, showcasing a significant advancement of 3.9%. Moreover, the Precision value has achieved 82.4%, demonstrating a commendable enhancement of 1.1%. The Recall value has reached an impressive 87.4%, exhibiting a remarkable boost of 10.2%. Notably, the parameter volume has been reduced by 18.48M. This study has effectively optimized the detection capability of bridge cracks while simultaneously reducing the algorithm’s parameter volume, rendering it highly applicable in practical applications.
China boasts a substantial inventory of bridges, and the efficient and precise detection of crack pathologies holds profound significance for the safety of production and daily life. The model proposed in this article has to some extent enhanced the accuracy of crack detection, yet there remain numerous areas for improvement, such as the arduous task of data annotation and the challenges associated with data acquisition. In the next phase of research, we intend to conduct real-time studies on bridge crack detection, aiming to provide more convenient and expedient support for this crucial domain.
Author Contributions
Conceptualization, D.W.; methodology, D.W. and F.Q.S.; software, D.W and F.Q.S.; validation, F.Q.S.; formal analysis, F.Q.S. and D.W; investigation, F.Q.S. , X.Y.Y. and S.X.J.; resources, D.W., X.Y.Y. and X.L.L ; data curation, F.Q.S. , S.X.J. and X.Y.Y.; writing—original draft preparation, F.Q.S.; writing—review and editing, D.W.; visualization, F.Q.S. ; supervision, S.X.J. and D.W. ; project administration, X.L.L. and D.W. All authors have read and agreed to the published version of the manuscript.
Funding
This research was funded by the National Natural Science Foundation of China (Grant No. 62103068, Grant No. 52478141, Grant No. 62003063, Grant No. 62205039), Science and Technology Research Program of Chongqing Municipal Education Commission of China (Grant No. KJQN202100745, Grant No. KJZD-K202400709), and the Natural Science Foundation of Chongqing, China (Grant No. CSTB2022NSCQ-MSX1599).
Data Availability Statement
Due to the nature of this research, participants of this study did not agree for their data to be shared publicly, so supporting data is not available.
Conflicts of Interest
All authors disclosed no relevant relationships.
References
- Zhao, R., Yuan, Y., Wei, X., et al. (2020). Review of annual progress of bridge engineering in 2019. Advances in Bridge Engineering, 1, 1-57. [CrossRef]
- Zhong, S. Y., Chen, Q., et al. (2020). Bridge engineering in photocatalysis and photoelectrocatalysis. Nanoscale, 12(10), 5764-5791. [CrossRef]
- Abdelkader, E. M., Zayed, T., Faris, N. (2023). Synthesized evaluation of reinforced concrete bridge defects, their non-destructive inspection and analysis methods: A systematic review and bibliometric analysis of the past three decades. Buildings, 13(3), 800. [CrossRef]
- Zoubir, H., Rguig, M., El Aroussi, M., et al. (2022). Concrete bridge defects identification and localization based on classification deep convolutional neural networks and transfer learning. Remote Sensing, 14(19), 4882. [CrossRef]
- Fujita, Y., Hamamoto, Y. (2011). A robust automatic crack detection method from noisy concrete surfaces. Machine Vision and Applications, 22, 245-254. [CrossRef]
- Li, G., Liu, Q., Zhao, S., et al. (2020). Automatic crack recognition for concrete bridges using a fully convolutional neural network and naive Bayes data fusion based on a visual detection system. Measurement Science and Technology, 31(7), 075403. [CrossRef]
- Liangfu, L. I., Waoxiao, G. A. O., Ruiyun, S. U. N., et al. (2018). Study on bridge floor crack classification method based on sparse coding. Journal of Light Industry, 33(3).
- Lee, B. Y., Kim, Y. Y., Yi, S. T., et al. (2013). Automated image processing technique for detecting and analysing concrete surface cracks. Structure and Infrastructure Engineering, 9(6), 567-577. [CrossRef]
- Wang, B. X., Zhang, Q. L., Zhao, W. G. (2018). Fast concrete crack detection method via L2 sparse representation. Electronics Letters, 54(12), 752-753. [CrossRef]
- Fan, Z., Wu, Y., Lu, J., et al. (2018). Automatic pavement crack detection based on structured prediction with the convolutional neural network. arXiv preprint arXiv:1802.02208.
- Zhang, A., Wang, K. C. P., Fei, Y., et al. (2018). Deep learning–based fully automated pavement crack detection on 3D asphalt surfaces with an improved CrackNet. Journal of Computing in Civil Engineering, 32(5), 04018041. [CrossRef]
- Pauly, L., Hogg, D., Fuentes, R., et al. (2017). Deeper networks for pavement crack detection. In Proceedings of the 34th ISARC (pp. 479-485). IAARC. [CrossRef]
- Lau, S. L. H., Chong, E. K. P., Yang, X., et al. (2020). Automated pavement crack segmentation using u-net-based convolutional neural network. IEEE Access, 8, 114892-114899. [CrossRef]
- Katsamenis, I., Protopapadakis, E., Bakalos, N., et al. (2023). A Few-Shot Attention Recurrent Residual U-Net for Crack Segmentation. arXiv preprint arXiv:2303.01582.
- Chen, L. C., Zhu, Y., Papandreou, G., et al. (2018). Encoder-decoder with atrous separable convolution for semantic image segmentation. In Proceedings of the European Conference on Computer Vision (ECCV) (pp. 801-818).
- Sandler, M., Howard, A., Zhu, M., et al. (2018). MobileNetV2: Inverted residuals and linear bottlenecks. In Proceedings of the IEEE Conference on Computer Vision and Pattern Recognition (pp. 4510-4520).
- Khan, S., Naseer, M., Hayat, M., et al. (2022). Transformers in vision: A survey. ACM Computing Surveys (CSUR), 54(10s), 1-41. [CrossRef]
- Yousefi, S., Sokooti, H., Elmahdy, M. S., et al. (2021). Esophageal tumor segmentation in CT images using a dilated dense attention Unet (DDAUnet). IEEE Access, 9, 99235-99248. [CrossRef]
- Ronneberger, O., Fischer, P., Brox, T. (2015). U-net: Convolutional networks for biomedical image segmentation. In Medical Image Computing and Computer-Assisted Intervention–MICCAI 2015: 18th International Conference, Munich, Germany, October 5-9, 2015, Proceedings, Part III 18. Springer International Publishing, 234-241.
- Badrinarayanan, V., Kendall, A., Cipolla, R. (2017). Segnet: A deep convolutional encoder-decoder architecture for image segmentation. IEEE Transactions on Pattern Analysis and Machine Intelligence, 39(12), 2481-2495. [CrossRef]
- Long, J., Shelhamer, E., Darrell, T. (2015). Fully convolutional networks for semantic segmentation. In Proceedings of the IEEE Conference on Computer Vision and Pattern Recognition (pp. 3431-3440).
- Chen, L. C., Papandreou, G., Kokkinos, I., et al. (2017). Deeplab: Semantic image segmentation with deep convolutional nets, atrous convolution, and fully connected crfs. IEEE Transactions on Pattern Analysis and Machine Intelligence, 40(4), 834-848. [CrossRef]
- Weber, M., Wang, H., Qiao, S., et al. (2021). Deeplab2: A tensorflow library for deep labeling. arXiv preprint arXiv:2106.09748.
- Chen, L. C., Papandreou, G., Schroff, F., et al. (2017). Rethinking atrous convolution for semantic image segmentation. arXiv preprint arXiv:1706.05587.
- Olimov, B., Subramanian, B., Ugli, R. A. A., et al. (2023). Consecutive multiscale feature learning-based image classification model. Scientific Reports, 13(1), 3595. [CrossRef]
- Yu, L., et al. (2022). A lightweight complex-valued DeepLabv3+ for semantic segmentation of PolSAR image. IEEE Journal of Selected Topics in Applied Earth Observations and Remote Sensing, 15, 930-943. [CrossRef]
- Wadekar, S. N., Chaurasia, A. (2022). Mobilevitv3: Mobile-friendly vision transformer with simple and effective fusion of local, global and input features. arXiv preprint arXiv:2209.15159.
- Liu, R., et al. (2022). RAANet: A residual ASPP with attention framework for semantic segmentation of high-resolution remote sensing images. Remote Sensing, 14(13), 3109. [CrossRef]
- Zhang, J., et al. (2020). Attention gate resU-Net for automatic MRI brain tumor segmentation. IEEE Access, 8, 58533-58545.
- Gulzar, Y. (2023). Fruit image classification model based on MobileNetV2 with deep transfer learning technique. Sustainability, 15(3), 1906. [CrossRef]
Figure 1.
Demonstration of related challenges.
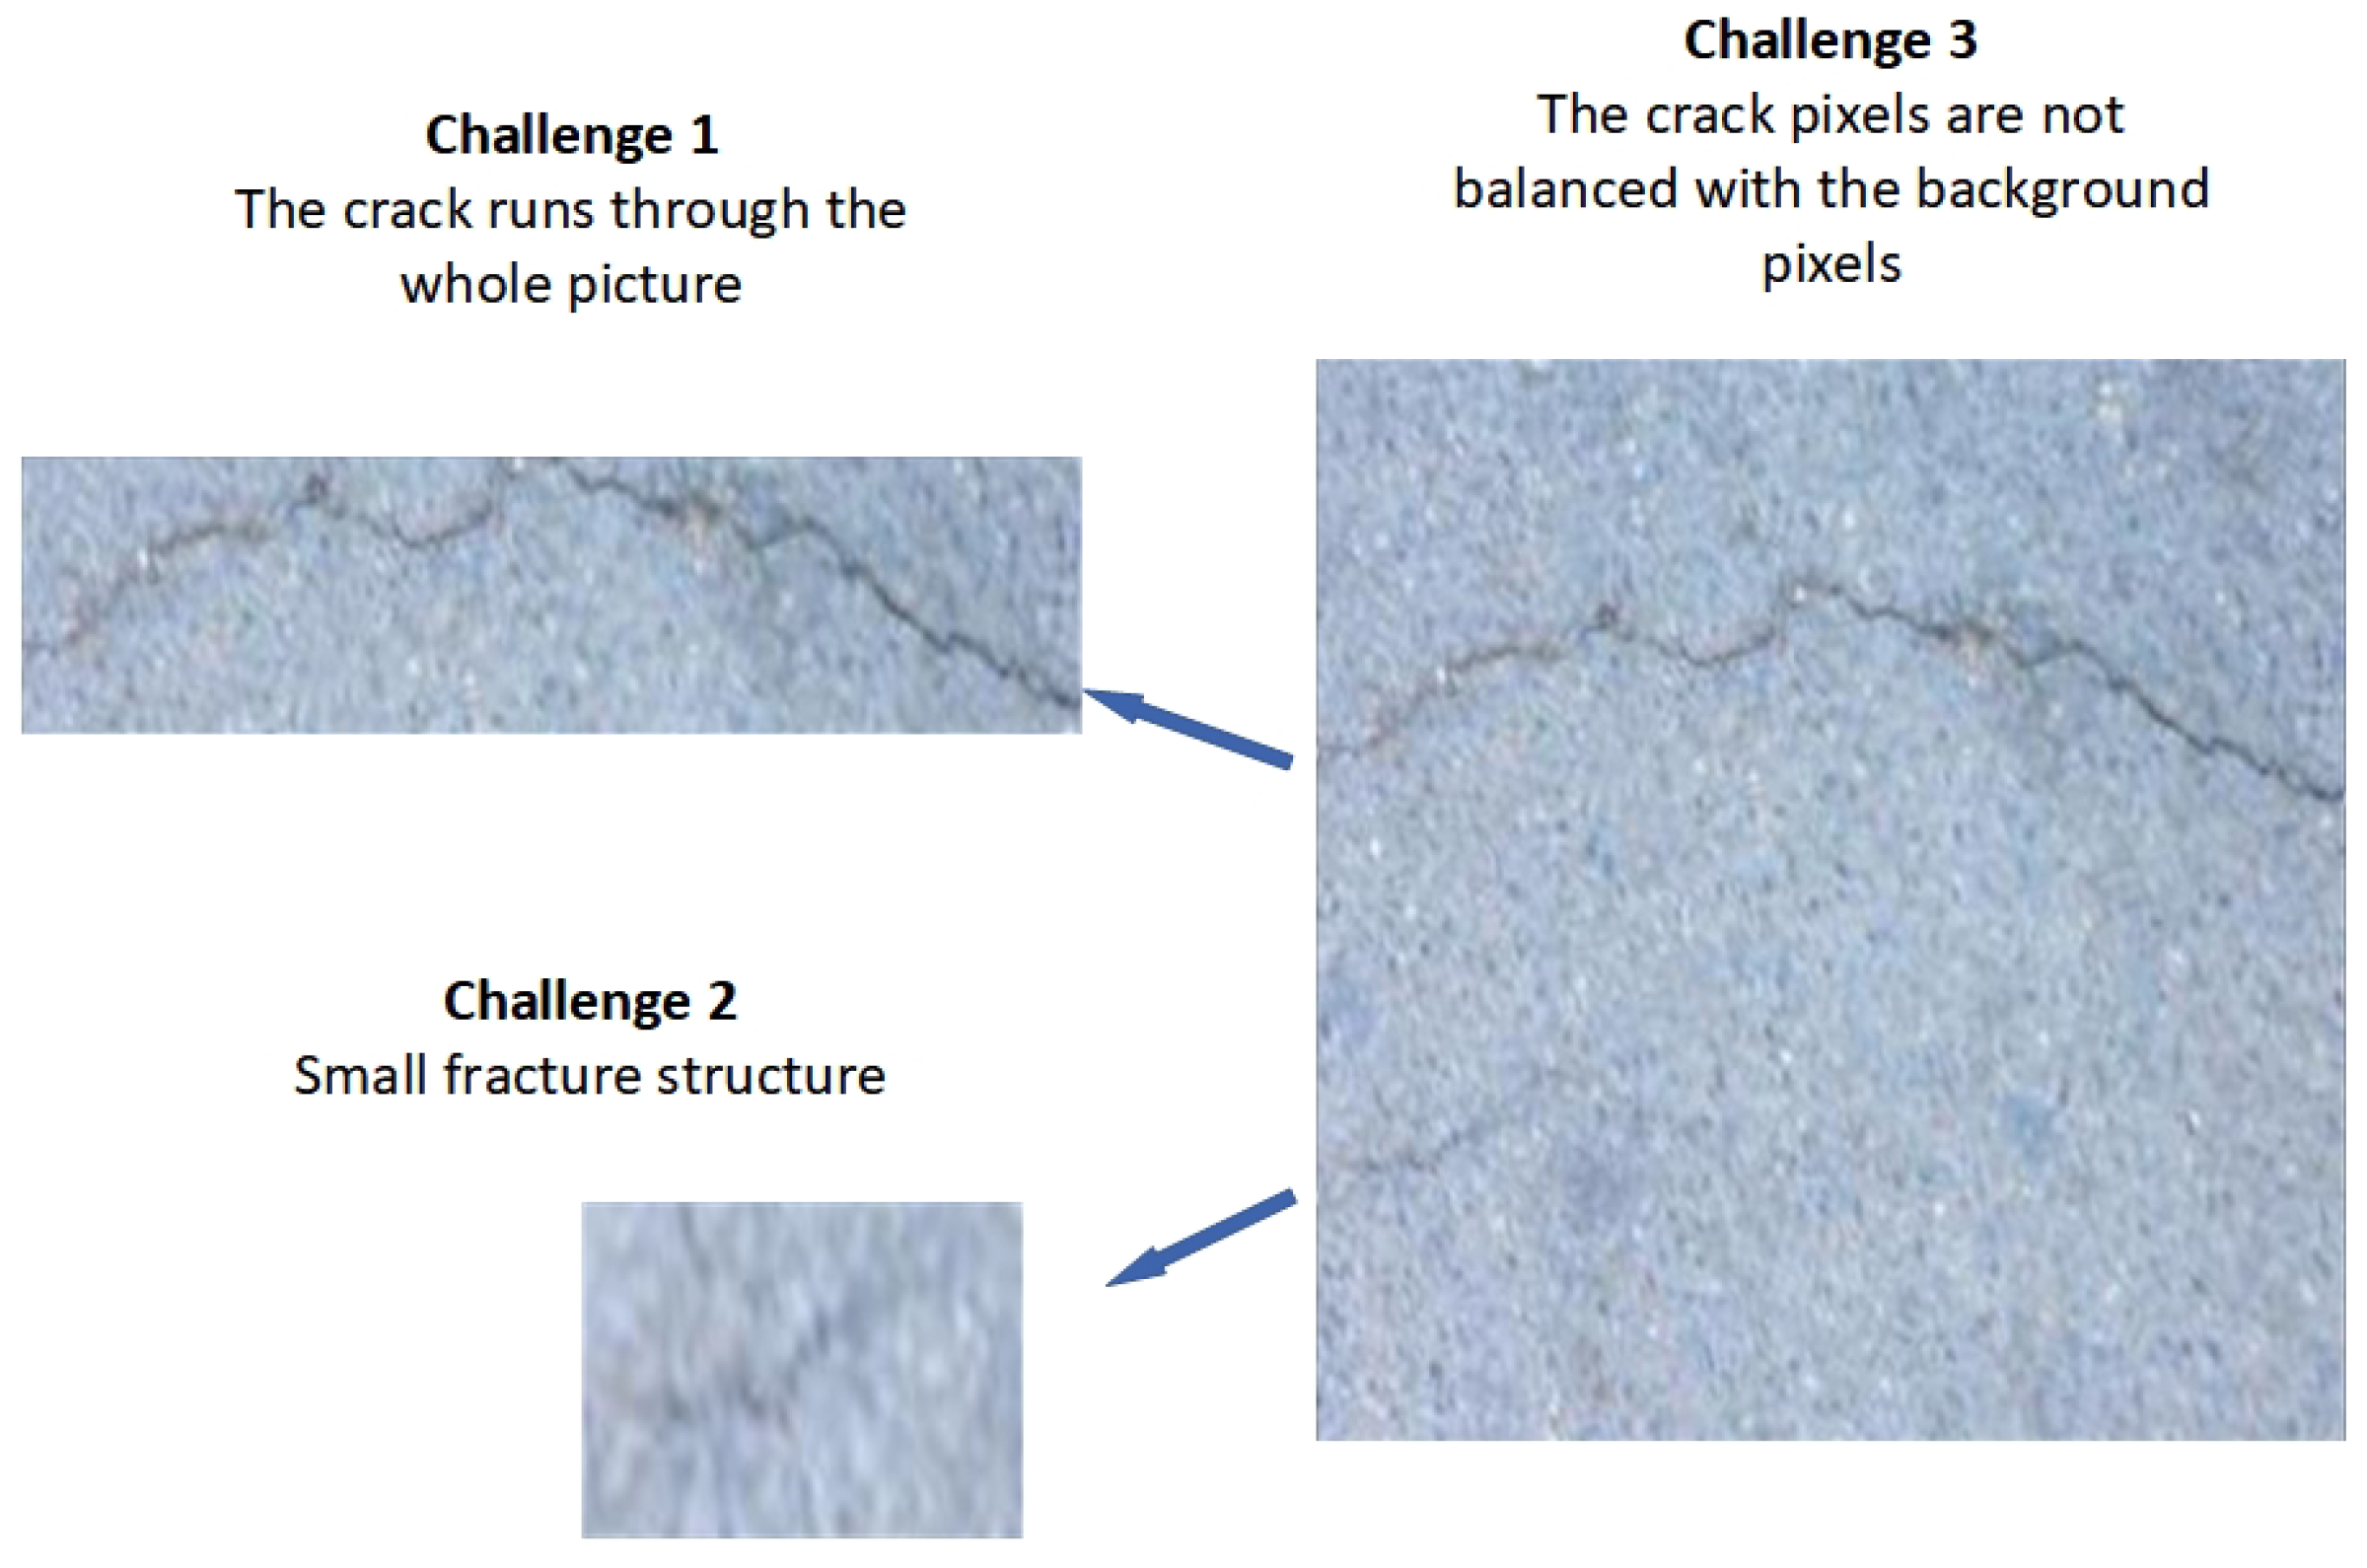
Figure 2.
FissureNet architecture diagram.
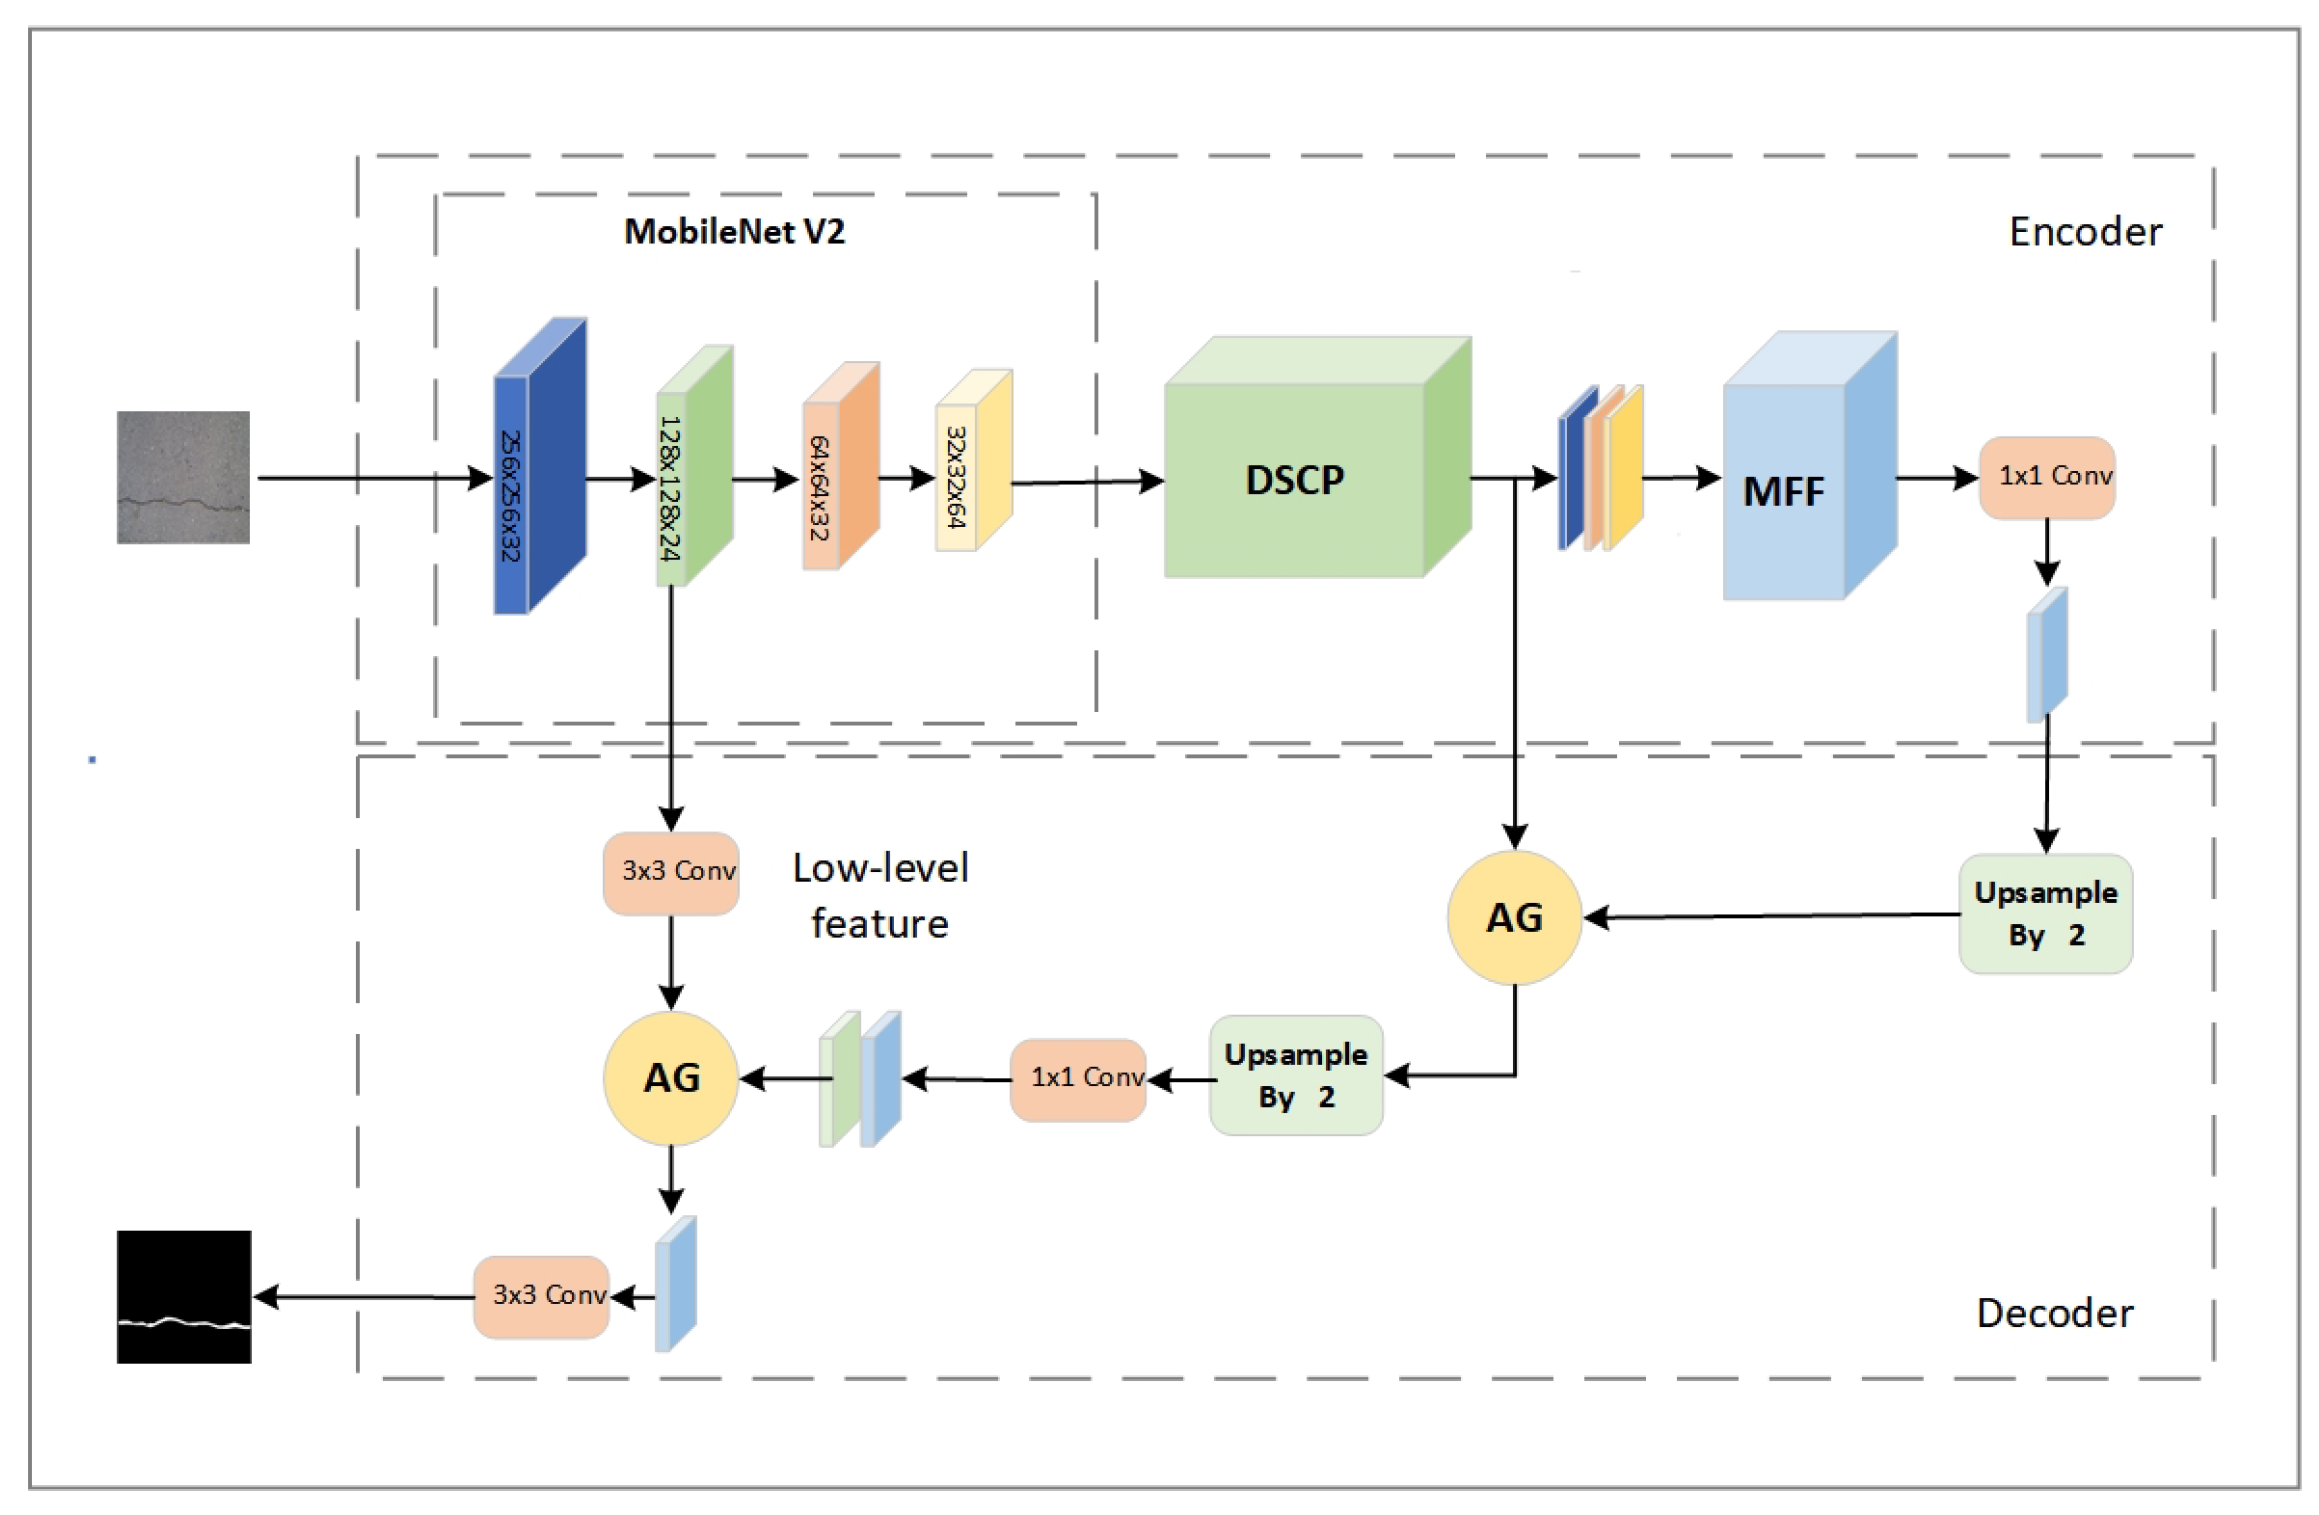
Figure 3.
Inverted-Residual structure.
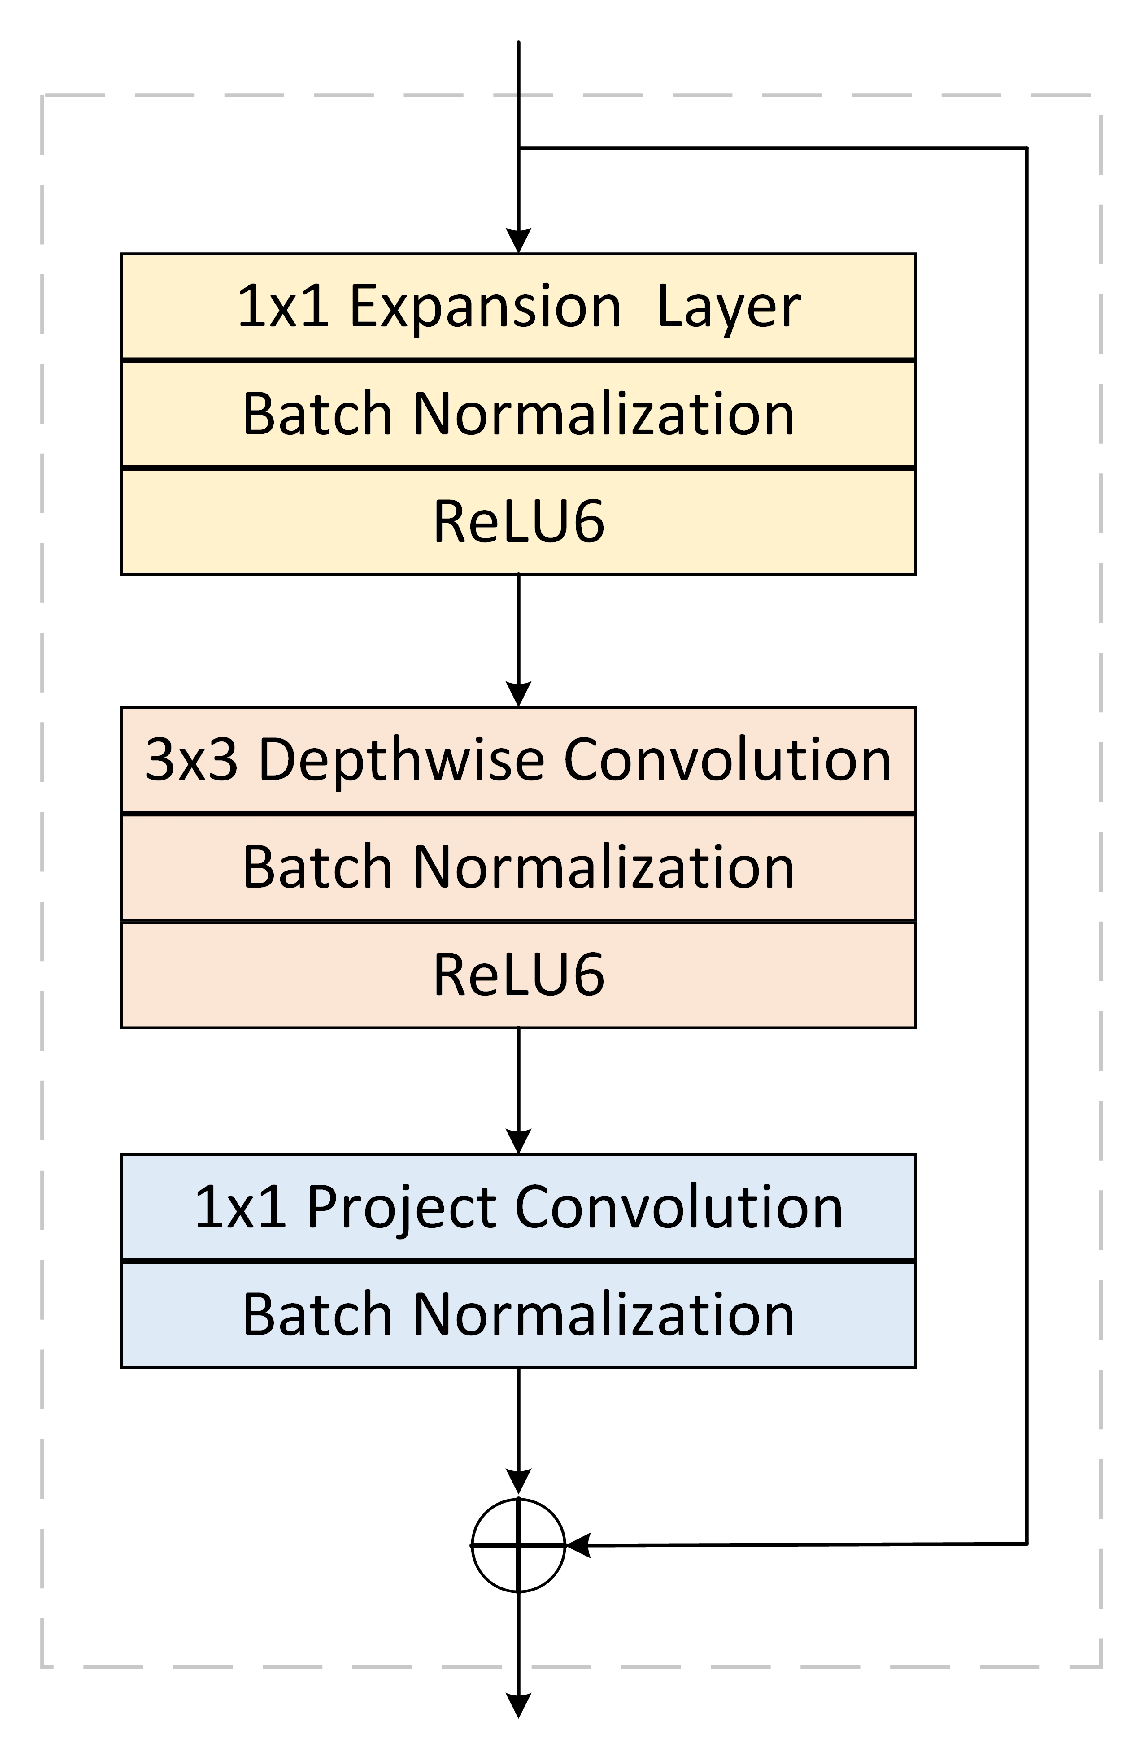
Figure 4.
Schematic of sampling positions for different convolution methods. Blue dots represent convolution kernel sampling points, and green grids represent object pixel positions.
Figure 4.
Schematic of sampling positions for different convolution methods. Blue dots represent convolution kernel sampling points, and green grids represent object pixel positions.
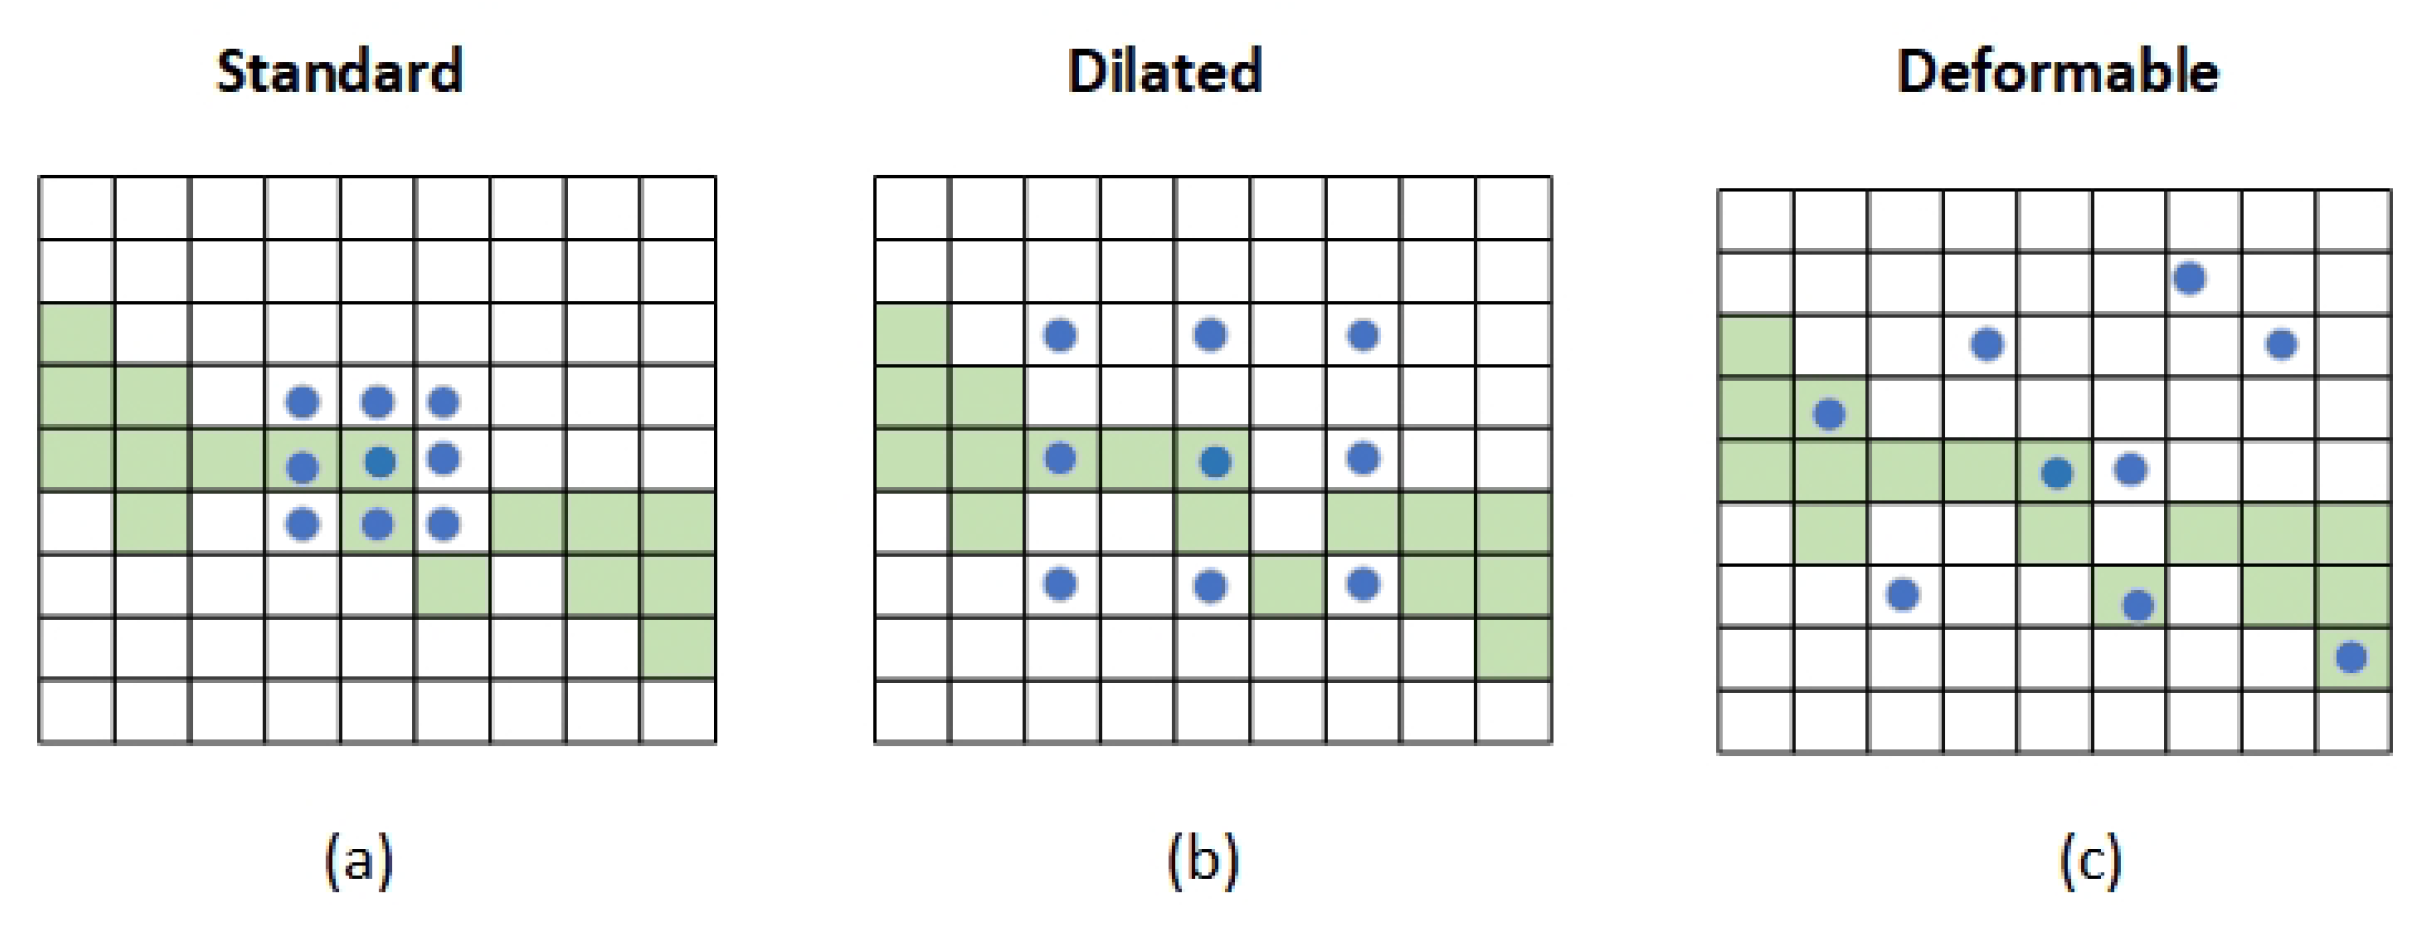
Figure 5.
Schematic of dynamic strip convolution.
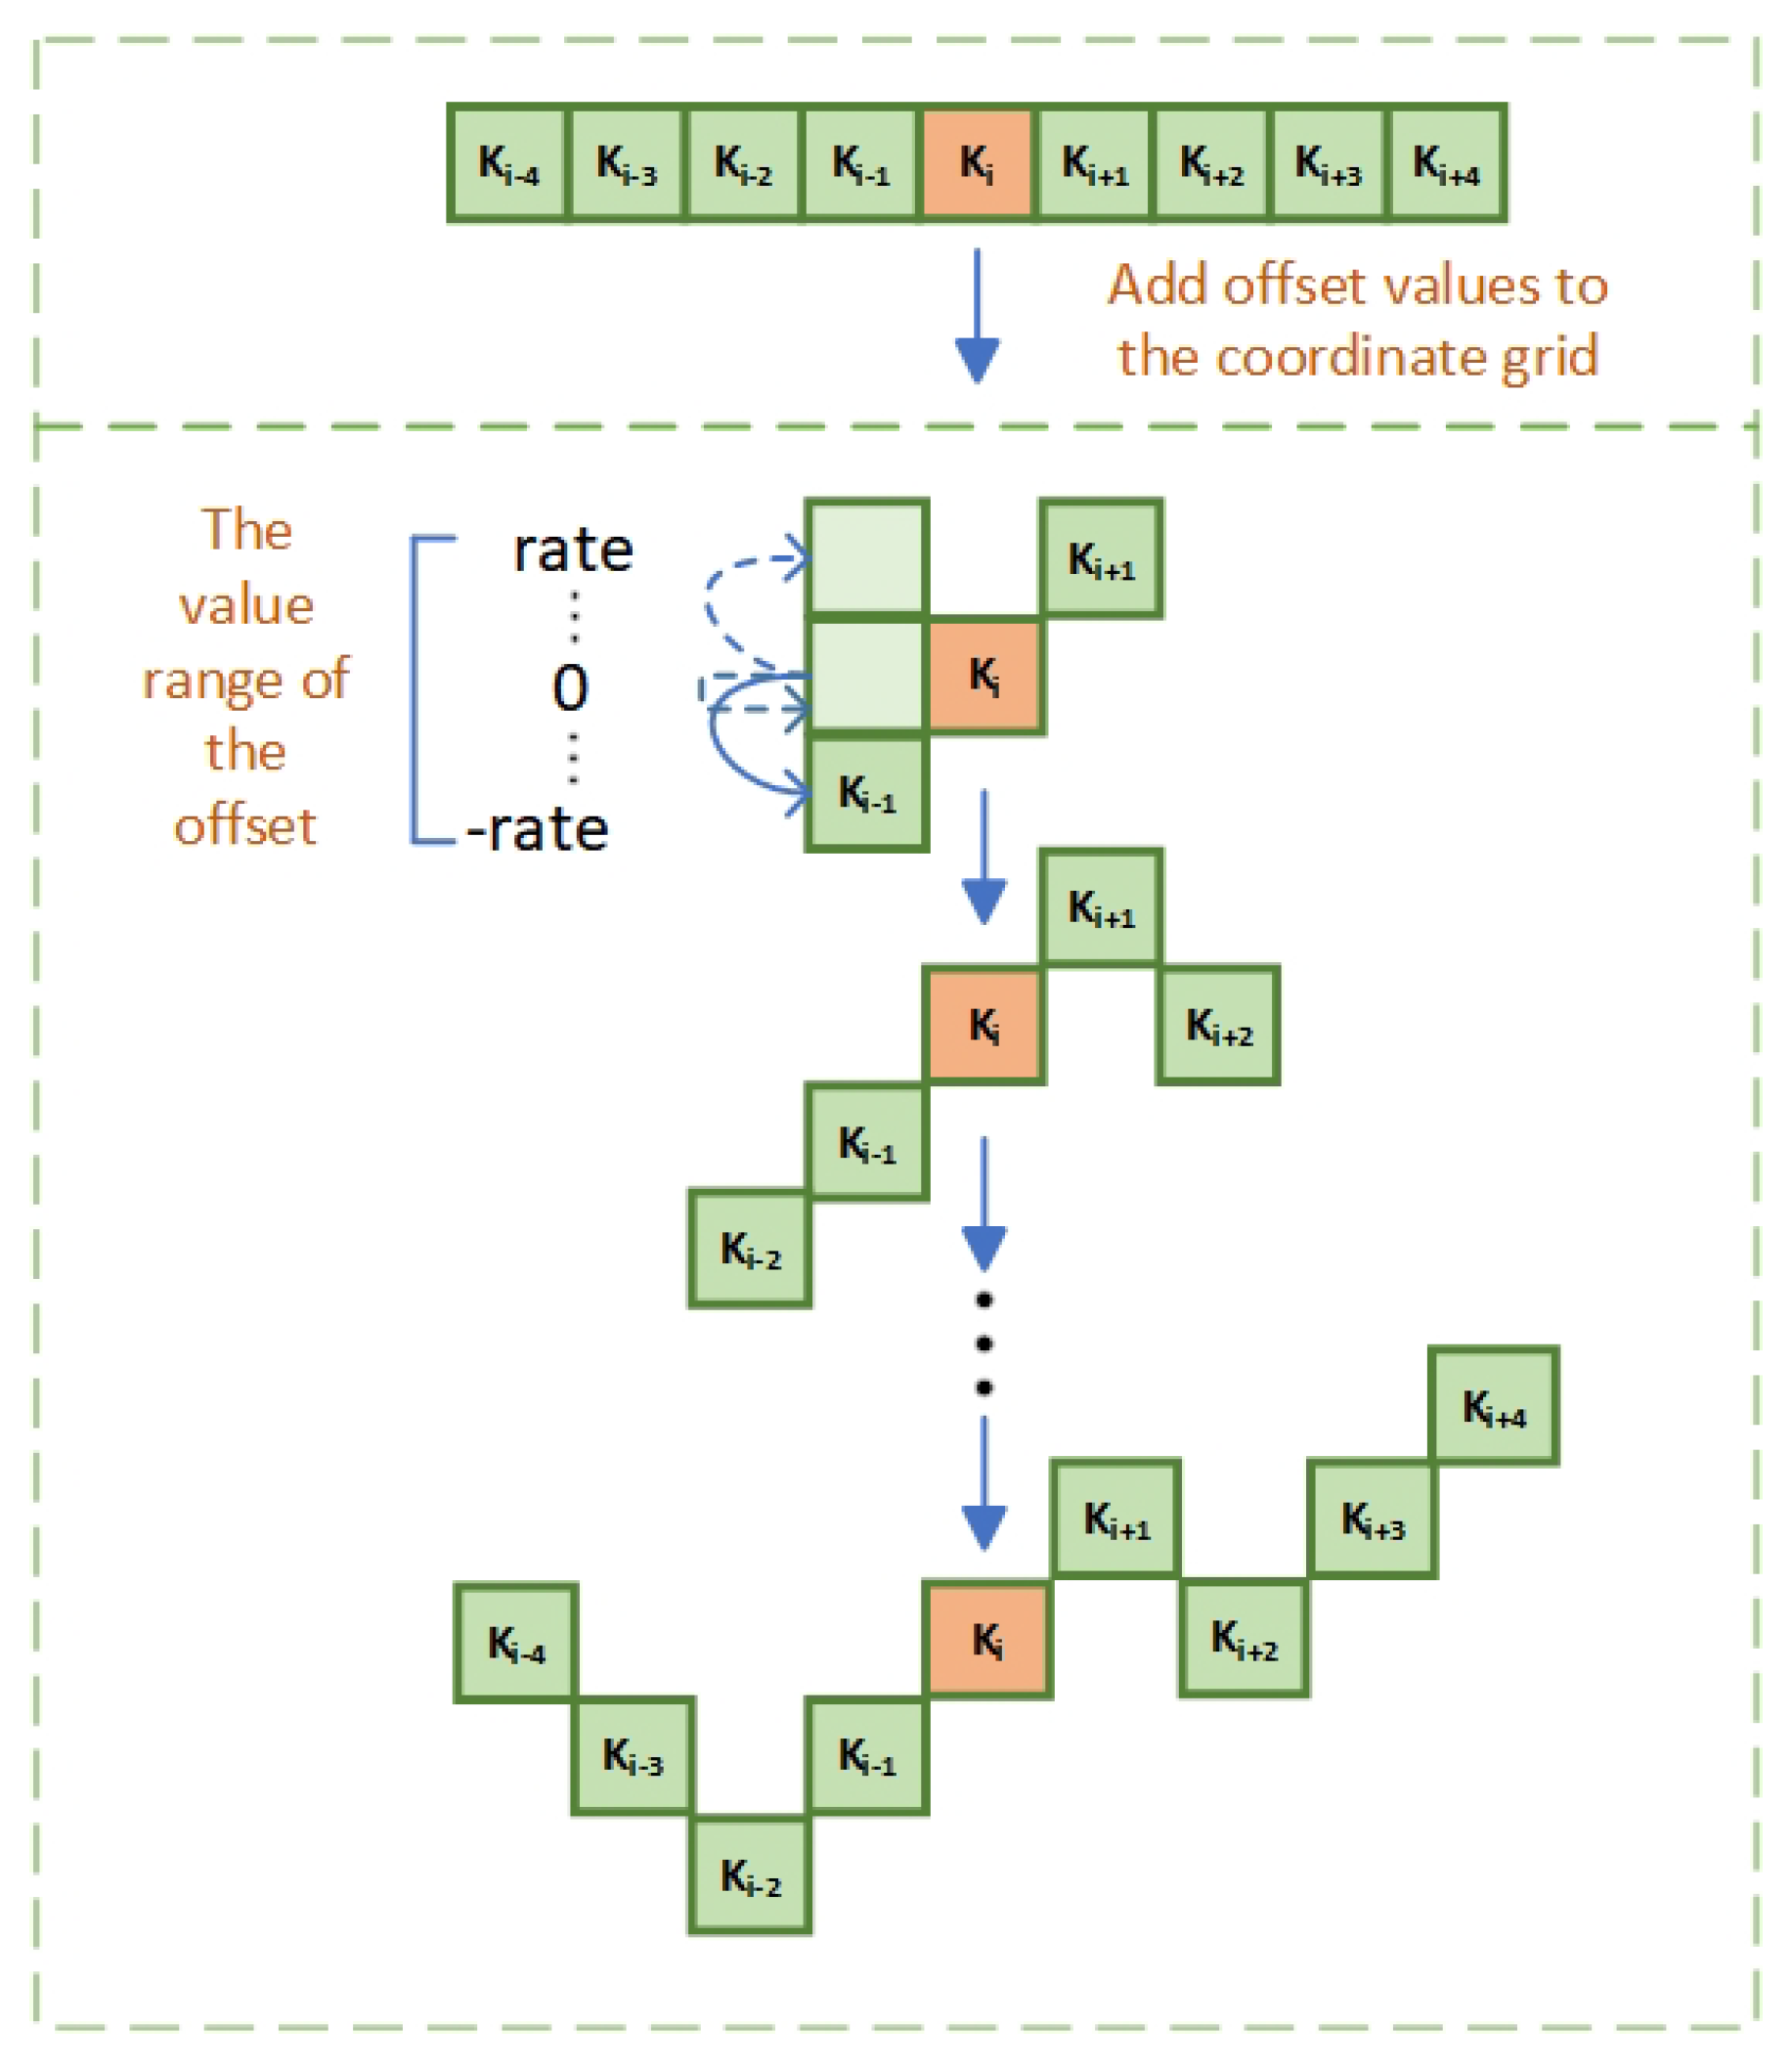
Figure 6.
Changes in the receptive field of dynamic strip convolution under different parameters.
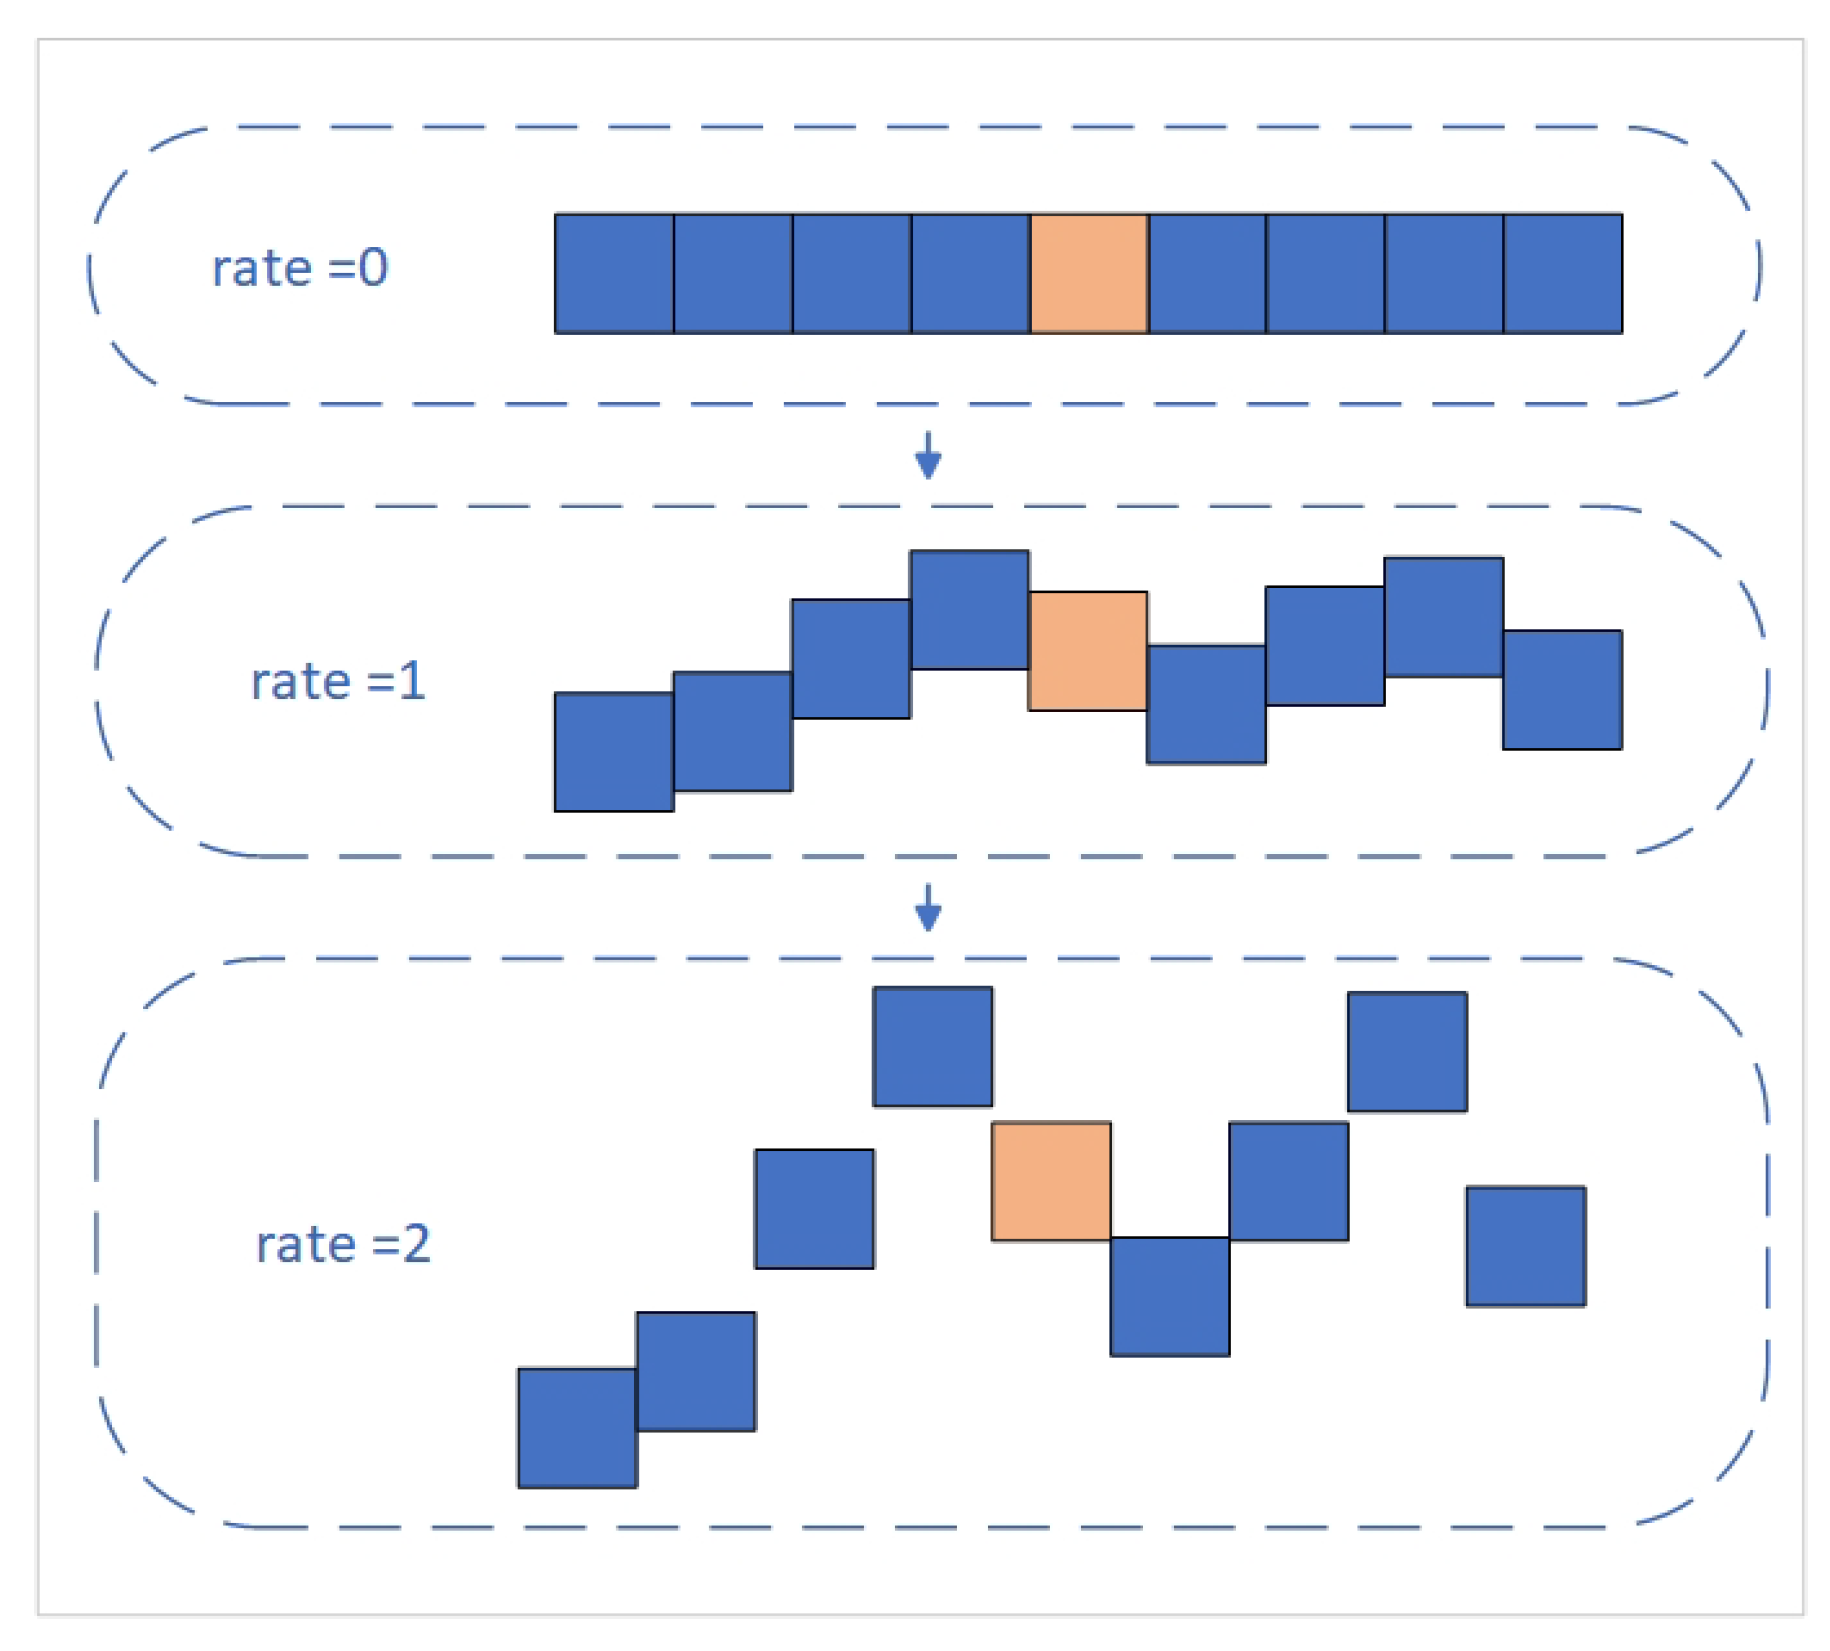
Figure 7.
DSCP structure.
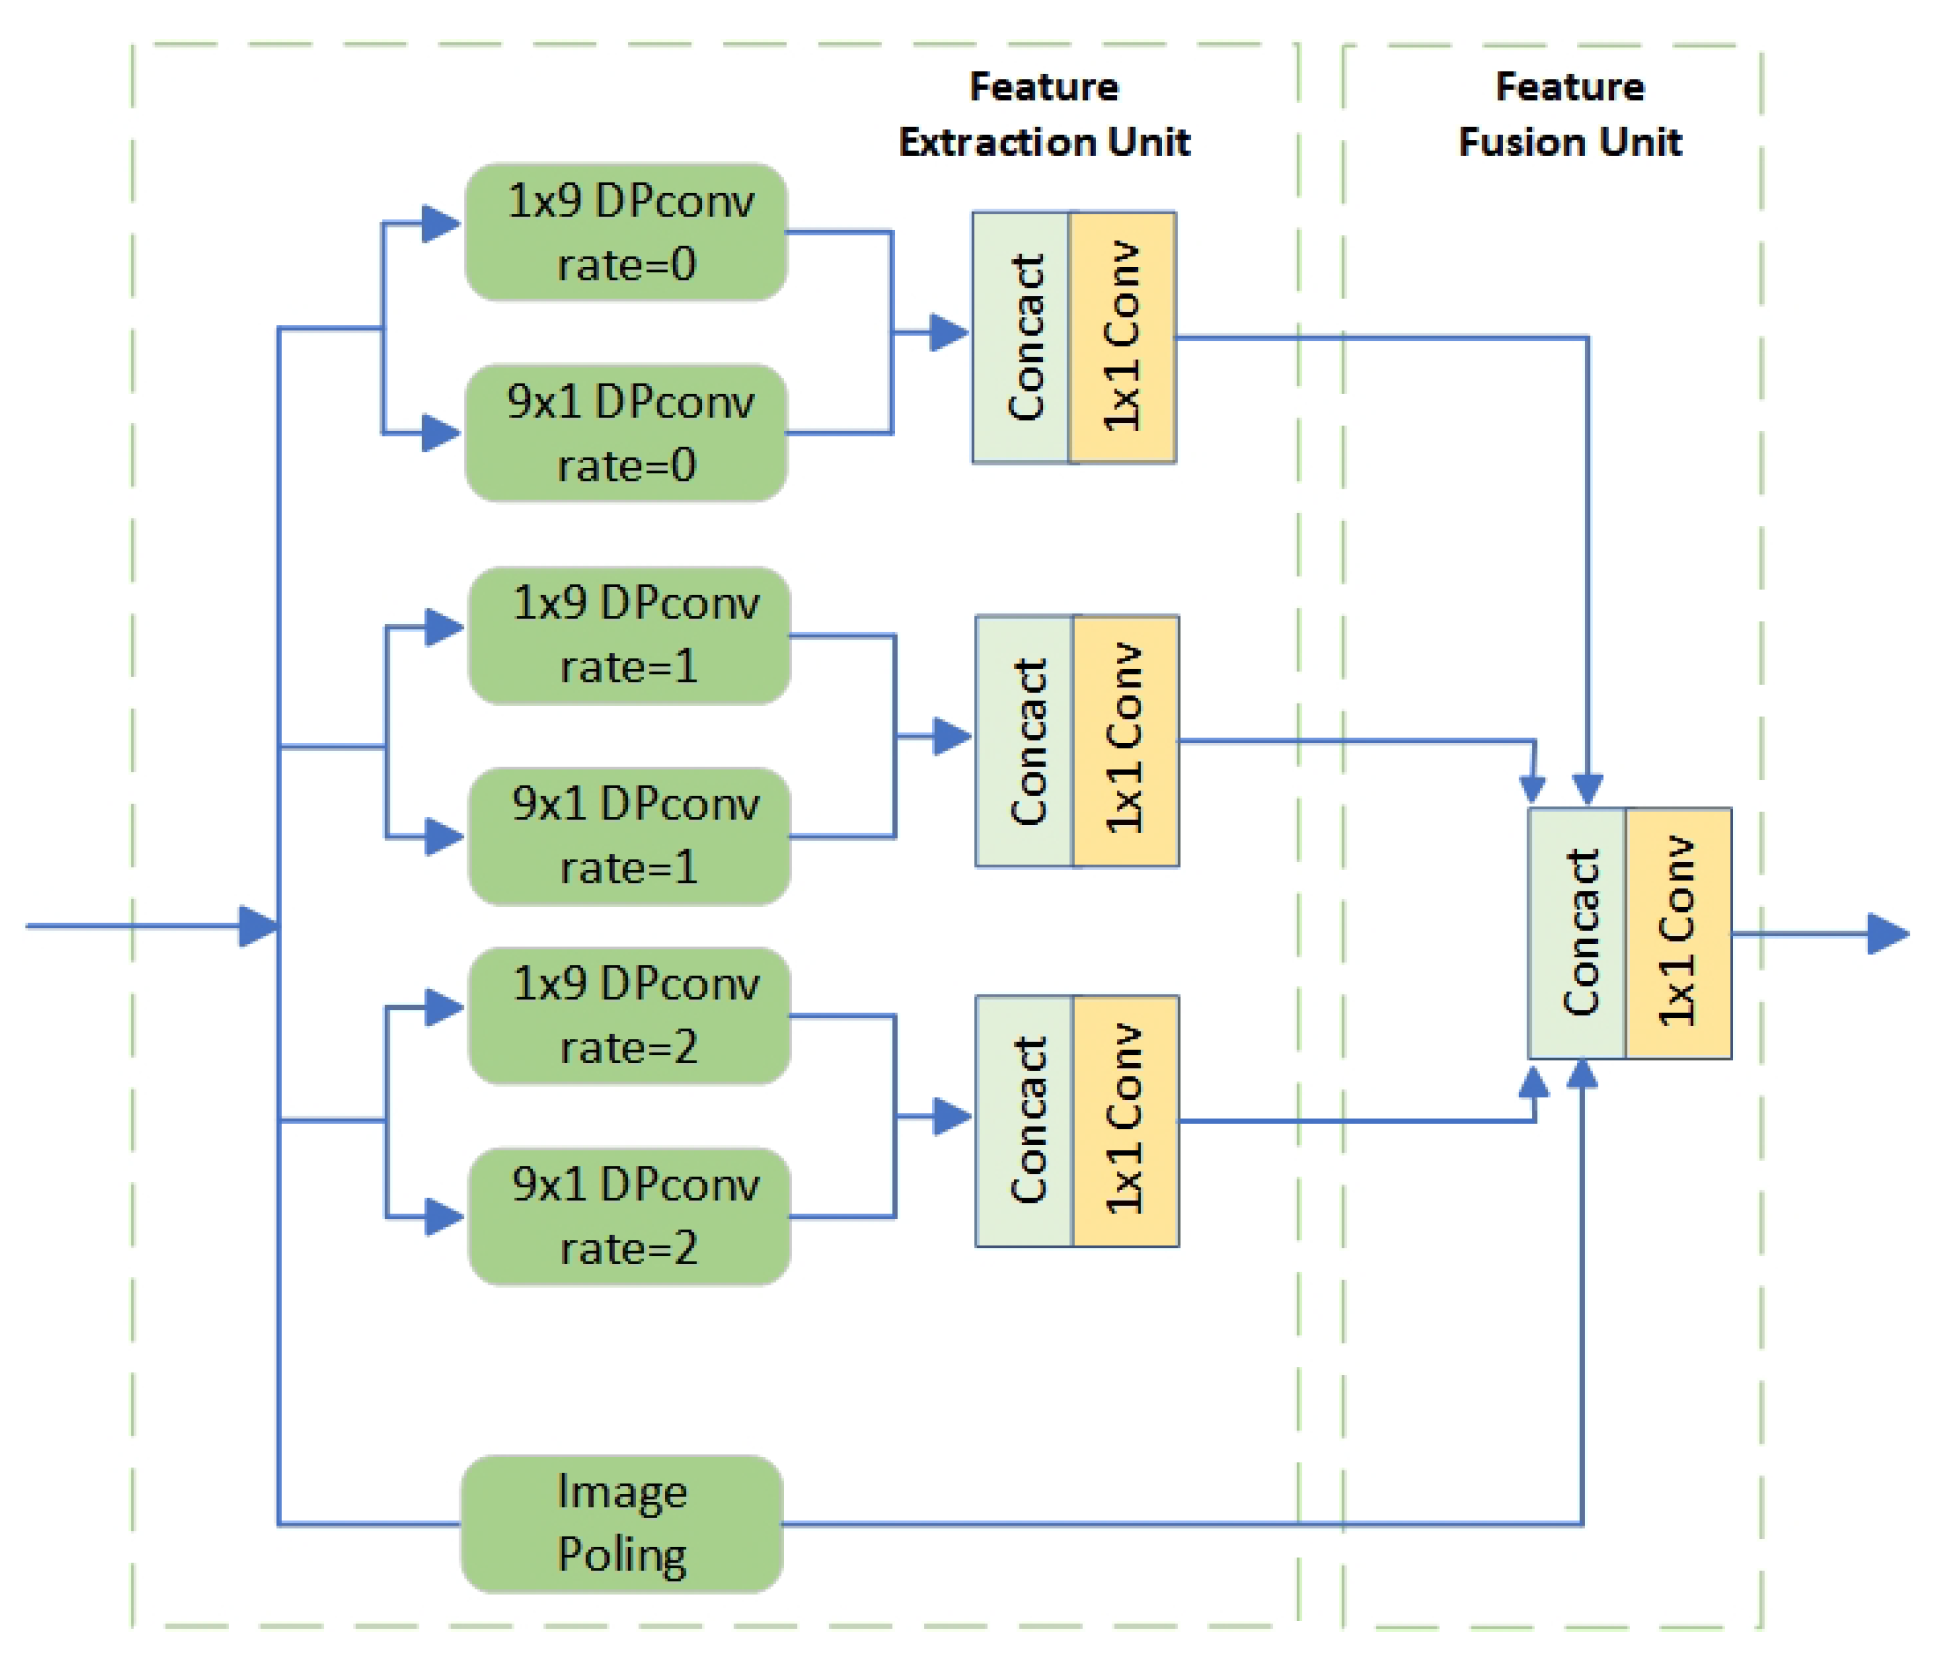
Figure 8.
VIT framework.
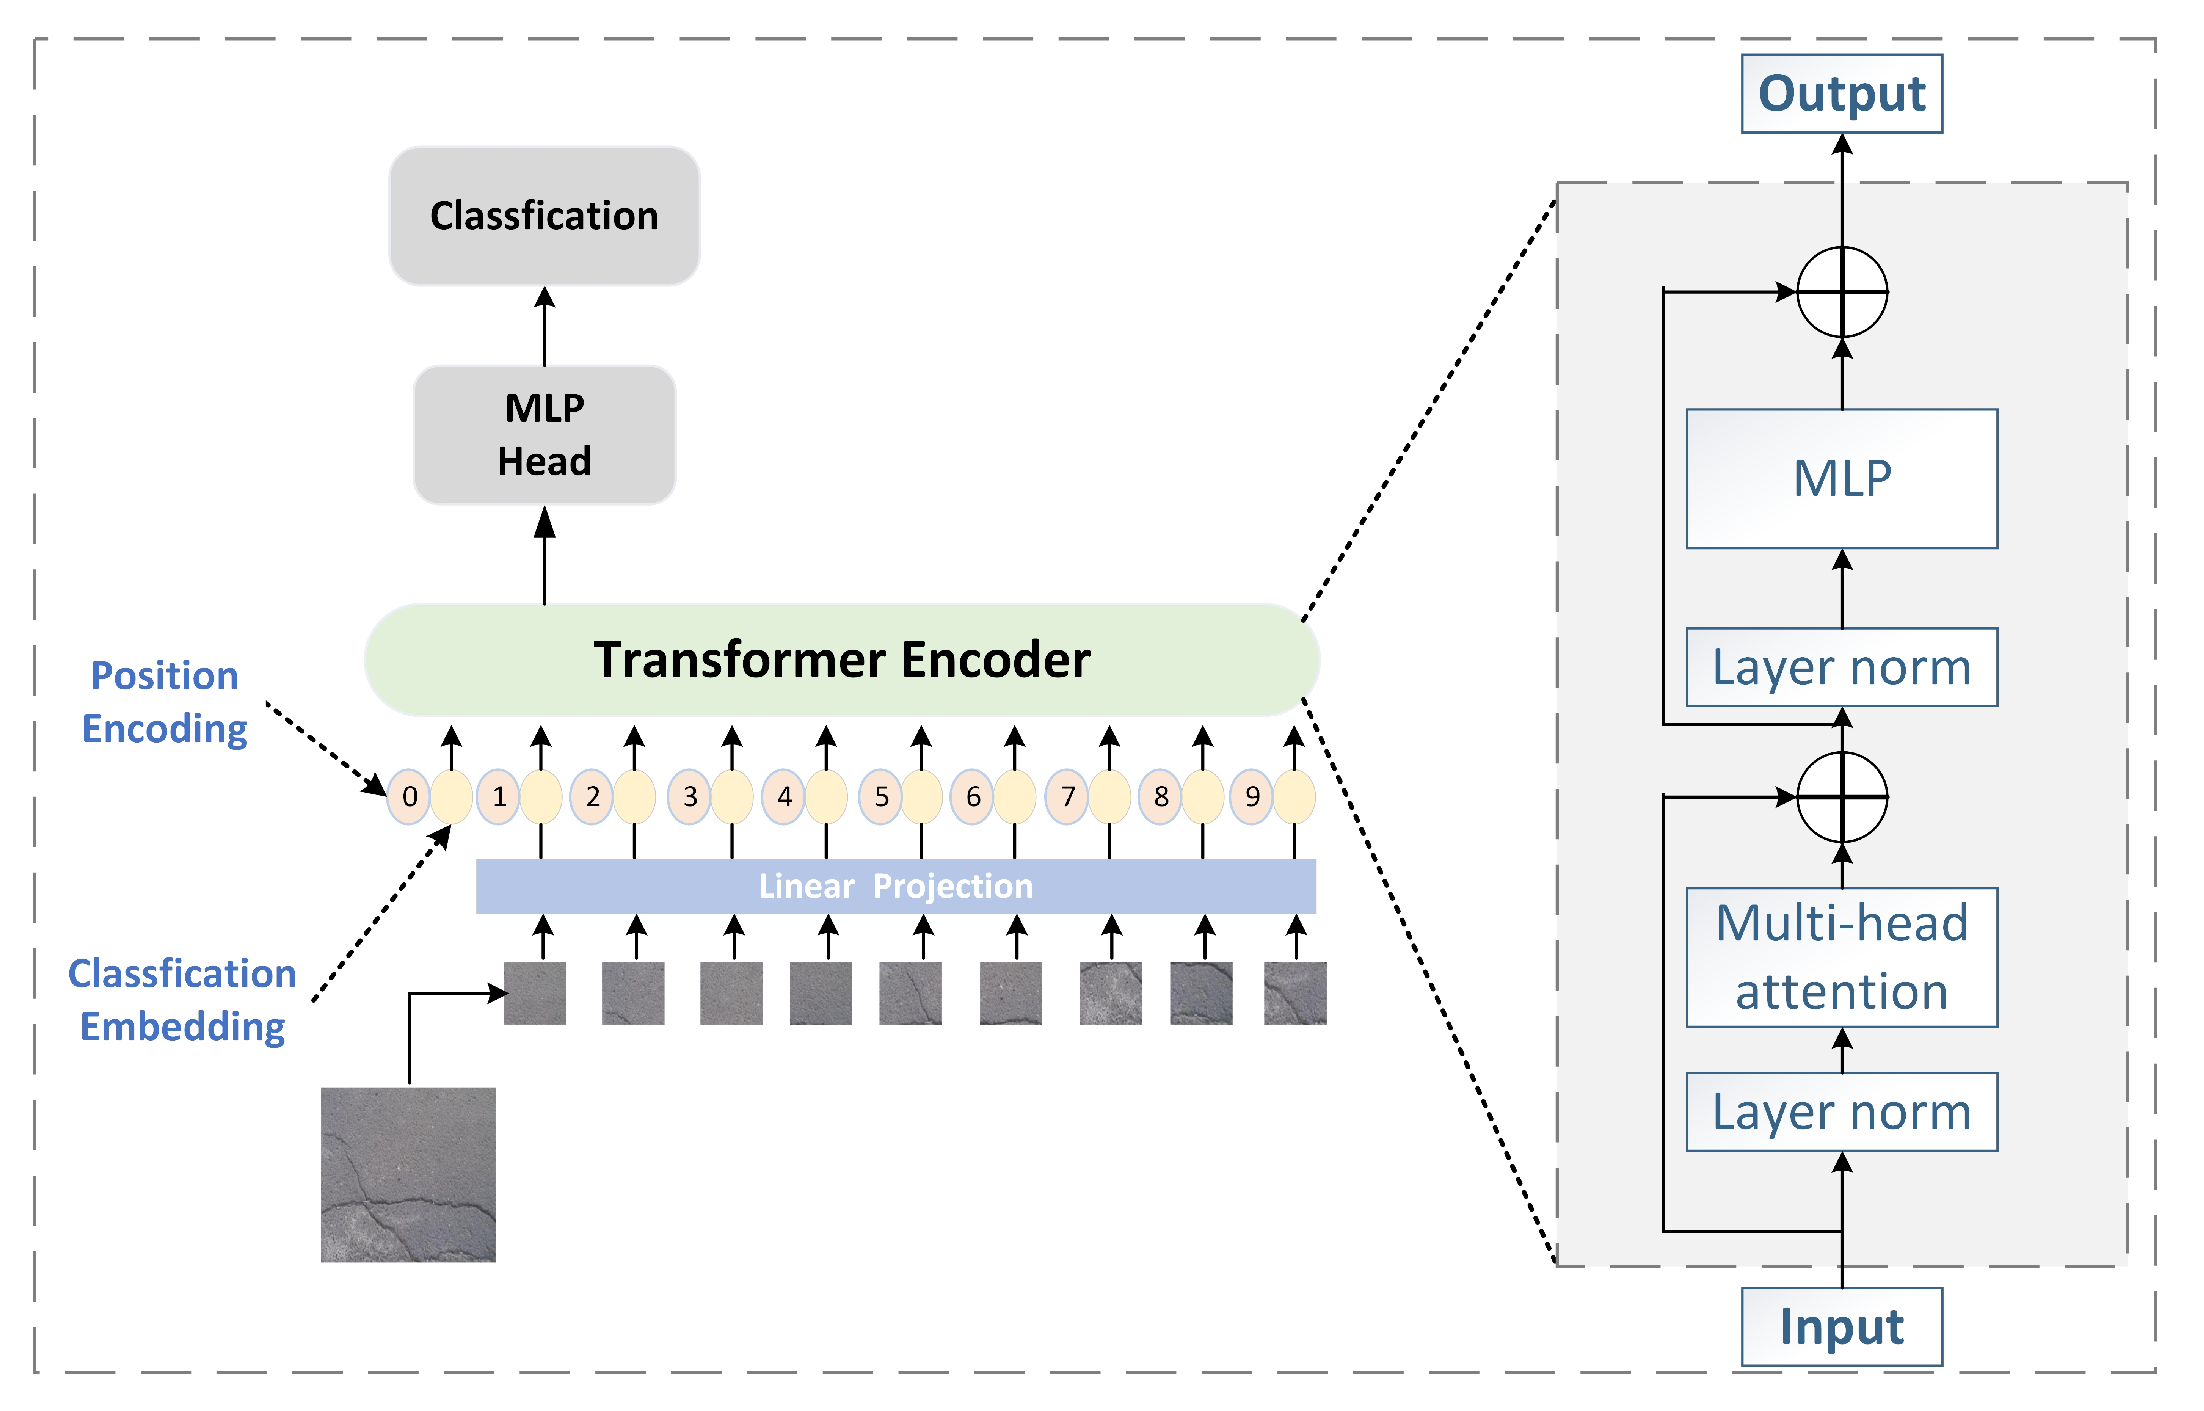
Figure 9.
MFF framework.
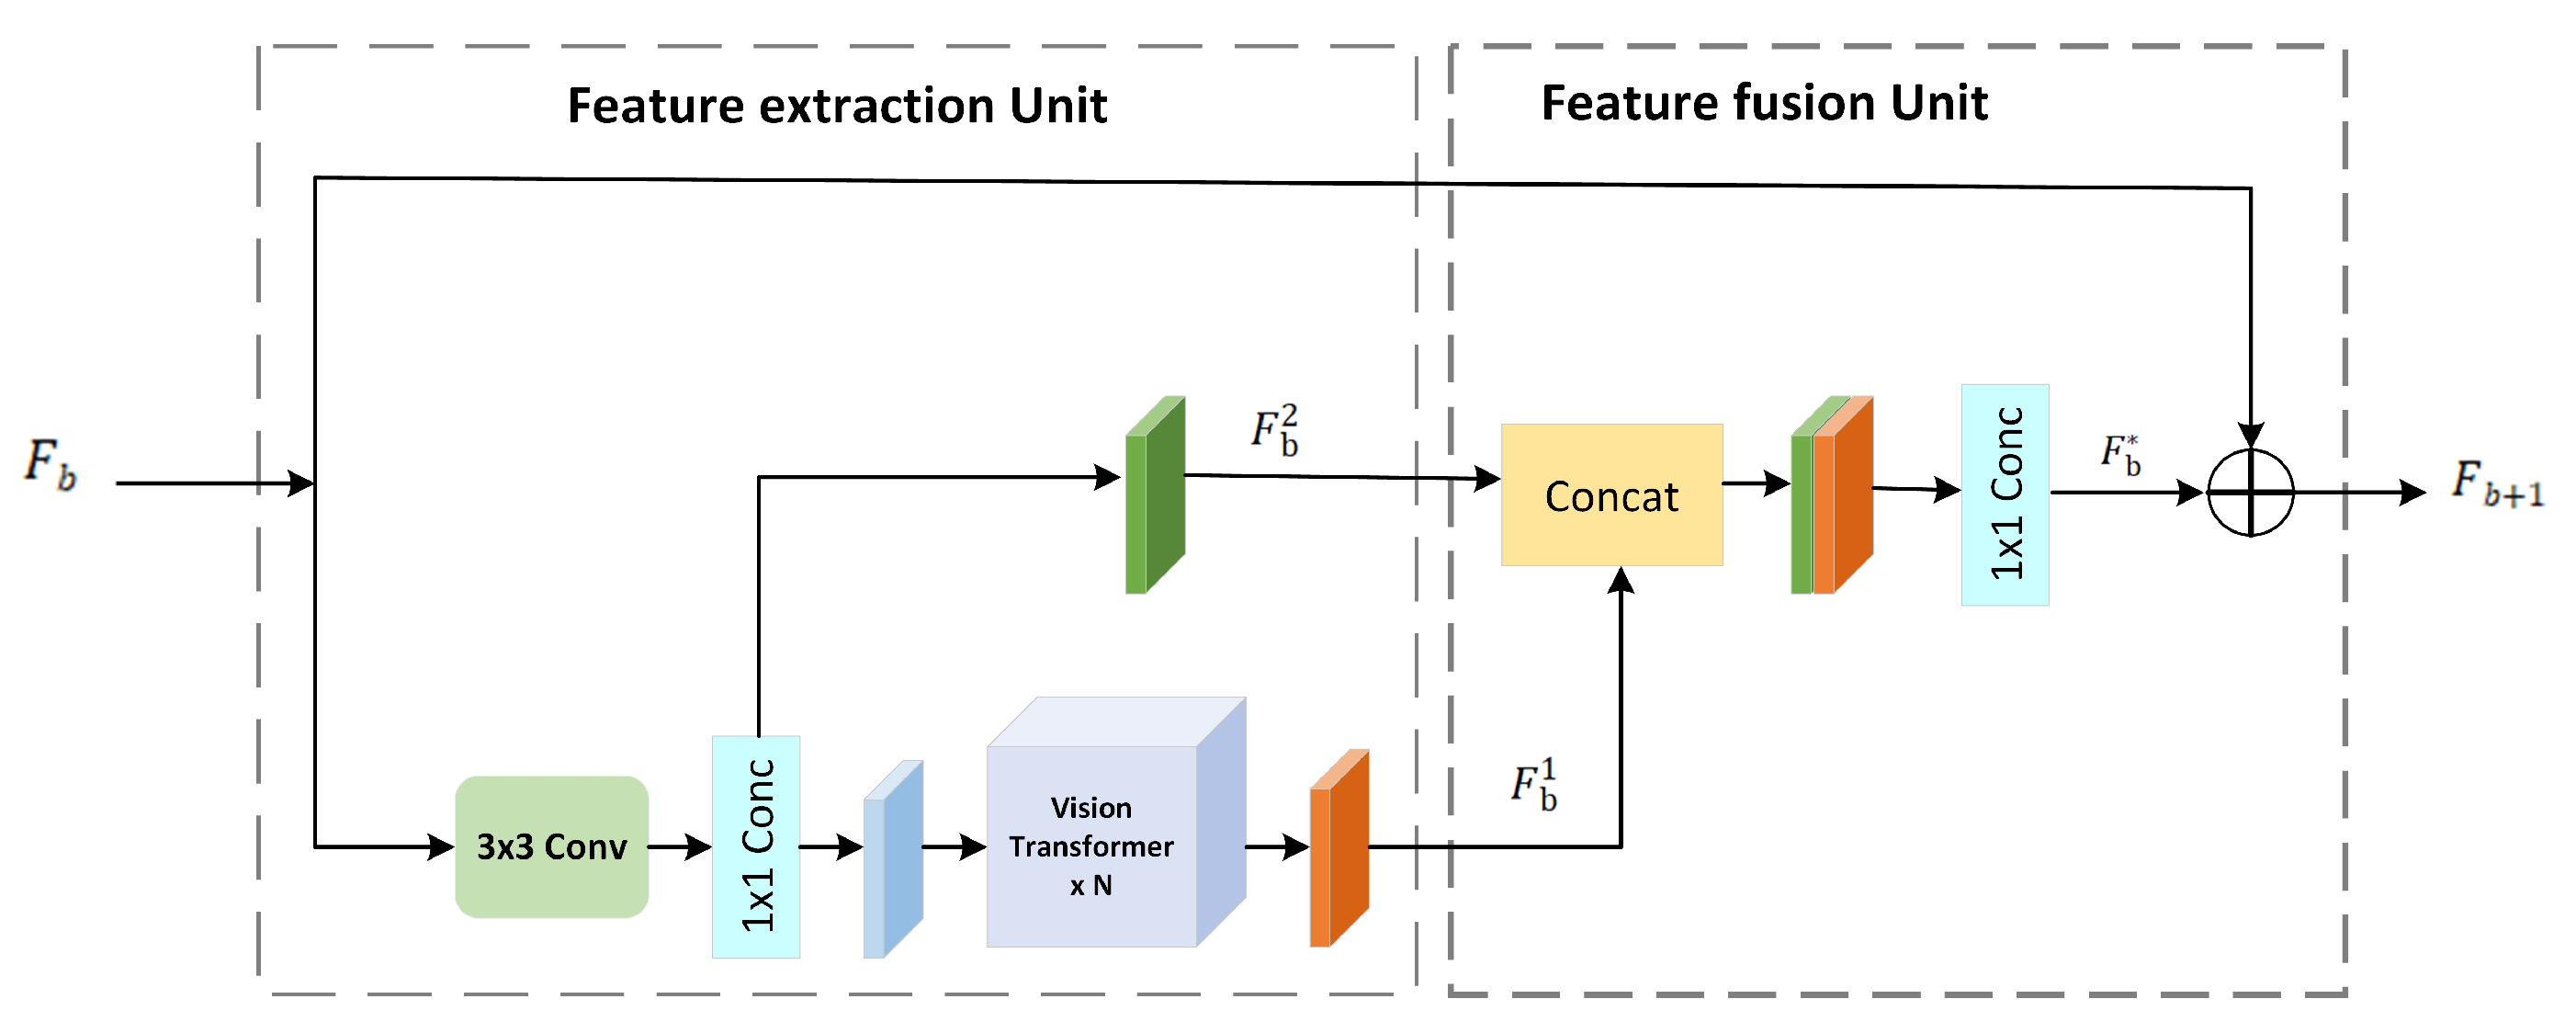
Figure 10.
Striped attention gate.
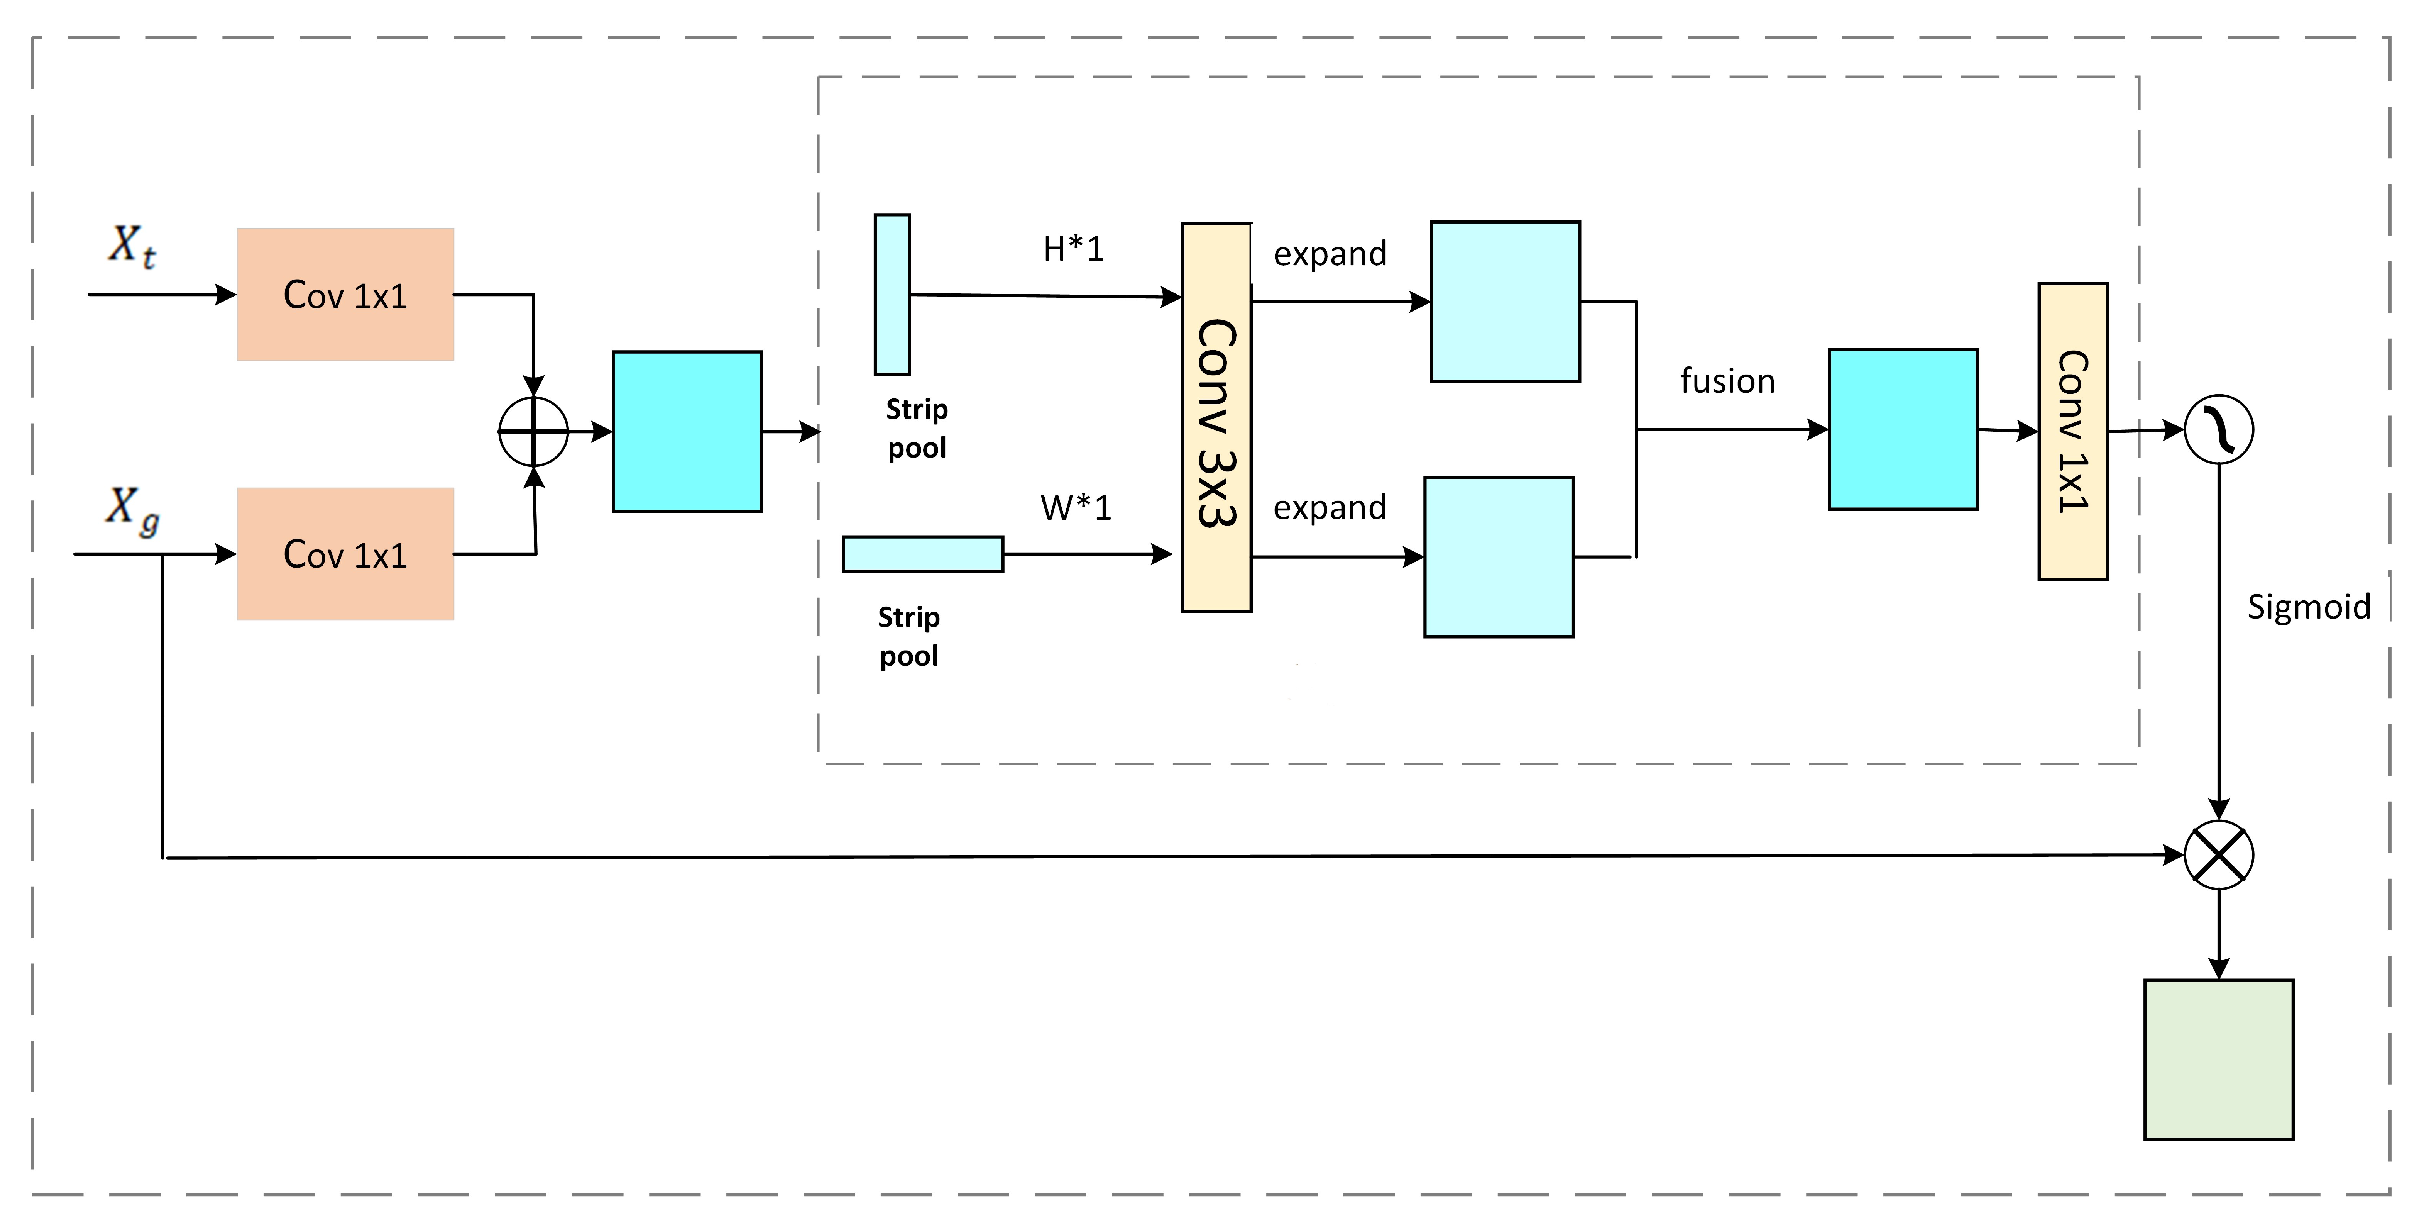
Figure 11.
Crack annotation.
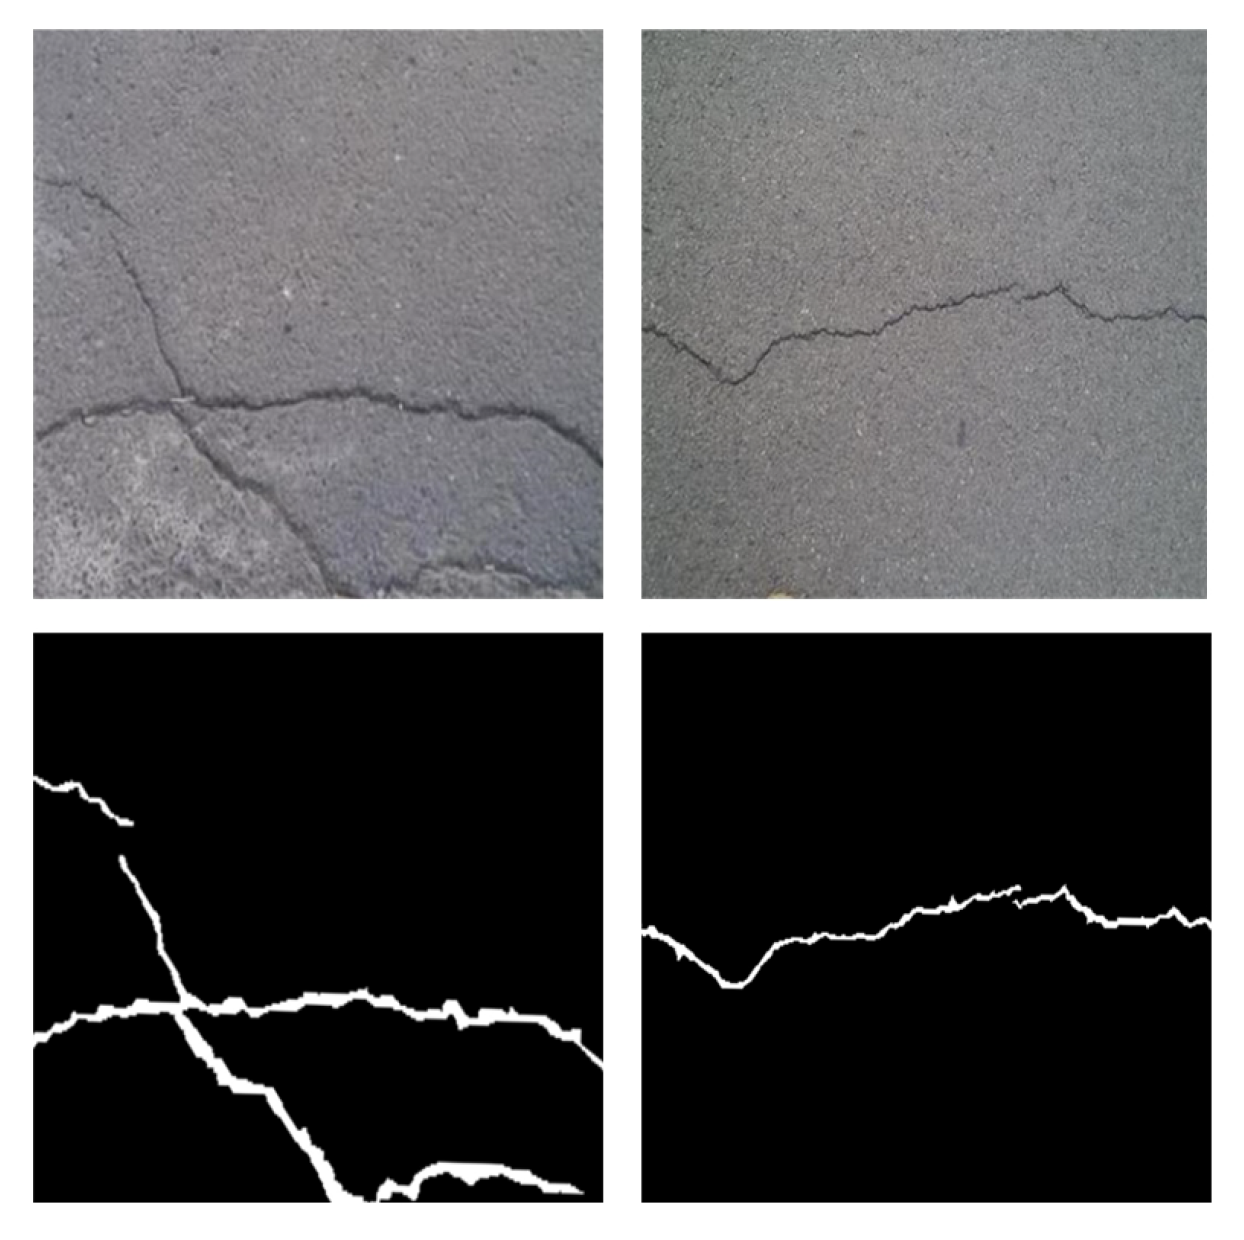
Figure 12.
MIoU growth of different methods.
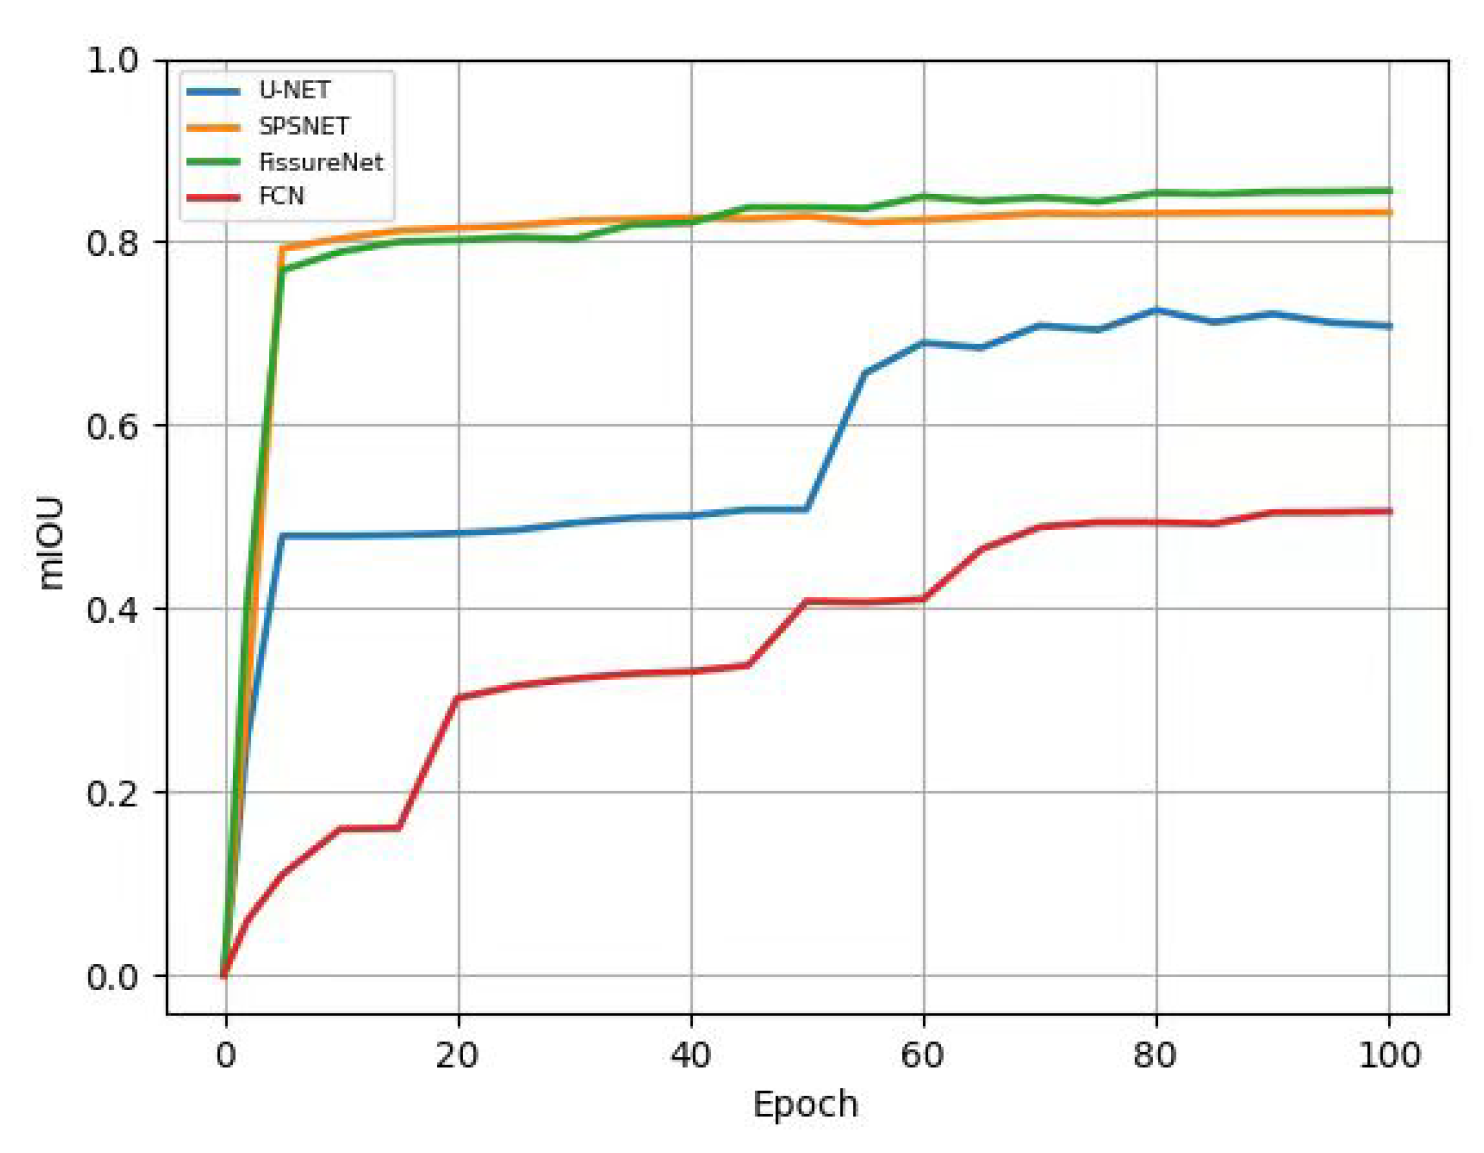
Figure 13.
Loss curves of different semantic segmentation algorithms.
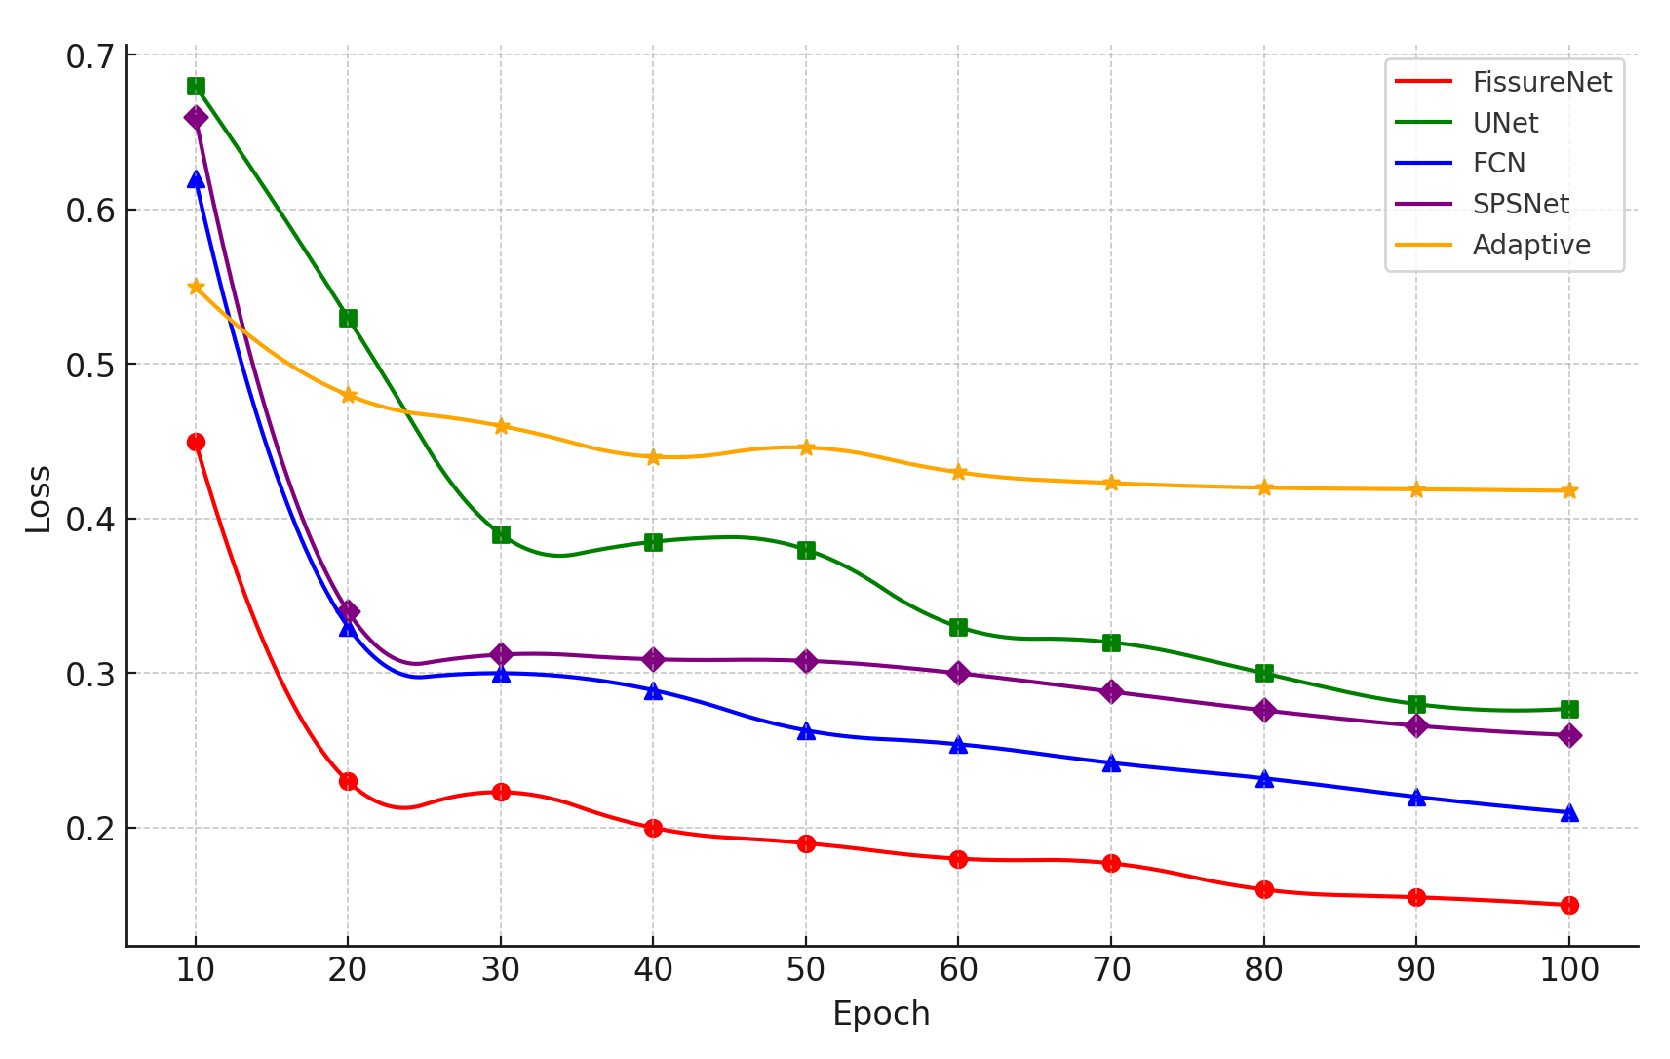
Figure 14.
Algorithm performance radar chart.
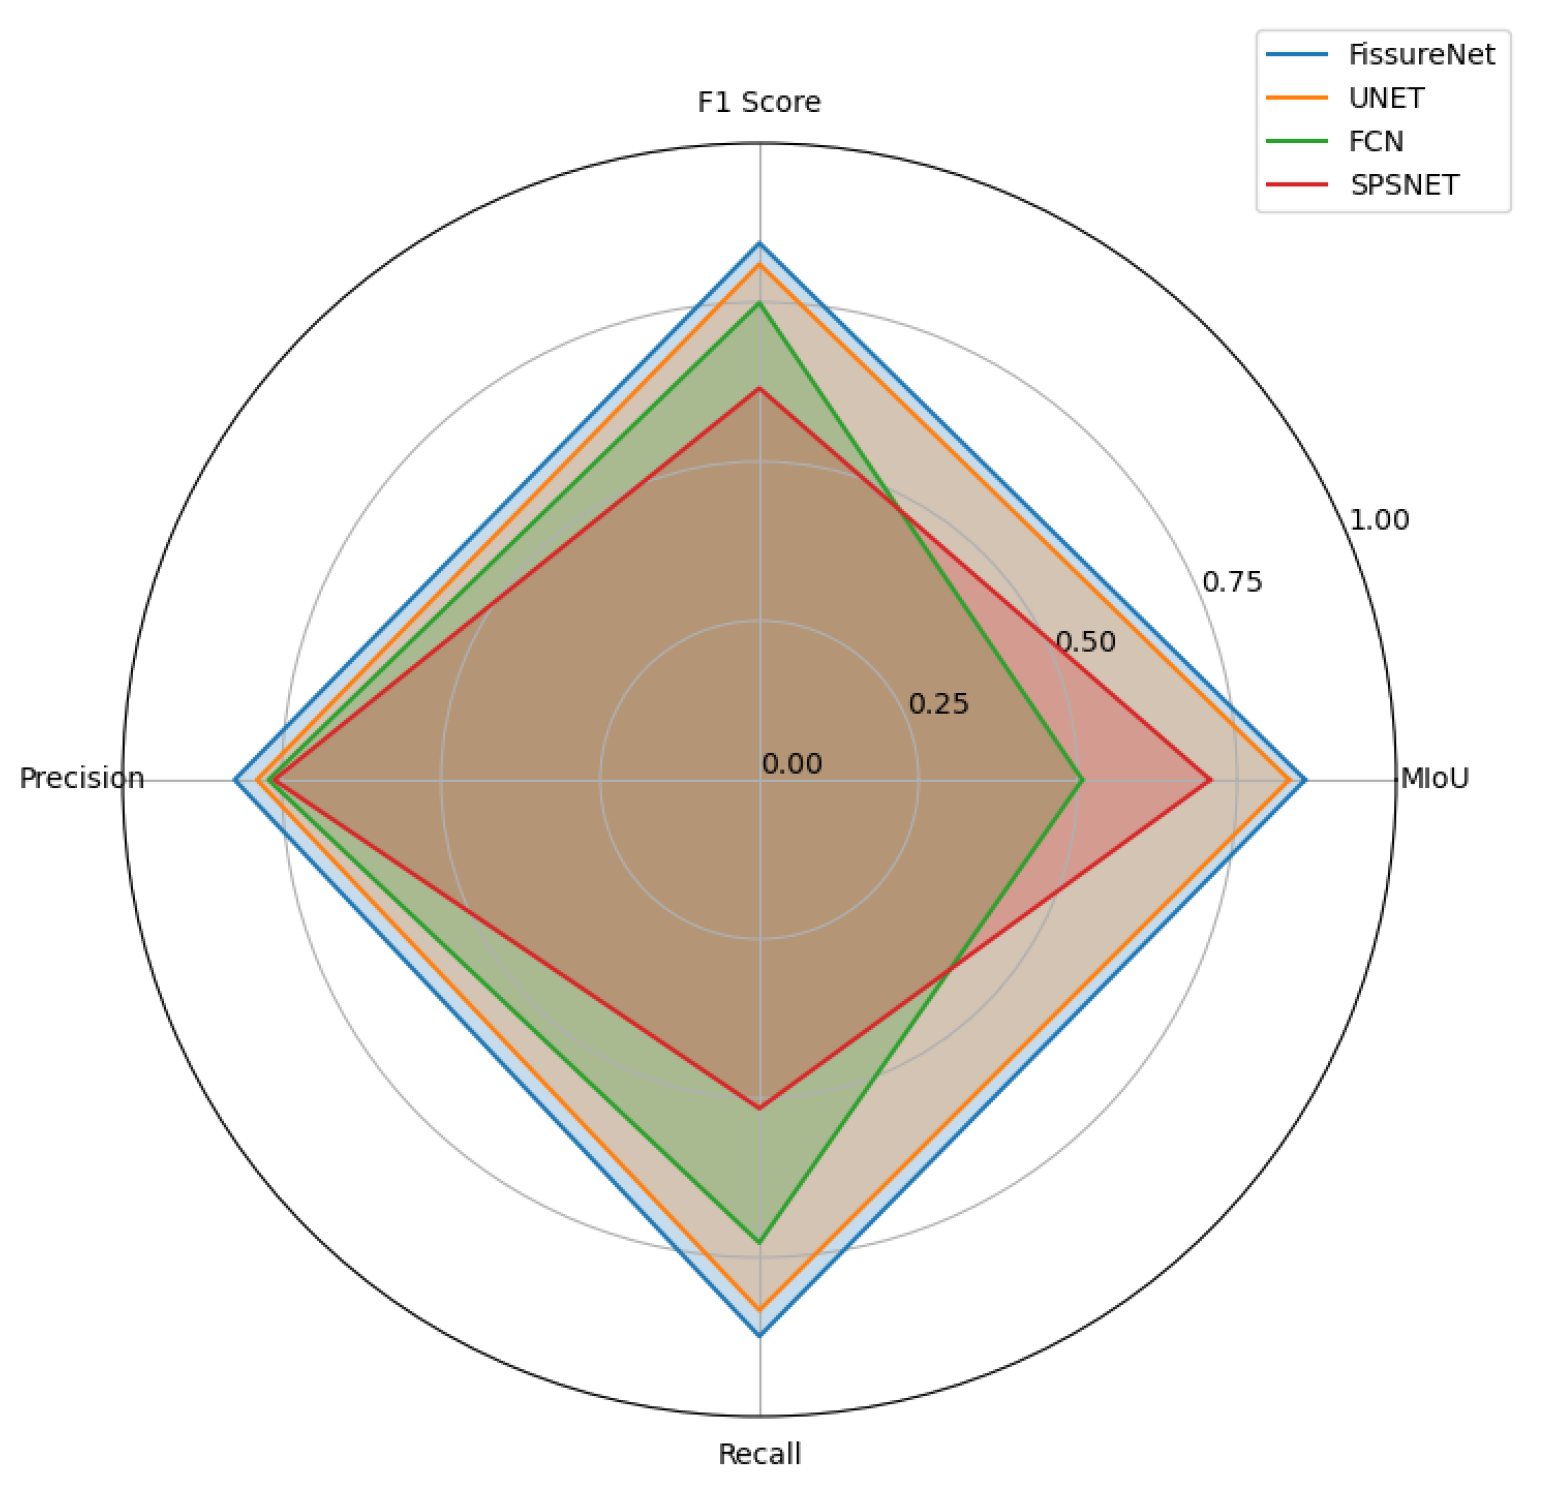
Figure 15.
Results of different methods in the test dataset.
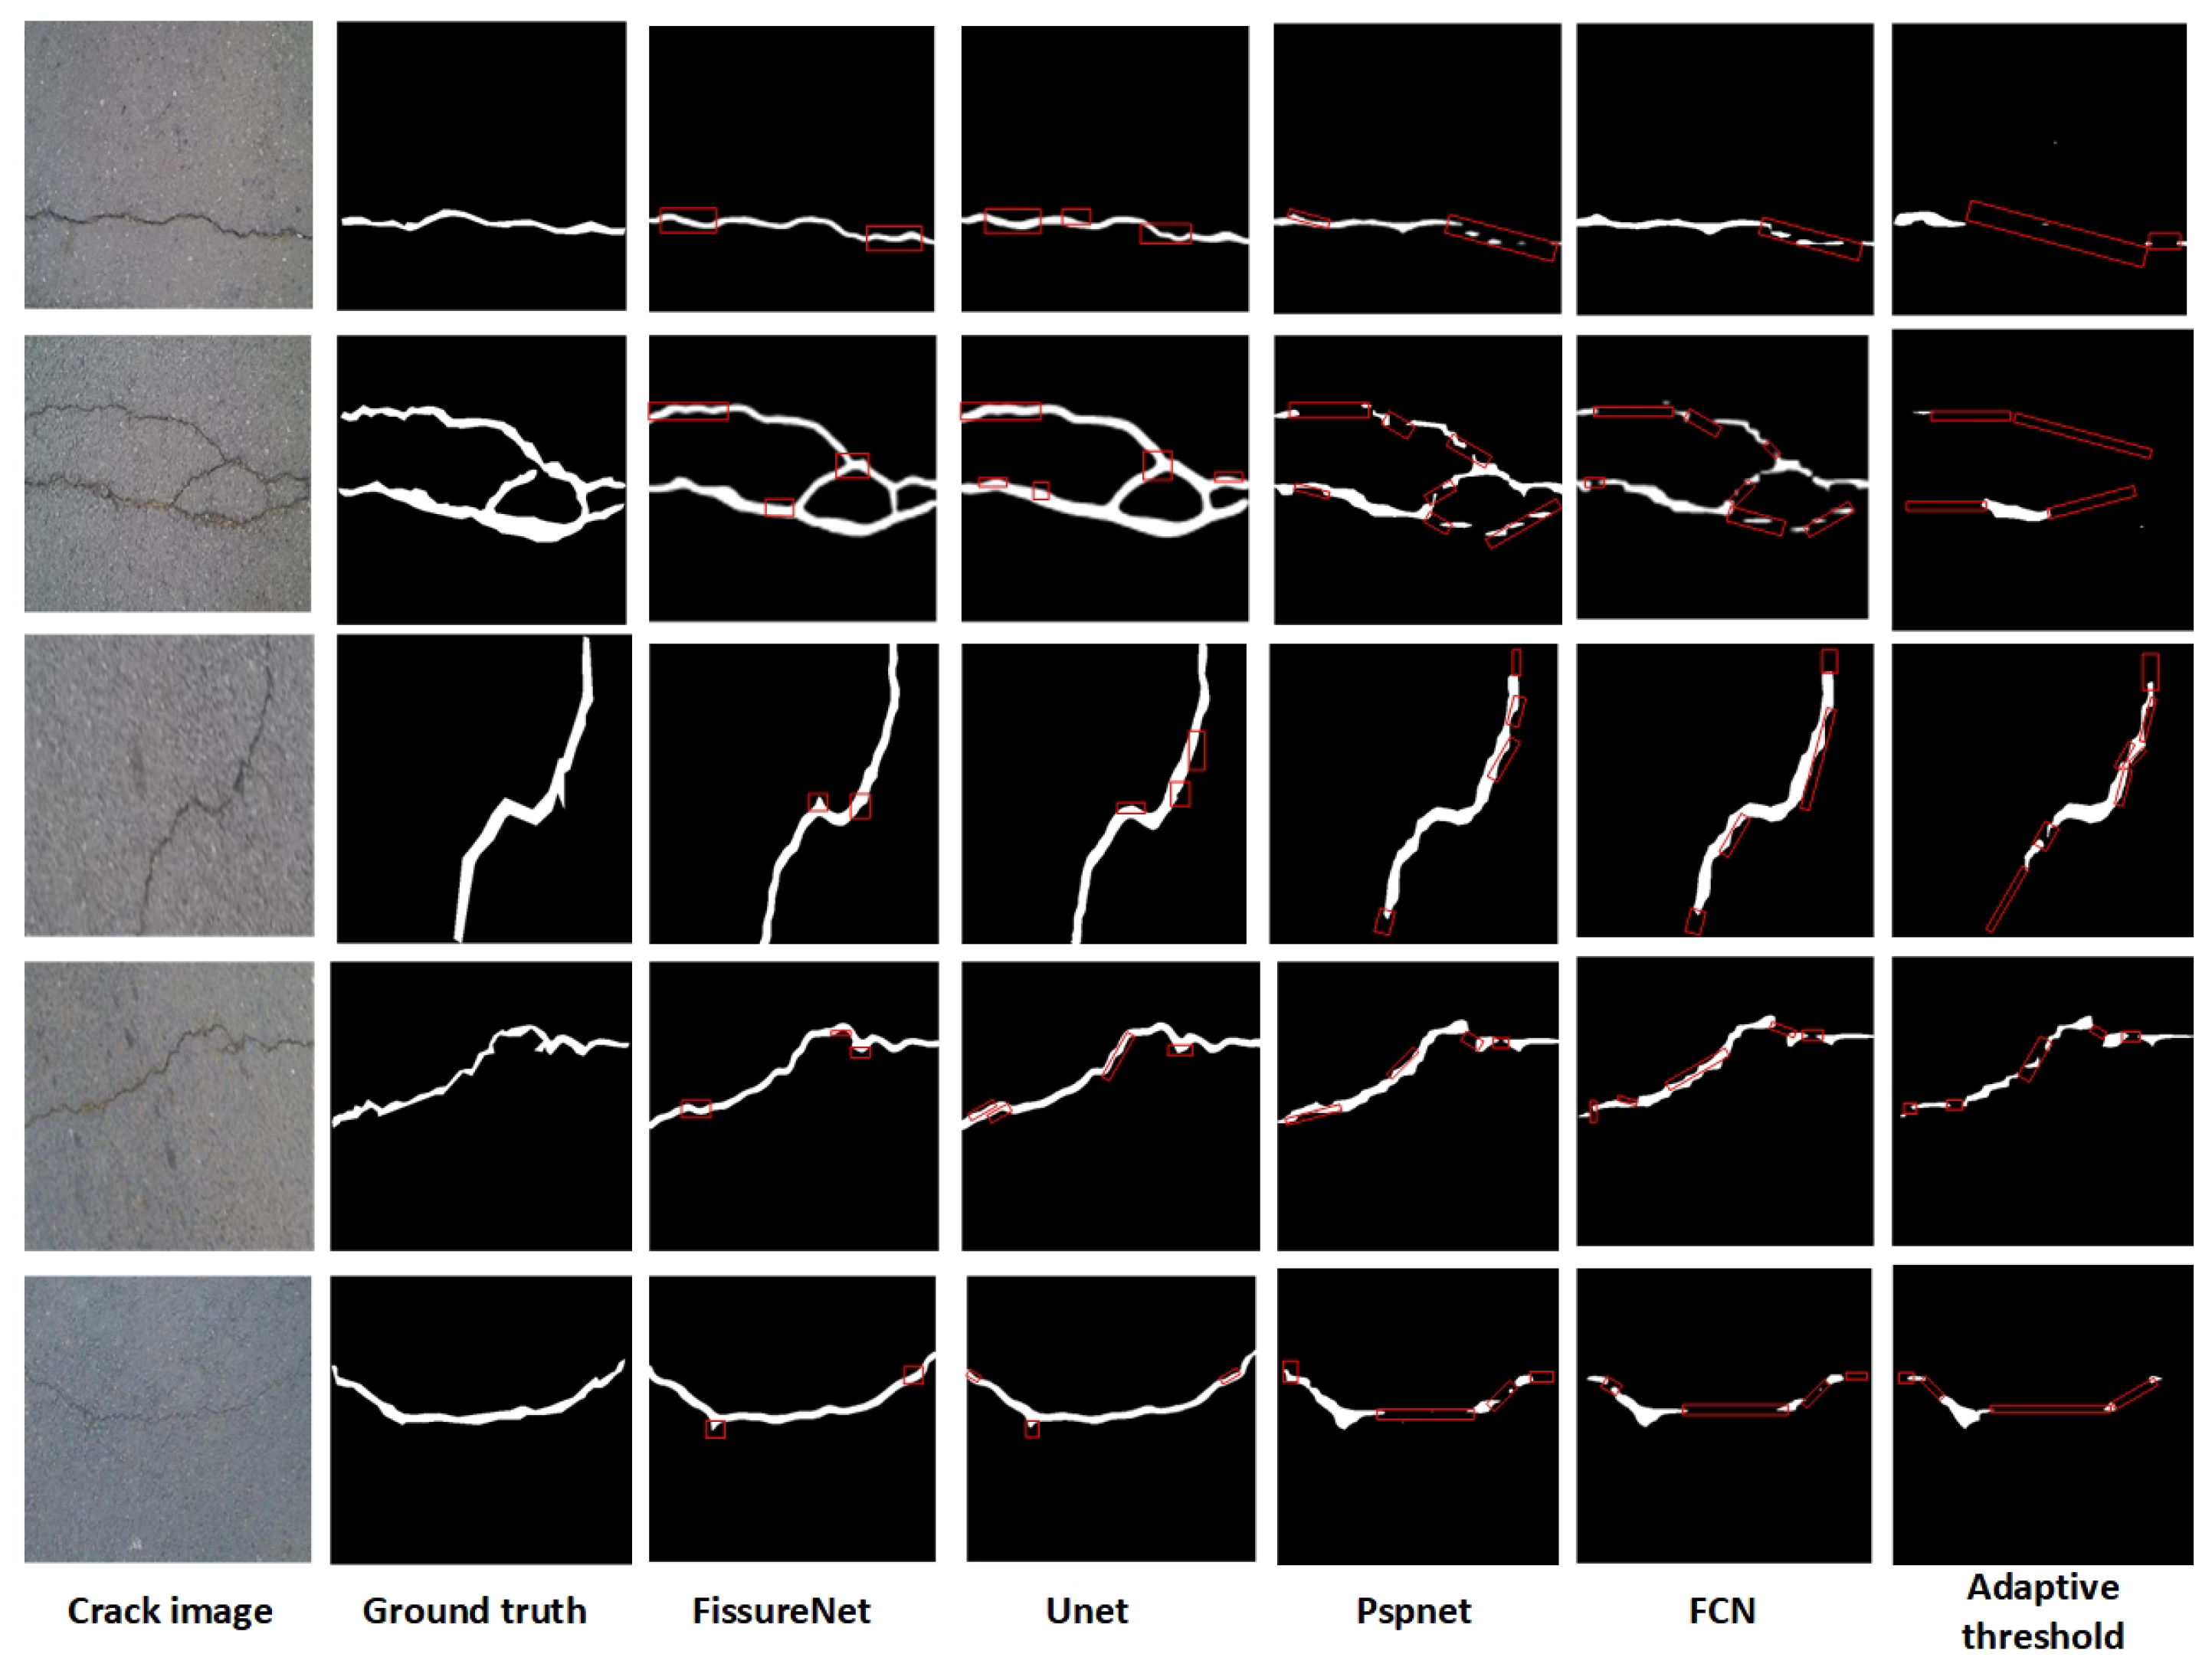

Table 1.
Backbone Network Configuration.
| Input Size | Layer Type | |
|---|---|---|
| 3×512×512 | Conv2d-BN-ReLU6 | - |
| 32×256×256 | Inverted-Residual | 1 |
| 16×256×256 | Inverted-Residual | 6 |
| 24×128×128 | Inverted-Residual | 6 |
| 32×64×64 | Inverted-Residual | 6 |
| 64×32×32 | Inverted-Residual | 6 |
| 96×32×32 | Inverted-Residual | 6 |
| 160×16×16 | Inverted-Residual | 6 |
| 320×16×16 | Conv2d-BN | - |
Table 2.
Experimental Environment Configuration.
| Type | Statement |
|---|---|
| Operating System | Windows 10 |
| RAM | 32G |
| CPU | Intel I5-13490F |
| GPU | NVIDIA GeForce RTX 4060 Ti |
| CUDA version | 11.8 |
| Pytorch version | 2.0.1 |
| Python version | 3.8.0 |
Table 3.
Results of Ablation Experiment Data.
| Metrics | |||||
|---|---|---|---|---|---|
| Algorithms | MIoU | Recall | Precision | F1 | Parameters |
| DL | 0.818 | 0.772 | 0.813 | 0.792 | 50.71M |
| DL+MV | 0.840 | 0.817 | 0.82 | 0.821 | 5.81M |
| DL+MV+DSCP | 0.832 | 0.831 | 0.789 | 0.831 | 8.99M |
| DL+MV+DSCP+MFF | 0.843 | 0.824 | 0.825 | 0.824 | 32.12M |
| DL+MV+DSCP+MFF+AG | 0.857 | 0.874 | 0.824 | 0.843 | 32.23M |
Table 4.
Comparison of metrics for different algorithms.
| Algorithms | MIoU | F1 | Precision | Recall | Parameters |
|---|---|---|---|---|---|
| FissureNet | 0.857 | 0.843 | 0.824 | 0.874 | 30.23M |
| UNET | 0.832 | 0.810 | 0.789 | 0.833 | 24.89M |
| FCN | 0.507 | 0.749 | 0.771 | 0.727 | 134.26M |
| SPSNET | 0.708 | 0.615 | 0.762 | 0.516 | 2.38M |
| Adaptive | 0.187 | 0.326 | 0.657 | 0.216 | 0.5M |
Disclaimer/Publisher’s Note: The statements, opinions and data contained in all publications are solely those of the individual author(s) and contributor(s) and not of MDPI and/or the editor(s). MDPI and/or the editor(s) disclaim responsibility for any injury to people or property resulting from any ideas, methods, instructions or products referred to in the content. |
© 2025 by the authors. Licensee MDPI, Basel, Switzerland. This article is an open access article distributed under the terms and conditions of the Creative Commons Attribution (CC BY) license (http://creativecommons.org/licenses/by/4.0/).
Copyright: This open access article is published under a Creative Commons CC BY 4.0 license, which permit the free download, distribution, and reuse, provided that the author and preprint are cited in any reuse.


