Preprint
Article

This version is not peer-reviewed.

Tectono-Stratigraphic Framework and Hydrocarbon Potential in the Albert Rift, Uganda: Insights from Basin and Petroleum System Modeling

A peer-reviewed article of this preprint also exists.

Submitted:

30 December 2024

Posted:

31 December 2024

You are already at the latest version

Abstract

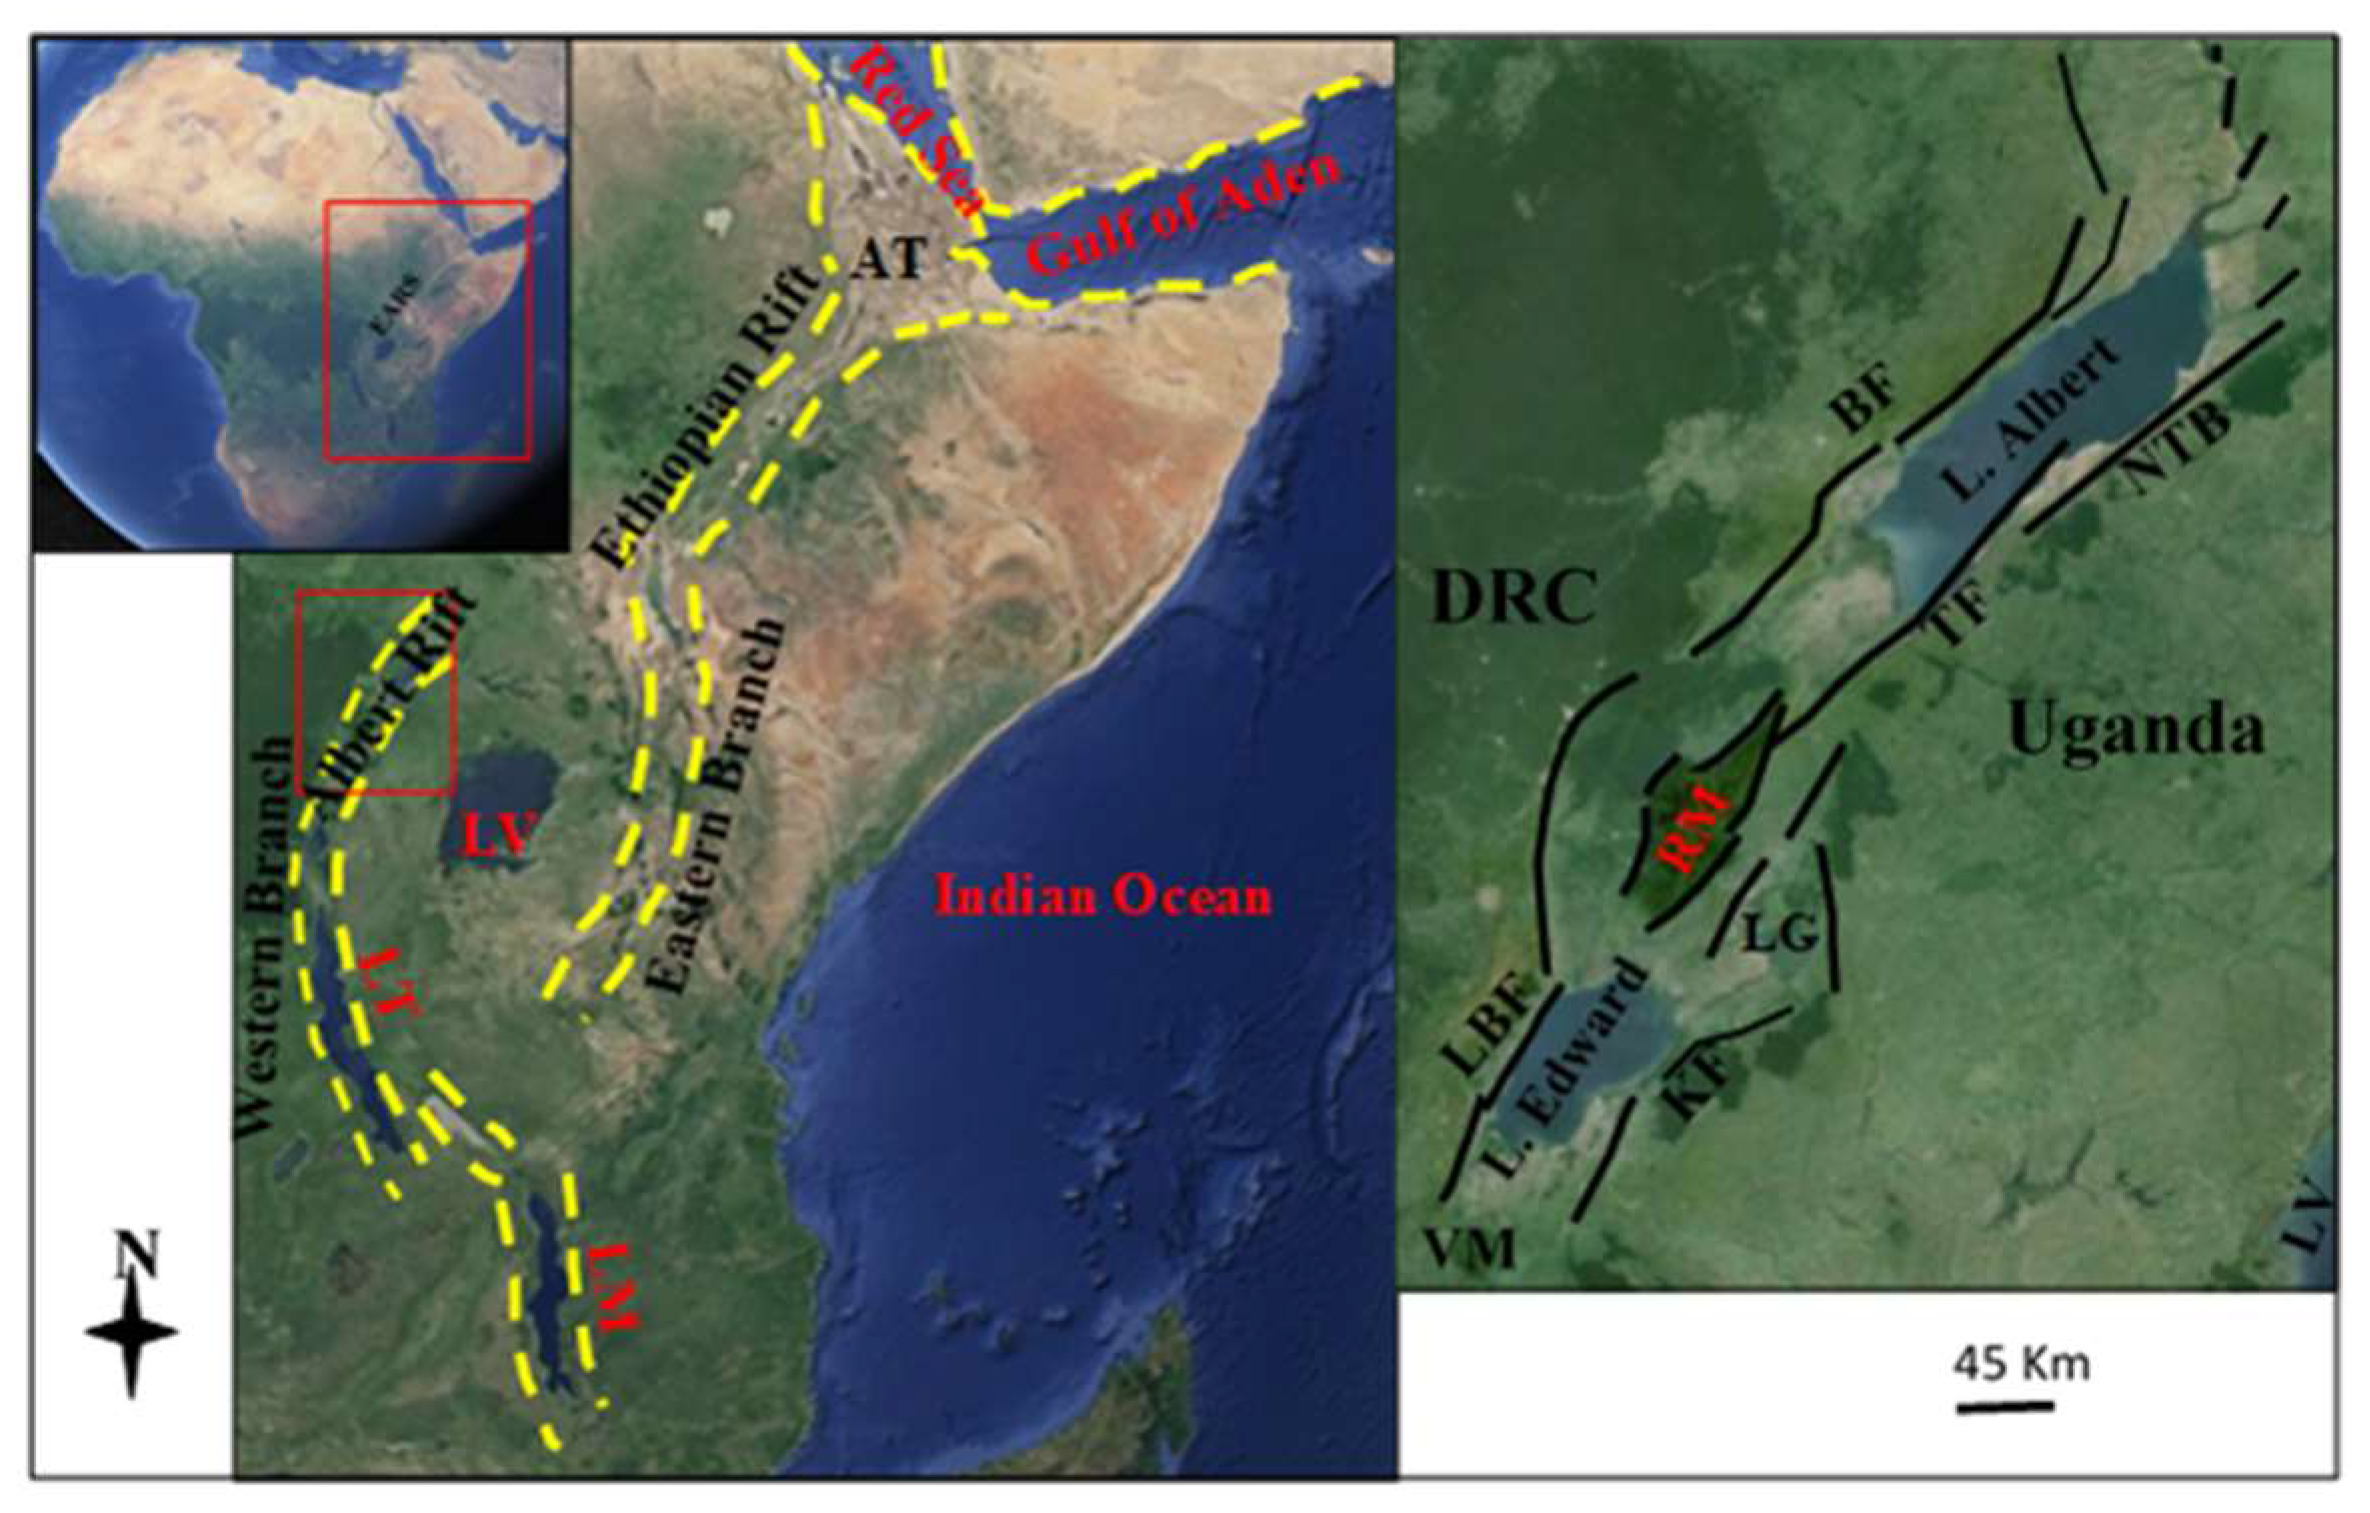
The Albert Rift in Uganda is a significant geological and petroleum exploration frontier within the East African Rift System. The basin has been comprehensively analyzed via thorough literature survey, seismic data analysis, well log interpretations, and basin and petroleum systems modeling to examine the complex interactions of tectonics, sedimentation, and hydrocarbon generation and expulsion within the rift basin. Our findings reveal a detailed tectonostratigraphic framework with multiple Neogene to Quaternary depositional sequences and structural features influencing hydrocarbon maturation, generation and expulsion. Key stratigraphic units are identified, highlighting their contributions to a viable petroleum system present within the rift basin. The Albert Rift is a Neogene petroleum system that is currently generating and expelling hydrocarbons to various potential traps. The study underscores the impact of rift-related tectonics on the basin architecture, source-reservoir-seal rock distribution within a young rift basin. Our research enhances new understanding of the Albert Rift's geological history and petroleum systems, offering valuable insights for future petroleum exploration strategies. By integrating tectonostratigraphic and petroleum system analysis, we provide a robust model applicable to similar rift basins worldwide.

Keywords: 
;  ;  ;  

1. Introduction

The Albert Rift represents the northernmost extension of the western branch of the East African Rift System (EARS) [1]. Extending approximately 570 km in length and 45 km in width, it spans from South Sudan in the north to Rwanda in the south, straddling the border between Uganda and the Democratic Republic of Congo (Figure 1 & Figure 2). This rift comprises half-grabens and grabens with varying symmetry and orientations, interspersed with accommodation zones and a prominently elevated basement horst at its center. Unlike the eastern branch of EARS, the Albert Rift has experienced comparatively less magmatism. This distinctive geological setting, coupled with the presence of the towering Mt. Rwenzori horst within the rift valley, has drawn significant scientific interest aimed at elucidating continental rifting mechanics.
The Albert Rift harbors three major lakes—Albert, Edward, and George—which are part of the chain of rift valley lakes in the western branch [3,4,5,6,7]. These lakes have accumulated organically rich sediments due to high biological productivity and bottom water anoxia [4,8,9]. Fluctuations in paleolake levels, driven by the interplay of tectonics and climate, have created conditions conducive to petroleum accumulation, as evidenced by discoveries in western Uganda [9,10,11]. This fluvial-lacustrine filled rift has emerged as a critical area for studying the geological evolution of a petroleum system in a young rift basin setting, offering a contemporary analogue for understanding the maturation processes of lacustrine organic-rich source rocks in ancient rift lake basins [12,13]. Despite decades of intensive investigation into the Albert Rift and the broader EARS, a comprehensive understanding of its geological development and petroleum systems remains elusive [14,15,16,17]. Various research findings have yielded divergent perspectives on the mechanisms and timing of the rifting events [18,19,20,21], interactions between tectonics, climate and sedimentation styles [9,22], as well as paleogeography and stratigraphy e.g. [2,23,24,25]. Furthermore, while significant petroleum resources have been discovered through exploration efforts, uncertainties persist regarding the precise timing and nature of key elements within the petroleum system. Critical information regarding the nature of the source rocks essential for understanding hydrocarbon generation remains elusive. Current interpretations suggest potential sources within the Mid-Upper Miocene lacustrine intervals, particularly the Kasande Formation, yet analyses and correlations from drilled wells have not confirmed the effective source rock facies associated with already discovered oil and gas [17,26]. Consequently, assessments of the petroleum potential of this region remain speculative pending the identification of effective source rocks and a refined understanding of the petroleum system.
In this study, we synthesize existing literatures from a variety of sources, including published and unpublished works accessed through platforms such as Google Scholar, Science Hub, academic libraries, and government agencies. We also conducted a detailed stratigraphic refinement of one of the least studied regions, the Lake Edward and George area. This involved reviewing literature and well reports, analyzing seismic data and wireline logs, and integrating all the information to establish the subsurface stratigraphy of this area. Through this analysis, we developed a tentative Albertine tectono-stratigraphy by considering the four type-localities in terms of event ages underscoring the current pitfalls and contradictions from different sources. We also employed a Basin and Petroleum Systems Modeling (BPSM) approach in the Onshore South Lake Albert Basin, where the available data allowed for reasonable predictions of the petroleum system elements. Despite the lack of confirmation of the source rocks in this frontier rift basin, BPSM offers a powerful predictive tool to infer the petroleum generation, expulsion and accumulation histories [27]. Such predictions will serve as critical milestones in advancing our understanding of the petroleum geology of this region until more definitive data becomes available. Our objective for this study is to conduct a comprehensive analysis of existing geological data concerning the Albert Rift, focusing on its development and implications for petroleum occurrences. We aim to identify current knowledge gaps, address some of these gaps through empirical and modeling approaches, and propose future research directions. By integrating previous findings with new insights, our study seeks to advance our understanding of the rift's petroleum potential and contribute to strategic exploration and resource management in this region. Through comprehensive integration, we present a tectonostratigraphic framework and a petroleum system model for the Albert Rift, laying foundational groundwork for future refined models as our understanding evolves.

2. Materials and Methods

2.1. Developing a Tectonostratigraphic Framework

We conducted a comprehensive review of all available information, including both published and unpublished sources, with a particular focus on four basins/subbasins. For the Lake Edward-Lake George area, we carried out seismic data interpretation and well log analysis using Schlumberger Petrel 2018 software to identify and subdivide the entire section into categorical stratigraphic units based on their seismic and wireline responses. Mudlog data were used for the additional lithologic characteristics. The ages of identified units were extracted from palynological, molluscan and vertebrate data provided by the Government of Uganda. The ages of different units were integrated with the documented tectonic events [2,22,24,25].

2.2. Petroleum Potential Evaluation

As part of the petroleum potential evaluation, we conducted Basin and Petroleum Systems Modeling (BPSM) for the onshore Southern Lake Albert Sub basin, which hosts the region's oldest known sedimentary sequence. The evaluation commenced with a detailed stratigraphic analysis of this specific subbasin, providing the foundational framework for model input. This was followed by a geochemical assessment of potential source rocks, determination of boundary conditions, model simulations, and calibration. The modeling study utilized data from one drilled well and a pseudo well to achieve its objectives.

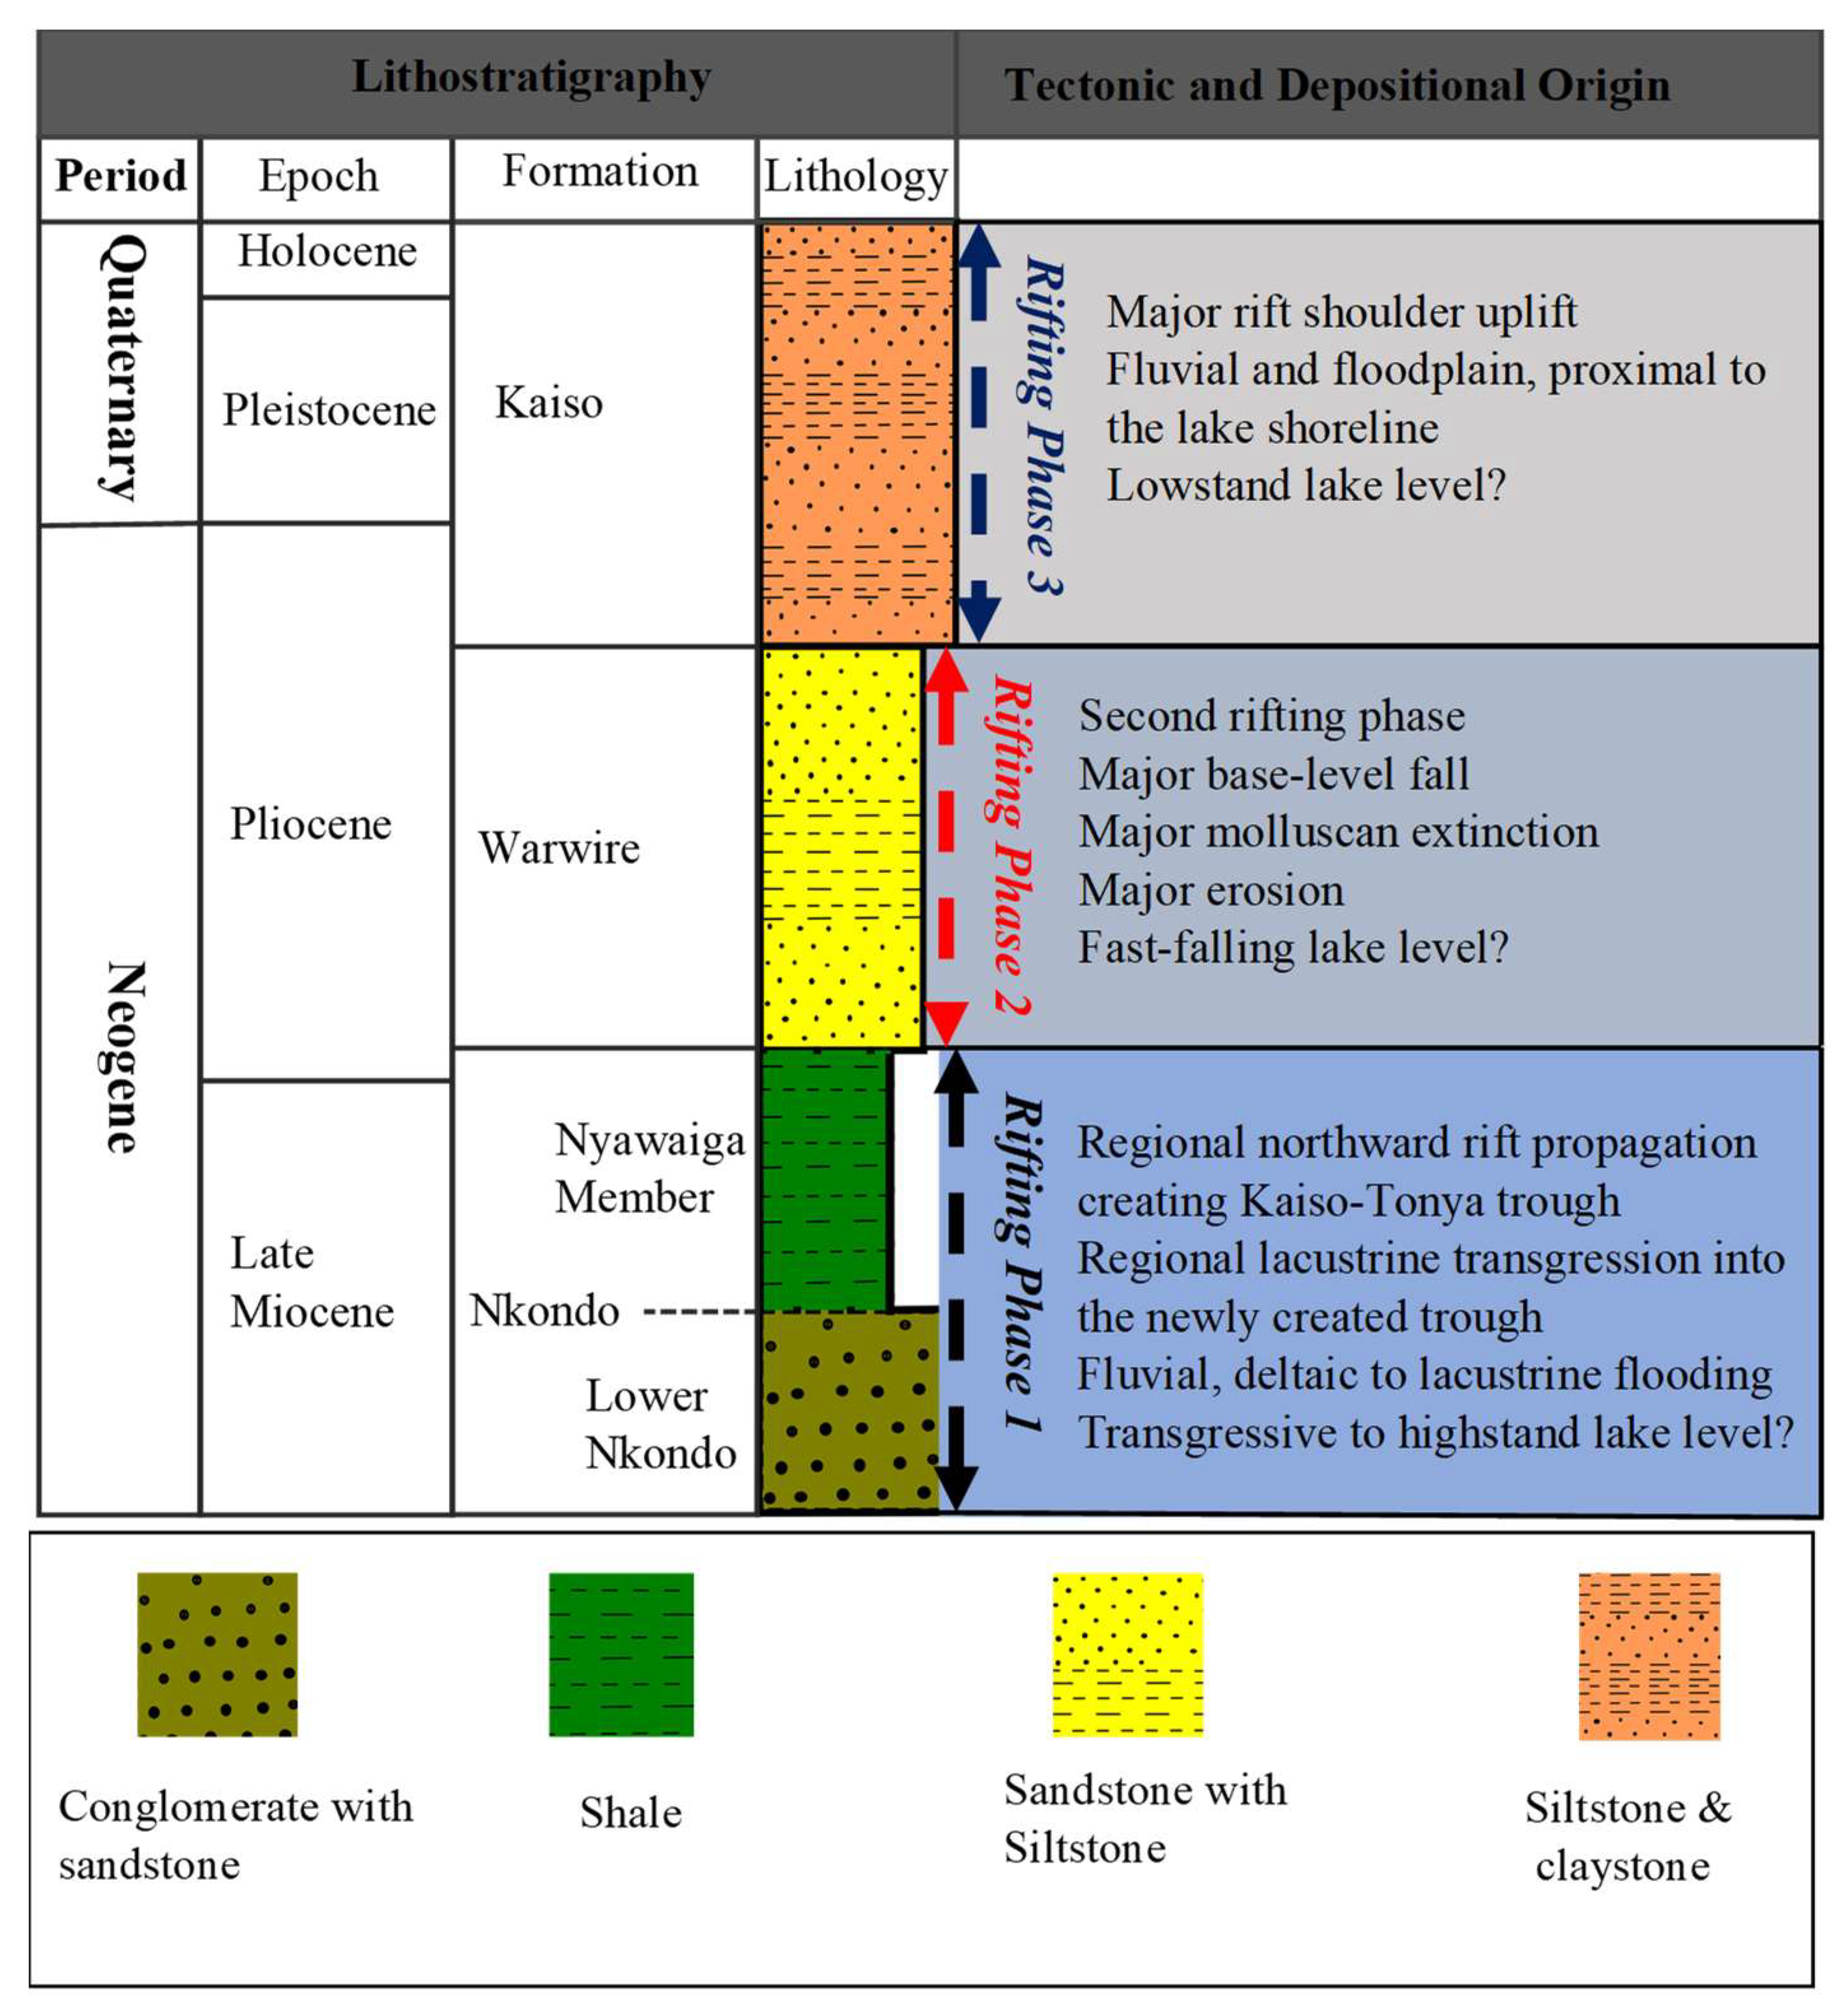
3.2.1. Southern Lake Albert Lithostratigraphy

Using depth sections interpreted from the NW-SE seismic line by Simon et al. [25] and TRC well reports, we constructed a generalized stratigraphic cross-section for the Southern Lake Albert Sub-basin, illustrating the dipping strata towards the basin center (Figure 8). This cross-section provided the framework for placing and modeling a pseudo Well X, enabling the analysis and prediction of how age, depth and proximity to the basin margin and/or depocenter influence petroleum maturation, generation and expulsion. These predictions represent a critical approach for Basin and Petroleum Systems Modeling (BPSM) in data-scarce regions.

2.2.2. Source Rock Characterization

To investigate the spatial and temporal variations in source rock quality within shale intervals, we performed Rock-Eval pyrolysis on selected samples from two exploration wells, NGJ and KTB. These results were integrated with data from the TRC Well geochemical reports to provide a comprehensive understanding of the source rock characteristics. The geochemical analysis revealed that the TRC Well samples, with an average Total Organic Carbon (TOC) of 3.5% and Hydrogen Index (HI) of 367 mg/g TOC, exhibit favorable conditions for a petroleum source rock. These parameters were subsequently used for input and calibration in BPSM. The dataset included borehole temperatures, TOC, HI, vitrinite reflectance (VR), and kerogen types from organic-rich shale facies of the Mid Miocene intervals, which are considered the most likely hydrocarbon sources. The average TOC and HI values derived from these potential source rock facies were utilized for modeling purposes.

2.2.3. Basin and Petroleum Systems Modeling

Basin and Petroleum Systems Modeling is a powerful tool for evaluating temperature, source rock maturity, generation and migration of petroleum in sedimentary basins [28,29,30]. 1D BPSM methodology is a fundamental approach in petroleum geology that models the geological and geochemical evolution of sedimentary basins along a single vertical profile. It helps understand the timing of sediment deposition, compaction, and hydrocarbon generation by simulating the thermal and burial history over geological time. This methodology is essential for predicting the maturation levels of organic-rich source rocks and provides insights into hydrocarbon generation, expulsion, and migration [31,32,33]. By integrating various datasets, including stratigraphic, geochemical, and boundary data, 1D BPSM can enhance the accuracy and reliability of predictions, thereby reducing exploration risk. It is the most applicable tool where data is scarce compared to more complex multi-dimensional models, serving as a preliminary guide and fundamental step for more detailed and sophisticated 2D or 3D modeling efforts. Additionally, it allows for testing different geological scenarios and hypotheses, making it crucial for exploring and assessing hydrocarbon resources effectively. This method is performed using various software packages tailored for BPSM, including PetroMod (Schlumberger), Genesis-Trinity (Zetaware), Permedia (Halliburton), among others. PetroMod is the most widely used in the petroleum industry due to its versatility [34]. PetroMod 1D can function independently or as an integrated part of the PetroMod 2D and 3D modeling systems. Single point data, including wells and pseudo-wells, can be created from scratch, imported from the Well Editor, or extracted from PetroMod 2D and 3D models. In this study, we utilized Schlumberger PetroMod 1D to model an exploration Well TRC and a pseudo Well X strategically located approximately 12 km apart (Figure 8). The stratigraphic dataset used for this modeling is detailed in Table 1 and Table 2, and Figure 8. Boundary conditions were determined based on published heat flow data [35,36] and PetroMod-1D sea level curves, incorporating surface water interface temperatures specific to the locality. Geochemical data, including Total Organic Carbon (TOC), Hydrogen Index (HI), and vitrinite reflectance (Ro) for both wells, were extracted from the TRC well reports. The modeled thermal history curves were calibrated using observed vitrinite reflectance and temperature measurements from the TRC well. Burial plots were overlaid with vitrinite reflectance modeled using the Easy %Ro method [36] embedded in the 1D PetroMod software. The decision to apply the measured geochemical parameters to the pseudo well is based on the geological proximity of the wells and the assumption that these sections of the shale formation were deposited under similar lacustrine conditions. Consequently, they are expected to have comparable initial TOC and HI values. This assumption is supported by literature interpretations suggesting that this part of the rift was a full graben with minimal depth variations during the time of deposition e.g. [9]. The current pronounced depth variations are attributed to tectonic movements that occurred quite recently.

3. Results

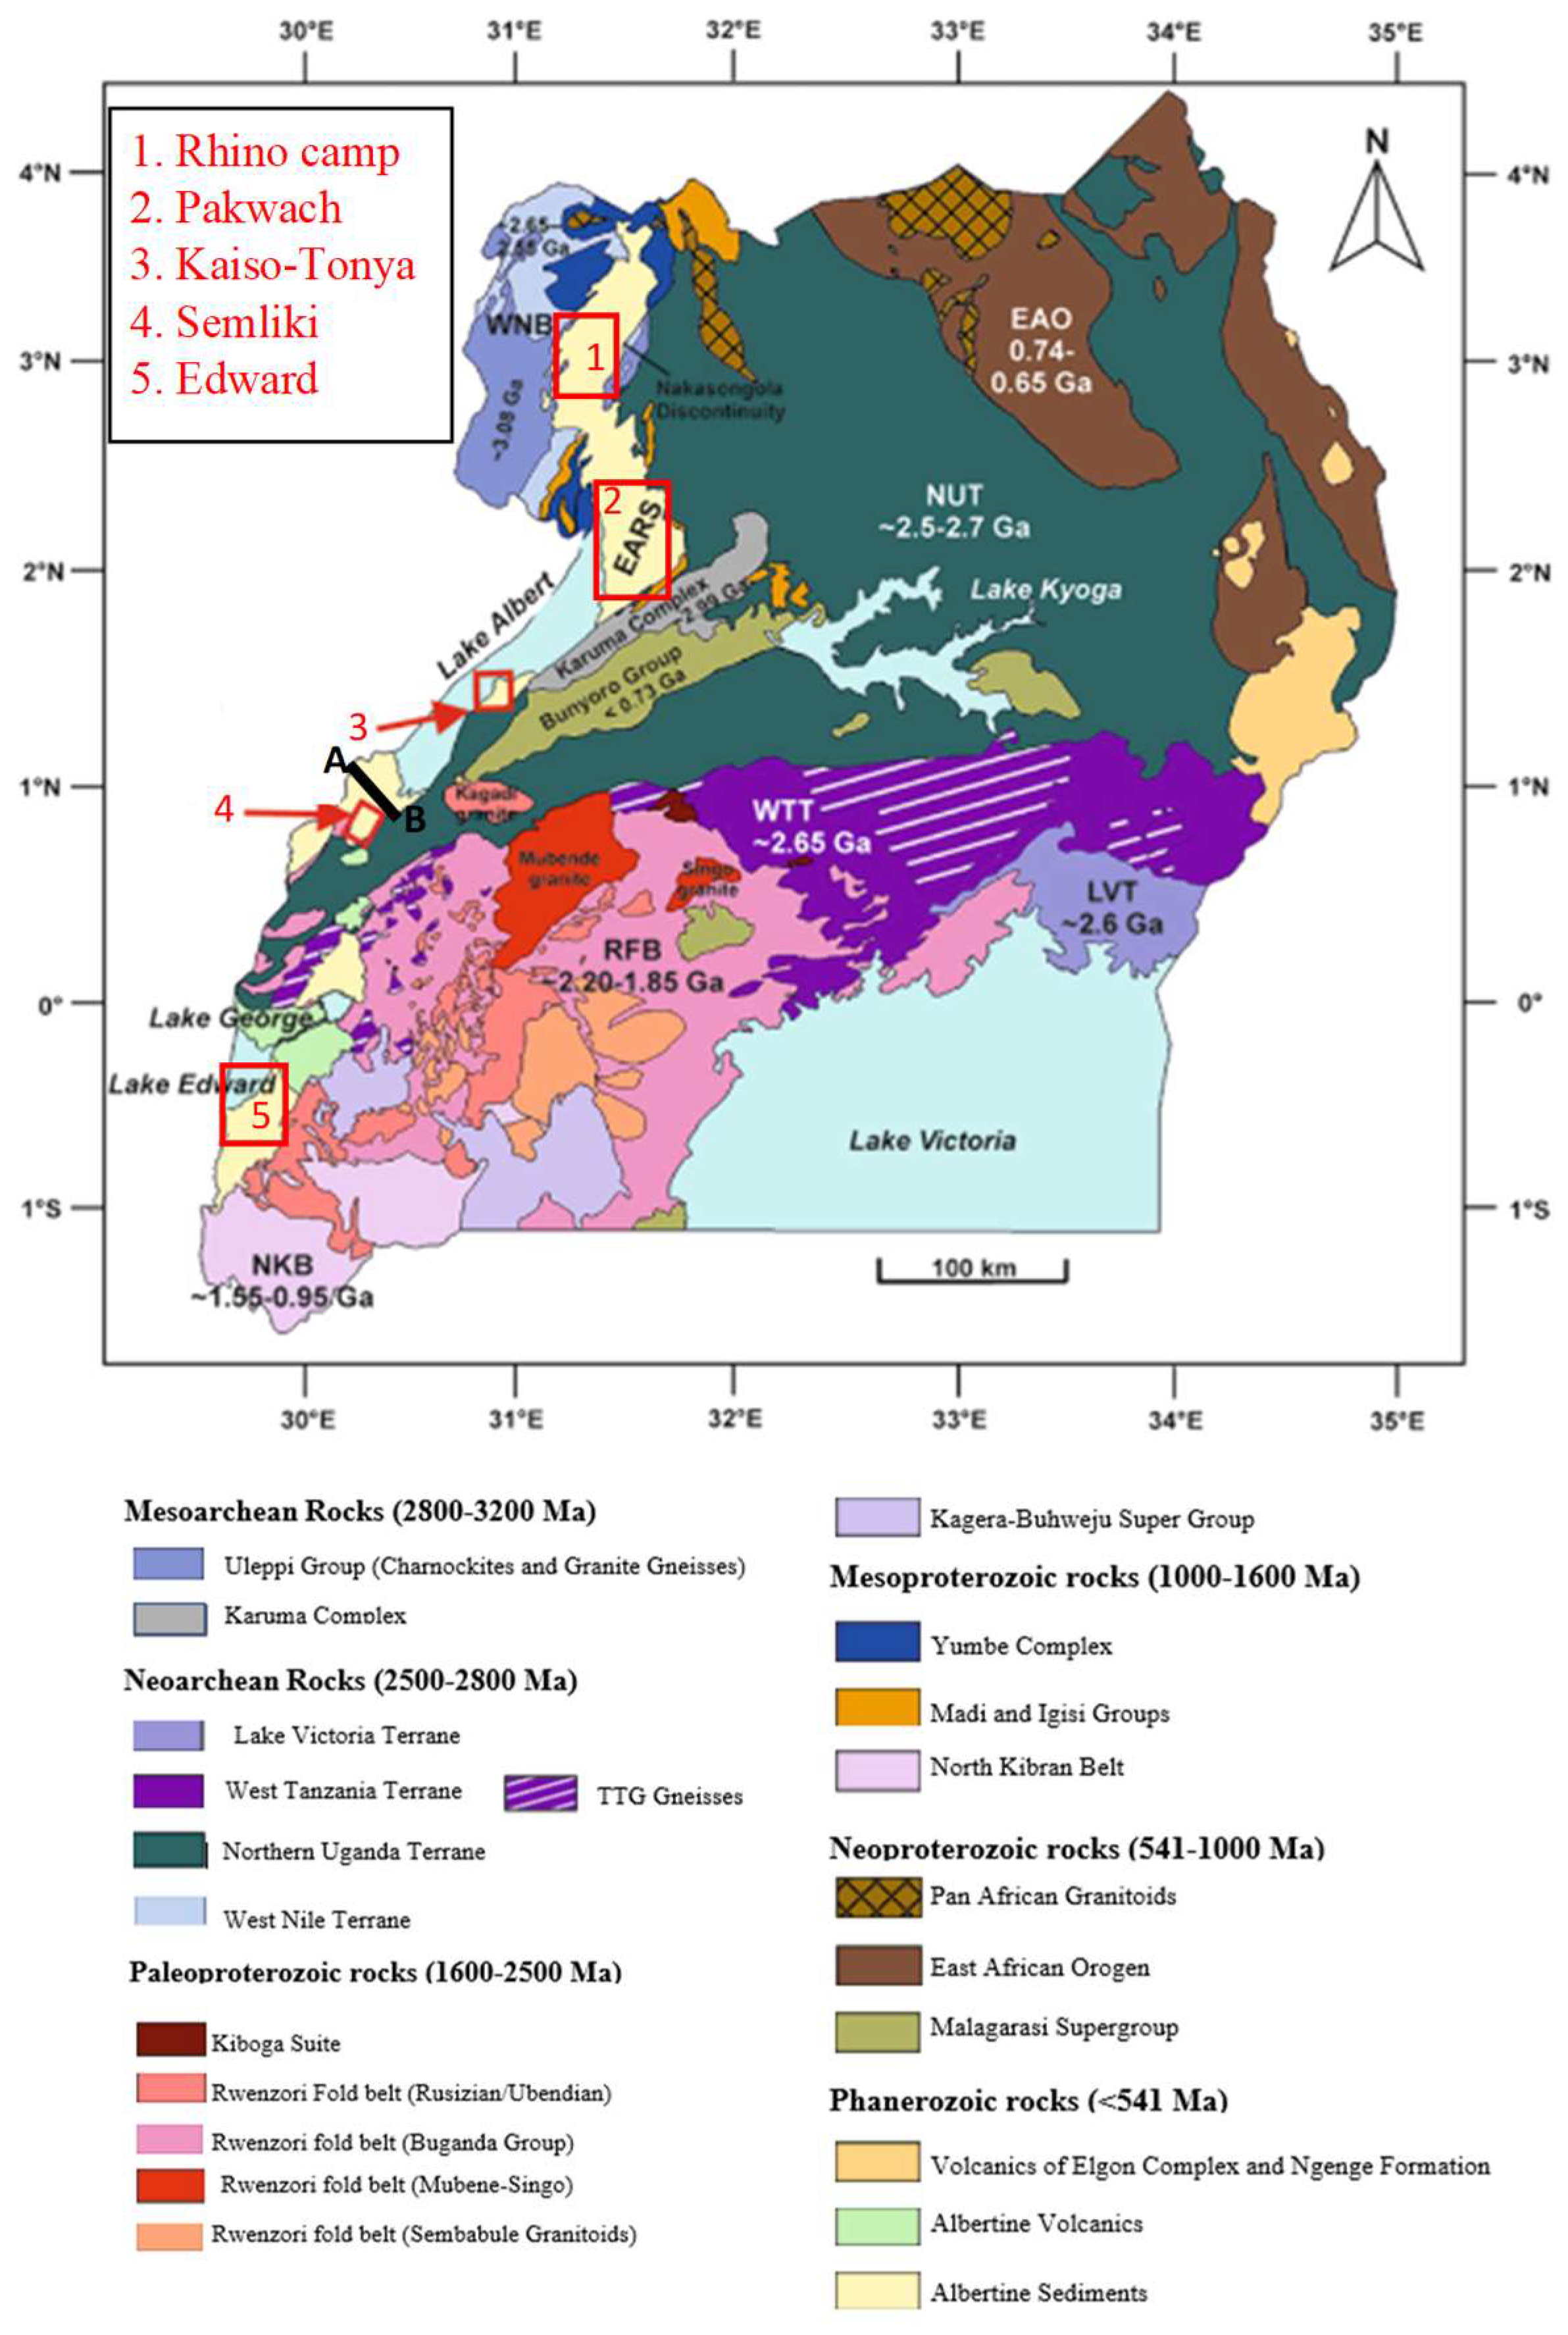
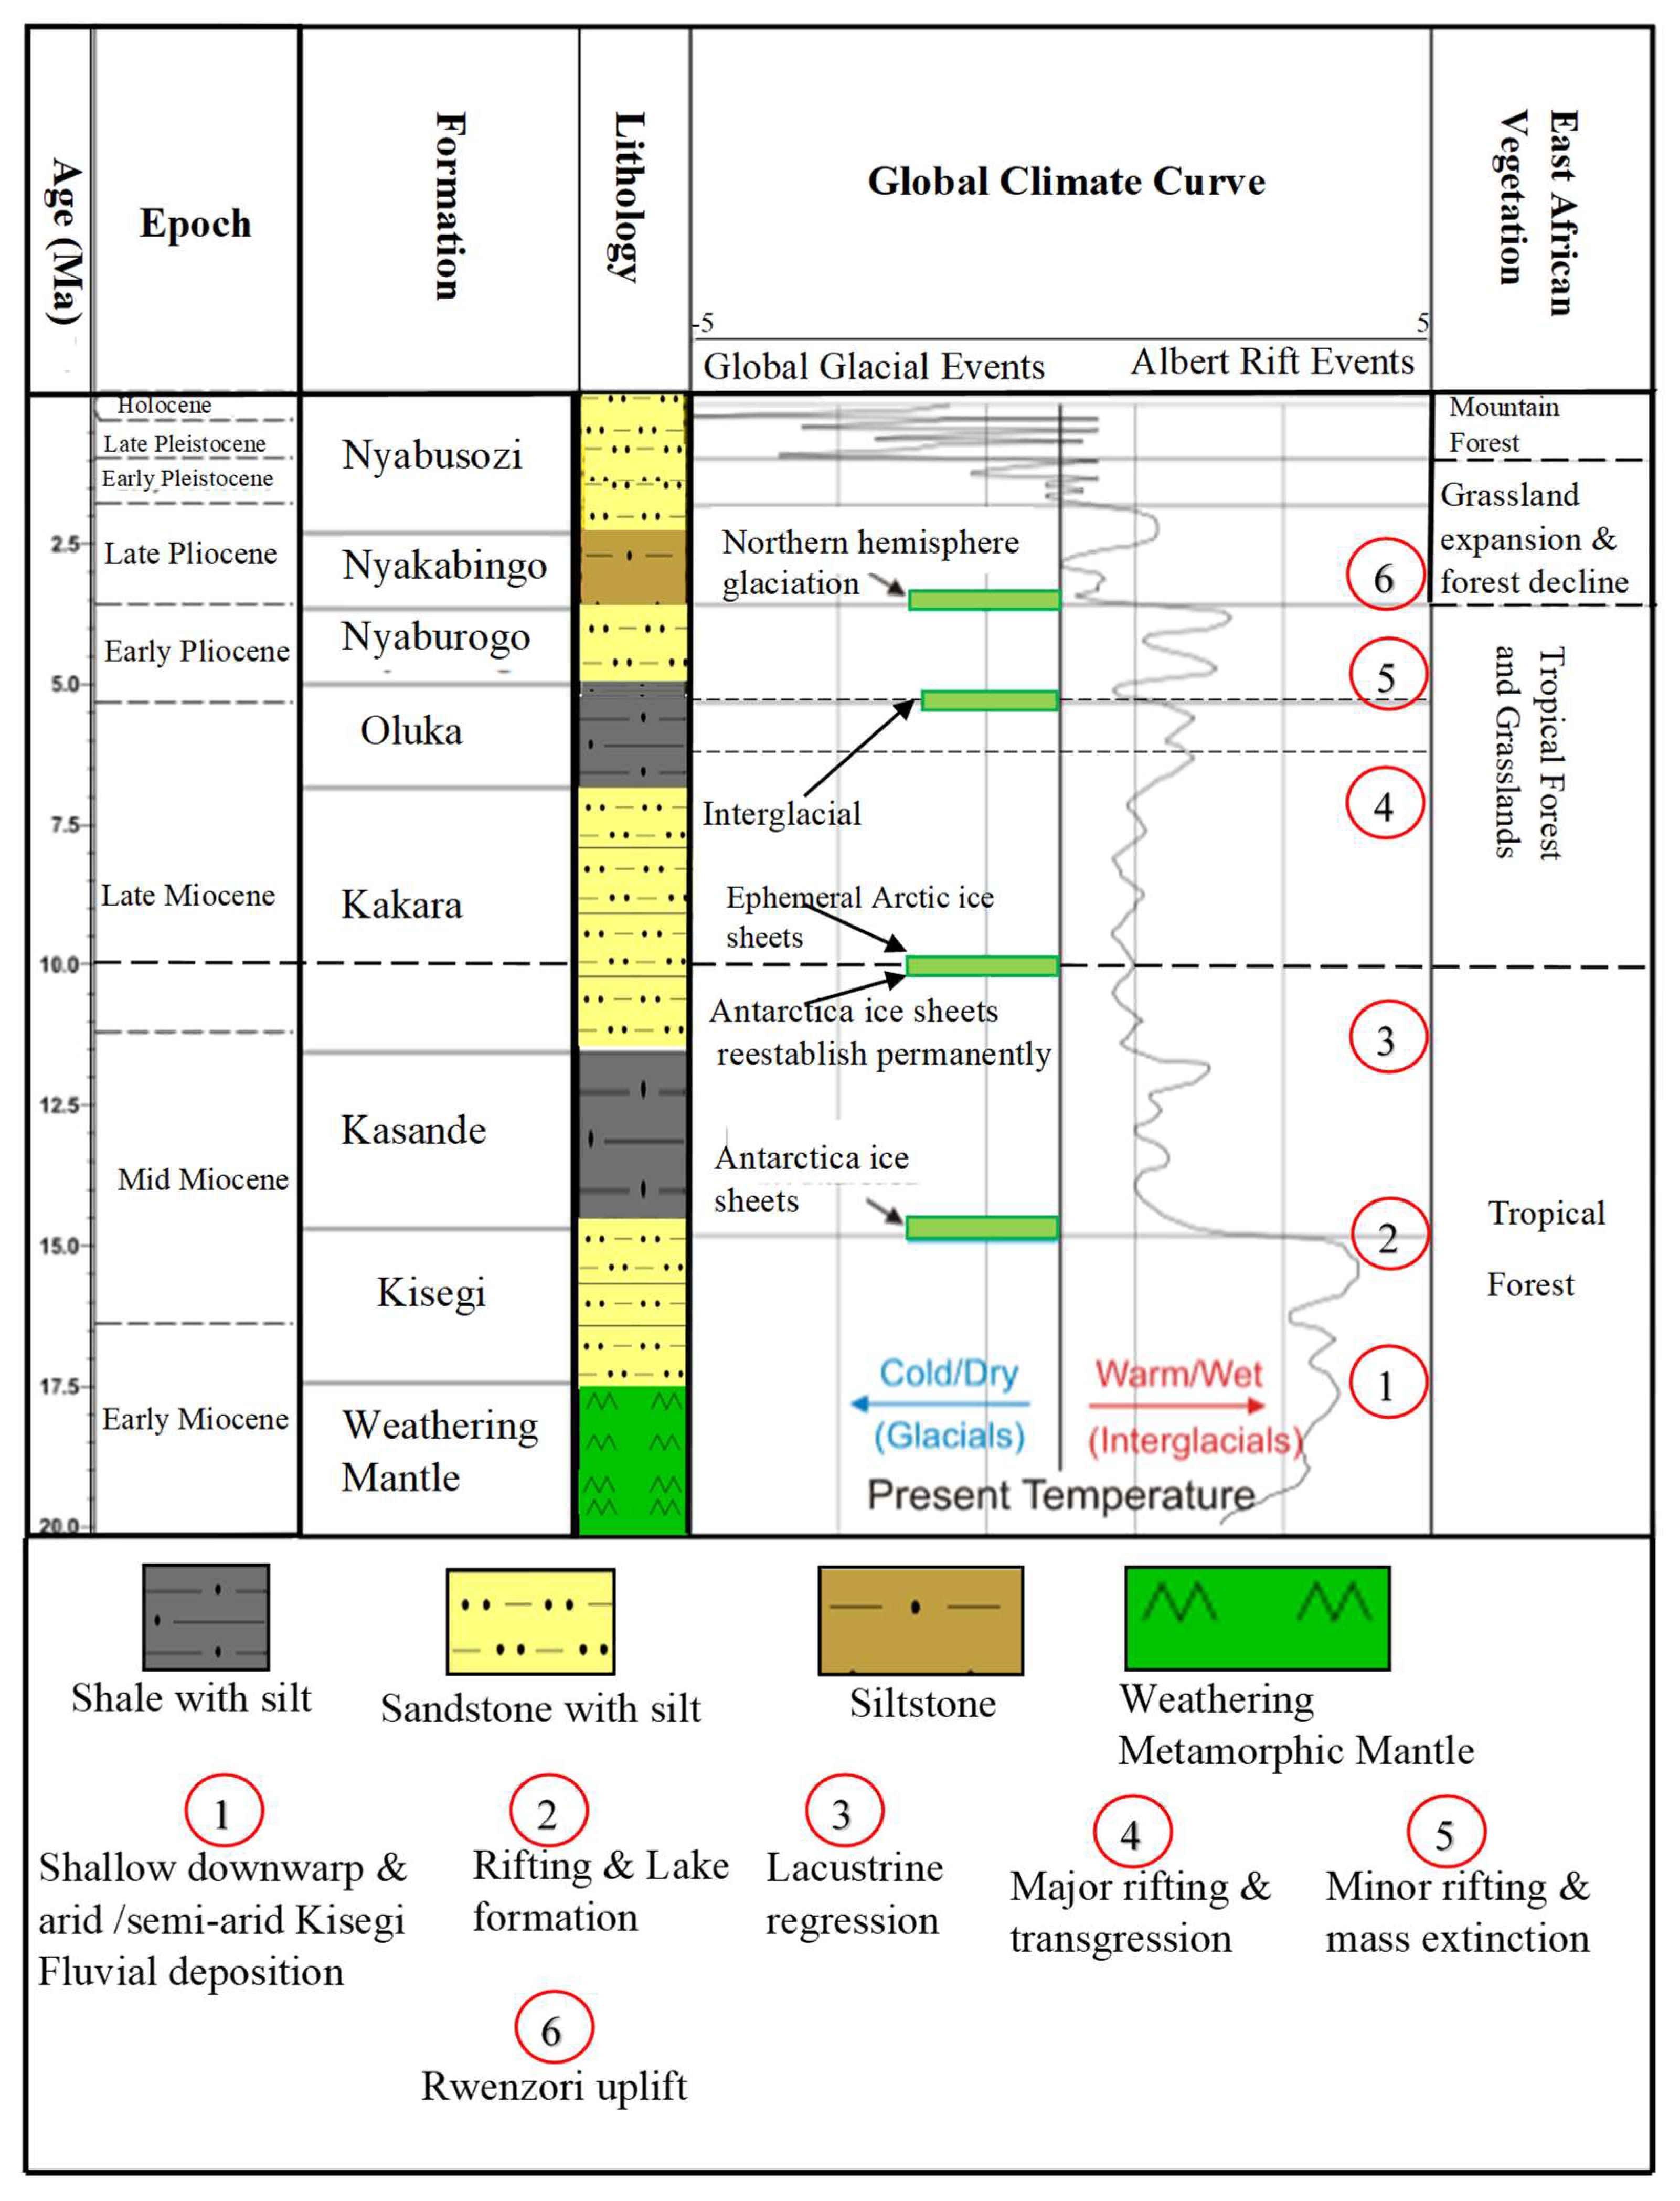
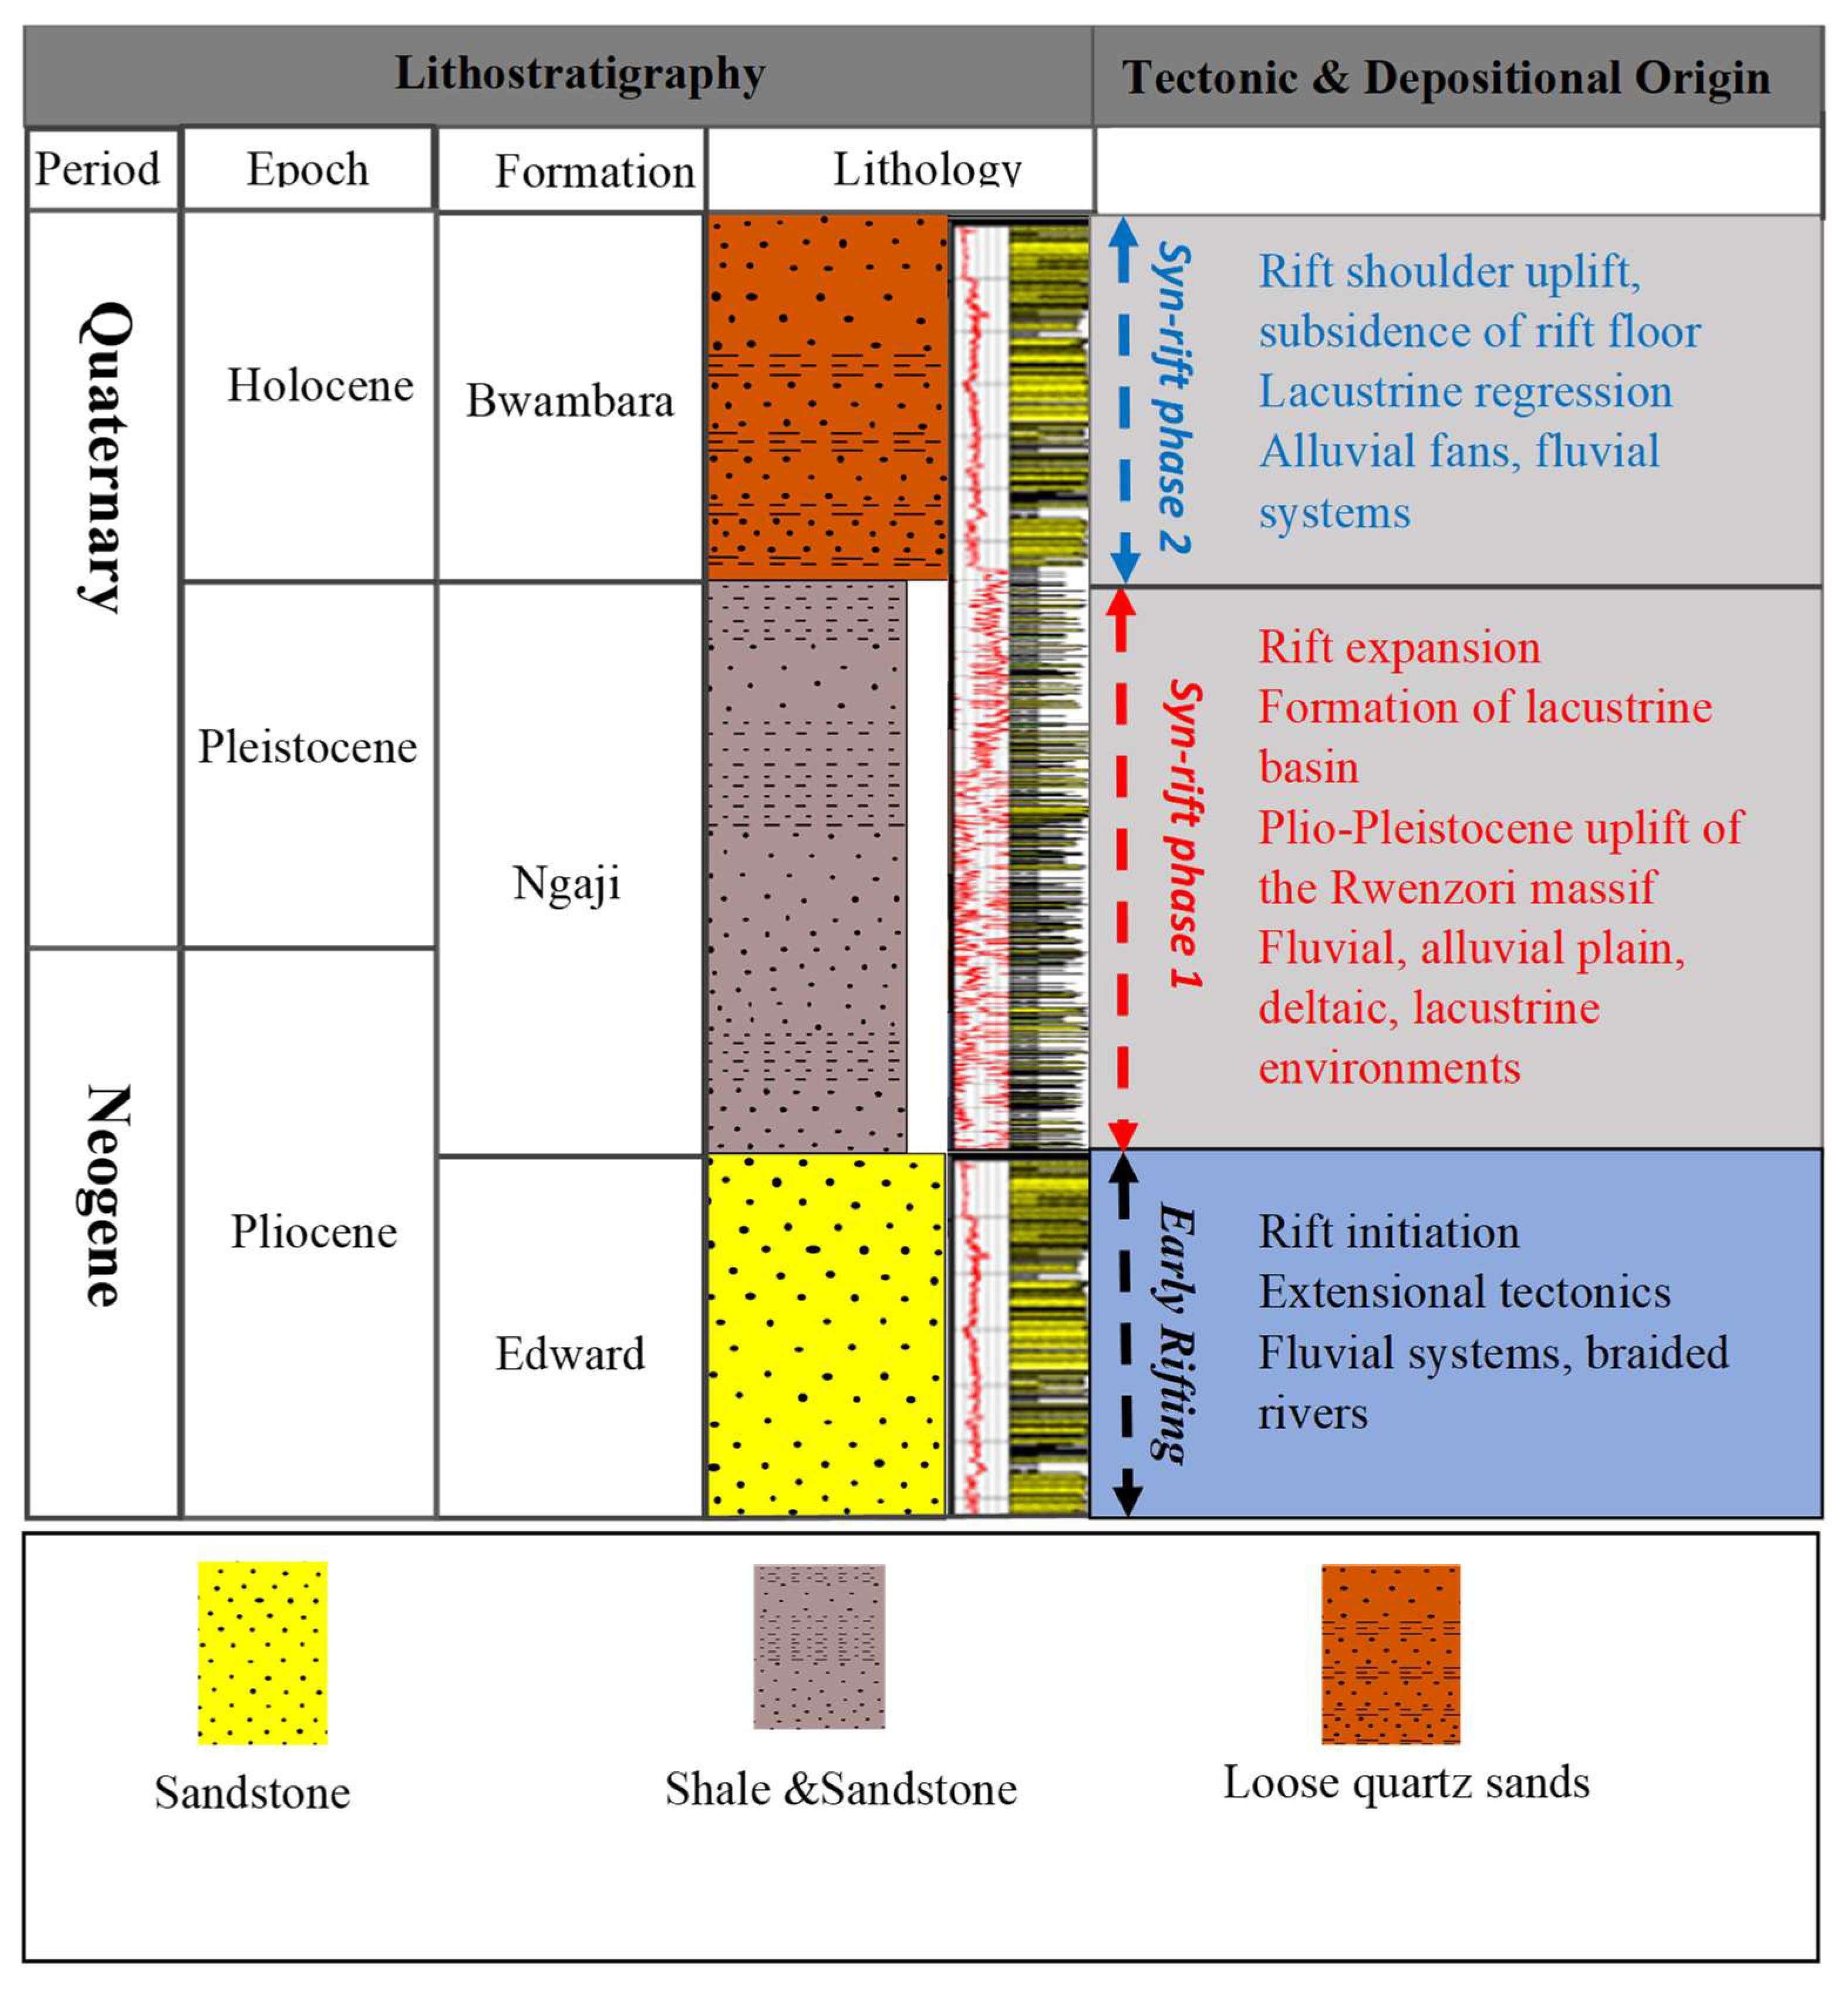
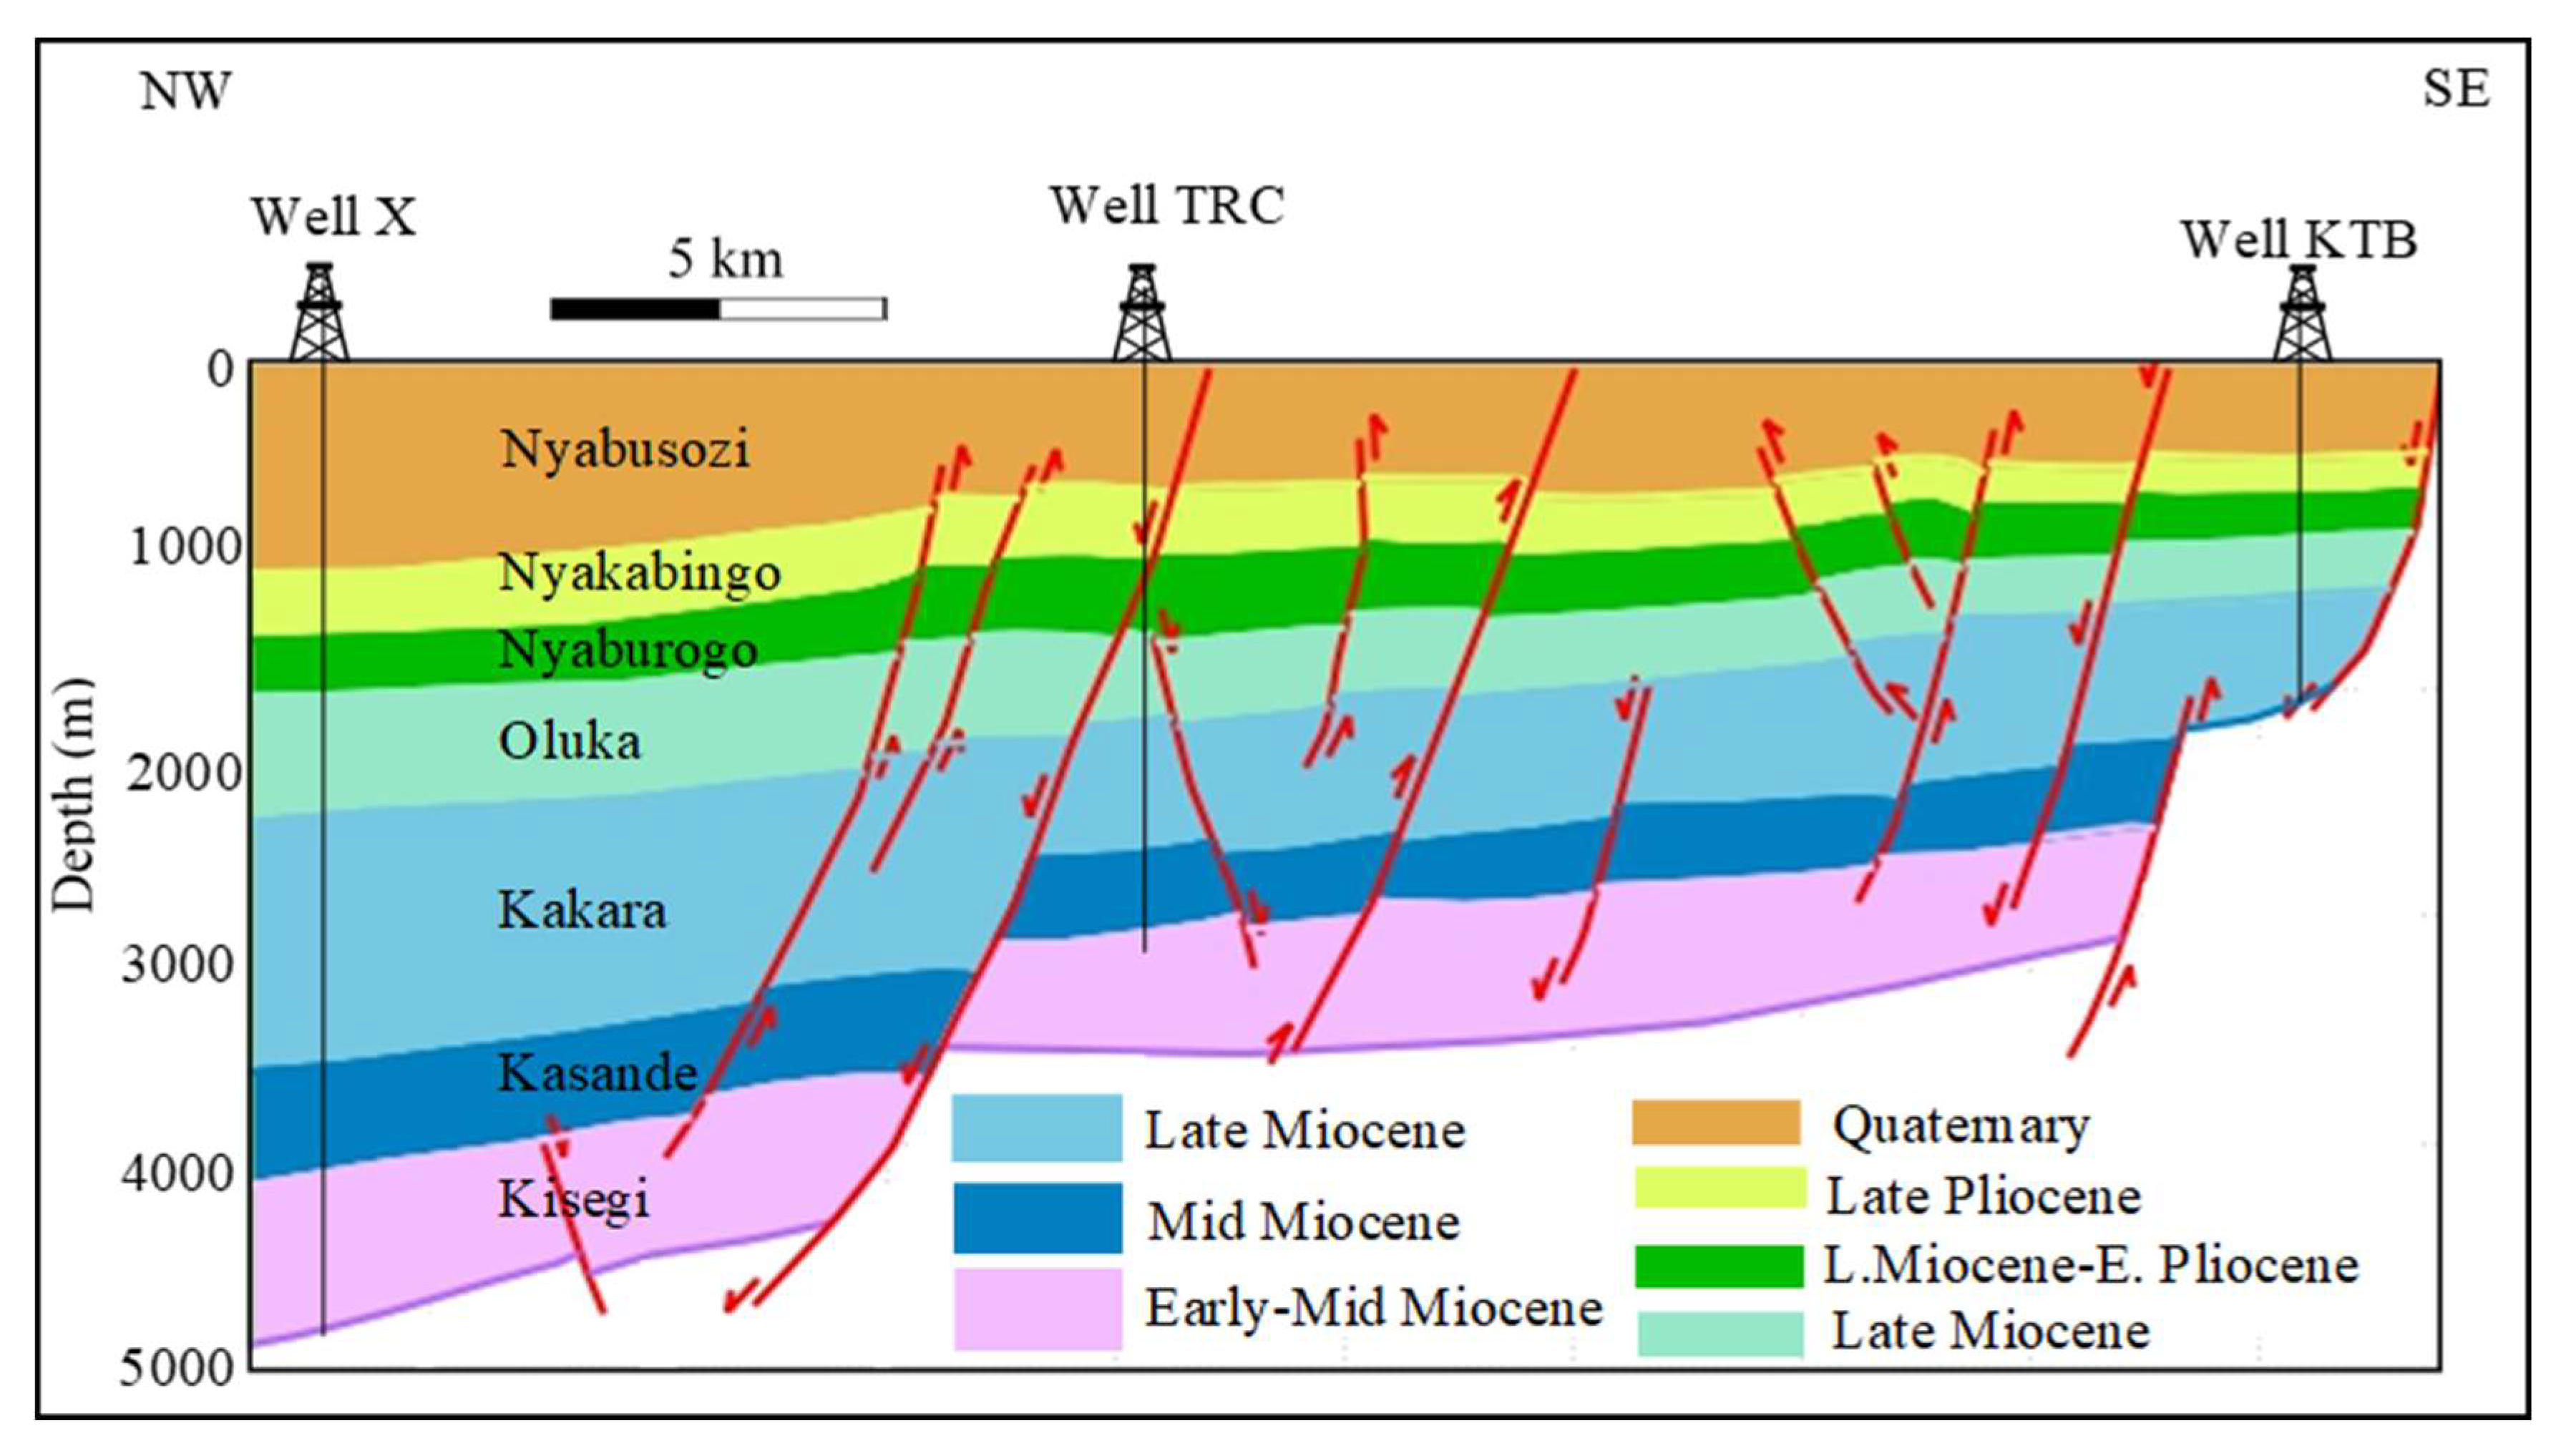
3.1. Albert Rift Regional Tectonostratigraphy

The integrated analysis of seismic, well, and literature data reveals the tectonostratigraphic framework of the Albert Rift, highlighting the basin's stratigraphy, depositional environments, and tectonic phases. The results indicate a complex tectonostratigraphic evolution, driven by repeated extensional tectonics and subsidence, which controlled sedimentation patterns and the development of hydrocarbon plays across different sectors of the rift. The Albert Rift is divided, from north to south, into distinct sectors: Rhino Camp, Pakwach/Murchison Falls, Kaiso-Tonya/Central Lake Albert, Southern Lake Albert/Semliki Valley, and the Lakes Edward-George basin. Each sector exhibits unique tectonic and depositional characteristics, contributing to the basin’s petroleum potential. In this section we present four of the five sectors based on data availability.
Tectonostratigraphy of Pakwach Basin
The Pakwach Basin, dating from the Early Pliocene, is characterized by four distinct tectonostratigraphic units, represented here as formations (Figure 3). These formation names and characteristics have been adopted and presented by the Directorate of Petroleum, Uganda [16].
Early Pliocene Rift Onset Phase: Wangkwar Formation
This formation marks the onset of rifting, with initial rift subsidence and sedimentation dominated by alluvial fan deposits transitioning to fluvial and alluvial plain systems. The sequence consists of coarse sands and conglomerates in the lower portion, shifting to finer sediments in the upper layers.
Mid Pliocene Rift Expansion Phase: Nyamusika Formation
Deposition occurred during a phase of rift expansion, with associated slow subsidence across the basin. The formation is dominated by lacustrine sediments, including shales and fine sands with gastropod shells, reflecting stable tectonic conditions and organic-rich sedimentation.
Late Pliocene to Early Pleistocene Renewed Rifting Phase: Paraa Formation
Renewed rifting and intensified subsidence resulted in the deposition of poorly sorted sediments in deltaic and shallow lacustrine environments. The formation features a mix of gritty sandstones, siltstones, and clays, with evidence of fluctuating lake levels and episodic sedimentation.
Mid Pleistocene to Holocene Late Rifting Phase: Tangi Formation
The final phase of rifting, marked by significant uplift and subsidence, led to the deposition of high-energy alluvial fans and fluvial systems. The formation consists of coarse sand, conglomerates and gritty clays, indicating localized tectonic adjustments and an aggradational depositional environment.
Generally, the tectonostratigraphic evolution of the Pakwach Basin reflects a series of tectonic and depositional phases. The Early Pliocene (Wangkwar Formation) marks the initiation of rifting, characterized by graben and half-graben structures and alluvial fan deposits. In the Mid Pliocene (Nyamusika Formation), rift expansion facilitated lacustrine transgression, with fine-grained, organic-rich sediments. During the Late Pliocene to Early Pleistocene (Paraa Formation), renewed tectonic activity resulted in fluvial-deltaic environments transitioning to shallow lacustrine settings. The Mid Pleistocene to Holocene (Tangi Formation) represents the latest stages of rifting, with pronounced uplift and high-energy alluvial fan and fluvial systems filling the newly created accommodation space. These findings highlight the tectonostratigraphic evolution of the Pakwach Basin, shaped by dynamic tectonic and sedimentary processes.
Tectonostratigraphy of the Central Lake Albert Basin
The Kaiso-Tonya area, part of the Central Lake Albert Basin, exhibits a tectonostratigraphic evolution influenced by extensional tectonics, sedimentary infill, and fluctuating lake levels. The basin's development is characterized by three rifting phases, each marked by specific stratigraphic units (Figure 4). Like in the Pakwach Basin, the stratigraphic units within the Kaiso-Tonya area are defined and presented by the Directorate of Petroleum, Uganda [16].
Late Miocene to Early Pliocene Rift Initiation Phase: Nkondo Formation
This phase involved the regional northward propagation of extensional faulting, leading to the development of the Kaiso-Tonya trough. The Nkondo Formation records this phase, beginning with conglomerates indicative of high-energy deposition near fault scarps. It transitions to sandstones, siltstones, and deep lacustrine shales, reflecting the shift from fluvial and deltaic environments to a deep lacustrine setting, with a maximum flooding surface marking the transgressive-highstand phase.
Early to Mid-Pliocene Syn-Rift Base Level Fall: Warwire Formation
Intense extensional faulting during this phase led to base-level fall and erosion, with notable environmental stress, including a molluscan extinction event. The Warwire Formation captures the geological record, characterized by alternating siltstones, sandstones, claystones, and coquina beds. These reflect shallow lacustrine, deltaic, and fluvial environments. Depositional shifts indicate active faulting, base-level changes, and sediment supply during fluctuating lake levels.
Late Pliocene to Recent Rifting Phase: Kaiso Formation
The final phase, marked by regional uplift of Rwenzori massif in the south and rift shoulders, and rift floor subsidence, is represented by the Kaiso Formation, dominated by claystones and siltstones. These sediments reflect deposition in fluvial and floodplain environments near the shrinking lake shoreline, with reduced accommodation space. The phase marks the transition from lacustrine systems to a primarily fluvial landscape.
Tectonostratigraphy of the Southern Lake Albert Basin
The Southern Lake Albert area also commonly referred to as Semliki exhibits four distinct tectonostratigraphic phases interpreted from documented sediment characteristics and regional correlations (Figure 5 & Figure 6). This area forms the most studied area of the five basins/subbasins though its tectonics and stratigraphy is still not yet universally agreed upon. Never the less, we try to prepare a harmonized tectonostratigraphy from the documented data which will form a foundation for future refinements e.g. [15,16,22,24,25].
Early Miocene Rift Initiation Phase: Kisegi Formation
The Kisegi Formation representing this phase marks the onset of rifting with coarse-grained, poorly sorted basal conglomerates, dominant channel sandstones and thin floodplain clays, reflecting alluvial fan and braided to meandering river deposition under an arid climate. Tensional gypsum stringers indicate active tectonic stress during this early phase or later tensional tectonics.
Mid to Late Miocene Major Rifting Phase: Kasande, Kakara, and Oluka Formations
This package represents a synrift major rifting phase that resulted in the deposition of lacustrine, deltaic, and fluvial sediments. It marks the transition from a fluvial basin to a lacustrine basin. This sedimentary package has been differentiated into three distinct formations. The Kasande Formation which marks the earliest unit is composed of organic-rich mudstones and coaly shales is interpreted to have been deposited in a warm, wet, open lacustrine environment while the overlying Kakara Formation is comprised of deltaic and shallow lacustrine sediments with iron oxide-rich sandstones, reflecting fluctuating depositional energy. Marking the end of this package, the Oluka Formation was deposited in deltaic, mudflat, and lacustrine settings, with ironstone and silica-cemented sandstones indicating fluctuating conditions influenced by tectonics and climate.
Early to Late Pliocene Syn-rift Phase: Nyaburogo and Nyakabingo Formations
This package represents a tectonostratigraphic phase that resulted into a shift in sediment provenance due to the changes in the sediment routing systems primarily caused by interruptions in the drainage flow directions. This package is subdivided into the Nyaburogo and Nyakabingo Formations which document alternating deltaic, lacustrine, and prodelta deposition. The lower section of this package is represented by the Nyaburogo Formation which is characterized by a silicified basal layer, followed by thick sequences of claystones interbedded with rust-brown to yellowish-brown siltstones and pisolitic ironstones. Overlying this unit is the Nyakabingo Formation which marks transition from low energy shallow lacustrine to higher-energy fluvial environments, with carbonate nodules and ironstones marking fluctuating water levels and episodic sedimentation.
Early Pleistocene to Present Rifting phase: Nyabusozi Formation
The Early Pleistocene to present marks a transitional phase in the basin's evolution, driven by the uplift of the Rwenzori Massif, which split the regional lacustrine basin into two distinct basins, altered sediment provenance, and triggered molluscan changes; this period is captured in the Nyabusozi Formation, characterized by a basal massive sandstone layer with low gamma ray response, overlain by alternating sands and clays interbedded with ironstone layers, reflecting dynamic depositional processes in lacustrine and shoreline environments influenced by fluctuating lake levels, tectonic uplift, and climatic variability.
Overall, the southern Lake Albert Basin represents the most complete sedimentary fill and records all the known tectonic and climatic shifts since early Miocene (Figure 6).
Tectonostratigraphy of the Lakes Edward-George Basin
Analysis of seismic data, well reports and other preliminary information shows that the tectonostratigraphy of the Lakes Edward-George Basin is characterized by progressive rifting phases, each influencing sedimentation patterns and structural development (Figure 7).
Pliocene Early Rifting Phase: Edward Formation
The Early Rifting Phase, represented by the Edward Formation, reflects the onset of rifting characterized by extensional tectonics and the development of normal faults accompanied by localized rift floor and rift margin volcanic activity. Sedimentation during this period was dominated by fluvial systems, with braided rivers transporting poorly sorted, angular, and immature sandstones derived directly from uplifted rift shoulders, indicative of proximal deposition with limited transport distances. The depositional environment, shaped by active faulting and limited accommodation space, highlights the interaction between tectonic uplift and sediment delivery, marking the initial phase of rift basin development.
Late Pliocene to Pleistocene Syn-Rift Phase: Ngaji Formation
This Syn-Rift Phase, represented by the Ngaji Formation, marks a period of active rift expansion characterized by continued basin extension, subsidence, and the development of horst and graben structures through enhanced normal faulting. This tectonic activity created substantial accommodation space, leading to diverse sedimentation, with fluvial systems depositing sandstones on alluvial plains and deltas at the basin margins, while quieter lacustrine settings in the central basin accumulated finer-grained claystones and siltstones. The depositional variability reflects a rift expansion stage where tectonic controls and fluctuating sediment supply shaped the interplay between fluvial, deltaic, and lacustrine environments.
Pleistocene to Holocene Late Syn-Rift Phase: Bwambara Formation
The most recent Syn-Rift Phase, represented by the Bwambara Formation, signifies a late rift stage marked by continued uplift of rift shoulders alongside rift floor subsidence and creation of new accommodation space. Lithologically, loose quartz sands with shell fragments indicate deposition in higher-energy environments influenced by episodic flooding and proximity to lacustrine conditions. Dominated by alluvial fans at the basin margins and braided river systems feeding fan deltas, this phase reflects proximal, high-energy sedimentation driven by renewed tectonic activity.

3.2. Petroleum Potential of the Albert Rift

An integrated analysis of the available geological, geochemical, and geophysical data highlights the Southern Lake Albert area, particularly the Semliki Sub-basin, as a key region of hydrocarbon prospectivity. This area is characterized by the presence of the oldest sedimentary sequences within the Albert Rift, coupled with mature source rocks that have generated and continue to generate and expel hydrocarbons.
This section delves into the stratigraphic framework of the Southern Lake Albert area, evaluating source rock geochemical data to establish the richness, maturity, and hydrocarbon generation potential of key formations. Furthermore, the timing and processes of petroleum generation and expulsion are presented, emphasizing their implications for potential hydrocarbon accumulations in the sub-basin and the entire Albert rift at large.

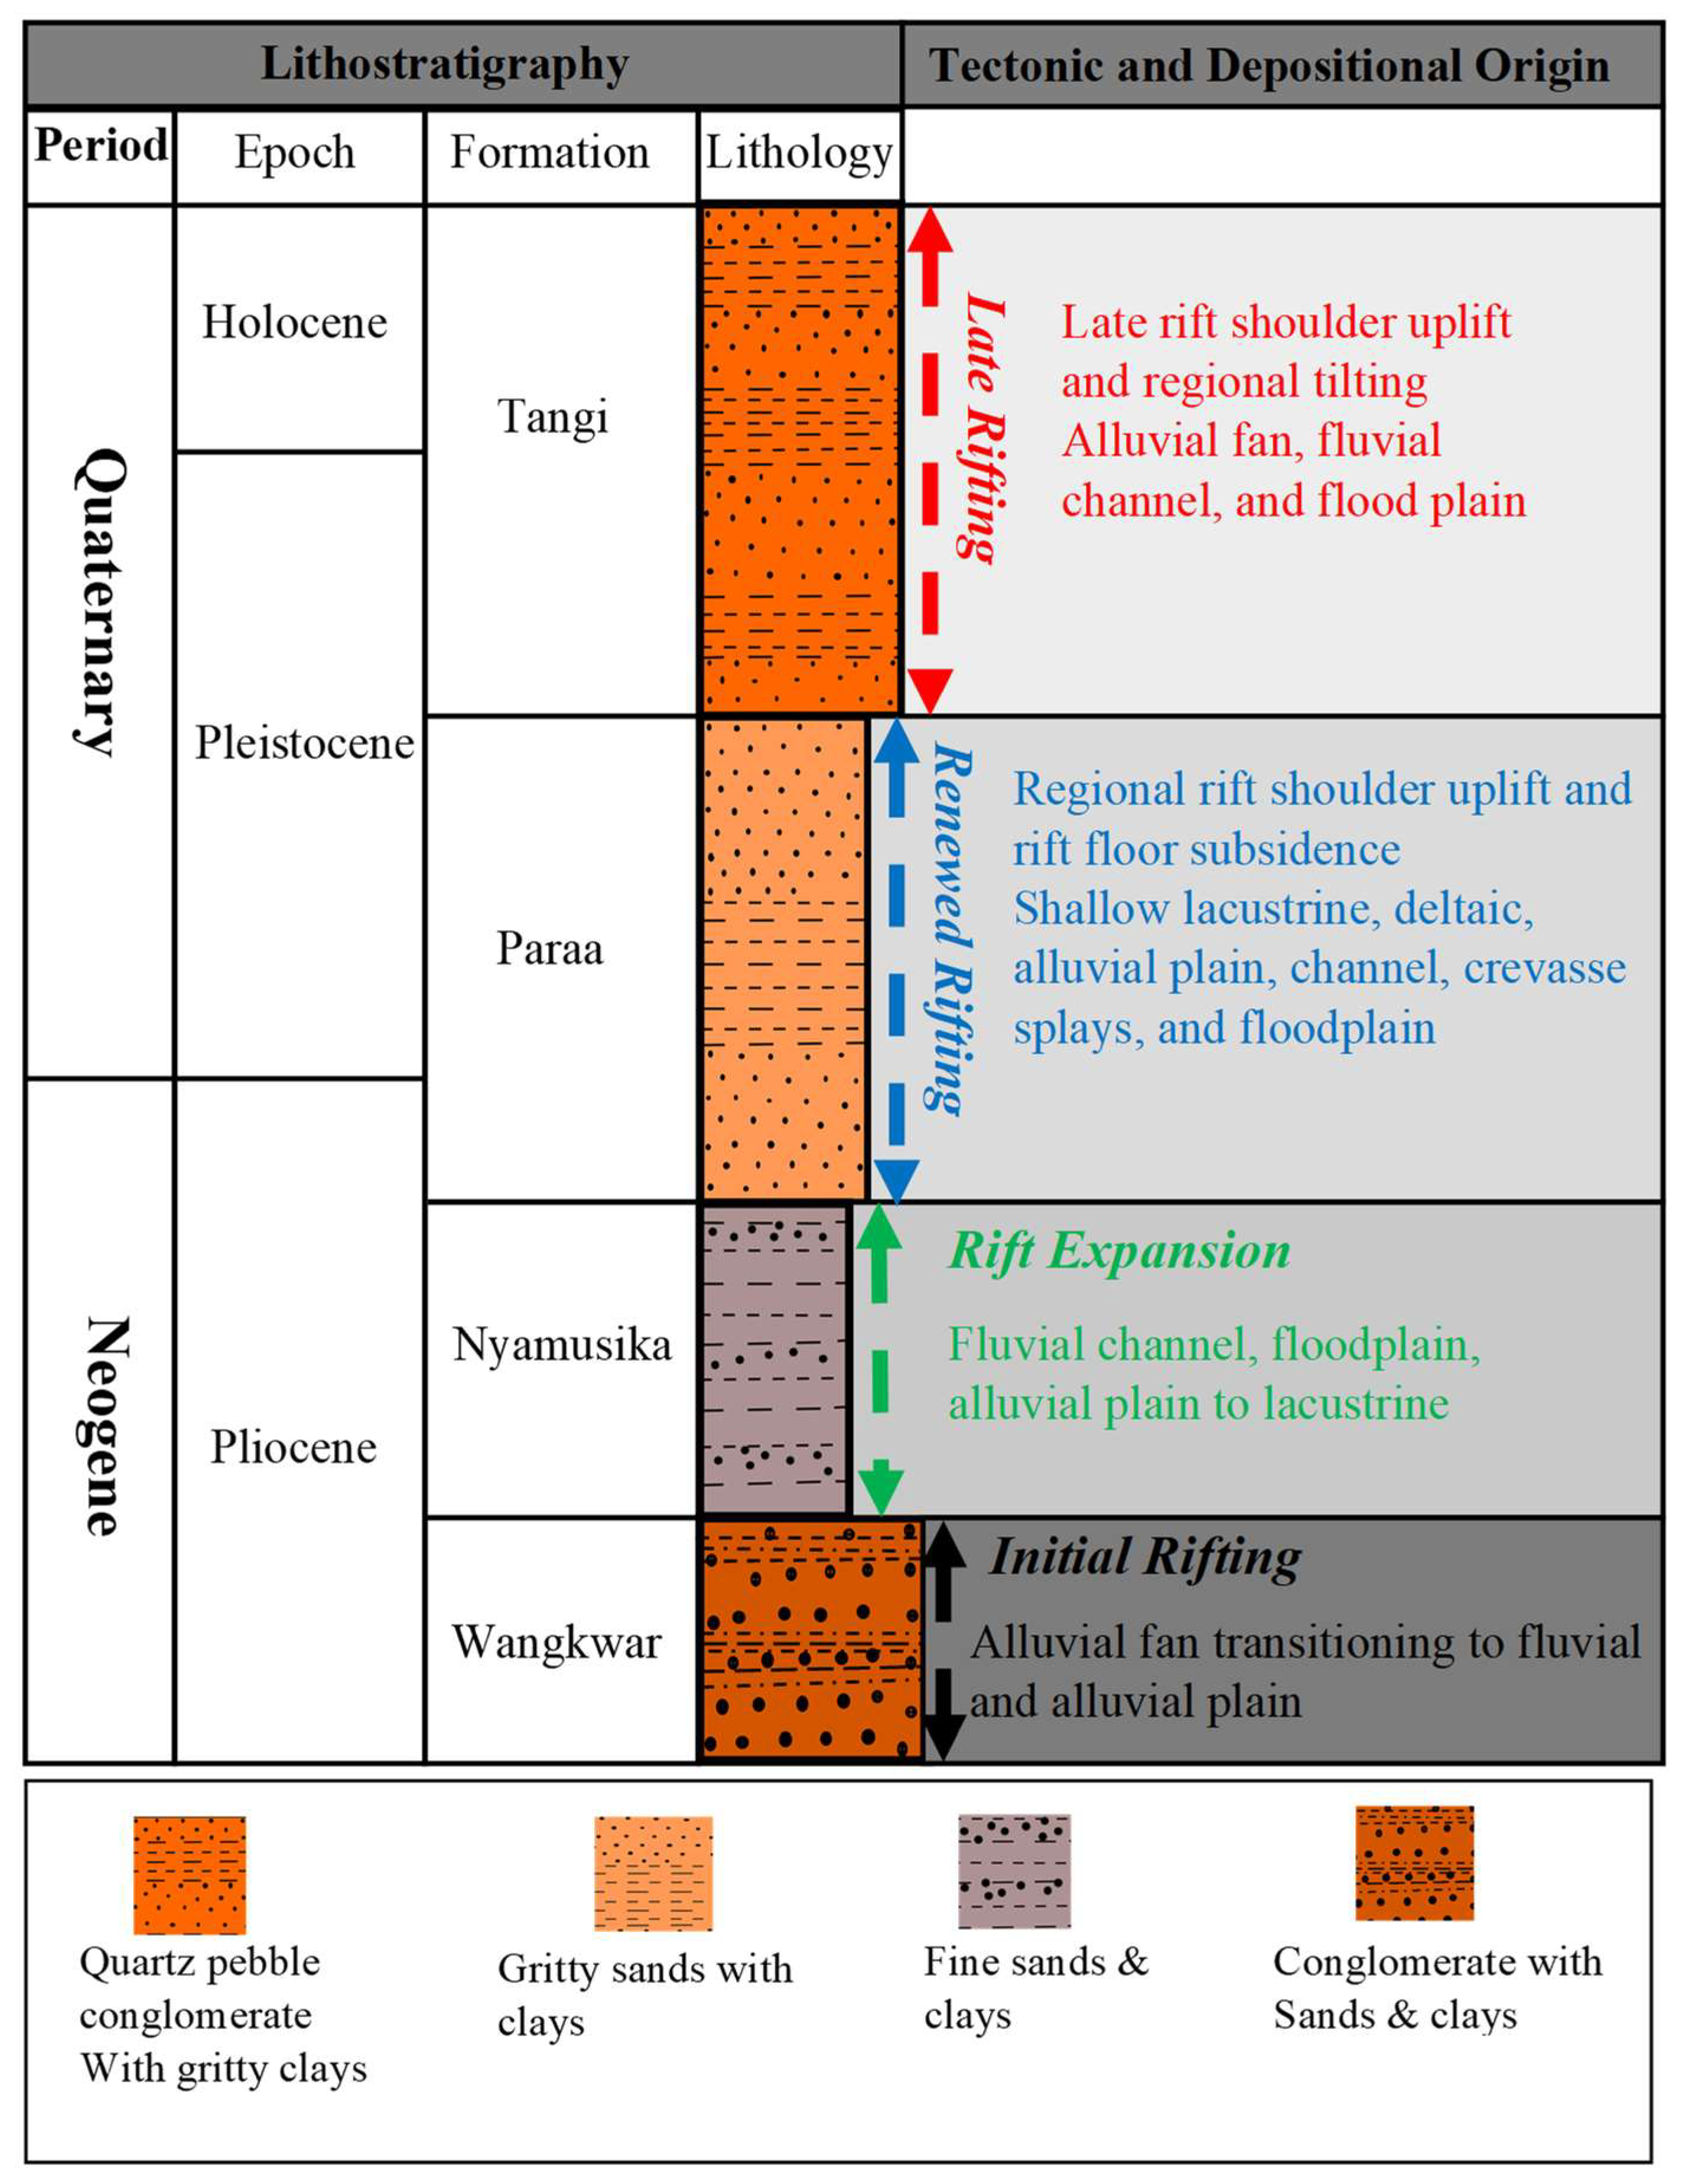
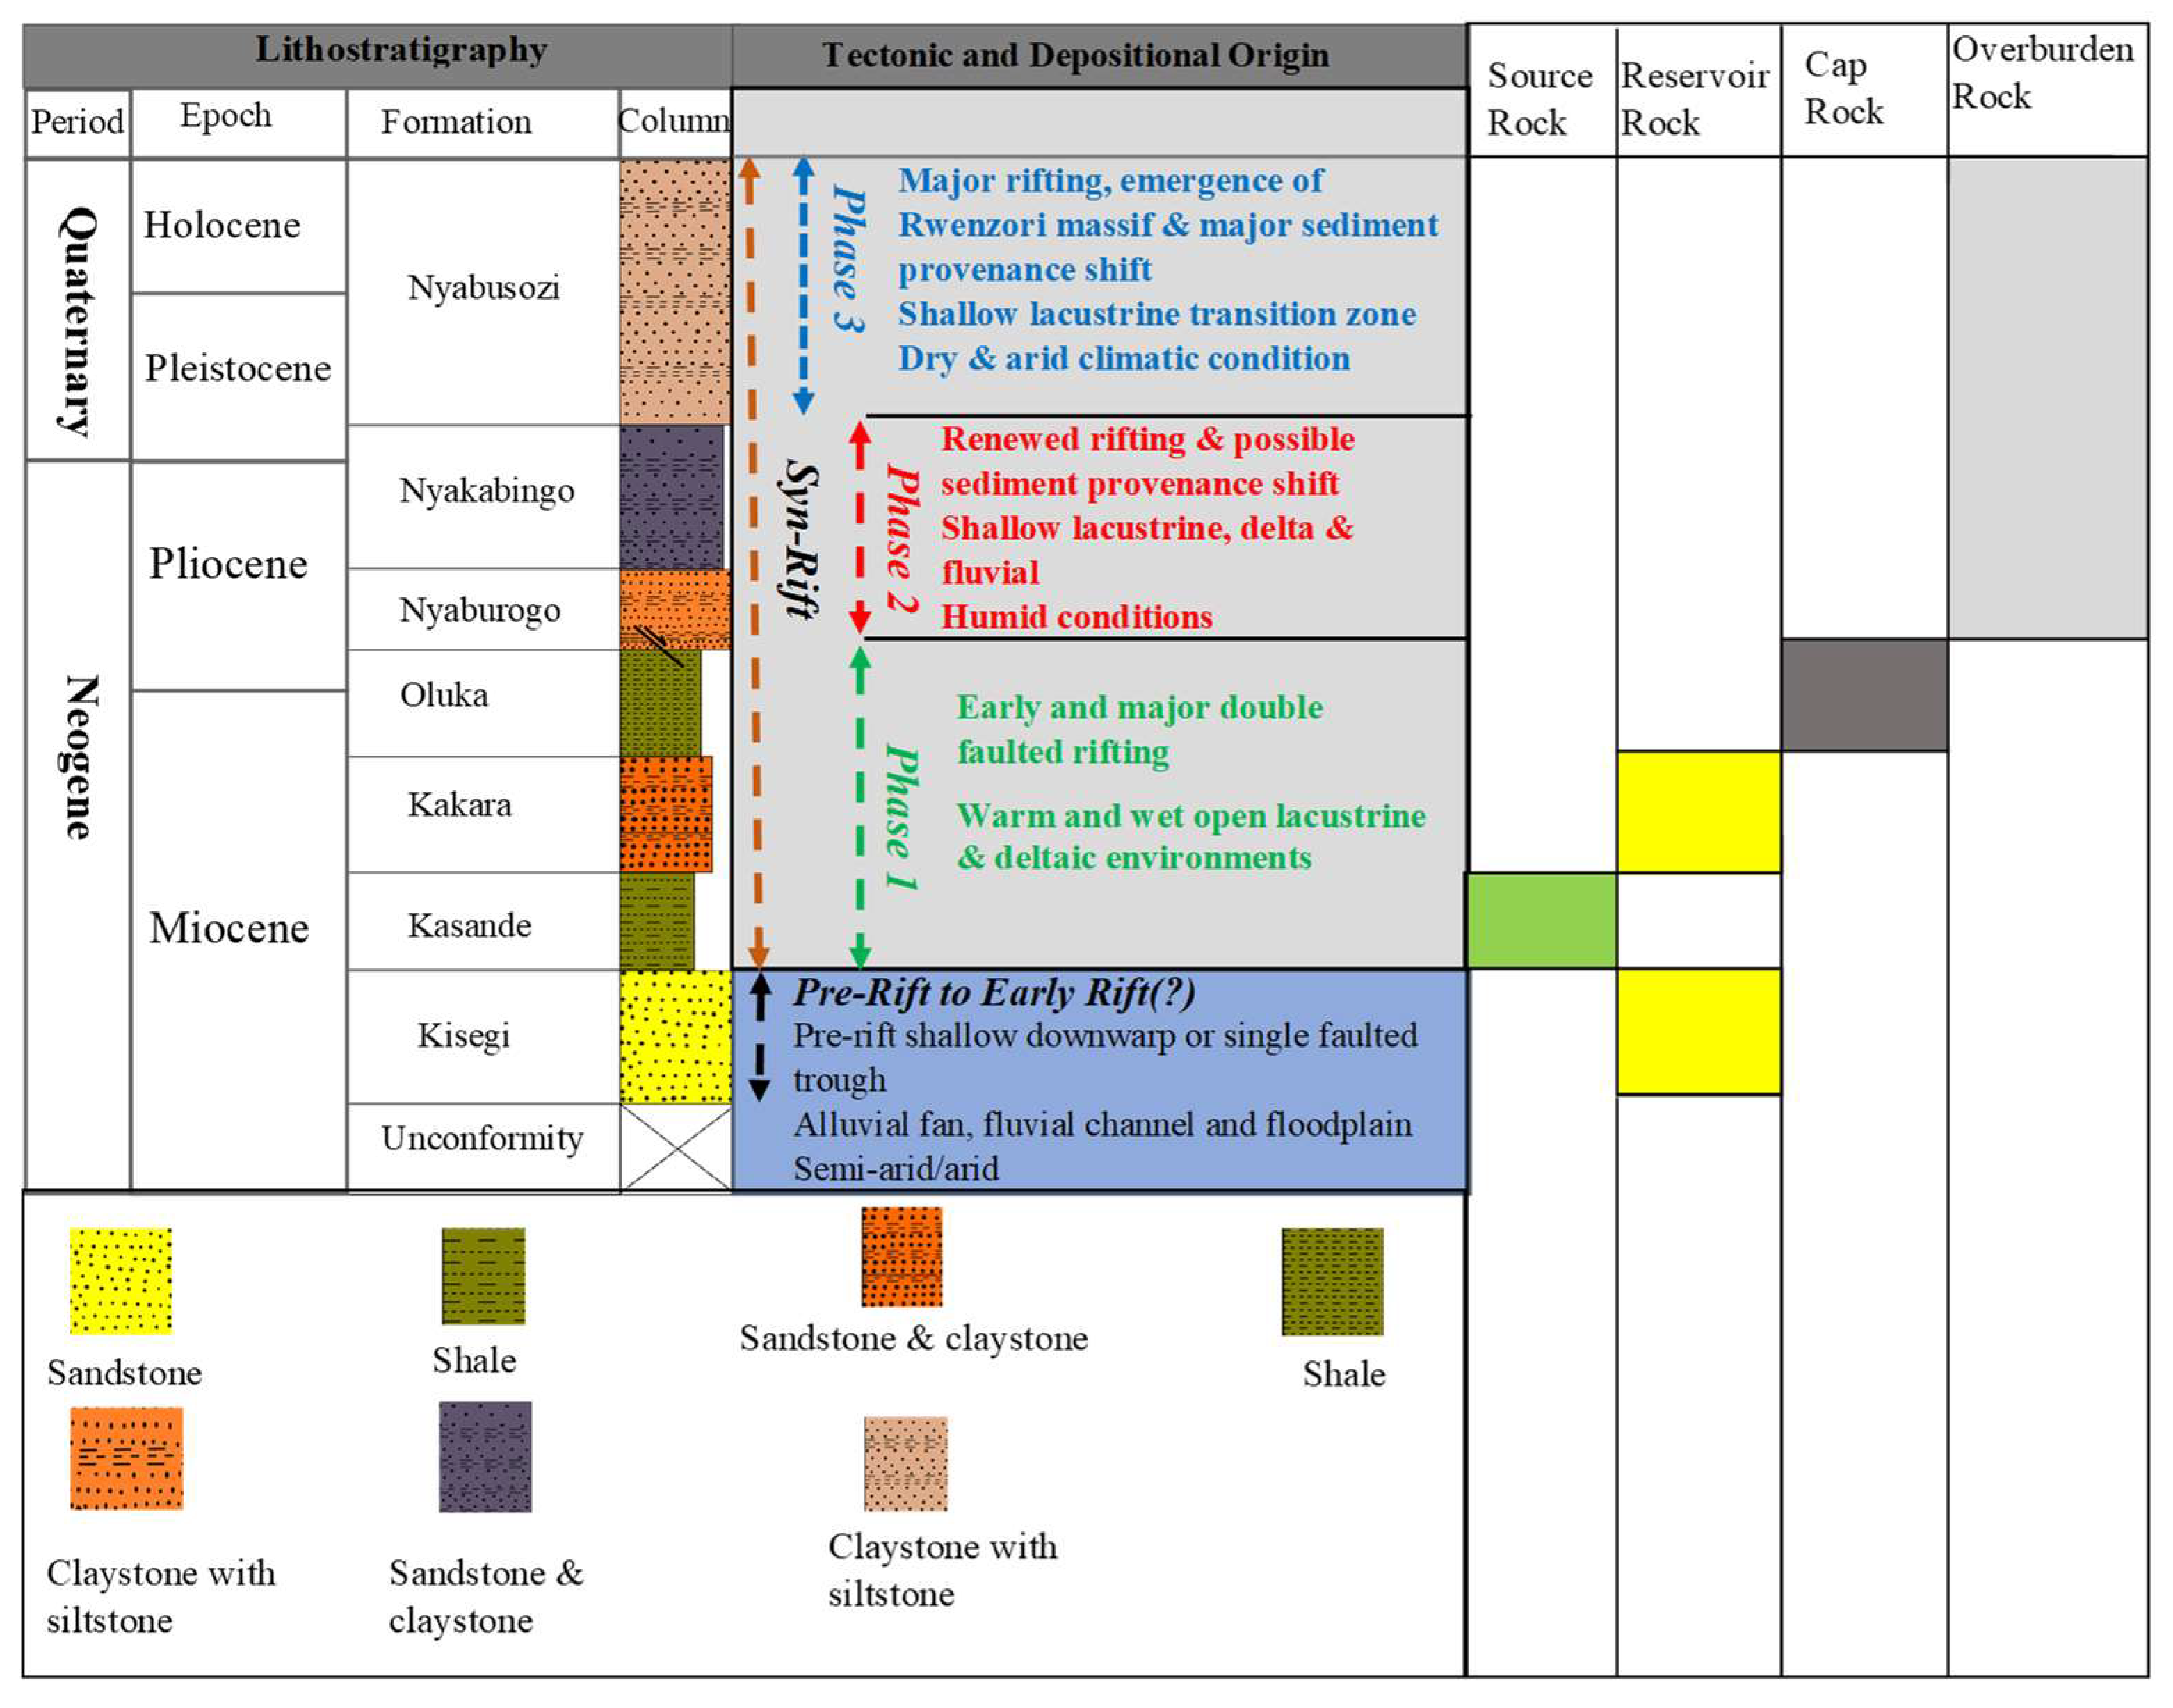
3.2.1. South Lake Albert Lithostratigraphy

The NW-SE cross-section along line A-B (Figure 2), generated from seismic and well data using the Midland Move 2015.1 software for the southern Lake Albert Basin, demonstrates a northwestward deepening and thickening of the basin and its stratigraphic units away from the rift margin in the southeast (Figure 8). This pronounced feature is primarily attributed to neotectonic faulting. Additionally, the cross-section reveals the interplay of extension and compression, resulting in both a thinning and thickening of the strata. From the integration of this cross section, well reports and published data, the stratigraphic results were obtained as presented in Table 1 and Table 2.

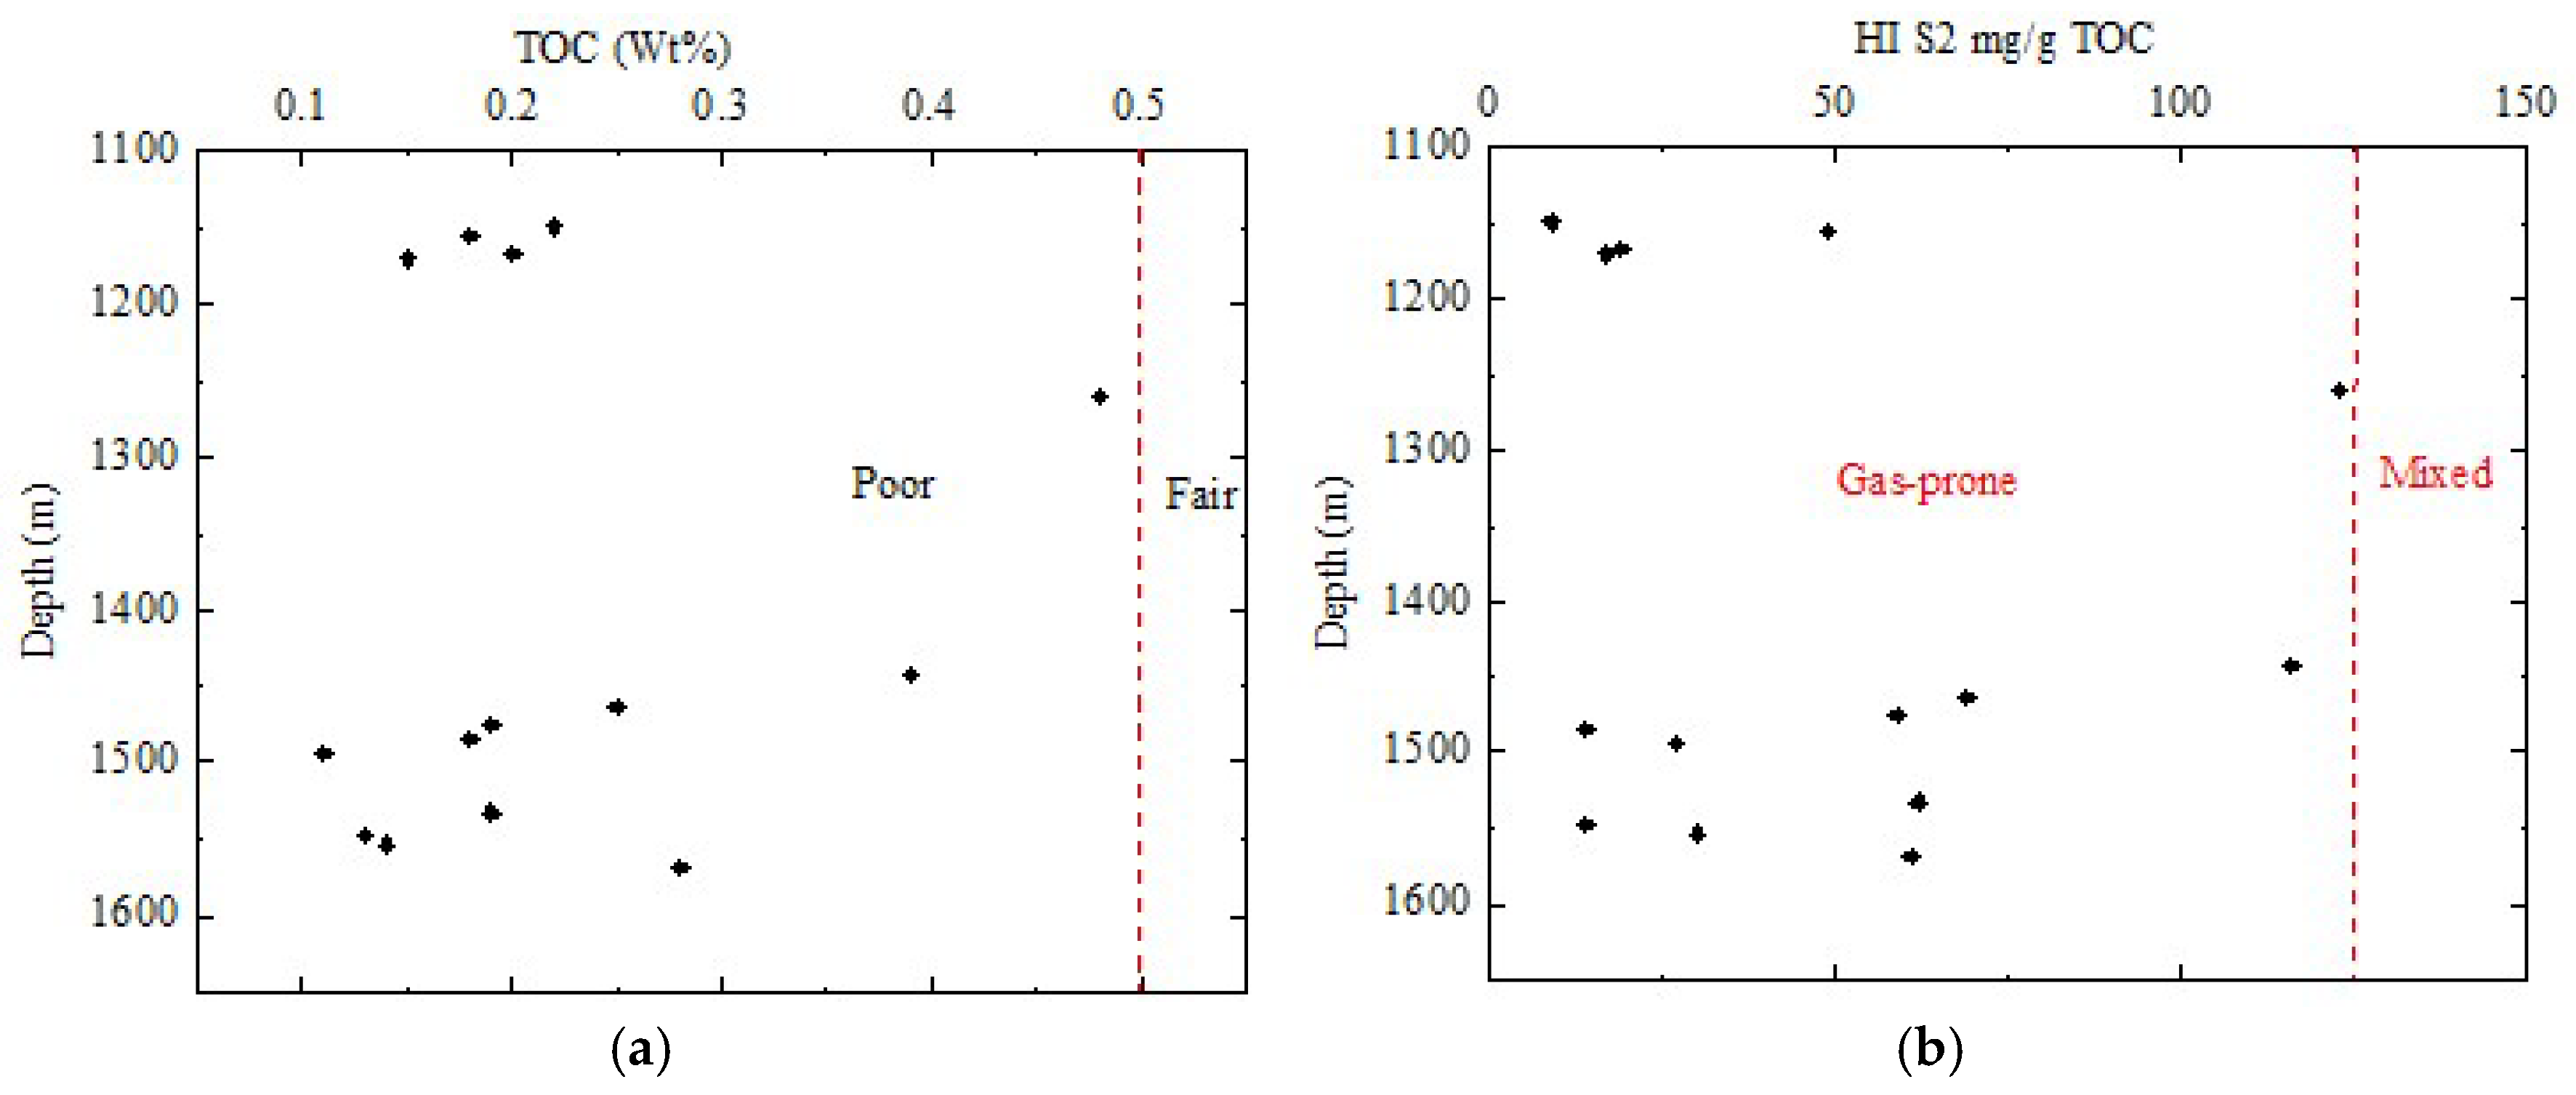
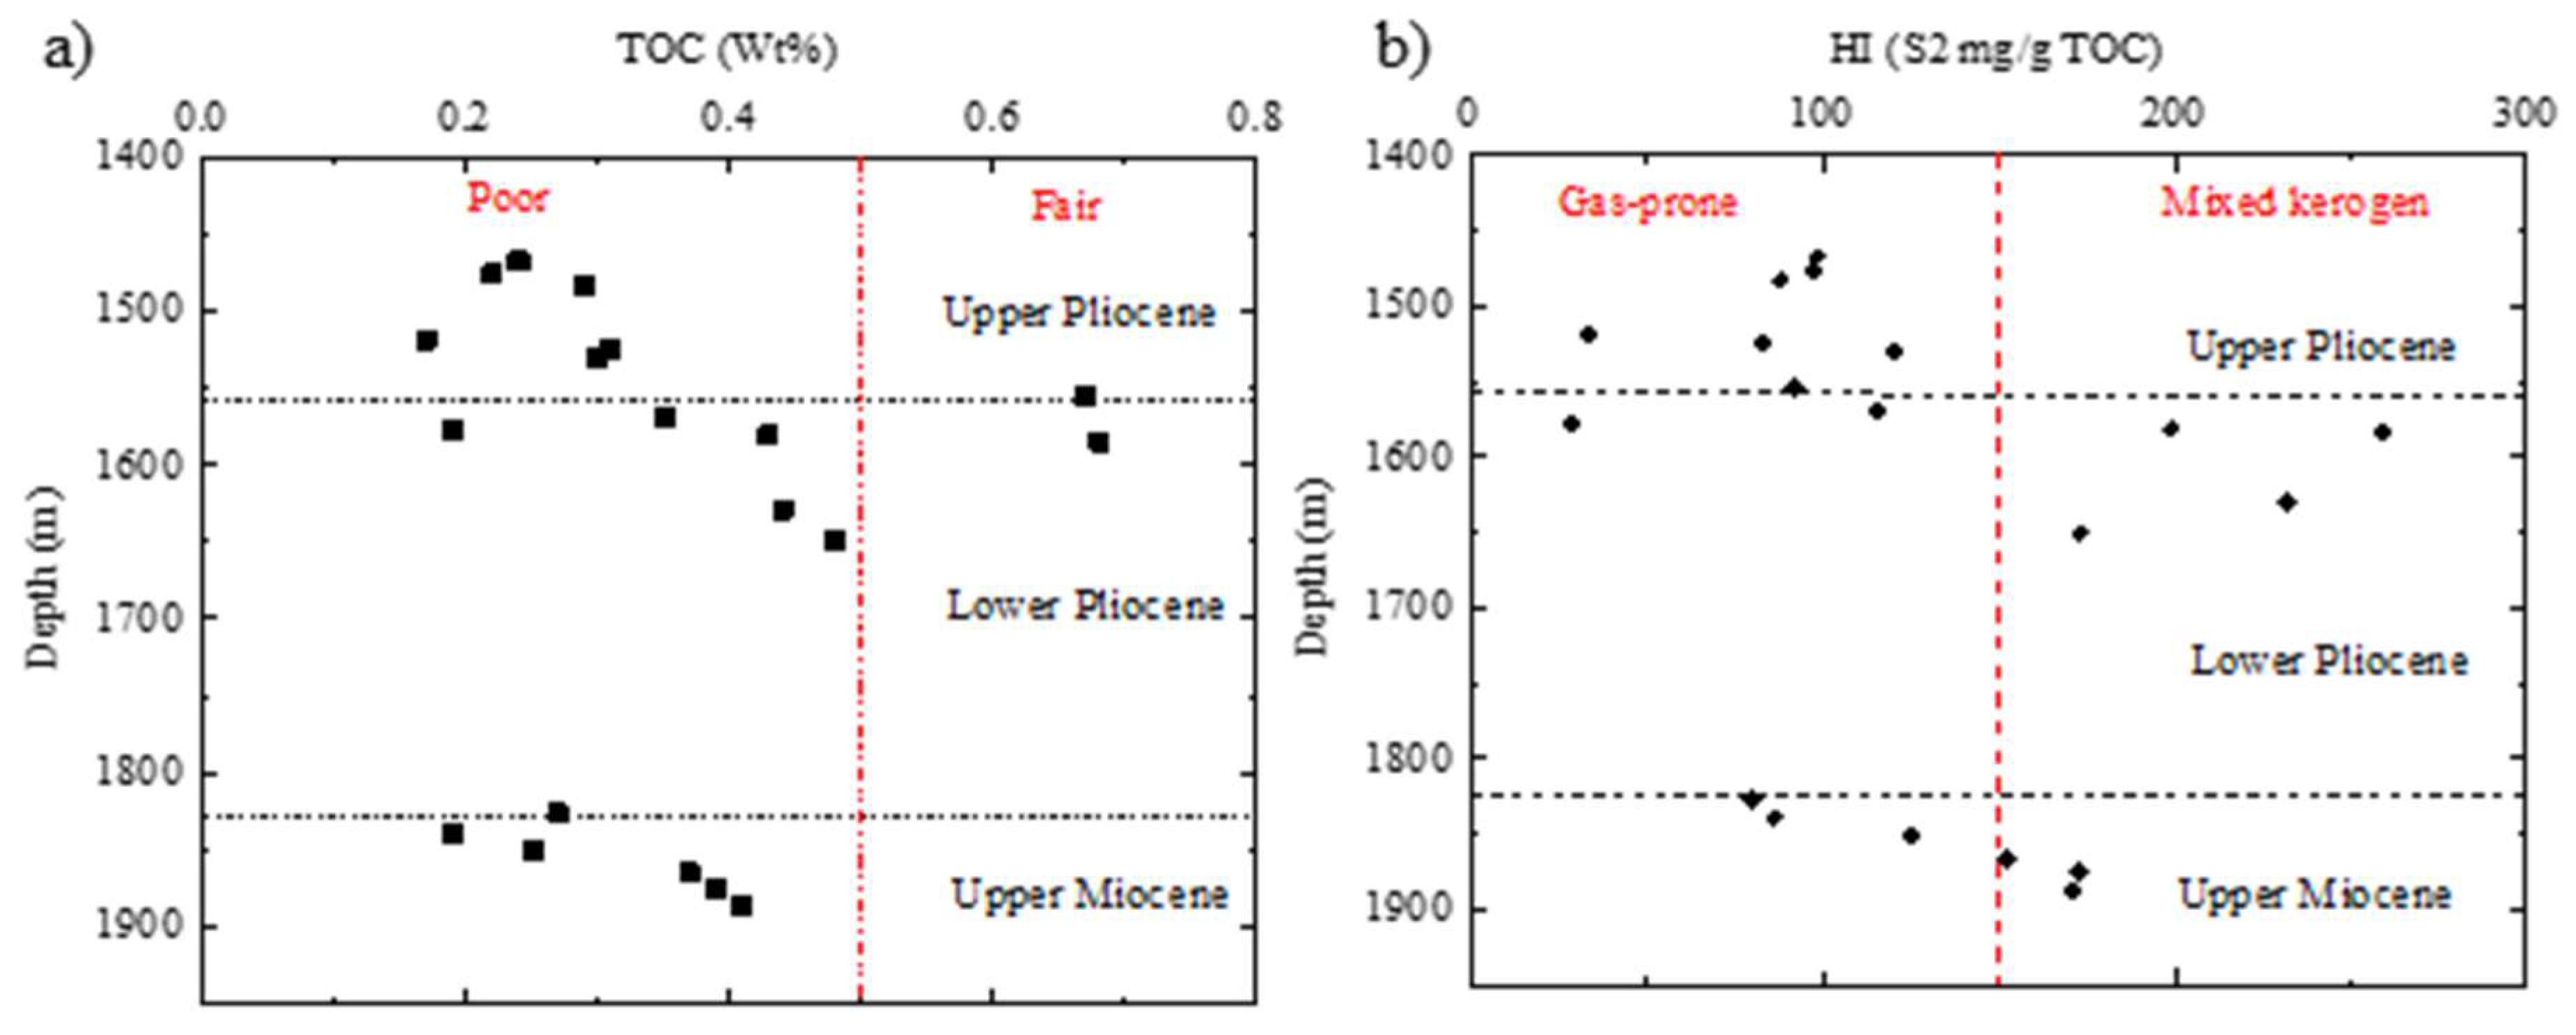
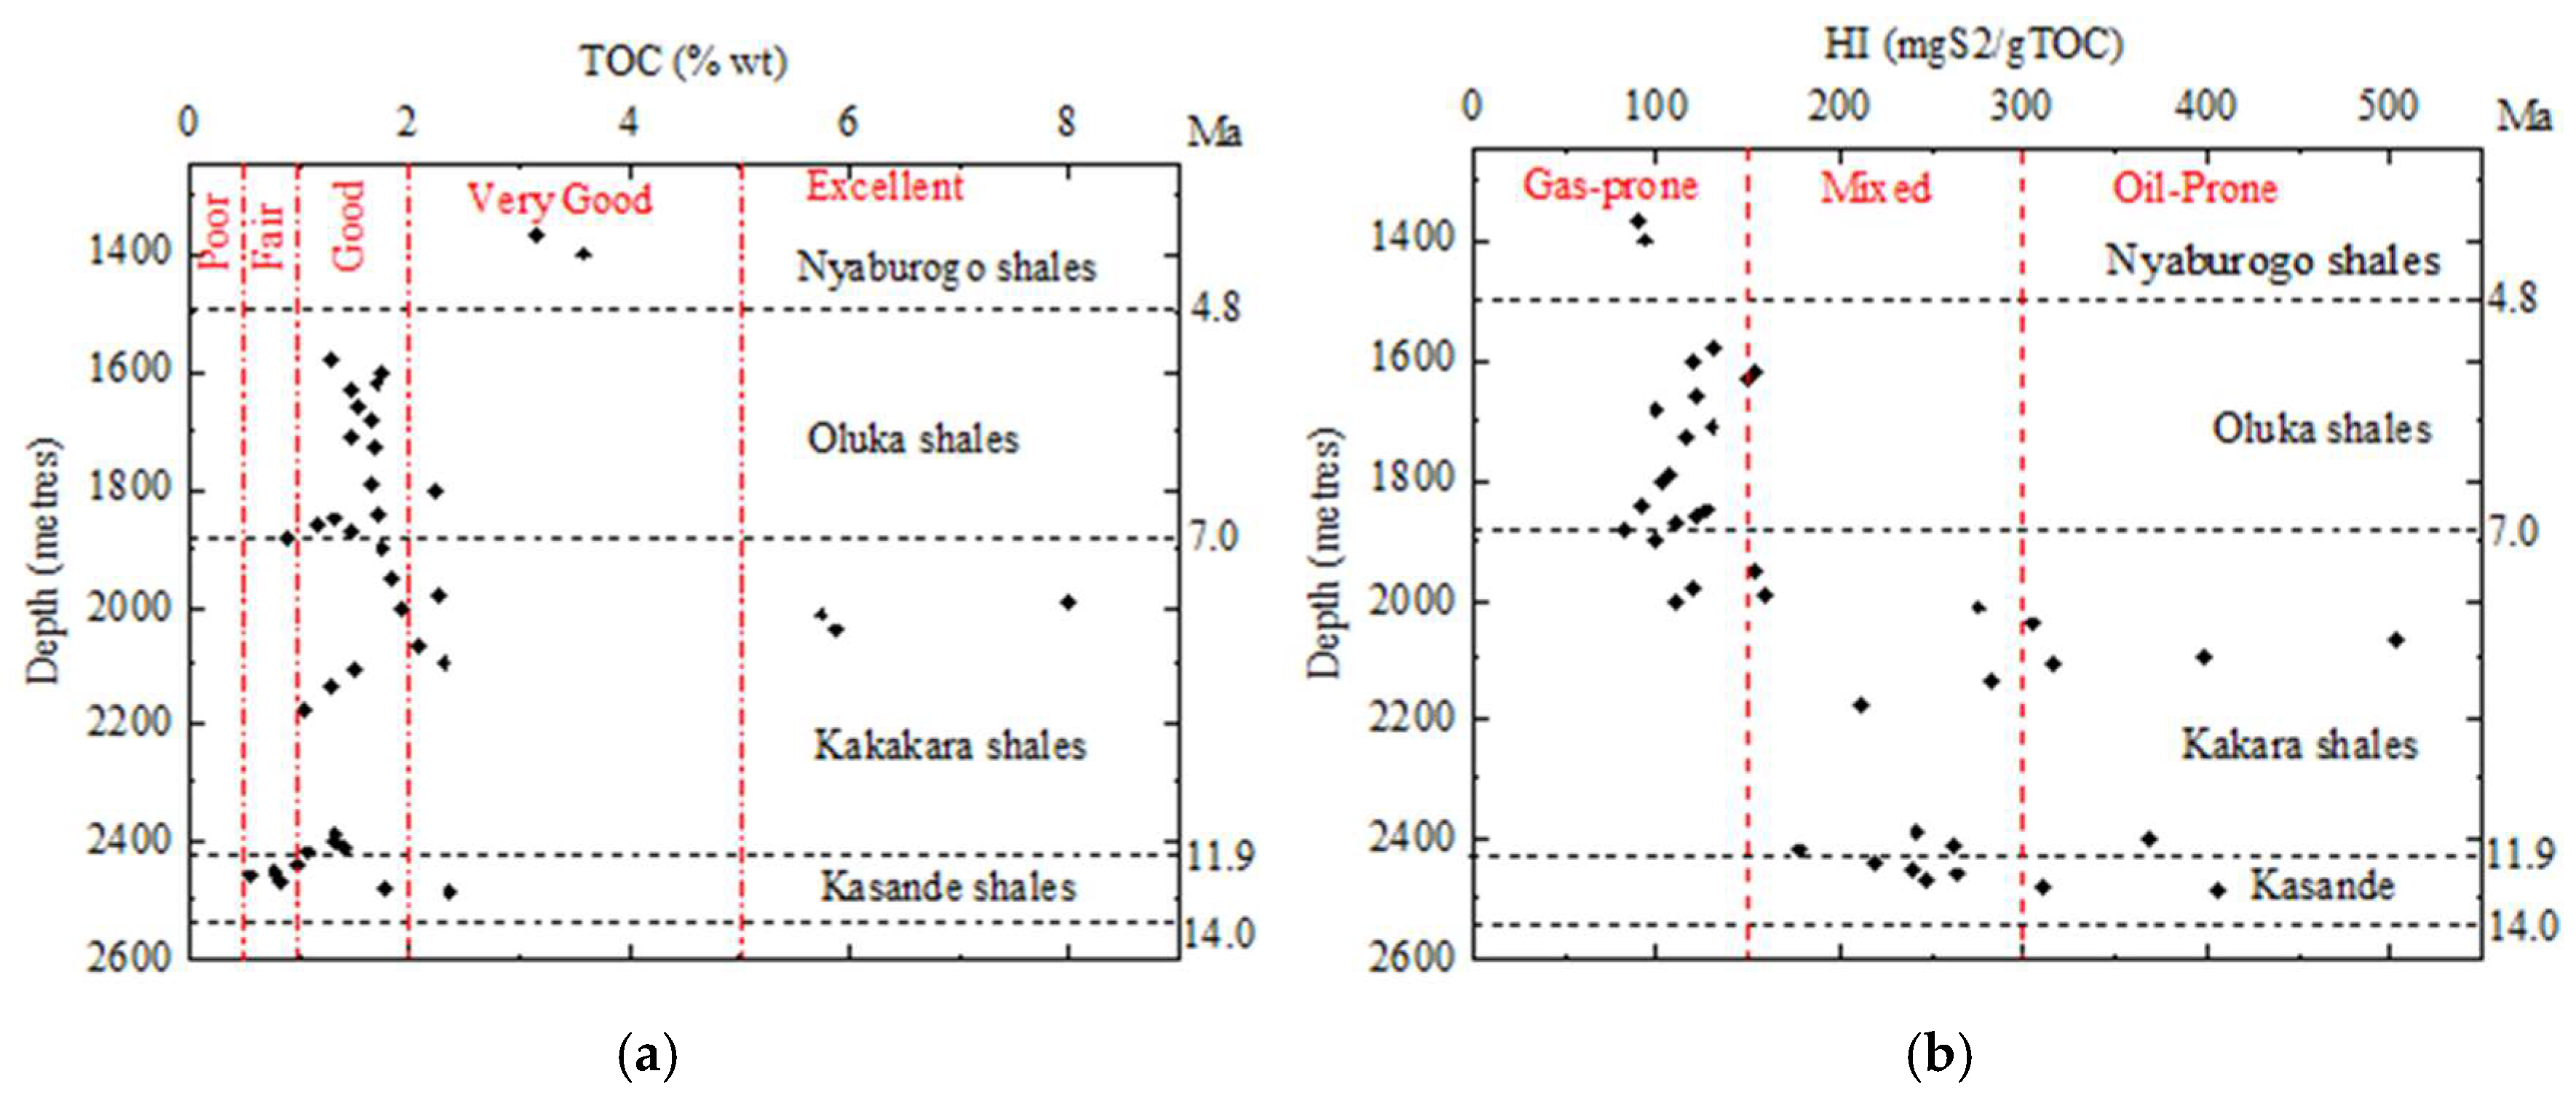
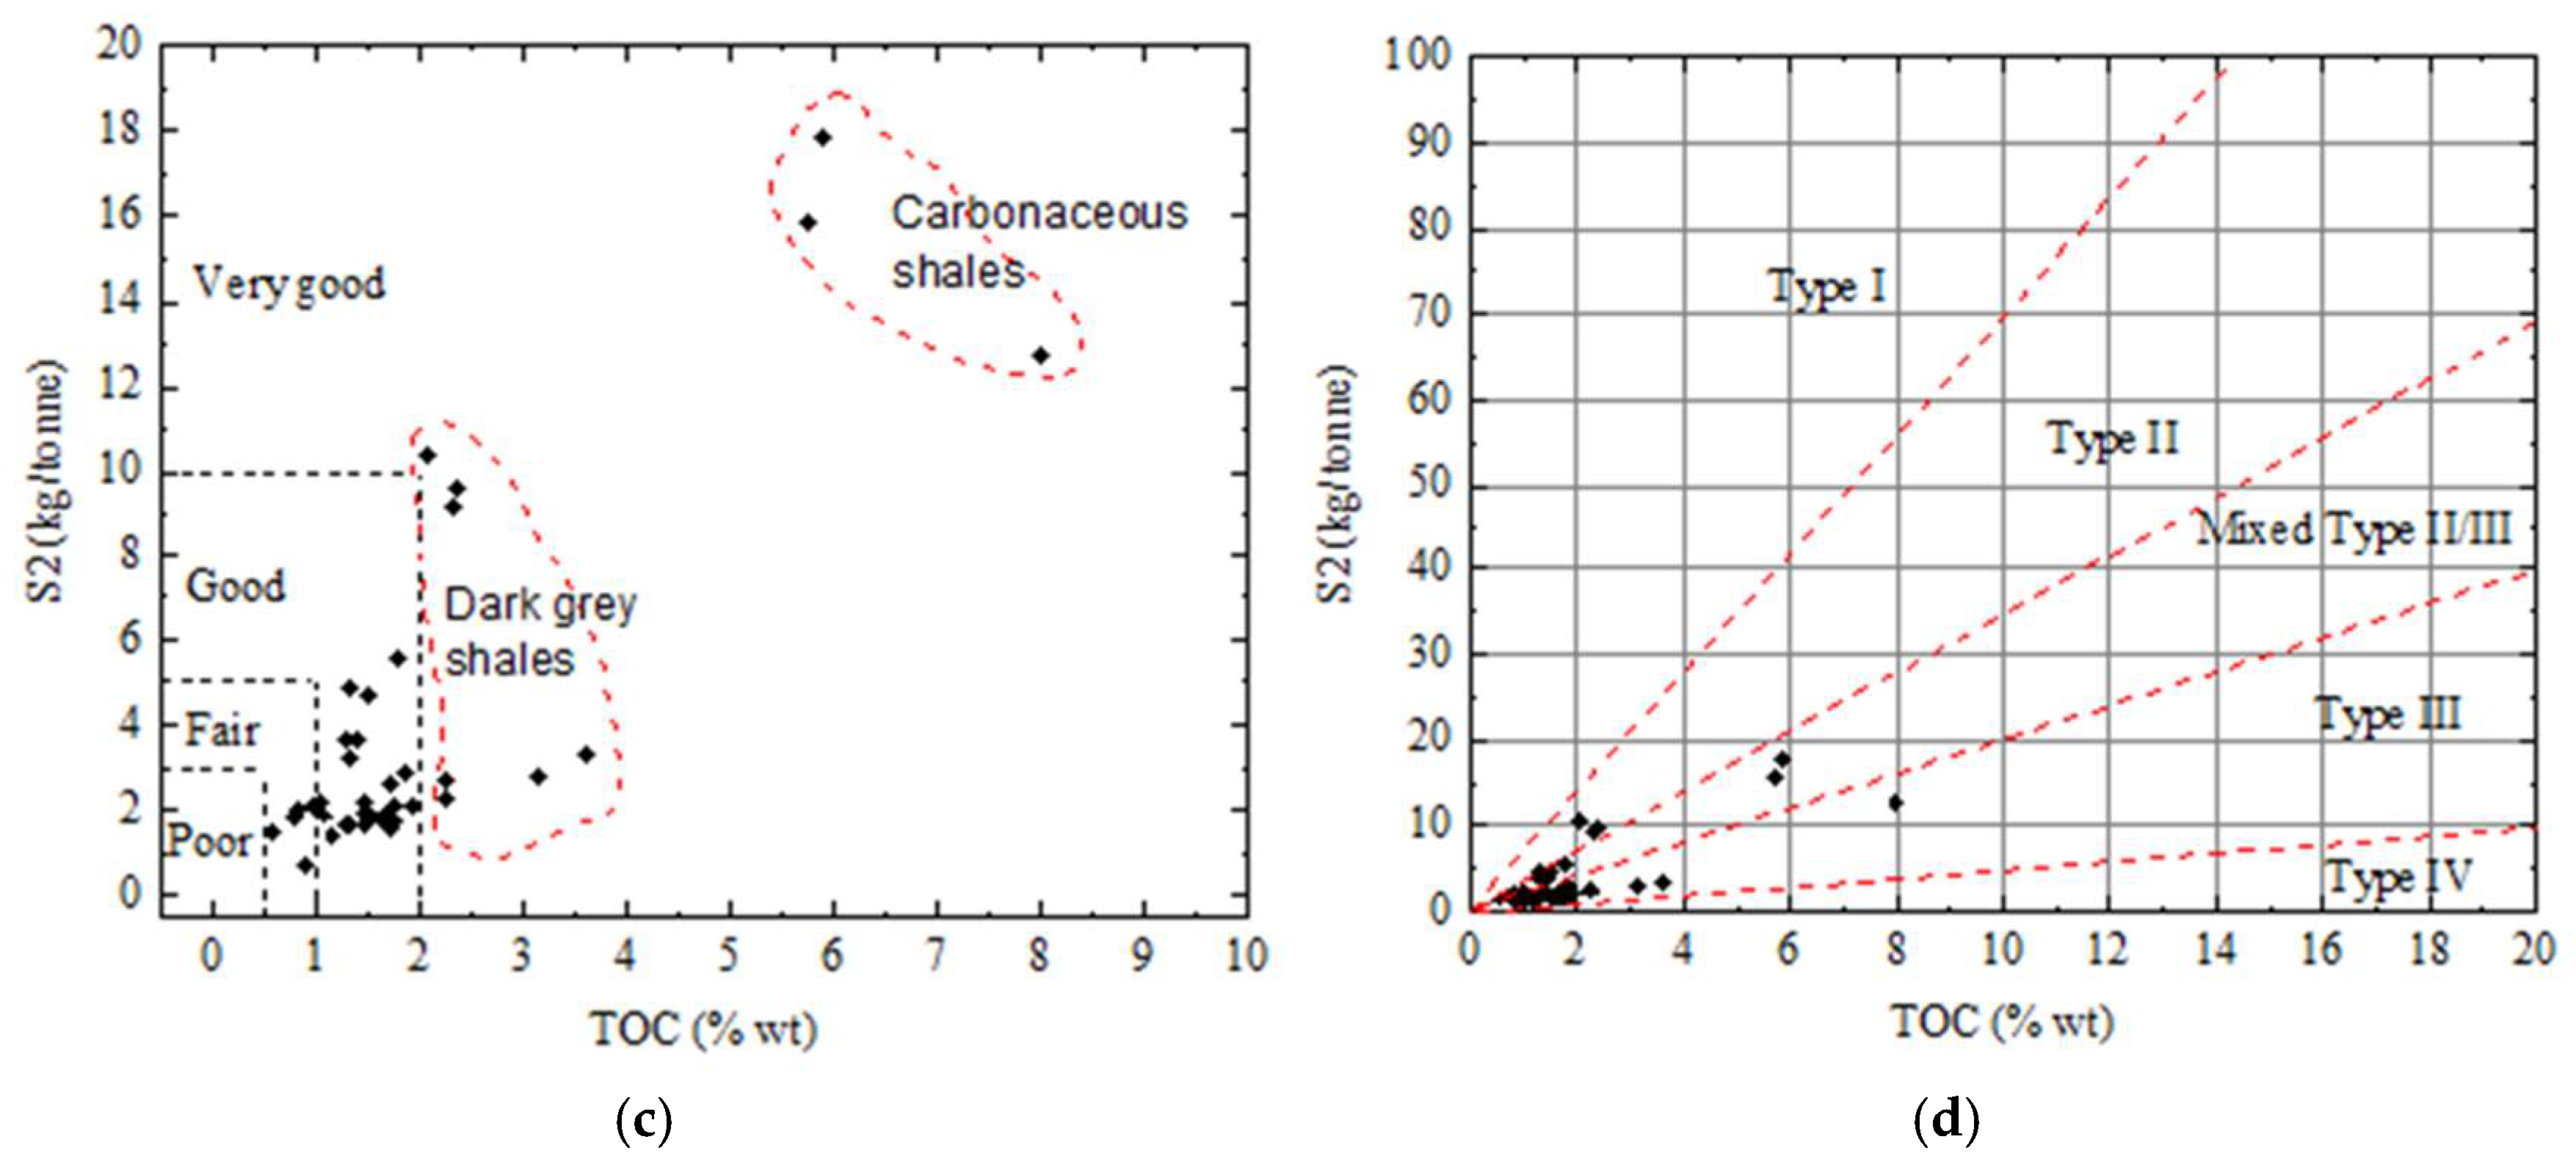
3.2.2. Source Rock Characteristics

Our analysis of the Rock-Eval pyrolysis data revealed crucial parameters indicative of organic richness, thermal maturity, and depositional environment. The parameters include the Total Organic Carbon (TOC) content, S1 and S2 peak areas representing free and kerogen-bound hydrocarbons, respectively, as well as Tmax values reflecting thermal maturity. Additionally, Hydrogen Index (HI) offers insights into the type and quality of organic matter and the presence of mineral matter. These parameters collectively provide a comprehensive understanding of the organic composition and thermal history of the analyzed samples. These parameters are provided in the respective tables and plots for each well.
In the NGJ well, the total organic carbon (TOC) contents range from 0.11% to 0.48%. Hydrogen index (HI) values vary between 9 mgHC/g TOC and 123 mgHC/g TOC. Tmax values range from 345°C to 424°C. Additionally, the S1 and S2 values are in the ranges of 0.00—0.03 mg/g and 0.02 — 0.6 mg/g, respectively. The samples also exhibit production index (PI) values ranging from 0.01 to 0.32 (Table 3).
In the KWB well, the total organic carbon (TOC) contents range from 0.17% to 0.68%. Hydrogen index (HI) values vary in the range of 28—259 mgHC/g TOC. Tmax values range from 403°C to 433°C. Additionally, the S1 and S2 values are in the ranges of 0.00—0.21 mg/g and 0.05—1.75 mg/g, respectively. The samples also exhibit production index (PI) values ranging from 0.02 to 0.13 (Table 4).
Based on the tables and cross plots, the NGJ samples fall in the poor and gas-prone organic matter zones (Figure 9 a & b), while the KWB samples plot in the poor and fair gas-prone zones, albeit skewed towards poorness (Figure 10 a & b).
Conversely, the plots for the data picked from TRC well reports fall in the mixed fair, good, and very good categories based on the classification of Dembicki [39], with organic matter displaying tendencies towards oil-proneness, mixed, and gas-proneness (Figure 11 a, b, c & d).

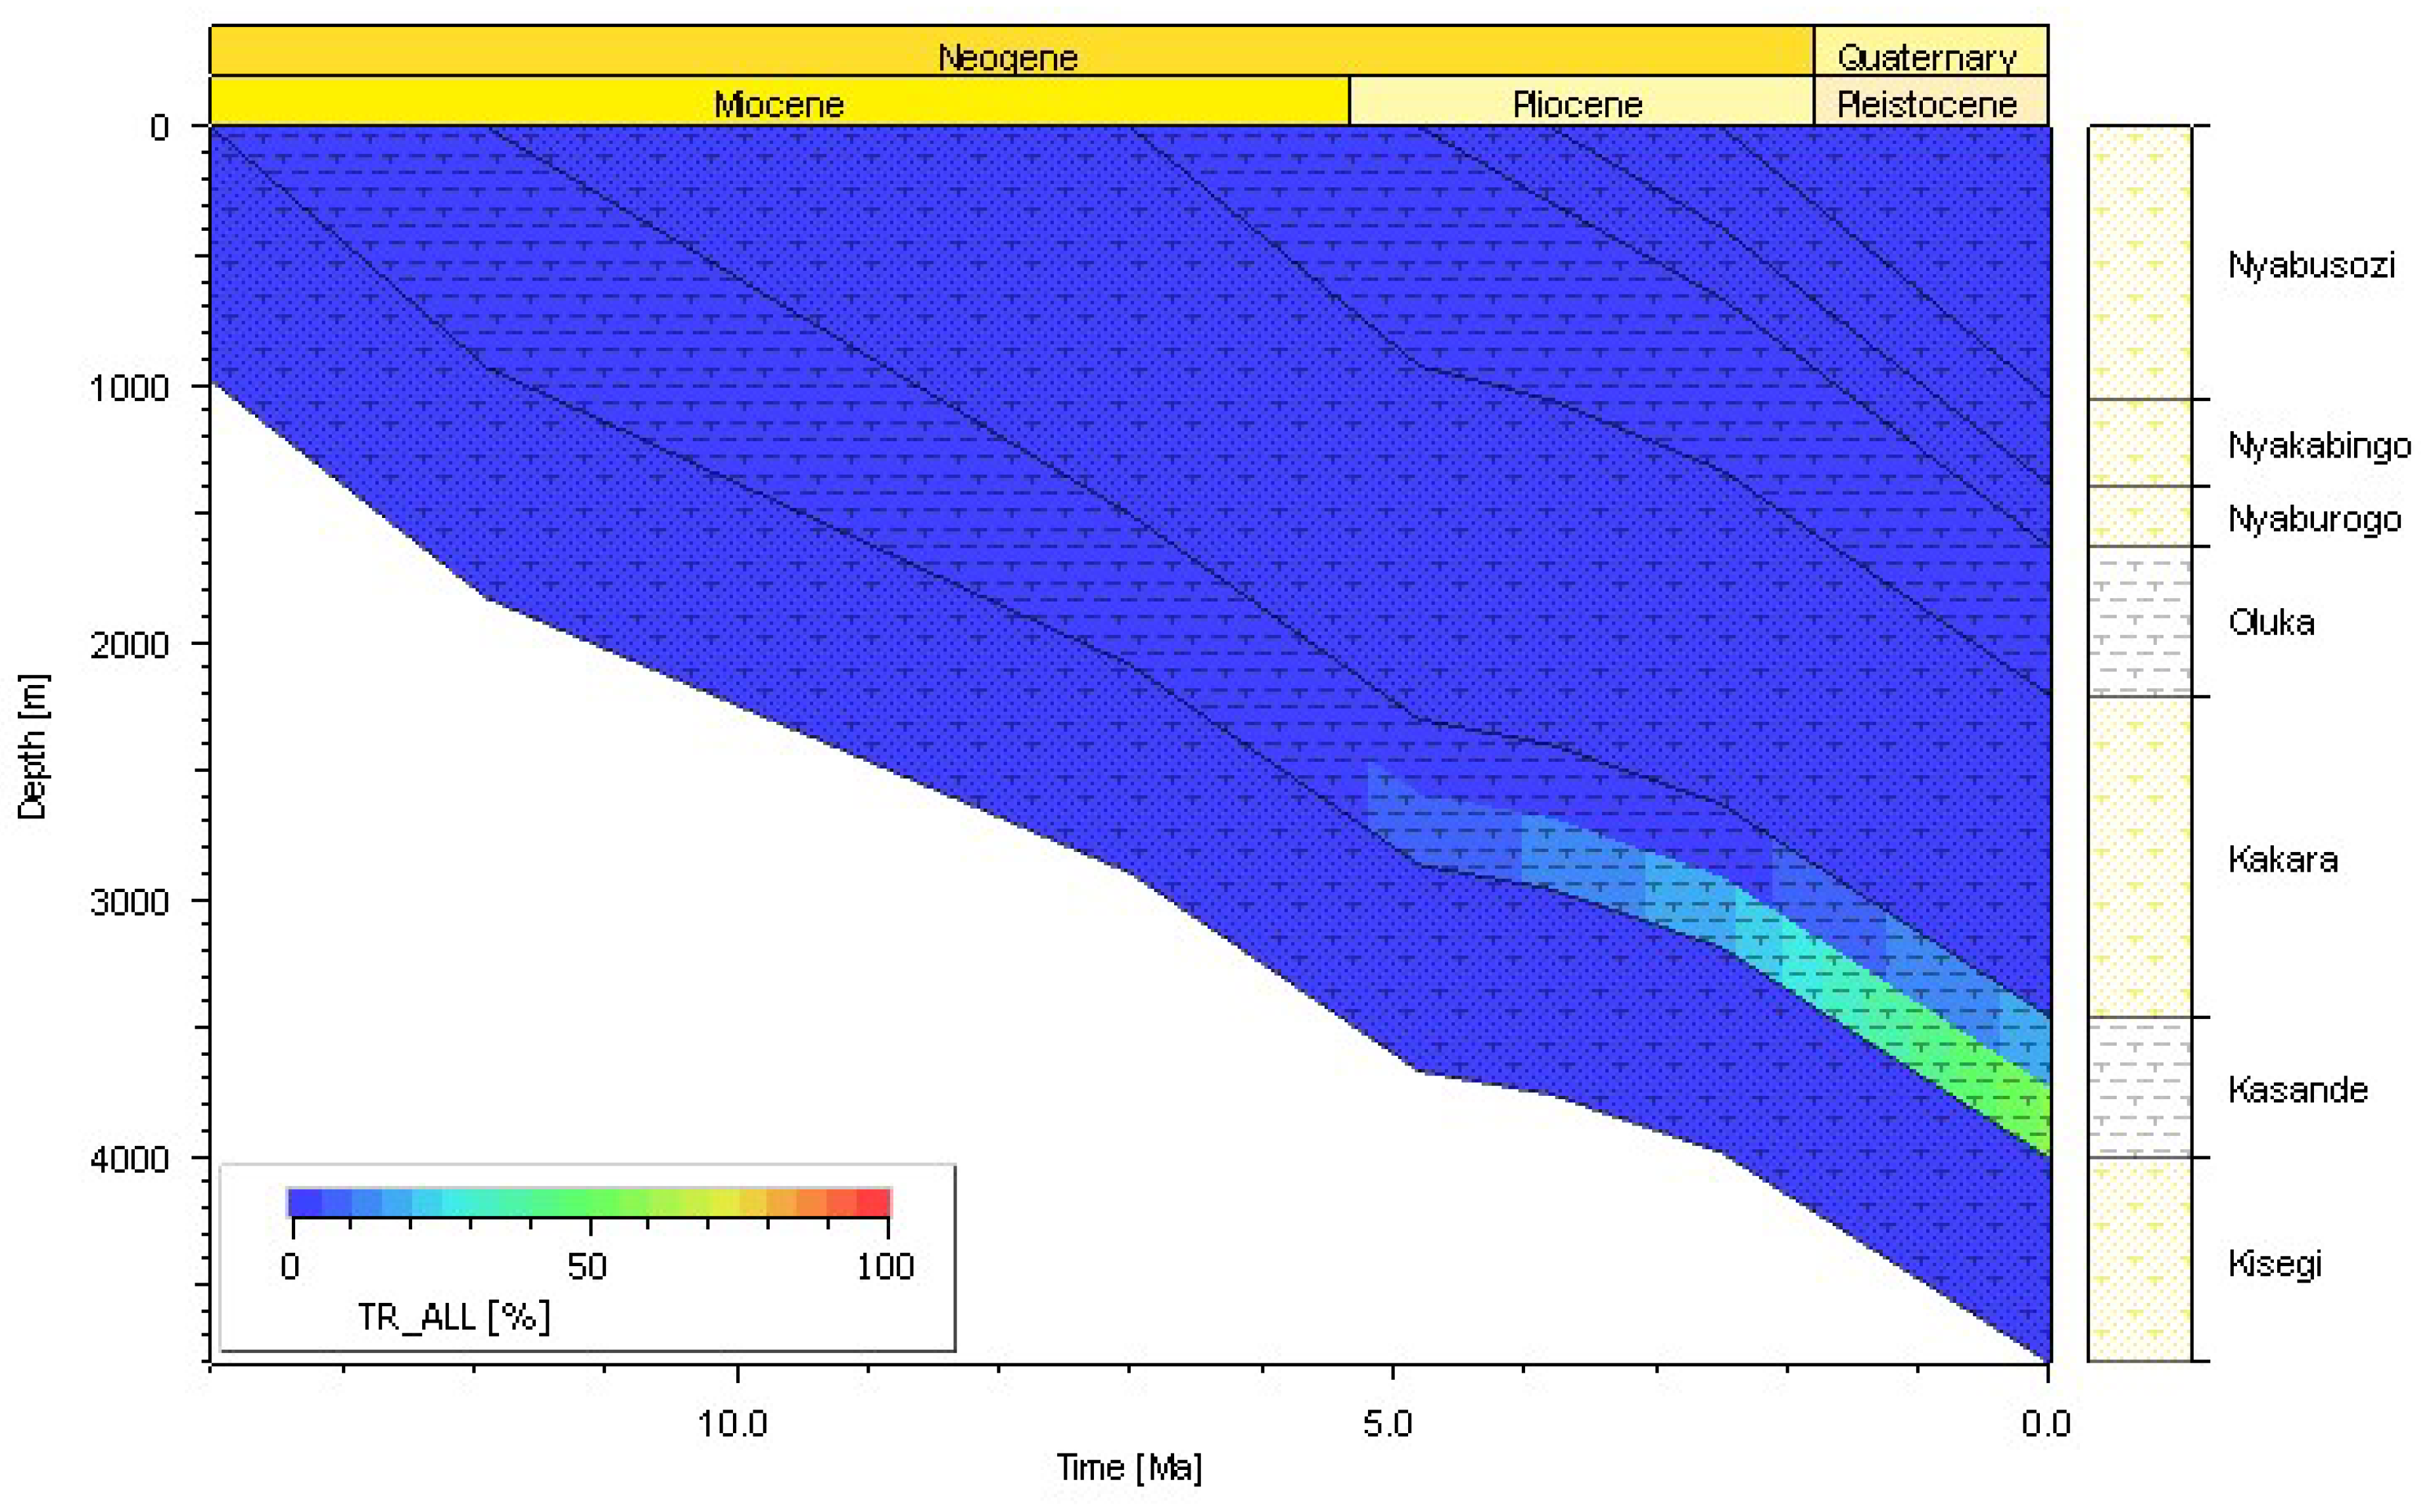
3.2.3. Burial and Thermal History

The burial history curves for the TRC well reveal four distinct subsidence phases, while pseudo Well X shows five distinct phases. The first phase exhibits slow subsidence rates from the Mid Miocene to the beginning of the Upper Miocene. This is followed by increased subsidence rates from the Upper Miocene to the Early Pliocene. The Early to Late Pliocene witnessed a slower subsidence rate compared to the previous phase, which was then followed by an accelerated subsidence throughout the Pleistocene (Figure 12 & Figure 13). Well X follows the same trend though with five phases.
Regarding thermal maturity, in the Well TRC, the top of the lacustrine shale source rock (2425 m), the Vr is 0.50% Ro while at the base of the source rock (2540 m), the Vr is 0.53% Ro (Figure 14 b). These Vr values indicate that the source rock is in the early stages of oil generation, approaching the onset of peak oil generation. For Pseudo Well X, the top of the Source Rock (3456 m) shows a Vr value of 0.66% Ro while the base of the Source Rock (4008 m) has a Vr value of 0.84% Ro (Figure 15). These values indicate the source rock is in the late stages of peak oil generation.

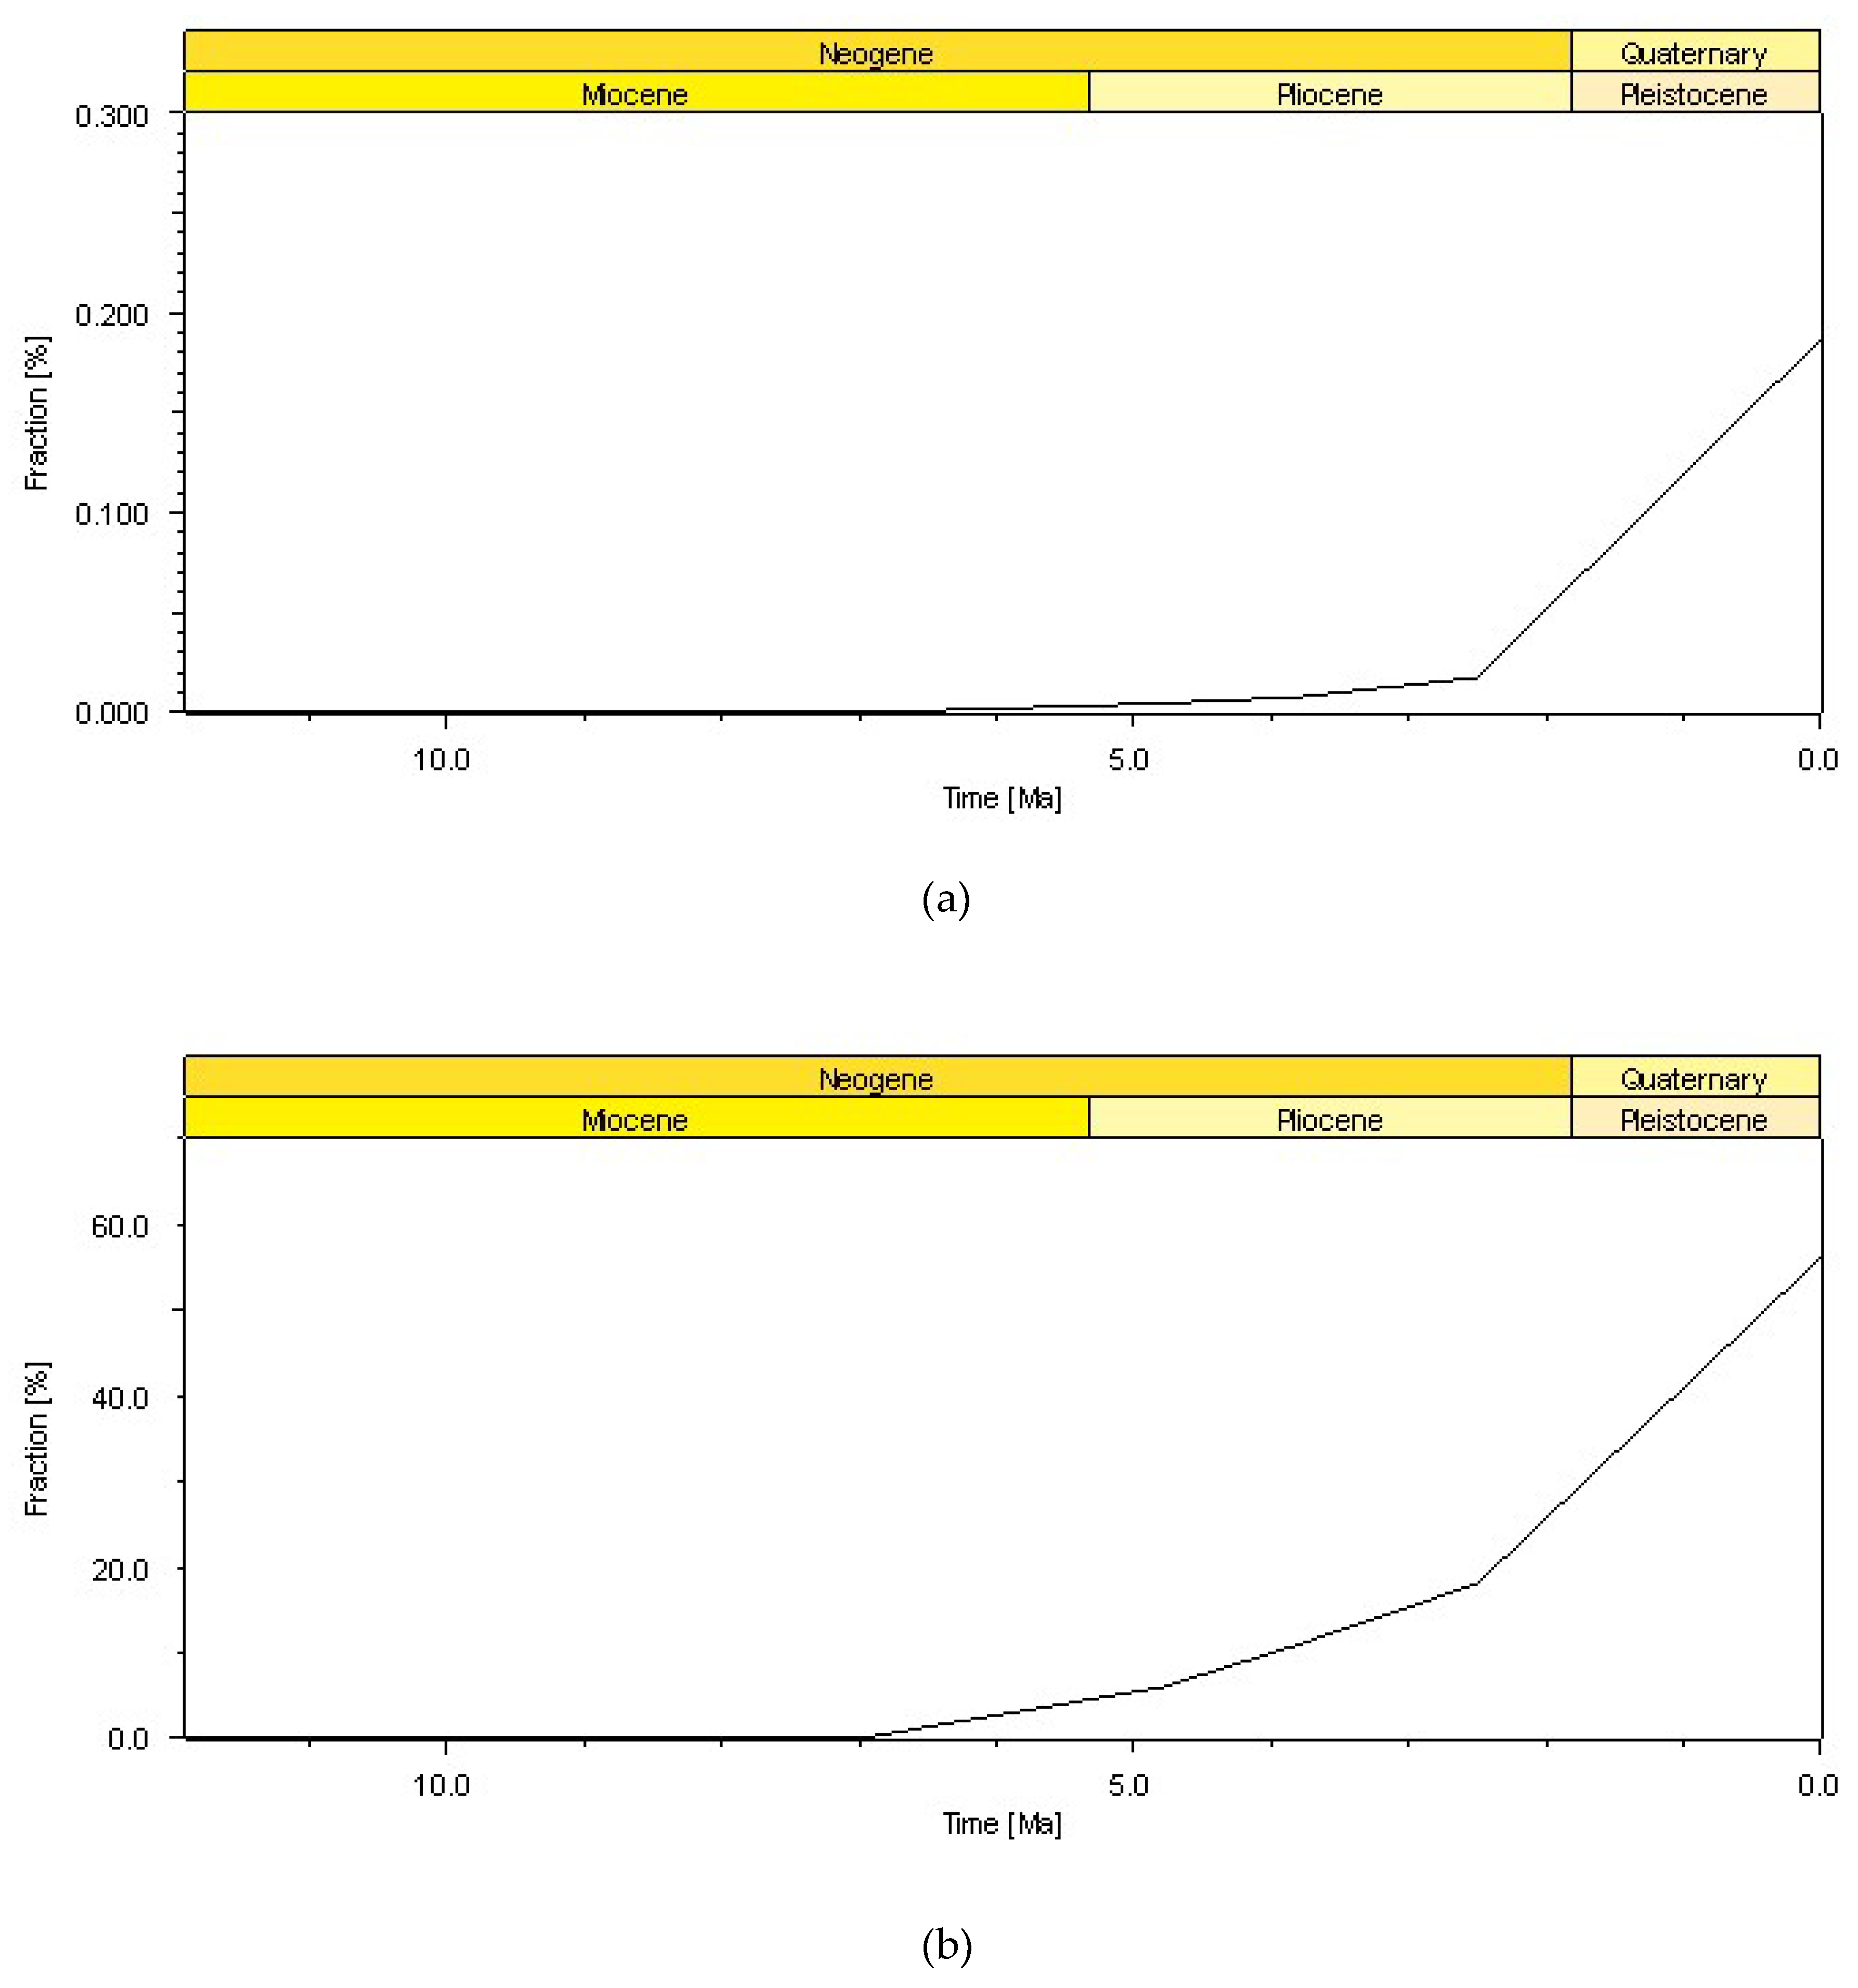
3.2.4. Hydrocarbon Transformation

The modeling results for two wells reveal distinct transformation and hydrocarbon generation histories as sediments deepen towards the depocenter in the northwest. For the TRC well, the transformation of kerogen into hydrocarbons is minimal, with a current transformation ratio (HTR) of approximately 0.2 % to 0.3 % (Figure 16 a). At Well X, located 12 km northwest of the TRC Well, the current source rock HTR is 60%, meaning that 60% of the original kerogen has been converted into hydrocarbons (Figure 16 b & Figure 17). At approximately 4.1 million years ago, HTR was 10%, indicating that hydrocarbon generation had increased significantly over that time period. At approximately 0.46 million years ago, HTR had increased to 50% showing a more rapid increase in hydrocarbon generation closer to the present.

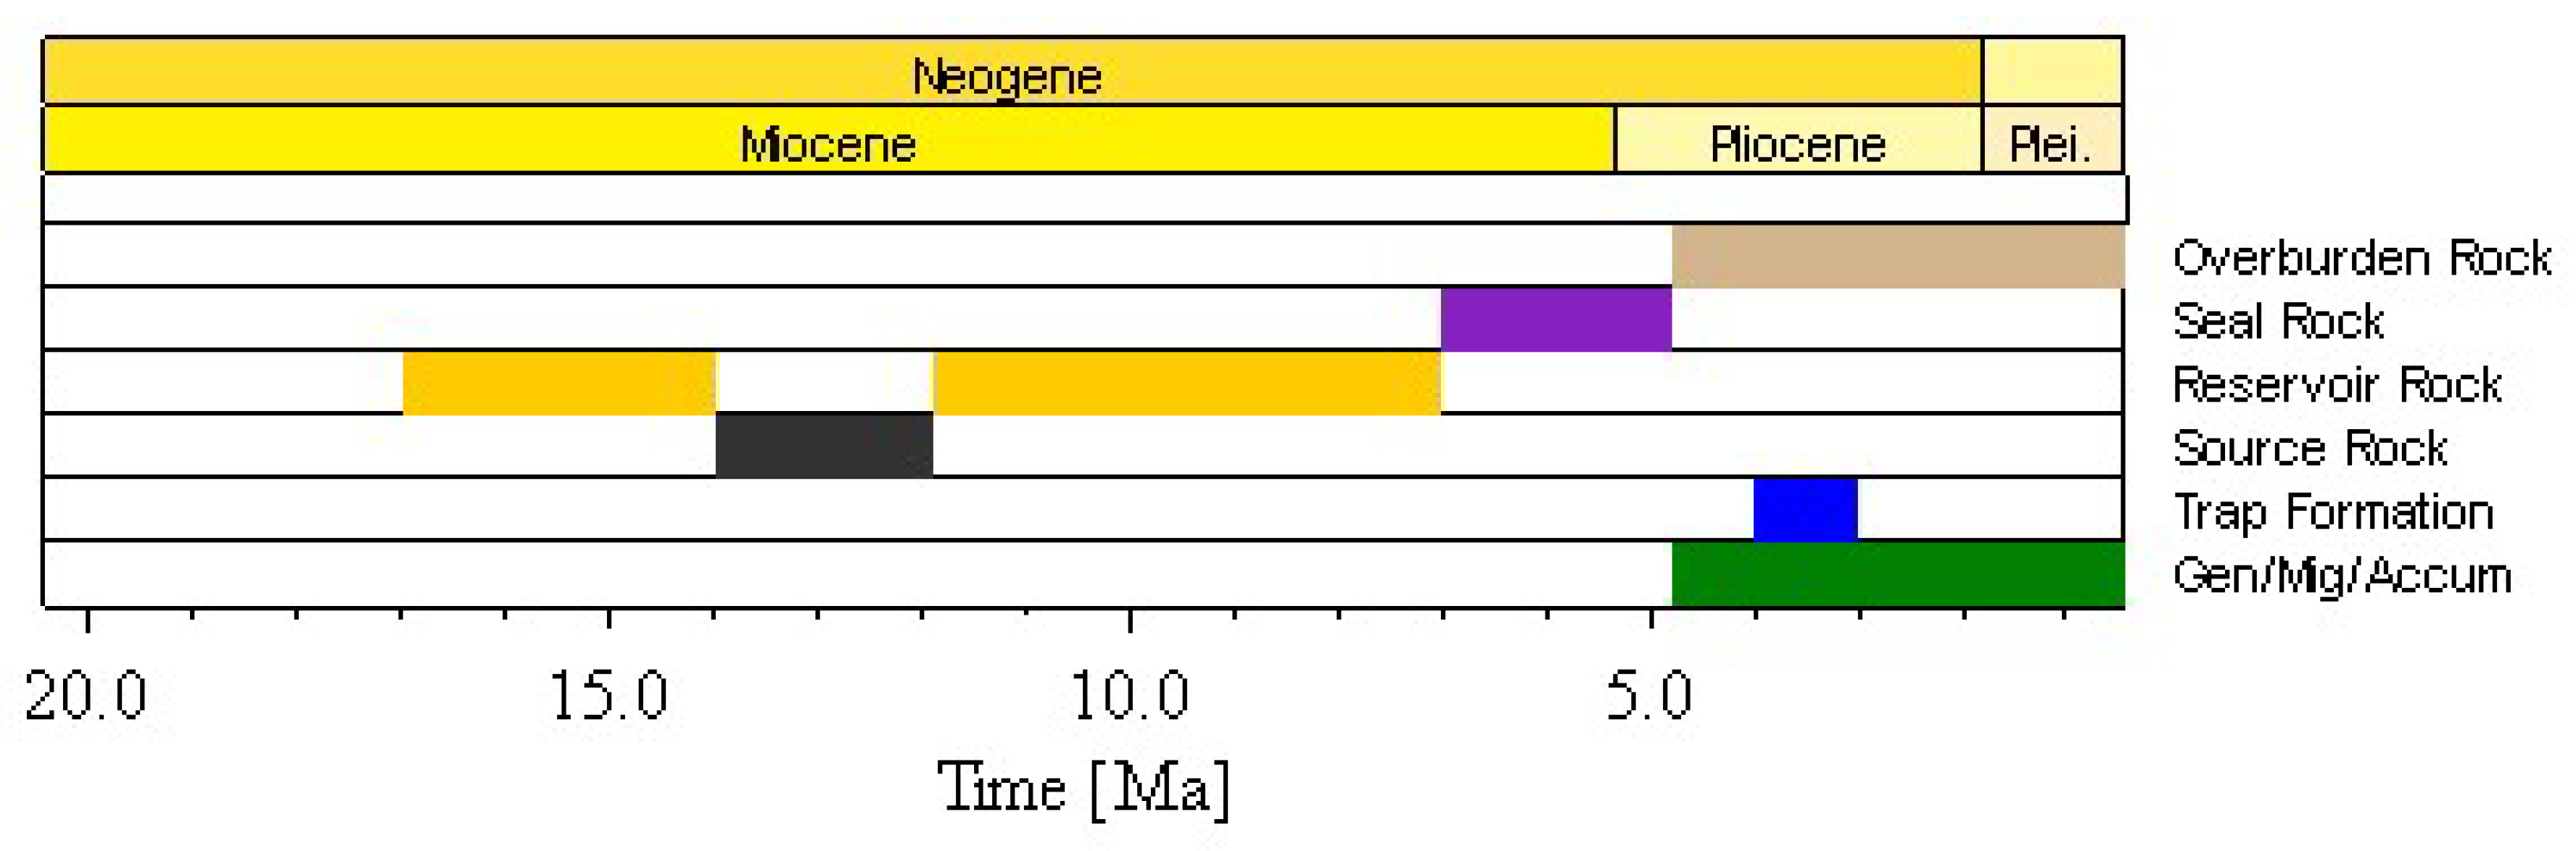
3.2.5. Petroleum System Elements

Petroleum system analysis reveals a complex interplay of elements within the Albert Rift basin. Key reservoirs identified include the Early Miocene Kisegi Formation, late Miocene Kakara Formation, and overburden formations such as the Mid Pliocene to recent Nyaburogo, Nyakabingo, and Nyabusozi formations. Source rock analysis highlights the significant role of the Mid Miocene Kasande Shale, which reached optimal thermal maturity during the late Pliocene, facilitating hydrocarbon generation and expulsion. The Late Miocene-Early Pliocene Oluka Formation acts as an effective seal, maintaining hydrocarbon entrapment conditions. Structural traps, formed during the early Pliocene or earlier tectonic events, provide favorable reservoir compartments for hydrocarbon accumulation (Figure 18).

4. Discussion

4.1. Tectonostratigraphic Evolution

The analysis of all the available data shows that the Albert Rift originated as a localized Semliki shallow basin during the Early Miocene, dominated by fluvial sediment accumulation. It evolved into a lacustrine rift valley influenced by tectonic activity and climatic shifts, propagating north and south during the Upper Miocene and Lower Pliocene. The current rift-wide tectonostratigraphy shows temporal tectonics and sediment deposition younging away from the central Semliki valley, supporting this progression. Similar patterns are observed in other EARS segments, including the Kenya Rift and Lakes Tanganyika, Malawi, and Rukwa e.g. [40,41,42,43]. This initial localized evolution led to the deposition of organic-rich source rock facies in confined niches controlled by the lacustrine extent, crucial for petroleum generation.
The southern Lake Albert sub-basin has the most complete stratigraphy of the Albert Rift, with Early Miocene to Recent sediments accessible from outcrops and subsurface seismic and well data. This area hosts a sedimentary package of seven formations, each representing a particular depositional regime and time, forming a four- to five- tectono-sedimentary phases [16,19,22,24,25,44]. This tectonic history matches the study's modeling results, showing a slightly non-uniform subsidence history with four to five phases. The first neotectonics phase represents slow subsidence from the Mid Miocene to the beginning of the Upper Miocene. The second phase, from the Upper Miocene to the Early Pliocene, involved accelerated subsidence. These two phases probably coincide with the formation and evolution of a lacustrine rift recorded by the regional Lake Obweruka [16,24]. The third phase, from the Early to Late Pliocene, witnessed slower subsidence, and it is during this time, the separation of Lake Obweruka into Lakes Albert and Edward around 2.5–3.0 Ma is documented to have occurred [18,24,25]. Phase four involved accelerated subsidence from the Pleistocene to the present, coinciding with late regional rift shoulder uplift and tilting [24,25,45].

4.2. Source Rock Potential and Depositional Environment

Geochemical data from the NGJ, KWB, and TRC wells provide insights into the depositional environments and source rock potential of the shales of the Albert Rift during the Miocene and Pliocene epochs. In the NGJ well, TOC values range from 0.11% to 0.48%, indicating poor source rock quality. HI values are in the range of 9—123 mgHC/g TOC, reflecting varying organic matter input, but exclusively gas-prone. The KWB well shows relatively higher organic richness, with TOC contents between 0.17% and 0.68% and HI values of 28—259 mgHC/g TOC, suggesting more oil-prone material compared to Well NGJ. In contrast, the TRC well exhibits significantly higher TOC values (0.56% to 7.99%, averaging 3.5%) and HI values of 89—502 mgHC/g TOC, with an average of 367 mgHC/g TOC, indicating good to excellent source rock potential. The Kasande-Kakara-Oluka-Nyaburogo shale intervals in Well TRC, spanning the Mid Miocene to Early Pliocene, are classified as good to very good source rock facies. The lower section (Mid Miocene) is predominantly oil-prone, while the upper section (Upper Miocene to Early Pliocene) is gas-prone. Organic microscopy of the samples as presented in the TRC well reports and other data shows a dominance of vitrinite and inertinite in the upper section e.g. [46], with the lower section containing strongly fluorescent algal kerogen, which explains the higher HI values.
The geochemical data and hydrogen index (HI) trends observed in the TRC well suggest a strong environmental control over the organic matter type and hydrocarbon generation potential. Based on the high HI values and the predominance of oil-prone kerogen in the lower section, it is prognosed that these intervals were deposited in a nutrient-rich, eutrophic zone of an open lake, with minimal fluvial input. Such depositional settings, characterized by low terrigenous plant material influx, are often associated with high algal productivity, as seen in global analogs like the Green River Formation in the U.S. and the Eocene Mahakam Delta in Indonesia, where lacustrine to marginal lacustrine conditions are conducive to the deposition of high-quality, oil-prone source rocks [4,47]. The restricted fluvial influence in the lower TRC intervals likely limited land plant detritus, resulting in predominantly algal kerogen and contributing to the oil-prone character of the source rocks.
In contrast, the upper section of the TRC well, with its lower HI values and gas-prone signature, suggests an increased fluvial input and a transition to shallower lacustrine or deltaic environments. This shift is consistent with the sedimentological and geochemical trends observed in other lacustrine basins within rifts [48] and the Triassic Newark Supergroup in the U.S., where deltas and shallow water environments tend to accumulate more terrestrial organic matter, favoring gas generation due to the higher proportion of vitrinite and inertinite from land plants [49].
The KWB and NGJ wells, with their relatively low HI values and predominantly gas-prone character, appear to have been deposited in environments with significant terrestrial plant input, likely deltaic or marginal lacustrine settings with swampy vegetation-rich conditions. The well report review for the NGJ well further supports this depositional interpretation, with evidence from palynomorph assemblages and lithological characteristics presented in this well report and our interpretations from the provided logs. These settings would be similar to the gas-prone source rocks observed in the deltaic sequences of the Niger Delta [50] and the Jurassic deltaic shales of the North Sea [51], where fluvial systems introduce abundant land plant detritus, resulting in gas-prone kerogen.

4.3. Subsidence History

The modeled TRC well data indicate a slow subsidence rate during the initial stages of basin development, between approximately 17 Ma and 8.0–7.0 Ma. While interpretations of this time period vary, it is broadly recognized as the early phase of rifting, characterized by low extensional rates and a correspondingly slow sedimentation rate e.g. [24,25]. This aligns with global and regional analogs of early-stage rift basins, such as the different segments of the East African Rift System, where tectonic stretching is gradual, leading to modest subsidence [48]. From 8.0–7.0 Ma to 4.0 Ma, the subsidence rate accelerates, reflecting increased tectonic activity and more rapid sedimentation, typical of a mature rifting stage. This acceleration is often associated with more pronounced extensional faulting and greater accommodation space for sediment deposition, comparable to phases observed in other rift settings like the northwestern Red Sea in Egypt [52].
Between 4.0 Ma and 2.5 Ma, subsidence rates decrease, possibly linked to a reduction in rift extension and fault activity, suggesting a temporary tectonic quiescence. This period likely corresponds to reduced sediment influx as tectonic uplift and subsidence slowed.
From 2.5 Ma to the present, subsidence rates again accelerate, coinciding with major tectonic events, including the documented uplift of the Rwenzori Mountains and significant subsidence of the rift floor e.g. [2]. This phase is associated with intensified rift tectonics and increased sedimentation rates, driven by both tectonic uplift and enhanced erosion, as documented in the Late Pleistocene [2,22]. These tectonic and sedimentary dynamics have been suggested and documented by several authors e.g. [24,25,53,54].

4.4. Thermal Maturity, Hydrocarbon Generation and Expulsion

Measured Ro values in Well TRC increase from 0.24% at 620 m to 0.47% at 2330 m, indicating that most of the well section is thermally immature for hydrocarbon generation. The top of the main oil generation window (Ro 0.5%) occurs at approximately 2500 m. Present-day geothermal gradient data suggests a higher maturity level than measured values, possibly due to recent increases in heat flow and geothermal gradient near geothermal springs and shallow magma chambers [55,56,57,58]. The current hydrocarbon transformation ratio (HTR) of 0.2%-0.3% for Well TRC reflects a low level of hydrocarbon generation, with ongoing maturation.
Pseudo Well X suggests that the source rock is in a peak oil window stage. The increase in Vr from 0.66% Ro at the top to 0.84% Ro at the base indicates deeper burial and higher thermal maturity. The current HTR of 60% reflects an advanced hydrocarbon generation, with rapid increases in recent thermal burial. The Kasande shale, with advanced maturation and high HTR in the deeper sections, is a mature source rock with substantial hydrocarbon generation potential. The progression of Vr and HTR over time indicates the presence of an effective hydrocarbon generation, likely to continue as it remains in the late stages of the oil window and approaches gas generation. This high HTR (60%) suggests a significant hydrocarbon expulsion, indicating potential for migration into nearby reservoir rocks. Future exploration should focus on identifying and assessing potential reservoirs and migration pathways to predict potential hydrocarbon entrapment. Modeling results show that the Albert Rift is a young petroleum system, with hydrocarbon generation and expulsion starting in the Early-Mid Pliocene in the depocenters. Some traps are still receiving hydrocarbons at present, suggesting potential for new accumulations in the rift.

5. Conclusions

This study presents a comprehensive examination of the geological evolution and petroleum systems of the Albert Rift, Uganda, through an integrated analysis of literature, seismic, well, and outcrop data, alongside BPSM of the most complete stratigraphy of the rift.
Key Findings include: (1) We identified and characterized several depositional units and structural features, establishing a robust and refined tectonostratigraphic framework that outlines the temporal and spatial evolution of this Neogene rift basin; (2) Our analysis highlights the significant impact of rift propagation on the basin architecture and stratigraphy, affecting the distribution and quality of source, reservoir, and seal rocks, with critical implications for petroleum systems. Four phases of subsidence with clear timing are presented in the TRC model. This could be a key milestone in harmonizing the earlier tectono-sedimentary evolution models documented by different authors; (3) Geochemical analyses reveal that Mid-Miocene sediments were deposited in a favorable lacustrine environment for source rock development. We demonstrated the processes of hydrocarbon generation and expulsion via BPSM, emphasizing the timing of these events. Modeled wells show increasing thermal maturity northwestwards towards the depocenters, with Vr values suggesting early oil to peak oil generation stages. Our findings indicate that the Mid-Miocene lacustrine source rock facies in the deeper parts of the rift basin began generating and expelling hydrocarbons from the Middle to Late Pliocene, while those in shallower areas have only recently entered the oil window and have yet to start major petroleum generation. Additionally, sediments in the northwest entered the oil window earlier than those in the southeast, consistent with current regional stratal dips.
The insights gained from this study provide a robust foundation for future exploration strategies in the Albert Rift. The integration of stratigraphic and petroleum system analyses offers a comprehensive understanding of the factors controlling hydrocarbon generation and expulsion, which can be applied to similar rift basins globally. Given the evidence that source rocks younger than the Mid-Miocene are unlikely to have generated or expelled hydrocarbons, future source rock investigations should prioritize the Southern Lake Albert sector as a starting point.
This study underscores the effectiveness of BPSM in understanding the depositional and petroleum generation histories of frontier basins where data remains limited. Our results demonstrate the crucial role of BPSM in resolving stratigraphic uncertainties within the Albert Rift, particularly in reconciling divergent interpretations. The study supports models suggesting an Early Miocene basin initiation, followed by a Mid-Miocene rifting and lacustrine deposition, contrasting with interpretations favoring a Late Miocene rift initiation.
This work contributes to the geological understanding of the Albert Rift and sets a precedent for utilizing integrated approaches in basin analysis. Future research should focus on refining stratigraphic correlations and exploring deeper, untested strata for further hydrocarbon potential.

Author Contributions

Conceptualization, L.T. and K.L.; methodology, L.T. and K.L.; software, S.W. and H.A.R.H.; validation, K.L., K.J. and T.S.; formal analysis, L.T.; investigation, L.T.; resources, K.J.; data curation, L.T., M.S. and S.W.; writing—original draft preparation, L.T.; writing—review and editing, K.L.; visualization, L.T.; supervision, K.L.; project administration, K.L.; funding acquisition, K.L. All authors have read and agreed to the published version of the manuscript

Funding

This work was supported the Major Research Project on the Tethys Geodynamic System of the National Natural Science Foundation of China (No. 92055204).

Data Availability Statement

The dataset used in this study is confidential data from the Government of Uganda.

Acknowledgments

We acknowledge the Government of Uganda and Chinese Government Scholarship Council for providing data and financial support respectively.

Conflicts of Interest

The authors declare no conflicts of interest.

References

  1. Abeinomugisha, D.; Njabire, N. Transfer Zones and Hydrocarbon Accumulation in the Albertine Graben of the East African Rift System. AAPG Annu. Conv. Exhib. 2012, 10401, 8. [Google Scholar]
  2. Hinderer, M.; Schneider, S.; Stutenbecker, L. Unravelling the evolution of a continental rift by a multi-proxy provenance study (Albertine Rift, Uganda). Int J Earth Sci. 2024, 113, 1317–1336. [Google Scholar] [CrossRef]
  3. Talbot, M.R. The origins of lacustrine oil source rocks: evidence from the lakes of tropical Africa. Geological Society, London, Special Publications. 1988, 40(1), 29-43. [CrossRef]
  4. Katz, B. J. Controls on distribution of lacustrine source rocks through time and space. In: Katz, B.J (Ed). Lacustrine basin exploration: Case studies and modern analogs. Memoir. 1990, 50, 61–76.
  5. Rosendahl, B. R.; Kilembe, E.; Kaczmarick, K. Comparison of the Tanganyika, Malawi, Rukwa and Turkana Rift zones from analyses of seismic reflection data. Tectonophysics. 1992, 213(1-2), 235-256. [CrossRef]
  6. Scholz, C. A. Deltas of the Lake Malawi rift, East Africa: Seismic expression and exploration implications: AAPG Bulletin. 1995, 79(11), 1679–1697. [CrossRef]
  7. Soreghan, M. J.; Cohen, A.S. Textural and compositional variability across littoral segments of Lake Tanganyika: The effect of asymmetric basin structure on sedimentation in large rift lakes: AAPG Bulletin. 1996, 80, 382–409.
  8. Demaison, G.J.; Moore, G.T. Anoxic environments and oil source bed genesis. Org. Geochem. 1980, 2, 9–31. [Google Scholar] [CrossRef]
  9. Karp, T.; Scholz, C.A.; McGlue, M.M. Structure and Stratigraphy of the Lake Albert Rift, East Africa Observations from Seismic Reflection and Gravity Data, in: Lacustrine Sandstone Reservoirs and Hydrocarbon Systems. AAPG Special Volumes. 2012. [CrossRef]
  10. Morley, C.K.; Nelson, R.A.; Patton, T.L.; Munn, S.G. Transfer zones in the East African rift system and their relevance to hydrocarbon exploration in rifts. AAPG bulletin. 1990, 74, 1234–1253. [Google Scholar] [CrossRef]
  11. Macgregor, D. History of the development of the East African Rift System: A series of interpreted maps through time. J Afr Earth Sci. 2015, 101, 232–252. [Google Scholar] [CrossRef]
  12. Abrahao, D.; Warme, J. E. Lacustrine and associated deposits in a rifted continental margin: Lower Cretaceous Lagoa Feia Formation, Campos Basin, offshore Brazil: In B. J. Katz, (Ed.). Lacustrine basin exploration: Case studies and modern analogs: AAPG Memoir. 1990, 50, 287– 305.
  13. McHargue, T. R. Stratigraphic development of proto-South Atlantic rifting in Cabinda, Angola: A petroliferous lake basin. In B. J. Katz (Ed.). Lacustrine basin exploration: Case studies and modern analogs: AAPG Memoir. 1990, 50, 307–326.
  14. Pickford, M. Field Report – Western Rift. Collège de France, Paris. Unpublished field report. 2011, 1-30.
  15. Pickford, M.; Senut, B. Western Rift Valley. Collège de France, Paris. Unpublished field report. 2012, 1-61.
  16. Lukaye, J.; Worsley, D.; Kiconco, L.; Nabbanja, P.; Abeinomugisha, D.; Amusugut, C.; Njabire, N.; Nuwagaba, R.; Mugisha, F.; Ddungu, T.; Sserubiri, T.; Sempala, V. Developing a coherent stratigraphic scheme of the Albertine Graben-East, Africa. Glob. j. Earth sci. eng. 2016, 6, 264–294. [Google Scholar] [CrossRef]
  17. Lukaye, J.; Etano, G.; Abbott, G. Molecular organic geochemistry of crude oils from the Albertine Graben, Uganda: possible implications on the expulsion of the oils from the source rocks. Glob. j. Earth sci. eng. 2017, 7.
  18. Pickford, M.; Senut, B.; Hadoto, D. Geology and palaeobiology of the Albertine Rift valley, Uganda-Zaire. Orléans, France: CIFEG. 1993, 1, 1-189.
  19. Bauer, F.U.; Glasmacher, U.A.; Ring, U.; Grobe, R.W.; Mambo, V.S.; Starz, M. Long-term cooling history of the Albertine Rift: new evidence from the western rift shoulder, DR Congo. Int J Earth Sci. 2016, 105, 1707–1728. [Google Scholar] [CrossRef]
  20. Jess, S.; Koehn, D.; Fox, M.; Enkelmann, E.; Sachau, T.; Aanyu. Paleogene initiation of the Western branch of the east African Rift: The uplift history of the Rwenzori Mountains, Western Uganda. Earth Planet. Sci. Lett. 2020, 552, 116593. [CrossRef]
  21. Michon, L.; Famin, V.; Quidelleur, X. Evolution of the East African Rift System from trap-scale to plate-scale rifting. Earth Sci Rev. 2022, 231, 104089. [Google Scholar] [CrossRef]
  22. Schneider, S.; Hornung, J.; Hinderer, M. Evolution of the western East African Rift System reflected in provenance changes of Miocene to Pleistocene synrift sediments (Albertine Rift, Uganda). Sediment. Geol. 2016, 343, 190–205. [Google Scholar] [CrossRef]
  23. Lukaye, J.M. Biostratigraphy and palynofacies of four exploration wells from the Albertine Graben, Uganda. American Association of Petroleum Geologists, Search & Discovery Article. 2009, 50169.
  24. Roller, S.; Hornung, J.; Hinderer, M.; Ssemmanda, I. Middle Miocene to Pleistocene sedimentary record of rift evolution in the southern Albert Rift (Uganda). Int J Earth Sci. 2010, 99, 1643–1661. [Google Scholar] [CrossRef]
  25. Simon, B.; Guillocheau, F.; Robin, C.; Dauteuil, O.; Nalpas, T.; Pickford, M.; Bez, M. Deformation and sedimentary evolution of the Lake Albert rift (Uganda, East African Rift System). Mar. Pet. Geol. 2017, 86, 17–37. [Google Scholar] [CrossRef]
  26. Lukaye, J.; Okello, M. Geochemical Characterization and Correlation of Crude Oils and Potential Source Rocks from the Semliki, Southern Lake Albert and Kaisotonya basins in the Albertine Graben, Uganda. In: International Conference and Exhibition, Melbourne, Australia 13-16 September. Society of Exploration Geophysicists and American Assoc. AAPG. 2015, 557-557. [CrossRef]
  27. Klemme, H. D.; Ulmishek, G. F. Effective petroleum source rocks of the world: stratigraphic distribution and controlling depositional factors. AAPG Bulletin. 1991, 75, 1809–1851. [Google Scholar]
  28. Tissot, B. P.; Pelet, R.; Ungerer, P. Thermal History of Sedimentary Basins, Maturation Indices, and Kinetics of Oil and Gas Generation. AAPG. 1987, 71, 1445–1466. [Google Scholar] [CrossRef]
  29. Welte, D. H.; Yalçin, M. N. Basin Modelling-A New Comprehensive Method in Petroleum Geology. Org. Geochem. 1988, 13, 141–151. [CrossRef]
  30. Ungerer, P.; Burrus, J.; Doligez, B.; Chenet, P. Y.; Bessis, F. Basin Evaluation by Integrated Two-Dimensional Modeling of Heat Transfer, Fluid Flow, Hydrocarbon Generation, and Migration. AAPG. 1990, 74, 309–335. [Google Scholar] [CrossRef]
  31. Debra, K. H.; Michael, L.; Laura, N.R.R.; Mitchell, E.H. Petroleum system Modeling Capacities for Use in Oil and gas Resource assessments. U.S. Department of the Interior. U.S. Geological Survey. Open-File Report. 2006, 1024.
  32. Hantschel, T.; Kauerauf, A.I. Fundamentals of basin and petroleum systems modeling. Springer Science & Business Media. 2009, 476.
  33. Peters, K.E.; Schenk, O.; Hosford, S. A.; Wygrala, B.; Hantschel, T. Basin and petroleum system modeling. Springer handbook of petroleum technology. 2017, 381–417. [Google Scholar] [CrossRef]
  34. Baur, F.; Scheirer, A.H.; Peters, K.E. Past, present, and future of basin and petroleum system modeling. AAPG Bulletin. 2018. [CrossRef]
  35. Tugume, F.A.; Nyblade, A.A. The depth distribution of seismicity at the northern end of the Rwenzori mountains: implications for heat flow in the western branch of the East African Rift System in Uganda. South Afr. J. Geol. 2009, 112, 261-276. [CrossRef]
  36. Sweeney, J.J.; Burnham, A.K. Evaluation of a simple model of vitrinite reflectance based on chemical kinetics. AAPG bulletin. 1990, 74, 1559–1570. [Google Scholar] [CrossRef]
  37. Frakes, L. A. Climates throughout Geological Time. Amsterdam, Elsevier. 1979, 1 - 310.
  38. Hardenbol, J.; Thierry, J.; Farley, M.; Thierry, J.; De Graciansky, P. C.; Vail, P. R. Mesozoic and Cenozoic Stratigraphy of European Basins. SEPM Special Publication. 1998, 60. [Google Scholar]
  39. Dembicki, H. Practical petroleum geochemistry for exploration and production. Elsevier. 2017, 1-331.
  40. Mechie, J.; Keller, G.R.; Prodehl, C.; Khan, M.A.; Gaciri, S.J. A model for the structure, composition and evolution of the Kenya rift. Tectonophysics. 1997, 278, 95-119. [CrossRef]
  41. Ebinger, C.J.; Casey, M. Continental breakup in magmatic provinces: An Ethiopian example. Geological Journal. 2001, 29, 527–530. [Google Scholar] [CrossRef]
  42. Hofstetter, R.; Beyth, M. The Afar Depression: interpretation of the 1960–2000 earthquakes. Geophys. J. Int, 2003, 155, 715-732. [CrossRef]
  43. Shaban, S.N.; Scholz, C.A.; Muirhead, J.D.; Wood, D.A. The stratigraphic evolution of the Lake Tanganyika Rift, East Africa: Facies distributions and paleo-environmental implications. Palaeogeography, Palaeoclimatology, Palaeoecology. 2021, 575, 110474. [CrossRef]
  44. Bauer, F.U.; Glasmacher, U.A.; Ring, U.; Schumann, A.; Nagudi, B. Thermal and exhumation history of the central Rwenzori Mountains, Western rift of the east African rift system, Uganda. Int J Earth Sci. 2010, 99, 1575–1597. [Google Scholar] [CrossRef]
  45. Nicholas, C.J.; Newth, I, R.; Abeinomugisha, D.; Tumushabe, W.M.; Twinomujuni, L. Geology and stratigraphy of the south-eastern Lake Edward basin (Petroleum Exploration Area 4B), Albertine Rift Valley, Uganda. J. Maps. 2016, 12, 237–248. [CrossRef]
  46. Mutebi, S.; Sen, S.; Sserubiri, T.; Rudra, A.; Ganguli, S. S.; Radwan, A. E. Geological characterization of the Miocene–Pliocene succession in the Semliki Basin, Uganda: Implications for hydrocarbon exploration and drilling in the East African Rift System. Nat. Resour. Res. 2021, 30, 4329–4354. [Google Scholar] [CrossRef]
  47. Tissot, B.P.; Welte, D.H. Petroleum formation and occurrence. Springer Science & Business Media. 2013, 1-679.
  48. Morley, C.K. Tectonic settings of continental extensional provinces and their impact on sedimentation and hydrocarbon prospectivity. In: Renaut R, W., Ashley. G, M (Eds.). Sedimentation in Continental Rifts. 2002. [CrossRef]
  49. Peters, K. E.; Cassa, M. R. Applied Source Rock Geochemistry. In: The Petroleum System – From Source to Trap. AAPG Memoir. 1994, 60, 93-120.
  50. Doust, H.; Omatsola, E. Niger Delta. In: Edwards, J. D., & Santogrossi, P. A. (Eds.). Divergent/Passive Margin Basins, AAPG Memoir. 1990, 48, 239-248.
  51. Cornford, C. Source Rocks and Hydrocarbons of the North Sea. In: Glennie, K. W. (Ed.). Petroleum Geology of the North Sea. Blackwell Publishing. 1998, 376-462.
  52. McClay, K.; Khalil, S.M.; Bosworth, W.; Gussinye, M.P. Tectono-stratigraphic evolution of the northwestern Red Sea, Egypt–a review. Rifting and Sediments in the Red Sea and Arabian Gulf Regions .2024, 9-36.
  53. Van Damme, D.; Pickford M. The late Cenozoic ampullariidae (mollusca, gastropoda) of the Albertine rift valley (Uganda-Zaire). Hydrobiologia. 1995, 316:1–32. [CrossRef]
  54. Van Damme, D.; Pickford, M. The late Cenozoic Thiaridae (Mollusca, Gastropoda, Cerithioidea) of the Albertine rift valley (Uganda-Congo) and their bearing on the origin and evolution of the Tanganyikan thalassoid malacofauna. Hydrobiologia. 2003, 498:1– 83. [CrossRef]
  55. Kato, V. Geothermal exploration in Uganda – Status report. Papers presented at “SDG Short Course II on Exploration and Development of Geothermal Resources”, organized by UNU-GTP, GDC and KenGen, at Lake Bogoria and Lake Naivasha, Kenya, 2016, 1-24.
  56. EAGER. Structural geology at Panyimur and Buranga. East Africa Geothermal Energy Facility, report U-23-D02. 2017.
  57. Hinz, N.; Cumming, B.; Sussman, D. Exploration of fault-related deep-circulation geothermal resources in the western branch of the East African Rift System: Examples from Uganda and Tanzania. Proceedings of the 7th African Rift Geothermal Conference, Kigali, Rwanda, 2018, 1-16.
  58. Kahwa, E. Geothermal exploration in Uganda – Status report. Papers presented at “SDG Short Course II on Exploration and Development of Geothermal Resources”, organized by UNU-GTP, GDC and KenGen, at Lake Bogoria and Lake Naivasha, Kenya, 2021, 1-11.
Figure 1. Outline of the Albert Rift in the East African Rift System. EARS=East African Rift System; AT=Afar Triangle; BF=Bunia Fault; NTB=North Toro-Bunyoro Fault; TF=Tonya Fault; KF=Kichwamba Fault; LBF=Lubero Border Fault; RM=Rwenzori Mountains; VM=Virunga Mountain; LV=Lake Victoria; LG=Lake George; LT=Lake Tanganyika; LM=Lake Malawi; DRC=Democratic Republic of Congo.
Preprints 144524 g001
Figure 2. Geology map of Uganda showing the different type localities where the Albert Rift sediments are well exposed (modified after Hinderer et al. [2]. The thick black line AB represents the location of the cross section presented in Figure 8.
Preprints 144524 g002
Figure 3. Generalized tectonostratigraphy of Pakwach Basin.
Preprints 144524 g003
Figure 4. Generalized tectonostratigraphy of Central Lake Albert Basin.
Preprints 144524 g004
Figure 5. Generalized tectonostratigraphy of Southern Lake Albert Basin.
Preprints 144524 g005
Figure 6. Generalized geological and climatic events chart of the Southern Lake Albert sub basin (Semliki) that represents the most complete stratigraphy of the rift sediments. The climate curve is based on Frakes [37] and Hardenbol et al. [38].
Preprints 144524 g006
Figure 7. Generalized tectonostratigraphy of Lakes Edward-George Basin.
Preprints 144524 g007
Figure 8. Simplified stratigraphic cross section along the NW-SE direction showing different formations penetrated by wells.
Preprints 144524 g008
Figure 9. (a) TOC versus depth and (b) HI versus depth plots based on Dembicki [39] for the Pliocene shale samples selected from NGJ borehole cuttings.
Preprints 144524 g009
Figure 10. a) TOC versus depth and b) HI versus depth plots for Miocene-Pliocene shale samples selected from KWB borehole cuttings.
Preprints 144524 g010
Figure 11. (a) TOC versus depth, (b) HI versus depth, c) S2 versus TOC for generation potential classification and d) S2 versus TOC for organic matter type classification plots for Miocene shales of the TRC Well utilizing information obtained from well reports provided by the Ministry of Energy and Mineral Development, Uganda (after Dembicki [39].
Preprints 144524 g011aPreprints 144524 g011b
Figure 12. Burial history for the exploration TRC Well.
Preprints 144524 g012
Figure 13. Burial history for pseudo Well X.
Preprints 144524 g013
Figure 14. Comparison of (a) measured and (b) modeled vitrinite reflectance for Well TRC.
Preprints 144524 g014
Figure 15. Modeled Vr plot for Well X.
Preprints 144524 g015
Figure 16. Hydrocarbon transformation plots for (a) Well TRC and (b) Well X.
Preprints 144524 g016
Figure 17. Source rock hydrocarbon transformation during burial for Well X.
Preprints 144524 g017
Figure 18. PetroMod generated petroleum system events chart for the pseudo Well X.
Preprints 144524 g018
Table 1. Stratigraphic dataset obtained from published literature and well reports used to model the burial, thermal and hydrocarbon generation history of the rift at the exploration Well TRC.
Layer Age
From (ma)
To (ma) Thickness
Top (m)
Base (m)
Nyabusozi 0 2.5 0 848
Nyakabingo 2.5 3.8 848 1055
Nyaburogo 3.8 4.8 1055 1492
Oluka 4.8 7 1492 1883
Kakara 7 11.9 1883 2425
Kasande 11.9 14 2425 2540
Kisegi 14 17 2540 3600
Table 2. Stratigraphic dataset derived from integrating TRC Well data with previous seismic interpretations used to model the burial-thermal and hydrocarbon generation history of the rift at pseudo Well X.
Layer Thickness
Top (m)
Bottom (m) Age
Top (Ma)
Bottom (Ma)
Nyabusozi 0 1056 0 2.5
Nyakabingo 1056 1392 2.5 3.8
Nyaburogo 1392 1632 3.8 4.8
Oluka 1632 2208 4.8 7
Kakara 2208 3456 7 11.9
Kasande 3456 4008 11.9 14
Kisegi 4008 4800 14 17
Table 3. Rock-Eval Pyrolysis data for the NGJ shale samples.
Depth(m) Quantity (mg) TOC (%) S1 (mg/g) S2 (mg/g) Tmax (0C) TpkS2 (0C) PI HI
1146-1149 46.9 0.22 0 0.02 404 441 0.10 9.00
1152-1155 52.8 0.18 0 0.09 421 457 0.03 49.00
1164-1167 57.8 0.20 0.01 0.04 345 382 0.28 19.00
1167-1170 53.4 0.15 0 0.03 418 455.00 0.12 17.00
1257-1260 46.7 0.48 0.01 0.6 413 450 0.01 123.00
1440-1443 53.8 0.39 0 0.46 421 458 0.01 116.00
1461-1464 58.9 0.25 0.01 0.17 422 458 0.05 69.00
1473-1476 53.9 0.19 0.02 0.11 424 461 0.14 59.00
1482-1485 54.7 0.18 0 0.03 403 440 0.09 14.00
1491-1494 59.6 0.11 0.01 0.03 415 452 0.32 27.00
1530-1533 49.6 0.19 0.01 0.12 382 419 0.04 62.00
1545-1548 44.9 0.13 0 0.02 354 391.00 0.15 14.00
1551-1554 45.8 0.14 0.01 0.04 411 448 0.12 30.00
1563-1569 55.3 0.28 0.03 0.17 414 451 0.14 61.00
Table 4. Rock-Eval Pyrolysis data for the KWB shale samples.
Depth(m) Quantity (mg) TOC (%) S1 (mg/g) S2 (mg/g) Tmax (0C) TpkS2 (0C) PI HI
1467.00 50.8 0.24 0.02 0.23 407 444 0.07 98
1476.00 44.9 0.22 0.01 0.21 414 451 0.07 97
1482.00 58.4 0.29 0.01 0.26 419 456.00 0.03 88
1518.00 41.9 0.17 0.00 0.06 418 455 0.06 33
1524.00 55.4 0.31 0.01 0.26 412.00 449.00 0.03 83
1530.00 60.8 0.30 0.02 0.36 414 451 0.06 120
1554.00 52.2 0.67 0.02 0.61 433 470 0.04 92
1569.00 61.4 0.35 0.03 0.4 413.00 450.00 0.06 115
1578.00 42.8 0.19 0.00 0.05 422 458 0.07 28
1581.00 60.6 0.43 0.05 0.85 421 458 0.05 199
1584.00 58.9 0.68 0.21 1.75 420 457 0.11 259
1629.00 57.6 0.44 0.15 1.03 411 448 0.13 232
1650.00 44.8 0.48 0.02 0.84 415 452.00 0.02 173
1827.00 52.3 0.27 0.01 0.22 416 453 0.03 80
1839.00 54.9 0.19 0.01 0.16 403 440 0.05 86
1851.00 50.8 0.25 0.02 0.31 415 451.00 0.05 125
1866.00 54.2 0.37 0.02 0.56 413 450.00 0.03 152
1875.00 54.1 0.39 0.06 0.68 419 455 0.08 173
1887.00 44.9 0.41 0.10 0.7 409 445 0.12 171
Disclaimer/Publisher’s Note: The statements, opinions and data contained in all publications are solely those of the individual author(s) and contributor(s) and not of MDPI and/or the editor(s). MDPI and/or the editor(s) disclaim responsibility for any injury to people or property resulting from any ideas, methods, instructions or products referred to in the content.
Copyright: This open access article is published under a Creative Commons CC BY 4.0 license, which permit the free download, distribution, and reuse, provided that the author and preprint are cited in any reuse.
Prerpints.org logo

Preprints.org is a free preprint server supported by MDPI in Basel, Switzerland.

Subscribe

Disclaimer

Terms of Use

Privacy Policy

Privacy Settings

© 2025 MDPI (Basel, Switzerland) unless otherwise stated