Submitted:
29 December 2024
Posted:
30 December 2024
You are already at the latest version
Abstract
Power transmission lines transfer energy between power plants and substations by means of a linear chain of towers. These towers are often situated over extensive distances, sometimes in regions that are difficult to access. Wireless sensor networks present a viable solution for monitoring these long chains of towers due to their wide coverage, ease of installation, and cost-effectiveness. The proposed LoRaBUS approach implements and analyses the benefits of a linear topology using a mixture of LoRa and LoRaWAN protocols. This approach is designed to enable automatic detection of nearby nodes, optimize energy consumption, and provide a prioritized transmission mode in emergency situations. On remote, hard-to-reach towers, a prototype fire protection system was implemented and tested. The results demonstrate that LoRaBUS creates a self-configurable linear topology which proves advantageous for installation processes, node maintenance and troubleshooting node failures. In addition, energy consumption is effectively managed by dynamically adjusting the transmission power based on the detected channel quality and the distance to the nearest neighbor node.
Keywords:
1. Introduction
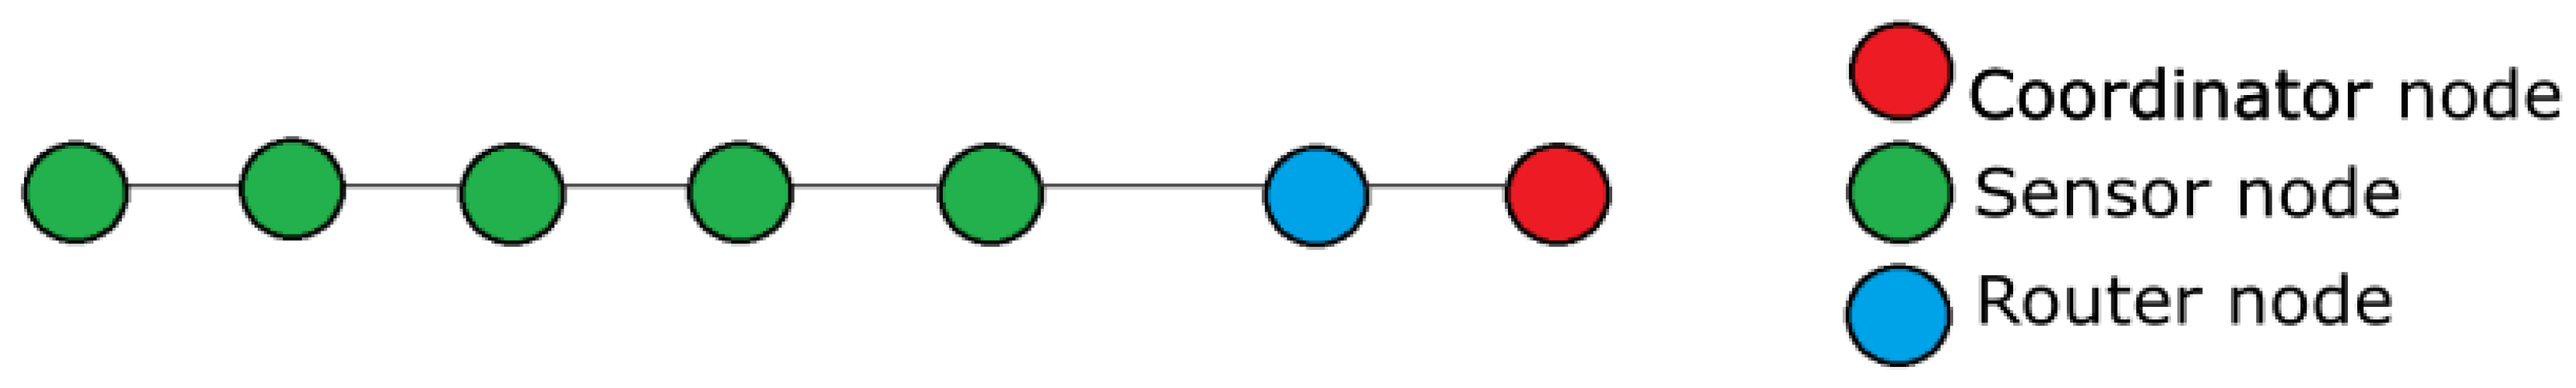
- The concept of a BUS topology in WSN with two final nodes acting as a routers to improve connectivity with upper system layers.
- The self-configuring algorithm which detects nearby nodes and adjust power consumption during transmission to avoid channel interference between adjacent nodes.
- The algorithm to transmit data between nodes avoiding data duplication and reducing power consumption.
- The communication architecture based on a combination of LoRa and LoraWAN for world-wide connection with controlling center.
- The proposed network topology is implemented in real prototype to test power consumption and quality coverage in a campus and non-urban scenarios.
2. System Architecture
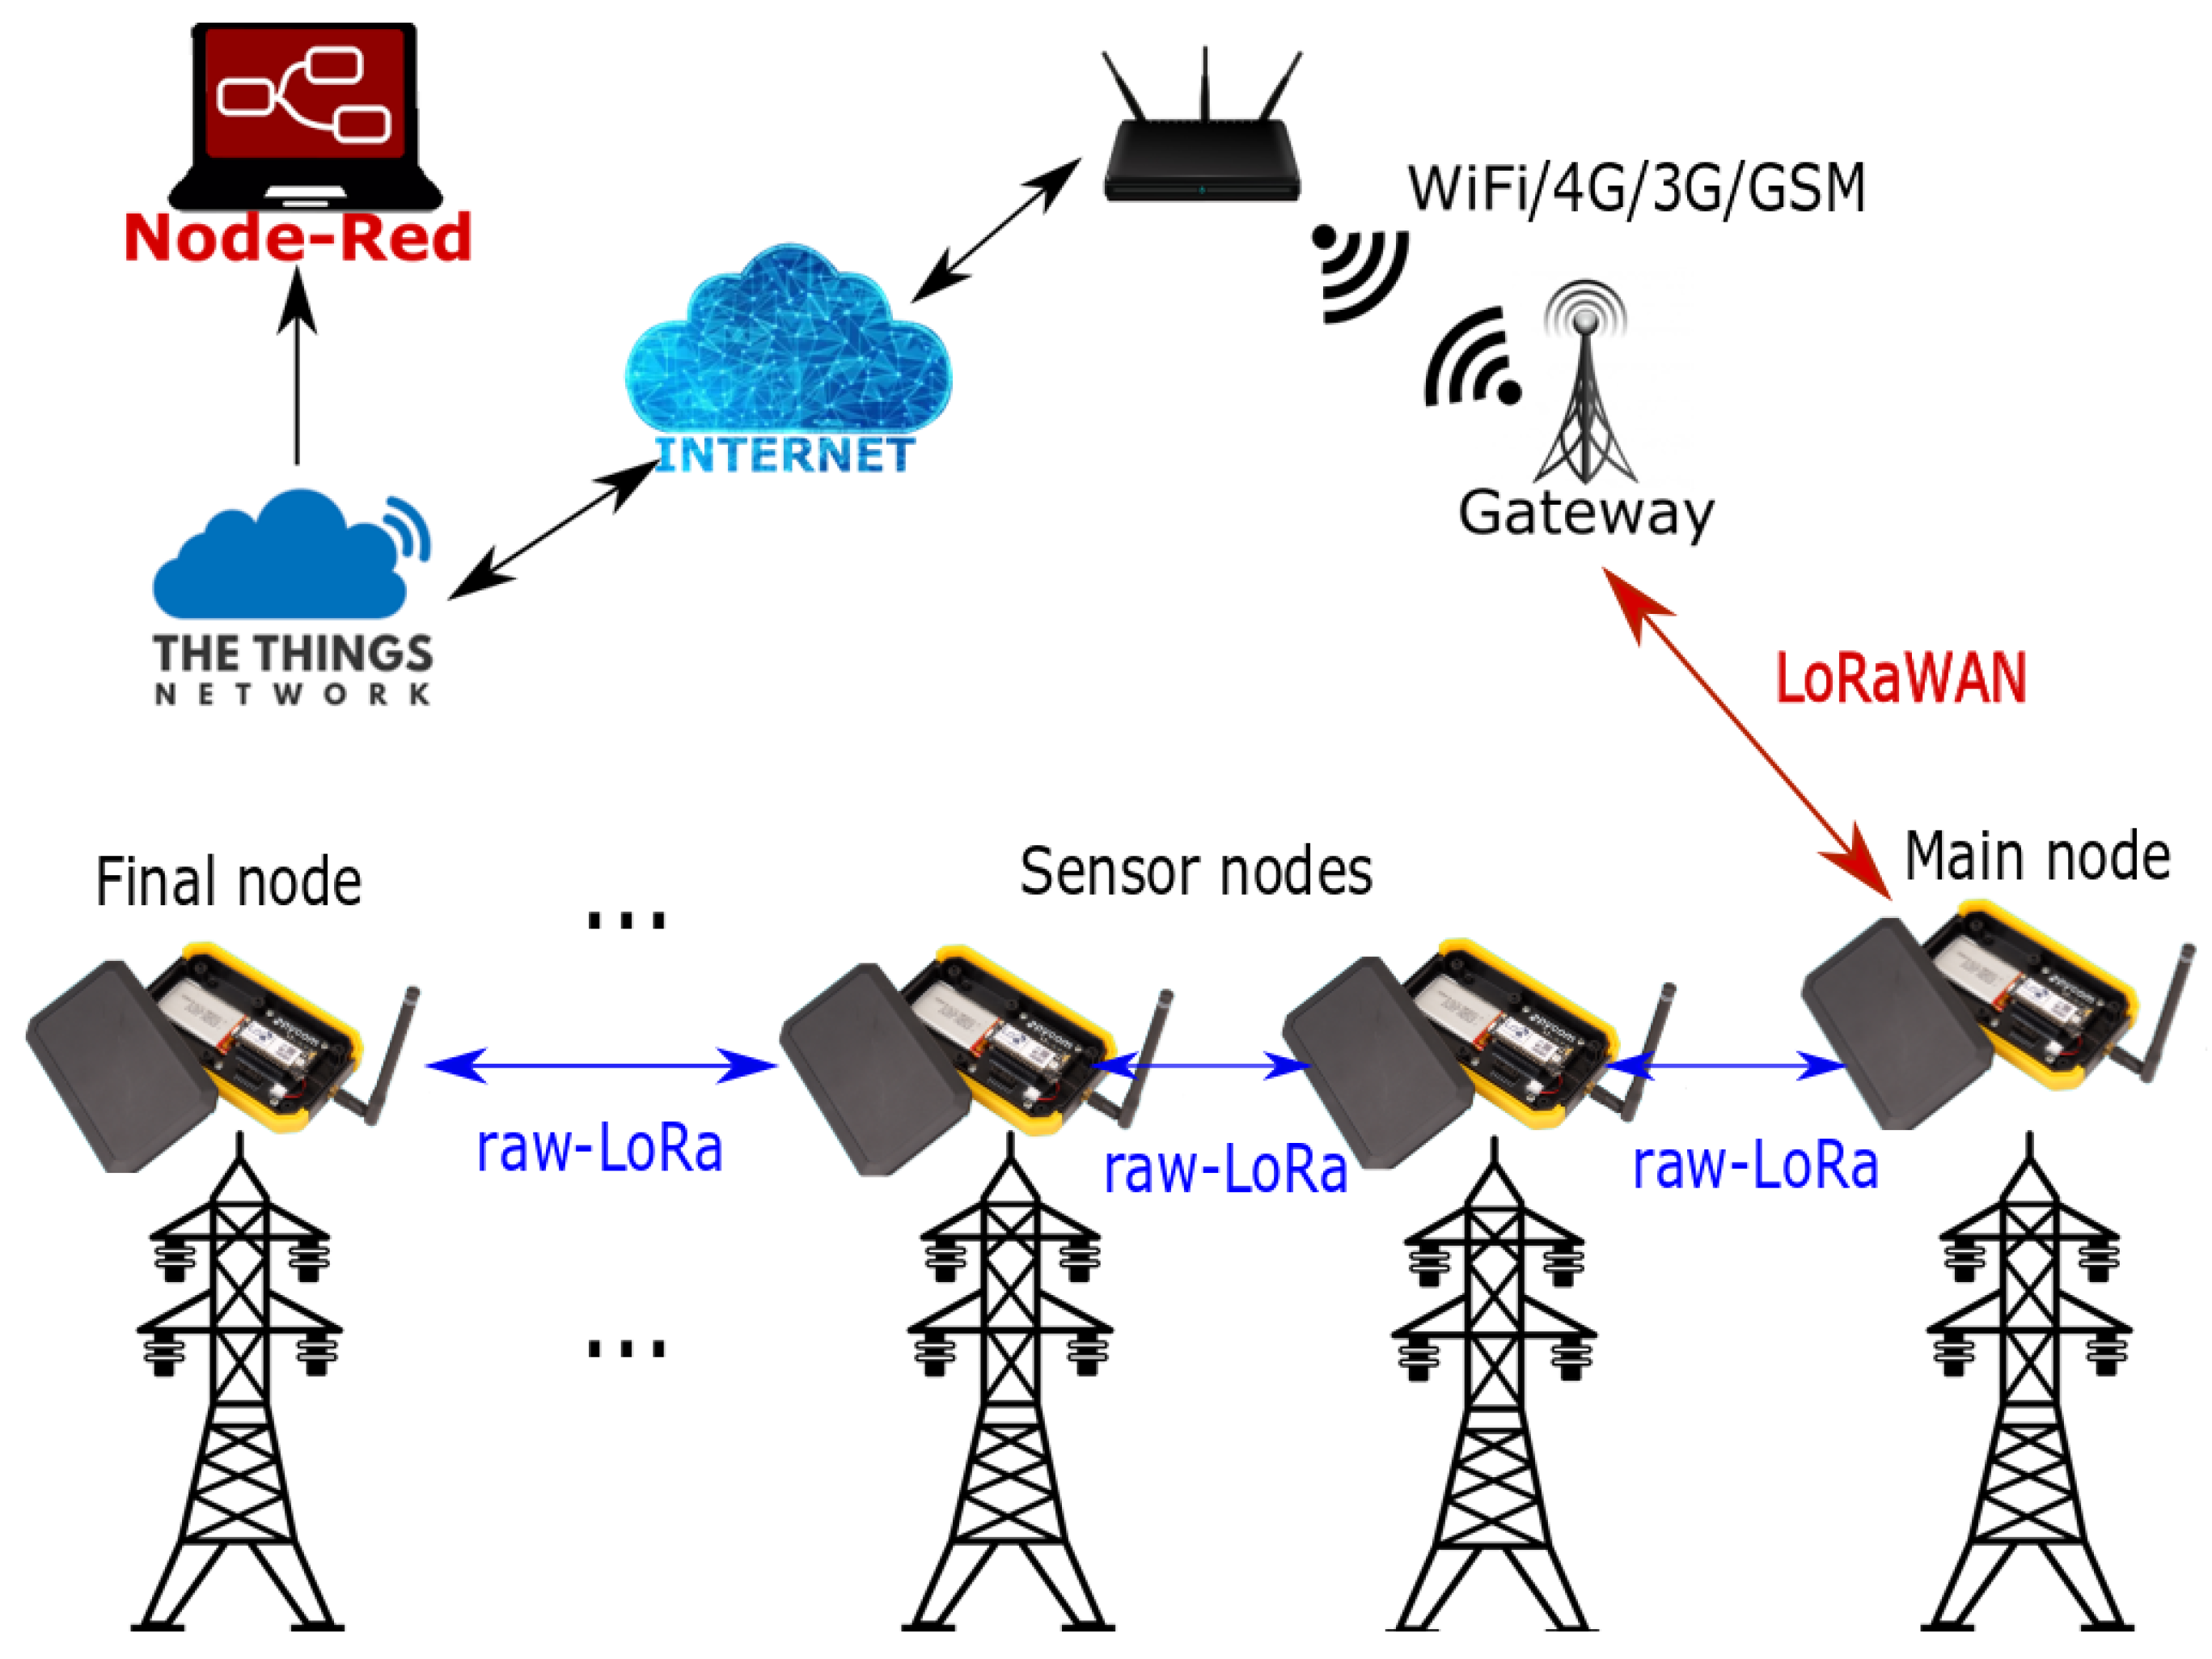
- The Gatewaynode maintains the connection between the LoRaWAN network with the Network Server. The data received from the BUS nodes is re-transmitted to the TTN via TCP/IP connections, such as WiFi or 3G.
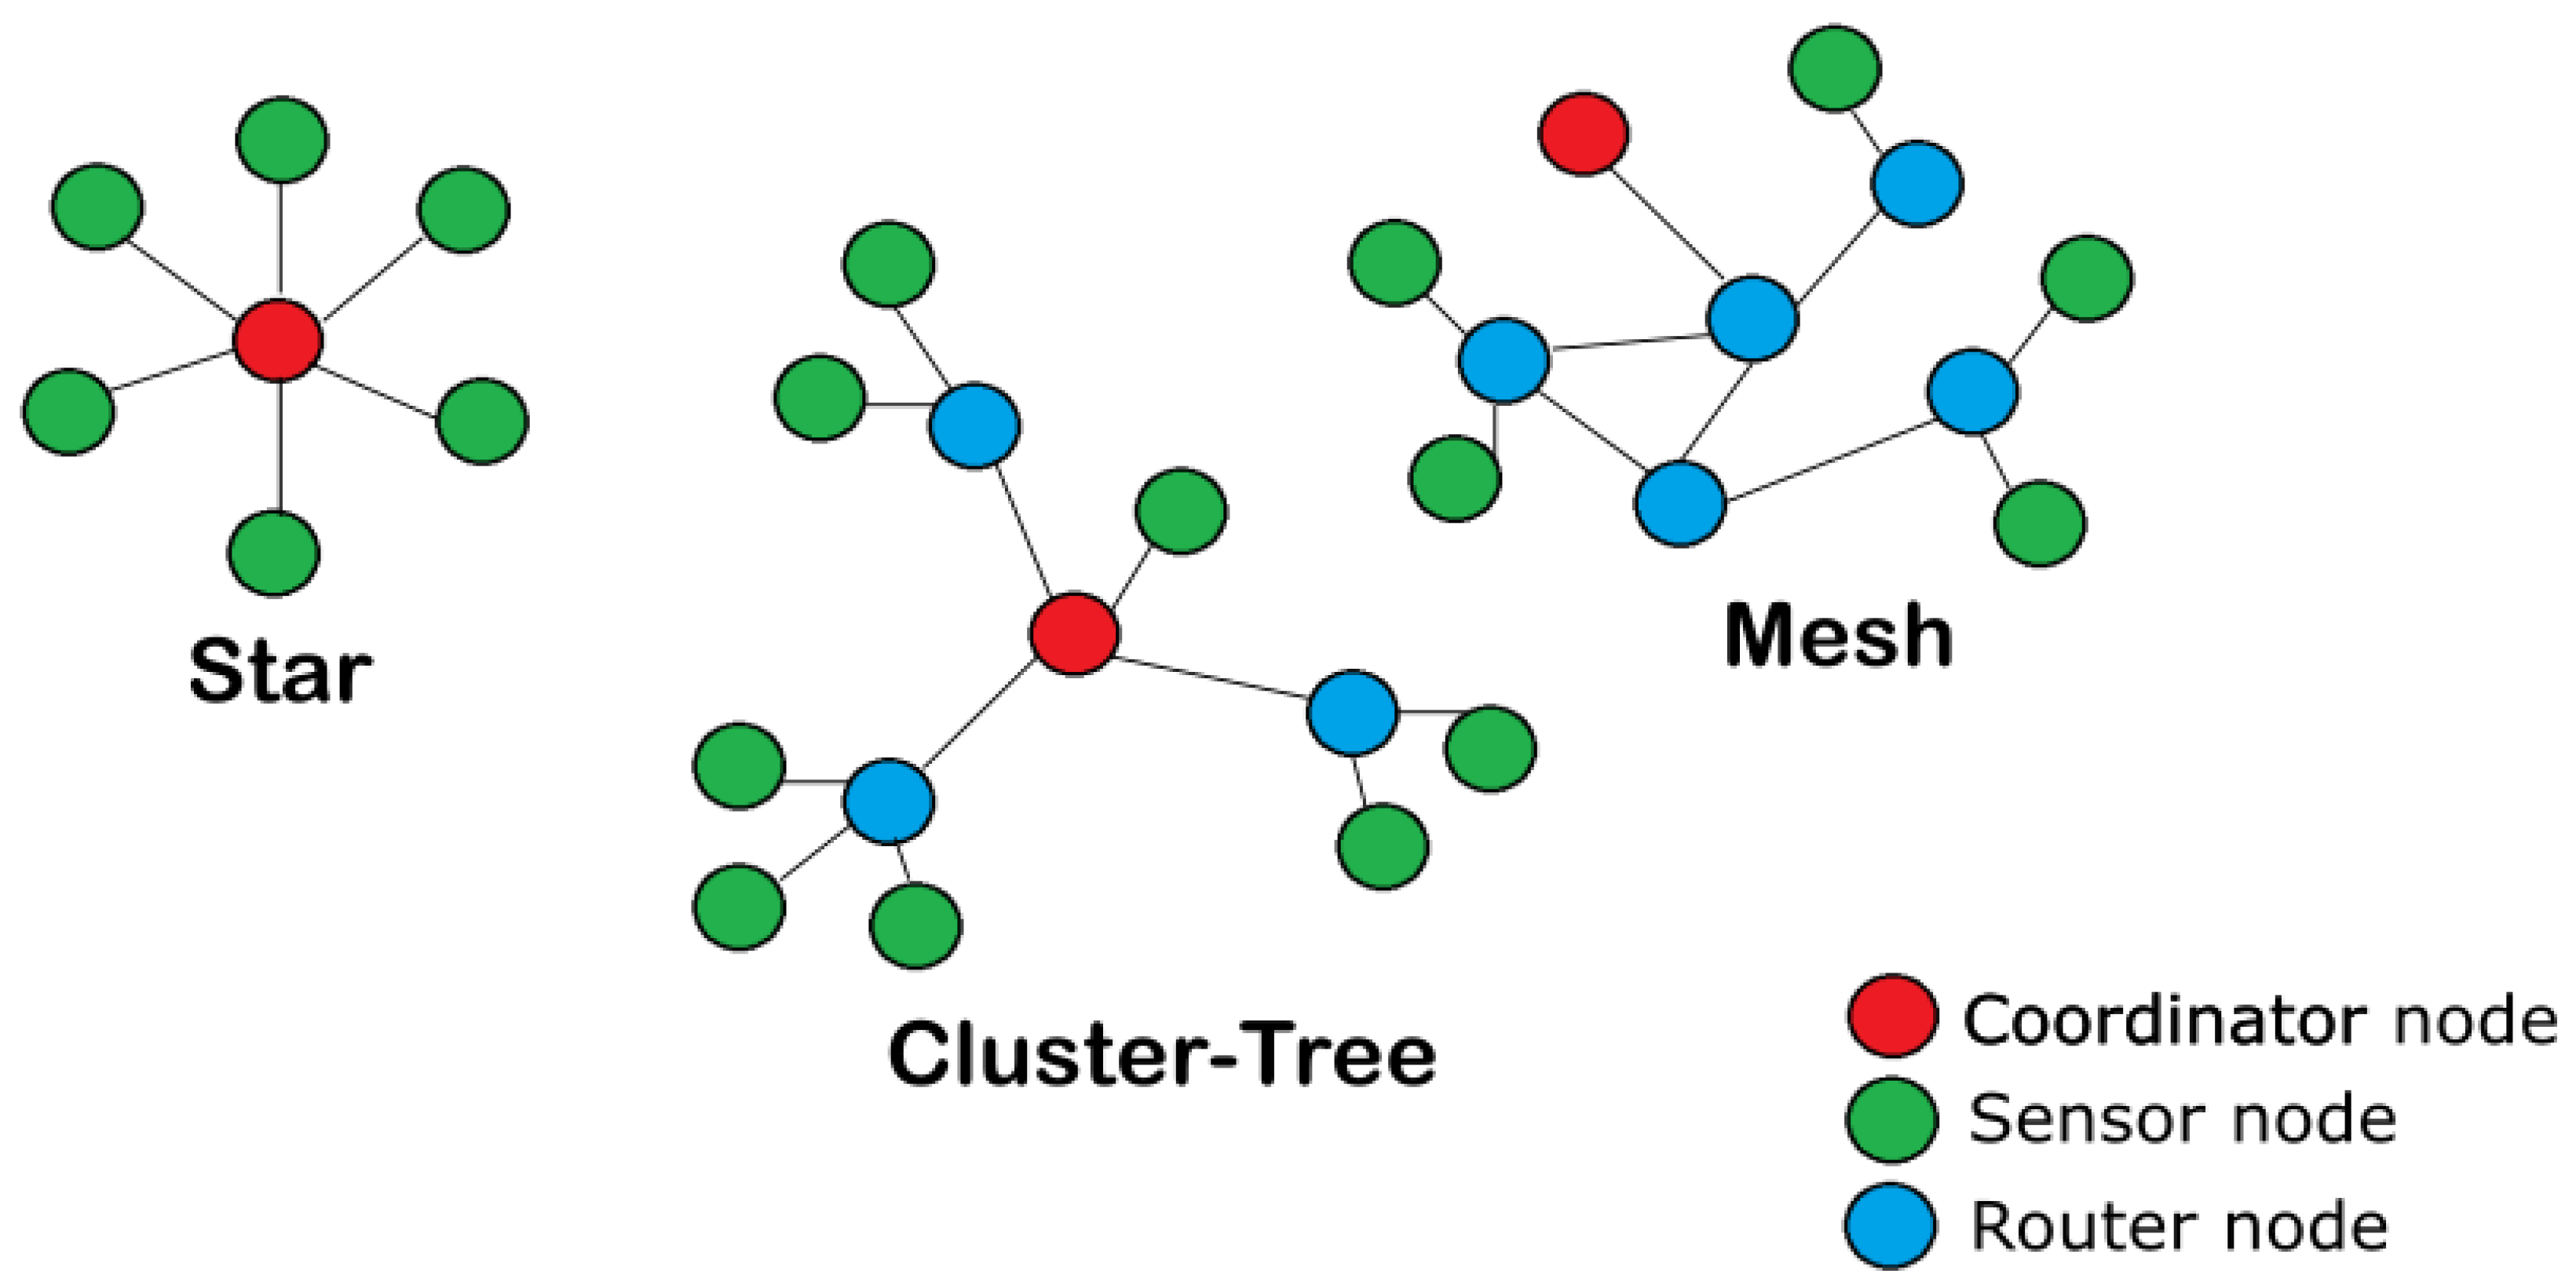
- The Main node is represented as Router node in Figure 2 and is the node placed nearest to the Gateway. Its main function is to convert the messages from the sensor nodes (via raw-LoRa) to a LoRaWAN message that could be sent to the gateway. Furthermore, this node decides which sensor node in the BUS topology will take control of the BUS to transmit the information at each transmission cycle.
- The Sensor nodes are able to measure the environmental conditions near their position and then send this information through the LoRaBUS implemented by themselves. The designed LoRaBUS protocol has not restriction on the maximum number of nodes, so the total distance that could be covered by the proposed LoRaBUS topology has no theoretical limitations.
- The Final sensor is a particular node similar to the sensor nodes which is located at the last position of the bus, i.e., at this node the sequence of nodes in the bus topology ends. Because the bus communication finish on this node, it has a different firmware although the hardware is the same that the sensors nodes. The complete functionality of this special node and other advantages are explained in Section 3.
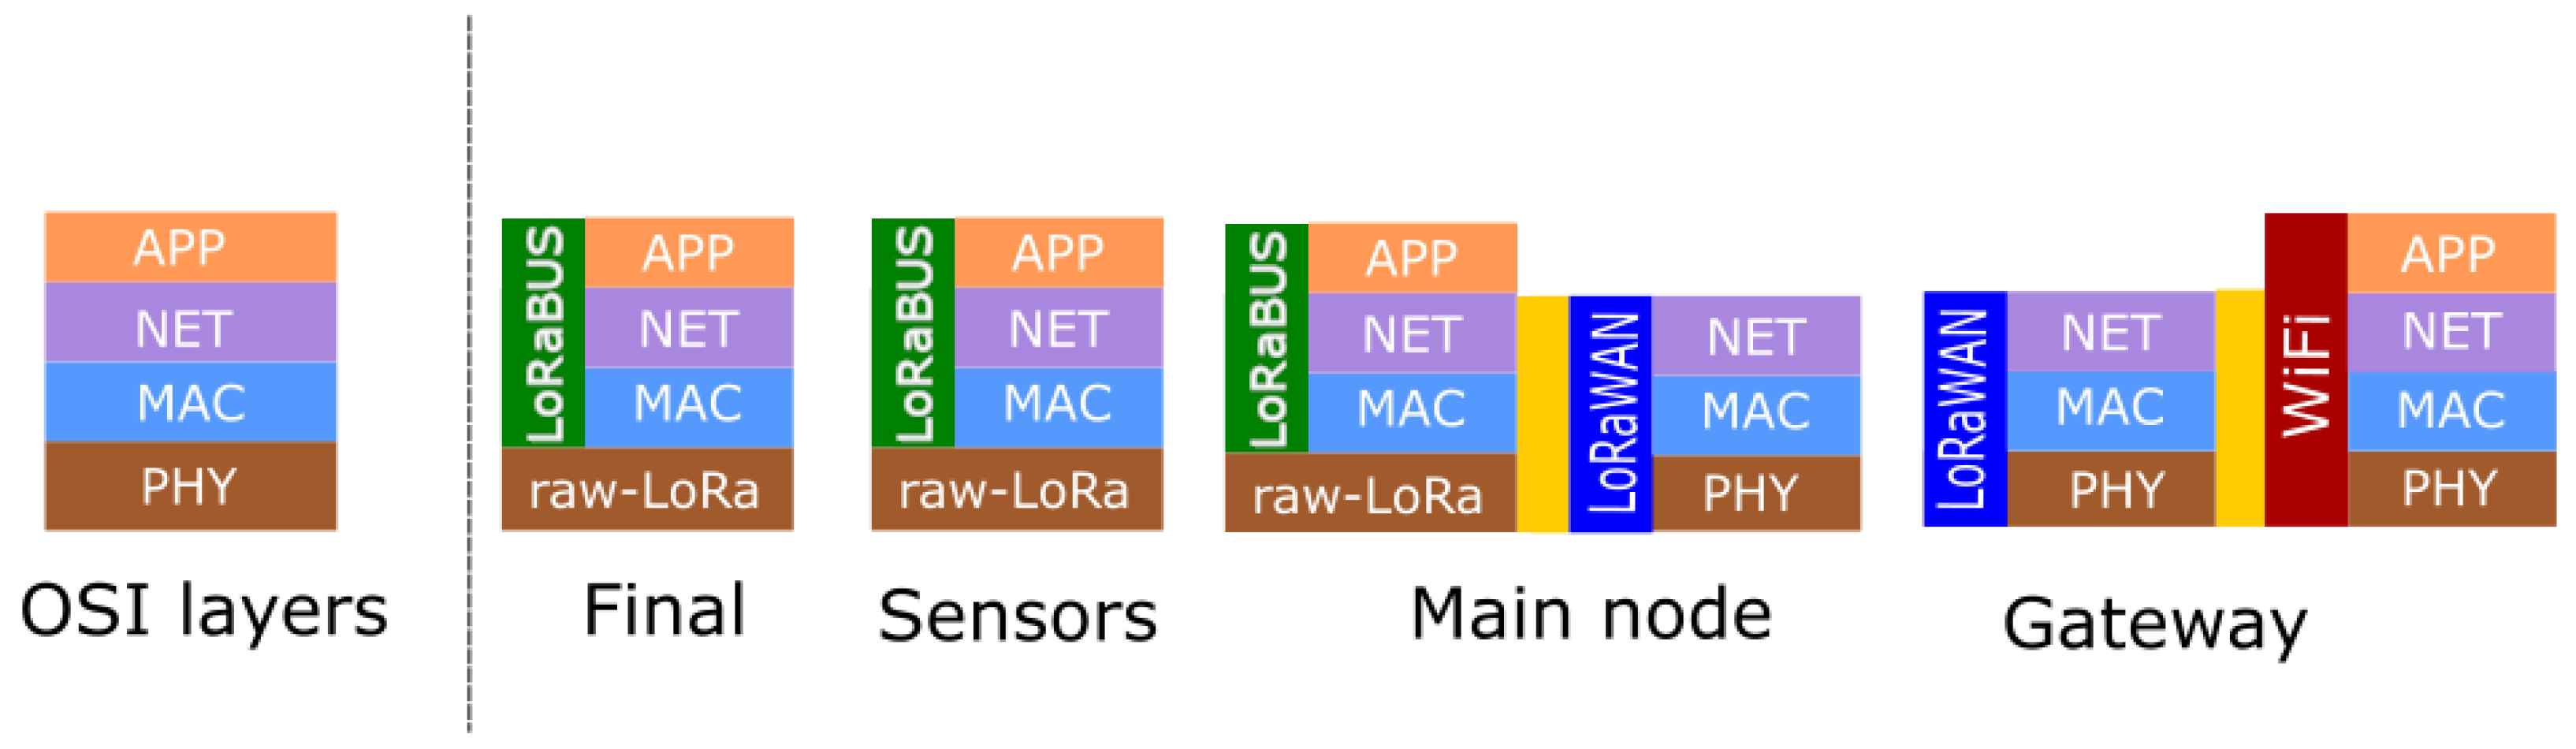
2.1. raw-LoRa and LoRaWAN
3. LoRaBUS Communication Protocol
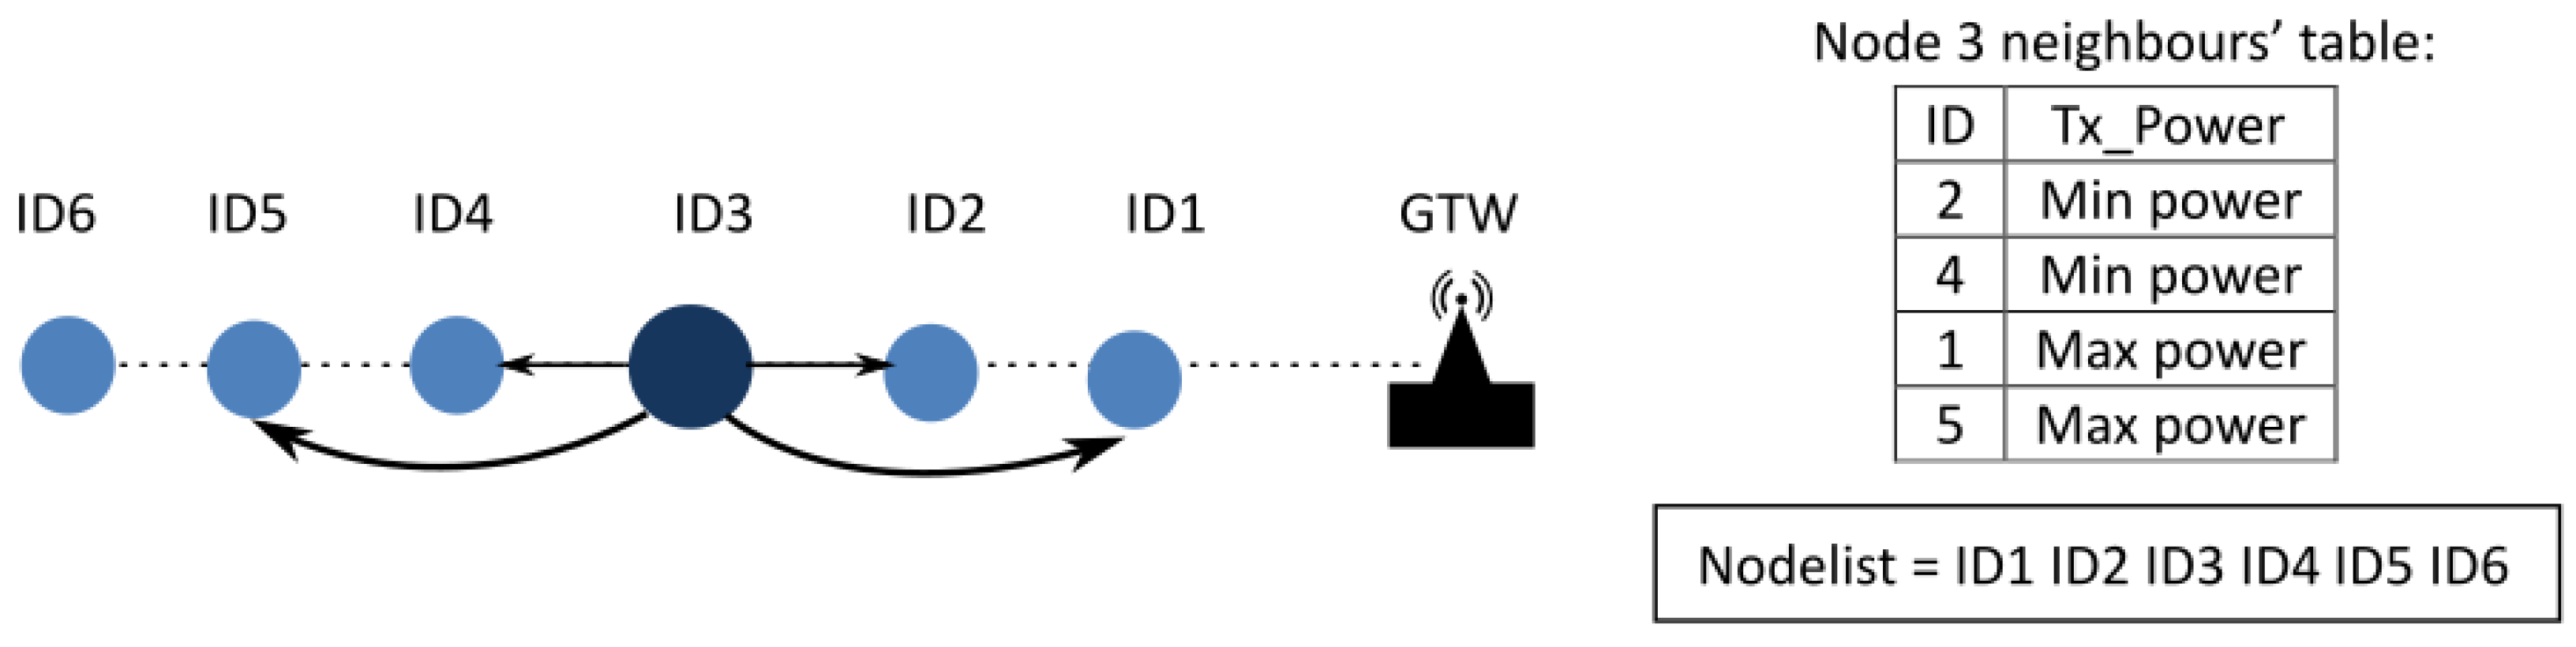
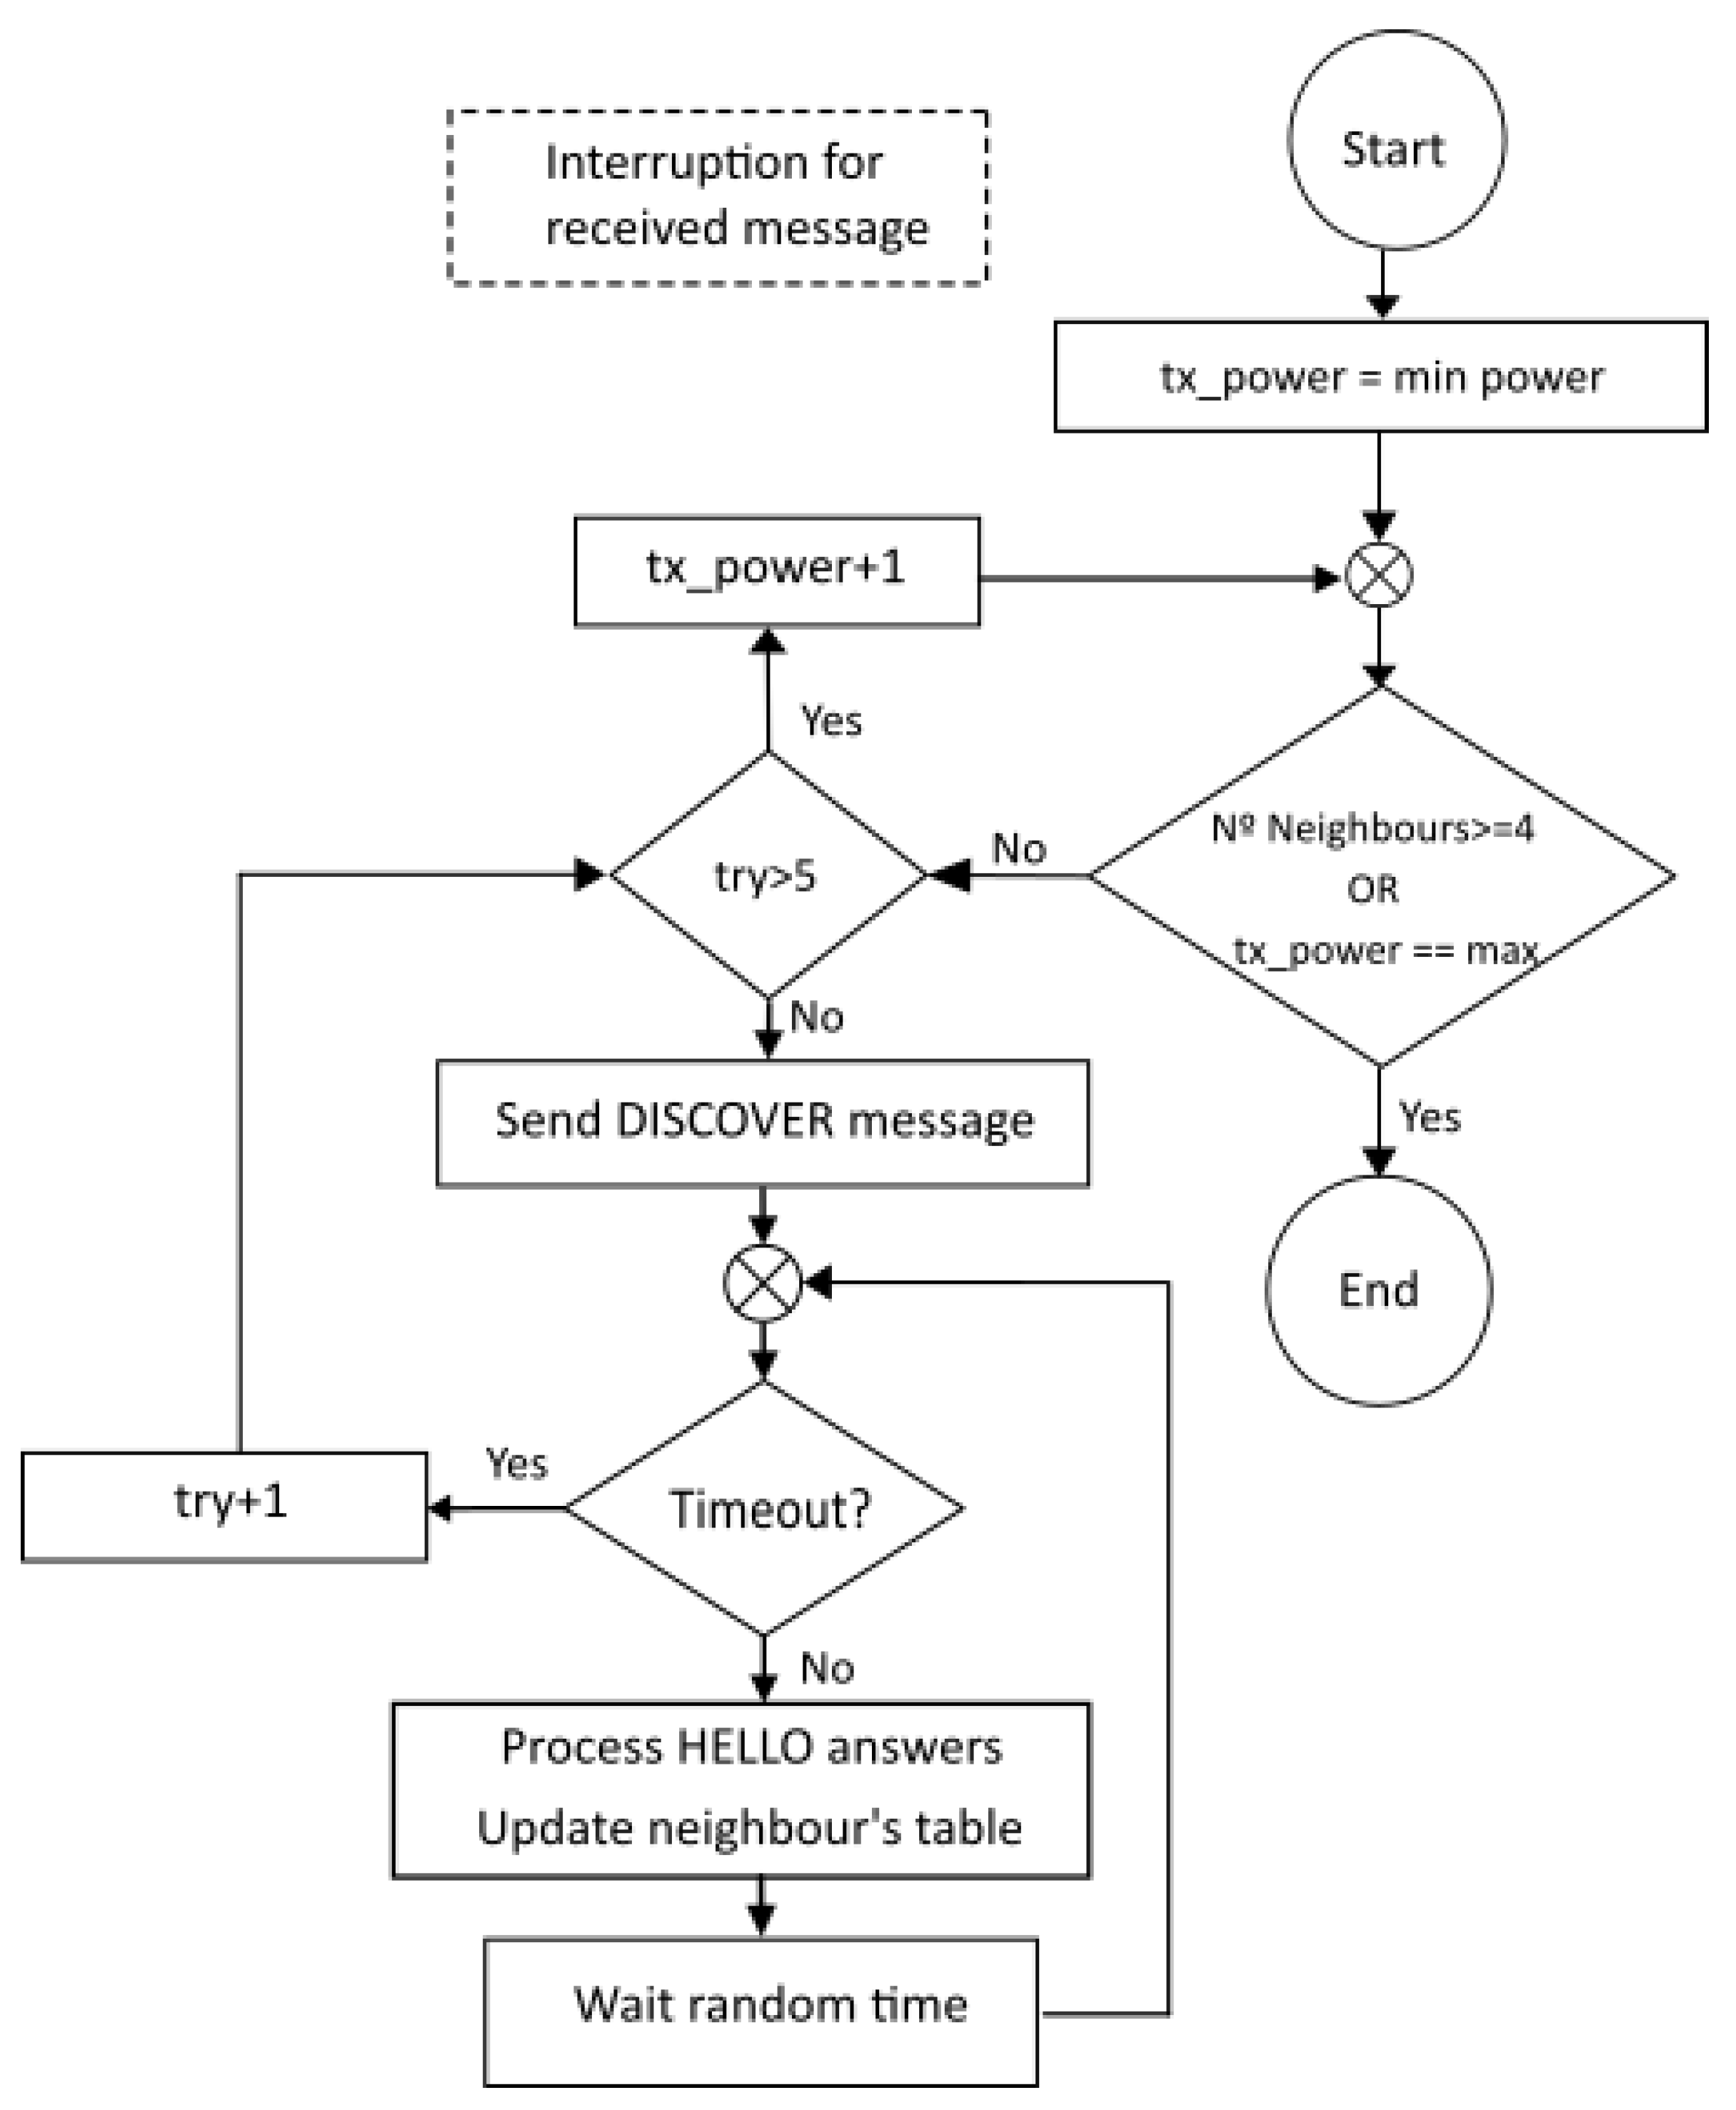
3.1. Discovering Neighbours
3.1.1. Getting the "Nodelist"
3.1.2. Getting the Neighbour’s Table
3.2. LoRaBUS Data Communication
4. System Test and Analysis
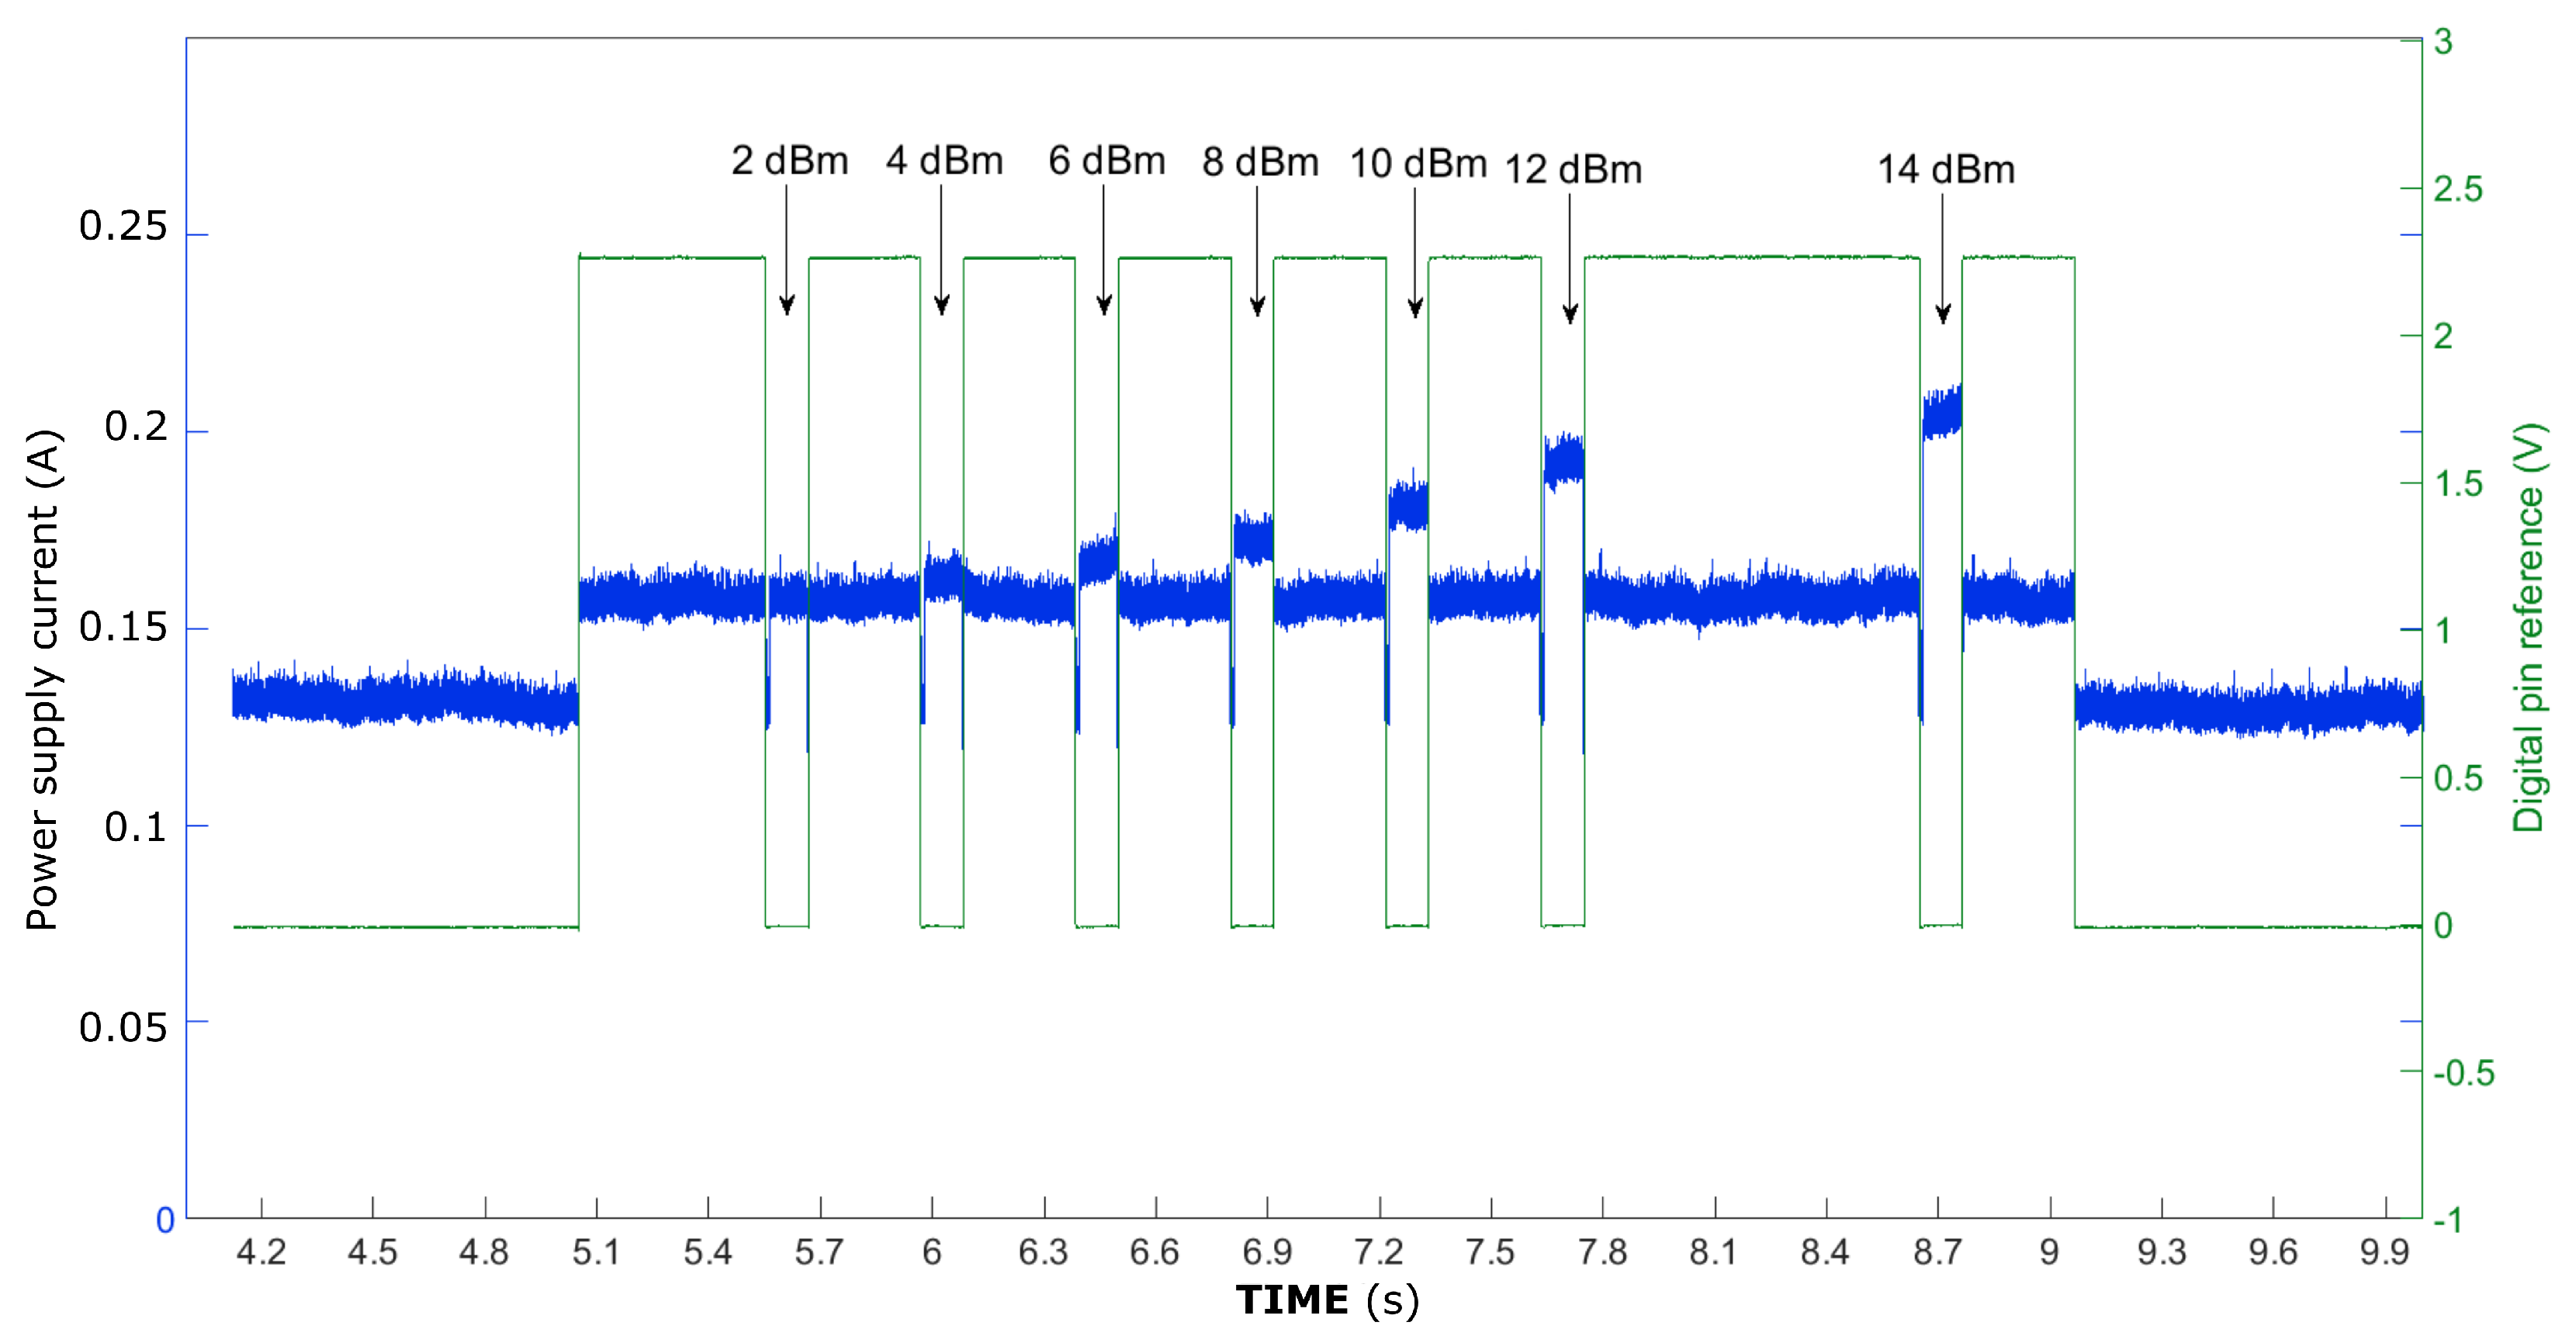
4.1. Sensor nOde Power Consumption Requirements
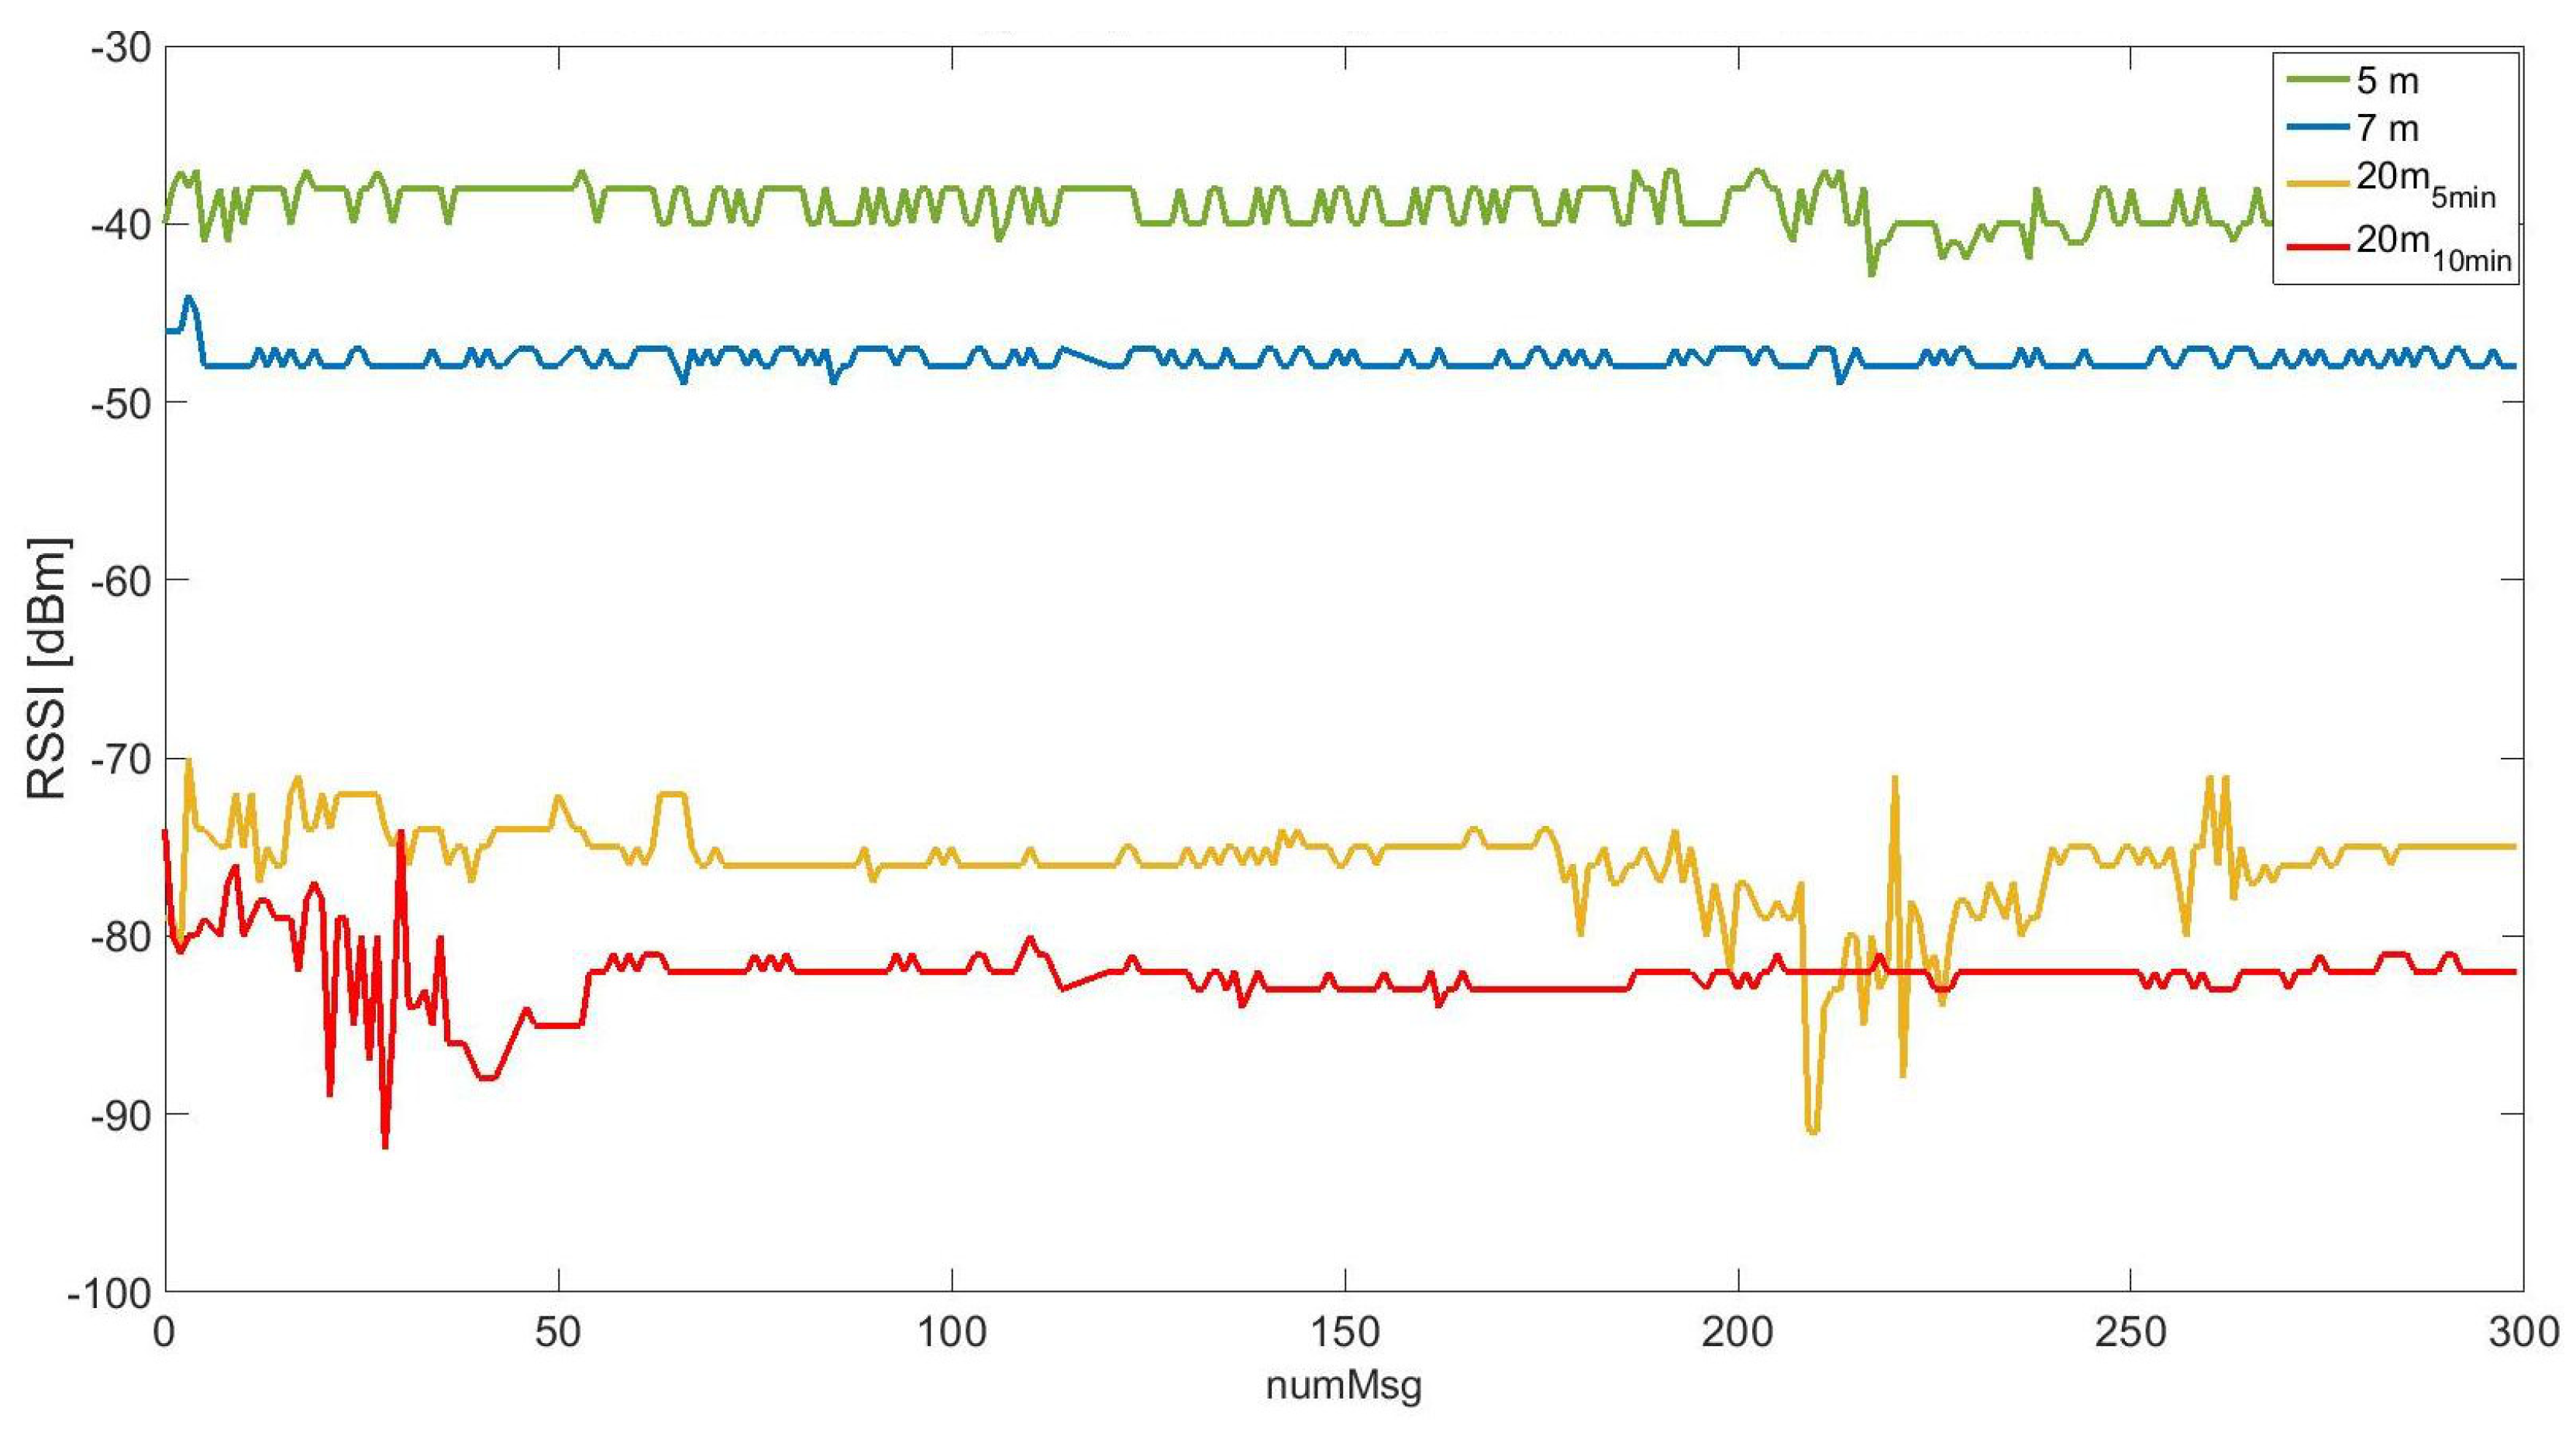
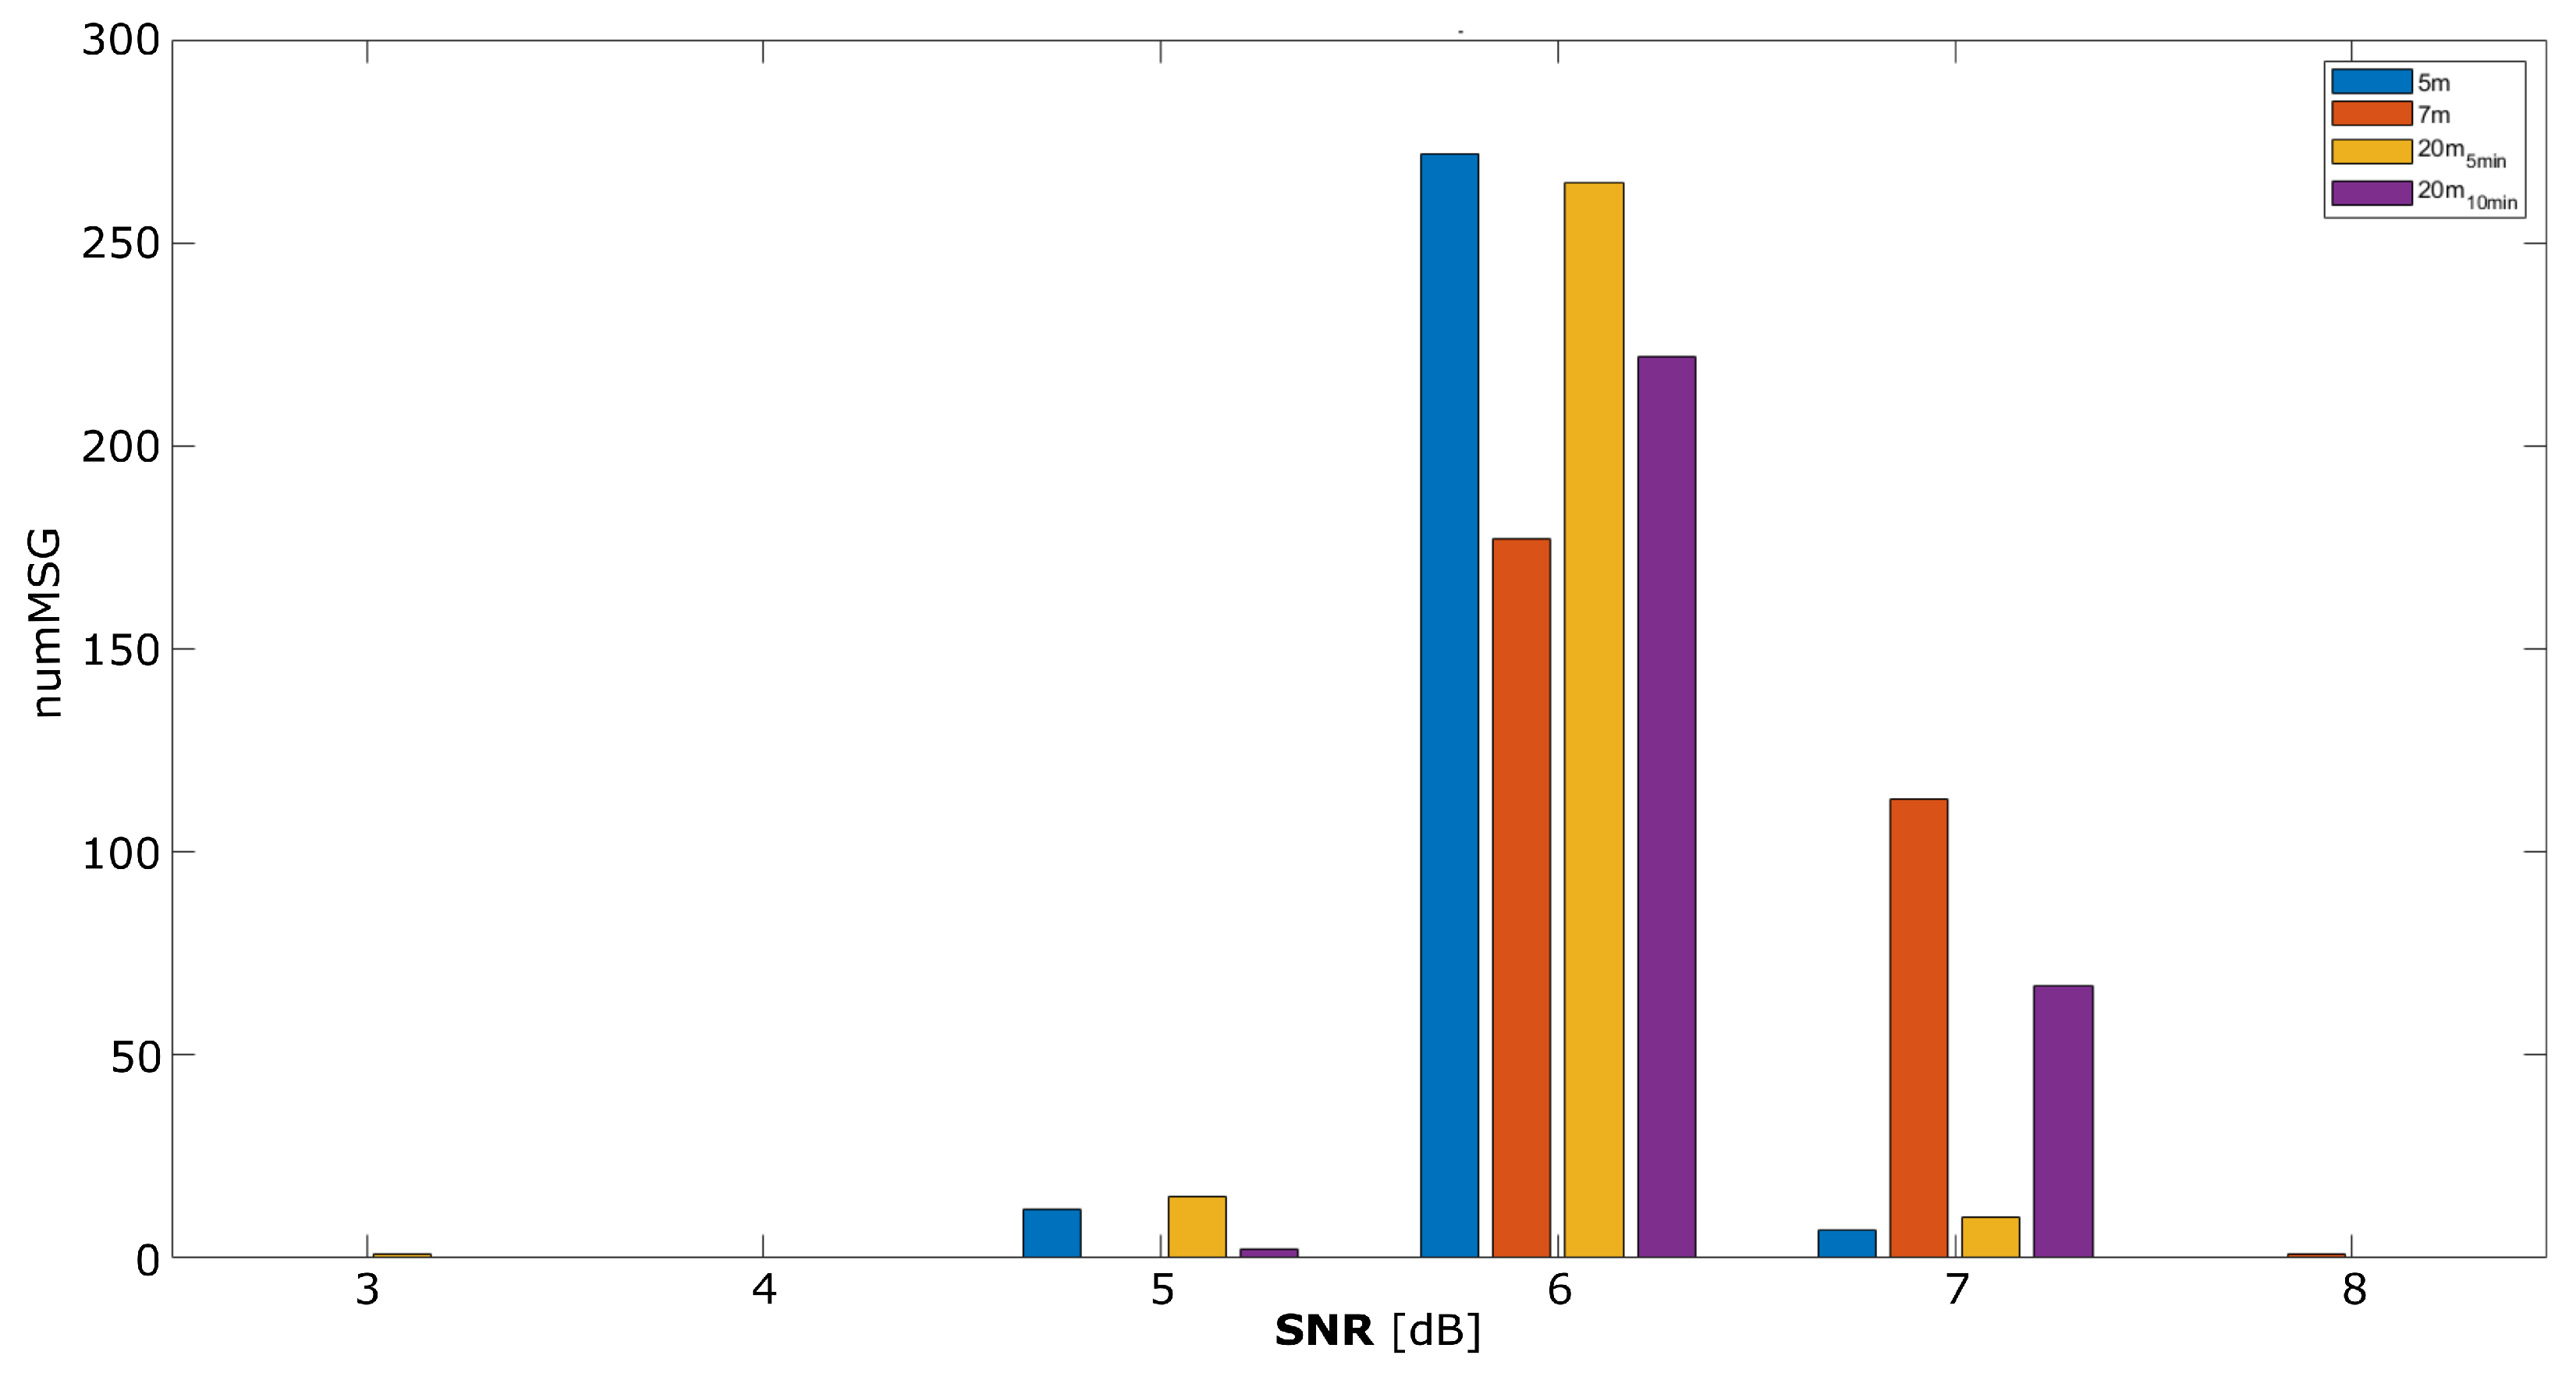
4.2. Node Communication Quality
- Scenario 5m: This represents direct communication over a 5-meter distance with no obstacles. The test was carried out in a laboratory on the first floor of the University of the Balearic Islands.
- Scenario 7m: In this scenario, the two nodes were placed in separate rooms, having a single wall between them.
- Scenario 20m: The most complex scenario, where one node was placed 20 meters away, separated by three walls and an aisle.
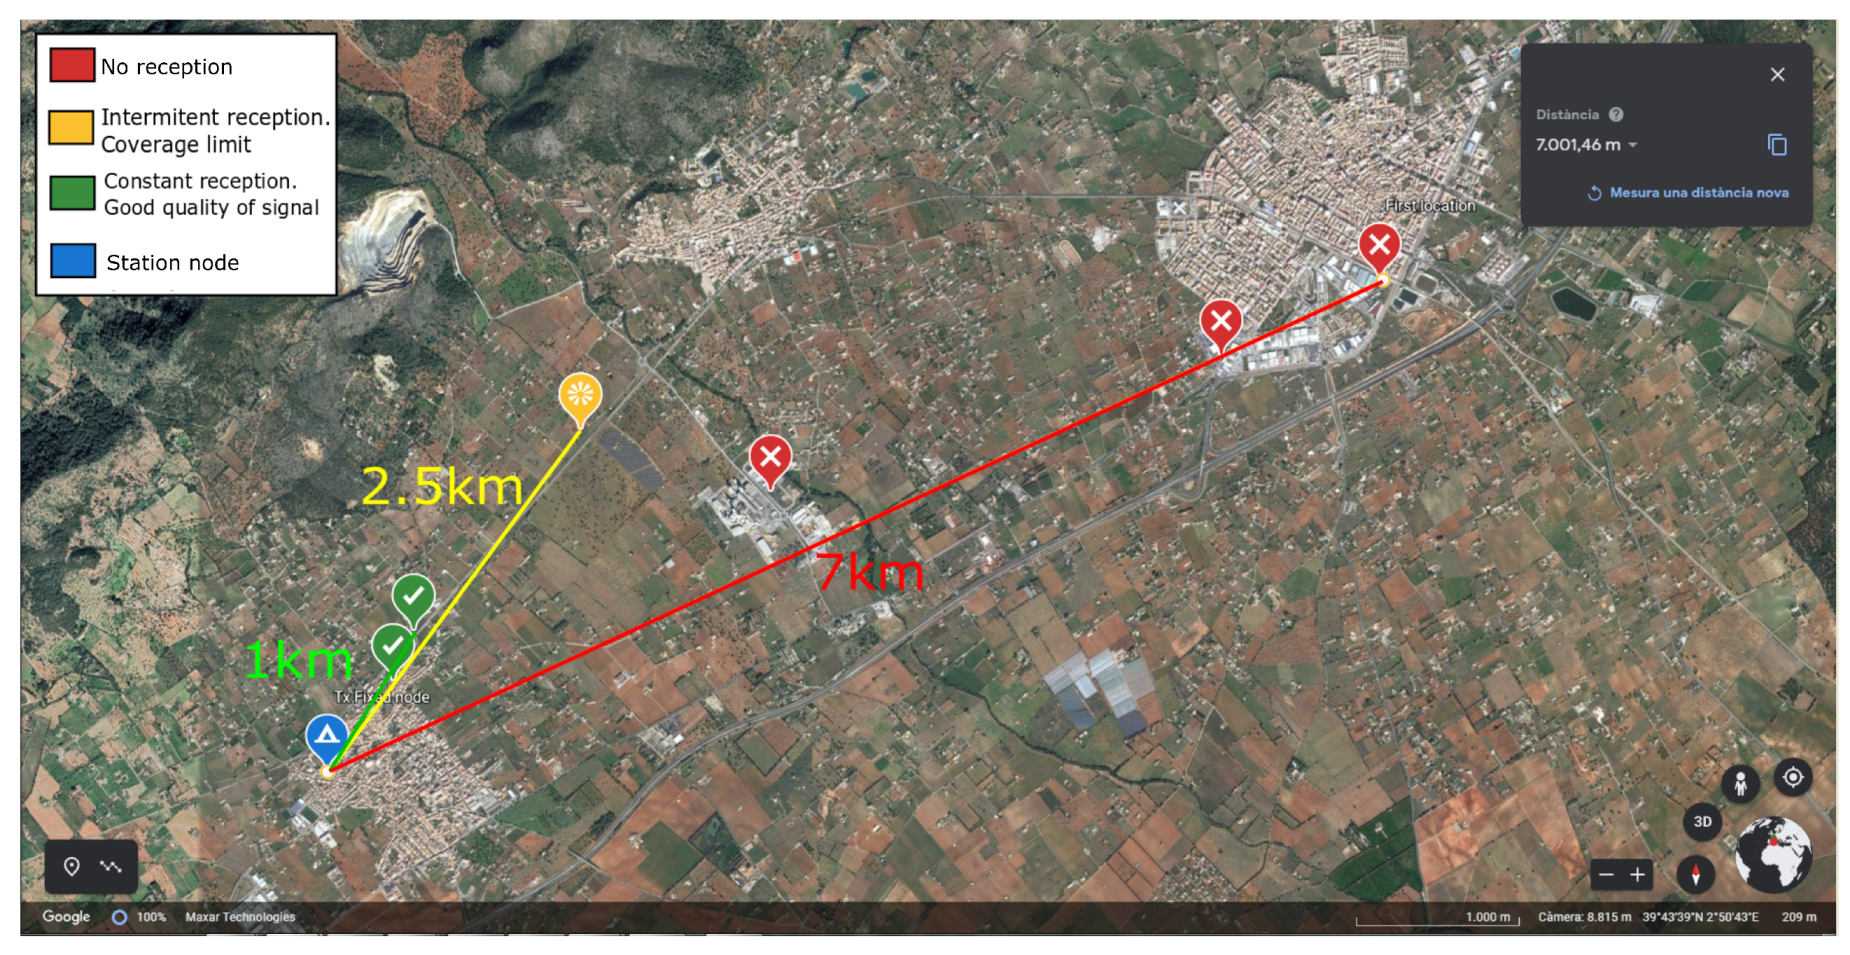
4.3. Point-to-Point Communication
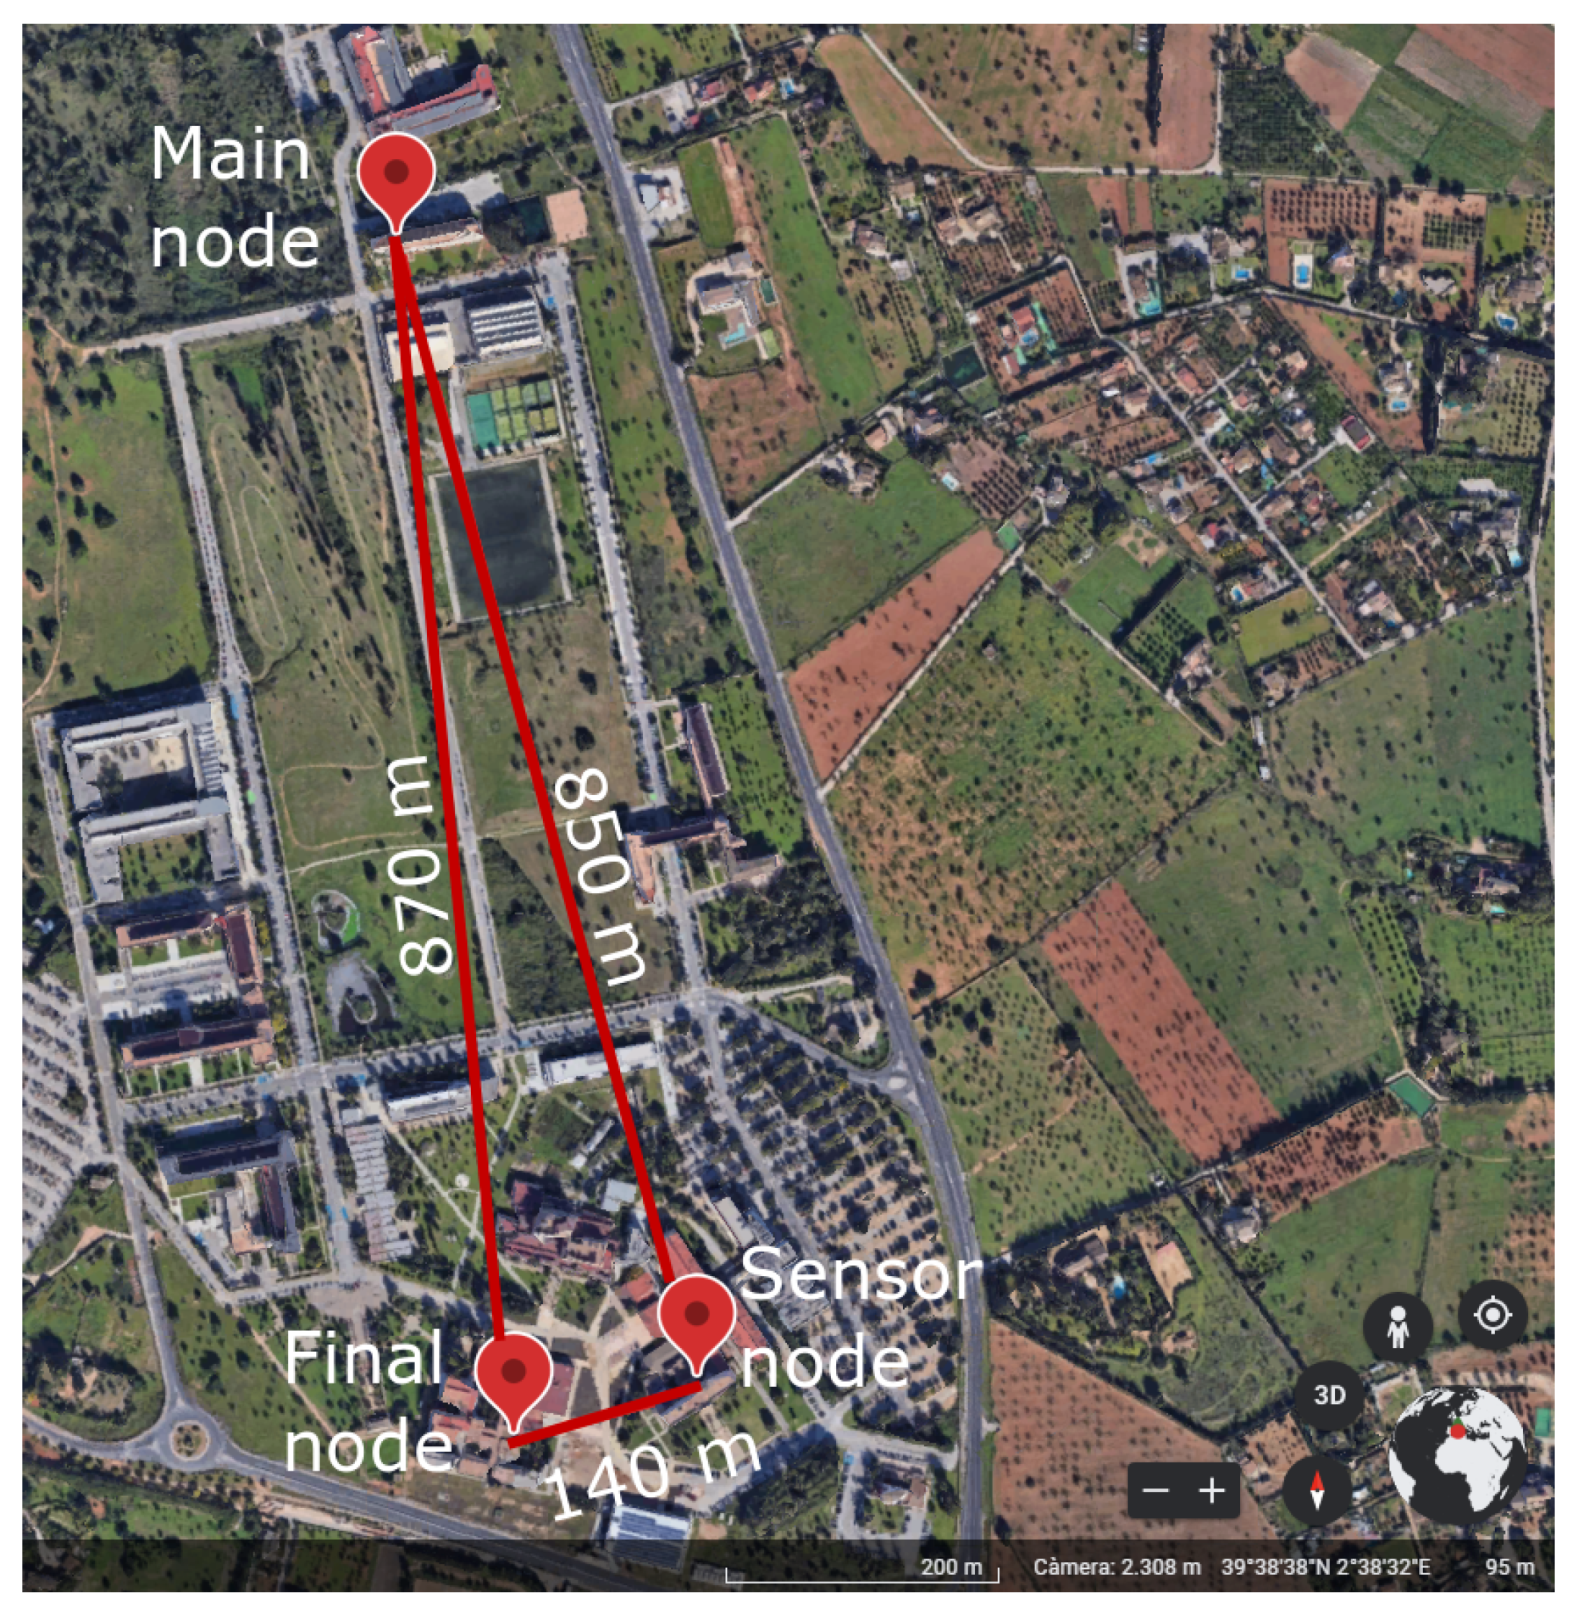
4.4. LoRaBUS Performance Analysis
- The nodelist was correctly generated in various configurations and locations. All BUS nodes successfully recognized which node identifier corresponds to the main, and final node, and also which nodes are its neighbors. Furthermore, in some locations, the Final Node directly received the CONFIG message from the Main Node. While this message could have been interpreted as the nodelist, the Final Node correctly waited for an alternative version and ultimately determined that the version forwarded by the Sensor Node was the correct one.
- The total time elapsed from the moment the Main Node sent the initial CONFIG message to the point where all three nodes had established the nodelist was approximately 1 min and 10 sec (from 00:02:01 to 00:03:12).
- The neighbors’ table of the Main Node and the Sensor Node included the identifiers of the other two nodes. Additionally, the Final Node correctly registered the identifier of the Sensor Node.
- The time required to construct the neighbors’ table was approximately 8 seconds per node, resulting in a total process duration of approximately 14 seconds.
- Following the configuration phase, the Main Node initiated a request for monitored data from the Final Node by sending a TOKEN message. The Sensor Node received this message and forwarded it to the Final Node. In response, the Final Node transmitted the monitored sensor data back to the Main Node, completing the process in 46 seconds. All communications during this phase were conducted using the minimum transmission power level.
- Finally, the Main Node sent a TOKEN to the Sensor Node, and the response was received in 17 seconds. The total time required to collect data from both nodes was approximately 64 seconds.
5. Conclusions
Author Contributions
Funding
Data Availability Statement
Acknowledgments
Conflicts of Interest
References
- Calderaro, V.; Hadjicostis, C.N.; Piccolo, A.; Siano, P. Failure Identification in Smart Grids Based on Petri Net Modeling. IEEE Transactions on Industrial Electronics 2011, 58, 4613–4623. [Google Scholar] [CrossRef]
- Moslehi, K.; Kumar, R. A Reliability Perspective of the Smart Grid. IEEE Transactions on Smart Grid 2010, 1, 57–64. [Google Scholar] [CrossRef]
- Simon, G.; Maróti, M.; Lédeczi, Á.; Balogh, G.; Kusy, B.; Nádas, A.; Pap, G.; Sallai, J.; Frampton, K. Sensor network-based countersniper system. In Proceedings of the Proceedings of the 2nd international conference on Embedded networked sensor systems, 2004; pp. 1–12. [CrossRef]
- Castillo-Effer, M.; Quintela, D.; Moreno, W.; Jordan, R.; Westhoff, W. Wireless sensor networks for flash-flood alerting. In Proceedings of the Proceedings of the Fifth IEEE International Caracas Conference on Devices, Circuits and Systems, 2004.; pp. 20041142–146. [CrossRef]
- Lo, B.P.L.; Thiemjarus, S.; King, R.C.; Yang, G.Z. BODY SENSOR NETWORK – A WIRELESS SENSOR PLATFORM FOR PERVASIVE HEALTHCARE MONITORING. 2005.
- Chinrungrueng, J.; Sunantachaikul, U.; Triamlumlerd, S. Smart Parking: An Application of Optical Wireless Sensor Network. In Proceedings of the 2007 International Symposium on Applications and the Internet Workshops; 2007; pp. 66–66. [Google Scholar] [CrossRef]
- Mohd Kassim, M.R.; Mat, I.; Harun, A.N. Wireless Sensor Network in precision agriculture application. In Proceedings of the 2014 International Conference on Computer, Information and Telecommunication Systems (CITS); 2014; pp. 1–5. [Google Scholar] [CrossRef]
- Wydra, M.; Kubaczynski, P.; Mazur, K.; Ksiezopolski, B. Time-Aware Monitoring of Overhead Transmission Line Sag and Temperature with LoRa Communication. Energies 2019, 12. [Google Scholar] [CrossRef]
- Gascón, D. Redes de Sensores Inalámbricos, la tecnología invisible. Tecnología y sociedad.
- Zeng, H.; Zuo, P.; Deng, F.; Zhang, P. Monitoring System of Transmission Line in Mountainous Area Based on LPWAN. Energies 2020, 13. [Google Scholar] [CrossRef]
- Augustin, A.; Yi, J.; Clausen, T.; Townsley, W.M. A Study of LoRa: Long Range & Low Power Networks for the Internet of Things. Sensors 2016, 16. [Google Scholar] [CrossRef] [PubMed]
- Zhang, X.; Zhang, M.; Meng, F.; Qiao, Y.; Xu, S.; Hour, S. A Low-Power Wide-Area Network Information Monitoring System by Combining NB-IoT and LoRa. IEEE Internet of Things Journal 2019, 6, 590–598. [Google Scholar] [CrossRef]
- Ergen, S.C. ZigBee/IEEE 802.15. 4 Summary. UC Berkeley, September 2004, 10, 11. [Google Scholar]
- Alliance, L. Lorawan specification. LoRa Alliance, 2015; 1–82. [Google Scholar]
- Liu, Y.; Liu, Y.; Xu, H.; Teo, K.L. Forest fire monitoring, detection and decision making systems by wireless sensor network. In Proceedings of the 2018 Chinese Control And Decision Conference (CCDC). IEEE; 2018; pp. 5482–5486. [Google Scholar] [CrossRef]
- Rodriguez-Navas, G.; Ribot, M.A.; Alorda, B. Understanding the Role of Transmission Power in Component-Based Architectures for Adaptive WSN. In Proceedings of the 2012 IEEE 36th Annual Computer Software and Applications Conference Workshops; 2012; pp. 520–525. [Google Scholar] [CrossRef]
- Mobilefish. LoRa/LoRaWAN tutorial 10: RSSI and SNR.
- (ETSI), E.T.S.I. Final Draft ETSI EN 300 220-2 V3.2.1. 33.
- TTN Documentation: Maximum duty cycle. The Things Industries.
- Bobkov, I.; Rolich, A.; Denisova, M.; Voskov, L. Study of LoRa Performance at 433 MHz and 868 MHz Bands Inside a Multistory Building. In Proceedings of the 2020 Moscow Workshop on Electronic and Networking Technologies (MWENT); 2020; pp. 1–6. [Google Scholar] [CrossRef]

| Message Type | Payload |
|---|---|
| CONFIG | CONFIG + power_tx + id1 + id2 +...+ idFinal + checksum |
| STOP | STOP +power_tx + nodelist + idSend + checksum |
| Message Type | Payload |
|---|---|
| DISCOVER | DISCOVER + tx_power + id + checksum |
| DISCOVER_NEXT | DISCOVER_NEXT + tx_power + id_next + checksum |
| DISCOVER_END | DISCOVER_END + tx_power + id + checksum |
| HELLO | HELLO + tx_power + id + checksum |
| Message Type | Payload |
|---|---|
| TOKEN | TOKEN + id_token + id_from + id_to + checksum |
| ALARM | ALARM + id_from + sensor_data + checksum |
| INFO | INFO + id_from + id_to + sensor_data + checksum |
| Mode | Current [mA] | Time [s] | Consumption [mAh] |
|---|---|---|---|
| raw-LoRa Transmitt | 160 | 0,1150 | 0,0051 |
| Idle | 140 | 5 | 0,194 |
| To read sensors | 140 | 5,3 | 0,21 |
| DeepSleep | 7 | 300 | 0,58 |
| Cycle | - | 310,415 | 0,9891 |
| Distance [m] | Messages Sent | Messages Received | PDR[%] |
|---|---|---|---|
| 5 | 300 | 231 | 77 |
| 7 | 300 | 230 | 76,67 |
| 20 | 300 | 239 | 79,6 |
| 20 (10 min) | 300 | 291 | 97 |
| Main Node | Sensor | Final | |
|---|---|---|---|
| Instant Description | Node | Node | Node |
| To install & place the node | 00:00:00 | 00:00:00 | 00:00:00 |
| Sending the first CONFIG msg | 00:02:01 | 00:02:13 | 00:02:15 |
| Receiving the first CONFIG msg | 00:02:14 | 00:02:07 | 00:02:13 |
| Obtaining the nodelist | 00:03:12 | 00:03:11 | 00:03:10 |
| Sending DISCOVER for the 1st time | 00:05:56 | 00:05:31 | 00:05:17 |
| Obtaining its neighbour’s table | 00:06:09 | 00:05:39 | 00:05:36 |
Disclaimer/Publisher’s Note: The statements, opinions and data contained in all publications are solely those of the individual author(s) and contributor(s) and not of MDPI and/or the editor(s). MDPI and/or the editor(s) disclaim responsibility for any injury to people or property resulting from any ideas, methods, instructions or products referred to in the content. |
© 2024 by the authors. Licensee MDPI, Basel, Switzerland. This article is an open access article distributed under the terms and conditions of the Creative Commons Attribution (CC BY) license (http://creativecommons.org/licenses/by/4.0/).


