

Submitted:
30 December 2024
Posted:
02 January 2025
You are already at the latest version
Abstract
In the H2O2/Kerosene bipropellant thruster, a liquid fuel jet is transversely injected into a crossflow of hot oxygen and water vapor, catalytically decomposed from a liquid oxidizer. Due to the high temperature and oxygen-rich environment, kerosene is auto-ignited without the need for an additional ignition source. Hence, fuel trajectory and breakup processes play a significant role in determining the performance of the rocket engine. However, little effort has been made to analyze these characteristics during actual rocket engine operation, mainly due to its harsh operating conditions of high temperature and pressure.In this study, an optically accessible combustion chamber was prepared to visualize the trajectory and breakup processes of the liquid jet during rocket engine operation. Physical and chemical processes inside the chamber were recorded using a high-speed camera utilizing a shadowgraph technique along with chemiluminescence suppression. Hot-fire tests were performed using 90 wt.% hydrogen peroxide and Jet A-1 in various jet-to-crossflow momentum ratios. Test cases with water injection replacing fuel were conducted with varying momentum ratios to identify the effect of the combustion process on the liquid jet. The study revealed that the existing correlations for the liquid jet trajectory commonly used for designing the H2O2/Kerosene bipropellant thruster in the past induced significant errors and suggested that the radiation heat transfer from the combustion flame downstream could affect the breakup processes upstream. A new correlation was suggested that accurately predicts the liquid fuel jet trajectory of the H2O2/Kerosene bipropellant thruster.
Keywords:
liquid jet in crossflow
; hydrogen peroxide/Kerosene bipropellant thruster
; combustion visualization
; parameter optimization
1. Introduction
Recent increases in space accessibility and advances in space mission complexity led to the growing need for a storable, high-performance, in-orbit propulsion system. For such propulsion systems, hydrazine and its derivatives have been the most widely used propellants for their high performance and storability; however, they are highly toxic, carcinogenic, and flammable. Due to the growing safety and health requirements and the resulting increase in development costs, numerous efforts have been made to replace these hazardous propellants with environmentally friendly, green propellants. Highly concentrated hydrogen peroxide is among the most promising candidates. Its low vapor pressure at room temperature leads to excellent stability and storability, making hydrogen peroxide handling considerably easy. Unlike the commonly used storable propellants, hydrogen peroxide is a non-toxic, non-carcinogenic substance. Liquid hydrogen peroxide can be decomposed into gaseous products expressed as , an exothermic reaction with a heat of decomposition of .
To further enhance the capability of hydrogen peroxide, several studies have been performed in recent years worldwide to utilize a liquid hydrocarbon(HC) as a fuel of a bipropellant propulsion system. The University of Purdue developed an H2O2/Kerosene staged-bipropellant rocket engine and performed studies on combustion chamber sizing and hypergolicity tests[1,2]. Korea Advanced Institute of Science and Technology developed a similar bipropellant engine and conducted research related to fuel injection and oxidizer film cooling technologies[3,4,5]. The Warsaw Institute of Aviation has developed and demonstrated a hydrogen peroxide bipropellant propulsion system using various types of fuel, including kerosene, TMPDA, ethanol, and established multidisciplinary optimized design procedures [6,7,8,9]. University of Padova [10] investigated in the combustion chamber cooling mechanism using double co-spinning counter-flowing vortex flow. H2O2/HC bipropellant propulsion system exhibits excellent volumetric specific impulse comparable to the high-performance yet toxic hydrazine bipropellants, making it suitable for the in-orbit propulsion system. The adiabatic decomposition temperature of the gaseous product of the highly concentrated hydrogen peroxide is higher than the auto-ignition temperature of major HC fuels. This feature simplifies the H2O2/HC bipropellant propulsion system by eliminating the need for a separate ignition system.
Figure 1 illustrates the operational concept of the H2O2/HC bipropellant thruster. Liquid hydrogen peroxide is first injected into the catalyst reactor, where it is catalytically decomposed into the gaseous products of hot oxygen gas and water vapor. The liquid fuel is then injected into the product gas and undergoes breakup processes of atomization, vaporization, and mixing. As the mixture gas is well above the auto-ignition temperature, the combustion process occurs spontaneously. The combustion product gas travels through the nozzle and creates thrust.
For the injection of liquid fuel, transverse injection is known to promote stable and efficient combustion, thus being the most widely selected in the design of H2O2/HC bipropellant thrusters. This injection method is employed to improve the performance of the systems with low jet-to-crossflow momentum ratio, making it suitable for the current propulsion system with a high OF ratio compared to other types of propellant combinations. As shown in Figure 2, a liquid jet introduced into the gaseous crossflow experiences aerodynamic forces that intensify the surface instabilities of the liquid column, thus dismantling it into ligaments and further into droplets.
Past studies revealed that the liquid jet in crossflow(LJICF) phenomenon plays a vital role in the performance of the H2O2/HC bipropellant propulsion system. Sisco et al. [2] studied the characteristics of auto-ignition with respect to the jet trajectory and predicted that overpenetration of the fuel jet is likely to increase the probability of failure in auto-ignition. Heo et al. [4] investigated the effect of jet penetration on combustion efficiency and suggested that the penetration depth between 44% and 72.4% of the chamber radius be optimal for the fuel injector design. For these studies, researchers used empirical correlations to predict the trajectory of the jet trajectory suggested by Wu et al[1,2,4,11,12]. Wu derived his jet trajectory correlation by injecting various liquids into the standard temperature and pressure(STP) subsonic gas. The positions of the observed liquid column from the injection to the fracture points were fitted to the general form of the jet trajectory equation which is primarily dependent on the jet-to-crossflow momentum ratio (q) as shown in Equation 1. Similarly, Cieliski et al conducted the cold flow tests and observed LJICF phenomenon to obtain the design configuration of the throttleable liquid propulsion demonstrator[7].
However, the condition inside the combustion chamber is high-temperature and high-pressure (HTHP), accompanied by a vigorous combustion process. The consequential difference in both liquid and gas properties leads to severe distortion of jet trajectory and penetration depth estimations based on previous studies. There were a few studies to derive jet trajectory correlations under HTHP conditions[13,14,15]. However, these studies were carried out at a maximum pressure and temperature of 20 bar and 650 K without combustion process, far less than the operating conditions of a rocket engine combustion chamber.
In this research, the LJICF phenomenon was observed at the combustion chamber of the H2O2/kerosene bipropellant thruster while conducting the hot-fire tests. A combustion chamber with a film-cooling optical window was utilized for the chemiluminescence-suppressed shadowgraph visualization of the liquid column and the breakup process. Test campaigns with different jet-to-crossflow momentum ratios were conducted by altering the oxidizer tank pressure, and thus, changing the mass flow rate of the crossflow gas. Two different types of liquid(water and kerosene) were injected through the transverse fuel injector to identify the effect of combustion and the resulting flame radiation on the LJICF trajectory. The images obtained from the hot-fire tests were analyzed for the assessment of the empirical correlations suggested in past studies. Moreover, a new correlation, suited for use under HTHP conditions accompanied by a combustion process, was derived based on the experimental data.
2. Experimental Setup
2.1. 100N H2O2/Kerosene Bipropellant Thruster
A bipropellant thruster with a thrust of 100N at sea level was designed using 90 wt.% hydrogen peroxide as an oxidizer and Jet A-1 as a fuel. The quality of the hydrogen peroxide used in hot-fire tests satisfied the MIL-PRF-16005F requirements [16]. The design parameters and expected performance were obtained on the basis of the NASA Chemical Equilibrium and Applications(CEA) code[17]. The design parameters of the H2O2/Kerosene bipropellant thruster are shown in the Table 1 and the designed thruster with operating schematics is shown in Figure 3.
As shown in Figure 3 and Figure 4, a single circular orifice fuel injector with an orifice diameter of 0.564 mm was mounted downstream of the catalytic reactor. Rearward-facing step for flame holding was excluded from the design to prevent any effect of flow recirculation on the LJICF phenomenon. Two 15mm thick optical windows made of NC-200 quartz were installed on both sides of the combustion chamber and sealed with Klinger gaskets and Viton o-rings. The softness of the gasket and o-ring components dampened the structural vibration exerted on the window, preventing possible cracks. The connector installed between the catalytic reactor and the combustion chamber has a 1 mm thick slot on both sides for the injection of film-cooling N2 gas.
The NC-200 quartz material can withstand the high pressure of compression strength of up to 1.1 GPa and high temperature of up to 1,600 K. However, the combustion product may reach up to 2,700 K, exceeding the capability of the material. Hence, the film cooling on the interior surface of the windows using N2 gas was implemented to prevent thermal shock cracks. Furthermore, the gas film cooling alleviated soot deposition created by the incomplete combustion. As illustrated in Figure 5, CFD analysis using ANSYS Fluent® was performed assuming the worst case scenario of crossflow with the temperature of the combustion gas to confirm that the N2 gas is effectively cooling the optical window under 1,000 K, well below the window’s maximum operating condition. Moreover, the results proved that the addition of film-cooling gas does not affect the mole fraction at the region where the primary breakup and combustion processes occur, indicating the negligible interference caused by the implementation of N2 gas film cooling.
Lastly, the MnO2/PbO/Al2O3 catalyst was selected for the decomposition of the liquid oxidizer. Commercially available -alumina pellets were crushed, polished, and screened with a sieve of mesh size from 10-16 (1.19 - 2.20 mm) to be used as the catalyst support. The active agents of the catalyst are manganese oxide and lead(II) oxide which were attached to the surface of the catalyst support using the wet impregnation method. The particles were immersed in a precursor, sodium permanganate solution(NaMnO4) and lead(II) oxide solution, then dried and calcinated. Impurities, such as sodium ions, were washed out with distilled water followed by a final calcination process. The size of the catalyst bed was determined following the design optimization criteria suggested by Jung et al[18]. The images of the fabricated and integrated combustion chamber of the H2O2/Kerosene bipropellant thruster are shown in Figure 6.
The schematic diagram of the propellant feeding system and the actual image of the experimental setup are shown in Figure 7 and Figure 8, respectively. The tanks of each propellant are pressurized by a high-pressure N2 gas. The flow of the propellants was controlled using pneumatic and solenoid valves. The temperature and pressure data were acquired at a rate of 40,000 samples and 80 samples per second, respectively, using a data acquisition system (Chassis: SCXI-1000, Voltage module: SCXI-1120 with SCXI-1320 terminal, Thermocouple module: SCXI1112, National Instruments Corporation, USA) equipped with the LabVIEW program. K-type thermocouples (Omega Engineering Inc., USA) and pressure transducers (Sensys Inc., South Korea, and Kulite Inc., USA) were used to measure temperature and pressure. The mass flow rate of the propellants was obtained utilizing the orifice plate differential pressure mass flow meter.
2.2. Combustion Visualization Setup
In this study, the backlit shadowgraph technique with chemiluminescence suppression was used to visualize the LJICF phenomenon. Shadowgraph is an optical method that reveals the nonuniformities of the media. As the liquid mostly blocks the transmission of light, it is possible to effectively distinguish and detect the liquid jet from gaseous crossflow. Additionally, to acquire a clear image, it is necessary to suppress the chemiluminescence generated by the combustion flame. The flame radiation spectrum for the oxygen-kerosene combustion process illustrated by Harrje et al[20] reveals that the peak intensity of radiation occurs at approximately 300, 420, and 500 nm wavelength caused by OH, CH, and C2 radicals, respectively. It is impossible to block entire flame radiation within the visible light spectrum due to the carbon continuum, however, it is possible to minimize the effect by filtering all but a narrow bandwidth of 450 - 500 nm wavelength. In this study, a high-power blue LED of 400 - 500 nm wavelength was used as a backlit illumination device. The light diffuser panel was mounted in front of the blue LED arrays to evenly distribute the intensity of the floodlight. BP470 blue bandpass filter (Midwest Optical System Inc., USA) with a bandpass spectrum of 425 - 495 nm was used to filter combustion-induced chemiluminescence. As a result, the bandpass spectrum of 425 - 495 nm can be observed through the visualization setup. To obtain visual data, FASTCAM UX-100 (Photron Inc., Japan) was used at 4,000 frames per second, 1280×1024 resolution, and 1/200,000 shutter speed. The conceptual schematics of the shadowgraph visualization setup and the images from the test stand are shown in Figure 9 and Figure 10. A scale bar was inserted in the combustion chamber before the experiment to derive the actual spatial position of the liquid jet from the recorded images.
3. Hot-Fire Tests
3.1. Mono-Mode Operation
The H2O2/Kerosene bipropellant thruster, propellant feeding system, and visualization setup were first validated by mono-mode operation. In the mono-mode, liquid was not injected through the fuel injector, and only liquid hydrogen peroxide was fed into the catalyst reactor. The measurement data depicted in Figure 11 revealed a successful mono-mode operation. The temperature downstream of the catalytic reactor achieved a nearly ideal adiabatic decomposition temperature of 1,050 K. There was no leakage through the optical window. Furthermore, the window was also capable of withstanding the mono-mode without N2 gas film cooling, showing that the thermal shock crack could be prevented if the temperature at the interior surface of the optical window is kept under 1,050 K. When injecting the N2 gas, condensation of the water vapor from the decomposition product gas occurred and disrupted the visibility of the window as shown in Figure 12. However, this issue was not concerning in the bi-mode operation with fuel injection as the heat radiated from the combustion flame would effectively diminish the effect of the condensation.
3.2. Bi-Mode Operations
Before conducting the bi-mode hot fire tests, a test campaign was carried out utilizing a set of dummy windows to specify the operating condition of the N2 gas film cooling system. Two 15mm thick stainless steel dummy walls were installed with thermocouples that reach the interior surface of the combustion chamber, as shown in Figure 13. Then, the pressure for the N2 injection that induces the gas mass flow rate sufficient to restrict the window overheat was iteratively investigated.
Bi-mode operations were conducted in two test campaigns with different liquids injected through the fuel injector: kerosene and water. First, the fuel injection bi-mode test campaign was conducted in different jet-to-crossflow momentum ratios shown in Table 2. The difference in jet-to-crossflow momentum ratio (q) was achieved by changing the pressure at the oxidizer tank, thus altering the mass flow rate of the decomposition product gas through the combustion chamber.
Afterward, the water injection bi-mode test campaign was carried out following the test condition listed in Table 3. Through the water injection bi-mode operation, it is possible to maintain the crossflow characteristics and identify the effect of combustion and consequent radiation heat transfer on the LJICF phenomenon. The name of each test case follows the following labeling format: Pio(HP)PiL(L), where PiX is the tank pressure of the X propellant in a bar unit and L is the type of liquid injected through the fuel injector, F for fuel and W for water. Each test campaign was conducted within a single day using identical catalyst in the order from low to high oxidizer tank pressure test case.
The bi-mode operation was conducted sequentially as depicted in Figure 14. As can be seen in the operation sequence, the bi-mode operation was gradually transitioned from and to the mono-mode to prevent sudden temperature changes, thus minimizing the risk of thermal shock cracking of the optical window. N2 gas film cooling was activated throughout the 10 seconds of oxidizer duration. The high-speed camera recorded the images for nearly 1 second (approximately 4,000 images) during the 3-second bi-mode operation.
As a result of the bi-mode test campaign, all test cases succeeded in auto-ignition as shown in Figure 15. As illustrated in Figure 16, the LJICF phenomenon is only observable with the proper chemiluminescence suppression due to the high-intensity flame radiation. It was also possible to observe a dark zone downstream of the liquid jet, in which the soot generated from the locally low OF ratio condition blocked the backlit illumination. On the other hand, the bright zone located in the upper and lower parts of the main soot generation is likely to be caused by either CH or C2 radicals caused by the locally high OF ratio condition.
Figure 17 shows the pressure and temperature measurement data obtained from the fuel injection bi-mode operation with the oxidizer tank pressure of 25 bar (Figure 17 a, b) and 32 bar (Figure 17 c, d). Pressure at the combustion chamber changed following the operation sequence explained in Figure 14 and achieved the nominal value of 19-23 bar as designed without significant combustion instability. The temperature downstream of the catalytic reactor reached the adiabatic decomposition temperature of 90 wt.% hydrogen peroxide, indicating the complete decomposition of the injected liquid oxidizer.
Figure 18 illustrates the pressure and temperature measurement data obtained from the water injection bi-mode operation with the oxidizer tank pressure of 30 bar. The chamber pressure did not experience any notable pressure disturbance or increase in pressure during water injection and achieved a nominal pressure of 16-17 bar. The temperature downstream of the catalytic reactor reached the adiabatic decomposition temperature of 90 wt.% hydrogen peroxide, indicating the complete decomposition of the injected liquid oxidizer.
Figure 19 illustrates the intensity of the pressure perturbation at the catalyst bed downstream and the chamber for both hot fire test campaigns. Each test campaign, fuel and water injection, consists of 4 and 3 consecutive hot-fire tests using identical catalyst loaded into the reactor. Table 4 indicates minor increase of pressure perturbation gradually over the duration of the test campaigns. This is likely to be caused by the gradual degradation of the catalyst, however, the reactor was capable of fully decomposing the injected liquid oxidizer and the perturbations were limited. Nevertheless, the increased pressure perturbation may cause the instability of the breakup processes of the liquid jet. This was mitigated by taking the time-averaged value of the optical measurement data, which will be described further in Section 4.1
4. Combustion visualization
4.1. Image Processing
The raw images obtained from the combustion chamber were examined to observe the LJICF phenomenon. As shown in the left image of Figure 20, the flawless visualization image contains several features to be recognized. The liquid column can be distinguished as a dark vertical line starting from the fuel injection orifice. The primary breakup point can be specified as the other end of this column. Since the forced convection by the crossflow is the unsteady process and induces perturbation of the primary breakup point, an average value was taken over the time span of optical measurement to designate the breakup point corresponding to each test case. The small particles next to the column represent the droplet generation as a result of the surface breakup process. The dark zone on the right side is suspected to be created by the soot particles from the incomplete combustion process. On the contrary, the bright zone on top and bottom of the soot-induced dark zone most likely coincides with the stoichiometric reaction zone and is caused by the radiation of CH radicals. In some test cases, the visualization images might be poor in quality as shown in the images in the middle and the right of Figure 20. Images obtained from the later part of the test campaign are often disrupted by continuous deposition of soot on the interior surface of the optical window, even with the N2 film cooling. In addition, slight dislocation of the high-speed camera can lead to capturing out-of-focus images.
Therefore, it was necessary to find a solution to effectively process these images so that the liquid jet trajectory can be extracted for every test case even with flaws. Figure 21 shows the conceptual diagram of imaging processing procedures for the combustion visualization images. First, the raw image obtained from the high-speed camera is converted into a grayscale. Second, the intensity of the grayscale image is adjusted so that its contrast is intensified. Third, an image segmentation tool from the MATLAB® image processing toolbox was utilized using an adaptive threshold algorithm to effectively distinguish the liquid column from the deposited soot and scattering droplets. Here, local graph cuts of sections were also used to generate clearer images. Lastly, the images obtained from the recording period (1 second, approximately 4,000 images) were all processed identically and then averaged over time. Lastly, the jet trajectory was extracted by manual selection and interpolation of the pixels in the liquid column. The average images and the jet trajectories for each test case are shown in Figure 22.
5. Results and Discussions
The extracted trajectory data obtained from the average images shown in Figure 22 were compared with the empirical correlations suggested in past studies. Here, the errors between the actual trajectory and the predicted ones from the empirical correlations were measured using a root mean square error (RMSE). RMSE is a frequently used measure of differences between values predicted by a model or an estimator and the values observed are calculated as expressed in Equation 2.
5.1. Comparison with Previous Correlations
Four correlations were selected from previous studies and compared with observation data acquired from the experiments. As mentioned in Sec Section 1, Wu’s correlation [11] derived from the STP crossflow condition was widely utilized in designing several H2O2/HC bipropellant thruster[1,2,4]. Correlations based on high-temperature standard-pressure (HTSP, Yoon et al.[21]) and high-temperature high-pressure (HTHP, Li et al.[15] and Bellofiore et al.[13]) were also chosen for the comparison. The correlations of these references are expressed in Table 5.
The results of the comparison are listed in Table 6. It was revealed that Wu’s correlation, the most widely used in designing the H2O2/HC bipropellant thruster, is inaccurate in the combustion chamber environment. This significant error is likely caused by the increase in gas viscosity due to the high-temperature condition[22] and the non-dimensional parameters being out of the range tested from the reference, specifically the jet-to-crossflow momentum ratio. Note that some thruster designs of the past studies situated within the non-dimensional parameter range suggested in these correlations which may lead to more accurate estimations. The correlation of HTSP delivered more accurate estimation compared to STP, but still with considerable error. It accounted for the effect by the high temperature crossflow, such as the change of viscosity, however, did not consider the effect of the increased in pressure on the aerodynamic forces and the resulting primary breakup processes. Unlike STP and HTSP condition correlations, HTHP correlations, especially the prediction from the Bellofiore’s correlation, estimated with acceptable accuracy. Both correlations from Li and Bellofiore account for the changes of crossflow gas properties caused by the increase in pressure and temperature. It is worth noticing that the error between the observation data and the prediction using Bellofiore’s correlation tends to decrease as the mass flow rate of the crossflow increases, or in other words, as the jet-to-crossflow momentum ratio (q) decreases. This is because the range of q validated for the Bellofiore’s correlation is limited between 12.2 and 71.4, and the momentum ratios for all test cases for this study were above 175. Taking into account the range of operating conditions for correlation validity, the 20(HP)25(W) test case was neglected due to the exceptionally high q of 1170.4. Based on the comparison results, it is clear that the correlations of past studies are not accurate nor suited for the combustion chamber condition of the current H2O2/Kerosene bipropellant thruster.
5.2. Derivation of a New Correlation
A new correlation for the LIJCF suitable for use in the current design of the H2O2/kerosene bipropellant thruster was derived by evaluating the jet breakup positions in terms of the liquid jet (z) and gas crossflow (x) coordinates and the normalized trajectories of and . The normalized z-axis jet breakup position () and the x-axis jet breakup position () obtained from the combustion visualization experiments observation data were plotted as a function of a number of dimensionless parameters illustrated in Figure 24 and Figure 25. In this study, the jet-to-crossflow momentum ratio , the gas Reynolds number , and the gas Weber number were chosen based on previous studies [13,23]. The main difference from other LJICF studies was the consider the effect of the radiation heat transfer from the combustion flame to the crossflow. Existing correlations failed to accurately predict both liquid jet trajectories of the fuel and water injected hot-fire test cases. Since the crossflow conditions were similar in terms of pressure and temperature, it seemed that the combustion process occurring downstream affects the breakdown process of the liquid jet upstream through a radiation heat transfer. Hence, to account for the effect of heat radiation from the combustion process on the jet primary breakup, a dimensionless Boltzmann number, , was implemented to the correlation. Here, is the Stefan-Boltzmann constant, and represent the gas temperature upstream and downstream of the LJICF phenomenon, assumed to be the adiabatic decomposition temperature of the liquid hydrogen peroxide and adiabatic combustion temperature. Empirical correlations between the jet breakup positions and the dimensionless parameters were assumed to follow a general form of the power law expressed in Equation 3. Here, represents the jet breakup position of the coordinates, is the jet orifice diameter, and the letters A to E represent the unknown parameters of the correlation that need to be fitted to the observed trajectories for each test case.
Nonlinear regression was performed to derive the empirical correlations of normalized jet breakup positions with the dimensionless parameters as expressed in Equation 4. Optimization processes were carried out using nonlinear regression using the MATLAB® Statistics toolbox to identify the five unknown parameters that best fit all data sets. The newly derived correlations indicate good agreements with experimental data with 0.965 and 0.927 as the coefficient of determination ().
The normalized trajectories using breakup positions as normalizing factors for each coordinate can be used for the assessment at different operating conditions [13,23,24]. The normalized trajectories and their average are shown in Figure 26, along with the empirical correlation derived from the data sets. Here, the correlation was assumed to adhere to the power-law and could be derived as follows:
6. Conclusions
The LJICF phenomenon was observed through combustion visualization using the chemiluminescence-suppressed shadowgraph technique in the H2O2/Kerosene bipropellant thruster. A combustion chamber with an optical window and N2 gas film cooling was designed and fabricated for the hot-fire tests. The hot-fire tests were conducted in two different test campaigns, each injecting Jet A-1 and water through the transverse fuel injector. The raw images obtained from the hot-fire tests visualization were edited with a series of image processing to extract the liquid jet trajectory data. The comparison between the observed and the predicted trajectories based on past studies revealed that the prior thruster designs may based on inaccurate empirical correlations. It is most likely caused by not accounting for the increased viscosity of the high-temperature crossflow and the radiation heat transfer from the downstream combustion process. It is worth noting that the thruster design of the current study accompanies a higher jet-to-crossflow momentum ratio than most of the past empirical correlations. Thus, past thruster designs may not have experienced such drastic differences between the intended and the actual liquid jet trajectory as suggested in this study. In any case, compensating the LJICF prediction could contribute to the optimal design and performance improvement of the propulsion system. Therefore, a new correlation accounting for the high temperature and high-pressure crossflow and the heat transfer from the flame radiation was derived based on the observation data obtained from the hot-fire tests. Through a multi-objective optimization process using nonlinear regression, it was possible to derive the empirical correlation that achieves high accuracy for the HTHP condition of a rocket combustion chamber with or without the trailing combustion process.
Author Contributions
Conceptualization, Suk Min Choi and Sangwoo Jung; Formal analysis, Suk Min Choi; Funding acquisition, Suk Min Choi and Sejin Kwon; Investigation, Suk Min Choi, Vincent Ugolini and Sangwoo Jung; Methodology, Suk Min Choi; Project administration, Suk Min Choi and Sejin Kwon; Software, Suk Min Choi; Supervision, Sejin Kwon; Validation, Suk Min Choi; Visualization, Suk Min Choi, Vincent Ugolini and Sangwoo Jung; Writing – original draft, Suk Min Choi.
Funding
This work was supported under the framework of an international cooperation program managed by the National Research Foundation of Korea (NRF-2023K2A9A2A1500018011, FY2023).
Data Availability Statement
The data presented in this study are available on request from the corresponding author.
Conflicts of Interest
No conflict of interest exists in the submission of this manuscript, and the manuscript is approved by all authors for publication. I would like to declare on behalf of my co-authors that the work described was original research that has not been published previously, and is not under consideration for publication elsewhere, in whole or in part. All the authors listed have approved the manuscript that is enclosed.
References
- Miller, K.J.; Sisco, J.C.; Austin, B.L.; Martin, T.N.; Anderson, W.E. Design and ground testing of a hydrogen peroxide/kerosene combustor for RBCC application. In Proceedings of the 39th AIAA/ASME/SAE/ASEE Joint Propulsion Conference and Exhibit. American Institute of Aeronautics and Astronautics Inc. 2003. [Google Scholar] [CrossRef]
- Sisco, J.C.; Austin, B.L.; Mok, J.S.; Anderson, W.E. Autoignition of kerosene by decomposed hydrogen peroxide in a dump combustor configuration. 39th AIAA/ASME/SAE/ASEE Joint Propulsion Conference and Exhibit 2003, 21. [Google Scholar] [CrossRef]
- Jo, S.; An, S.; Kim, J.; Yoon, H.; Kwon, S. Performance Characteristics of Hydrogen Peroxide/Kerosene Staged-Bipropellant Engine with Axial Fuel Injector. Journal of Propulsion and Power 2011, 27, 684–691. [Google Scholar] [CrossRef]
- Heo, S. Design and Validation of Hydrogen Peroxide/Kerosene Bipropellant Thruster. PhD thesis, Korea Advanced Institute of Science and Technology, 2018.
- Jang, D.; Kwak, Y.; Kwon, S. Design and validation of a liquid film-cooled hydrogen peroxide/kerosene bipropellant thruster. Journal of Propulsion and Power 2015, 31, 761–765. [Google Scholar] [CrossRef]
- Okninski, A.; Bartkowiak, B.; Sobczak, K.; Kublik, D.; Surmacz, P.; Rarata, G.; Marciniak, B.; Wolanski, P. Development of a Small Green Bipropellant Rocket Engine Using Hydrogen Peroxide as Oxidizer. In Proceedings of the 50th AIAA/ASME/SAE/ASEE Joint Propulsion Conference, Reston, Virginia; 7 2014; pp. 1–10. [Google Scholar] [CrossRef]
- Cieśliński, D.; Okninski, A.; Bartkowiak, B.; Okniński, A.; Ranachowski, M.; Sekrecki, M.; Surmacz, P.; Kutnik, K.; Gorgeri, A.; Marciniak, B.; et al. Liquid throttleable engine utilizing high-test peroxide-green storable propulsion solution for future space transportation. Technical report, 2022.
- Surmacz, P.; Sobczak, K.; Bartkowiak, B.; Greg Rarata, G.; Surmacz, P.; Rarata, G.; Okninski, A.; Mayer, T.; Wolanski, P.; Valencia Bel, F. Development Status of 500 N-class HTP/TMPDA Bi-propellant Rocket Engine. Technical report, 2018.
- Okninski, A.; Kindracki, J.; Wolanski, P. Multidisciplinary optimisation of bipropellant rocket engines using H2O2 as oxidiser. Aerospace Science and Technology 2018, 82-83, 284–293. [Google Scholar] [CrossRef]
- Santi, M.; Fagherazzi, M. ; Barato. , F.; Pavarin., AIAA, 2020, D. Design and testing of a hydrogen peroxide bipropellant thruster. In Proceedings of the AIAA Propulsion and Energy 2020 Forum. American Institute of Aeronautics and Astronautics Inc; pp. 1–18. [Google Scholar] [CrossRef]
- Wu, P.K.; Kirkendall, K.A.; Fulle, R.P.; Nejad, A.S. Breakup processes of liquid jets in subsonic crossflows. Journal of Propulsion and Power 1997, 13, 64–73. [Google Scholar] [CrossRef]
- Broumand, M.; Birouk, M. Liquid jet in a subsonic gaseous crossflow: Recent progress and remaining challenges. Progress in Energy and Combustion Science 2016, 57, 1–29. [Google Scholar] [CrossRef]
- Bellofiore, A.; Cavaliere, A.; Ragucci, R. Air density effect on the atomization of liquid jets in crossflow. Combustion Science and Technology 2007, 179, 319–342. [Google Scholar] [CrossRef]
- Masuda, B.J.; McDonell, V.G. Penetration of a recessed distillate liquid jet into a crossflow at elevated pressure and temperature. In Proceedings of the ICLASS; 2006. [Google Scholar]
- Li, L.; Lin, Y.; Xue, X.; Gao, W.; Sung, C.J. Injection of Liquid Kerosene Into a High-Pressure Subsonic Air Crossflow From Normal Temperature to Elevated Temperature. In Proceedings of the Volume 2: Combustion, Fuels and Emissions, Parts A and B. American Society of Mechanical Engineers; 6 2012; pp. 877–884. [Google Scholar] [CrossRef]
- U.S. Dept. of Defense. Propellant, Hydrogen Peroxide. Technical report, 1968.
- McBride, B.J.; Gordon, S.; McBride, B.J. Computer Program for Calculation of Complex Chemical Equilibrium Compositions and Applications, 1994.
- Jung, S.; Choi, S.; Kwon, S. Design optimization of green monopropellant thruster catalyst beds using catalytic decomposition modeling. 53rd AIAA/SAE/ASEE Joint Propulsion Conference, 2017. [CrossRef]
- Jung, S.; Kim, K.S.; Kwon, S. Combustion performance enhancement of a hydrogen peroxide bi-propellant thruster using the fluidic oscillator kerosene injector. In Proceedings of the International Astronautical Congress, Paris, France; 2022. [Google Scholar]
- Harrje, D.T. Liquid Propellant Rocket Combustion Instability; 1972. [CrossRef]
- Yoon, H.; Hong, J.; Lee, C. Correlations for penetration height of single and double liquid jets in cross flow under high-temperature conditions. Atomization and Sprays 2011, 21, 673–686. [Google Scholar] [CrossRef]
- No, S.Y. Empirical Correlations for Penetration Height of Liquid Jet in Uniform Cross Flow - A Review. Journal of ILASS-Korea 2011, 16. [Google Scholar]
- Ragucci, R.; Bellofiore, A.; Cavaliere, A. Statistical evaluation of dynamics and coherence breakdown of kerosene and water jets in crossflow. In Proceedings of the ILASS-Europe, Nottingham, UK; 9 2004. [Google Scholar]
- Chen, T.; Smith, C.; Schommer, D.; Nejad, A. Multi-zone behavior of transverse liquid jet in high-speed flow. In Proceedings of the 31st Aerospace Sciences Meeting, Reno, US; 1 1993. [Google Scholar] [CrossRef]
Figure 1.
Operation concept of H2O2/HC bipropellant thruster
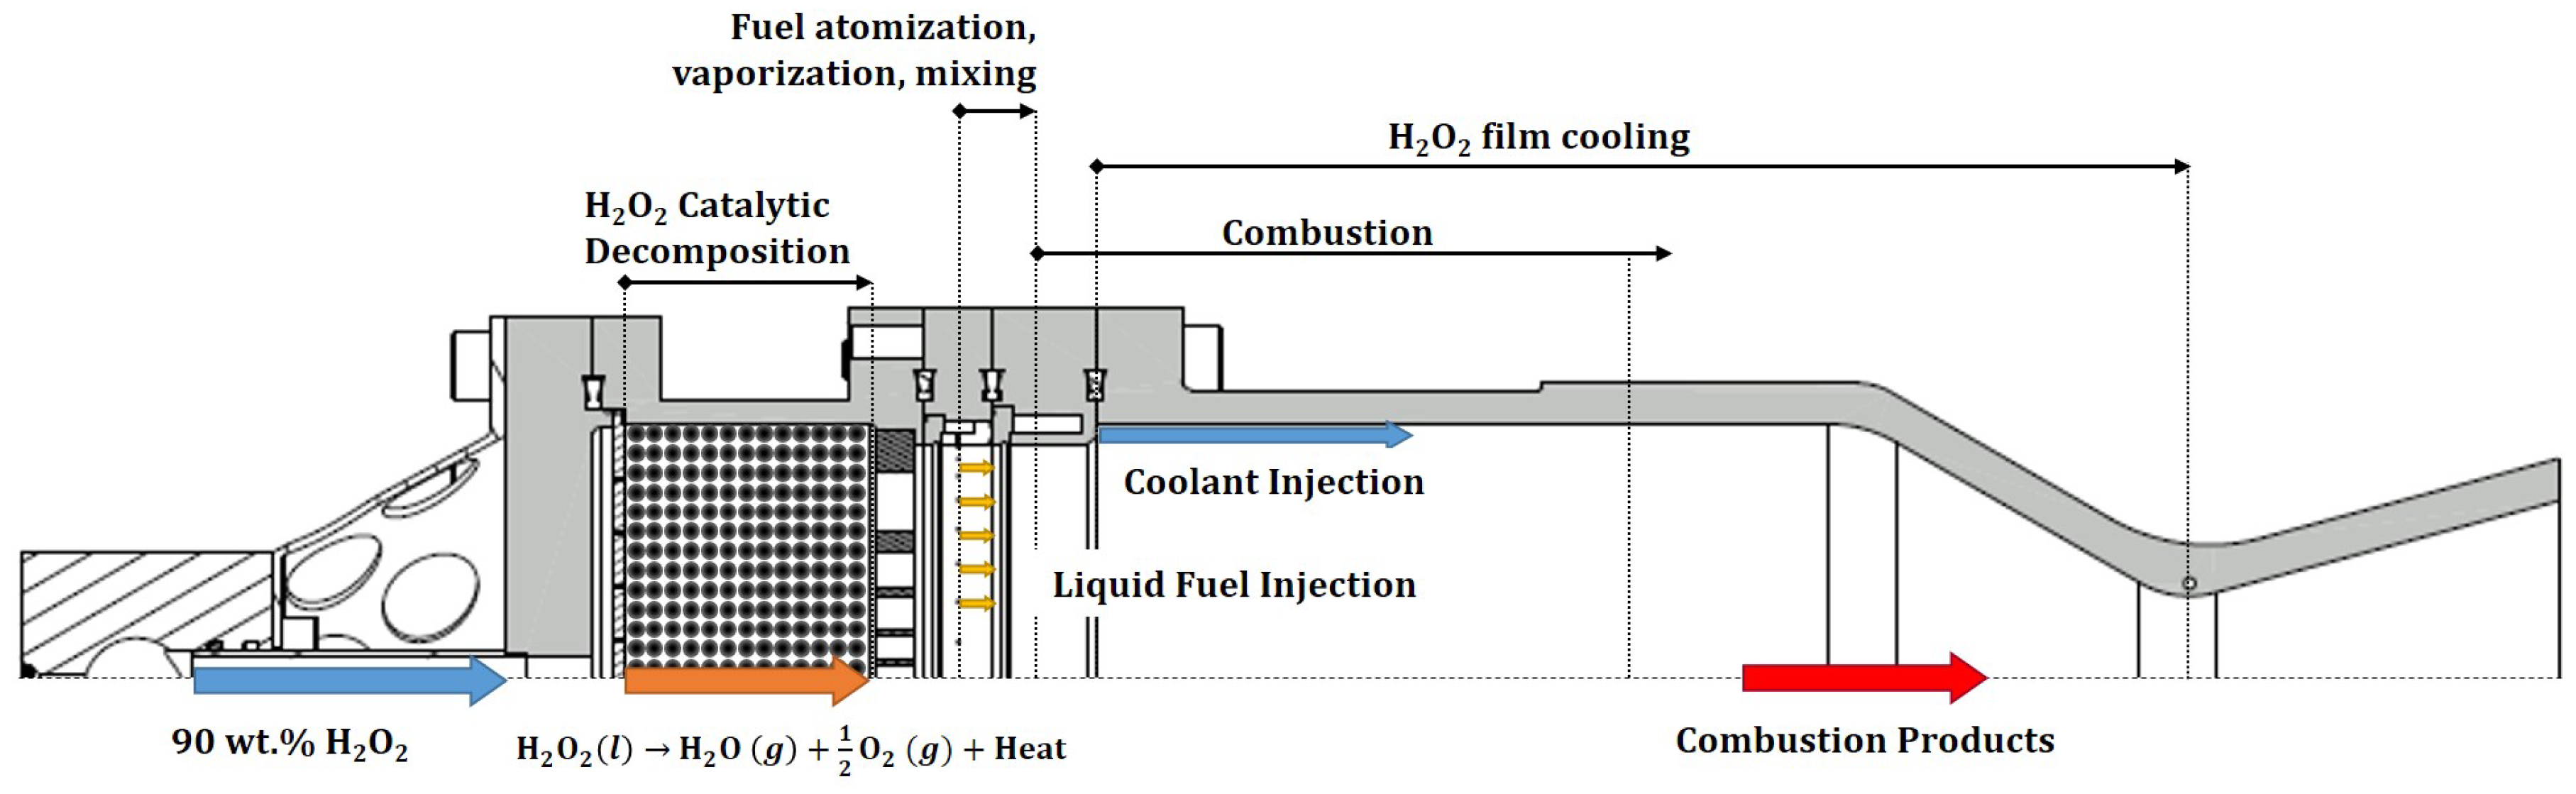
Figure 2.
High-speed image(left) and schematic diagram(right) of the liquid jet in crossflow
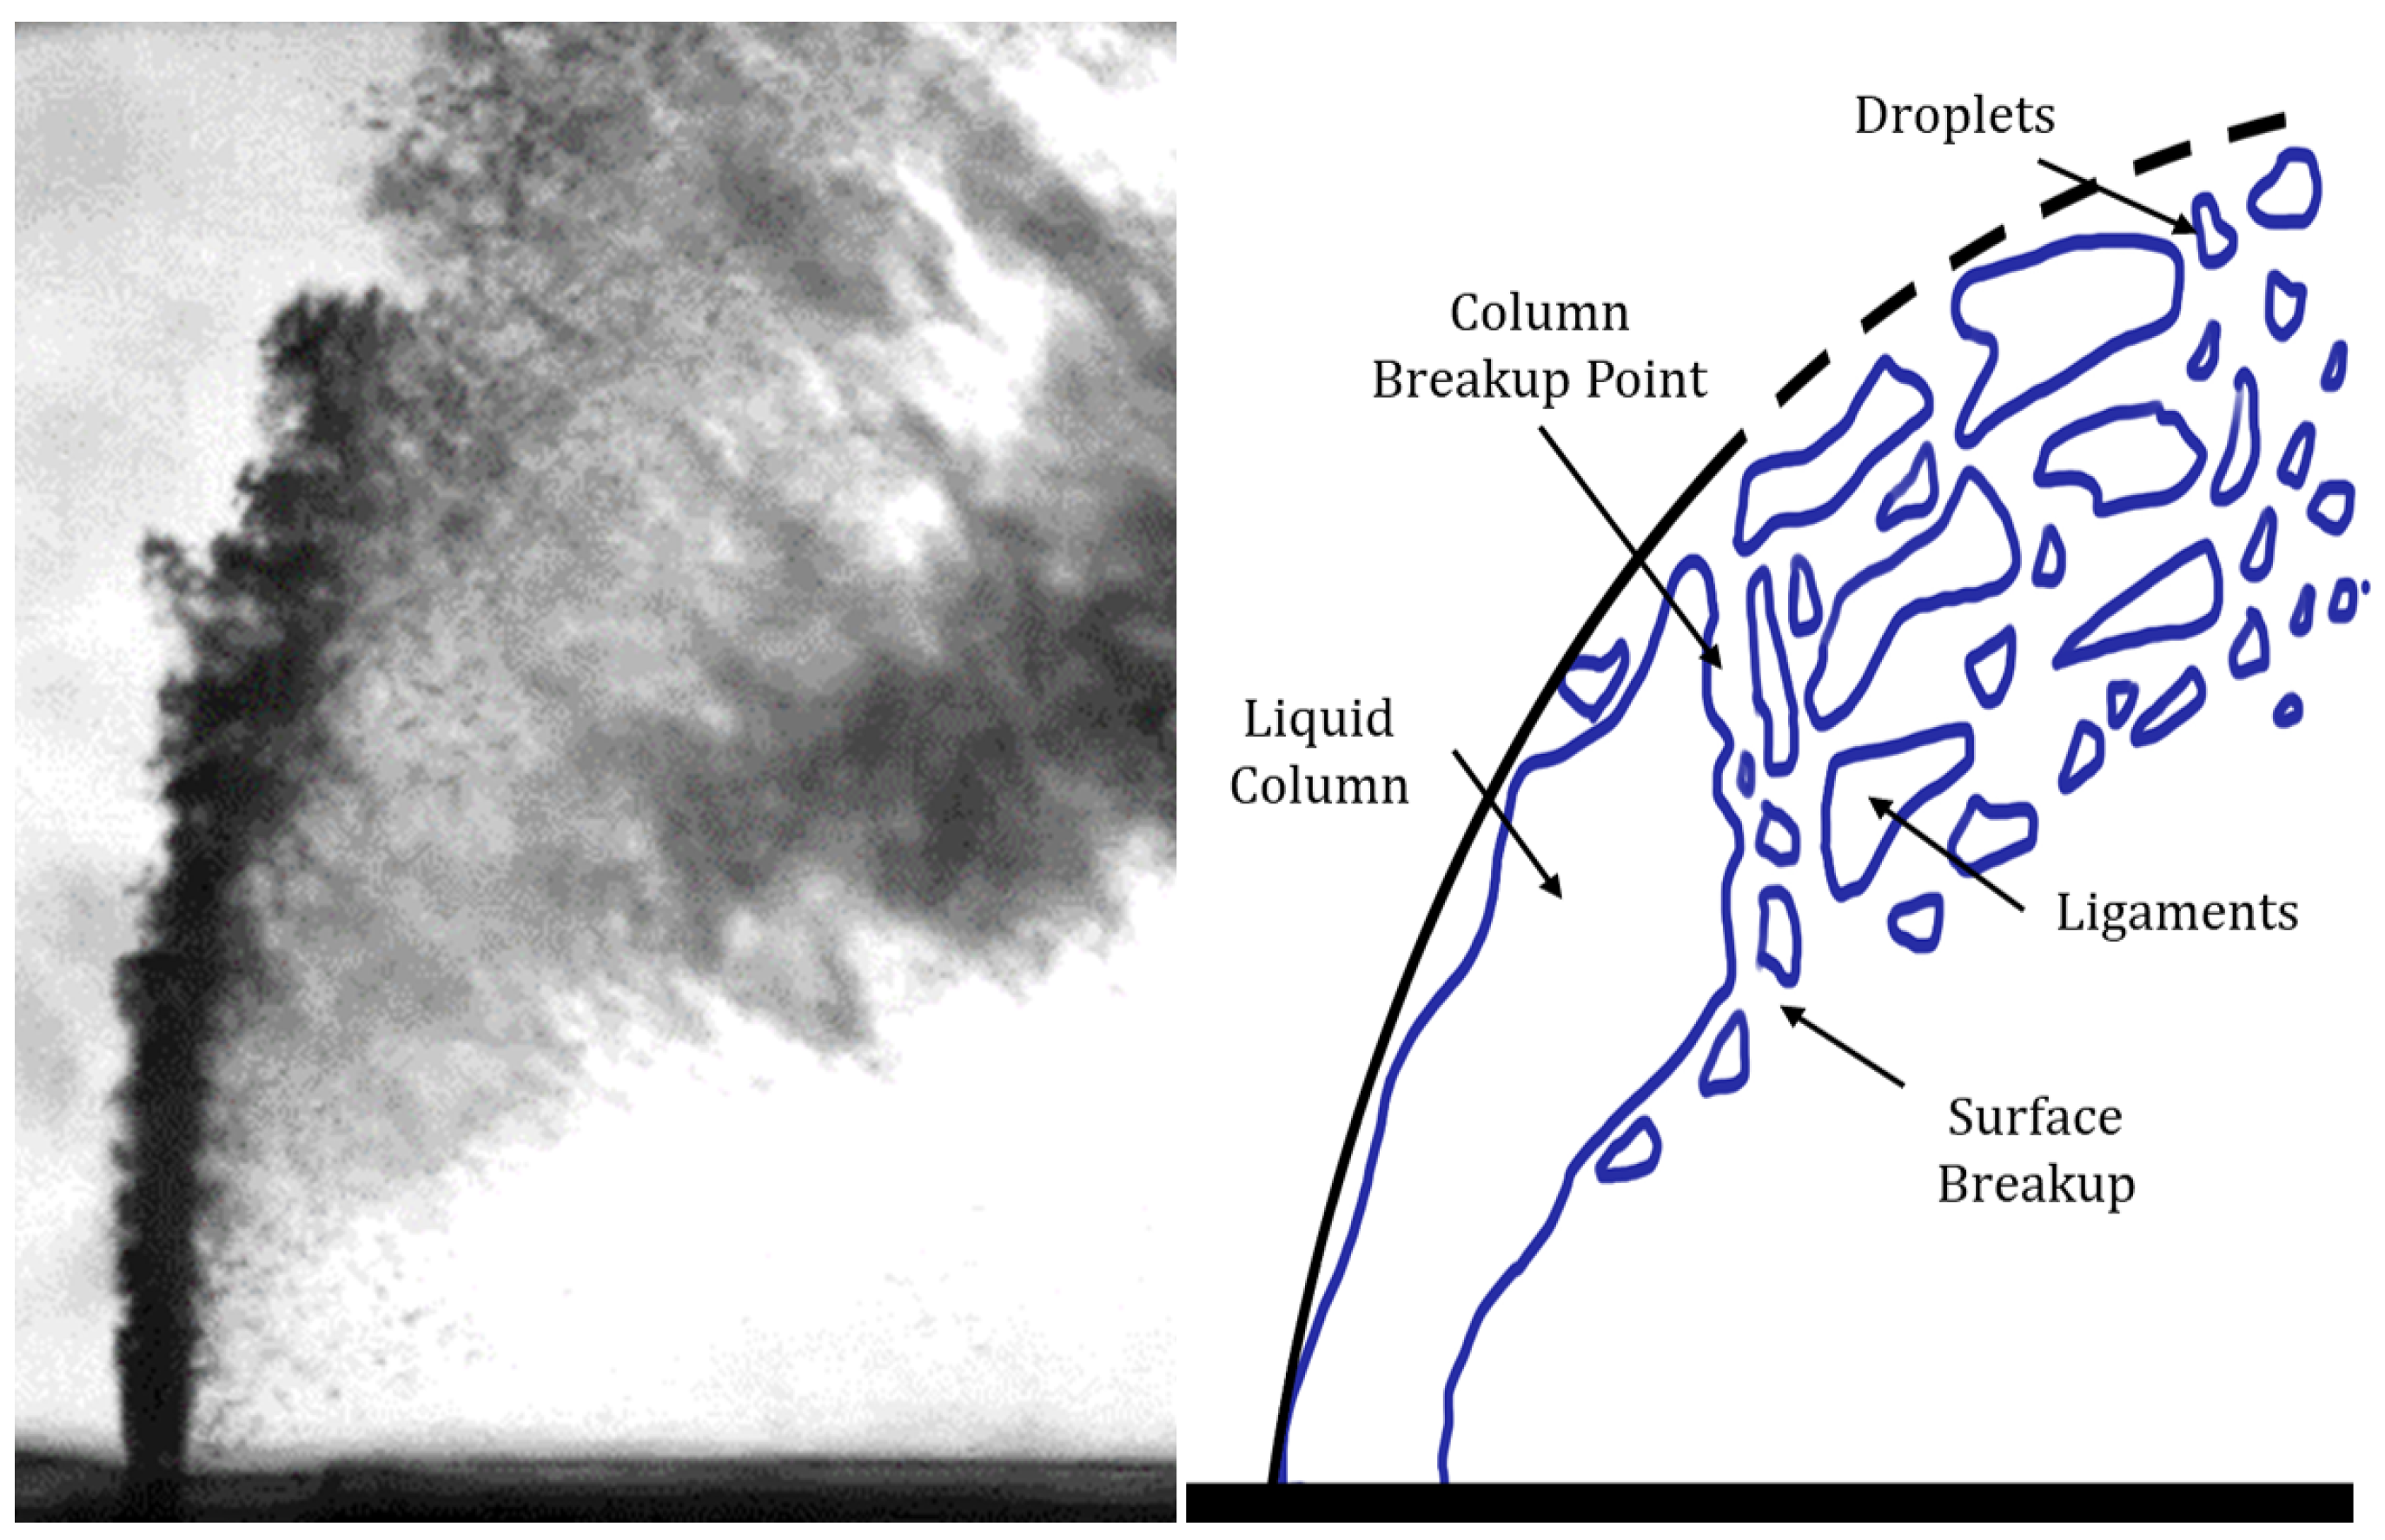
Figure 3.
Parts breakdown of the H2O2/Kerosene bipropellant thruster (1: Catalyst reactor, 2: Connector, 3: Copper gasket, 4: Exterior flange, 5: Quartz window, 6: Fuel injector, 7: Combustion chamber, 8: Connector, 9: Nozzle, 10: Pipe connector, 11: Injector flange, 12: Catalyst bed))
Figure 3.
Parts breakdown of the H2O2/Kerosene bipropellant thruster (1: Catalyst reactor, 2: Connector, 3: Copper gasket, 4: Exterior flange, 5: Quartz window, 6: Fuel injector, 7: Combustion chamber, 8: Connector, 9: Nozzle, 10: Pipe connector, 11: Injector flange, 12: Catalyst bed))
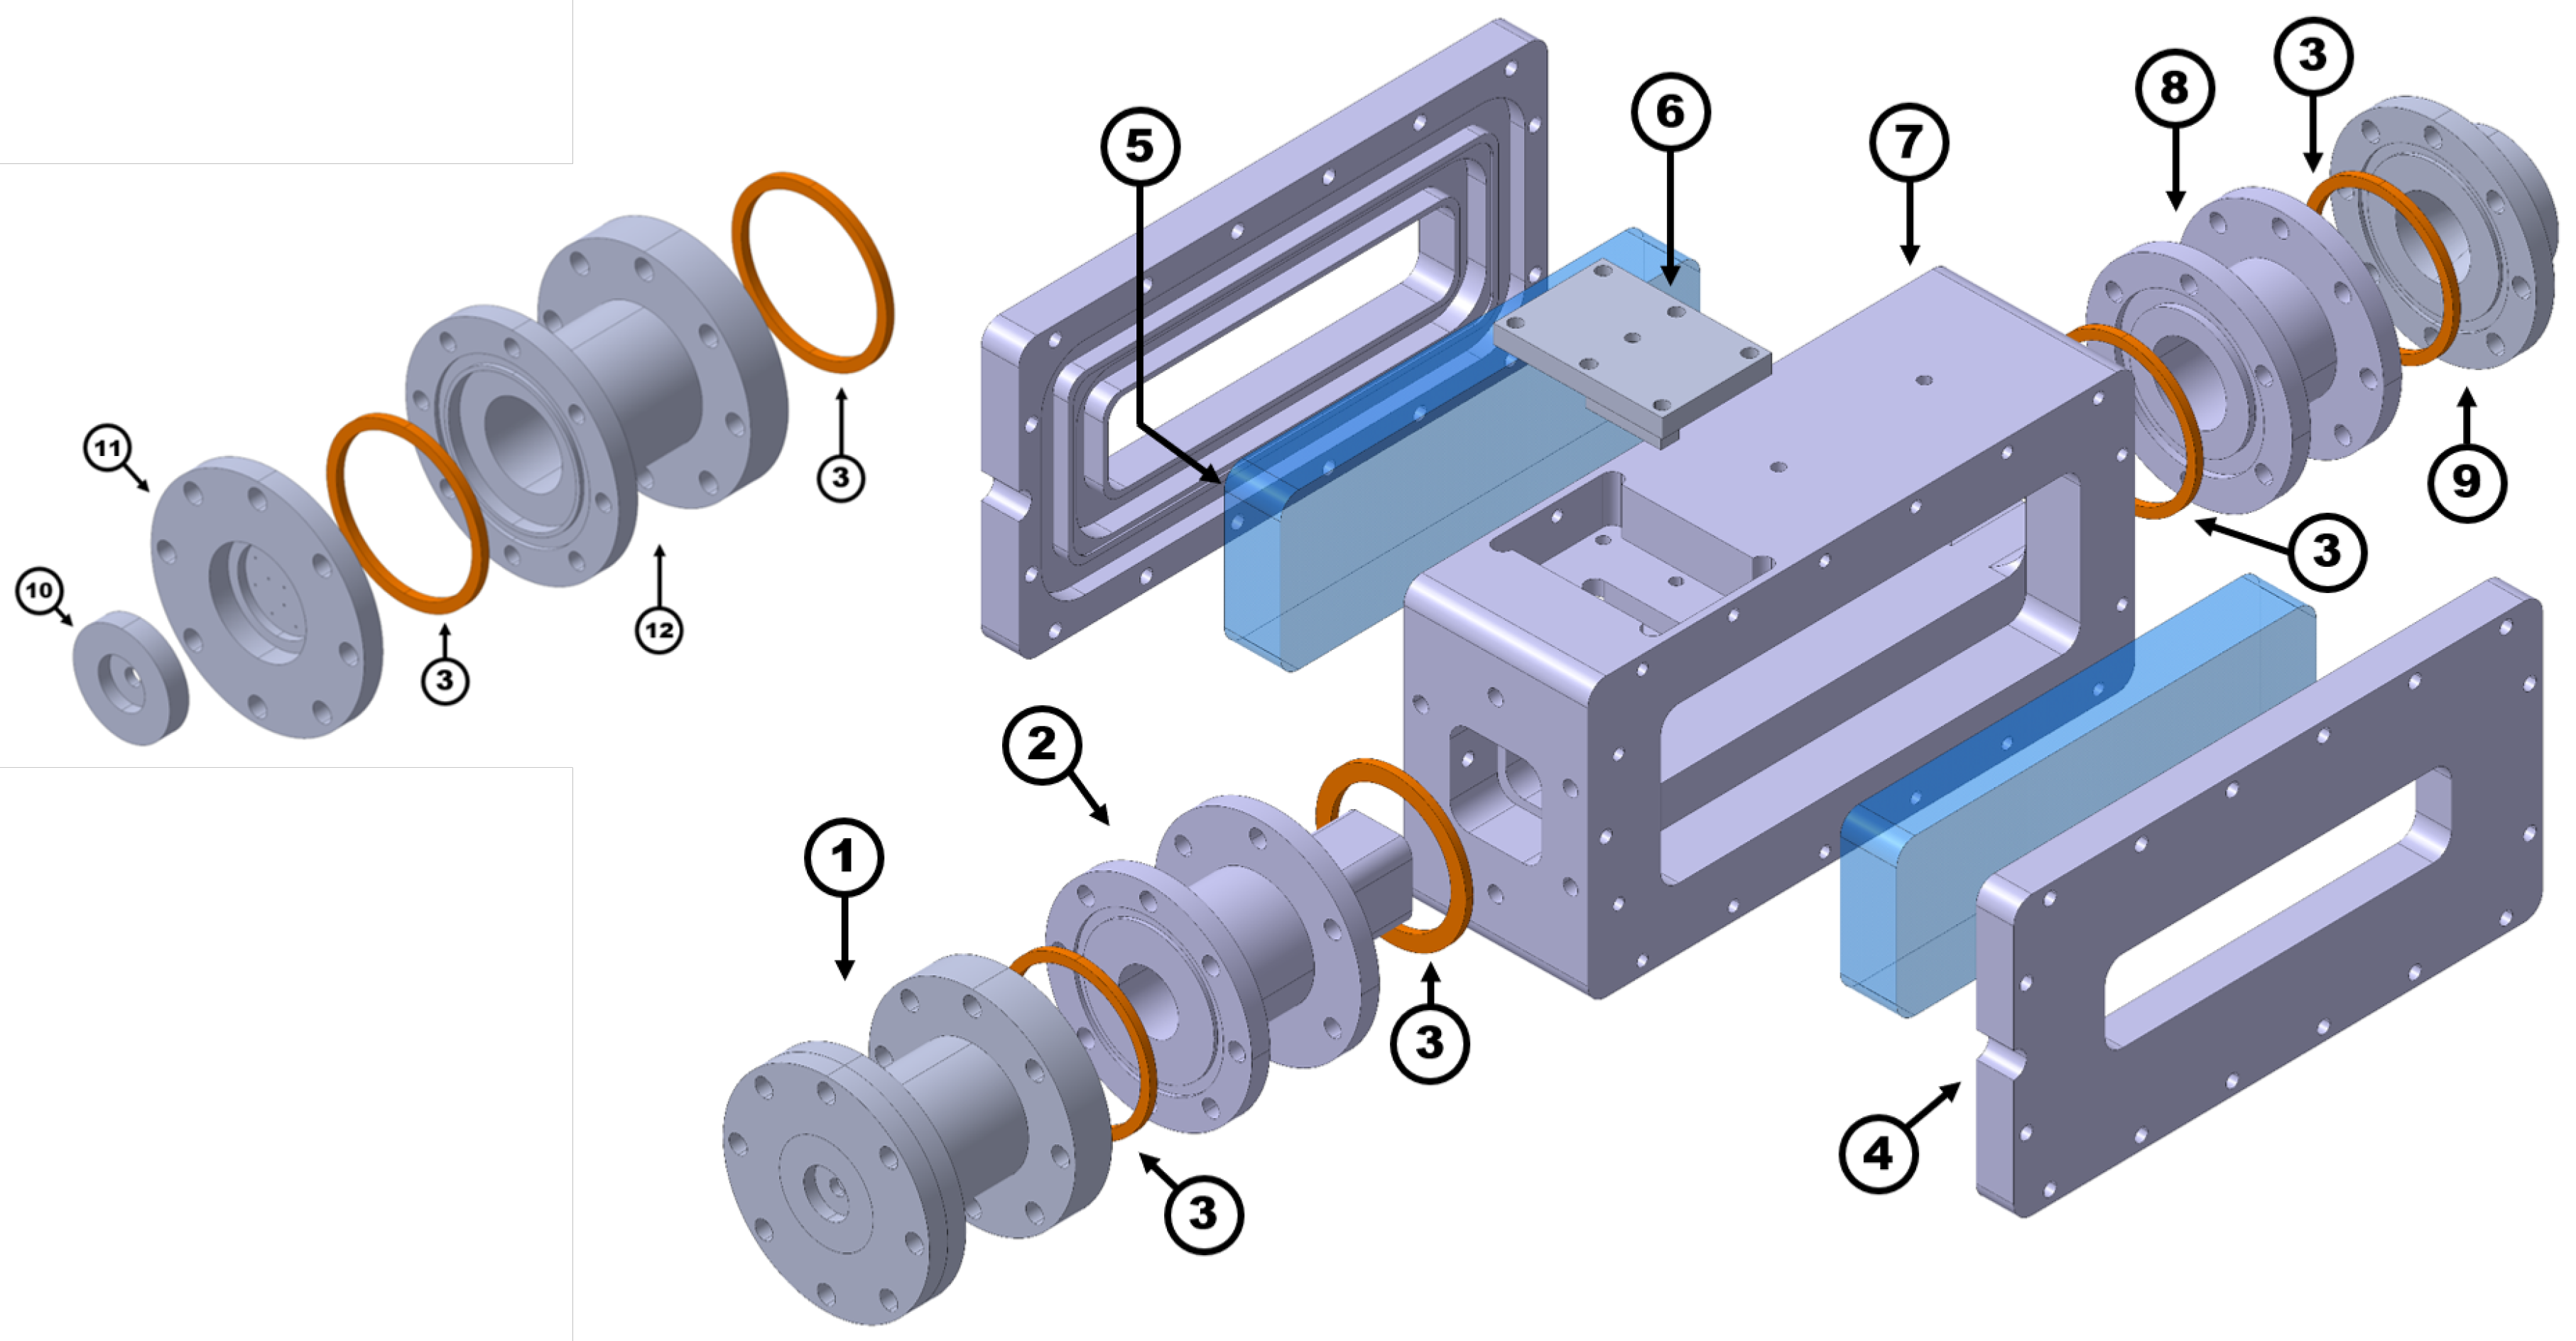
Figure 4.
H2O2/Kerosene bipropellant thruster design schematics
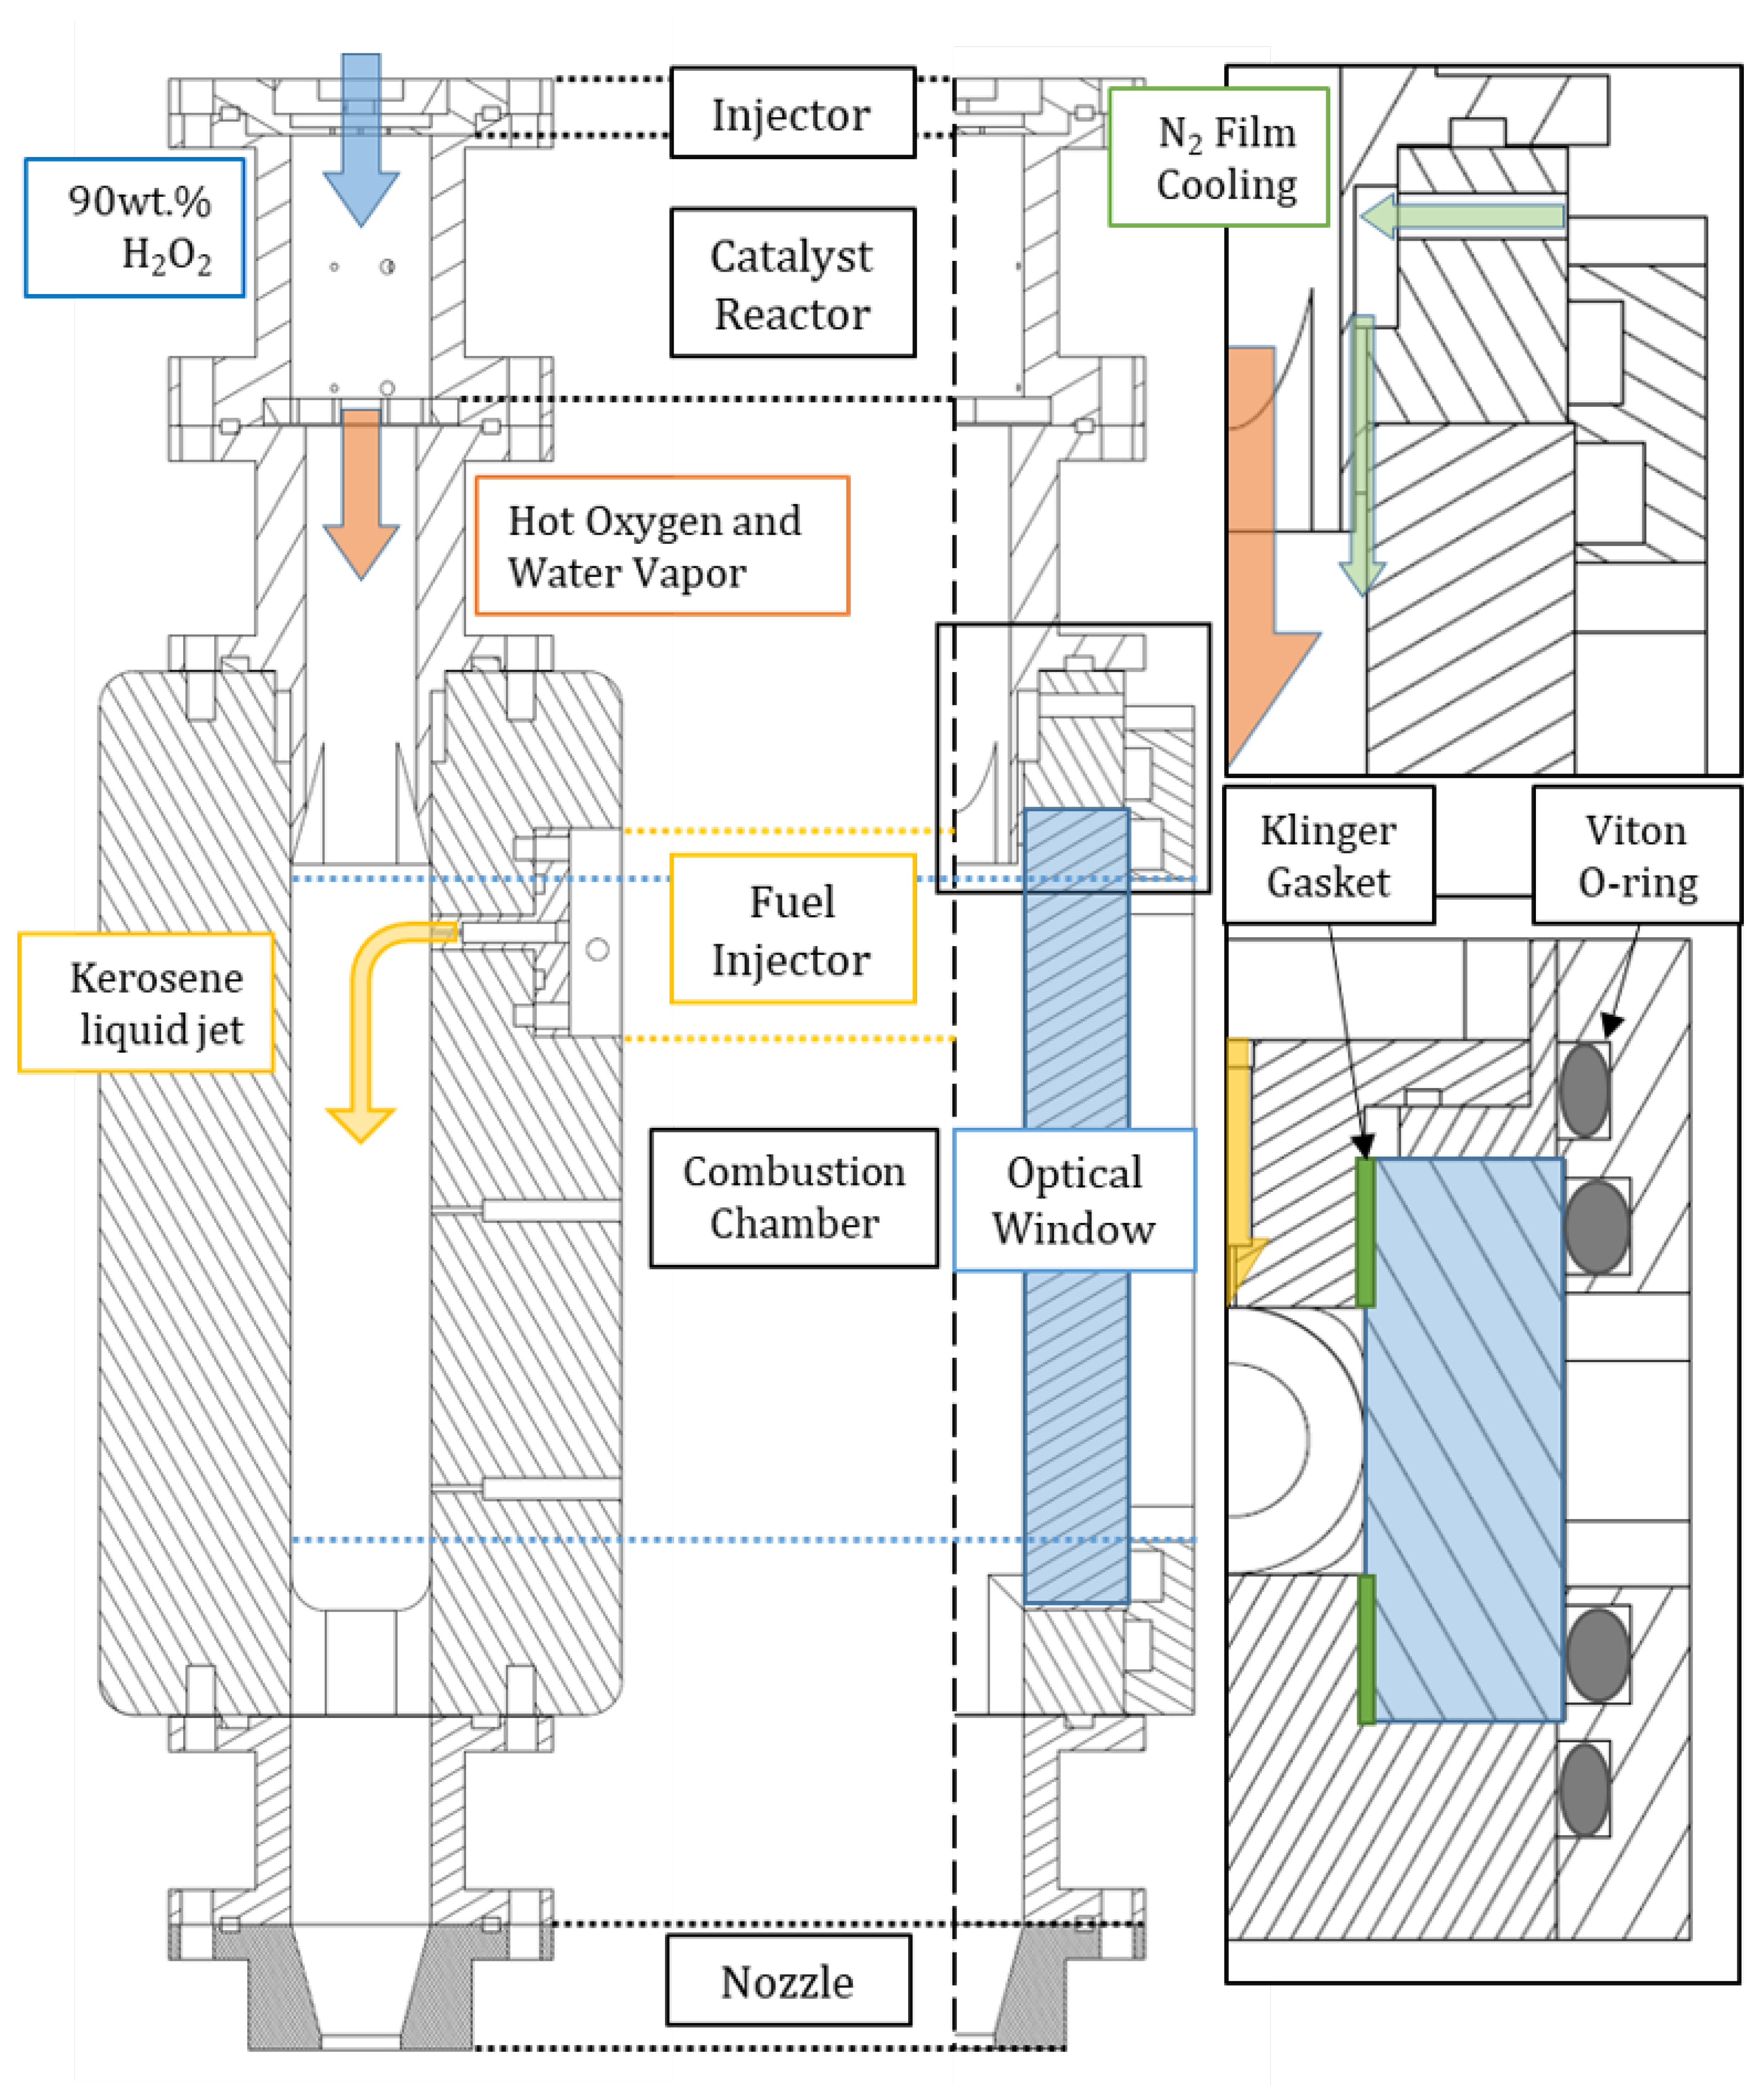
Figure 5.
CFD analysis using ANSYS Fluent® to calculate mass fraction of N2 species (left) and temperature (right)
Figure 5.
CFD analysis using ANSYS Fluent® to calculate mass fraction of N2 species (left) and temperature (right)
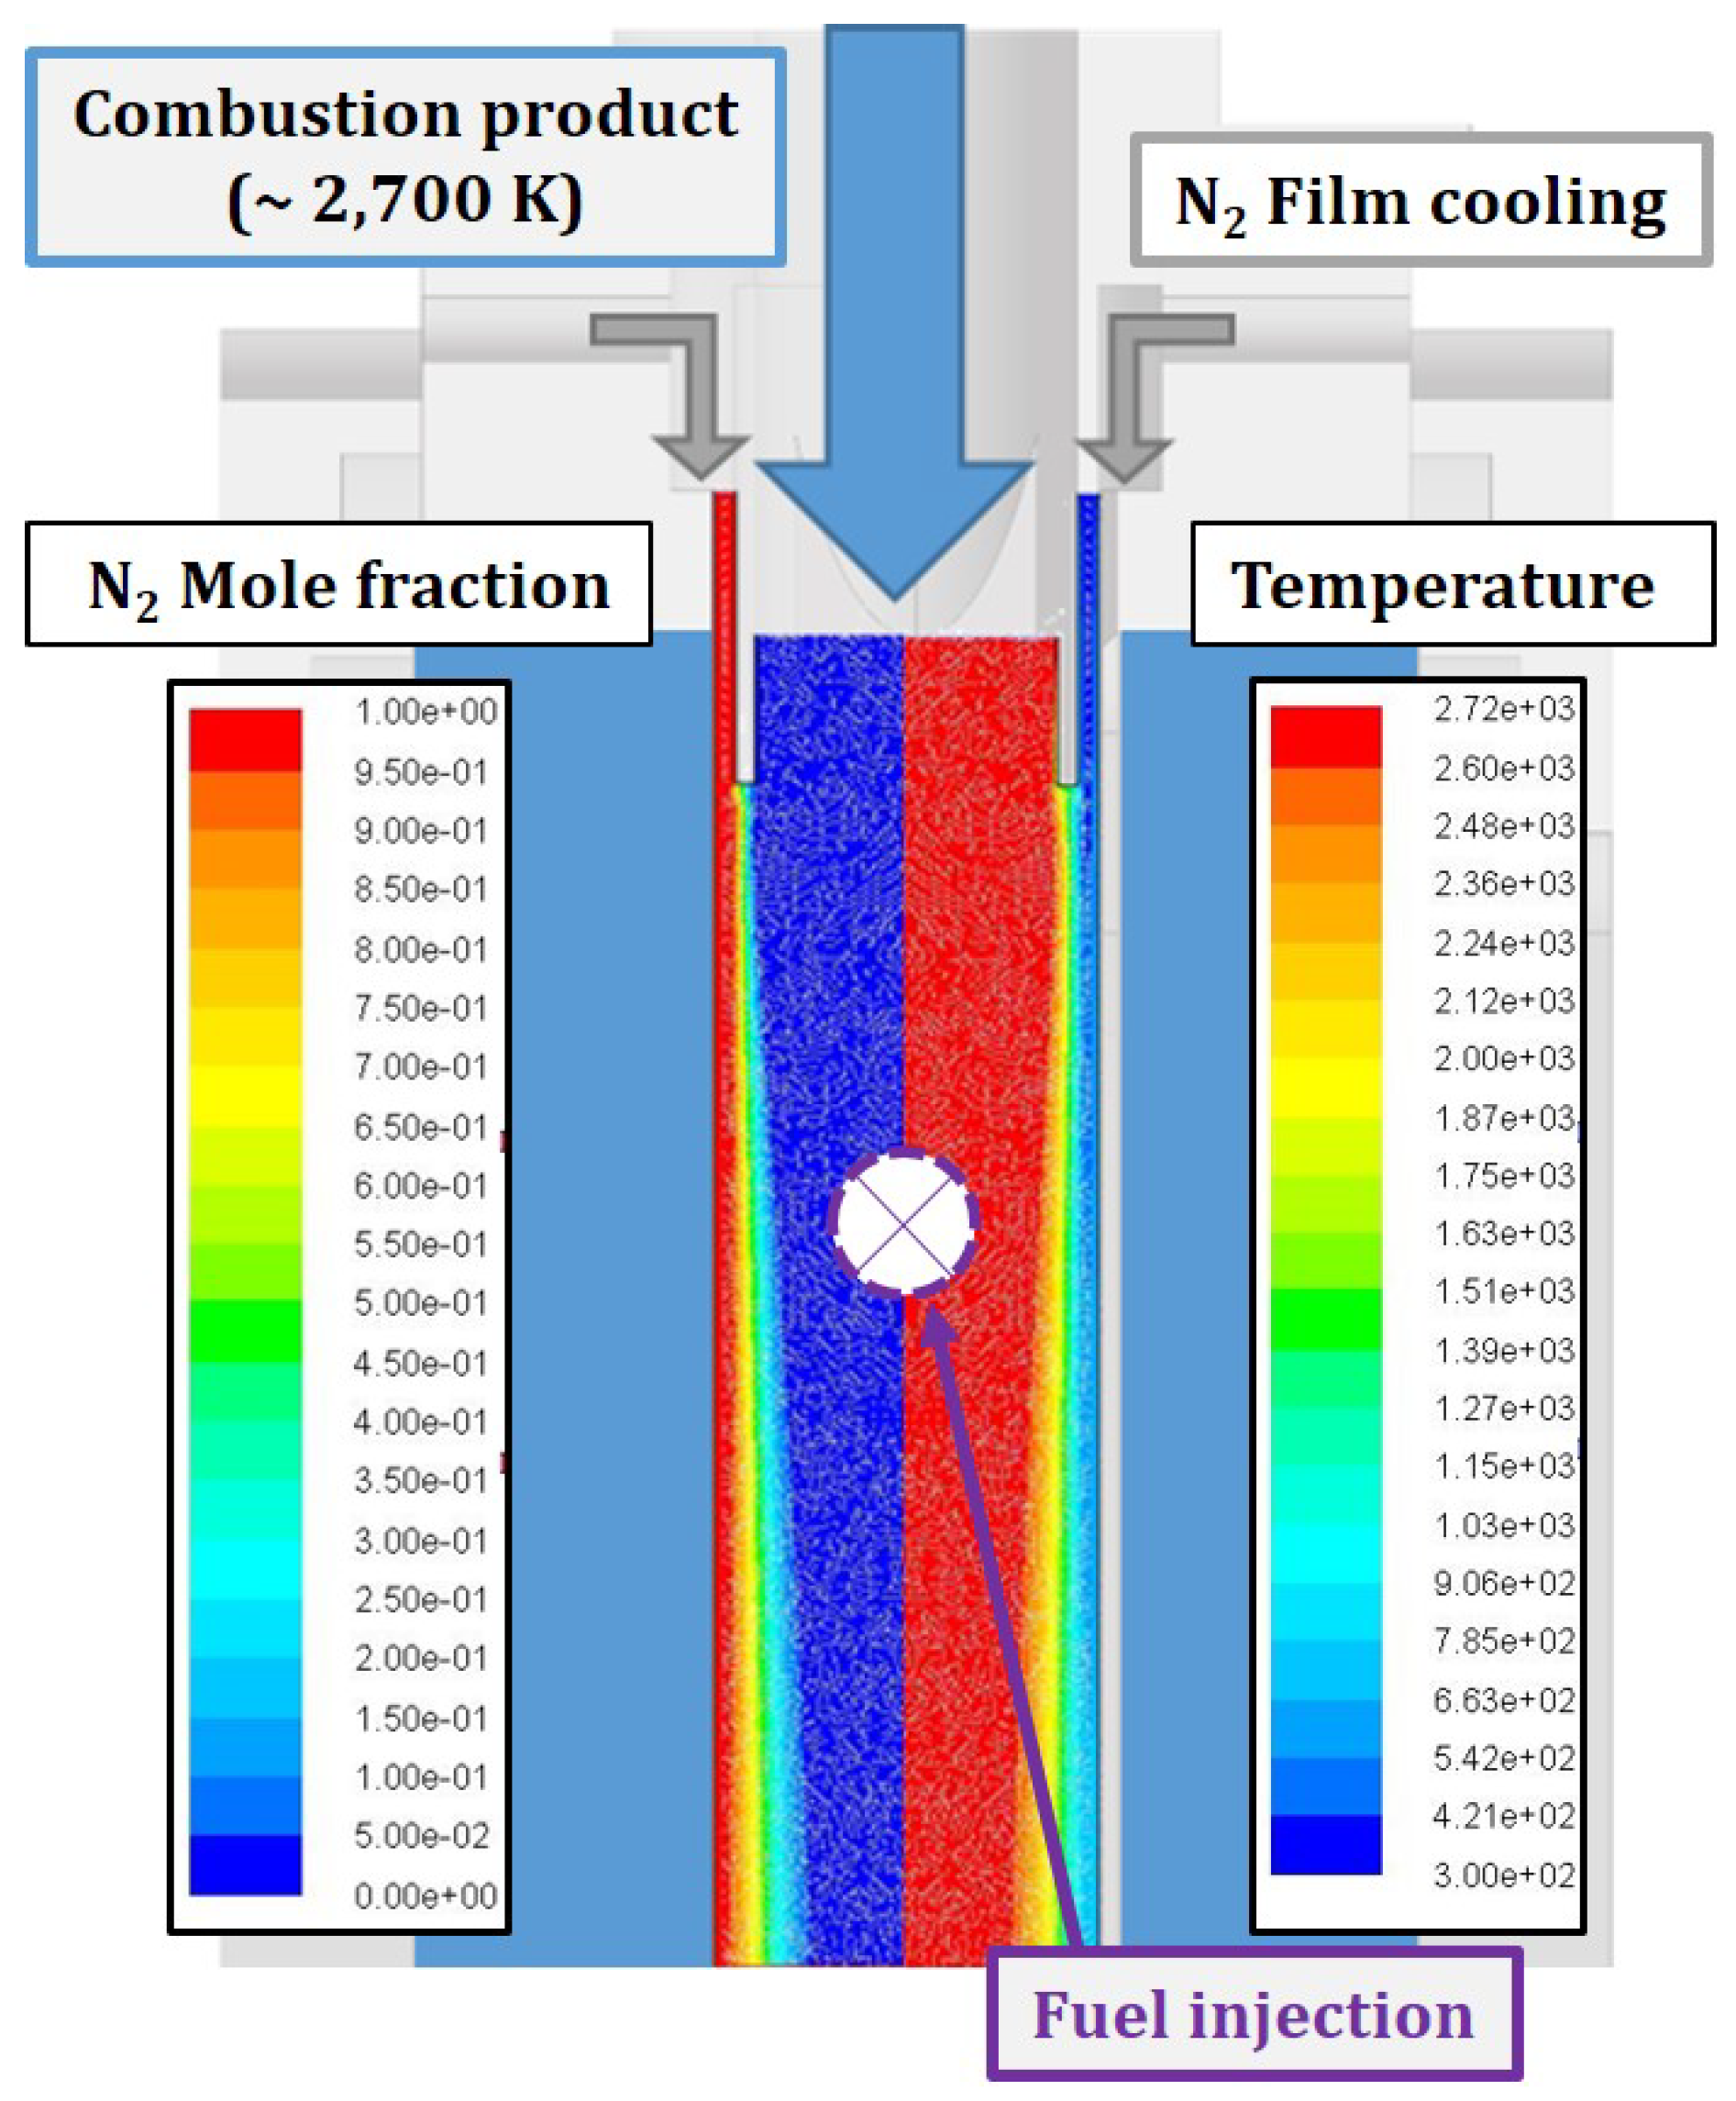
Figure 6.
Images of H2O2/Kerosene bipropellant thruster and its components
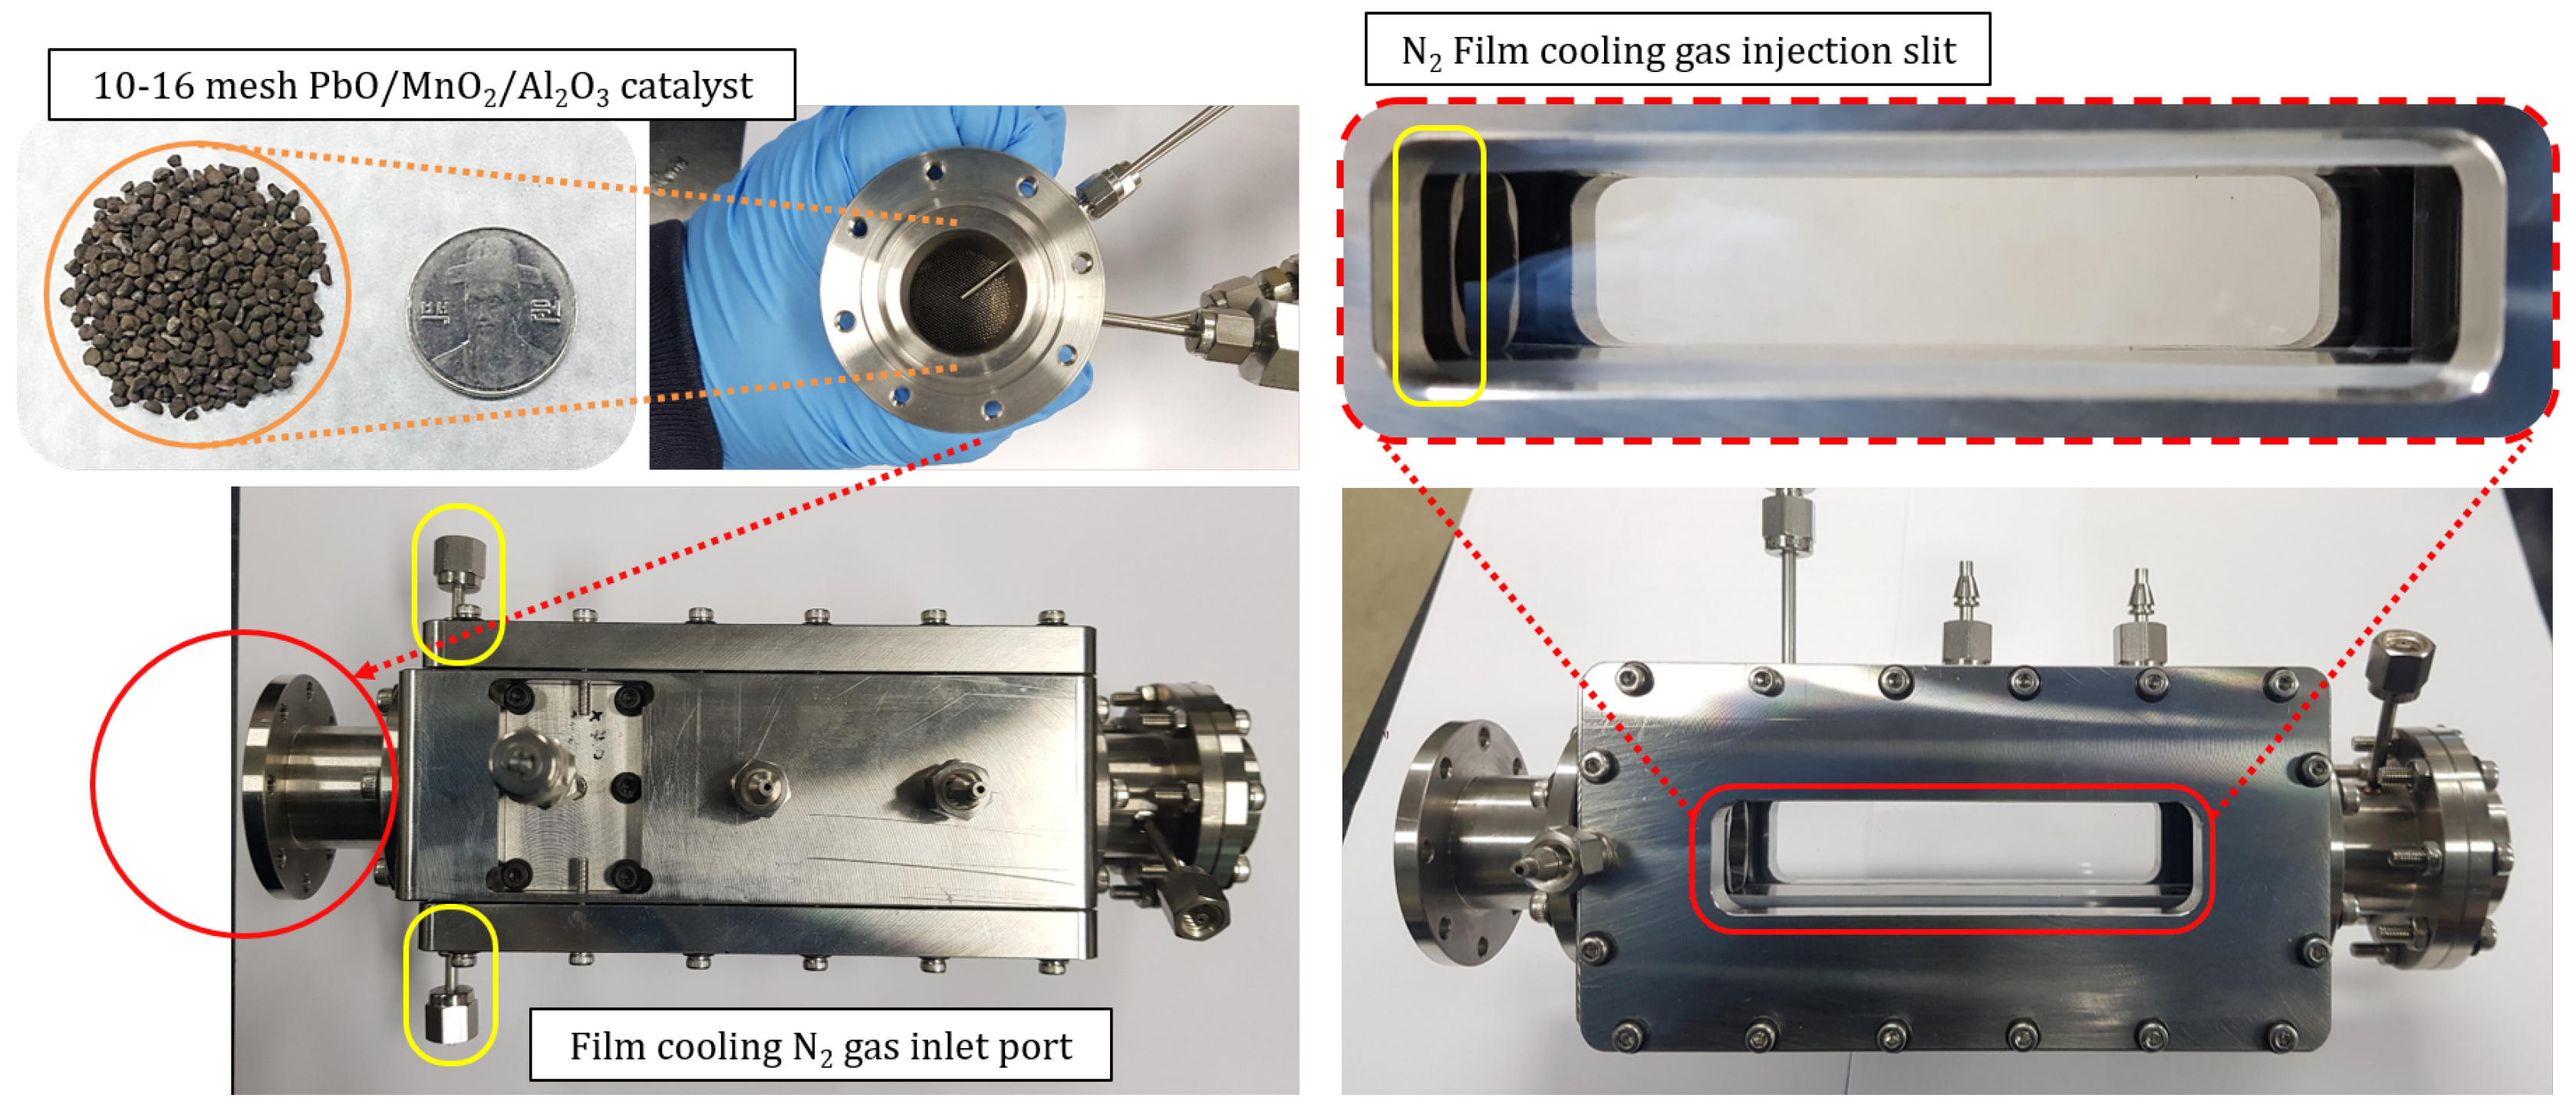
Figure 7.
Schematic diagram of propellant feeding system at KAIST[19]
Figure 7.
Schematic diagram of propellant feeding system at KAIST[19]
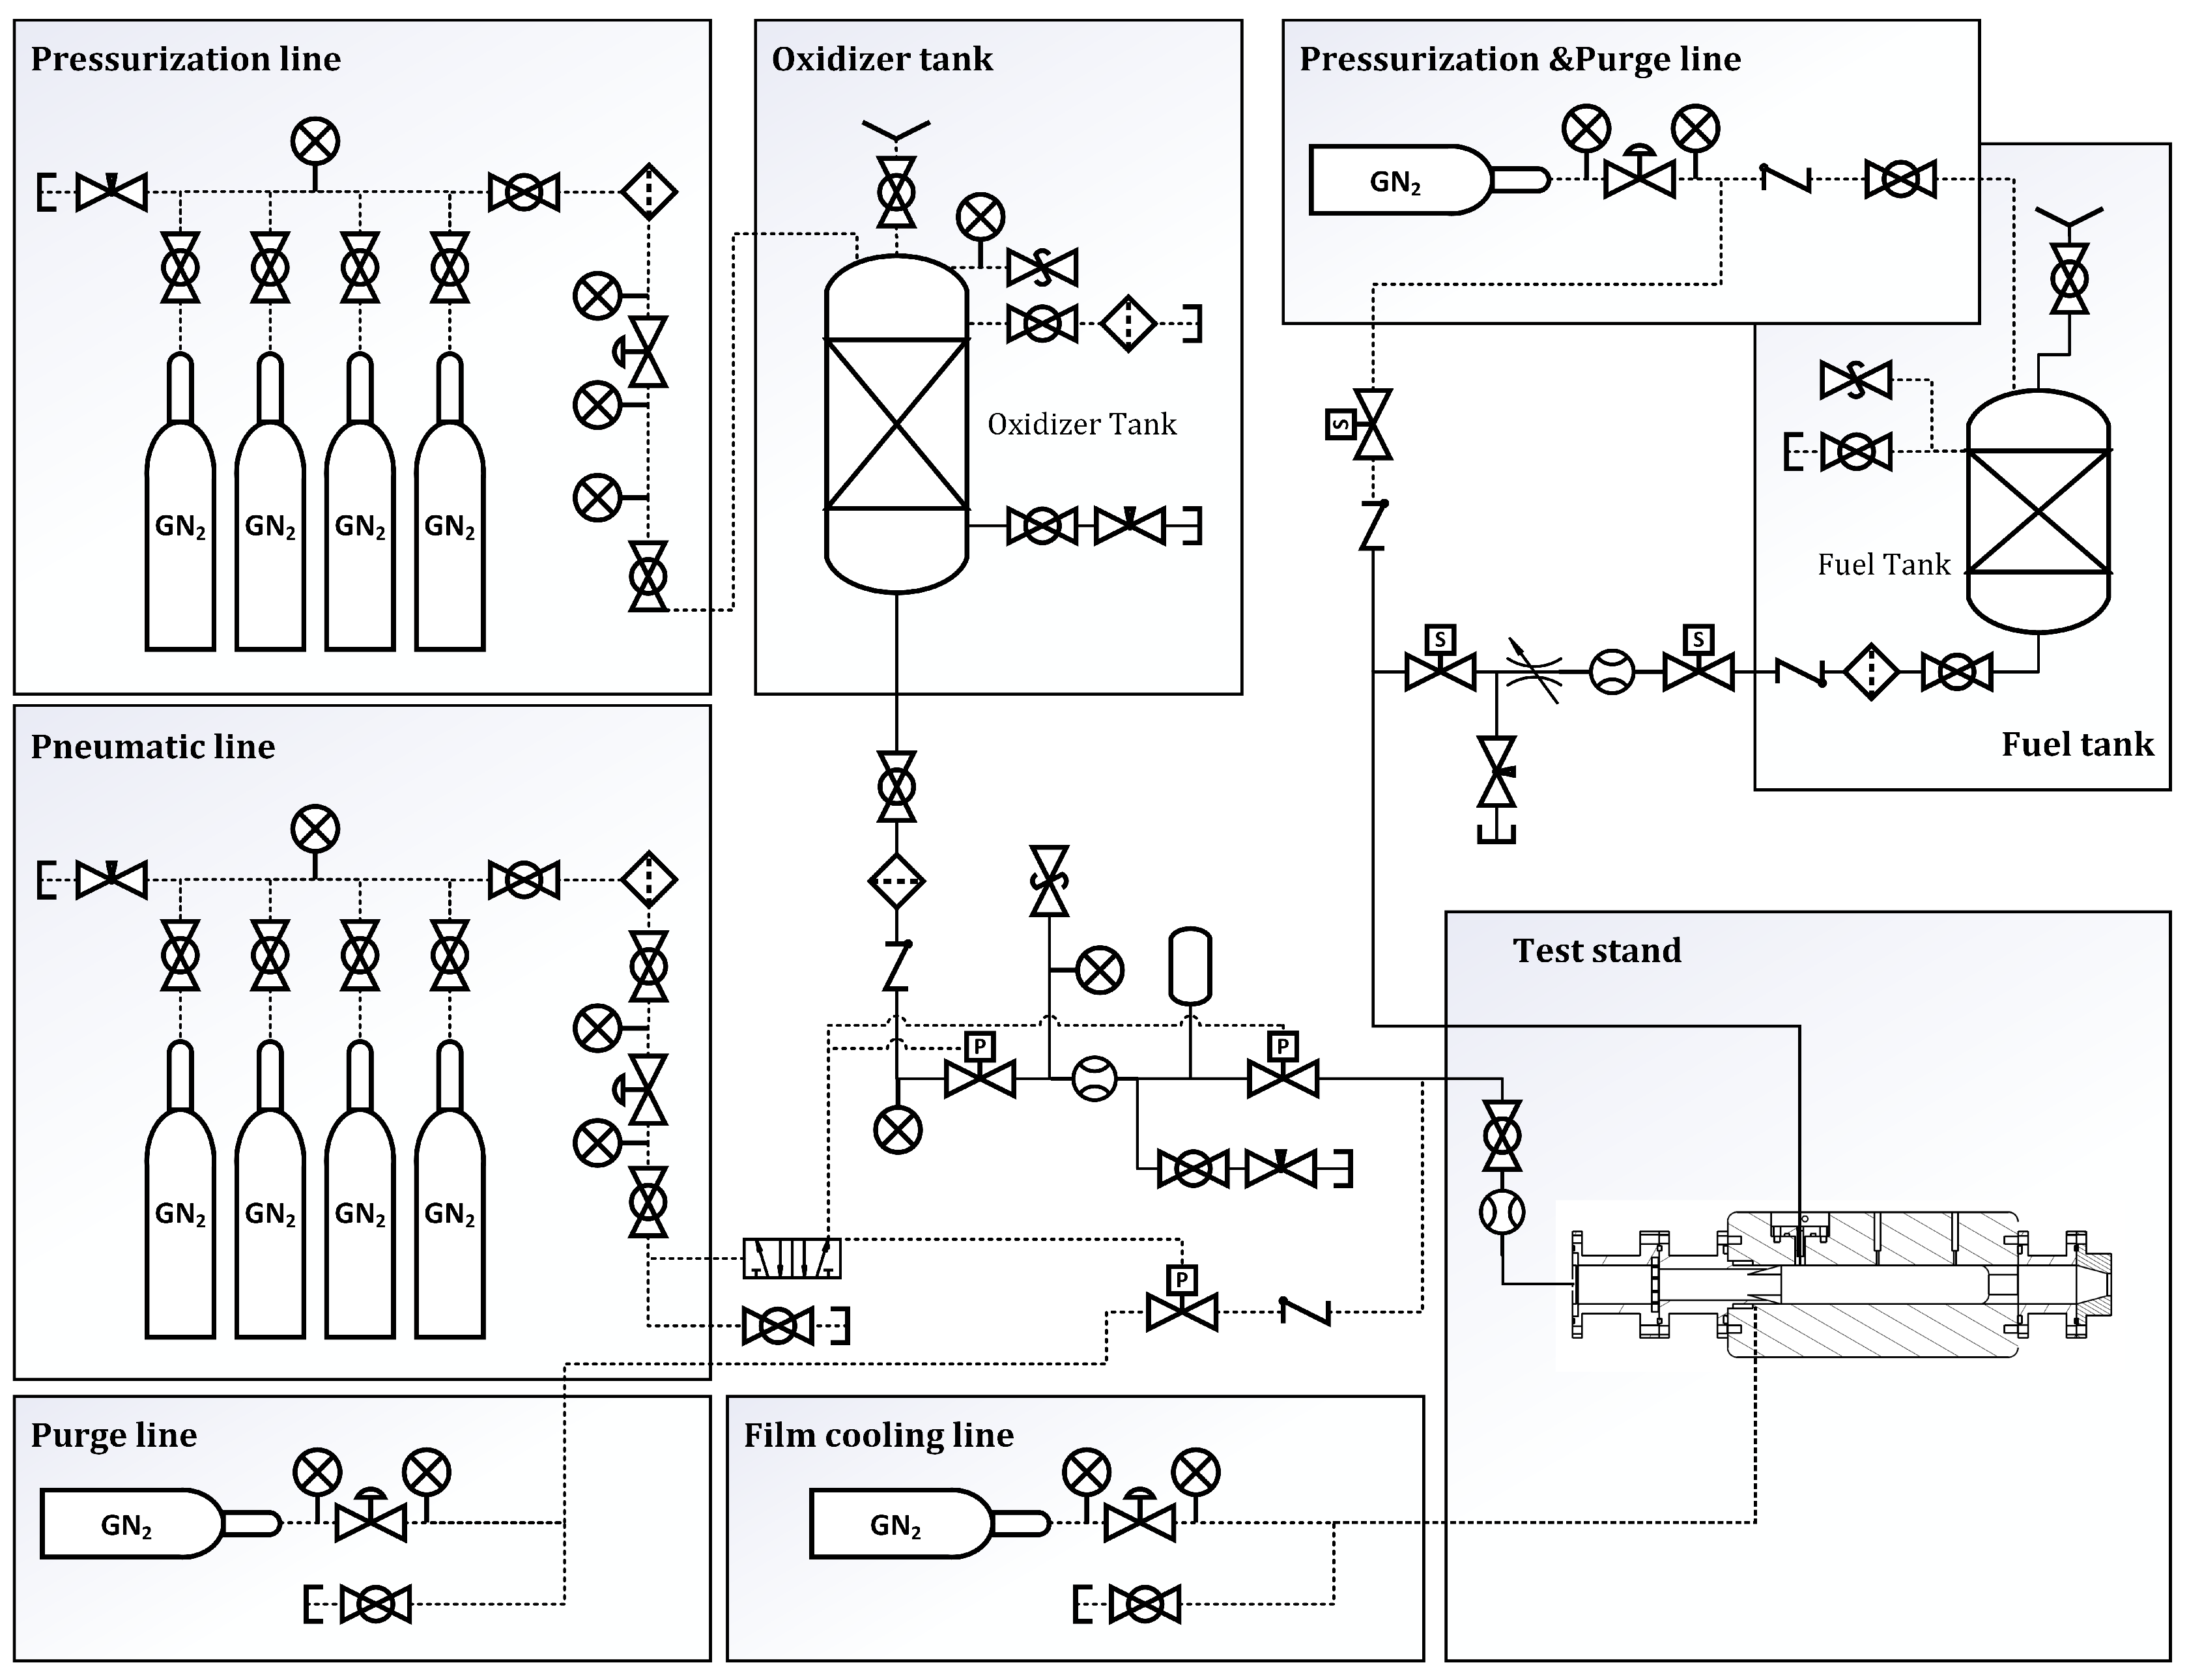
Figure 8.
Propellant feeding system and thruster experimental setup (left) and combustion chamber visualization setup (right)
Figure 8.
Propellant feeding system and thruster experimental setup (left) and combustion chamber visualization setup (right)
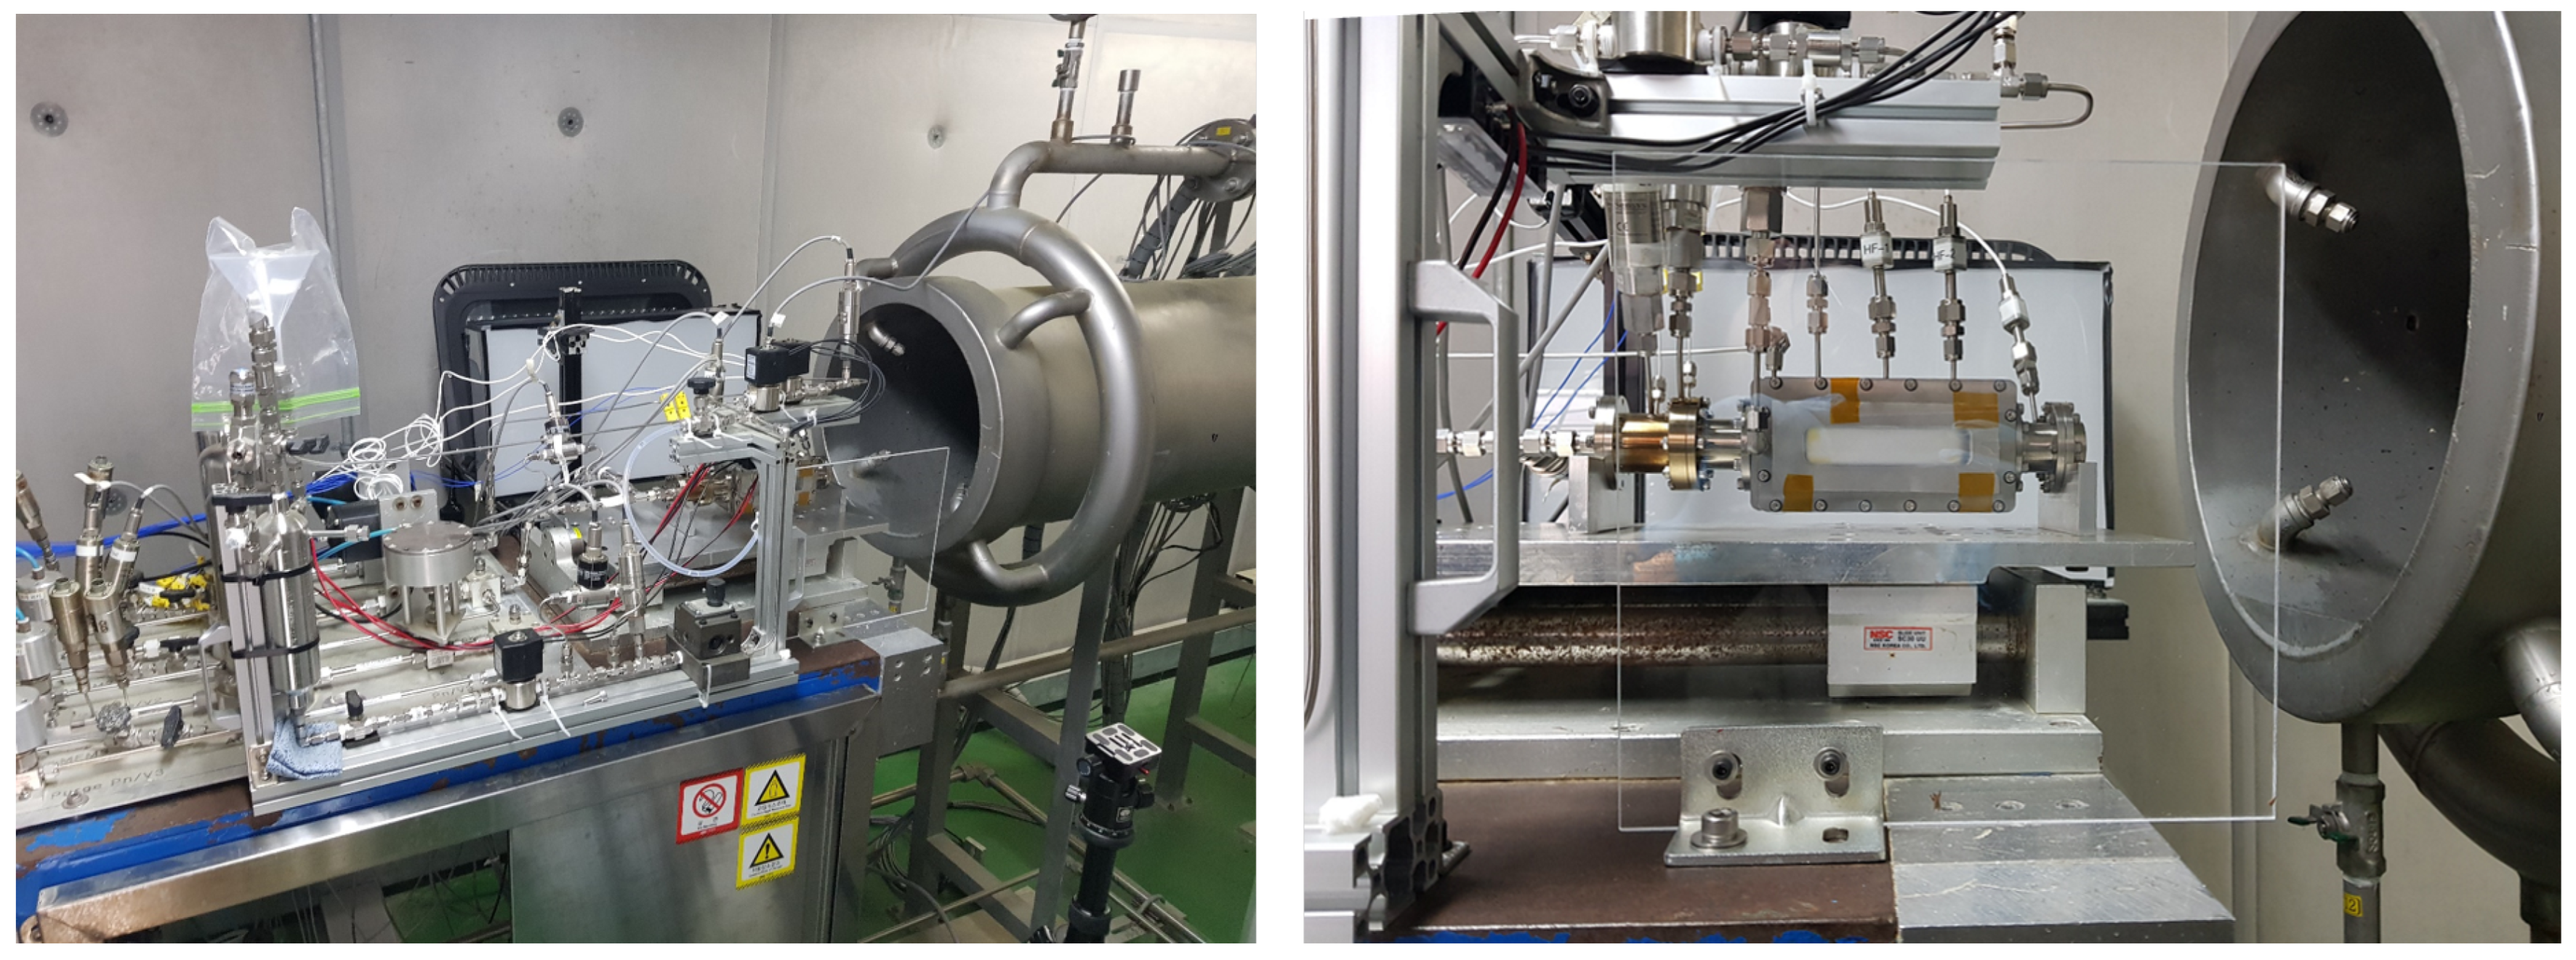
Figure 9.
Conceptual schematics of shadowgraph visualization of combustion chamber with chemiluminescence suppression
Figure 9.
Conceptual schematics of shadowgraph visualization of combustion chamber with chemiluminescence suppression
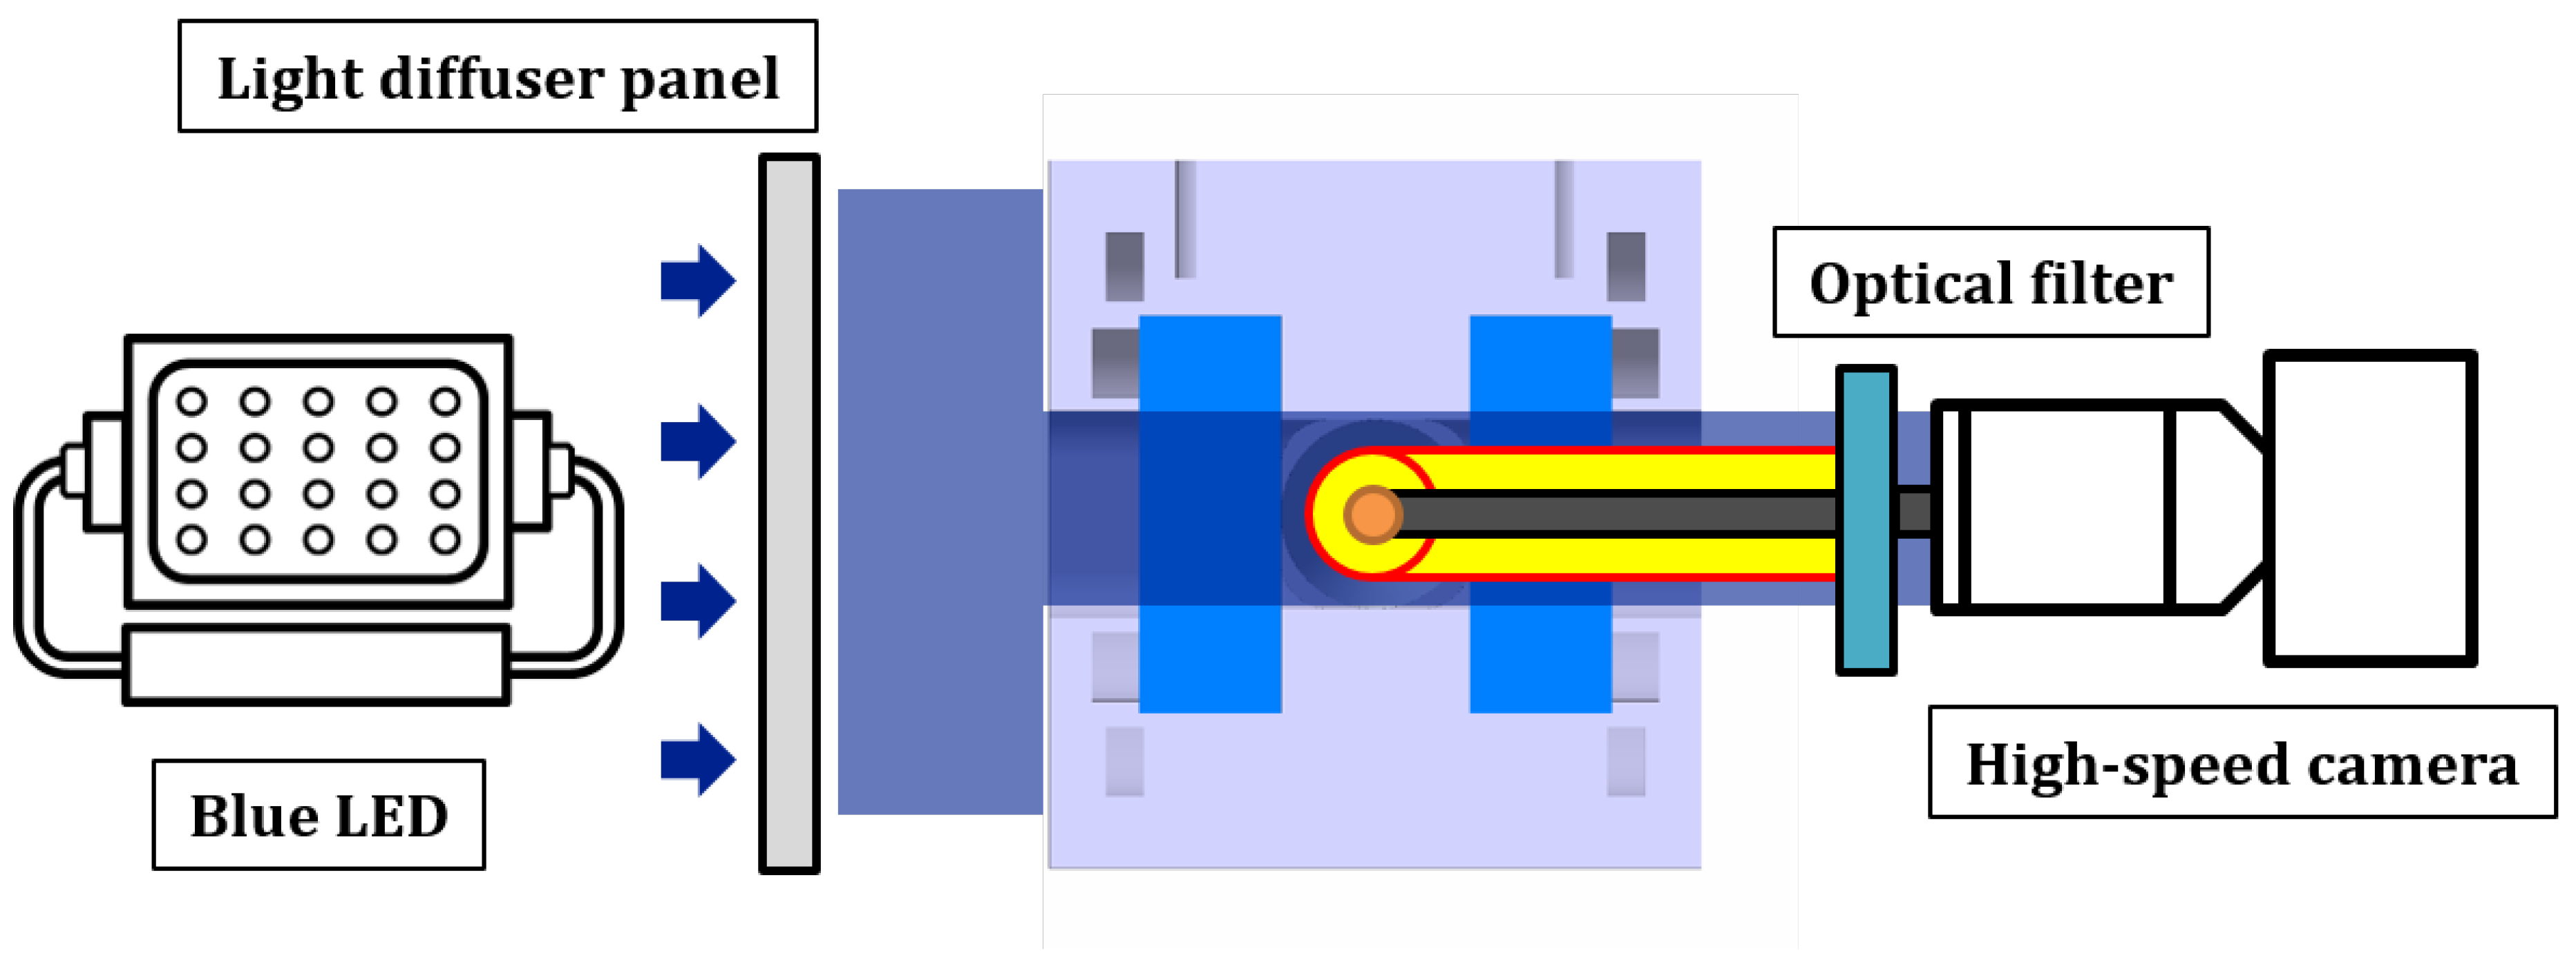
Figure 10.
Propellant feeding system and thruster experimental setup (left) and combustion chamber visualization setup (right) with chemiluminescence suppression
Figure 10.
Propellant feeding system and thruster experimental setup (left) and combustion chamber visualization setup (right) with chemiluminescence suppression
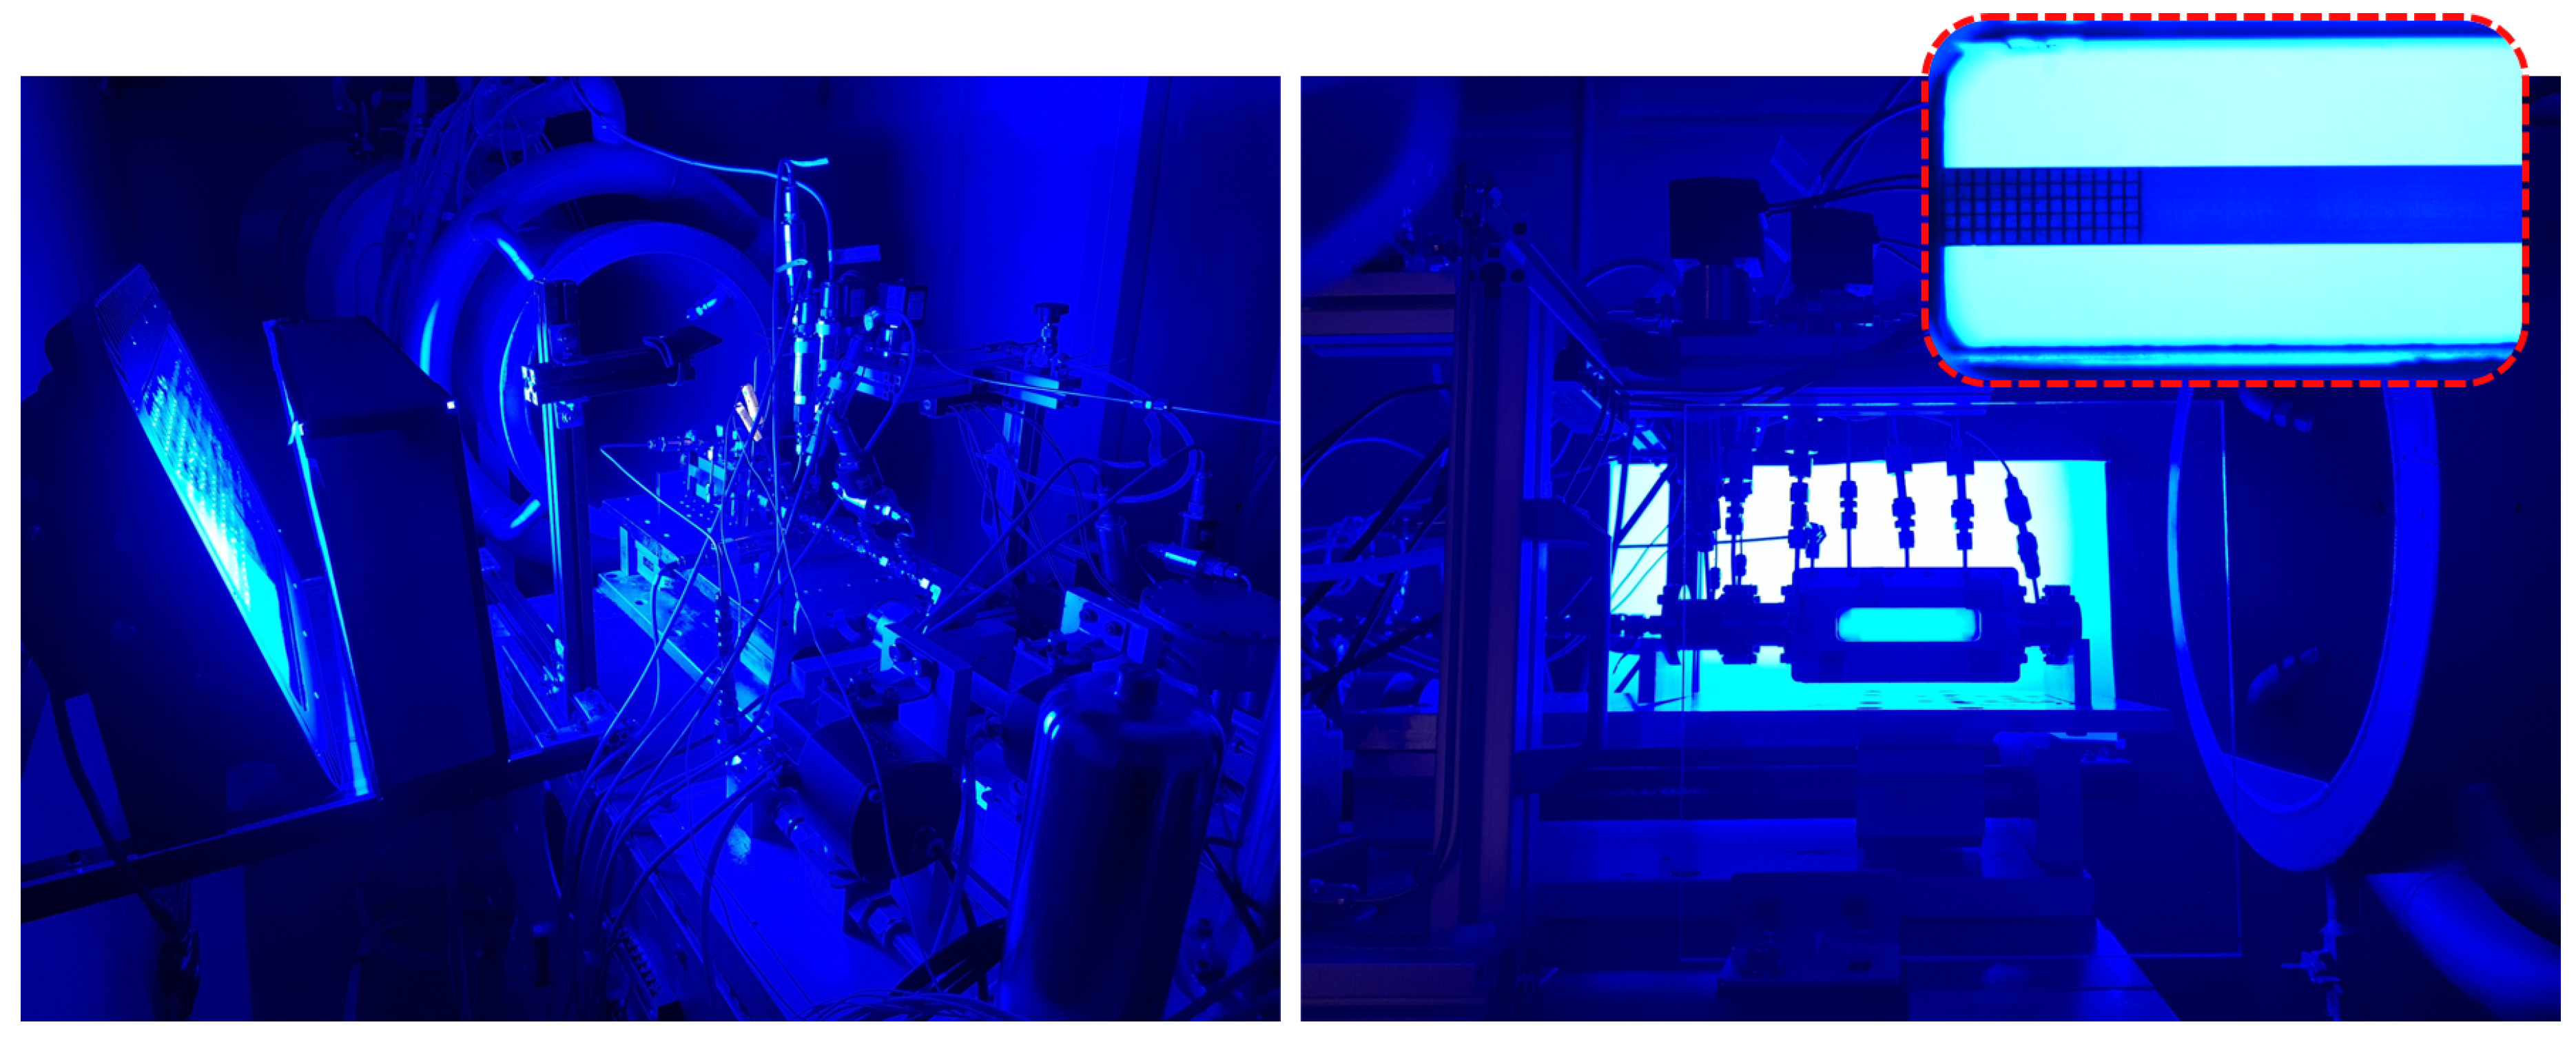
Figure 11.
Pressure and temperature measurement for mono-mode operation for experimental setup validation
Figure 11.
Pressure and temperature measurement for mono-mode operation for experimental setup validation
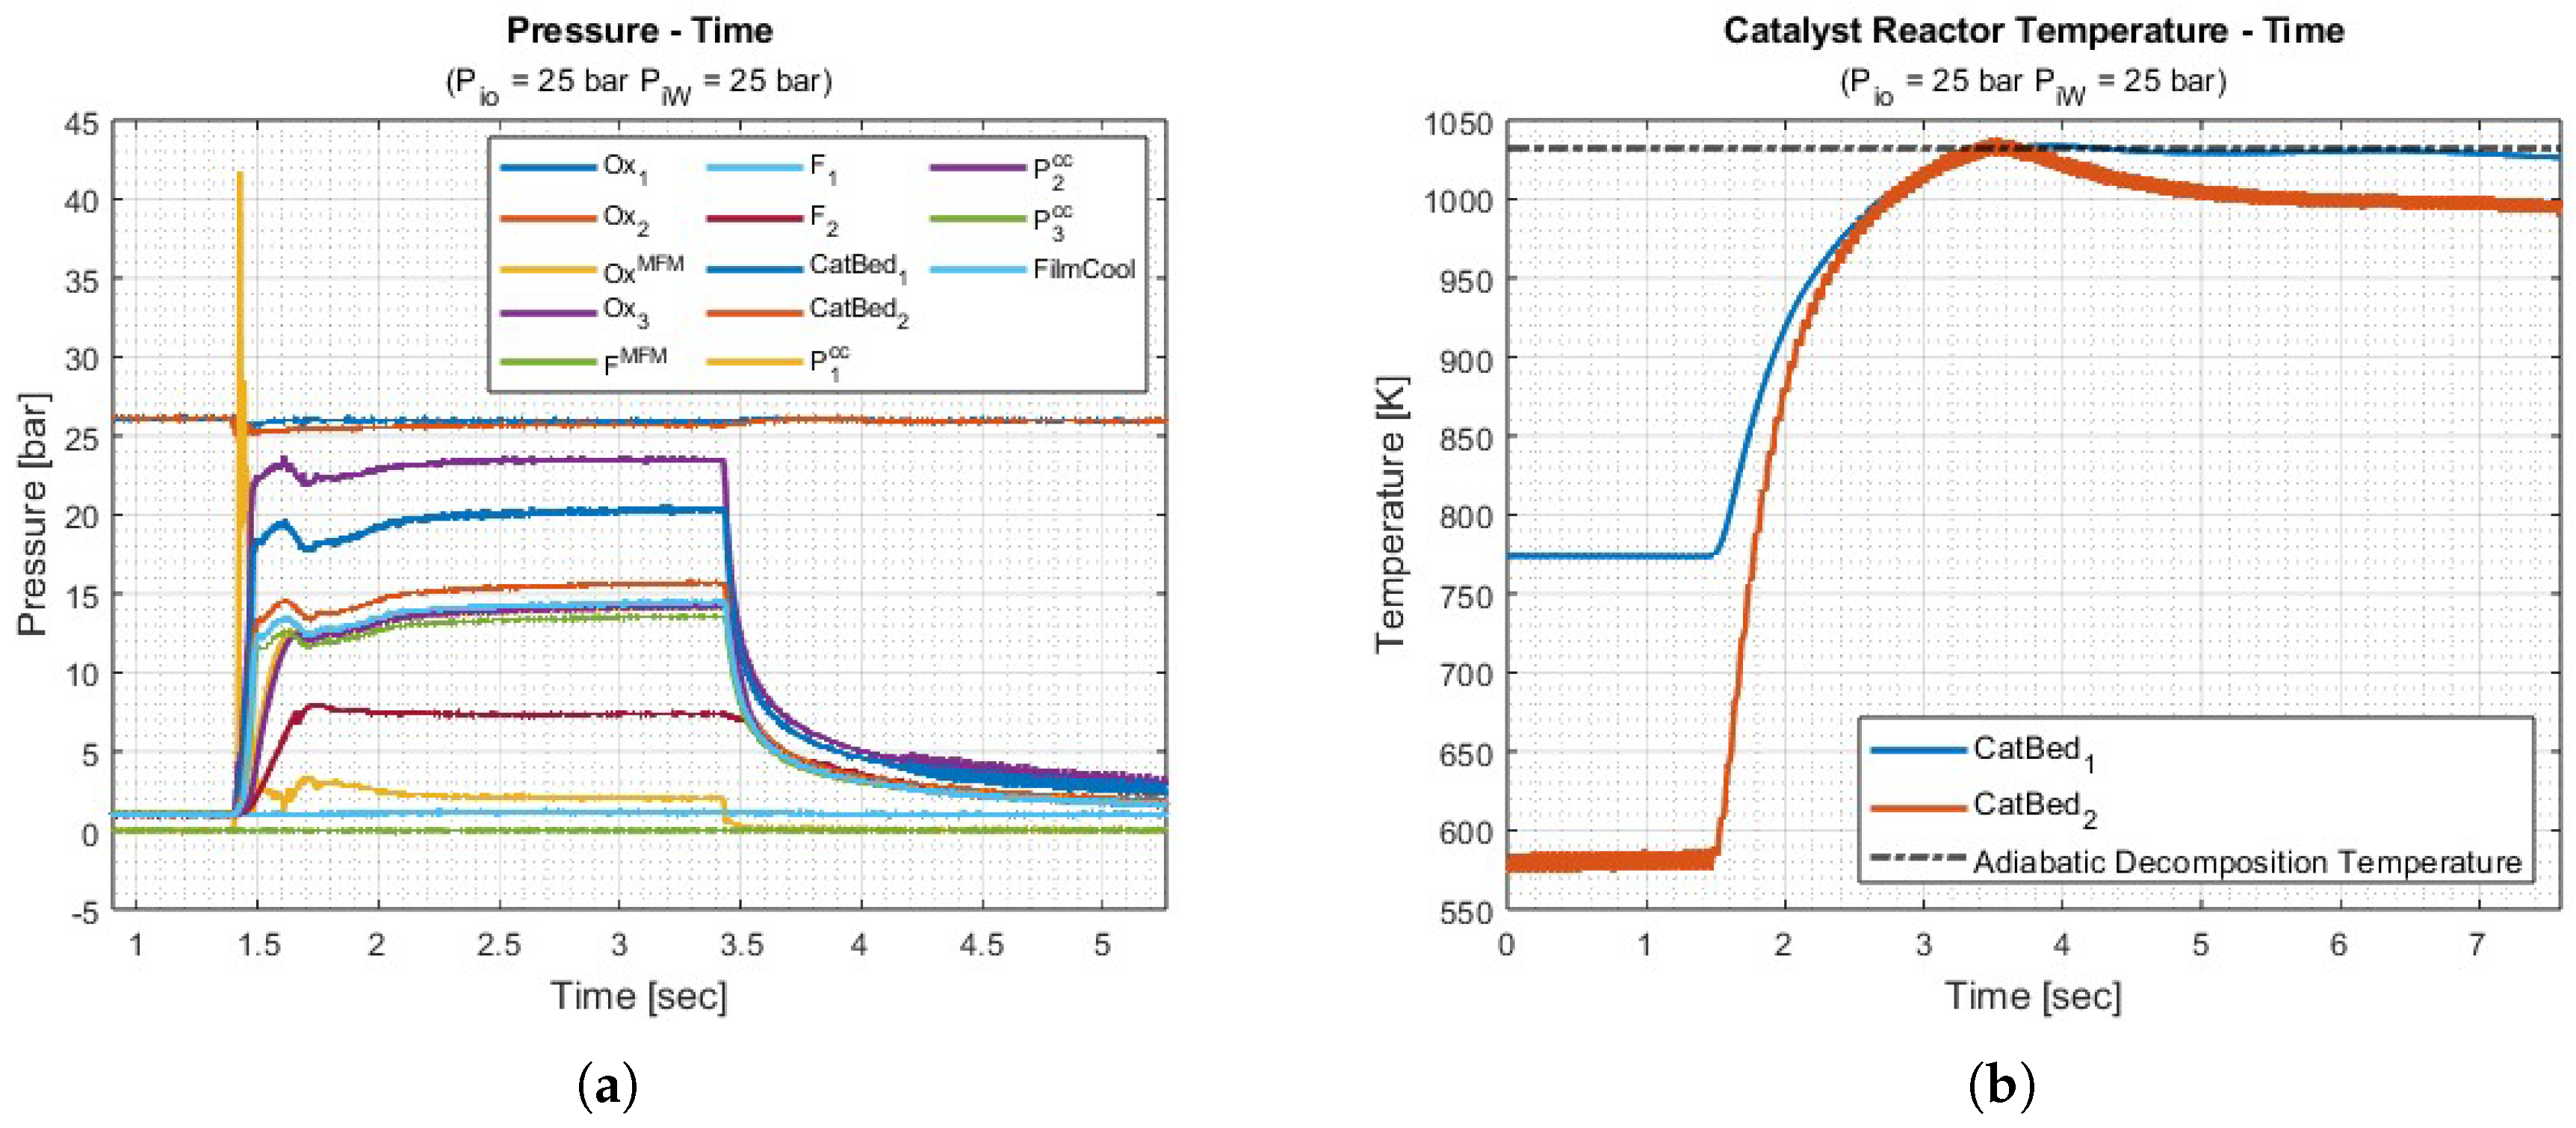
Figure 12.
Recorded images of mono-mode operation using visualization chamber
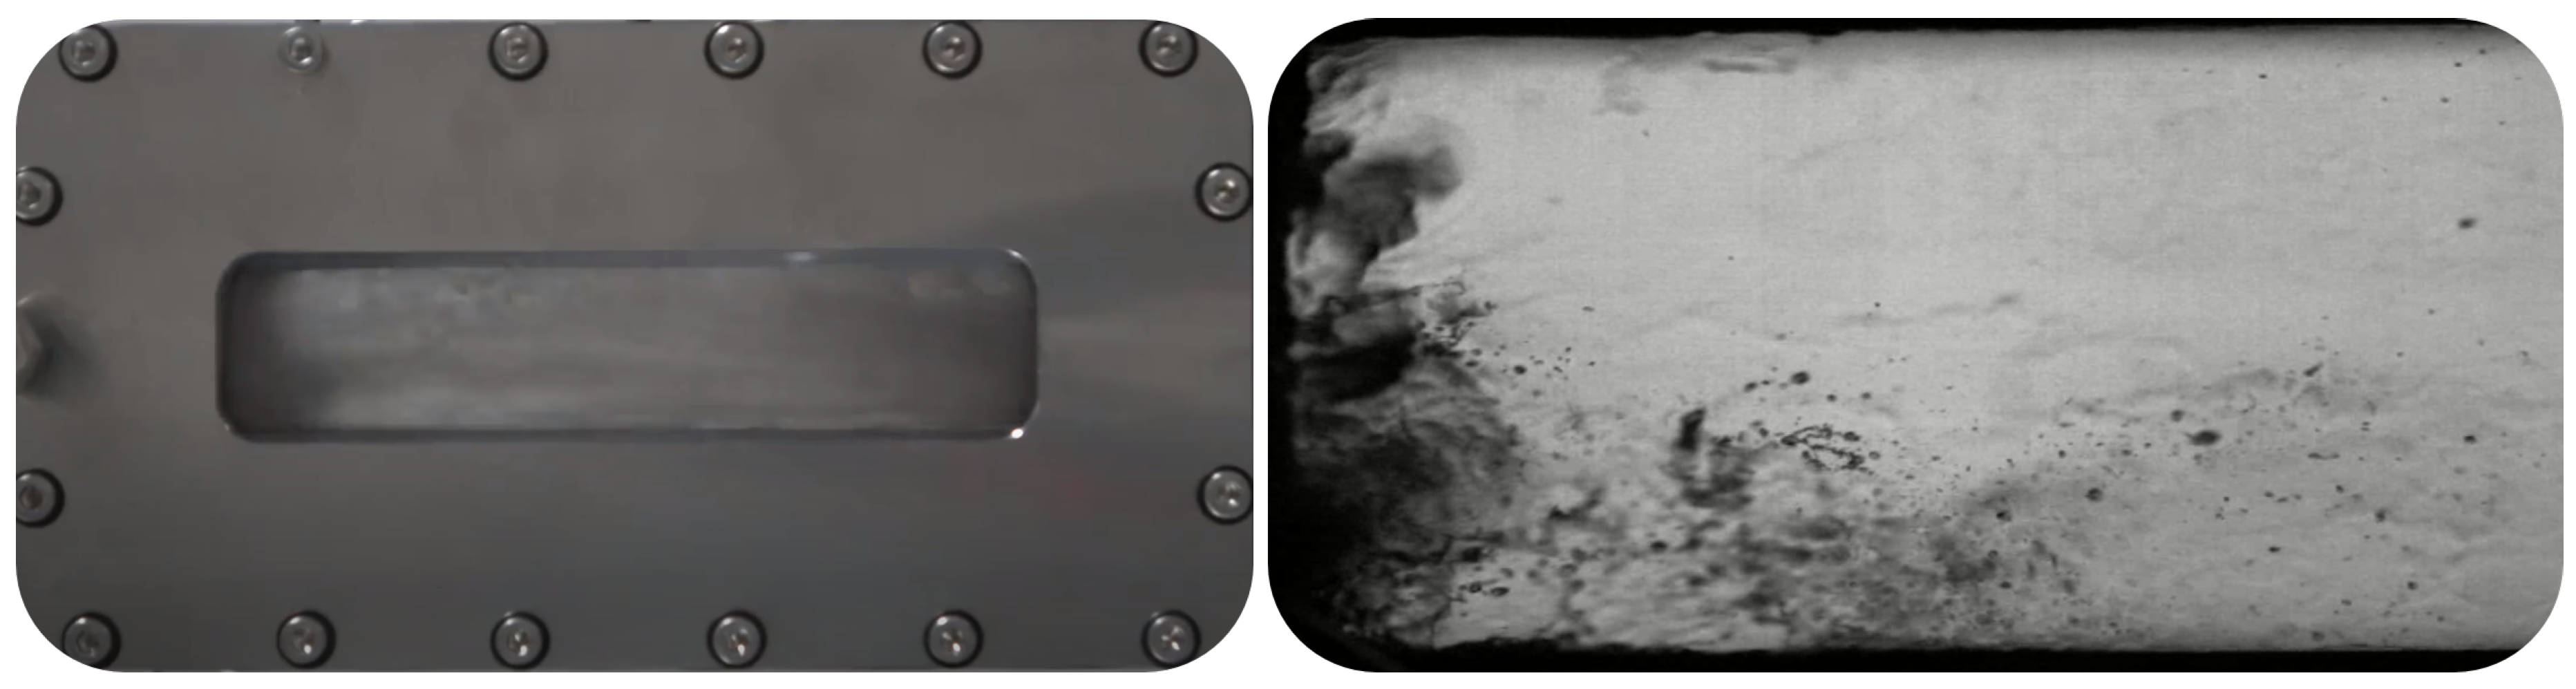
Figure 13.
H2O2/Kerosene bipropellant thruster integrated with dummy windows
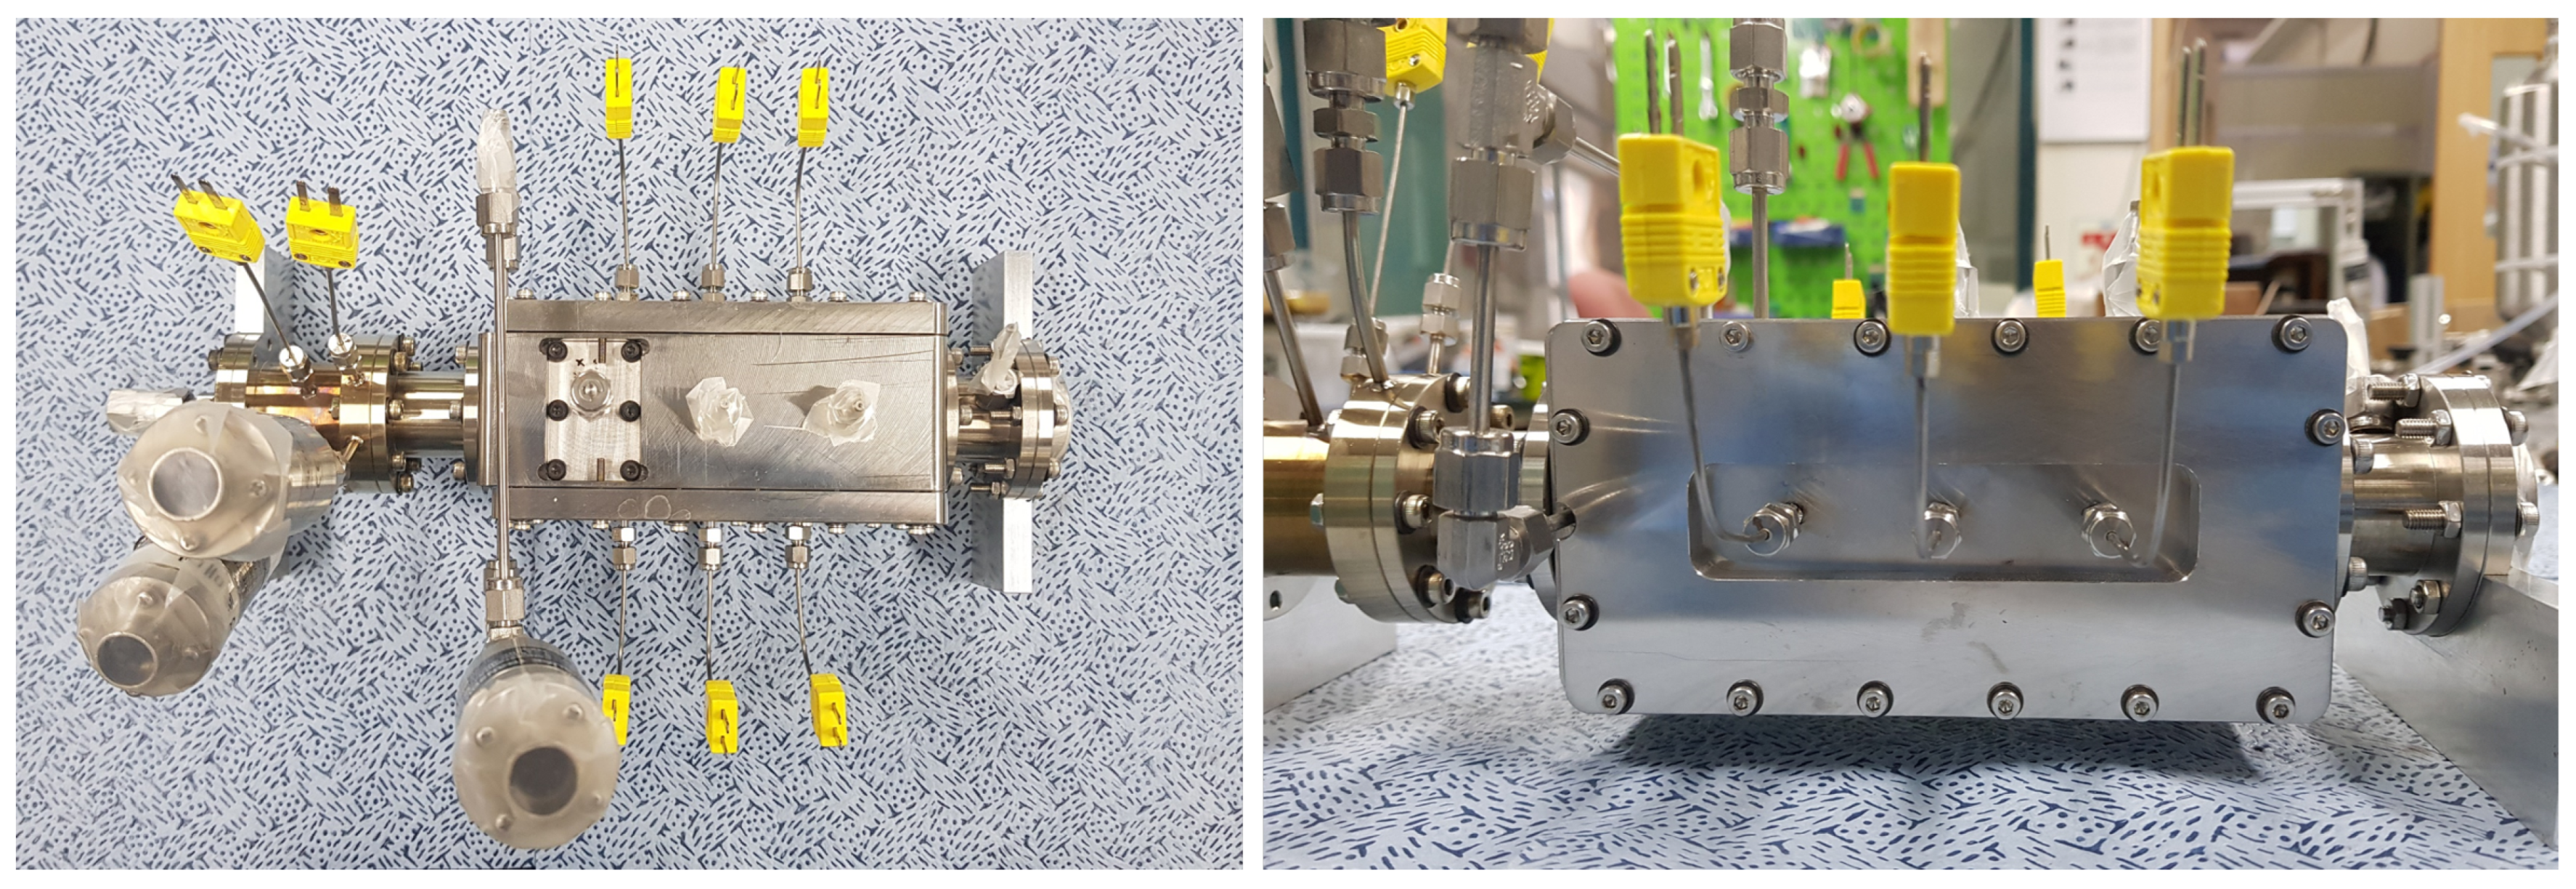
Figure 14.
Bi-mode operation sequence
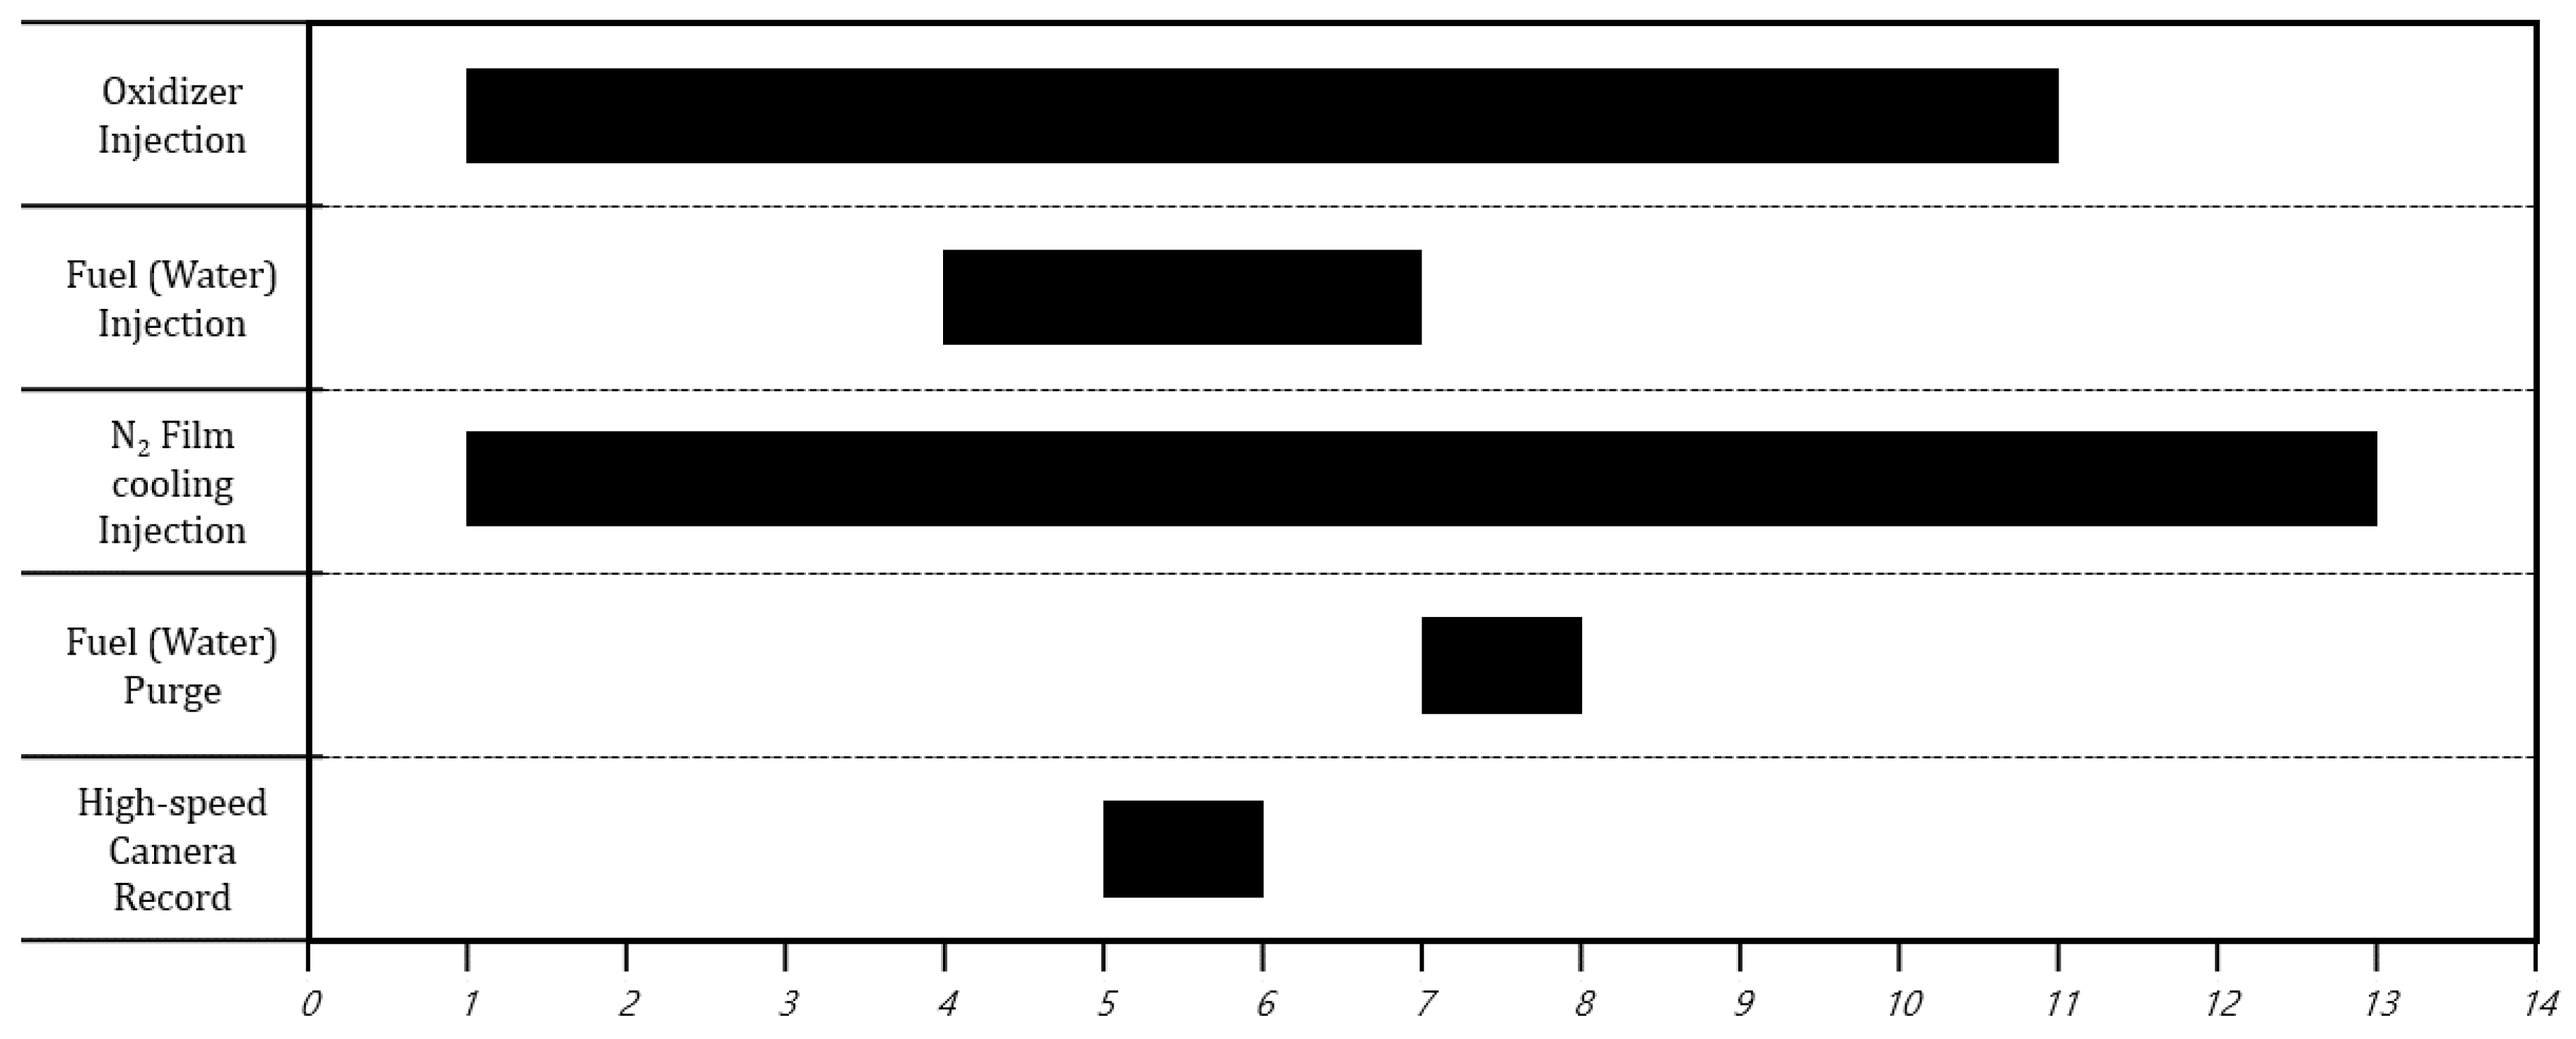
Figure 15.
Hot-fire test of H2O2/Kerosene bipropellant thruster
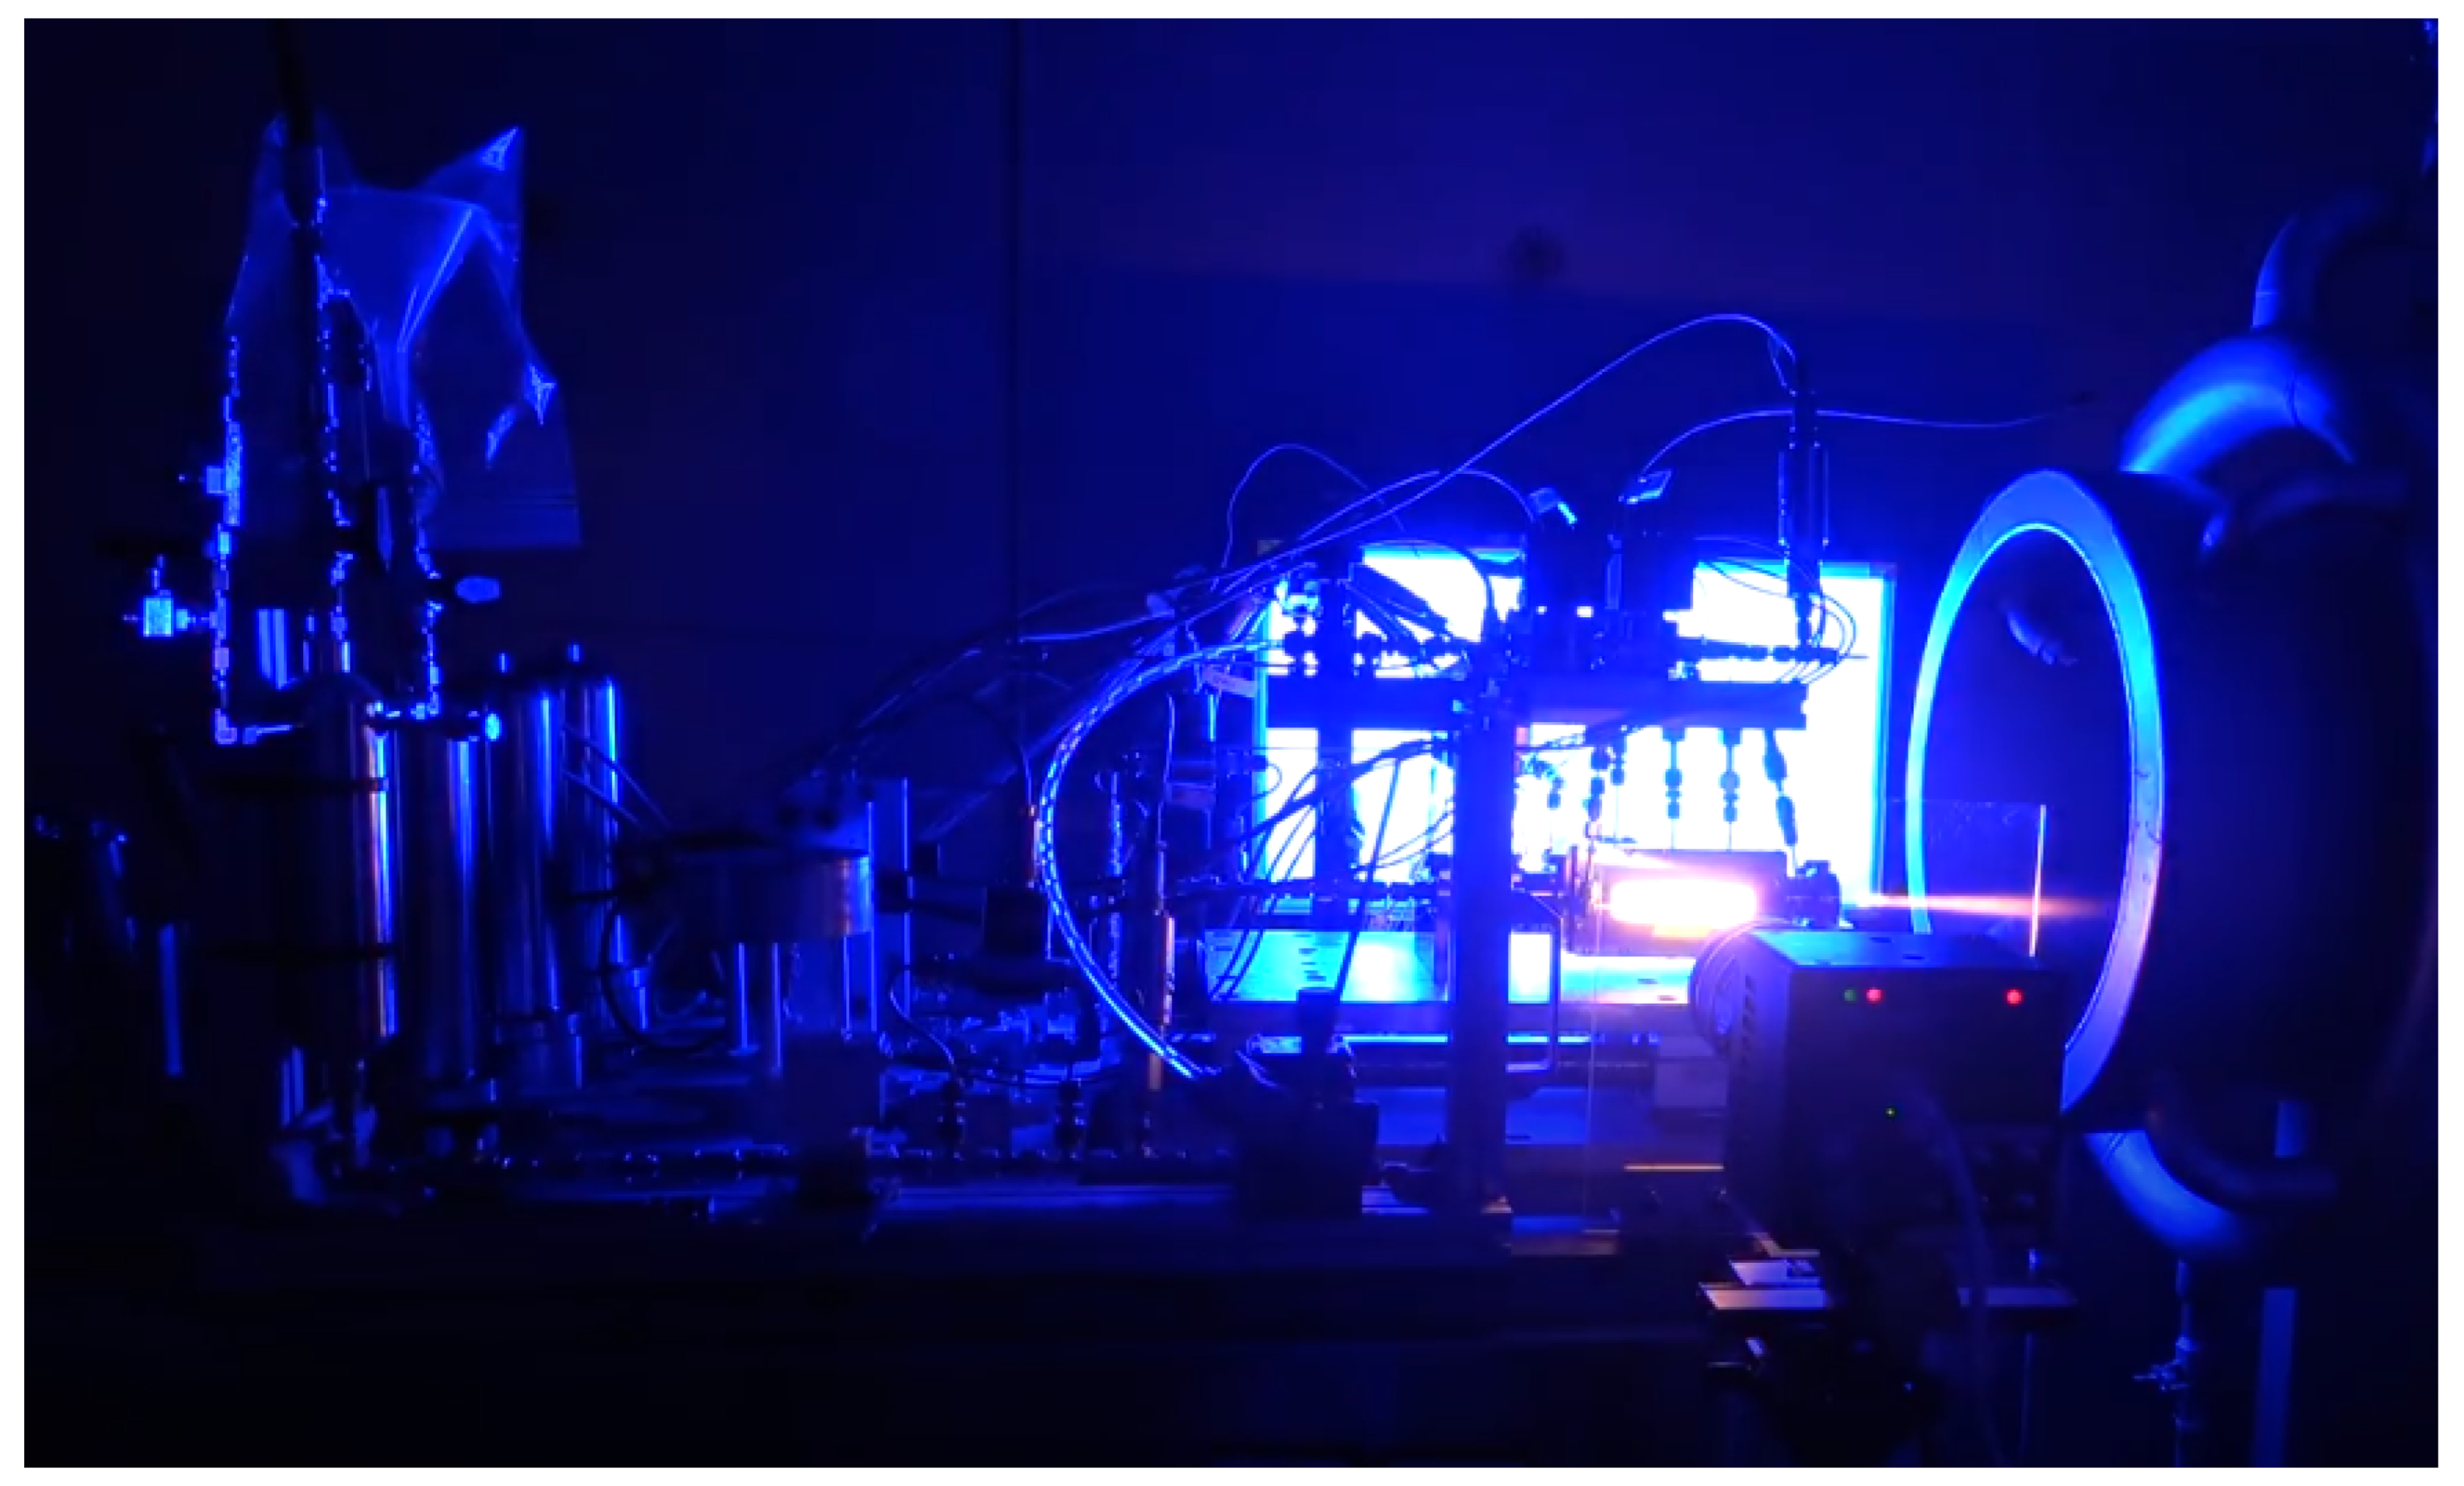
Figure 16.
Effect of chemiluminescence imaging in shadowgraph images for observing the combustion process
Figure 16.
Effect of chemiluminescence imaging in shadowgraph images for observing the combustion process
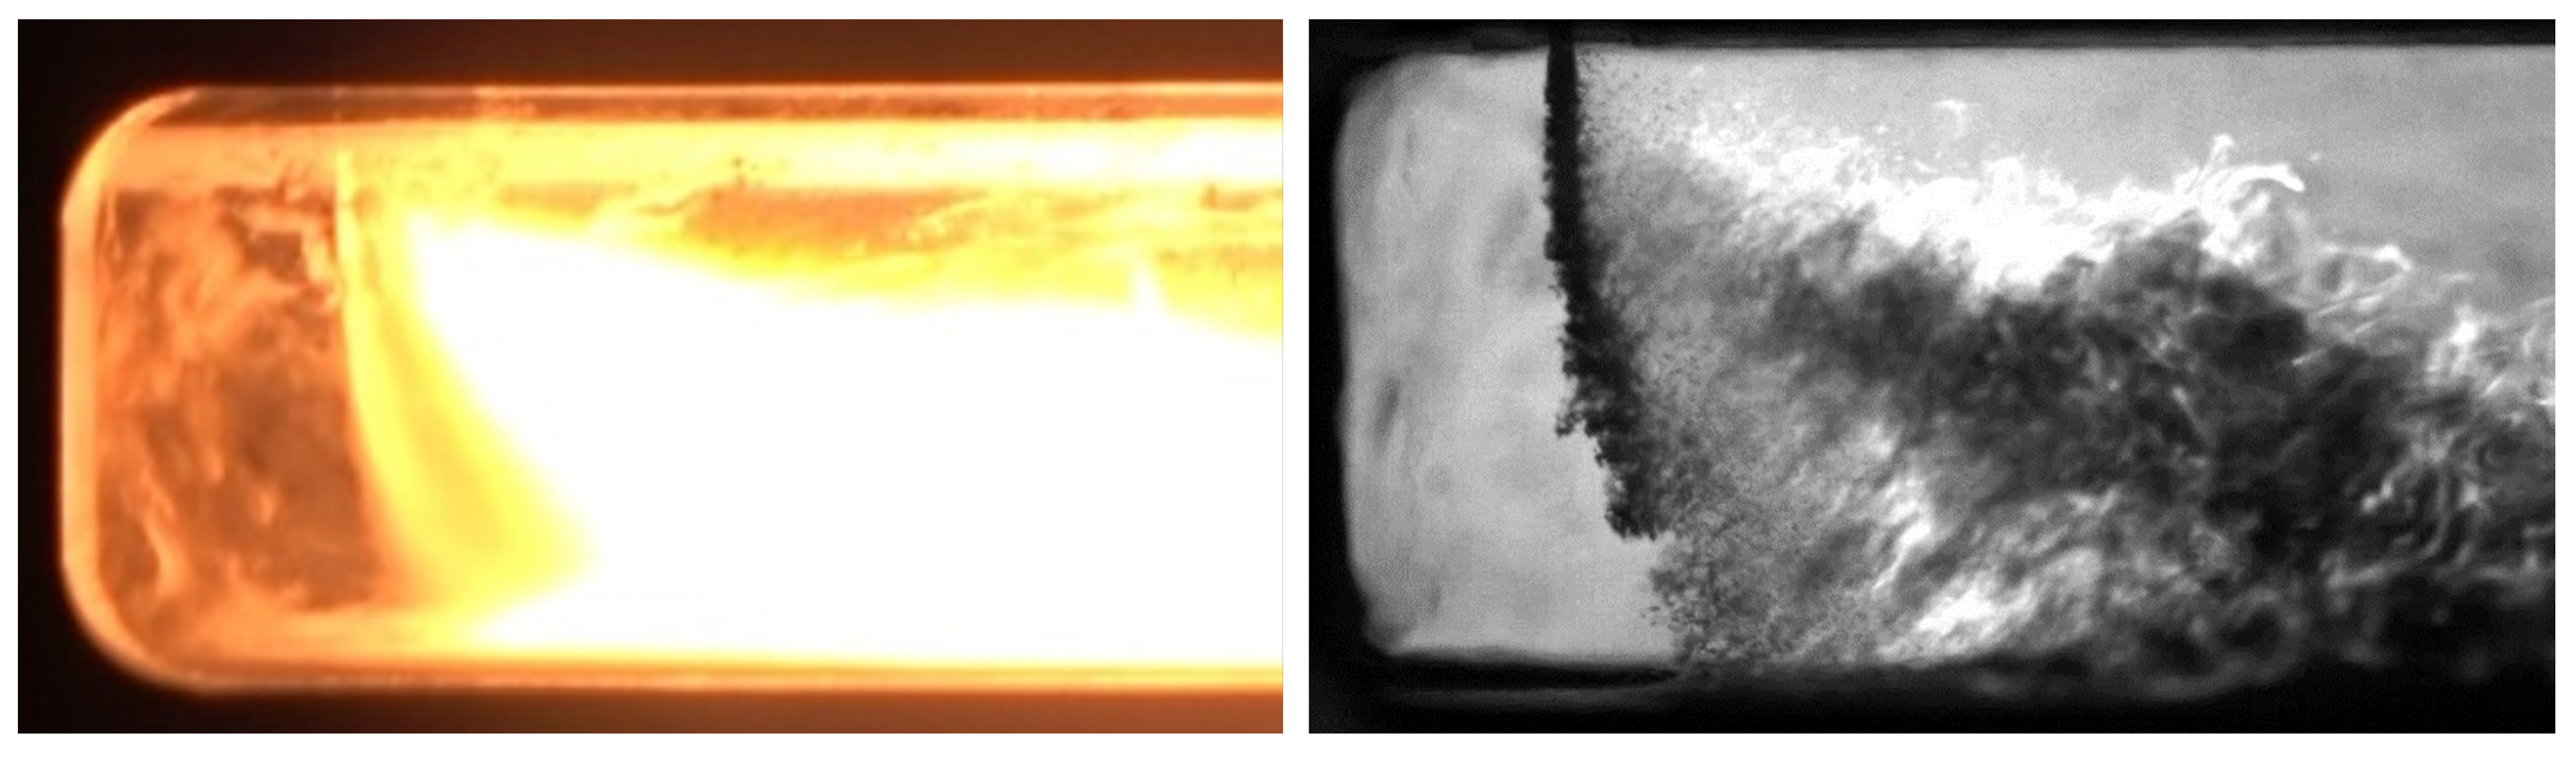
Figure 17.
Pressure and temperature measurement for fuel injection bi-mode operation for bar and bar condition
Figure 17.
Pressure and temperature measurement for fuel injection bi-mode operation for bar and bar condition
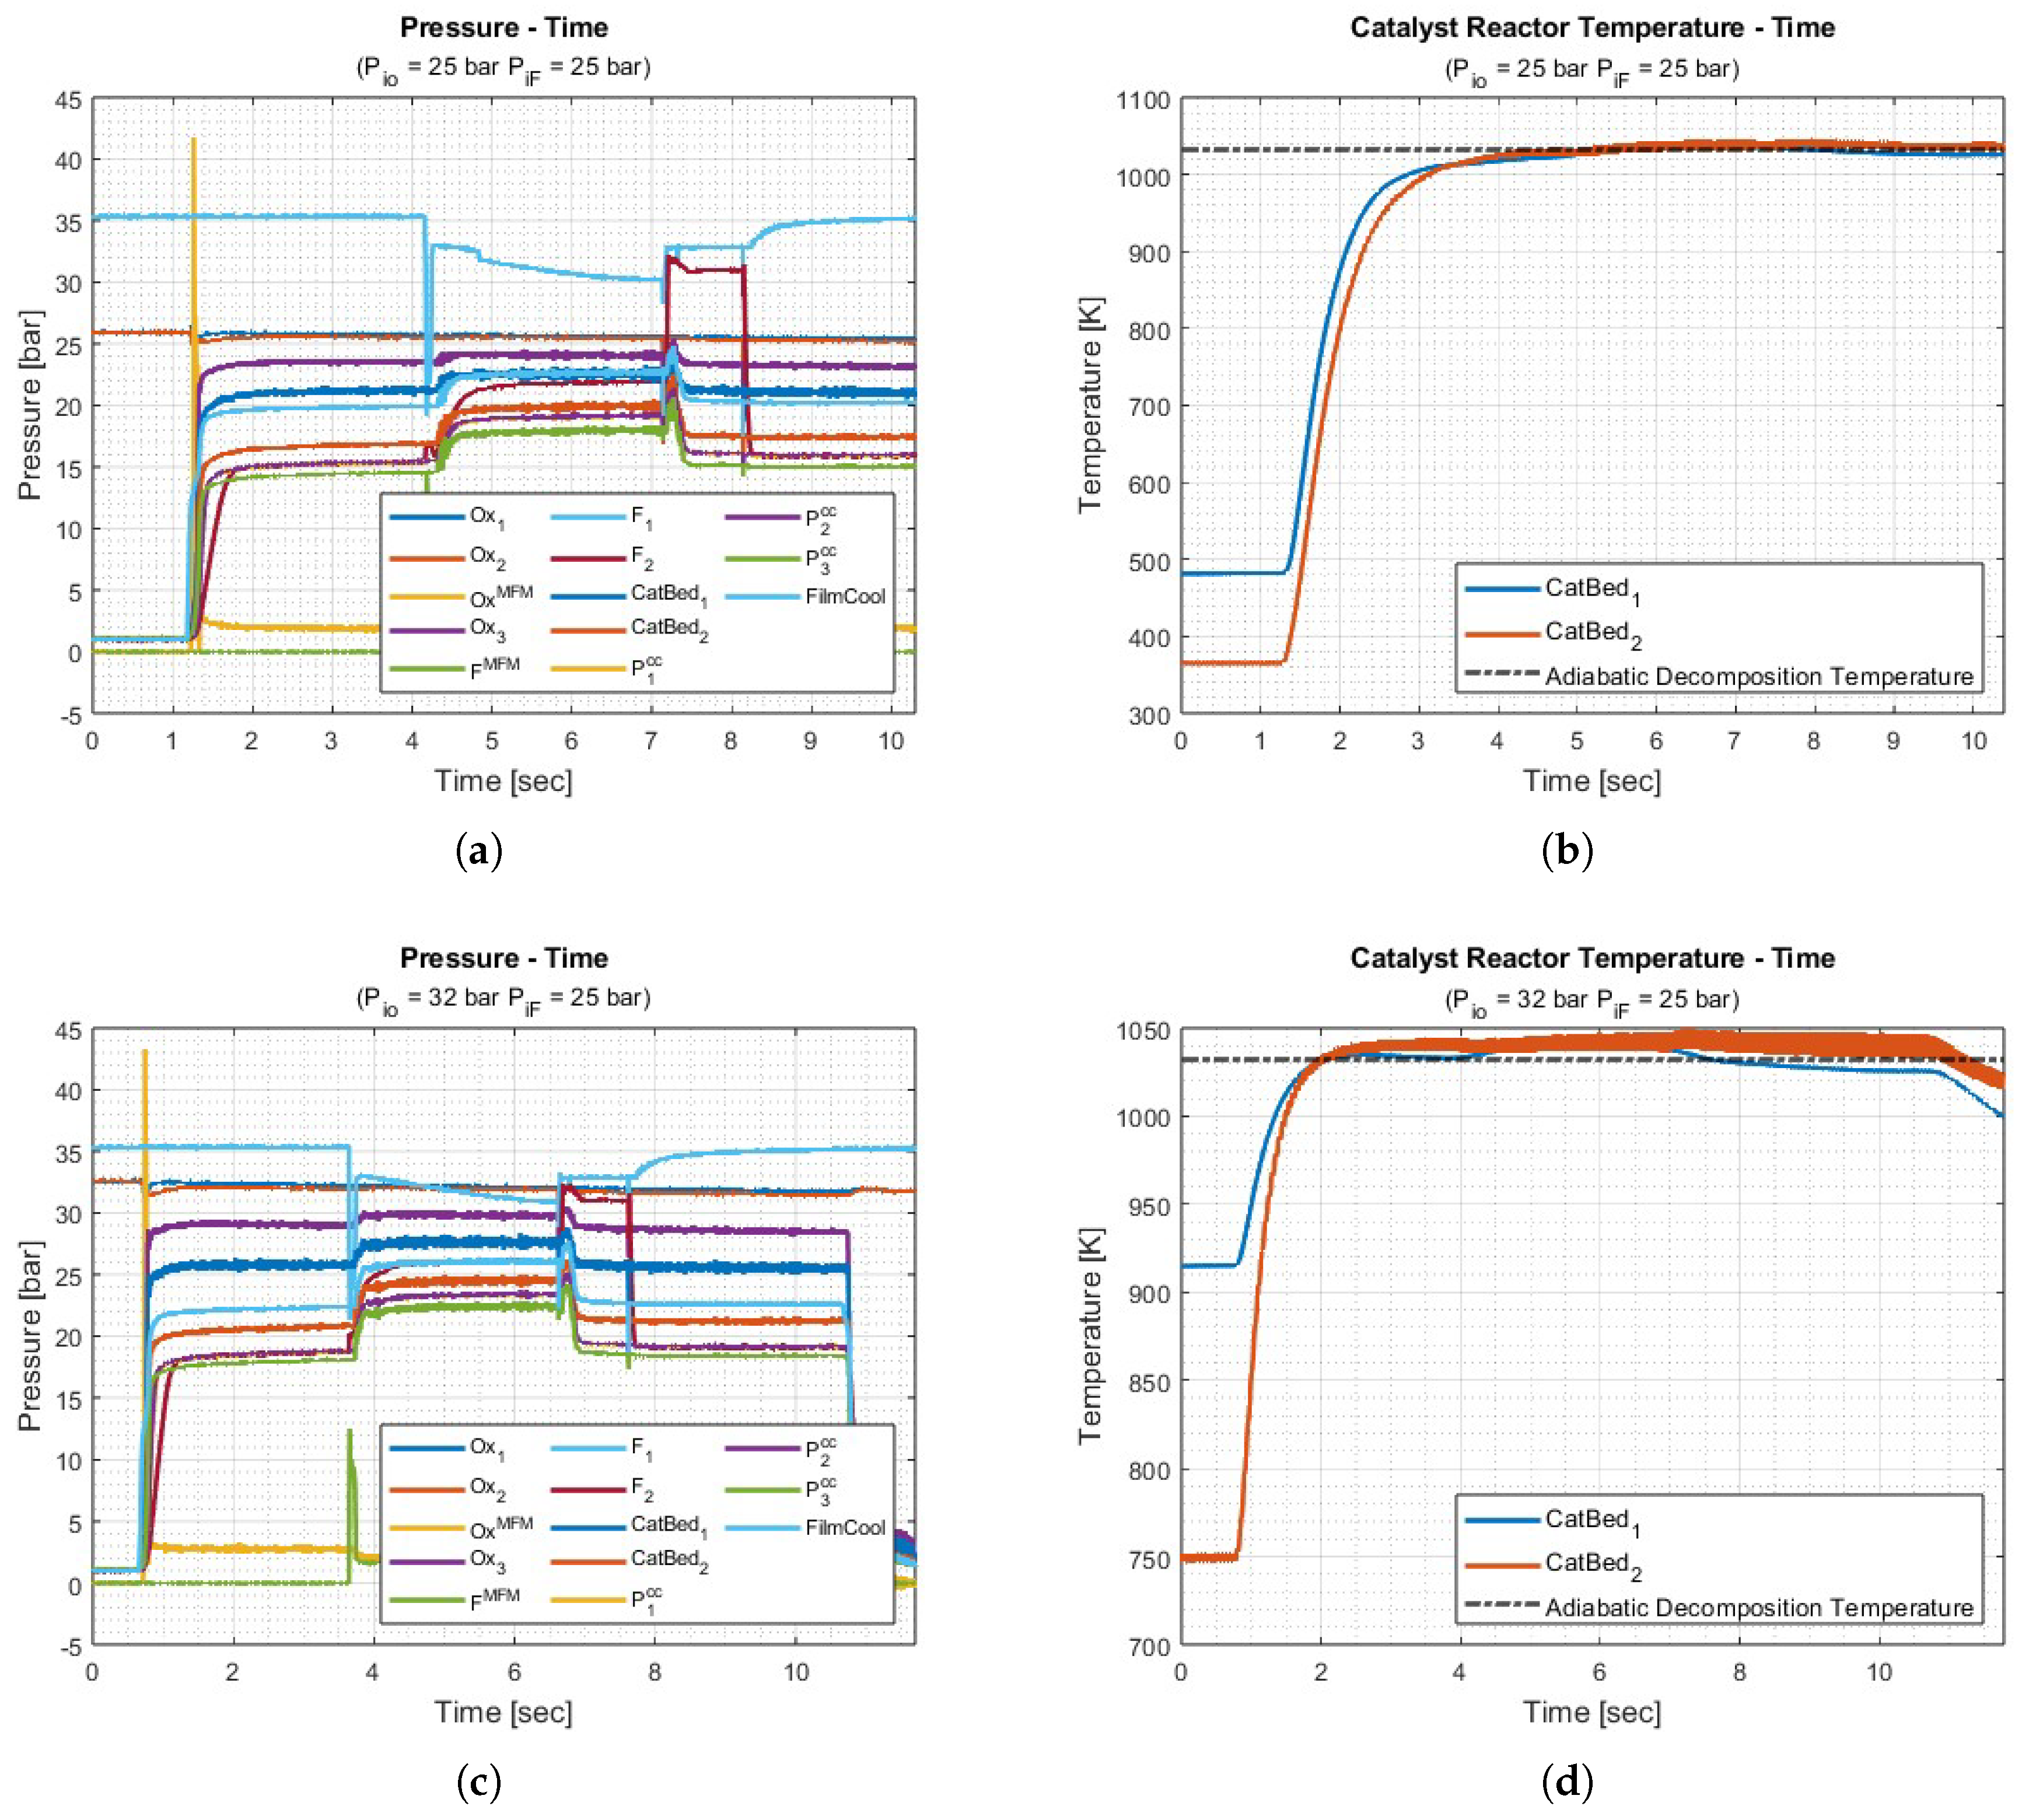
Figure 18.
Pressure and temperature measurement for water injection bi-mode operation for bar condition
Figure 18.
Pressure and temperature measurement for water injection bi-mode operation for bar condition
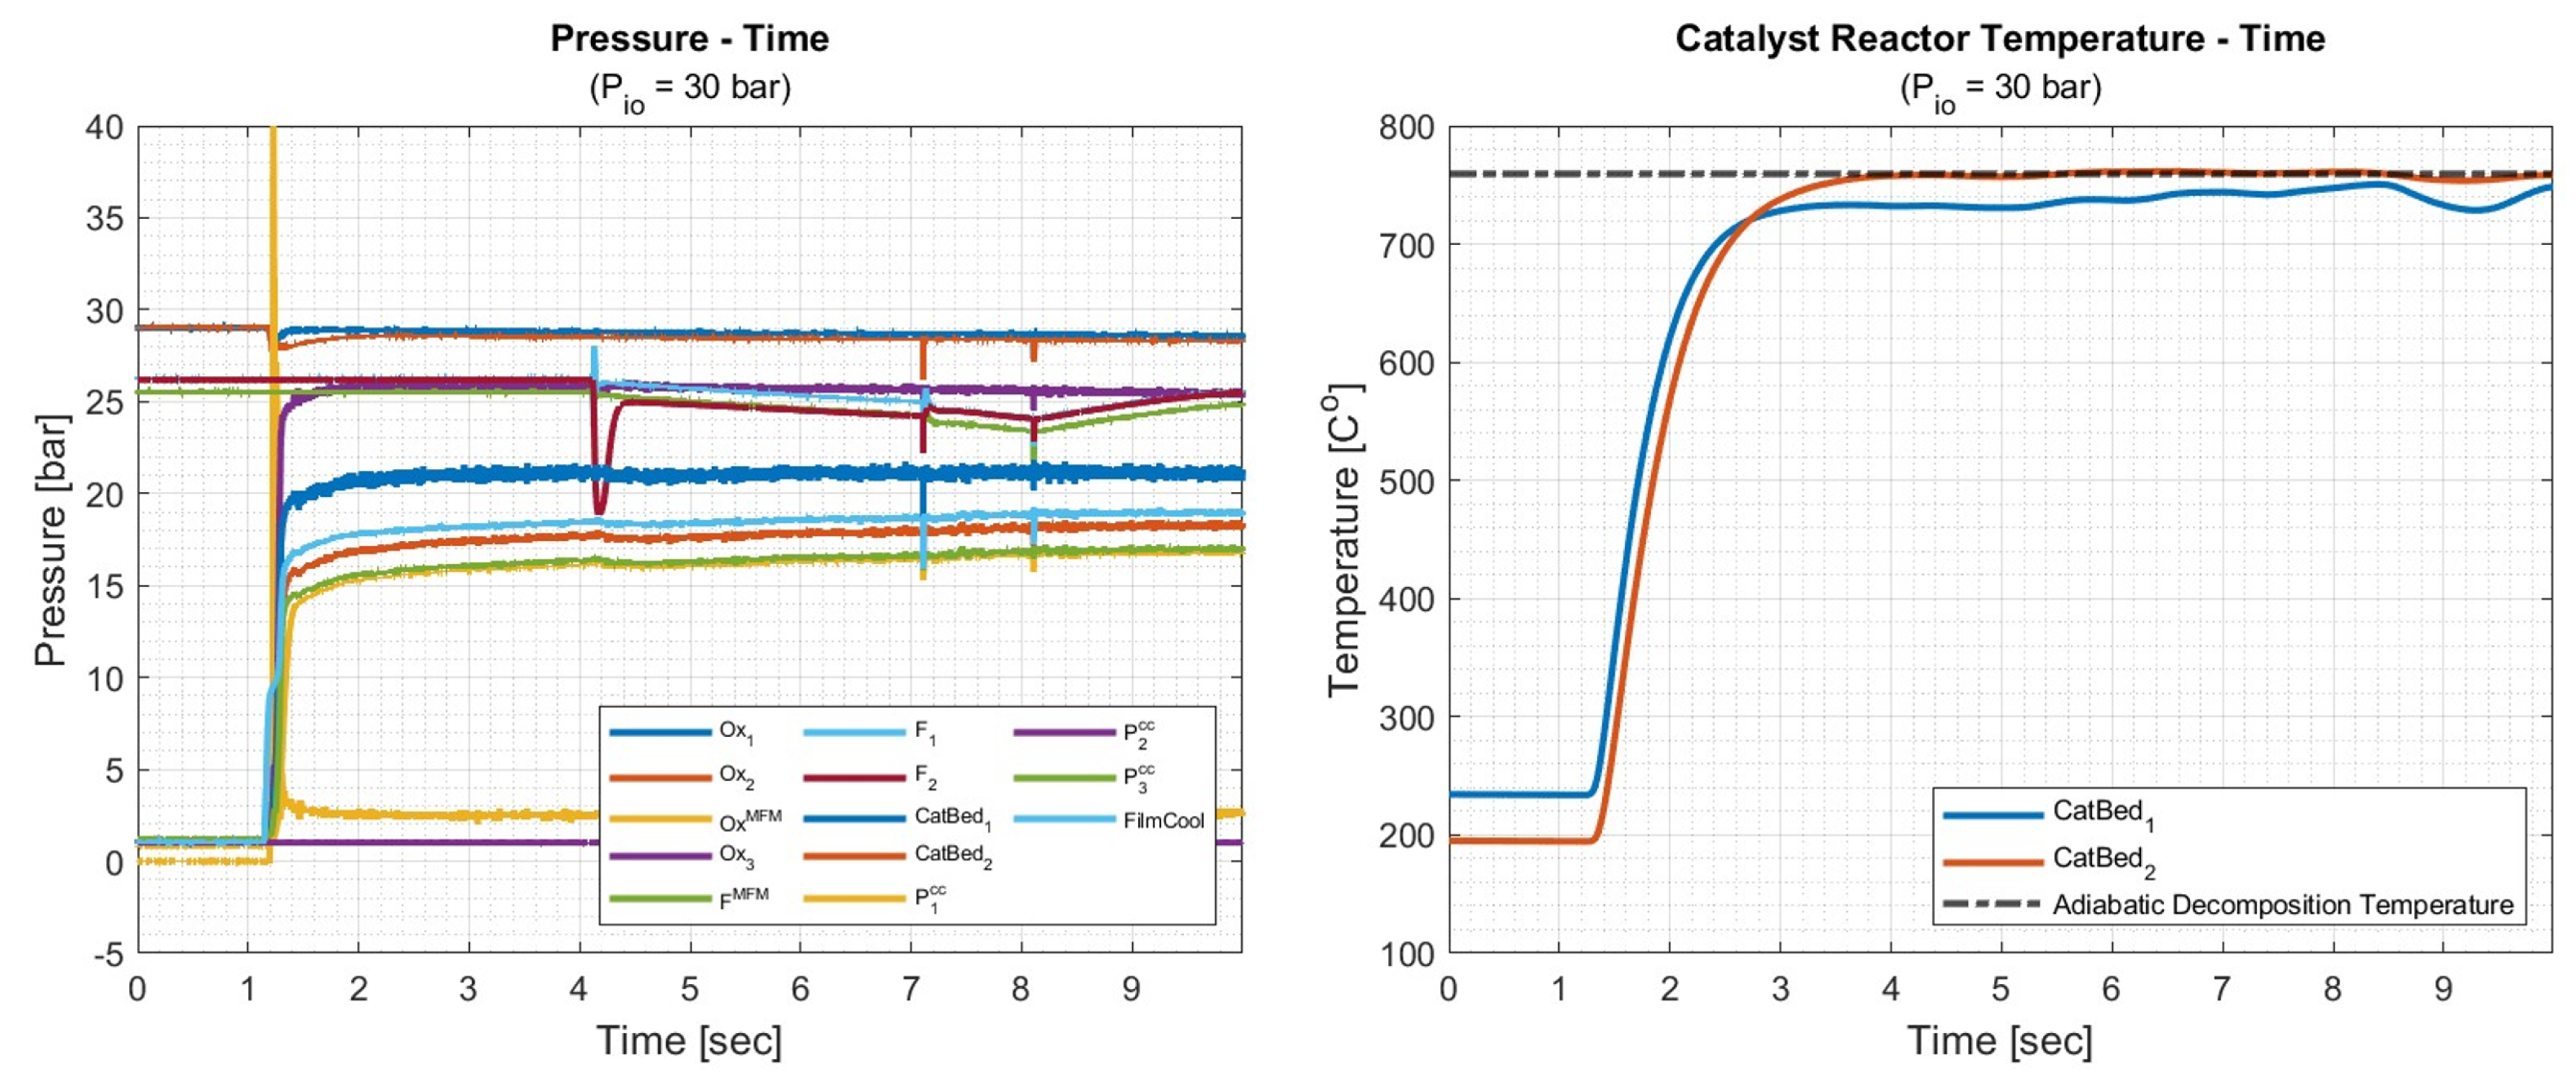
Figure 19.
Pressure perturbation changes according to the consecutive operation
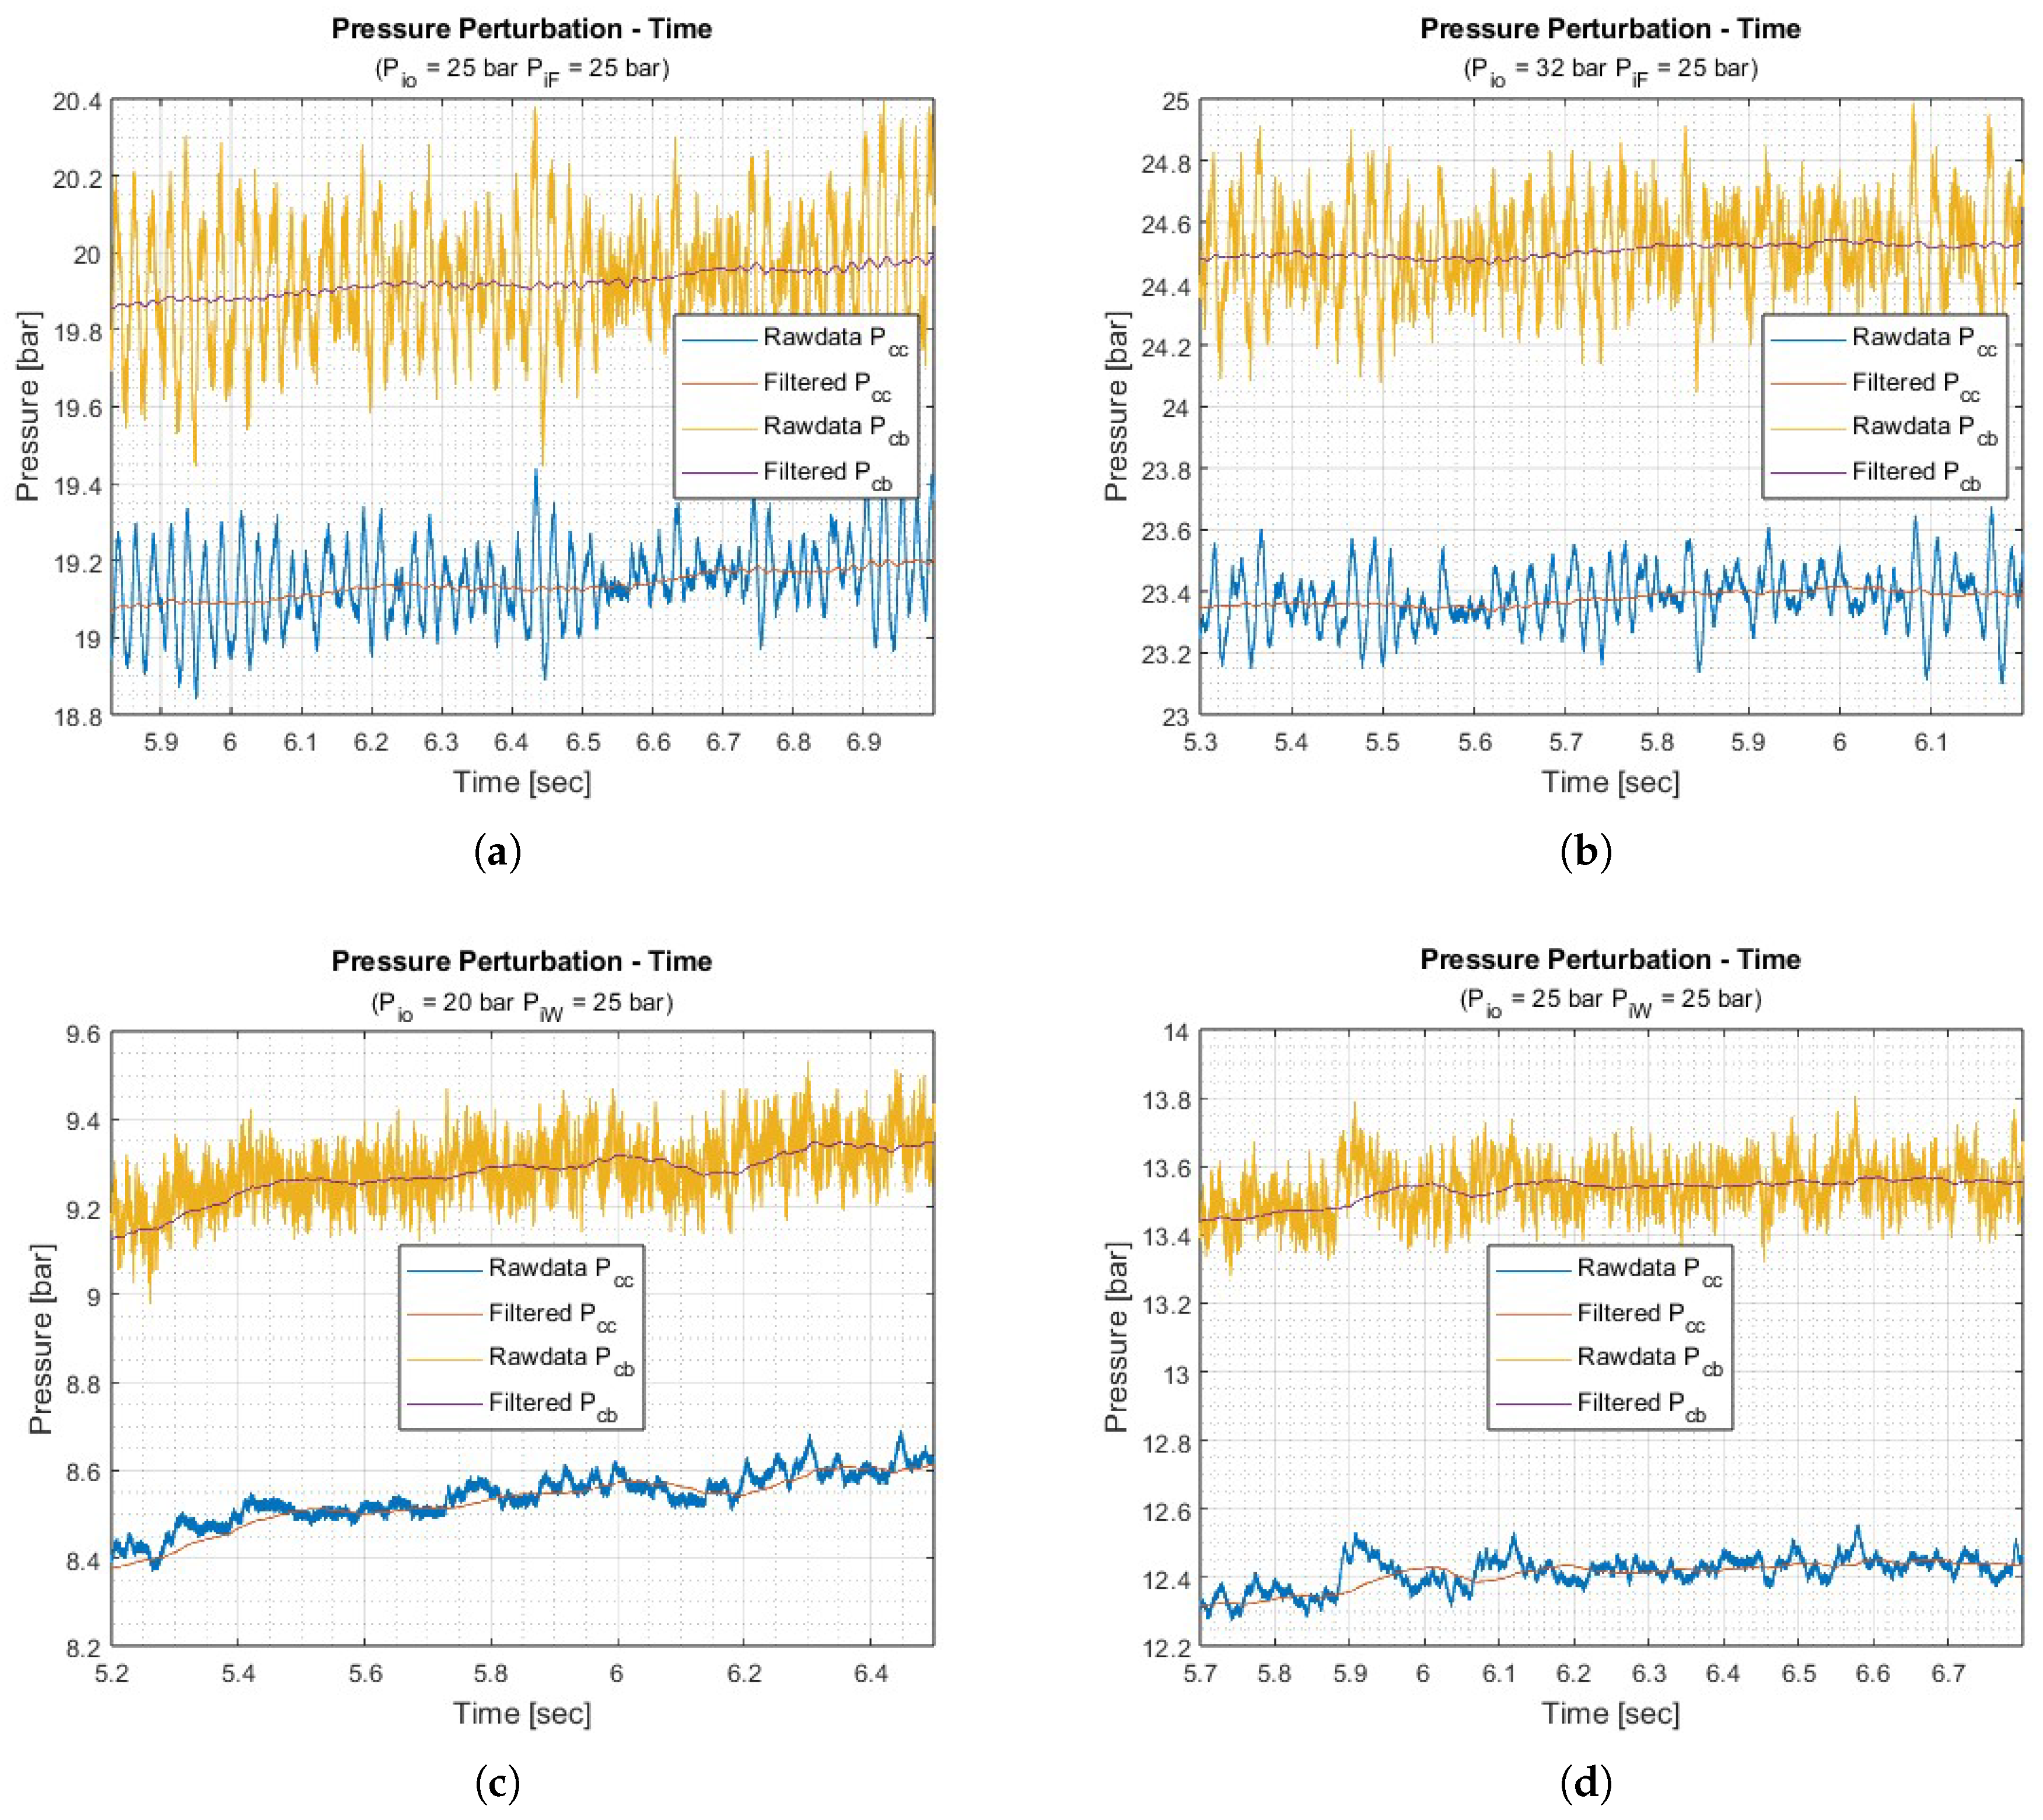
Figure 20.
Flawless visualization image (left), image disruption by soot deposition (middle), out-of-focus image (right)
Figure 20.
Flawless visualization image (left), image disruption by soot deposition (middle), out-of-focus image (right)
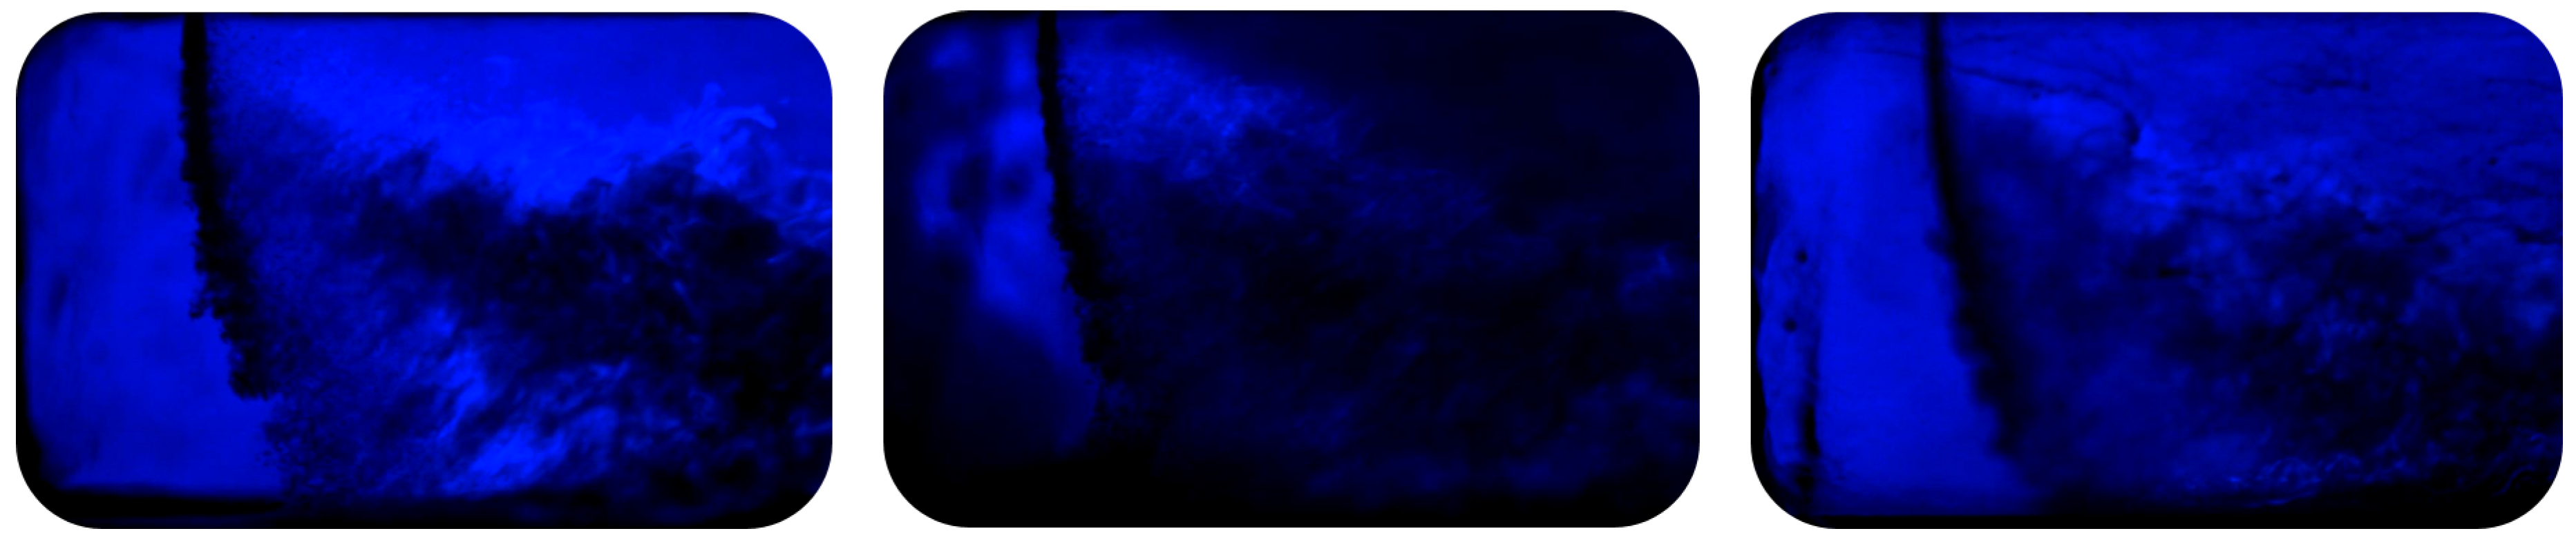
Figure 21.
Conceptual diagram of imaging processing procedures for combustion visualization images
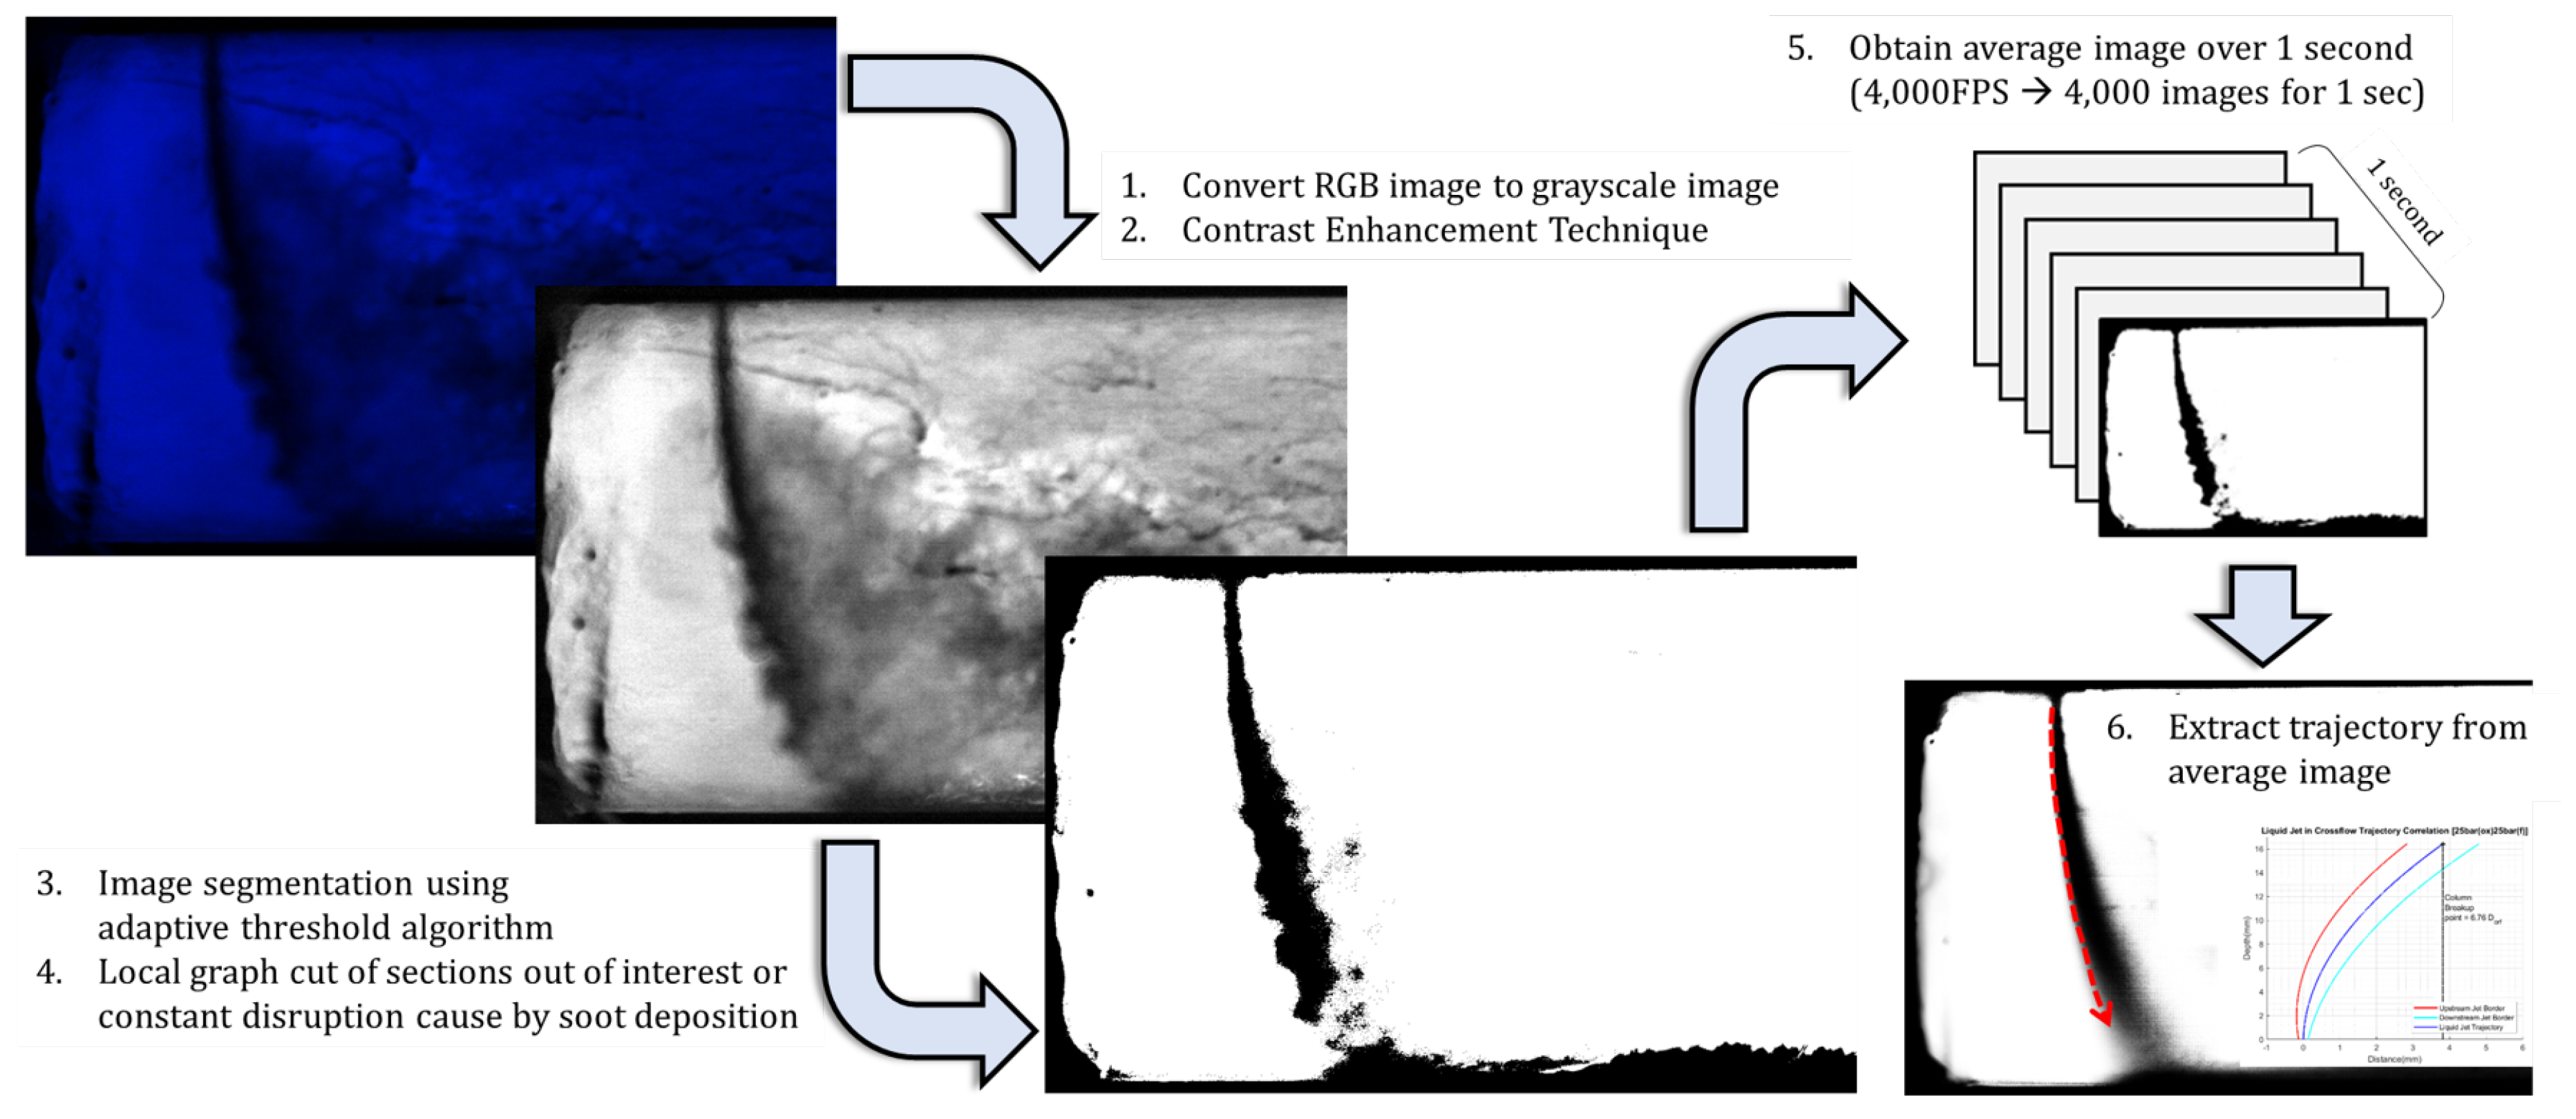
Figure 22.
Average image and extracted jet trajectories in bi-mode operations
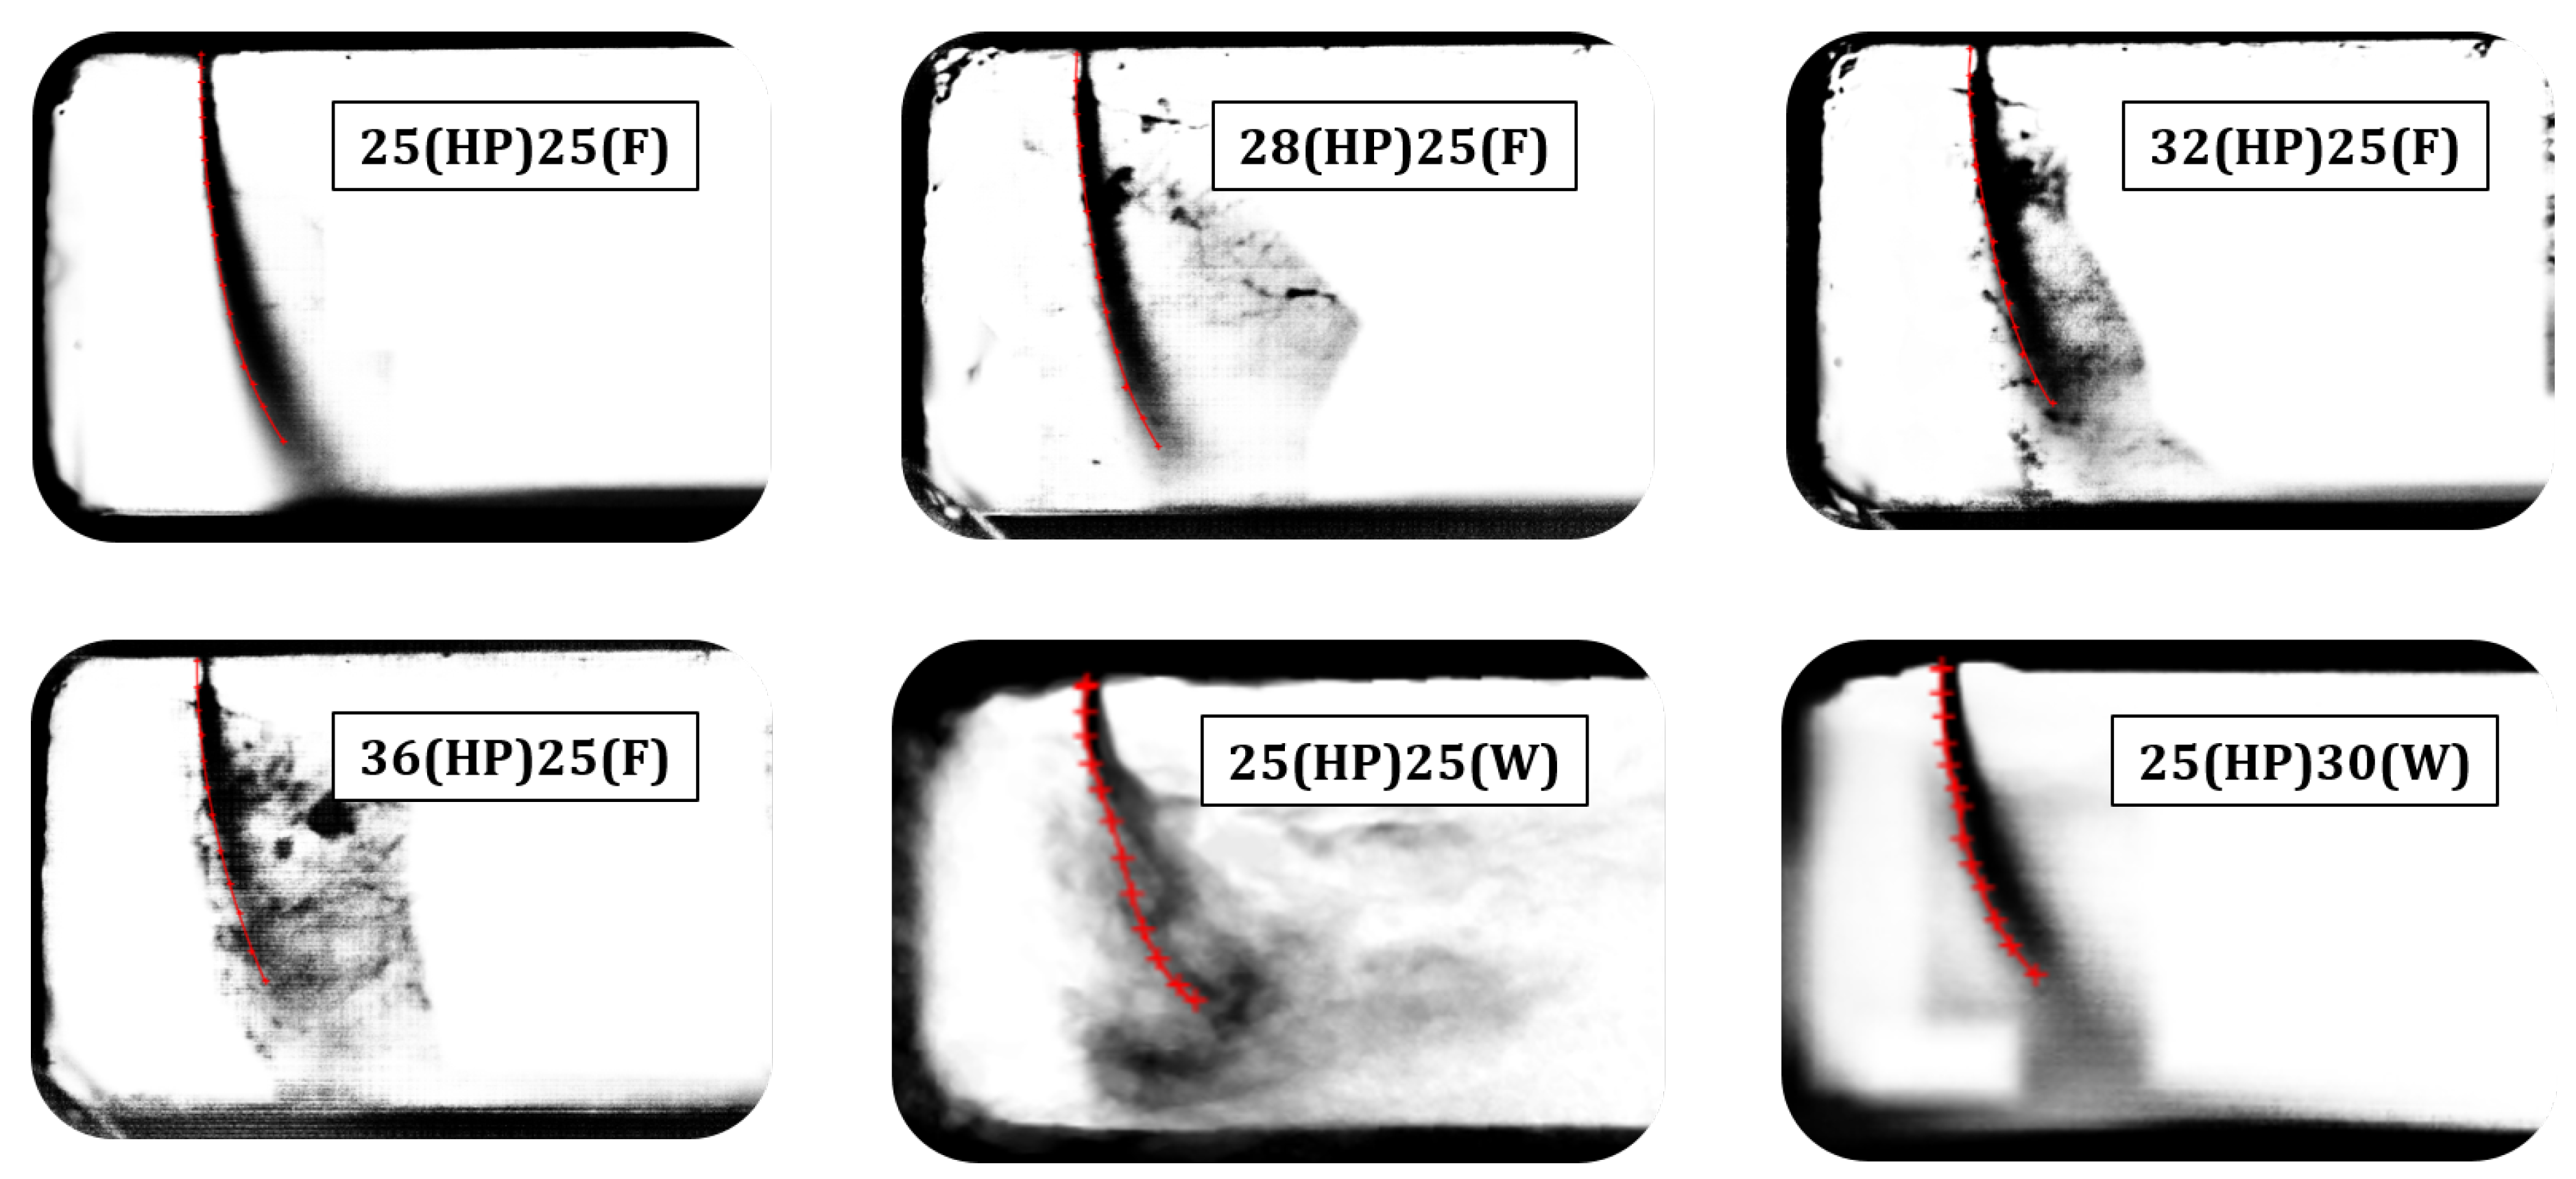
Figure 23.
Trajectory comparison and RMSE calculation between observed data and past correlations.
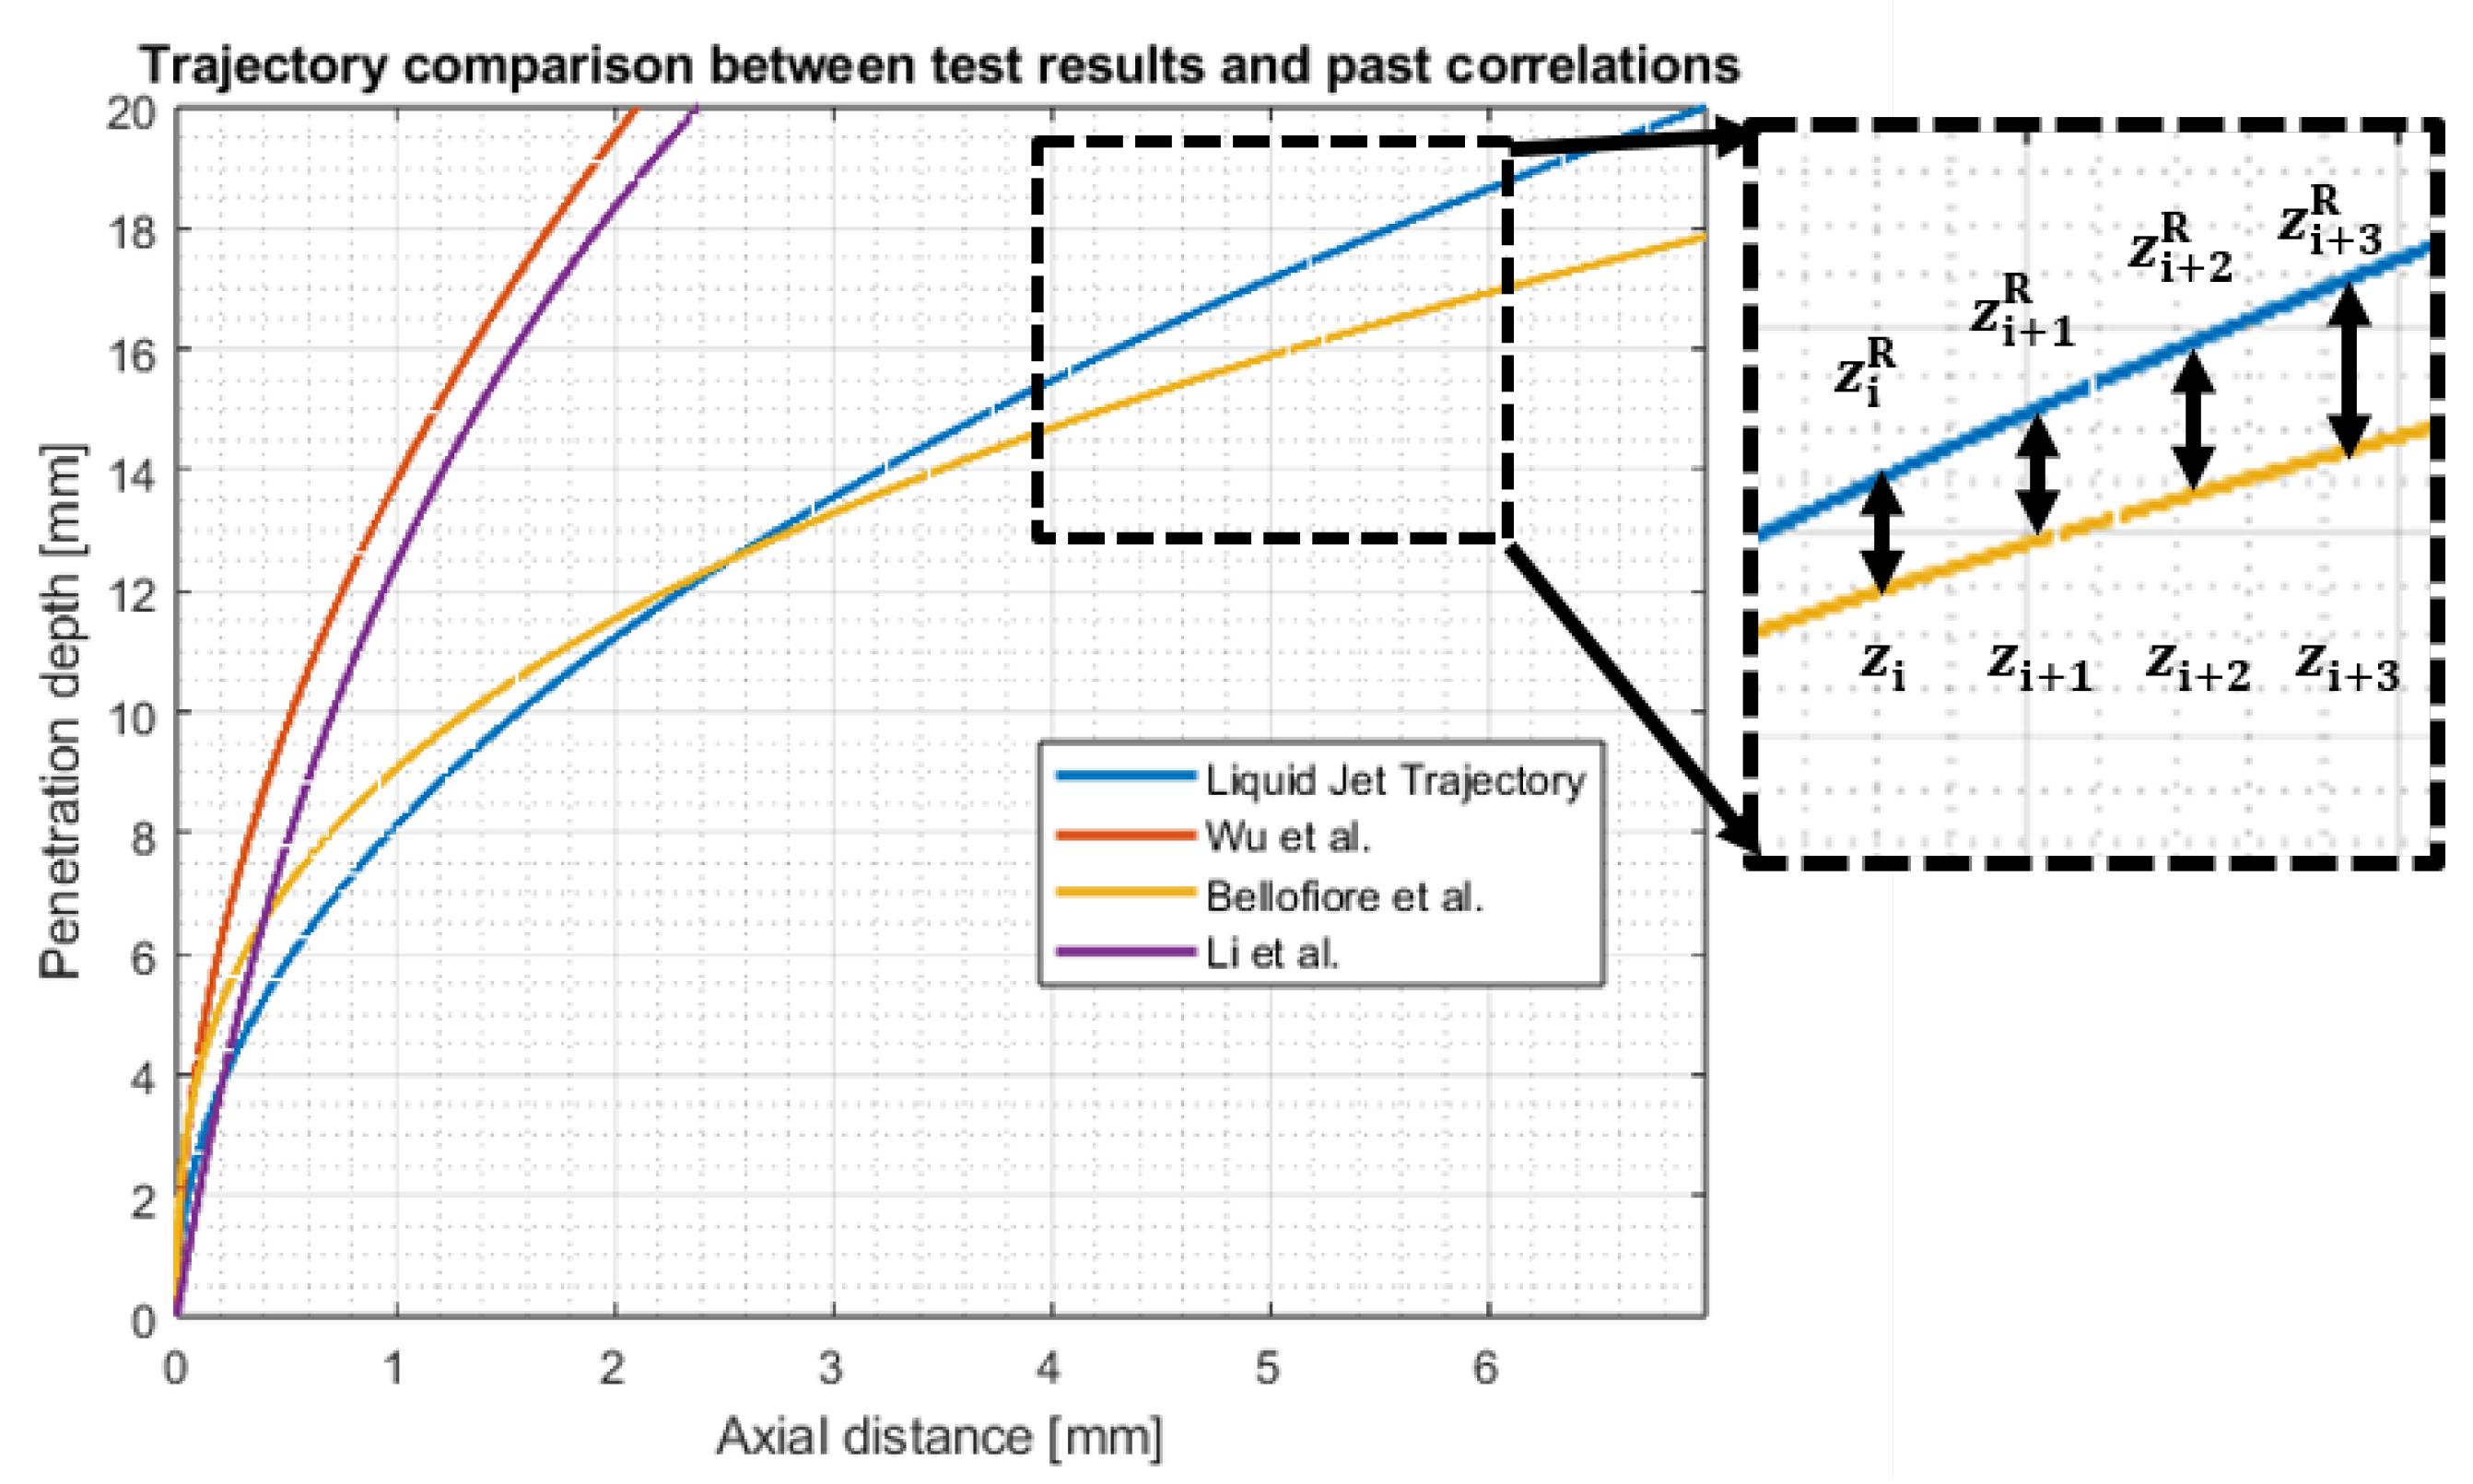
Figure 24.
Z-axis breakdown position as a function of dimensionless parameters
Figure 25.
X-axis breakdown position as a function of dimensionless parameters
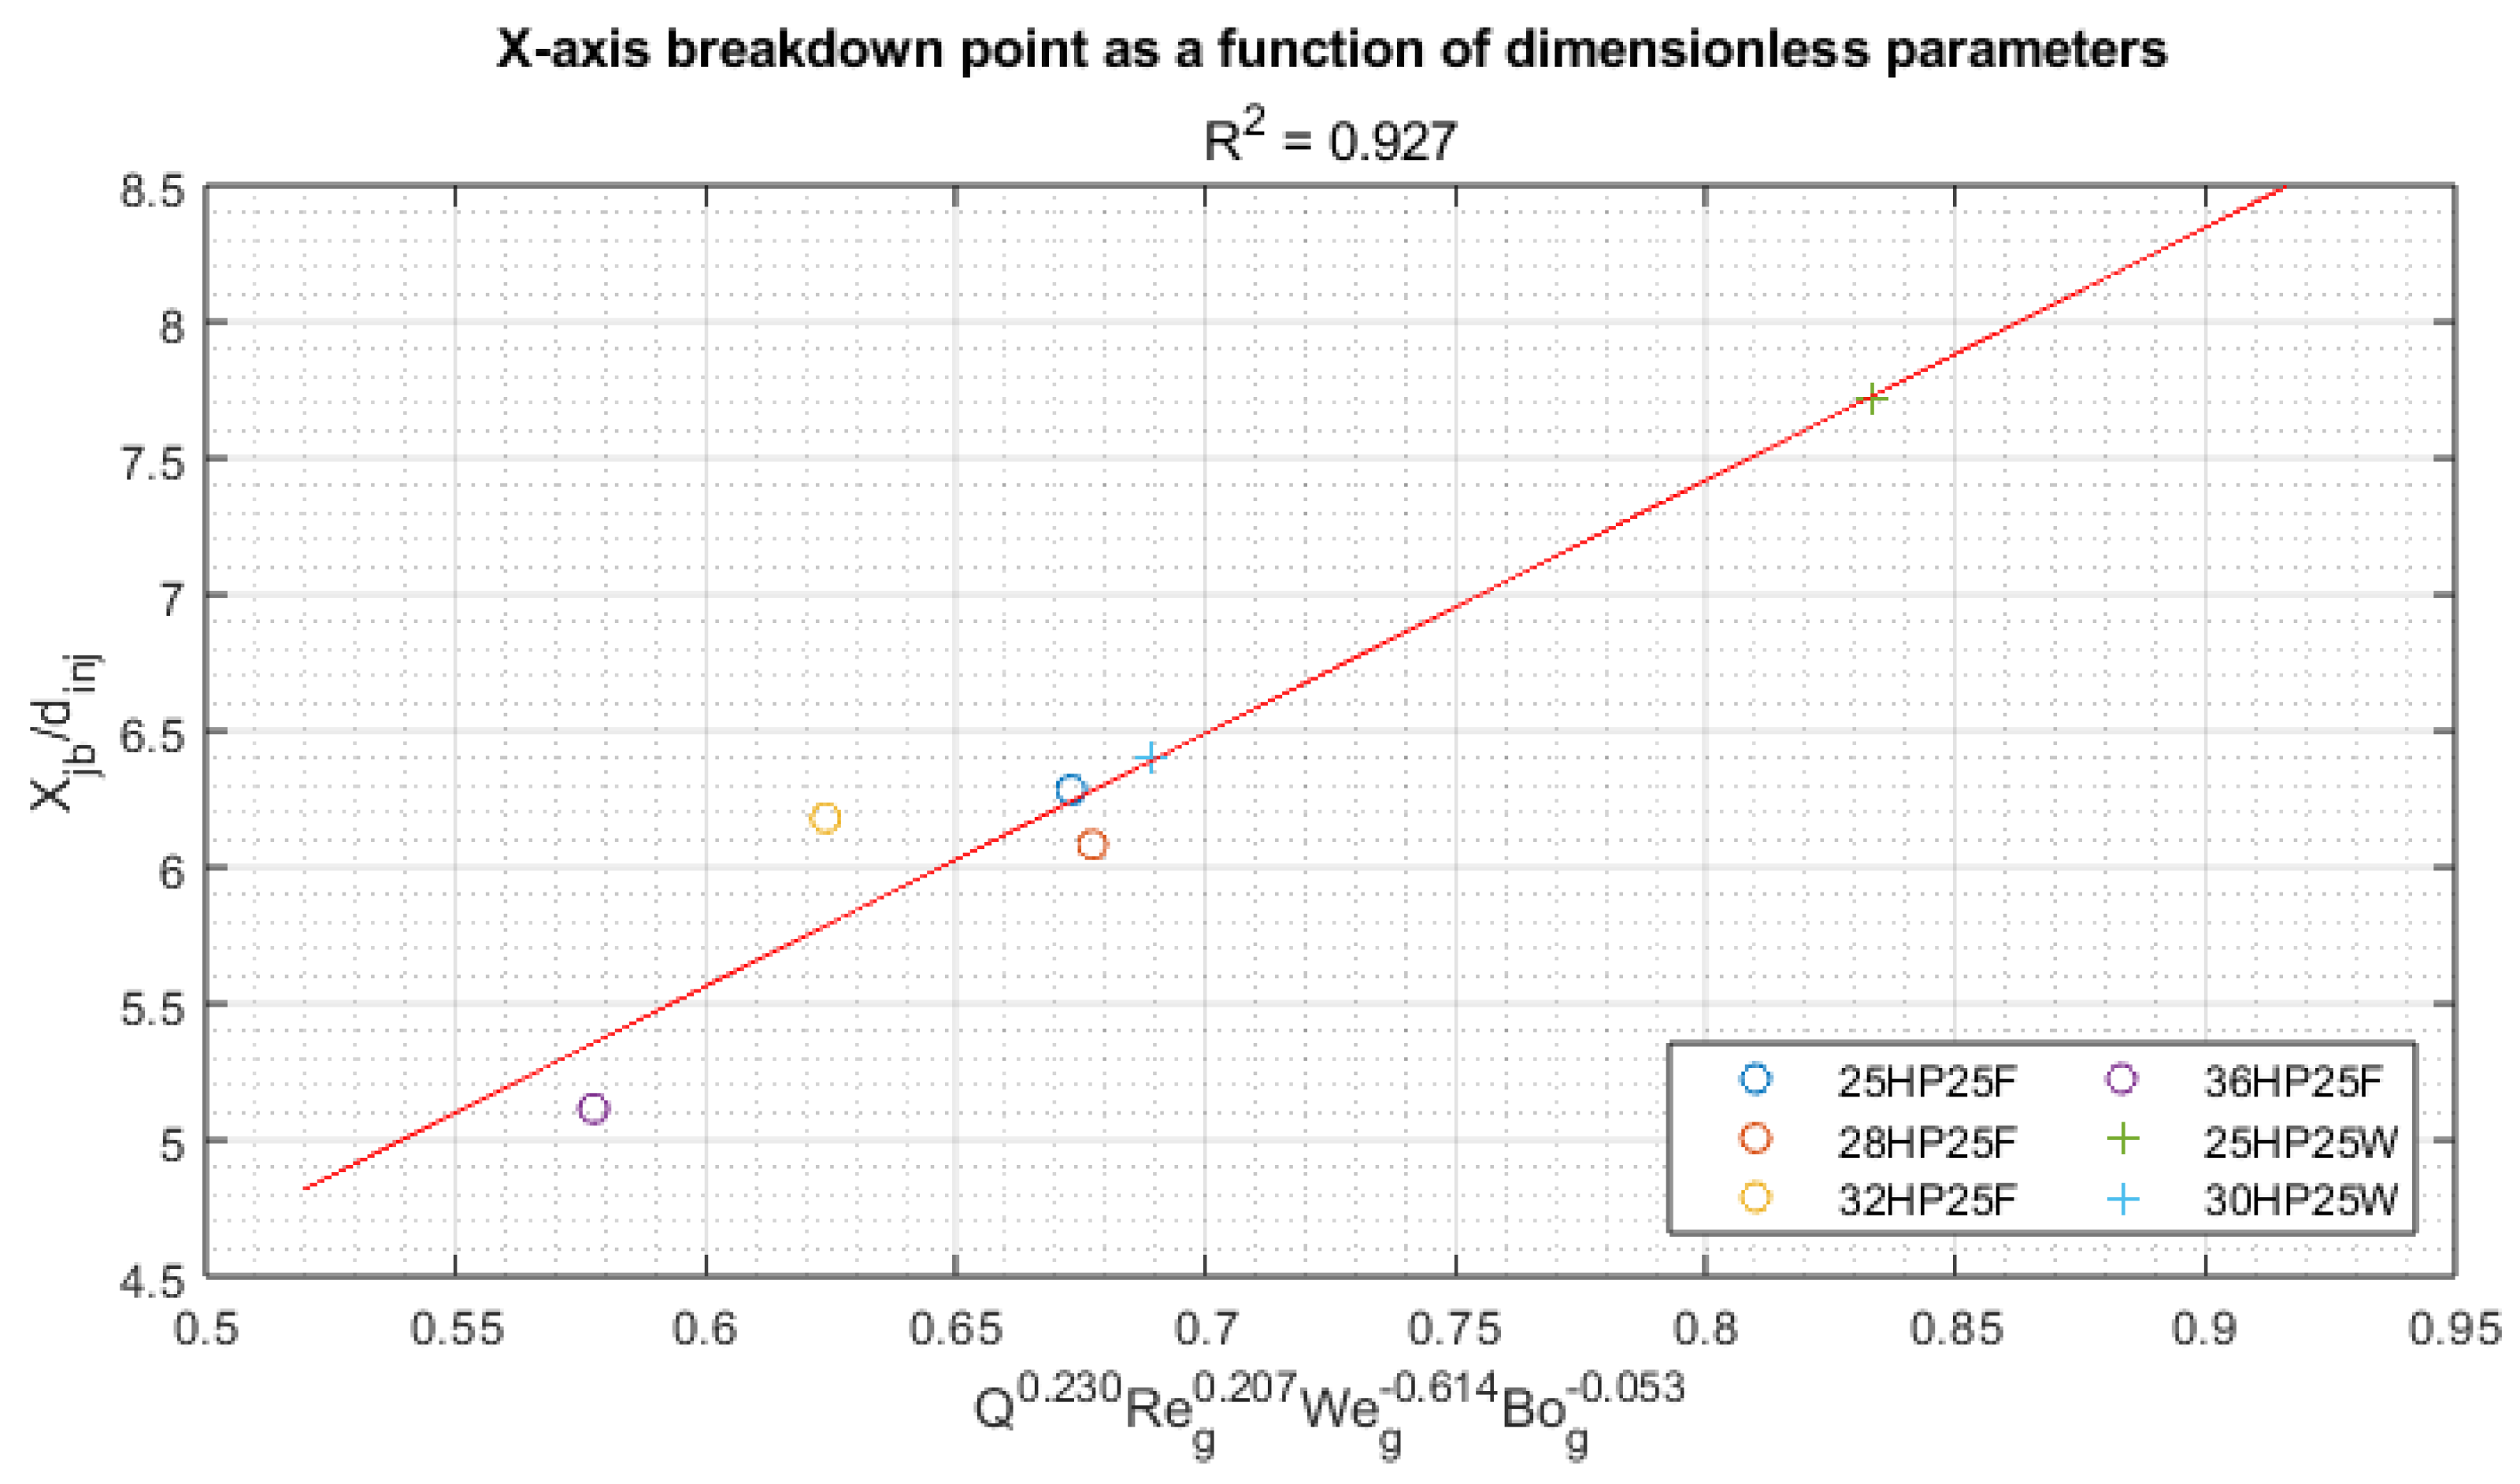
Figure 26.
Normalized trajectories from the experimental data and the power-law empirical correlation
Figure 26.
Normalized trajectories from the experimental data and the power-law empirical correlation
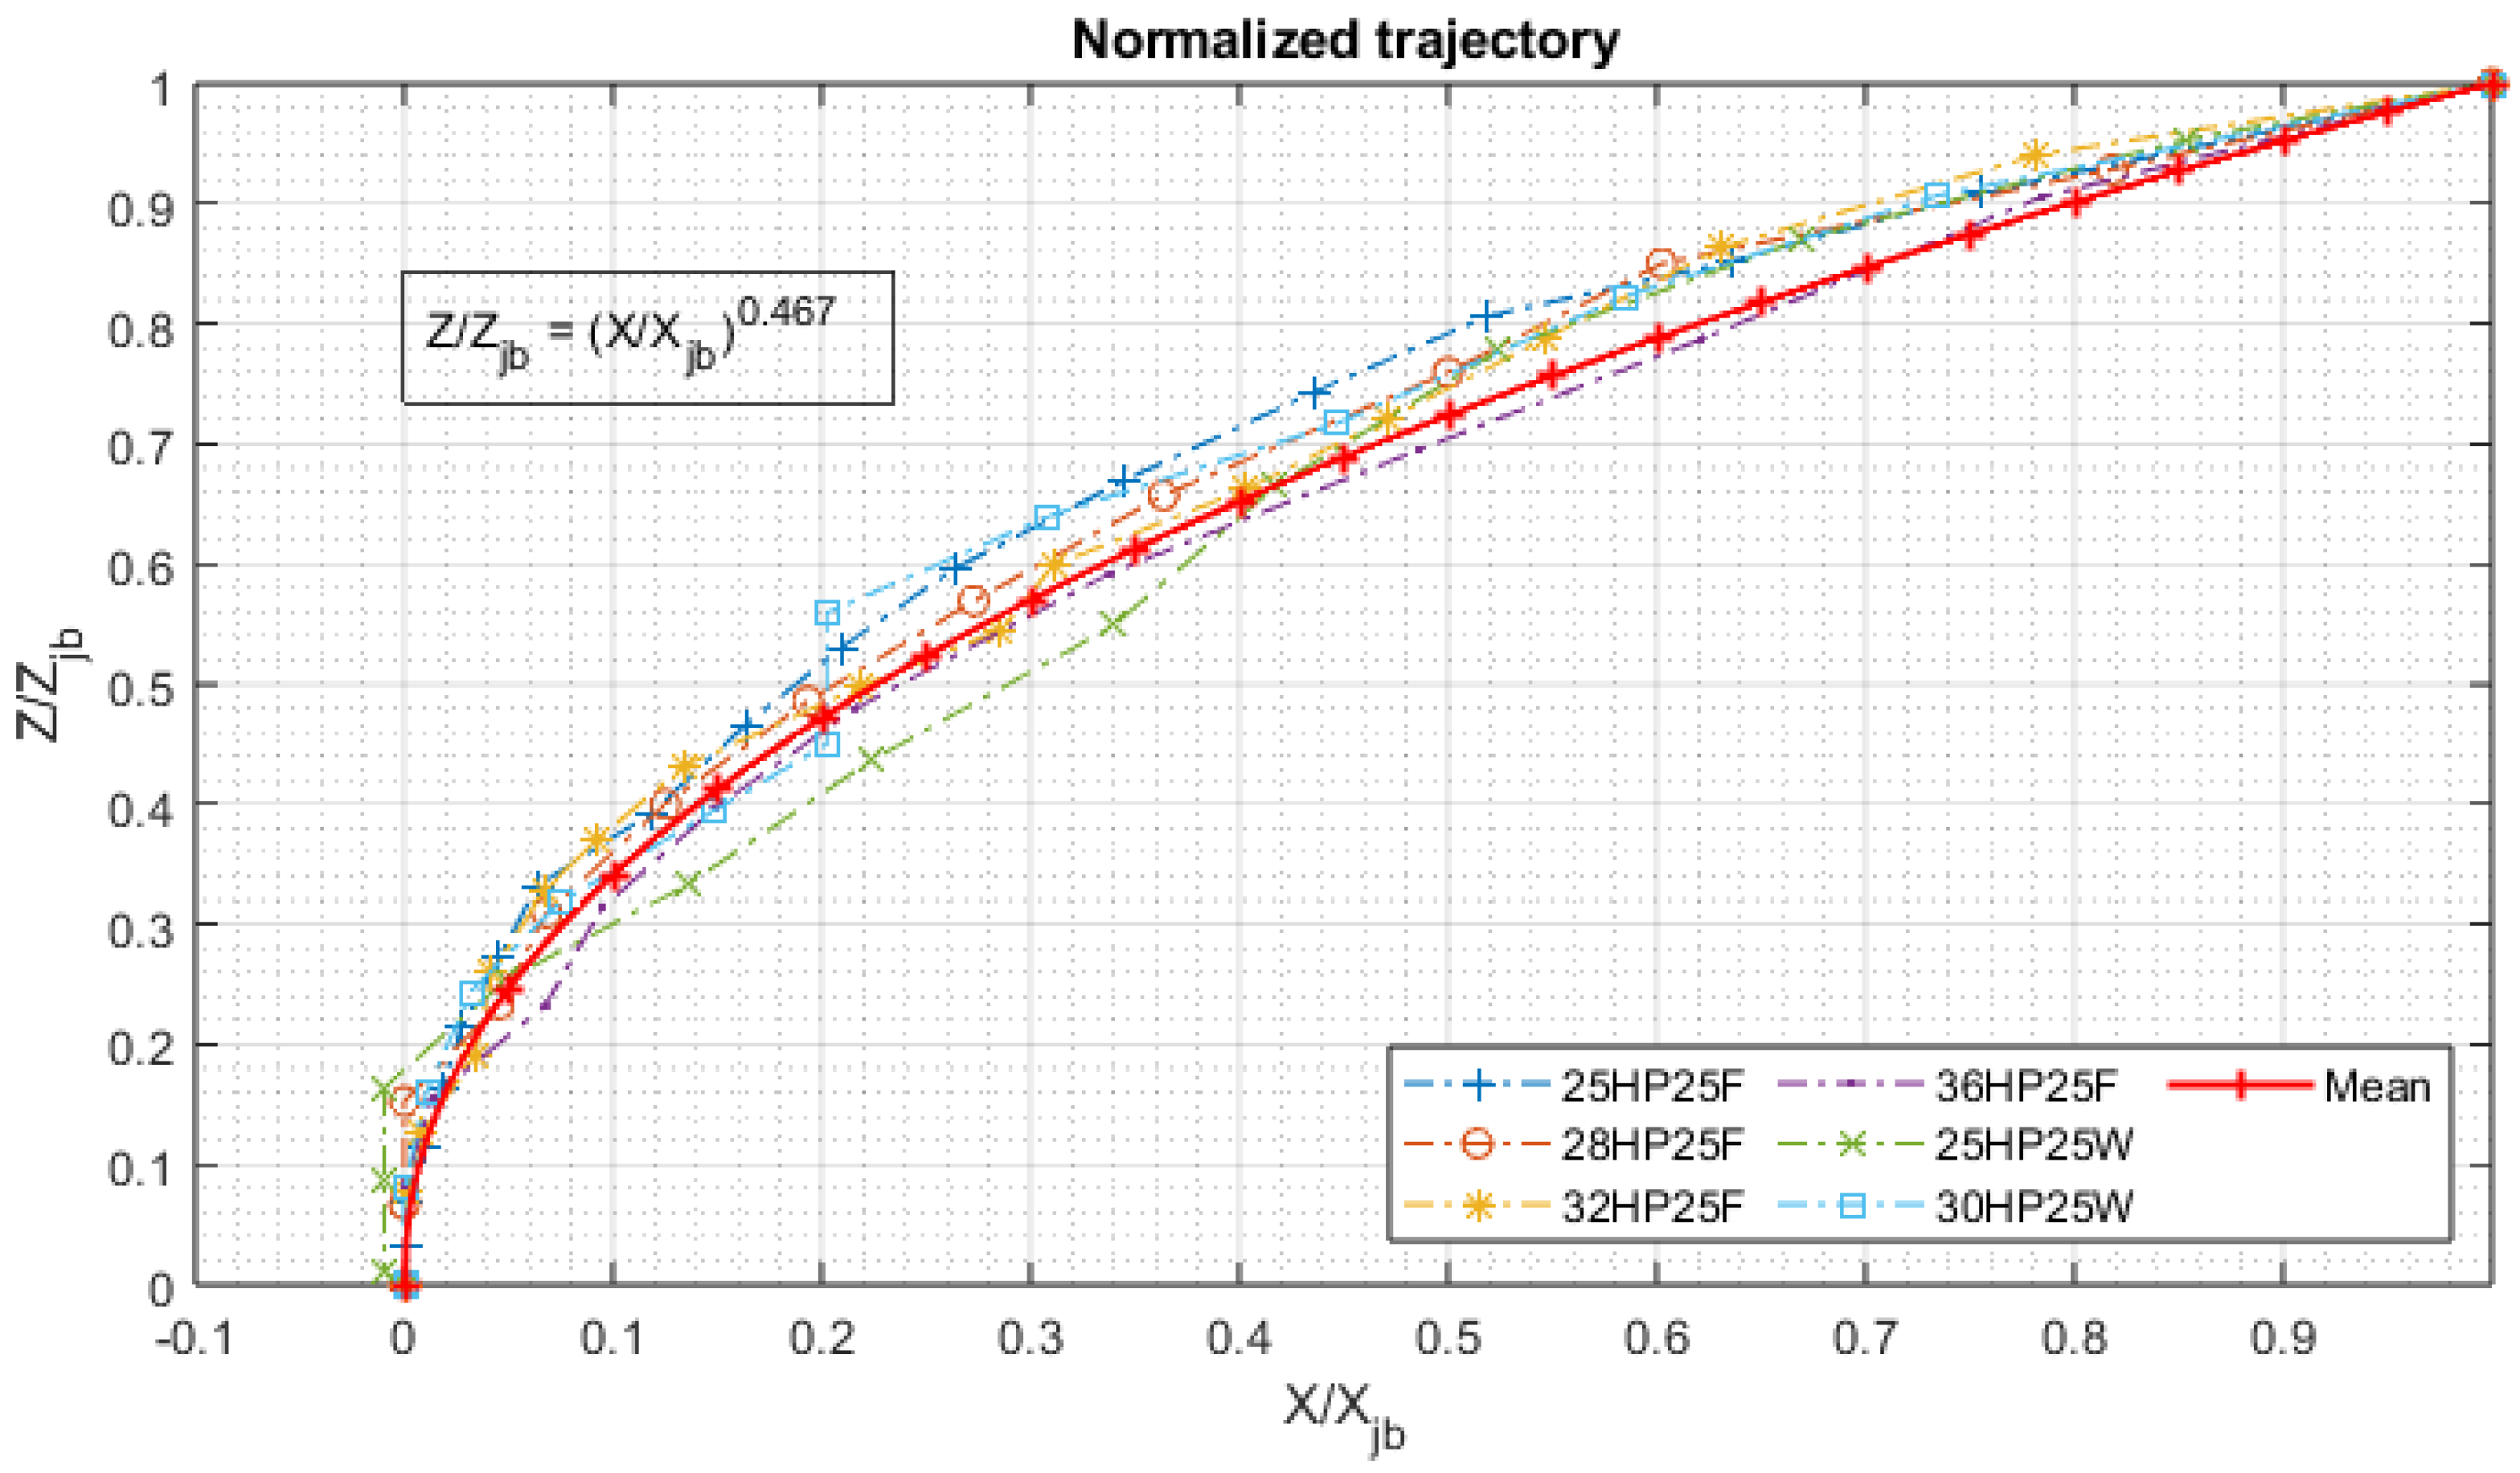
Figure 27.
Comparison between the predictions of the previous correlations and newly derived correlation
Figure 27.
Comparison between the predictions of the previous correlations and newly derived correlation
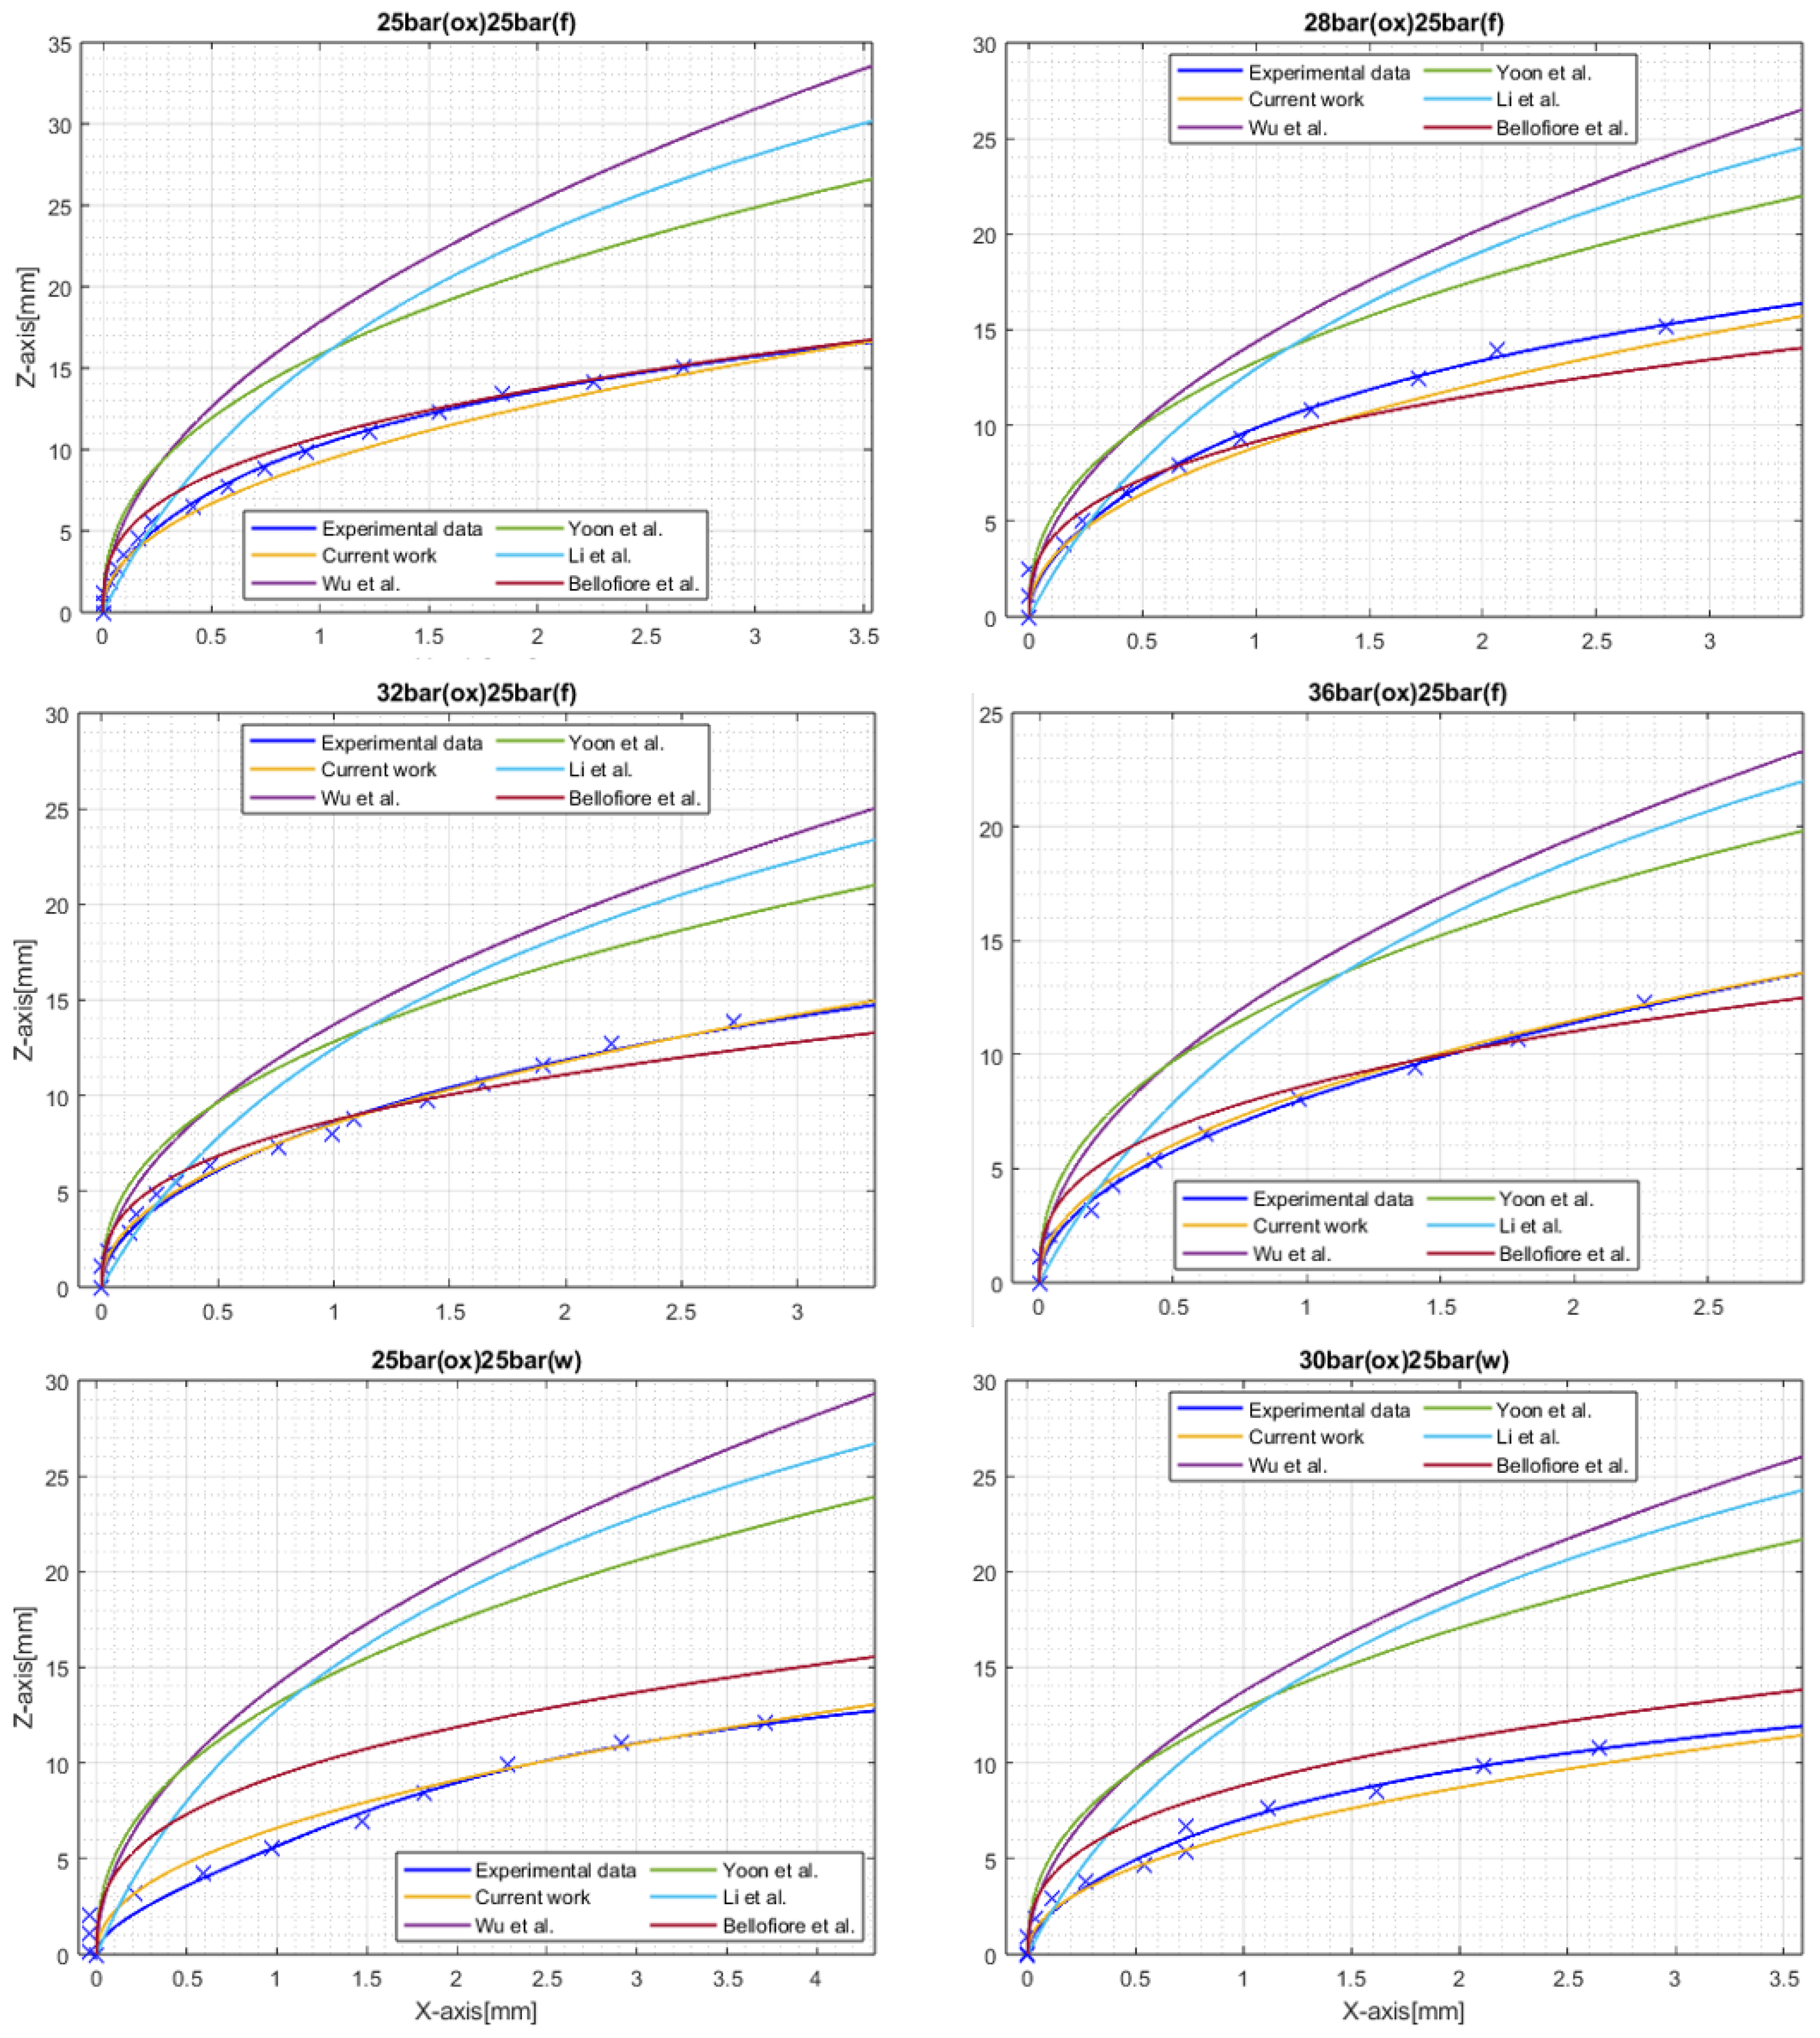

Table 1.
Design parameters of 100N H2O2/Kerosene bipropellant thruster
| Parameter | Value |
|---|---|
| Oxidizer | 90 wt.% H2O2 |
| Fuel | Jet A-1 |
| Oxidizer mass flow rate | 28.0 g/s |
| Fuel mass flow rate | 4.0 g/s |
| OF ratio | 7.0 |
| Chamber pressure | 20 bar |
| Maximum chamber temperature | 2,730 K |
| Maximum crossflow temperature | 1,032 K |
| Test section dimensions | 20 mm × 20 mm |
| Test section length | 95 mm |
| Fuel injector orifice diameter | 0.564 mm |
Table 2.
Hot-fire test conditions for fuel injection bi-mode operation
| [bar] | 25 | 28 | 32 | 36 |
|---|---|---|---|---|
| [bar] | 25 | 25 | 25 | 25 |
| Test label | 25(HP)25(F) | 28(HP)25(F) | 32(HP)25(F) | 36(HP)25(F) |
| [bar] | ||||
| ROF | ||||
| [g/s] | 32 | 35 | 40 | |
| [g/s] | ||||
Table 3.
Hot-fire test conditions for water injection bi-mode operation
| [bar] | 20 | 25 | 30 |
|---|---|---|---|
| [bar] | 25 | 25 | 25 |
| Test label | 20(HP)25(W) | 25(HP)25(W) | 30(HP)25(W) |
| [bar] | |||
| ROF | - | - | - |
| [g/s] | |||
| [g/s] | |||
Table 4.
Intensity of the pressure perturbation at the catalyst bed downstream and chamber in each test case
Table 4.
Intensity of the pressure perturbation at the catalyst bed downstream and chamber in each test case
| Case | MinMax() | MinMax() |
|---|---|---|
| 25(HP)25(F) | 0.9383 bar | 0.5641 bar |
| 28(HP)25(F) | 0.9393 bar | 0.5824 bar |
| 32(HP)25(F) | 1.0009 bar | 0.5809 bar |
| 36(HP)25(F) | 1.2122 bar | 0.7238 bar |
| 20(HP)25(W) | 0.3936 bar | 0.1432 bar |
| 25(HP)25(W) | 0.5964 bar | 0.3739 bar |
| 30(HP)25(W) | 0.6755 bar | 0.3136 bar |
Table 5.
Liquid jet in crossflow trajectory correlations of previous studies
| Reference | Correlation | Range |
|---|---|---|
| Wu et al. [11] |
|
|
| Yoon et al. [21] |
|
|
| Li et al. [15] |
|
|
| Bellofiore et al. [13] |
|
Table 6.
Assessment of past correlations by comparing the observed and predicted trajectories with RMSE values
Table 6.
Assessment of past correlations by comparing the observed and predicted trajectories with RMSE values
| Case | Wu et al. (STP) | Yoon et al. (HTSP) | Li et al. (HTHP) | Bellofiore et al (HTHP) |
|---|---|---|---|---|
| 25(HP)25(F) | 8.140 mm | 5.569 mm | 6.230 mm | 0.995 mm |
| 28(HP)25(F) | 4.927 mm | 3.428 mm | 3.760 mm | 1.228 mm |
| 32(HP)25(F) | 5.414 mm | 4.045 mm | 4.376 mm | 0.886 mm |
| 36(HP)24(F) | 5.570 mm | 4.356 mm | 4.553 mm | 0.888 mm |
| 25(HP)25(W) | 9.578 mm | 7.539 mm | 8.196 mm | 3.120 mm |
| 30(HP)25(W) | 7.118 mm | 5.705 mm | 6.038 mm | 1.774 mm |
Table 7.
Comparison between observed and predicted jet trajectory using RMSE values
| Case | Current work | Bellofiore et al. |
|---|---|---|
| 25(HP)25(F) | 0.664 mm | 0.995 mm |
| 28(HP)25(F) | 0.753 mm | 1.228 mm |
| 32(HP)25(F) | 0.142 mm | 0.886 mm |
| 36(HP)24(F) | 0.222 mm | 0.888 mm |
| 25(HP)25(W) | 0.728 mm | 3.120 mm |
| 30(HP)25(W) | 0.601 mm | 1.774 mm |
Disclaimer/Publisher’s Note: The statements, opinions and data contained in all publications are solely those of the individual author(s) and contributor(s) and not of MDPI and/or the editor(s). MDPI and/or the editor(s) disclaim responsibility for any injury to people or property resulting from any ideas, methods, instructions or products referred to in the content. |
© 2025 by the authors. Licensee MDPI, Basel, Switzerland. This article is an open access article distributed under the terms and conditions of the Creative Commons Attribution (CC BY) license (http://creativecommons.org/licenses/by/4.0/).
Copyright: This open access article is published under a Creative Commons CC BY 4.0 license, which permit the free download, distribution, and reuse, provided that the author and preprint are cited in any reuse.


