Preprint
Article

This version is not peer-reviewed.

RURUS SURYAWAN Score: A Novel Scoring System to Predict 30-Day Mortality for Acute Myocardial Infarction Undergoing Primary Percutaneous Coronary Intervention

A peer-reviewed article of this preprint also exists.

Submitted:

25 December 2024

Posted:

26 December 2024

You are already at the latest version

Abstract

Background/Objectives: It is essential to identify acute myocardial infarction patients with greater risk of deterioration following primary percutaneous coronary intervention. Given an inconsistent result about predictors of 30-day outcomes regarding scoring system for first episode of acute myocardial infarction, the objective of this study is to develop novel scoring system to predict 30-day mortality among patients with first episode of acute myocardial infarction underwent primary percutaneous coronary intervention. Methodology. Retrospective study was conducted with total sampling for all patients with first-time acute myocardial infarction underwent primary percutaneous coronary intervention, between 2021 to 2024 at Dr. Soetomo Hospital, Indonesia. We performed a total sampling, collected 1714 patients, in which 1535 patients were included.. Primary outcomes were 30-day mortality. Results. The analysis included 1535 patients: derivation set 926 and validation set 609. In our study, the 30-day mortality was 20.7%. Multivariate logistic regression analysis was used to build prediction models in derivation group, and then validated in validation cohort. Discrimination, calibration and clinical usefulness of the predicting model were assessed using the C-index, calibration plot and decision curve analysis. After pairwise comparison, the best performing model was chosen to build a nomogram according to the regression coefficients. The AUROC was 0.944 (0.906–0.972) in the derivation set and 0.959 (0.921–0.983) in the validation set. Conclusion. After adjusting for potential confounders, we developed RURUS SURYAWAN, a novel scoring system to identify predictor of 30-day mortality among acute myocardial infarction before primary percutaneous coronary intervention.

Keywords: 
;  ;  ;  

1. Introduction

The mortality rate of acute myocardial infarction has significantly decreased in decade, due to the invention of primary percutaneous coronary intervention by Geoffrey Hartzler in the early 1980s [1]. The prognosis of acute myocardial infarction after invention of primary percutaneous coronary intervention is better [2]. For every time earlier, reperfusion treatment results in an improvement of mortality rate and primary percutaneous coronary intervention is still a treatment of choice for acute myocardial infarction [3]. Almost all reports showed a consequent reduction in mortality in acute myocardial infarction patients compared with thrombolysis, which was insufficient to assess the extent of the improvement [4]. Unfortunately, according to several reports, residual 30-day mortality among patients with acute myocardial infarction underwent primary percutaneous coronary intervention still high, ranges from 5–10%, especially in developing country [5]. Data conducted by Pramudyo et al (2022) revealed that Indonesia ranked fourth in the world for the highest mortality rate of acute myocardial infarction patients compared to 186 other countries [6]. 30-day mortality rate of acute myocardial infarction in Indonesia was approximately 10.6% for patients with acute myocardial infarction [6]. Still, this number is higher when compared to the mortality rate in other Asian countries (5%), European (4-8%) and American (6-9%) [7,8,9].
The high mortality rate of acute myocardial infarction in Indonesia has attracted much attention of cardiologist, and influenced by many factors, such as demographic factors, history of cardiovascular risk factors, clinical presentation, and the results of investigations and management in the hospital [10]. The high mortality rate in patients with acute myocardial infarction has also raised particular concerns for cardiologist to develop a method to accurately identify patients at high-risk so that awareness can be increased to reduce the risk of death [11,12]. Currently, there are several prognostic tool in the field of acute myocardial infarction : Global Registry of Acute Coronary Events (GRACE), Thrombolysis in Myocardial Infarction (TIMI), Platelet Glycoprotein IIb/IIIa in Unstable Angina: Receptor Suppression Using Integrilin (PURSUIT), Oxford Acute Severity of Illness Score (OASIS), Logistic Organ Dysfunction System (LODS) and Simplified Acute Physiology Score (SAPS II) [13,14,15,16,17,18].
The GRACE score was established to assess 30-day mortality and identify high-risk groups among patients with acute myocardial infarction globally [13]. For global use, GRACE score demonstrated a superior predictive power for the one-year mortality due to acute myocardial infarction compared with other scoring systems, such as the TIMI and PURSUIT risk scores [14,15]. The TIMI and GRACE risk scores were calculated using data from a Western Caucasian cohort with limited participation from an Asian cohort. Asian patients have been understudied [13,16].
OASIS was proposed in 2013 by machine-learning algorithms. This scoring system has better predictive models for ICU mortality with an area under the receiver operating characteristic curve of 0.88 and calibrated well [17]. Unfortunately, this sophisticated scoring systems require the collection of numerous physiologic measurements, making their applications in clinical practice difficult [17]. In China, a study conducted by Wang et al (2021) introduced LODS scoring system as a valuable scoring system for the prediction of 30-day mortality among intensive care patients diagnosed with ST-Elevation Myocardial Infarction (STEMI) [18]. LODS is an organ dysfunction-based scoring system and permits the calculation of predicted mortality based on the organ dysfunction score on the day of ICU admission [18]. With a more concise composition of local population and greater clinical benefit, LODS may be a better predictor of 30-day mortality for intensive care patients with STEMI in China [19].
Indonesia still does not have a local registry nor a scoring system for predictor of 30-day mortality among patients with acute myocardial infarction or acute coronary syndrome [19,20]. Thus, the aim of this study is to develop a novel scoring system to predict 30-day mortality of patients with firstly diagnosed acute myocardial infarction after primary percutaneous coronary intervention at Dr. Soetomo General Academic Hospital, Surabaya.

2. Materials and Methods

2.1. Study Population and Design

This retrospective study was conducted at Dr. Soetomo General Academic Hospital, Surabaya, as a tertiary referral hospital in Indonesia, from 2021 to 2024. The data collected included the baseline demographics, clinical characteristics, comorbidities, laboratory, echocardiography, angiography parameters and compared it with 30-day mortality of first episode of acute myocardial infarction underwent primary percutaneous coronary intervention during hospital admission. This study has been approved by the Health Research Ethics Committee of the Dr. Soetomo General Academic Hospital, Surabaya. This study was conducted in accordance with the Declaration of Helsinki. The patients in the database are anonymous.

2.2. Inclusion and Exclusion Criteria

The population of this study consisted of hospitalized patients with first episode of acute myocardial infarction underwent primary percutaneous coronary intervention at Dr. Soetomo General Academic Hospital, Surabaya. The inclusion criteria were: (a) adults aged above 18 years (b) admitted to the hospital for the first time with emergency causes or complications from first episode of acute myocardial infarction, (c) underwent primary percutaneous coronary intervention with total or subtotal occlusion coronary artery from cardiac catheterization, (d) willing to participate in the study by signing the informed consent form, (e) underwent anamnesis and had 50 ml blood taken for laboratory examination, (f) able to be followed up at least 1 months after hospitalization. The exclusion criteria were: (a) admitted for elective procedures, (b) presence of others unrelated disease such as primary valvular heart disease, congenital heart disease, liver cirrhosis, malignancy, tuberculosis or HIV/AIDS, (c) history of a mechanical circulatory support such as intra-aortic balloon pump or extracorporeal membrane oxygenation, e) special or vulnerable patients such as prisoners or homeless individuals, f) history of cardiac arrest before primary percutaneous coronary intervention.

2.3. Statistical Analysis

Statistical analyses were performed using IBM SPSS Statistics for Windows Operating System, version 26.0 software (IBM Corp., Armonk, N.Y., USA), STATA software, version 15.0 (Stata Corporation, College Station, Texas, USA) and R statistics 4.0.3 with the “glmnet” package (R Foundation for Statistical Computing, Vienna, Austria). Baseline characteristic such as gender, age, categories were described as a proportion if the data were categorical and described as mean or median. Clinical characteristics, comorbidities, laboratory, echocardiography, angiography parameters affecting 30-day mortality in acute myocardial infection after primary percutaneous coronary intervention were tested using the Multivariate Cox Regression test. A p-value below 0.05 was declared statistically significant. The scoring system was assessed to develop the score for each predictor variables contributing in 30-day mortality. To avoid the occurrence of intercorrelation among two or more independent variables, multicollinearity was assessed by examining tolerance and the Variance Inflation Factor (VIF). Primary outcome was 30-day mortality. The score was calculated using the beta coefficient and standard error. The predictive values of our novel risk score was assessed by receiver operating characteristics curve (ROC) analysis (using MedCalc Version 12.2.1; MedCalc Software, Mariakerke, Belgium), applying net reclassification and integrated discrimination improvement. Prognostic utility of the risk models for 30-day mortality has been assessed by deriving their C-statistics, using ROC curves. The final scores were classified based on the risk of acute myocardial infarction patients with high, moderate, and low mortality rates.
In the derivation set, we performed multivariable logistic regression model to determine predictors for 30-day mortality. We use the Least Absolute Shrinkage and Selection Operator (LASSO) logistic regression algorithm in order to obtain a subset of predictor variables from the 20 candidate variables. The LASSO algorithm can select from the set of candidate variables that achieve greater importance once regularized. The LASSO algorithm finds the variables that contribute the least in the logistic regression model and forces them to have coefficients equal to zero. To check the stability in the selection of variables and in the calculation of the coefficients of the logistic regression, an analysis with random partitions of the derivation and validation sets was carried out. One hundred sets of derivation have been created randomly with the same number of records as those used in the temporal validation (n = 926). The LASSO variable selection methodology has been applied to each of these sets, and the corresponding logistic regression coefficients have been calculated. These results were compared with those obtained in the temporal validation.

3. Results

This retrospective study is evaluating the 30-day mortality from 1535 patients assigned to Dr. Soetomo General Academic Hospital with first episode of acute myocardial infarction underwent primary percutaneous coronary intervention during hospital admission. The Hosmer-Lemeshow statistic was 3.56df8,(p = 0.795). The C statistic for the model in the test cohort was 0.85.

3.1. Baseline Characteristics

A total of 1714 patients assigned to Dr. Soetomo General Academic Hospital with first episode of acute myocardial infarction underwent primary percutaneous coronary intervention during hospital admission were screened. Patients without an ICU record or those with missing or incomplete echocardiography or laboratory data were excluded, and 1535 adult patients were included in this study. According to the grouping method of a previous study, all patients were randomly divided into a derivation (n=926, 60.33%) and a validation (n=609, 39.67%) group (Table 1).

3.2. Model Development

For the derivation group, Table 2 show the variables selected using regression analysis that was associated with 30-day mortality from univariate analysis. Statistically significant variables screened from the univariate analysis were included in the non-conditional binary multivariate logistic regression. A multivariate logistic regression identified resting heart rate, anion gap, lactate, calcium, BUN and diastolic blood pressure levels at the admission, and also the presence of CKD as the most significant mortality risk predictors. Heart rate at discharge was related to 1-year mortality after adjustment for these variables (hazard ratio 1.13; 95% confidence interval [CI], 1.03-1.24 per 10 beats per minute, P = 0.02). Among the variables screened using LASSO regression, in addition to the seven variables above, anemia and MCV were also identified as statistically significant variables using multivariate likelihood ratio (LR). For continuous variables entered into the multivariate LR model mentioned previously, potential non-linearity in the prediction of 30-day mortality was explored using a smoothing plot.

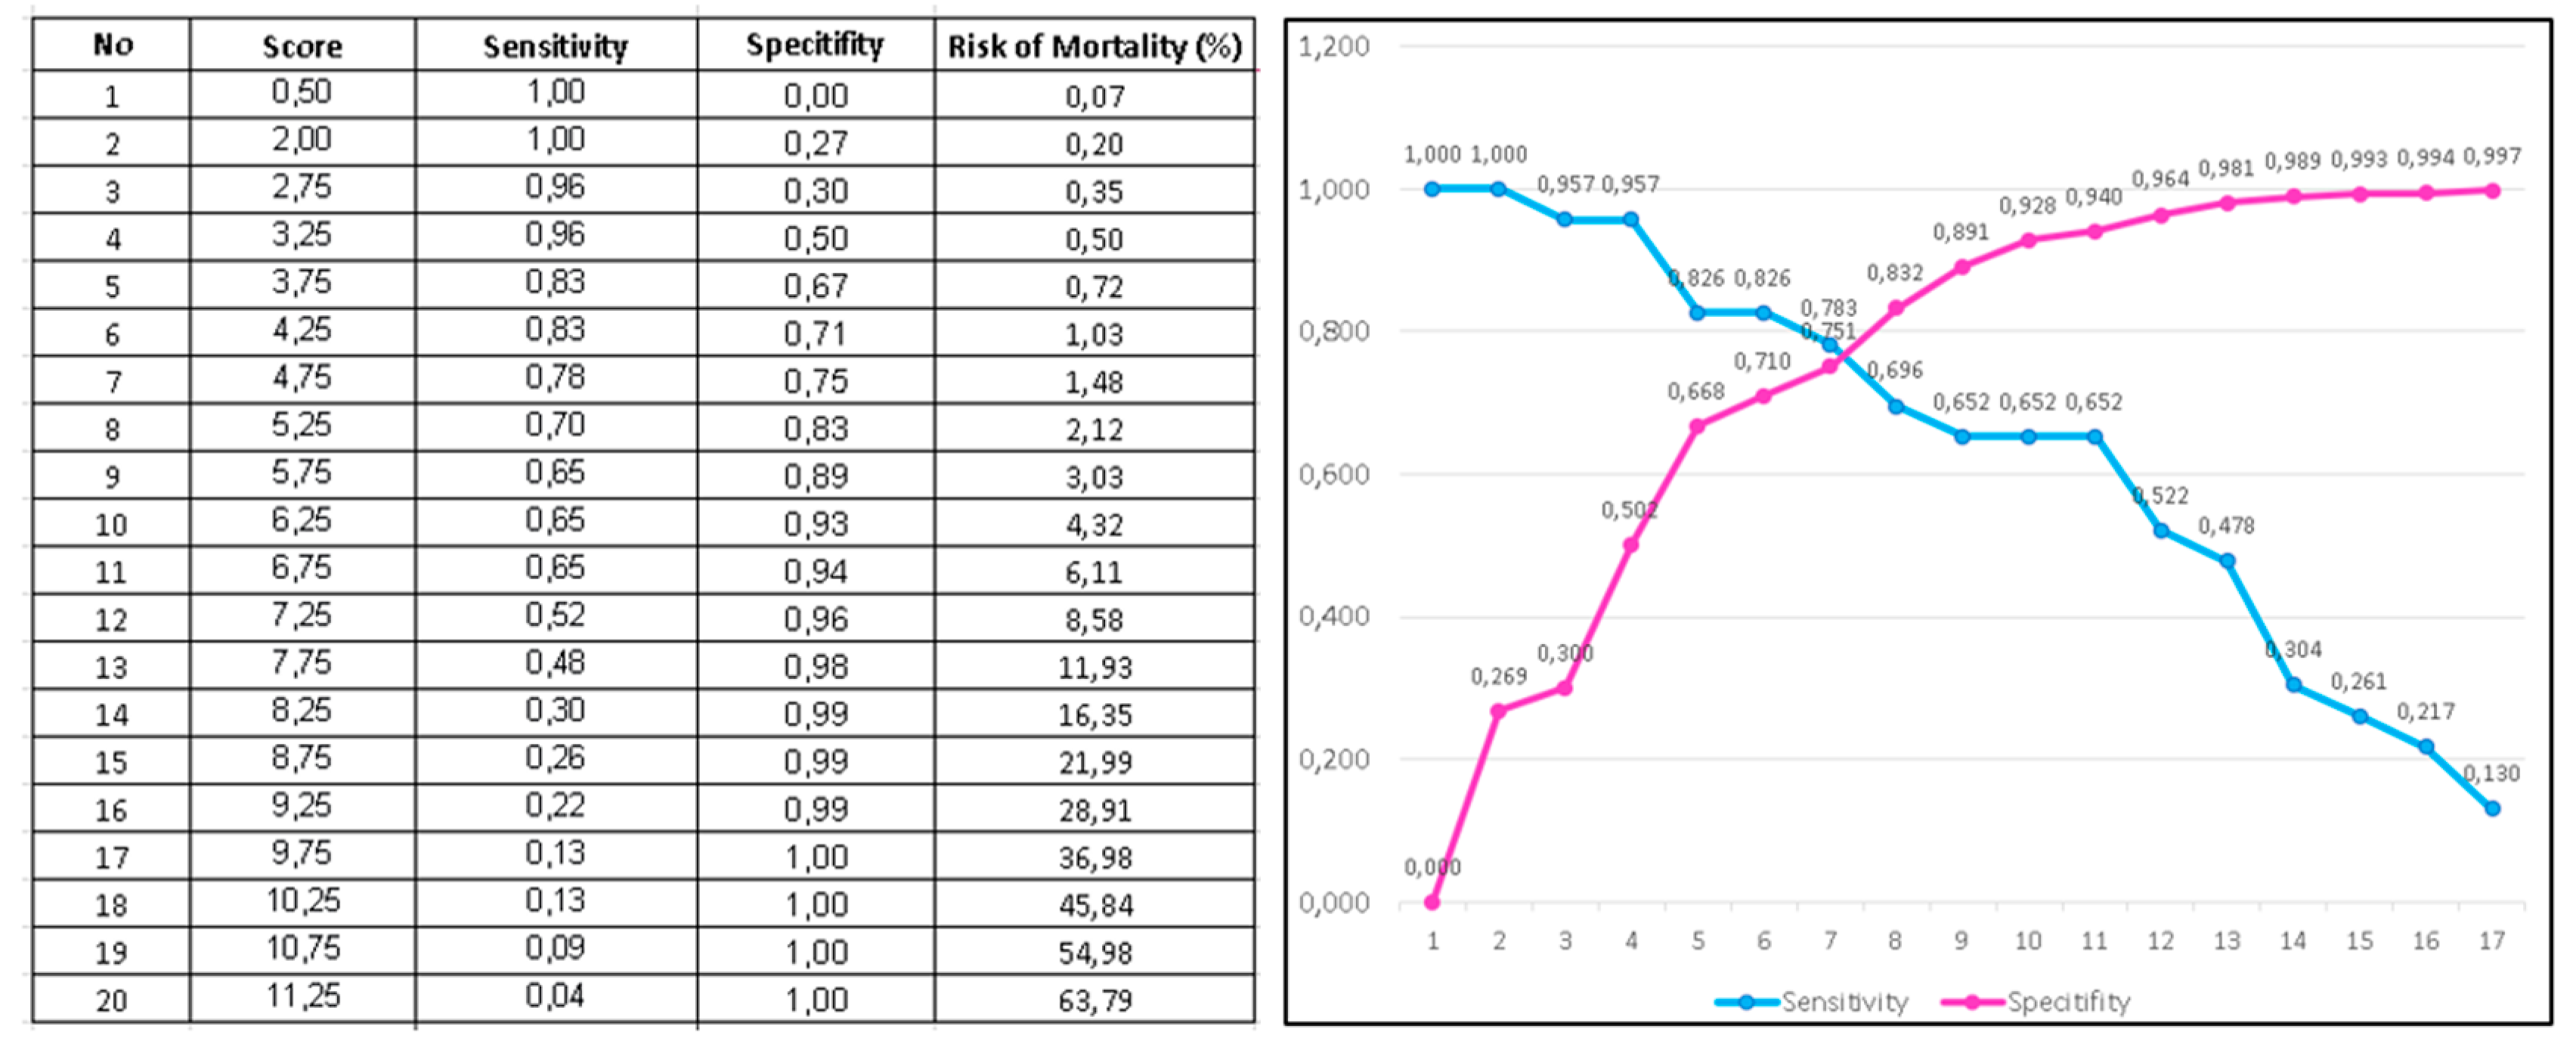
3.3. RURUS SURYAWAN as Novel Risk Score for 30-Days Mortality Among Acute Myocardial Infarction Patients Undergoing Primary Percutaneous Coronary Intervention

After obtaining results from univariate and multivariate logistic regression analysis, we developed a novel score “RURUS SURYAWAN” to predict 30-day mortality among first diagnosed acute myocardial infarction patients undergoing primary percutaneous coronary intervention.
Table 3. RURUS SURYAWAN score assignment.
Variables Multivariate analysis Point assigned
OR 95% CI P value
Resting heart rate (>110 bpm) 1.51 1.20 - 1.90 0.024 1
Underweight (BMI < 18kg/m2) 1.37 1.15 - 1.99 0.033 1
Respiratory rate (>28 / minutes) 1.18 1.03 - 1.34 0.039 1
Urine-output, first 24 hours admission (<0.5 ml / kg BW / hour) 2.56 1.79 - 4.44 <0.001 1
Saturation O2 peripheral (<90%) 1.35 1.21 - 1.49 0.026 1
Systolic blood pressure during admission (<90 mmHg) 2.31 1.67 - 4.02 <0.001 1
Urea nitrogen (> 50 mg/dL) 1.93 1.81 - 2.04 <0.001 1
Reduced ejection fraction. (baseline LVEF < 40%) 1.21 1.08 - 1.37 0.042 1
time delaYed of primary percutaneous coronary intervention (door-to-balloon time >2 hours) 1.89 1.56 - 2.37 0.002 1
Age (>70 years old) 1.55 1.23 - 2.08 0.021 1
Women 1.17 1.02 - 1.33 0.041 1
Anemia (Hb < 10 g/dL) 1.79 1.45 - 2.55 0.003 1
NT-proBNP (> 1500 pg/mL) 2.17 1.58 - 3.74 <0.001 1
Total score 13
The estimated multivariate logistic regression model with the 30-days mortality risk score demonstrated excellent calibration-in-the-large, with an intercept of 0.016. The difference in log-odds ratio between predictions and observed outcomes in the validation group was statistically significantly (P = 0.009). When the logistic regression model was recalibrated to the derivation group and applied to subjects in the validation group, it demonstrated good calibration-in-large and the calibration slope was significantly different from (P<0.001). The concordance between the observed probability of 30-days mortality and the predicted probability of 30-days mortality across the 13 vigintiles of variables in the validation sample is described in Figure 1. The Hosmer-Lemeshow X2 statistic of the full model was 3.56 (P = 0.795)
When assigning a point score, each variables in the Table 3 gave 1 point assigned. Therefore, a total of 13 point could be assigned. The score ranged from 0 to 13 and mortality rates increased with higher score (Ptrend < .0001). After grouping patients into low-risk (0–3 points), intermediate-risk (4–6 points), high-risk (7–9 points), and very high-risk (10–13 points) in the classification groups (Table 3), most deaths occurred in the high-risk and very high-risk group. Mortality rates were <1%, 2-5%, 8-30% and >50% in low-risk, intermediate-risk, high-risk, and very high-risk groups, respectively (Ptrend < 0.001). This trend persisted when using multiple imputation or a conservative analytical approach as seen in the Figure 1.
Table 3. RURUS SURYAWAN score stratification.
RURUS SURYAWAN score Stratification Risk of 30-day mortality
0-3 points Low risk <1%
4-6 points Intermediate risk 2-5%
7-9 points High risk 8-30%
10-13 points Very high risk >50%
The area under the ROC curve of the RURUS SURYAWAN score to predict 30-day mortality was was 0.944 (0.906–0.972) in the derivation set and 0.959 (0.921–0.983) in the validation set, with 94.6% sensitivity and 97.3% specificity (P < 0.001). The area under the ROC curve of the HAS-BLED score to predict 30-day mortality was 0.717 (0.680-0.752), with 85.1% sensitivity and 51.5% specificity (P < 0.001). The area under the ROC curve of TIMI score to predict 30-day mortality was 0.844 (0.813-0.871), with 91.0% sensitivity and 61.6% specificity (P < 0.001).

4. Discussion

We developed and validated RURUS SURYAWAN score, an improvisation from the previous risk model to predict 30-day mortality for firstly diagnosed acute myocardial infarction patients after primary percutaneous coronary intervention. RURUS SURYAWAN scoring system contains 15 variables with a score range from 0-20. The final parsimonious scoring systems doesn’t require any collection of sophisticated parameter, making their applications in clinical practice easier and quicker than others scoring system. This model includes resting heart rate (>110 bpm), underweight (BMI < 18kg/m2), respiratory rate (>28 / minutes), first 24 hours urine-output (<0.5 ml / kg BW / hour), peripheral O2 saturation (<90%), systolic blood pressure during admission (<90 mmHg), urea nitrogen (> 50 mg/dL), reduced ejection fraction (< 40%), timing of primary percutaneous coronary intervention (door-to-balloon time >2 hours), age (>70 years old), sex (women), anemia (Hb < 10 g/dL), and elevated NT-proBNP (> 1500 pg/ml) as factors for risk adjustment. The model performed well in an independent validation cohort, as well as in various subgroups stratified by cardiac arrest and other clinical factors. A simplified integer score based on this model also performed well and can potentially serve as a foundation for prospective risk stratification at the point of care.
The RURUS SURYAWAN score is stratified into low-risk, intermediate-risk, and high-risk categories based on 13 variables as mentioned in the Table 3. The scores vary from “0 to 13-point scores.” As seen in the Table 4, a score of 0–3 indicates a patient is at “low risk” and advises consideration of routine or usual care after primary PCI and further investigations can be planned during outpatient department visits. Our study saw an 30-day mortality less than 1% for low-risk patients. Patients with a score of 4–6 are classified as “intermediate risk,” and they are usually considered safe but sometimes require monitoring with 2-5% risk of 30-day mortality. Patients with a score of 7-9 are classified as “high risk,” and they require strict clinical observation, including longer duration of intensive care. About 8-30% of high-risk patients had 30-day mortality in our study. Patients with a score of 10-13 are deemed “very high risk” with more than 50% risk of 30-day mortality and require early aggressive care with very close hemodynamic monitoring during 30-day stay.
In the literature, mostly comparable results were found when comparing RURUS SURYAWAN score with HEART score, TIMI score, ACUITY score, CRUSADE score, and GRACE score. In previous study, the AUC of the HEART score was 0.83 (95% CI: 0.81–0.85), the AUC of the TIMI score was 0.75 (95% CI: 0.72–0.77), the AUC of the ACUITY score was 0.72 (95% CI: 0.69–0.75), the AUC of the CRUSADE score was 0.64 (95% CI: 0.61–0.68), the AUC of the GRACE score was 0.78 (95% CI: 0.75–0.81); which are slightly lower than our AUC of RURUS SURYAWAN score was 0.944 (0.906–0.972) in the derivation set and 0.959 (0.921–0.983) in the validation set [22,23]. The TIMI risk score estimates mortality based on: age ≥65, ≥3 coronary artery disease (CAD) risk factors, known CAD (stenosis ≥50%), aspirin use in the past 7 days, severe angina (≥2 episodes in 24 hours), ST-segment deviation ≥0.5 mm, and positive cardiac markers. The GRACE risk score was calculated by the eight different baseline variables incorporated in the risk calculator: age, heart rate (beats per minute), systolic blood pressure, serum creatinine level, cardiac arrest at admission, ST-segment deviation on ECG, elevated cTn, and congestive heart failure (Killip class).
In our retrospective study, several predictors were associated with higher 30-day mortality. Relevant risk factors included vital signs. Vital signs are easy and inexpensive to measure, and when it is measured under controlled conditions, the results are highly reproducible. There are no technical or financial barriers to its incorporation during 30-day admission. Deterioration in vital sign due to acute myocardial infarction are known to indicate worsened prognosis. Thus, close and intense monitoring, early recognition of deterioration, and appropriate treatment to intervene vital signs during hospital admission may be beneficial to improve the prognosis of AMI patients. Cardiac arrest has been shown to be a strong important predictor of AMI mortality from several reports [24], nevertheless we decided not to include cardiac arrest since we faced a difficulty to adjust risk for these events, given their heterogeneity in clinical severity, and inclusion of these patients in hospital scorecards for percutaneous coronary intervention can result in unintended consequences to withhold aggressive treatment.
One of the most important predictor for mortality is resting heart rate. This study is in-line with study from Jabre, et al (2014) which revealed that elevated resting heart rate at the time of the acute myocardial infarction identifies patients at increased risk of all-cause and cardiovascular mortality [25]. Even though heart rate measured upon admission is dependent on the sympathetic activity due to the chest pain, stress, or anxiety, however Jabre, et al (2014) found that resting heart rate upon admission was still a strong prognostic marker of all-cause and cardiovascular mortality for resting heart rate > 110 bpm and cardiovascular mortality only for resting heart rate > 80 bpm during admission [25]. Indeed, resting heart rate might theoretically contribute to increased mortality by increasing myocardial oxygen consumption, thus worsening ischemia, increasing infarct size and stimulating the atherosclerotic progression and plaque instability [26].
Regarding blood urea nitrogen, according to Zhu et al (2022), blood urea nitrogen was robustly associated with increased short-term mortality in patients with acute myocardial infarction developing cardiogenic shock [27]. Horiuchi et al (2018) also found that blood urea nitrogen is a strong predictor for 30-day mortality among acute myocardial infarction patients [28].
Inclusion of ejection fraction obtained from transthoracic echocardiography may add significant prognostic information. Previous report from Bosch and Théroux (2005) revealed that adding baseline LVEF into the model improved the prediction of mortality (C statistic 0.73 vs 0.67) [29].
Individual patient data from four trials (CAPRICORN, EPHESUS, OPTIMAAL, and VALIANT), showed that LVEF is a ubiquitous risk marker associated with death regardless of type of AMI. Thus, recent clinical practice guidelines recommended initial measurement of LVEF for patients with STEMI and NSTEMI, because LVEF has both prognostic and therapeutic significance for acute myocardial infarction patients [30]. Unfortunately, significant variability in LVEF measurement rates across clinician remains.
Additionally, our study results showed that delayed of primary percutaneous coronary intervention poses a greater risk of 30-day mortality among patients with firstly diagnosed acute myocardial infarction patients. Data from Thailand PCI registry in 2006 showed the median door-to-device time for AMI patients was 122 minutes, and the overall mortality rate was 17.0% [31]. Existing studies have also revealed that the impact of short door-to-device time, particularly those smaller than 60 minutes, on patient mortality remains debatable [32]. Tsukui, et al (2020) observed that a longer duration of primary PCI >2 hours was significantly linked with 30-day mortality from all causes despite correcting for cardiogenic shock, arrhythmias, or kidney injury [33]. However, shortening door-to-device time <1 hour was not related with mortality from any cause in the multivariate Cox regression analysis [33]. Consistent with our study, AMI patients treated with primary PCI, door-to-device time longer than 120 minutes (2 hours) was related with 30-day mortality, but door-to-device time less than 60 minutes (1 hour) was not associated with survival benefit (OR 1.89, 95% CI: 1.56–2.37, P=0.002).
Age is one of the most important predictor of survival after acute myocardial infarction. Older patients have a greater risk of 30-days mortality due to recurrent myocardial infarction, heart failure, cardiogenic shock, atrioventricular block, and atrial fibrillation or flutter. In the angiographic substudy of GUSTO-III trial, older patients had greater risk for TIMI grade 0 flow and lower rates of TIMI grade 3 flow, more multivessel disease, and lower left ventricular ejection fractions [34]. Older patients had their own risk for all-cause mortality, due to their anatomic complexity, physiological vulnerability, age-related risks (including prevalent geriatric syndromes), multimorbidity, frailty, disability, cognitive decline, polypharmacy, heterogeneity in life expectancy and goals of care [35].
Women also tend to have significantly higher in-hospital mortality for acute myocardial infarction than men, according to our study. Since women are generally older at hospitalization and have higher comorbidity rate than men. Previous report has suggested that women have longer delays from symptom onset to hospitalization and, as a result, tend to have higher 30-day mortality rates for acute myocardial infarction than men [36]. Other study also showed women hospitalized for acute myocardial infarction died more frequently than men (9.3% vs. 6.1%, P < 0.01) [37].
Anemia is also recognized as strong, independent risk factors for mortality after acute myocardial infarction. The prevalence of anemia of 28% among acute myocardial infarction patients underwent primary percutaneous coronary intervention. Our study suggested a significant increase risk for 30-day mortality in acute myocardial infarction patients with anemia (Hb < 10 g/dL) once various confounding conditions were adjusted for. Previous study revealed that overall mortality in each group containing patients with anemia was higher than in the corresponding non-anemic groups [38]. From The Myocardial Ischemia National Audit Project (MINAP) registry, anemia is independently associated with 30-day (OR 1.28, 95% CI 1.22-1.35) and 1-year mortality (OR 1.31, 95% CI 1.27-1.35), with a reverse J-shaped relationship between hemoglobin levels and mortality outcomes [39]. In the setting of acute myocardial infarction, anemia might worsen ischemia by decreasing the oxygen delivery to the jeopardized myocardium and increase myocardial oxygen demand due to greater cardiac output to maintain adequate systemic oxygen delivery [40]. Also, patients with anemia are often underprescribed antiplatelet therapy due to bleeding concerns [41].
Lastly, NT-proBNP also has an incremental prognostic value for 30-day mortality over and beyond the TIMI risk score and the GRACE risk calculator. Data concerning optimal timing to measure NT-proBNP during acute myocardial infarction are limited. One of the aforementioned studies, which confirmed additional value of NT-proBNP, was based on measurements at 24–96 hours [42]. Other study revealed that NT-proBNP values upon admission were significantly higher in patients who died, compared to those who survived [43]. Thus, it is consistent with our findings that NT-proBNP had a good and comparable predictive value for 30-day mortality.

4.1. Strength

As far as we know, RURUS SURYAWAN score has the strongest AUC with better sensitivity and specificity to discriminate 30-day mortality in the in disease-specific cohorts among Asian patient with first episode of acute myocardial infarction underwent primary percutaneous coronary intervention during hospital admission. Our study used a combination of derivation and validation feature selection methods. Cross-validation and hyperparameter tuning improved model performance and reduced over-fitting risk. A pair-wise corrected resampled t-test was employed to compare model predictions. To ensure the current study’s reliability, all models were validated using untouched validation data that was not used for model construction. We expect our score to be further externally validated in different databases allowing additional comparison with other scores.

4.2. Limitation

There are certain limitations to our current study. Firstly, RURUS SURYAWAN score that we developed were for predicting 30-day mortality. The scores have not been validated for predicting mortality within different time frames. Secondly, it requires the collection of variables during admission, making their applications in clinical practice difficult. We attempted to mitigate this effect by using easily obtained variables in the emergency ward. On the other hand, we recognized that several missing variables could result in a skewed outcome. Another potential limitations of this study should be acknowledged. Since this research is based on a single-centre retrospective study, this study inevitably has a particular selection bias. It is difficult to control selection bias inside our database. Therefore, 30-day outcomes at our centre may not be generalizable to other centre. We expect that subsequent investigations conducted in the multicentre study will corroborate our findings.

5. Conclusions

Our results indicate that standard clinical characteristics routinely obtained during the initial medical evaluation of patients with firstly diagnosed acute myocardial infarction can be used to construct RURUS SURYAWAN score, a simple classification system to predict risk of 30-day mortality. This risk model for 30-day mortality could evaluate interventions to improve the outcomes of patients with acute myocardial infarction. Although it has achieved adequate internal validation, it must be externally validated.

Author Contributions

Conceptualization, I.G.R.S. and R.A.N.; methodology, I.G.R.S.; software, D.N.; validation, Y.H.O., B.B.D., A.P.H., and M.Y.A.; formal analysis, P.B.T.S.; investigation, I.G.R.S. and M.E.R.S.E.; resources, M.E.R.S.E.; data curation, M.E.R.S.E.; writing—original draft preparation, R.A.N.; writing—review and editing, Y.H.O., B.B.D., A.P.H., and M.Y.A; visualization, R.A.N.; supervision, Y.H.O., B.B.D., A.P.H., and M.Y.A.; project administration, I.G.R.S.; funding acquisition, I.G.R.S. All authors have read and agreed to the published version of the manuscript.

Funding

Research grant was obtained from the Universitas Airlangga Health Research and Development Grant (Project number: 055/PAN.KKE/VI/2023), as part of the Sustainable Development Goals. The funders had no role in study design, data collection and analysis, decision to publish, or preparation of the manuscript. The opinions, results and conclusions reported in this paper are those of the authors and are independent from the funding sources. No endorsement by Faculty of Medicine Universitas Airlangga or Dr. Soetomo General Academic Hospital are intended or should be inferred.

Institutional Review Board Statement

The study was conducted in accordance with the Declaration of Helsinki and approved by the Institutional Review Board of Dr. Soetomo General Academic Hospital, Surabaya (0135/KEPK/I/2021) on January 29th, 2021 under the name of I Gde Rurus Suryawan as Principal Investigator.

Informed Consent Statement

Informed consent was obtained from all subjects involved in the study. Written informed consent has been obtained from the patient(s) to publish this paper.

Data Availability Statement

The data belongs to the Division of Interventional Cardiology, Department of Cardiology and Vascular Medicine, Faculty of Medicine Universitas Airlangga – Dr. Soetomo General Academic Hospital that require institutional agreements for data release to third parties hence ethical approval is needed for analysis. Data are however available from the Division of Interventional Cardiology, Department of Cardiology and Vascular Medicine, Faculty of Medicine Universitas Airlangga – Dr. Soetomo General Academic Hospital upon reasonable request, by email them at kardiologiunair@gmail.com

Acknowledgments

The authors thank all patients, cardiology residents, nurses, secretaries, and local laboratories for their kind assistance, especially their extensive help during the data collection. Furthermore, we would would like to thank Prof. Dr. Budi Santoso and Prof. Dr. Cita Rosita Sigit Prakoeswa as Dean of Airlangga School of Medicine and Director of Dr. Soetomo General Academic Hospital for allowing this research to be held in Universitas Airlangga – Dr. Soetomo General Academic Hospital and for their permission to publish this manuscript. We also thank Mrs Fita Triastuti for her secretarial support and Dr Andrianto for performing editorial translation. We also acknowledge the Indonesian Heart Association for their technical support.

Conflicts of Interest

The authors declare no conflicts of interest.

Abbreviations

The following abbreviations are used in this manuscript:
ACS Acute Coronary Syndrome
AMI Acute Myocardial Infarction
AUC area under the curve
AUROC area under the receiver operating characteristic
CAPRICORN CArvedilol Post-infaRct survIval COntRolled evaluatioN
EPHESUS Eplerenone in patients with heart failure due to systolic dysfunction complicating acute myocardial infarction
GRACE Global Registry of Acute Coronary Events
GUSTO Global Utilization of Streptokinase and Tissue Plasminogen Activator for Occluded Coronary Arteries
ICU Intensive Care Unit
LASSO Least Absolute Shrinkage and Selection Operator
MINAP Myocardial Ischemia National Audit Project
NSTEMI Non ST-Elevation Myocardial Infarction
NT-proBNP N-terminal prohormone of brain natriuretic peptide
OASIS Oxford Acute Severity of Illness Score
OPTIMAAL Optimal Therapy in Myocardial Infarction with the Angiotensin II Antagonist Losartan
PCI Percutaneous Coronary Intervention
PPCI Primary Percutaneous Coronary Intervention
PURSUIT Platelet Glycoprotein IIb/IIIa in Unstable Angina: Receptor Suppression Using Integrilin
ROC receiver operating characteristic
STEMI ST-Elevation Myocardial Infarction
TIMI Thrombolysis in Myocardial Infarction
VALIANT VALsartan In Acute Myocardial iNfarcTion
VIF Variance Inflation Factor

References

  1. Bamford P, Henry TD, O’Neill WW, Grines CL. The Revolution of STEMI Care: A Story of Resilience, Persistence, and Success. Journal of the Society for Cardiovascular Angiography & Interventions 2024 Nov 3; 11: 102395.
  2. Dadjoo Y, Mahmoodi Y. The prognosis of primary percutaneous coronary intervention after one year clinical follow up. Int Cardiovasc Res J. 2013 Mar;7(1):21-4.
  3. Widimsky P, Wijns W, Fajadet J, de Belder M, Knot J, Aaberge L, et al. Reperfusion therapy for ST elevation acute myocardial infarction in Europe: Description of the current situation in 30 countries. Eur Heart J. 2010;31:943–57. [CrossRef]
  4. Yan F, Zhang Y, Pan Y, Li S, Yang M, Wang Y, Yanru C, Su W, Ma Y, Han L. Prevalence and associated factors of mortality after percutaneous coronary intervention for adult patients with ST-elevation myocardial infarction: A systematic review and meta-analysis. J Res Med Sci. 2023 Mar 16;28:17. [CrossRef]
  5. Kawamura Y, Yoshimachi F, Murotani N, Karasawa Y, Nagamatsu H, Kasai S, Ikari Y. Comparison of Mortality Prediction by the GRACE Score, Multiple Biomarkers, and Their Combination in All-comer Patients with Acute Myocardial Infarction Undergoing Primary Percutaneous Coronary Intervention. Intern Med. 2023 Feb 15;62(4):503-510. [CrossRef]
  6. Pramudyo M, Yahya AF, Martanto E, Tiksnadi BB, Karwiky G, Rafidhinar R, Putri GNI. Predictors of 30-day Mortality in Patients with Acute Coronary Syndrome in Hasan Sadikin Hospital, Bandung, Indonesia: A Retrospective Cohort Study. Acta Medica Indonesiana. 2022 Dec 54;3.
  7. Ioacara S, Popescu AC, Tenenbaum J, Dimulescu DR, Popescu MR, Sirbu A, Fica S. Acute Myocardial Infarction Mortality Rates and Trends in Romania between 1994 and 2017. Int J Environ Res Public Health. 2019 Dec 31;17(1):285. [CrossRef]
  8. Salari N, Morddarvanjoghi F, Abdolmaleki A, Rasoulpoor S, Khaleghi AA, Hezarkhani LA, Shohaimi S, Mohammadi M. The global prevalence of myocardial infarction: a systematic review and meta-analysis. BMC Cardiovasc Disord. 2023 Apr 22;23(1):206. [CrossRef]
  9. Yoon SSS, et al. Trends in the prevalence of coronary heart disease in the US: National Health and Nutrition Examination Survey, 2001–2012. Am J Prev Med. 2016;51(4):437–445. [CrossRef]
  10. Danny S, Roebiono P, Soesanto A, & Kasim M. Factors Influencing Major Cardiovascular Event Post Acute Myocardial Infarction in Woman. Indonesian Journal of Cardiology, 30(1), 3-12. [CrossRef]
  11. Sachdeva P, Kaur K, Fatima S, Mahak F, Noman M, Siddenthi SM, Surksha MA, Munir M, Fatima F, Sultana SS, Varrassi G, Khatri M, Kumar S, Elder M, Mohamad T. Advancements in Myocardial Infarction Management: Exploring Novel Approaches and Strategies. Cureus. 2023 Sep 19;15(9):e45578. [CrossRef]
  12. Rohani, C., Jafarpoor, H., Mortazavi, Y., Esbakian, B., Gholinia, H. Mortality in patients with myocardial infarction and potential risk factors: A five-year data analysis. ARYA Atherosclerosis Journal, 2022; 18(3): 1-8. [CrossRef]
  13. Gong IY, Goodman SG, Brieger D, Gale CP, Chew DP, Welsh RC, Huynh T, DeYoung JP, Baer C, Gyenes GT, Udell JA, Fox KAA, Yan AT; Canadian GRACE/GRACE-2 and CANRACE Investigators. GRACE risk score: Sex-based validity of 30-day mortality prediction in Canadian patients with acute coronary syndrome. Int J Cardiol. 2017 Oct 1;244:24-29.
  14. McClure MW, Berkowitz SD, Sparapani R, Tuttle R, Kleiman NS, Berdan LG, Lincoff AM, Deckers J, Diaz R, Karsch KR, Gretler D, Kitt M, Simoons M, Topol EJ, Califf RM, Harrington RA. Clinical significance of thrombocytopenia during a non-ST-elevation acute coronary syndrome. The platelet glycoprotein IIb/IIIa in unstable angina: receptor suppression using integrilin therapy (PURSUIT) trial experience. Circulation. 1999 Jun 8;99(22):2892-900. [CrossRef]
  15. Amin ST, Morrow DA, Braunwald E, Sloan S, Contant C, Murphy S, Antman EM. Dynamic TIMI risk score for STEMI. J Am Heart Assoc. 2013 Jan 29;2(1):e003269. [CrossRef]
  16. Johnson AE, Kramer AA, Clifford GD. A new severity of illness scale using a subset of acute physiology and chronic health evaluation data elements shows comparable predictive accuracy. Crit. Care Med. 2013;41:1711–1718. [CrossRef]
  17. Johnson AE, Kramer AA, Clifford GD. A new severity of illness scale using a subset of acute physiology and chronic health evaluation data elements shows comparable predictive accuracy. Crit. Care Med. 2013;41:1711–1718. [CrossRef]
  18. Wang L, Zhang Z, Hu T. Effectiveness of LODS, OASIS, and SAPS II to predict 30-day mortality for intensive care patients with ST elevation myocardial infarction. Sci Rep. 2021 Dec 13;11(1):23887. [CrossRef]
  19. Le Gall JR, Lemeshow S, Saulnier F. A new simplified acute physiology score (SAPS II) based on a European/North American multicenter study. JAMA. 1993;270:2957–2963. [CrossRef]
  20. Kolovou GD, Katsiki N, Mavrogeni S. Risk Scores After Acute Coronary Syndrome. Angiology. 2017 Mar;68(3):185-188. [CrossRef]
  21. Correia LC, Garcia G, Kalil F, Ferreira F, Carvalhal M, Oliveira R, Silva A, Vasconcelos I, Henri C, Noya-Rabelo M. Prognostic value of TIMI score versus GRACE score in ST-segment elevation myocardial infarction. Arq Bras Cardiol. 2014 Aug;103(2):98-106. [CrossRef]
  22. Choi SY, Kim MH, Serebruany V. Comparison of ACUITY, CRUSADE, and GRACE Risk Scales for Predicting Clinical Outcomes in Patients Treated with Dual-Antiplatelet Therapy. TH Open. 2018 Nov 27;2(4):e399-e406. [CrossRef]
  23. Amador P, Santos J F, Gonçalves S, Seixo F, Soares L. Comparison of ischemic and bleeding risk scores in non-ST elevation acute coronary syndromes. Acute Card Care. 2011;13(02):68–75. [CrossRef]
  24. McNamara RL, Kennedy KF, Cohen DJ, Diercks DB, Moscucci M, Ramee S, Wang TY, Connolly T, Spertus JA. Predicting 30-day Mortality in Patients With Acute Myocardial Infarction. J Am Coll Cardiol. 2016 Aug 9;68(6):626-635. [CrossRef]
  25. Jabre P, Roger VL, Weston SA, Adnet F, Jiang R, Vivien B, Empana JP, Jouven X. Resting heart rate in first year survivors of myocardial infarction and long-term mortality: a community study. Mayo Clin Proc. 2014 Dec;89(12):1655-63. [CrossRef]
  26. Heidland UE, Strauer BE. Left ventricular muscle mass and elevated heart rate are associated with coronary plaque disruption. Circulation. 2001;104(13):1477–1482. [CrossRef]
  27. Zhu Y, Sasmita BR, Hu X, Xue Y, Gan H, Xiang Z, et al. Blood Urea Nitrogen for Short-Term Prognosis in Patients with Cardiogenic Shock Complicating Acute Myocardial Infarction. Int J Clin Pract. 2022;2022:9396088. [CrossRef]
  28. Horiuchi Y, Aoki J, Tanabe K, Nakao K, Ozaki Y, Kimura K, et al. A High Level of Blood Urea Nitrogen Is a Significant Predictor for 30-day Mortality in Patients with Acute Myocardial Infarction. Int Heart J. 2018;59:263-71. [CrossRef]
  29. Bosch X, Théroux P. Left ventricular ejection fraction to predict early mortality in patients with non-ST-segment elevation acute coronary syndromes. Am Heart J. 2005 Aug;150(2):215-20. [CrossRef]
  30. Miller AL, Dib C, Li L, Chen AY, Amsterdam E, Funk M, Saucedo JF, Wang TY. Left ventricular ejection fraction assessment among patients with acute myocardial infarction and its association with hospital quality of care and evidence-based therapy use. Circ Cardiovasc Qual Outcomes. 2012 Sep 1;5(5):662-71. [CrossRef]
  31. Srimahachota S, Kanjanavanit R, Boonyaratavej S, et al. Demographic, management practices and 30-day outcomes of Thai Acute Coronary Syndrome Registry (TACSR): the difference from the Western world. J Med Assoc Thai 2007;90 Suppl 1:1-11.
  32. Champasri K, Srimahachota S, Chandavimol M, Udayachalerm W, Thakkinstian A, Sookananchai B, Phatharajaree W, Kiatchoosakun S, Sansanayudh N. Door-to-device time and mortality in patients with ST-elevation myocardial infarction treated with primary percutaneous coronary intervention: insight from real world data of Thai PCI Registry. Cardiovasc Diagn Ther. 2023 Oct 31;13(5):843-854. [CrossRef]
  33. Tsukui T, Sakakura K, Taniguchi Y, et al. Association between the Door-to-balloon Time and Mid-term Clinical Outcomes in Patients with ST-Segment Elevation Myocardial Infarction. Intern Med 2020;59:1597-603. [CrossRef]
  34. Al-Khatib SM, Stebbins AL, Califf RM, Lee KL, Granger CB, White HD, Armstrong PW, Topol EJ, Ohman EM; GUSTO-III trial. Sustained ventricular arrhythmias and mortality among patients with acute myocardial infarction: results from the GUSTO-III trial. Am Heart J. 2003 Mar;145(3):515-21. [CrossRef]
  35. Damluji AA, Forman DE, Wang TY, Chikwe J, Kunadian V, Rich MW, Young BA, Page RL 2nd, DeVon HA, Alexander KP; American Heart Association Cardiovascular Disease in Older Populations Committee of the Council on Clinical Cardiology and Council on Cardiovascular and Stroke Nursing; Council on Cardiovascular Radiology and Intervention; and Council on Lifestyle and Cardiometabolic Health. Management of Acute Coronary Syndrome in the Older Adult Population: A Scientific Statement From the American Heart Association. Circulation. 2023 Jan 17;147(3):e32-e62. [CrossRef]
  36. Stehli J, Martin C, Brennan A, Dinh DT, Lefkovits J, Zaman S.. Sex differences persist in time to presentation, revascularization, and mortality in myocardial infarction treated with percutaneous coronary intervention. J Am Heart Assoc. 2019;8(10). [CrossRef]
  37. Dennis JA, Zhang Y, Zhang F, Kopel J, Abohelwa M, Nugent K. Comparison of 30-day mortality and readmission frequency in women versus men with acute myocardial infarction. Proc (Bayl Univ Med Cent). 2021;34(6):668-672. Published 2021 Jul 21. [CrossRef]
  38. Shu DH, Ransom TP, O'Connell CM, et al. Anemia is an independent risk for mortality after acute myocardial infarction in patients with and without diabetes. Cardiovasc Diabetol. 2006;5:8. Published 2006 Apr 7. [CrossRef]
  39. Mamas MA, Kwok CS, Kontopantelis E, Fryer AA, Buchan I, Bachmann MO, Zaman MJ, Myint PK. Relationship Between Anemia and Mortality Outcomes in a National Acute Coronary Syndrome Cohort: Insights From the UK Myocardial Ischemia National Audit Project Registry. J Am Heart Assoc. 2016 Nov 19;5(11):e003348. [CrossRef]
  40. Eikelboom JW, Mehta SR, Anand SS, Xie C, Fox KA, Yusuf S. Adverse impact of bleeding on prognosis in patients with acute coronary syndromes. Circulation. 2006;114:774–782. [CrossRef]
  41. Nikolsky E, Aymong ED, Halkin A, Grines CL, Cox DA, Garcia E, Merhan R, Tcheng JE, Griffin JJ, Guagliumi G, Stuckey T, Turco M, Cohen DA, Negoita M, Lansky AJ, Stone GW. Impact of anemia in patients with acute myocardial infarction undergoing primary percutaneous coronary intervention: analysis from the Controlled Abciximab and Device Investigation to Lower Late Angioplasty Complications (CADILLAC) Trial. J Am Coll Cardiol. 2004;44:547–553. [CrossRef]
  42. Garcia-Alvarez A, Regueiro A, Hernández J, Kasa G, Sitges M, Bosch X, Heras M. Additional value of B-type natriuretic peptide on discrimination of patients at risk for mortality after a non-ST-segment elevation acute coronary syndrome. Eur Heart J Acute Cardiovasc Care. 2014;3(2):132–140. [CrossRef]
  43. Schellings DA, Adiyaman A, Dambrink JE, et al. Predictive value of NT-proBNP for 30-day mortality in patients with non-ST-elevation acute coronary syndromes: a comparison with the GRACE and TIMI risk scores. Vasc Health Risk Manag. 2016;12:471-476. Published 2016 Nov 21. [CrossRef]
Figure 1. Observed and predicted of 30-day mortality based on RURUS SURYAWAN score (maximum 13 points).
Preprints 144152 g001
Table 1. Baseline Characteristics of Study Participants.
Variable Total
(n=1535)
Derivation group
(n=926)
Validation group
(n=609)
P value for
derivation vs
validation
Alive
(n=1217)
Died
(n=318)
P value for
alive vs dead
Sex 0.856 0.041
 Male (n, %) 1211 (78.9%) 730 (78.8%) 481 (78.9%) 972 (79.9 %) 239 (75.2%)
 Female (n, %) 324 (21.1%) 196 (21.2%) 128 (21.1%) 245 (20.1%) 79 (24.8%)
Age, mean + SD, years 69.86 + 9.47 69.85 + 9.49 69.87 + 9.23 0.798 68.21 + 9.45 71.42 + 10.27 0.021
BMI, mean + SD, kg/m2 23.12 + 6.93 23.05 + 8.23 23.29 + 7.25 0.767 24.27 + 8.03 21.43 + 7.56 0.033
Resting heart rate during admission, mean + SD, bpm 91.44 + 11.03 91.43 + 11.97 91.45 + 12.05 0.863 88.75 + 10.99 96.82 + 17.49 0.024
Systolic blood pressure during admission, mean + SD, mmHg 123.37 + 14.69 123.71 + 13.18 123.33 + 13.95 0.512 127.51 + 13.32 112.56 + 21.44 <0.001
Diastolic blood pressure during admission, mean + SD, mmHg 64.27 + 9.68 64.64 + 9.50 64.30 + 9.12 0.918 64.90 + 7.90 61.87 + 12.88 0.053
Respiratory rate during admission, mean + SD, bpm 22.80 + 4.10 22.82 + 3.99 22.76 + 4.03 0.821 20.62 + 3.90 28.56 + 7.84 0.039
Core temperature during admission, mean + SD, °C 36.23 + 0.72 36.24 + 0.71 36.22 + 0.78 0.719 36.40 + 0.52 36.14 + 0.87 0.125
Saturation O2 peripheral, mean + SD, % 97.31 + 4.87 97.24 + 4.67 97.35 + 4.19 0.658 97.63 + 3.56 92.23 + 6.34 0.026
Urine-output (first 24 hours), median (lower-upper), mL/24 hours 1.350
(880–2.200)
1.340 (870-2.100) 1.355 (886-2.230) 0.932 1.480 (890-2.300) 1.160 (550-1.900) <0.001
LVEF, mean + SD, % 46.93 + 13.91 46.92 + 13.79 46.88 + 14.29 0.799 49.32 + 11.79 41.27 + 21.79 0.042
Haematocrit, mean (SD), % 31.91 (5.20) 31.77 (5.13) 32.25 (5.36) 0.151 31.94 (5.19) 31.69 (5.27) 0.571
Red cells, mean (SD), ×1012/L 3.58 (0.63) 3.55 (0.62) 3.62 (0.65) 0.088 3.58 (0.62) 3.54 (0.70) 0.411
MCH, mean (SD), pg 27.89 + 1.55 27.88 + 1.49 27.89 + 1.69 0.394 29.53 (2.58) 29.63 (2.87) 0.647
MCHC, mean (SD), % 29.81 + 1.34 29.87 + 1.37 29.77 + 1.35 0.701 32.88 (1.41) 32.75 (1.36) 0.275
MCV, mean (SD), fL 89.90 (6.53) 90.01 (6.47) 89.66 (6.67) 0.396 89.81 (6.43) 90.47 (7.16) 0.242
RDW, mean (SD), % 15.95 (2.13) 16.01 (2.25) 15.81 (1.82) 0.139 15.83 (2.07) 16.75 (2.33) <0.001
White cells, mean (SD), /×10∧9/L 10.54 (4.29) 10.54 (4.31) 10.53 (4.23) 0.980 10.20 (4.11) 12.78 (4.78) <0.001
Platelet count, median (lower-upper), ×109/L 222.67
(168.91–304.25)
222.12
(168.91–301.38)
224.03
(168.97–306.78)
0.582 226.09
(173.40–305.33)
198.56
(134.68–262.07)
<0.001
NT-proBNP, median (lower-upper), pg/ml 5840.00
(2251.00–14 968.00)
6217.00
(2341.00–15 555.00)
4994.00
(2088.38–13 629.75)
0.102 5302.00
(2143.00–13 666.50)
9469.00
(3082.50–3662.75)
<0.001
hsTnI, median (lower-upper), ng/ml 89.25 (46.00–185.19) 85.00 (46.92–185.88) 99.00 (44.00–185.00) 0.509 90.00 (47.00–182.13) 83.12 (37.85–38.63) 0.794
Blood urea nitrogen, median (lower-upper), mg/dL 30.67 (20.83–45.25) 30.67 (20.56–45.08) 30.49 (22.25–45.36) 0.580 29.25 (20.11–43.00) 39.62 (27.06–57.16) <0.001
Random blood glucose, mean (SD), mEq/L 148.80 (51.49) 148.07 (52.09) 150.49 (50.12) 0.462 148.14 (50.46) 153.01 (57.63) 0.270
Sodium, mean (SD), mEq/L 138.89 (4.15) 138.85 (4.17) 138.98 (4.12) 0.636 139.01 (3.98) 138.20 (5.02) 0.023
Potassium, mean (SD), mEq/L 4.18 (0.41) 4.17 (0.41) 4.18 (0.42) 0.662 4.15 (0.39) 4.32 (0.53) <0.001
Chloride, mean (SD), mEq/L 102.28 (5.34) 102.27 (5.43) 102.32 (5.14) 0.875 102.17 (5.21) 103.10 (6.00) 0.040
Calcium, total, mean (SD), mg/dL 8.50 (0.57) 8.49 (0.58) 8.54 (0.56) 0.169 8.54 (0.55) 8.24 (0.62) <0.001
Magnesium, mean (SD), mg/dL 2.12 (0.25) 2.12 (0.26) 2.13 (0.24) 0.420 2.11 (0.24) 2.17 (0.29) 0.011
pH, mean (SD) 7.38 (0.07) 7.38 (0.07) 7.37 (0.07) 0.041 7.38 (0.06) 7.36 (0.07) <0.001
PO2, mean (SD), mm Hg 85.54 (12.86) 85.48 (12.95) 85.67 (12.65) 0.846 86.82 (12.85) 84.07 (12.85) 0.141
PCO2, mean (SD), mm Hg 45.54 (12.86) 45.48 (12.95) 45.67 (12.65) 0.846 45.82 (12.85) 44.07 (12.85) 0.141
Bicarbonate, mean (SD), mEq/L 26.91 (5.17) 26.90 (5.23) 26.94 (5.02) 0.906 27.37 (4.98) 24.00 (5.42) <0.001
Lactate, median (Q1–Q3), mmol/L 1.60 (1.20–2.20) 1.60 (1.20–2.20) 1.65 (1.25–2.20) 0.309 1.60 (1.20–2.10) 2.00 (1.36–3.08) <0.001
Hypertension 0.072 0.013
 No (n, %) 332 (28.21%) 220 (26.67%) 112 (31.82%) 274 (26.94%) 58 (36.48%)
 Yes (n, %) 845 (71.79%) 605 (73.33%) 240 (68.18%) 743 (73.06%) 101 (63.52%)
Supraventricular arrhythmias 0.918 <0.001
 No (n, %) 646 (54.89%) 452 (54.79%) 194 (55.11%) 578 (56.83%) 67 (42.14%)
 Yes (n, %) 531 (45.11%) 373 (45.21%) 158 (44.89%) 439 (43.17%) 92 (57.86%)
Ventricular arrhythmias 0.857 0.614
 No (n, %) 1076 (91.42%) 755 (91.52%) 321 (91.19%) 928 (91.25%) 147 (92.45%)
 Yes (n, %) 101 (8.58%) 70 (8.48%) 31 (8.81%) 89 (8.75%) 12 (7.55%)
Diabetes mellitus 0.390 0.086
 No (n, %) 681 (57.86%) 484 (58.67%) 197 (55.97%) 579 (56.93%) 102 (64.15%)
 Yes (n, %) 496 (42.14%) 341 (41.33%) 155 (44.03%) 438 (43.07%) 57 (35.85%)
Anemia 0.822 <0.001
 No (n, %) 778 (66.10%) 547 (66.30%) 231 (65.62%) 653 (64.21%) 124 (77.99%)
 Yes (n, %) 399 (33.90%) 278 (33.70%) 121 (34.38%) 364 (35.79%) 35 (22.01%)
Hyperlipidaemia 0.275 0.067
 No (n, %) 730 (62.02%) 520 (63.03%) 210 (59.66%) 620 (60.96%) 109 (68.55%)
 Yes (n, %) 447 (37.98%) 305 (36.97%) 142 (40.34%) 397 (39.04%) 50 (31.45%)
Chronic kidney disease 0.937 <0.001
 No (n, %) 747 (63.47%) 523 (63.39%) 224 (63.64%) 625 (61.46%) 122 (76.73%)
 Yes (n, %) 430 (36.53%) 302 (36.61%) 128 (36.36%) 392 (38.54%) 37 (23.27%)
Chronic obstructive pulmonary disease 0.697 <0.001
 No (n, %) 1389 (90.49%) 761 (92.24%) 327 (92.90%) 1118 (91.86%) 271 (85.22%)
 Yes (n, %) 146 (9.51%) 64 (7.76%) 25 (7.10%) 99 (8.13%) 47 (14.78%)
30-day mortality 0.106
 No (n, %) 1217 (79.28%) 709 (76.57%) 508 (83.42%)
 Yes (n, %) 318 (20.72 %) 217 (23.43%) 101 (16.58 %)
Table 2. Univariate and multivariate logistic regression analyse variables.
Variables Univariate analysis Multivariate analysis
OR 95% CI P value OR 95% CI P value
Sex, women, % 1.33 1.04 - 1.78 0.037 1.17 1.02 - 1.33 0.041
Age, years 1.72 1.34 - 2.24 0.0197 1.55 1.23 - 2.08 0.021
BMI, mean + SD, kg/m2 1.44 1.18 - 2.12 0.027 1.37 1.15 - 1.99 0.033
Resting heart rate, bpm 1.78 1.48 to 2.14 <0.001 1.51 1.20 to 1.90 0.004
Systolic blood pressure during admission (<90 mmHg) 2.97 1.95 - 4.59 <0.001 2.31 1.67 - 4.02 <0.001
Respiratory rate during admission, bpm 1.21 1.04 - 1.45 0.032 1.18 1.03 - 1.34 0.039
Saturation O2 peripheral (<90%) 1.45 1.28 - 1.77 0.018 1.35 1.21 - 1.49 0.026
Urine-output, first 24 hours admission (<0.5 ml / kg BW / hour) 2.81 1.98 – 5.13 <0.001 2.56 1.79 - 4.44 <0.001
Blood urea nitrogen, mg/dL 2.02 1.91 - 2.13 <0.001 1.93 1.81 - 2.04 <0.001
Red blood cells, ×1012/L 0.82 0.58 - 1.14 0.233 NA
Haemoglobin, g/dL 1.94 1.62 - 2.88 0.002 1.79 1.45 - 2.55 0.003
MCV, fL 1.03 0.92 - 1.98 0.120 NA
MCH, pg 1.07 0.99 - 1.16 0.098 NA
White cells, ×10∧9/L 1.11 0.96 to 1.16 0.057 NA
Lymphocytes, % 0.92 0.88 - 1.15 0.078 NA
Platelet count, ×109/L 1.12 0.98 - 1.16 0.074 NA
PaO2, mm Hg 0.91 0.86 – 1.03 0.355 NA
PaCO2, mm Hg 0.94 0.86 – 0.97 0.098 NA
Sodium, mEq/L 0.95 0.91 to 0.99 0.197 NA
Potassium, mEq/L 1.77 1.23 - 2.17 0.052 NA
Calcium, mg/dL 0.95 0.78 - 1.34 0.144 NA
Magnesium, mg/dL 0.89 0.27 - 1.02 0.064 NA
Anion gap, mEq/L 1.23 1.15 - 1.32 0.048 1.05 0.97 - 1.27 0.053
Lactate, mmol/L 1.28 1.18 - 1.44 0.046 1.07 0.99 - 1.40 0.052
Chronic kidney disease No 1
Yes 1.85 1.30 - 2.76 0.016 1.54 1.14 - 2.43 0.024
hsTnI, ng/mL 1.02 0.95 - 1.07 0.355 NA
NT-proBNP, pg/mL 2.82 1.90 - 4.65 <0.001 2.17 1.58 - 3.74 <0.001
Ejection Fraction, % 1.45 1.22 - 1.92 0.028 1.21 1.08 - 1.37 0.042
Time for Percutaneous Coronary Intervention, minutes 1.91 1.58 - 2.57 <0.001 1.89 1.56 - 2.37 0.002
Disclaimer/Publisher’s Note: The statements, opinions and data contained in all publications are solely those of the individual author(s) and contributor(s) and not of MDPI and/or the editor(s). MDPI and/or the editor(s) disclaim responsibility for any injury to people or property resulting from any ideas, methods, instructions or products referred to in the content.
Copyright: This open access article is published under a Creative Commons CC BY 4.0 license, which permit the free download, distribution, and reuse, provided that the author and preprint are cited in any reuse.
Prerpints.org logo

Preprints.org is a free preprint server supported by MDPI in Basel, Switzerland.

Subscribe

Disclaimer

Terms of Use

Privacy Policy

Privacy Settings

© 2025 MDPI (Basel, Switzerland) unless otherwise stated