1. Introduction
In the realm of computer security, side-channel attacks pose a substantial threat to the integrity and confidentiality of information processed by modern CPUs. Among them, the Spectre attack is one of the most prominent. It exploits vulnerabilities in dynamic branch prediction (DBP), a function performed by a logic circuit found in almost all modern processors. The DBP unit is supposed to anticipate the direction of a branch rather than wait for the outcome of its decision to keep the processor’s instructions flowing at top speed. It is an essential part of performance in modern CPUs. Unfortunately, Spectre attacks can exploit this technique to access sensitive information. The vulnerability to Spectre and other similar attacks has prompted researchers to introduce various mitigation measures, often affecting system performance and, as a side effect, power consumption.
The mitigation techniques for the Spectre flaw can generally be classified into two main approaches: hardware or software-based. Hardware-based mitigations involve modifications to the underlying microarchitecture of processors to address the vulnerabilities exploited by Spectre attacks. These changes may include alterations to the speculative execution mechanisms, branch prediction algorithms, and memory access patterns. Hardware vendors release microcode updates to patch vulnerabilities in their processors. These updates often include fixes and mitigations for Spectre vulnerabilities discovered in the processor’s speculative execution logic. Sometimes, hardware mitigations may require the introduction of new processor designs that incorporate architectural changes to enhance security against Spectre attacks. Software-based Spectre mitigation implements techniques and strategies at the software level. These mitigations typically involve operating system patches, runtime mitigations, application level mitigations, and new compiler flags.
Operating system vendors release patches and updates that include mitigations for Spectre vulnerabilities. These patches may incorporate changes to the kernel, runtime libraries, and system calls to mitigate the risks associated with speculative execution. Some software frameworks and runtime environments implement runtime mitigations for Spectre vulnerabilities. These mitigations may include runtime instrumentation, code reordering, or dynamic code analysis to detect and prevent speculative execution attacks at runtime.
Developers implement mitigations at the application level to reduce the attack surface for Spectre vulnerabilities. Techniques such as constant-time programming, input validation, and sandboxing can help mitigate the impact of Spectre attacks on specific applications. Compiler developers add new flags that enable specific mitigations against Spectre vulnerabilities during compilation. These flags introduce code transformations or runtime checks to prevent or mitigate the exploitation of speculative execution.
Compiler-based mitigation strategies, such as those offered by Intel Compiler (IC), GNU Compiler Collection (GCC), and the Clang compiler, are advantageous for several reasons. First, compiler-based mitigations provide a flexible and compatible approach to addressing security vulnerabilities like Spectre. Compiler flags may be applied to existing code without any changes to the underlying architecture, unlike hardware-based solutions, which may require new processor designs or microcode updates. Second, integrating compiler flags into the software development process is often straightforward and does not require significant expertise or infrastructure changes. Developers can enable the appropriate flags during compilation to apply the desired mitigations. Third, compiler-based mitigations are generally portable across different platforms and operating systems. This portability allows developers to apply consistent security measures across diverse environments, including desktops, servers, embedded systems, and cloud platforms. Last, compiler-based mitigations seamlessly integrate into the software development workflow, allowing developers to incorporate security measures at the source code level. This integration facilitates early detection and mitigation of security vulnerabilities during the development lifecycle, reducing the risk of exploitation in deployed applications.
Mitigation strategies for Spectre and similar vulnerabilities often involve changes to the CPU’s speculative execution behavior. These changes can slow down the execution of instructions, leading to increased execution times in programs. Measuring the performance overhead involves quantifying the slowdown in execution time, power consumption, or other relevant performance metrics.
Measuring the effectiveness and efficiency of various Spectre mitigation strategies to prevent side-channel attacks involves a multifaceted approach. This study needed to consider the security effectiveness, how well the mitigations prevented attacks, and the efficiency impact on both time and energy concerns. For these ends, the researchers needed to define and establish evaluation metrics for measuring the effectiveness of security, time performance, and power efficiency.
Experts measure security effectiveness by the ability of the countermeasures to prevent information leakage. They use various metrics. These metrics include the reduction in successful side-channel attacks, the decrease in exploitable vulnerabilities, and the increase in effort required for an attack to succeed. Efficiency impact typically involves measuring the performance overhead introduced by the mitigations and the extra energy consumption cost caused by them compared to a baseline where no-mitigations are applied.
Previous research has primarily concentrated on the performance penalties associated with Spectre mitigations, with studies such as Kocher
et al. [
1] detailing the mechanisms of the Spectre attack and its variants. Mitigation techniques have been explored in works by Canella
et al. [
2], which assesses the efficacy of different strategies against speculative execution attacks. Herzog
et al. studied the energy overhead of Meltdown and Spectre attack mitigations at the operating system level [
3]. However, the energy dimension remains underexplored comprehensively, with limited analysis of how these security measures affect power consumption at the application level. This paper seeks to fill this gap by quantitatively providing a comprehensive evaluation of the energy implications of Spectre mitigations, contributing to a more nuanced understanding of the trade-offs between security and power efficiency in modern CPUs.
The primary objective of this study was to investigate the balance between security and energy efficiency, specifically by examining the energy implications of implementing mitigations against Spectre Variant 1 (V1) and Spectre Variant 2 (V2). These particular variants were chosen for several reasons. First, Spectre V1 (Bounds Check Bypass) and V2 (Branch Target Injection) are among the earliest discovered and most widely mitigated Spectre variants by compiler vendors. Second, they affect all modern processors from major manufacturers such as Intel, AMD, and ARM, making their study broadly applicable. Lastly, their mitigation strategies have set precedents that influence responses to subsequent Spectre variants, underlining their importance in the security landscape.
This research was conducted through experimental analysis, utilizing empirical data collected from internal sensors embedded in an HPC-class CPU. We hypothesized that different compiler-based mitigation strategies for Spectre V1 and V2 would result in varying levels of power and energy usage, thus indicating significant trade-offs between securing processors and maintaining energy efficiency. By focusing on the compilers most commonly used today—GCC, Intel, and Clang—this study aimed to provide concrete insights into how each mitigation technique impacts CPU power consumption. The ultimate contribution of this research lies in its practical approach, which avoids the complexities of mathematical modeling or detailed simulation, instead providing a clear, empirical basis for understanding the interplay between CPU security and energy efficiency.
The implications of this study extend far beyond the realm of HPC-class CPUs, offering significant insights into a range of computing environments where energy efficiency and security are paramount. For instance, in the rapidly growing field of Internet of Things (IoT), devices often operate under stringent power constraints. The findings from our study can guide developers in these environments to implement energy-efficient security measures against Spectre-like attacks without significantly compromising the device’s battery life or performance. Similarly, in mobile computing, where battery longevity and security are critical, applying the insights from our research can help in designing more robust and energy-efficient security protocols. Moreover, the mitigation strategies explored in this study have implications for cloud computing infrastructures, which rely on virtualization technologies vulnerable to side-channel attacks similar to Spectre. By applying our findings, cloud service providers can enhance the security of their multi-tenant environments while optimizing power usage, thereby reducing operational costs and improving service reliability. Additionally, our research can inform security practices in embedded systems used in automotive and aerospace industries, where safety and power efficiency are crucial. The ability to secure these systems against sophisticated attacks without draining critical energy resources can significantly enhance their operational effectiveness and longevity.
In this paper, the authors will adhere to the standard definitions of energy and power from physics, i.e., power is the time rate of energy. Energy is, of course, measured in Joules. Power draw is measured in Watts, defined as Joules per second. The authors chose to round the numbers in the tables to enhance readability, energy to whole numbers, and power to one decimal digit where appropriate. The remainder of this paper is structured as follows.
Section 2 presents a review of related previous work.
Section 3 provides an overview of the experimental design, offering the necessary foundational information.
Section 4 details the methodology and the experimental setup used for the study.
Section 5 presents the results and provides an analysis of the findings. Finally,
Section 6 provides a conclusion, summing up the study’s outcomes, addresses limitations, and suggests areas for future research.
2. Literature Review
It seems that little or, to the best of the authors’ knowledge and efforts, no concrete work was published to address the impact of side-channel attack mitigations on the energy or the power draw. Therefore, this review begins with a chronological exploration of seminal works that laid the foundation for understanding side-channel attacks. It then delves into specific types of side-channel attacks relevant to this study, highlighting the top research and its significant contributions to the field. The review hopes to address the gap by examining works that indirectly touch on the intersection of security mitigations and energy consumption.
Unlike traditional attacks that target software vulnerabilities, side-channel attacks harness the way the hardware and software are designed to optimize the coding process [
4]. The first side-channel attacks, used, were timing attacks. Kocher [
5], in 1996, proved that private keys of RSA encryption systems can be revealed by accurately measuring the time needed for calculating a private key operation. He exploited the performance optimization operations, used by an algorithm (such as the Chinese Remainder Theorem ( CRT)) to elevate unnecessary operations in calculations, to infer the input data binary digits. He invested the fact that different input data takes different amounts of time to be processed by cryptography systems.
Timing attacks led to many other software-based side-channel attacks such as cache attacks [
6,
7], differential fault attacks [
8], DRAM attacks [
9], DBP attacks [
10,
11]..etc.
Yarom and Falkner [
12] demonstrated a cache side-channel attack called "FLUSH+RELOAD" which exploits sharing memory pages existing in Intel X86 processors to monitor access in shared memory lines in L3 cache. This attack uses clflush instruction to achieve its job. They suggested some solutions to mitigate this type of attack such as limiting the current ability of clflush instruction in Intel X86.
Irazoqui
et al. [
13] introduced an attack called Cross-VM attack which may affect the cloud computing systems. This attack is a cache-based side-channel attack that exploits resource sharing in virtualizing software. This attack also uses the FLUSH+RELOAD technique. They suggested some countermeasures for mitigation such as using cache pre-fetching, cache flushing, and restricting the duplication. Gulmezoglu
et al. [
14] introduced a faster and a more realistic FLUSH+RELOAD attack on AES.
Gruss
et al. [
15] introduced "Cache Template Attacks" which automatically profile information of any program by exploiting cache-based leakage. They concluded that cache-based side-channel attacks are a big threat to the current architectures used in modern computers.
Gruss. in this thesis [
16] discussed the current architecture in the modern processor and the attacks exploit architectural fault and side-channel leakage as well as discussed the defenses.
Yarom
et al. [
17] introduced a new type of side-channel attack called "CacheBleed" which can recover sub-cache-line information using timing variations and cache-bank conflict.
Lipp
et al. [
18] presented the Meltdown attack, an attack exploit Out-Of-Order execution to read kernel-memory space without any permission or privileges. It can affect cloud machines. To prevent this attack, the KAISER defense Mechanism can be used. They evaluated the performance of the Meltdown attack on different systems. They also studied the effect of KAISER on performance and proposed hardware solutions.
Evtyushkin and Riley [
11] presented an attack, called BranchScope, that aims to infer the direction of a conditional branch instruction in the victim code by manipulating the directional component of the branch predictor. The attack was applied on different Intel CPUs.
Bulck
et al. [
19] introduced a side-channel attack, called "Foreshadow", which can penetrate the SGX protection system by abusing a speculative execution bug without the need for kernel-level access.
Kocher
et al. [
1] described Spectre attacks. These attacks use a sequence of transient speculative instructions to leak information across security domains.
Chen
et al. [
20] presented SGXPectre attacks, stealing Intel secrets from SGX enclaves via speculative execution. These attacks can observe cache-state changes due to a program outside the enclave which leads to disclosing the secrets inside the internal register or enclave memory.
Schwarz
et al. [
21] presented NetSpectre, a generic type of Spectre attack, which can, remotely over the network, extract information from cache memory.
Kiriansky and Waldspurger [
22] introduced another type of Spectre attack that can leverage speculative stores to create speculative buffer over follow. Also, they introduced another type of Spectre attack that can overwrite read-only data and code pointers to breach sandboxes.
Weisse
et al. [
23] presented an extension attack for Foreshadow, called Foreshadow-NG (Next Generation). This attack can bypass the abstraction of the virtual memory to access kernel memory.
Koruyeh
et al. [
24] introduced SpectreRSB attack that, rather than exploit branch prediction unit, exploits the return stack buffer which can make threats to SGX enclaves and OS kernel.
Intel [
20] published a white paper that concluded that "Intel is continuing to investigate architecture and micro-architecture changes to combat these types of attacks while maintaining high processor performance"
Wang
et al. [
25] proposed a static analysis approach to mitigate Spectre attacks by inserting fences at vulnerable conditional branches to prevent speculative execution.
Khasawneh
et al. [
26] introduced SafeSpec, a model that can support speculative execution to be immune to side-channel leakage by storing side effects in separate structures. They claim that SafeSpec can prevent the three types of Spectre and Meltdown.
Dong
et al. [
27] evaluated the performance impact of three different defenses against side-channel attacks, namely: MPX, address bit-masking and testing, and separate virtual address spaces for applications.
Mcilroy
et al. [
28] explored side-channel attacks and speculative execution and their implication for programming languages. They introduced a mathematical model to define the source of side-channels. Moreover, they proposed an architectural model for vulnerability study. They also evaluated the software mitigations that currently exist.
Canella
et. al [
2] introduced a systematic evaluation of the attacks and defenses related to transient execution. They tried to give a big picture of the attack that helped give a good methodology for defense evaluation. They concluded that most of the defenses cannot fully mitigate all attack variants.
Herzog
et. al provide analysis of the energy overhead associated with Meltdown and Spectre mitigations at the operating system level. Their work concentrated on the subsystem-specific effects [
3].
Behrens, et al. presented a comprehensive analysis of the performance penalties associated with mitigations for transient execution attacks, such as Spectre and Meltdown, across multiple processor generations [
29].
Each of these strategies is chosen to comprehensively evaluate the trade-offs between security, performance, and energy consumption.
Spectre attacks, first disclosed in early 2018, introduced a new class of vulnerabilities in modern CPUs, prompting the development of various mitigation strategies, including compiler-based approaches. These countermeasures have only recently been refined, reflecting the relative recency of this research area. While the literature on side-channel attacks and their mitigations is extensive, to our knowledge, no prior studies have comprehensively examined the energy impact of compiler-based Spectre attack mitigations. This underscores the novelty of this work and highlights its contribution to the field, given the limited availability of comparative studies in this area.
3. Research Design
The research relies on experimentation to collect empirical data from the reliable sensors embedded in the CPU. It calls for a robust experiment designed to answer the questions raised by the investigation about the impact of Spectre V1 and V2 mitigations on power and energy consumption. The study must identify the factors that likely affect consumption. Based on those factors, one can develop test cases to help uncover the full range of relevant behaviors. They then may rationalize the variables that measure those behaviors. In this section, the authors discuss the operative factors, the test cases, and the ensuing variables of the experiment.
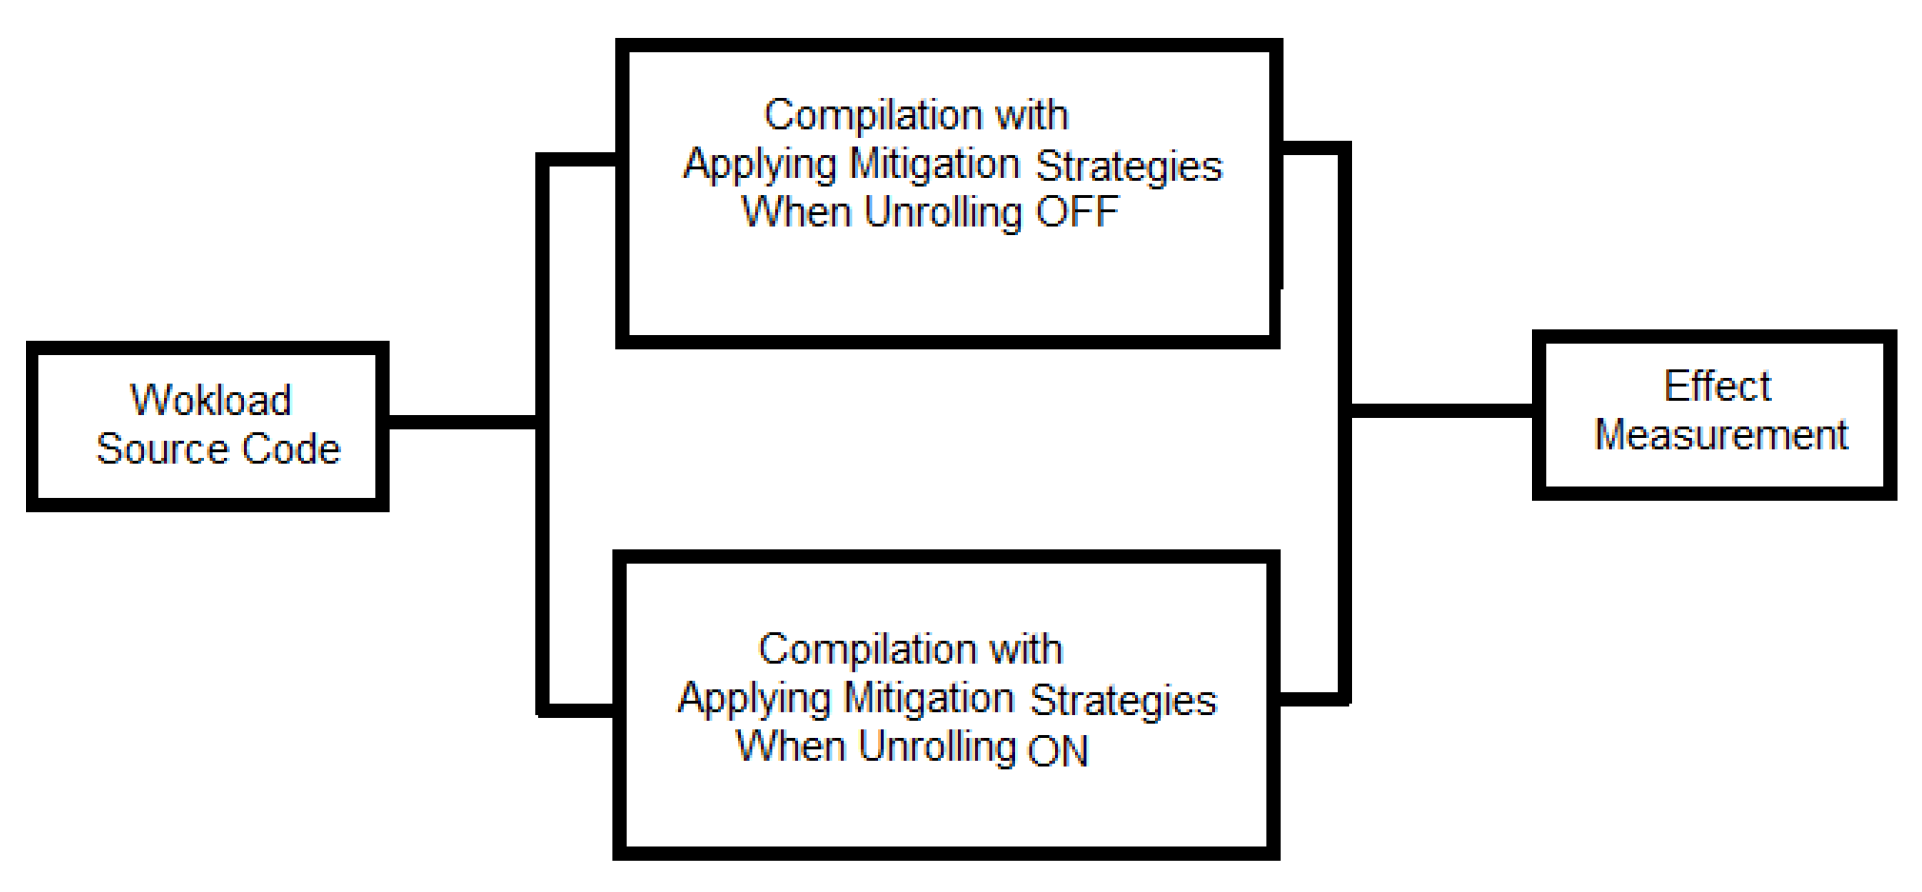
Figure 1 is a block diagram illustrating the experiment design. The mitigation strategies used in the experiment are shown in
Table 1. These strategies are adopted by three well-known compilers, namely Intel, GCC, and Clang compilers, to mitigate Spectre V1 and V2 attacks. The variables and factors considered in this study include the compiler type, the mitigation strategies applied, and their impact on software performance and energy consumption.
Selecting Spevtre V1 and V2 is for the reasons mentioned in
Section 1. The focus on these three compilers is justified by several reasons. IC compilers are widely used in industries that demand high computational efficiency, such as finance, scientific research, and engineering [
30]. GCC is a popular, open-source compiler supporting various programming languages and platforms. It is widely used in cross-platform development and is the default compiler on most Unix-like operating systems [
31]. Clang, part of the LLVM project, is known for its modern, modular architecture, enabling easy integration with other tools and new technologies. It offers competitive compilation time and memory usage, making it a preferred choice for developers [
31].
Each strategy is applied once with the unrolling feature turned off and once with the unrolling feature activated. Loop unrolling is typically used to optimize performance by reducing the overhead of loop control code and increasing the instruction-level parallelism. Given that Spectre attacks target branch instructions, and loop unrolling can reduce the number of branch instructions by minimizing loop control overhead, it is hypothesized that unrolling may have a positive impact on the footprint of the mitigation. By potentially decreasing the number of branch instructions, loop unrolling could mitigate the performance and energy impacts introduced by Spectre defenses.
All strategies for Spectre V1 and V2 mitigations depend on limiting speculative execution to prevent side-channel attacks. This common approach involves various techniques to ensure that speculative execution does not leak sensitive information through vulnerabilities exploited by these attacks.
Speculative execution is well known for its significant positive impact on performance. While the performance impact of limiting speculative execution to mitigate Spectre V1 and V2 has been studied in [
29], and the energy overhead associated with applying mitigations for side-channel attacks at the operating system level has been studied in [
3], its effect on energy and power consumption at application level with compiler-based mitigations remains under-explored comprehensively. This study aims to fill this gap by analyzing how these mitigation strategies influence both energy and power consumption, providing a comprehensive understanding of the trade-offs involved.
The no-mitigation strategy is used as a baseline to measure the impact of the Spectre V1 and V2 mitigations. By compiling benchmarks without any mitigation strategies, we can establish a reference point for performance and energy consumption. This allows for a clear comparison to understand the overhead introduced by each mitigation technique.
Each of the following strategies addresses specific vulnerabilities in different ways. Since this research aims to conduct a comprehensive investigation, it is necessary to exhaustively examine all of them. The remainder of this section provides a definition of each mitigation strategy and the rationale behind its selection for this experiment.
The Comprehensive Conditional Branch Mitigation (CCBM) strategy applies fixes to all conditional branches, providing broad and comprehensive mitigation against Spectre V1 attacks. This strategy ensures that all potential speculative execution vulnerabilities in conditional branches are addressed, offering a high level of security. Applying fixes to all conditional branches may significantly impact performance and energy consumption due to the broad scope of the mitigation.
Targeted Pattern Mitigation (TPM) strategy specifically targets patterns of code that are known to be susceptible to speculative execution attacks. By focusing on these patterns, this strategy aims to balance security and performance, mitigating vulnerabilities without the broader overhead of comprehensive approaches. This potentially reduces the energy overhead compared to more comprehensive mitigations.
The Speculative Load Defense (SLD) strategy hardens speculative loads to prevent leaking through speculative execution paths. This strategy is particularly effective in scenarios where speculative loads are a significant vulnerability, providing targeted protection with minimal performance impact. This strategy may effectively mitigate Spectre V1 vulnerabilities with a moderate impact on performance and energy consumption, providing a targeted approach to security.
The Indirect Branches Inline Thunk (IBIT) strategy uses inline thunks for indirect branches to mitigate Spectre V2. Thunks act as intermediaries, ensuring speculative execution does not bypass security checks. This strategy helps maintain performance while providing robust security. Indirect Branches External Thunk (IBET) strategy isolates branch targets with external thunks, adding an extra layer of security against Spectre V2.
Function Calls Inline Thunk (FCIT) strategy mitigates Spectre V2 by using inline thunks for function calls, preventing speculative execution vulnerabilities within function calls. This strategy ensures that function calls are securely handled without significantly impacting performance. Function Calls External Thunk (FCET) strategy applies external thunks to function calls, similar to IBET but for function calls. Isolating branch targets with external thunks may provide robust security against Spectre V2 with performance and energy costs due to the added complexity of external thunks.
Function Returns Inline Thunk (FRIT) strategy uses inline thunks for function returns to prevent speculative execution vulnerabilities. This strategy ensures that the return paths of functions are secure, providing targeted protection with minimal performance impact.
The Return Trampoline (RT) strategy mitigates Spectre V2 by using return trampolines, which replace indirect jumps and calls with returns. The Return Trampolines External Thunk (RTET) strategy employs external return trampolines to prevent speculative execution vulnerabilities, similar to RT but with added external separation. This approach enhances security but may increase energy consumption.
4. Experement Methodology and Setup
This section is about the process used to collect the data. It is divided into two parts. The first presents the methodology of the study. The second details the experimental setup, including the choices, the environments, procedures, and tools employed. Additionally, it documents the conditions under which the data were obtained and includes relevant commentary on the data collection process.
4.1. Methodology
The methodology used in this study [
32] was based on the work presented in [
33], which utilized empirical data collected directly from internal CPU sensors to analyze energy consumption linked to specific algorithmic behaviors. We adapted and further developed parts of this methodology for our research, which focused on empirically assessing the branch prediction function and the energy consumption patterns of the physical circuitry associated with this function. The approach detailed in [
32] systematically employs Intel’s Running Average Power Limit (RAPL) for empirical assessment of energy consumption, addressing the research questions posed by this study. This method includes various precautions to ensure the accuracy of the empirical measurements, thereby providing more reliable estimations. It also discusses the factors influencing these measurements, the challenges encountered, and the insights gained from the empirical data collected throughout our experimental processes.
The main lessons can be summarized as follows:
Averaging multiple RAPL measurements generally improves accuracy. However, beyond a certain point, increasing the number of readings does not enhance accuracy.
Averaging RAPL readings taken with a single thread tends to be more accurate than those taken with multiple threads.
To measure the energy consumption of a workload without the unpredictable effects typically introduced by compiler optimizations, it is good practice to use minimal compiler optimization.
Dedicating one core to the workload minimizes CPU context switching by ensuring the workload runs exclusively on that core, free from interruptions by other processes. This approach enhances RAPL accuracy.
Enabling the Power Management Unit (PMU) negatively impacted the accuracy of RAPL readings because the PMU’s dynamic control over CPU power varied from one run to another.
Turning off hyper-threading reduces RAPL noise because it prevents multiple threads from sharing the same physical core, thereby eliminating the interference and variability introduced by simultaneous multi-threading. This results in more consistent and accurate power measurements.
Measuring only one RAPL metric at a time increases its accuracy because it reduces the potential for measurement interference and contention between multiple metrics. This focused approach allows for more precise and reliable readings by minimizing the complexity and overhead associated with tracking multiple metrics simultaneously.
Running software inside a container appears to reduce environmental noise levels, making it more suitable for experimental studies.
4.2. Experemental Setup
The experiment is designed to isolate the effects of Spectre mitigations on both performance and power consumption across a diverse set of benchmarks and compilation strategies. Through this approach, the study aims to provide a better understanding of the trade-offs involved in deploying Spectre mitigations, facilitating the development of optimized, secure, and energy-efficient software applications.
The experiment quantifies the impact of Spectre V1 and V2 mitigations on software performance and energy consumption. We compiled 10 benchmarks from the Parsec suite using IC, GCC, and Clang compilers to ensure broad coverage across different computing environments. These benchmarks, summarized in
Table 3, represent diverse computational scenarios, enabling a comprehensive evaluation of the subject matter. The specific compiler flags used in the experiment are detailed in
Table 3, covering the strategies mentioned in
Table 2.
Each benchmark is compiled under different settings to capture a wide array of performance and energy consumption profiles: without any Spectre mitigations, with Spectre V1 mitigations enabled and with Spectre V2 mitigations enabled. Each of the settings is further divided into two cases: with loop unrolling disabled and with loop unrolling enabled. The experiments were conducted on the system detailed in
Table 4. Lubuntu operating system was used instead of Ubuntu. Lubuntu is a lightweight variant of Ubuntu, designed to be less resource-intensive. Its reduced resource consumption minimizes noise in the readings, leading to more accurate and reliable experimental results.
We used the dataset in the case of the absence of Spectre mitigation as a baseline for comparative analysis to estimate the effectiveness of various Spectre mitigation strategies in terms of energy and performance. Energy consumption across the 10 benchmarks, in the case of no Spectre mitigations, draws a general picture of how the compiler type and load characteristics influence energy use.
The inclusion of loop unrolling adds an additional dimension to the experiment. Loop unrolling is a common optimization technique that can impact both performance and energy consumption. By examining both cases (loop unrolling OFF and ON ), the experiment can evaluate the interplay between loop unrolling and Spectre mitigations, providing insights into potential trade-offs or synergies between the two.
The Spectre V1 proof-of-concept (PoC) source code, in the paper [
34], is compiled without any mitigations and with Spectre V1 mitigations applied, to assess the effectiveness and impact of these mitigations. Similarly, the Spectre V2 PoC source code, used in the paper [
1], is compiled under the same two conditions to evaluate the mitigation strategies for Spectre V2.
In the experiment, the benchmarks were executed, with all compiler strategies illustrated in
Table 1. The collected data included energy consumption, execution time, the total number of instructions, percentages of branch instructions, branch misses, and cache misses. These metrics were chosen due to their significant correlation with both the performance of the software and the power efficiency of the system, providing insights into how different Spectre mitigation strategies affect these critical aspects.
To measure energy consumption and other metrics, we utilized the Running Average Power Limit (RAPL) tool available on Xeon CPUs, alongside the
perf tool available in Linux, to gather the necessary data. For several reasons, we have chosen this machine as a platform for our research. First, its architectural features have been extensively documented in studies such as [
35], providing a reliable foundation for analysis and comparison. Second, the Haswell-EP integrates fully integrated voltage regulators (FIVR) directly on the CPU die, allowing precise control over frequency and power states across various domains of the chip package. This setup facilitates high-resolution power readings, with core-specific measurements being accurate when other cores are idle, and credible even with low activity on different cores. Finally, [
36] established that RAPL estimates for the Haswell architecture closely correspond to external plug-based power measurements, confirming the reliability of its energy reporting. These factors make the Haswell-EP CPU a robust and well-suited testbed for investigation in this research.
To ensure the reliability of our measurements, we adhered to the guidelines outlined in our methodology paper described in [
32] which can be summarized as follows.
Turning off the Hyper-Threading Technology.
Making the compiler optimization on the lowest possible level. However, to enable the unrolling feature, the optimization must be at least at level one (-O1).
Turning off the Power Management Unit (PMU)
Running each benchmark inside a docker container.
The benchmark is run on a dedicated core.
Disabling non-maskable interrupt.
Running every benchmark many times until the average of every measurement converges.
Measuring only one RAPL metric at a time (energy, time, number of instructions, branch instructions percentage, miss-prediction percentage, and cache misses)
5. Results and Discussion
The experimental data collected from the study are presented in
Table A1–
Table A5, located in the appendix.
Table A6 in the appendix, illustrates the average power consumption, calculated based on the energy consumption and execution times detailed in
Table A1 and
Table A2.
5.1. No-Mitigation Case
We investigate the ’No-mitigation’ scenario for several key reasons. Initially, this analysis helps us understand the baseline properties and their impact on metrics across three different compilers. Additionally, we aim to assess how loop unrolling influences these metrics within and across compilers and for specific benchmarks. This baseline analysis is crucial for isolating effects directly attributable to the applied mitigations from those influenced by the compiler used, the impact of loop unrolling, and the inherent characteristics of the benchmarks. Consequently, this allows us to accurately identify the true effects of the mitigations.
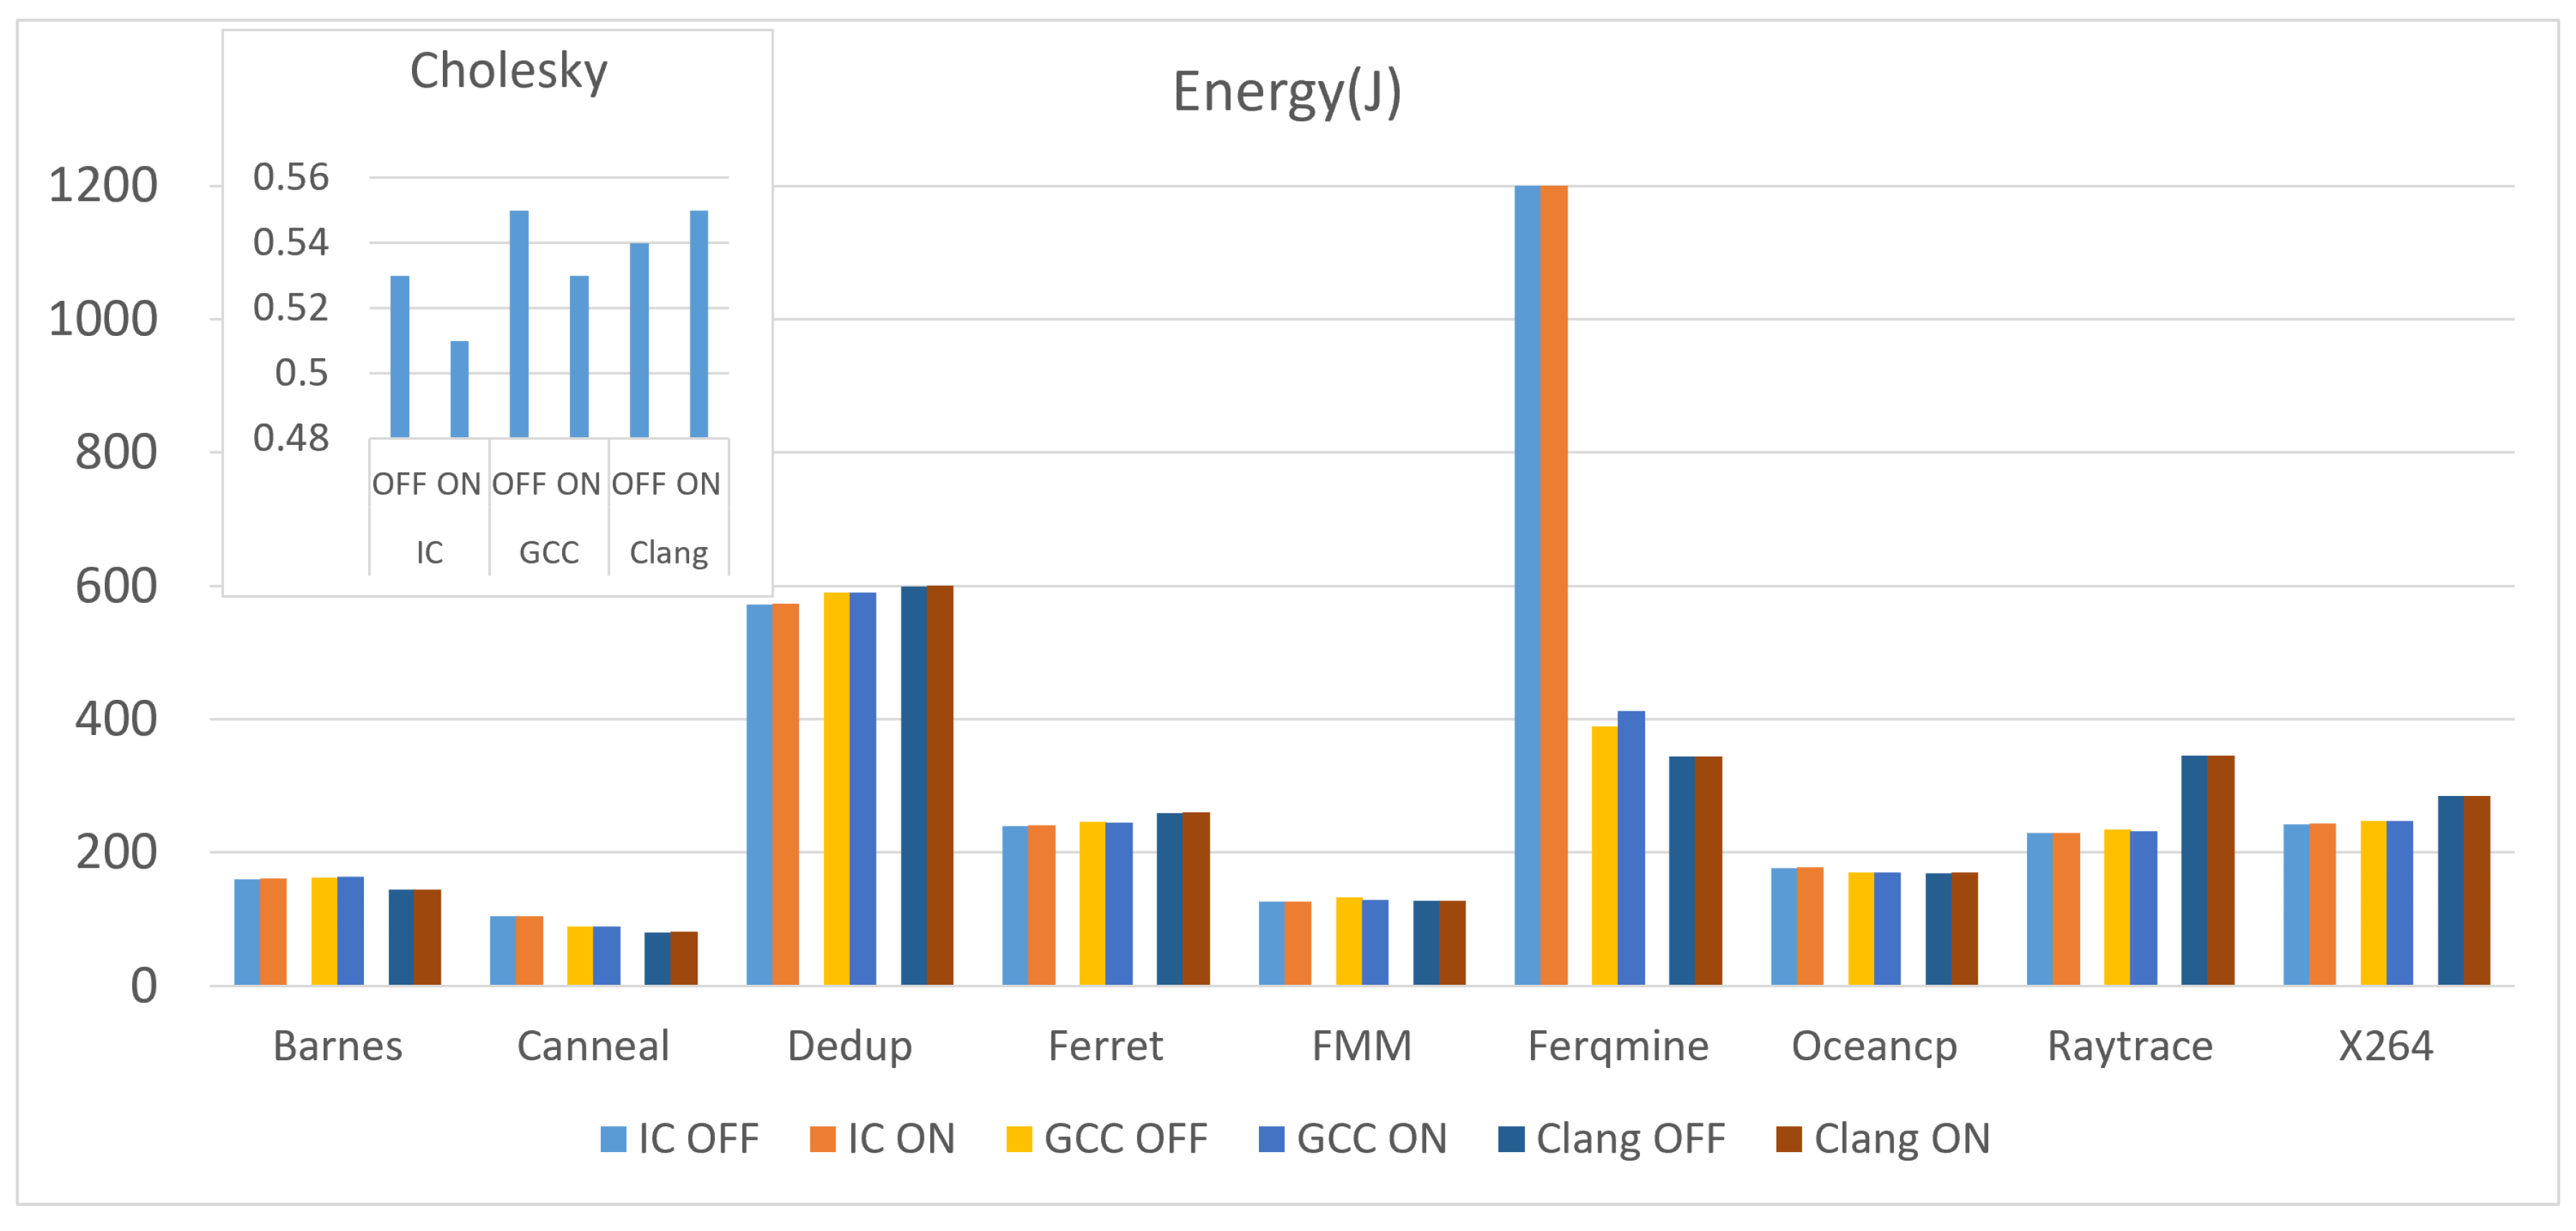
Figure 2 shows the energy consumption of the 10 benchmarks compiled with the three compilers under the two conditions (unrolling OFF and Unrolling ON). Cholesky benchmark has been isolated in its own graph due to its notably smaller time duration and consequent energy consumption when compared to other benchmarks, as it allows for a clearer and more focused analysis of the Cholesky benchmark’s performance characteristics without the distraction of the larger scales associated with other benchmarks.
Energy consumption remains relatively stable between unrolling OFF and ON for most benchmarks. However, there is a slight increase in energy consumption when loop unrolling is enabled for most benchmarks. Generally, enabling loop unrolling seems to increase the energy consumption for most benchmarks compared to when it is disabled. However, different benchmarks exhibit varying responses to loop unrolling.
The Cholesky benchmark reveals distinct variations in energy consumption across different compilers and loop unrolling settings, illustrating how each compiler manages the benchmark’s specific computational tasks. These findings highlight the critical importance of carefully selecting the appropriate compiler and optimization settings tailored to the specific needs of an application, ensuring optimal performance and energy efficiency. The graph also suggests that different compilers handle loop unrolling with varying levels of efficiency.
The observation that the Freqmine benchmark consumes significantly more energy when compiled with IC compared to GCC and Clang is indeed intriguing. To investigate this further, we needed to consider the data of the other metrics which will be discussed later in this subsection.
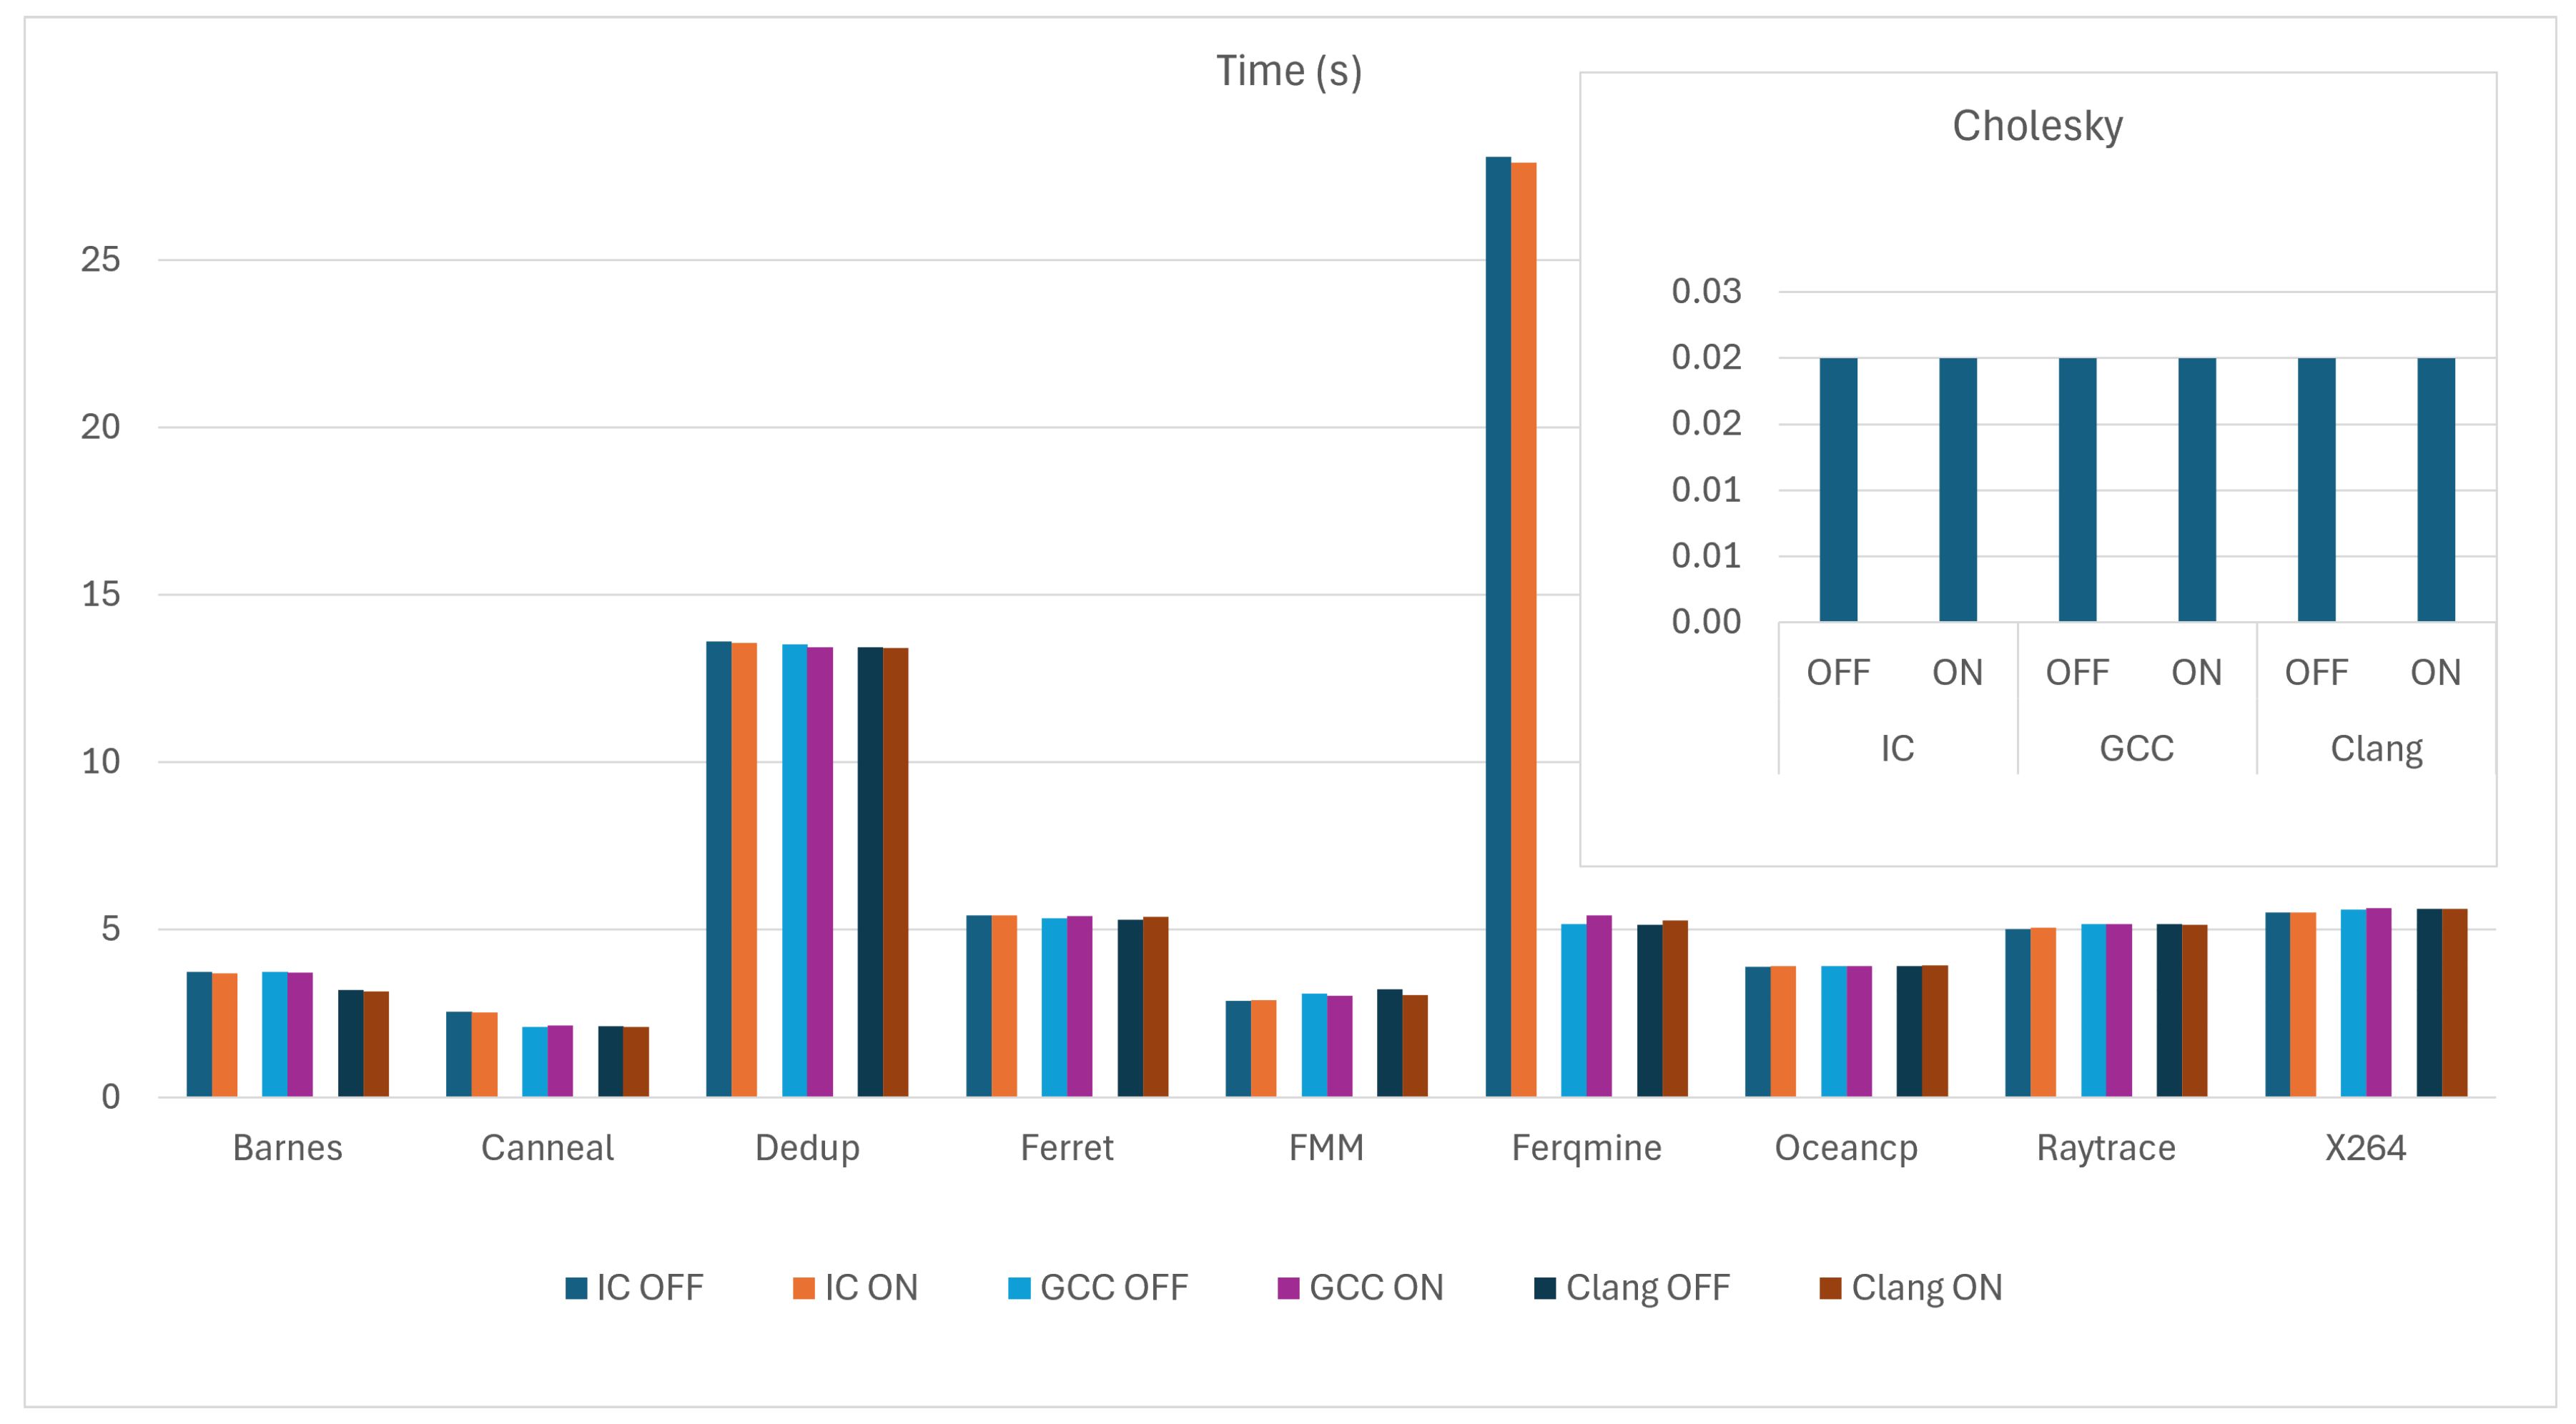
Figure 3 shows the execution time in seconds for the 10 benchmarks under the same criteria. Across most benchmarks, turning on loop unrolling slightly reduces the execution time compared to having it off, which is expected as unrolling loops can reduce the overhead of loop control and increase the efficiency of execution in many cases.
As we can notice from
Figure 2 and
Figure 3, there is, generally, a correlation between energy consumption and execution time. Benchmarks that take longer to execute also tend to consume more energy.
While disabling loop unrolling might intuitively seem like it would conserve energy by maintaining a smaller code size and potentially using fewer CPU resources, it actually engages additional components such as the Dynamic Branch Predictor (DBP). The increased use of the DBP, due to more frequent branch instructions, leads to additional power consumption through miss-predictions and the overhead of managing these branches. However, despite these factors, enabling loop unrolling generally results in higher energy consumption.
The increase in energy consumption when unrolling is enabled, despite reduced execution times, can be attributed to several factors. Unrolling loops demands more immediate CPU resources, leading to bursts of intensive computation that temporarily raise power usage. Furthermore, the larger code size from unrolled loops can lead to increased cache usage and more cache misses, which are costly in terms of energy consumption.
To provide an overview of benchmark trends excluding load characteristics, total energy and time were calculated. Cumulative data, as shown in
Table 5, reveals that the IC compiler has the highest total time and energy consumption. In contrast, Clang has the lowest execution time, and GCC has the lowest energy use. Additionally, the data indicates that loop unrolling generally increases energy consumption while reducing execution time, suggesting a trade-off between enhanced performance and higher energy demands.
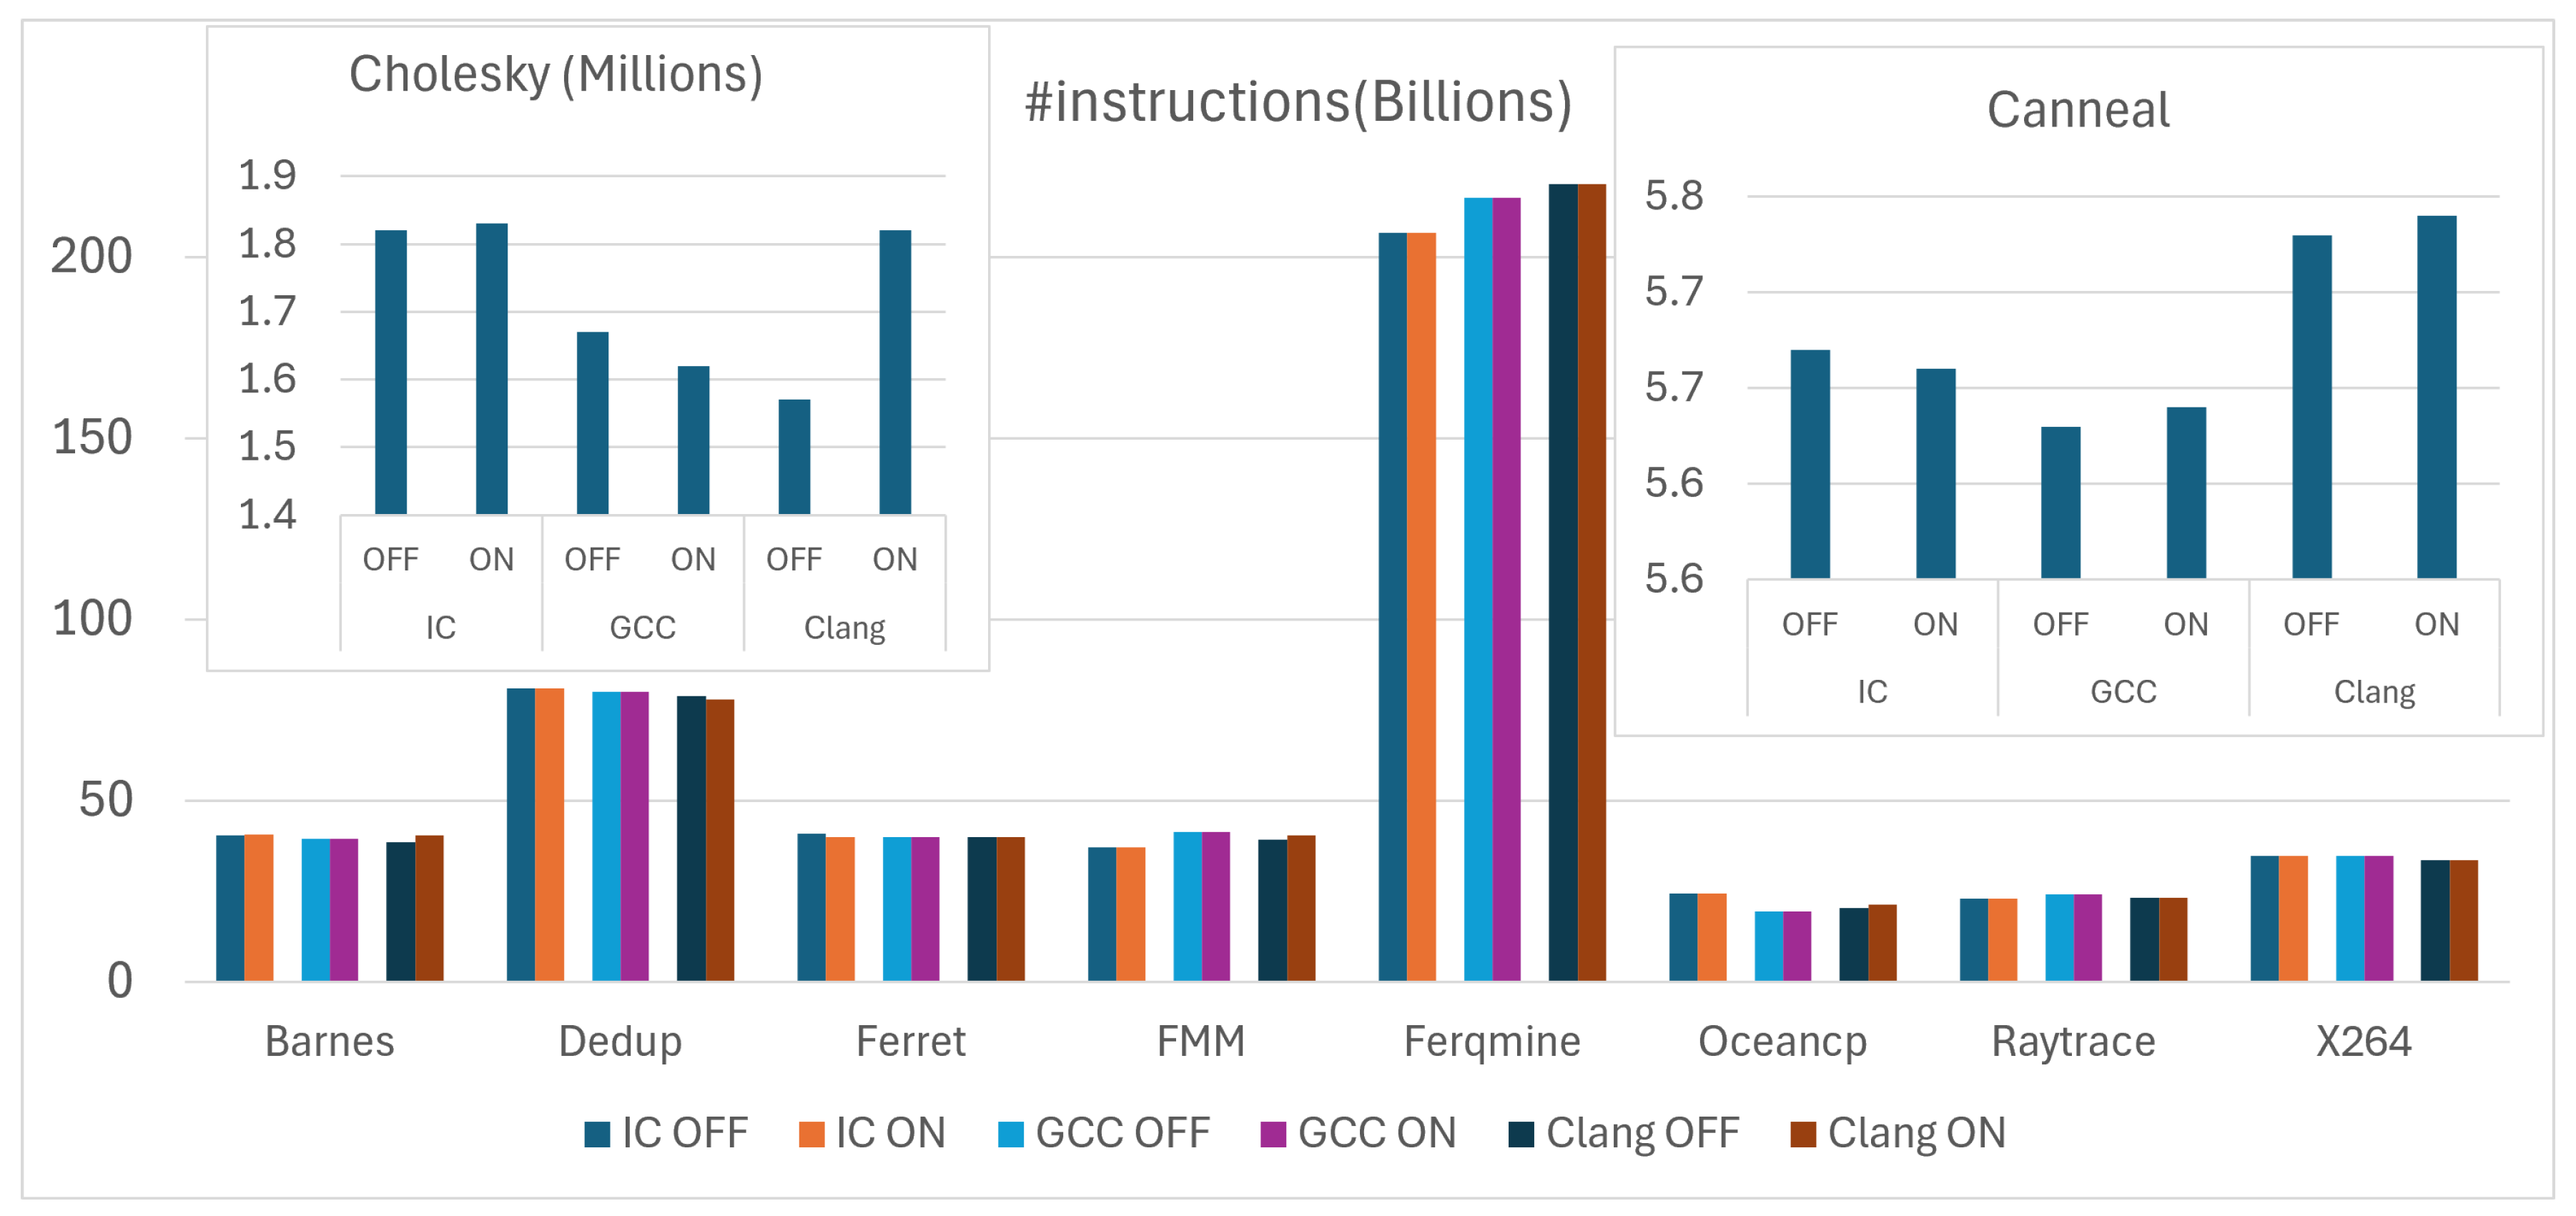
Since the number of instructions executed is a key attribute of compiler performance, we have included it as one of the primary metrics for evaluation. This allows for a comprehensive analysis of how different compilers manage code complexity and efficiency, providing insights into their capabilities in generating binary code.
Figure 4 illustrates the number of executed instructions of the 10 benchmarks, compiled with the three compilers with loop unrolling settings either enabled (ON) or disabled (OFF). Distinguishing the Cholesky and Canneal benchmarks from others is due to their smaller scale in terms of the number of executed instructions and their characteristics. The graph displays only slight differences in the number of instructions executed among the three compilers and shows minimal differences between cases with and without loop unrolling, generally favoring the scenario where unrolling is enabled.
Interestingly, the Freqmine benchmark, which demonstrated a significant increase in both time and energy consumption when compiled with the IC Compiler, recorded the lowest number of instructions with the IC Compiler compared to the other two compilers. The observation might indeed seem counter-intuitive at first. Typically, a higher number of instructions correlates with increased computation time and energy usage. Several factors can explain why fewer instructions might still lead to higher time and energy consumption. However, since all benchmarks were compiled using a single thread and with the -O1 optimization level across the three compilers, the observed higher time and energy consumption for the Freqmine benchmark with the IC compiler, despite a lower number of instructions, can be attributed to instruction complexity. At the -O1 level, which focuses on minimizing space with some optimization for execution speed, the IC may generate fewer but more complex instructions. These complex instructions could require more cycles per instruction or involve more resource-intensive operations, such as those affecting memory access or computational intensity. This would explain why the execution time and energy consumption are higher even though the instruction count is lower.
Cholesky and Canneal benchmarks, shown in
Figure 4, illustrate how benchmark characteristics can significantly impact the binary code generated by different compilers. With the same level of compiler optimization (in our case -O1, and unrolling OFF and ON), different compilers generate varying numbers of instructions based on how they handle the characteristics of each benchmark. This fact underscores the importance of choosing the right compiler based on the specific needs of the application. Developers should consider not only the optimization level but also how different compilers interpret and execute the code of specific algorithms.
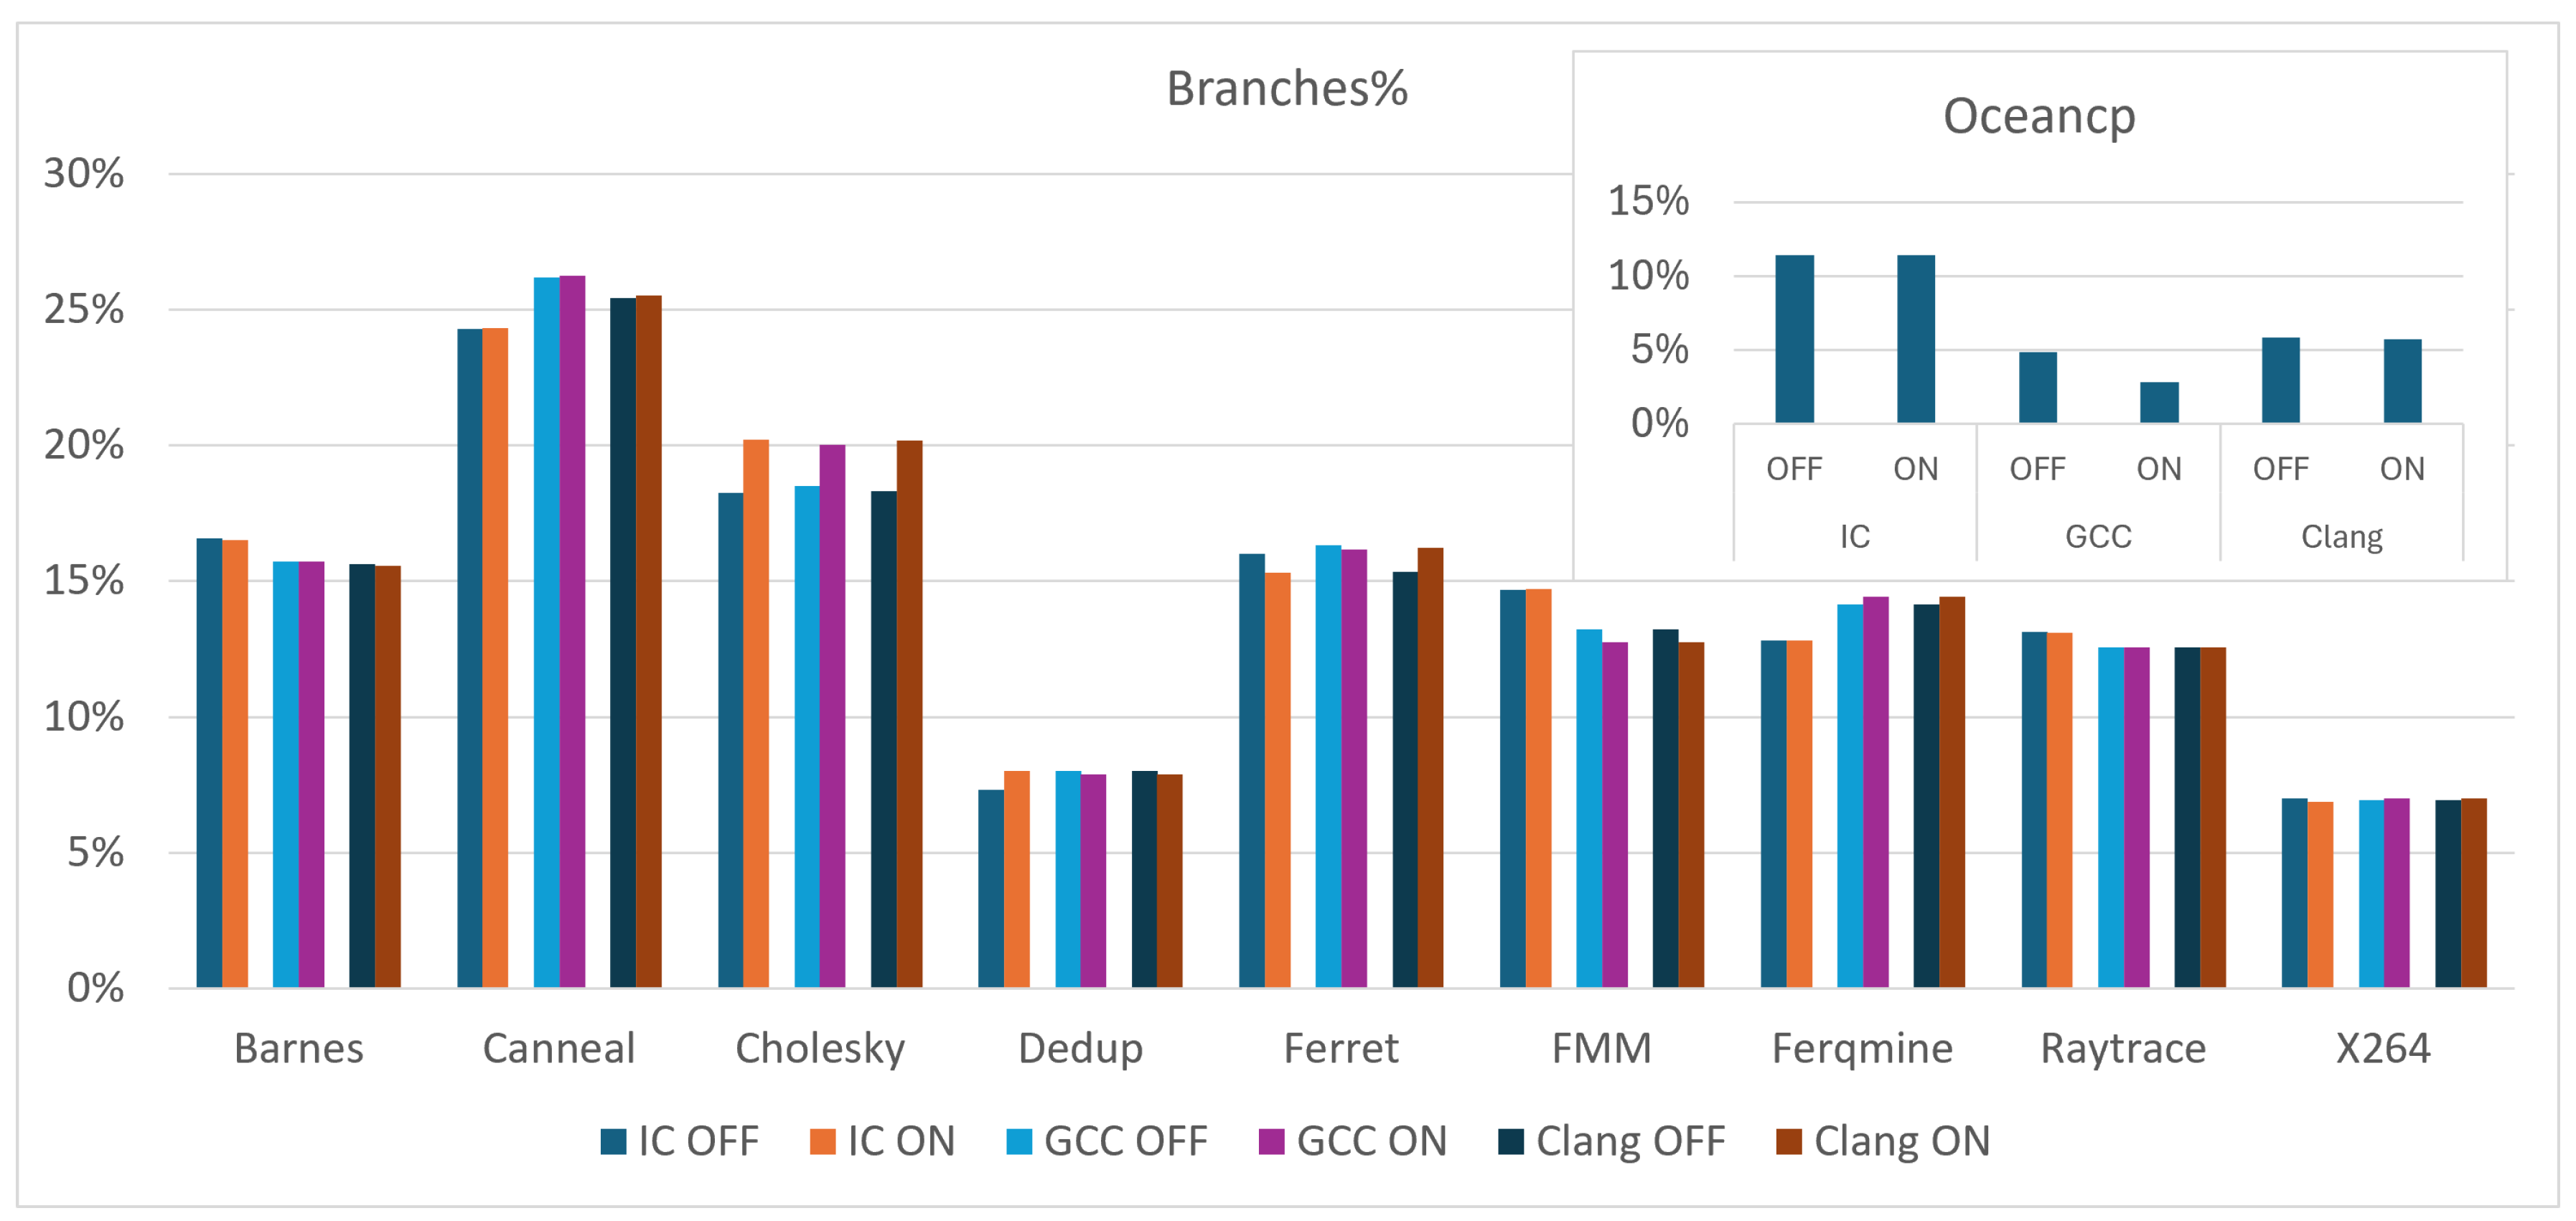
Figure 5 shows the percentage of branch instructions, facilitating comparisons of branch density across benchmarks. Using percentages rather than absolute counts ensures fair comparisons by normalizing differences in execution times and total instruction counts among the 10 benchmarks, thereby preventing scale variances from skewing the analysis.
In 13 out of 30 cases, loop unrolling resulted in an increased percentage of branch instructions, underscoring the significant influence of application characteristics and compiler behavior on the outcomes of unrolling operations. Specifically, of these 13 instances, 7 cases demonstrated different results across compilers, highlighting the variability in compiler behavior during the unrolling process. In contrast, the remaining 6 cases showed consistent results among all three compilers, illustrating the effects of workload characteristics on the outcomes of unrolling.
Loop unrolling often duplicates the loop body to decrease iterations but can lead to additional conditional logic in compilers, especially when iterations do not align with the unrolling factor. This often increases the percentage of branch instructions. Moreover, if the loop already includes branches, unrolling may raise their proportion relative to total instructions, even if the absolute branch count remains constant or rises only slightly.
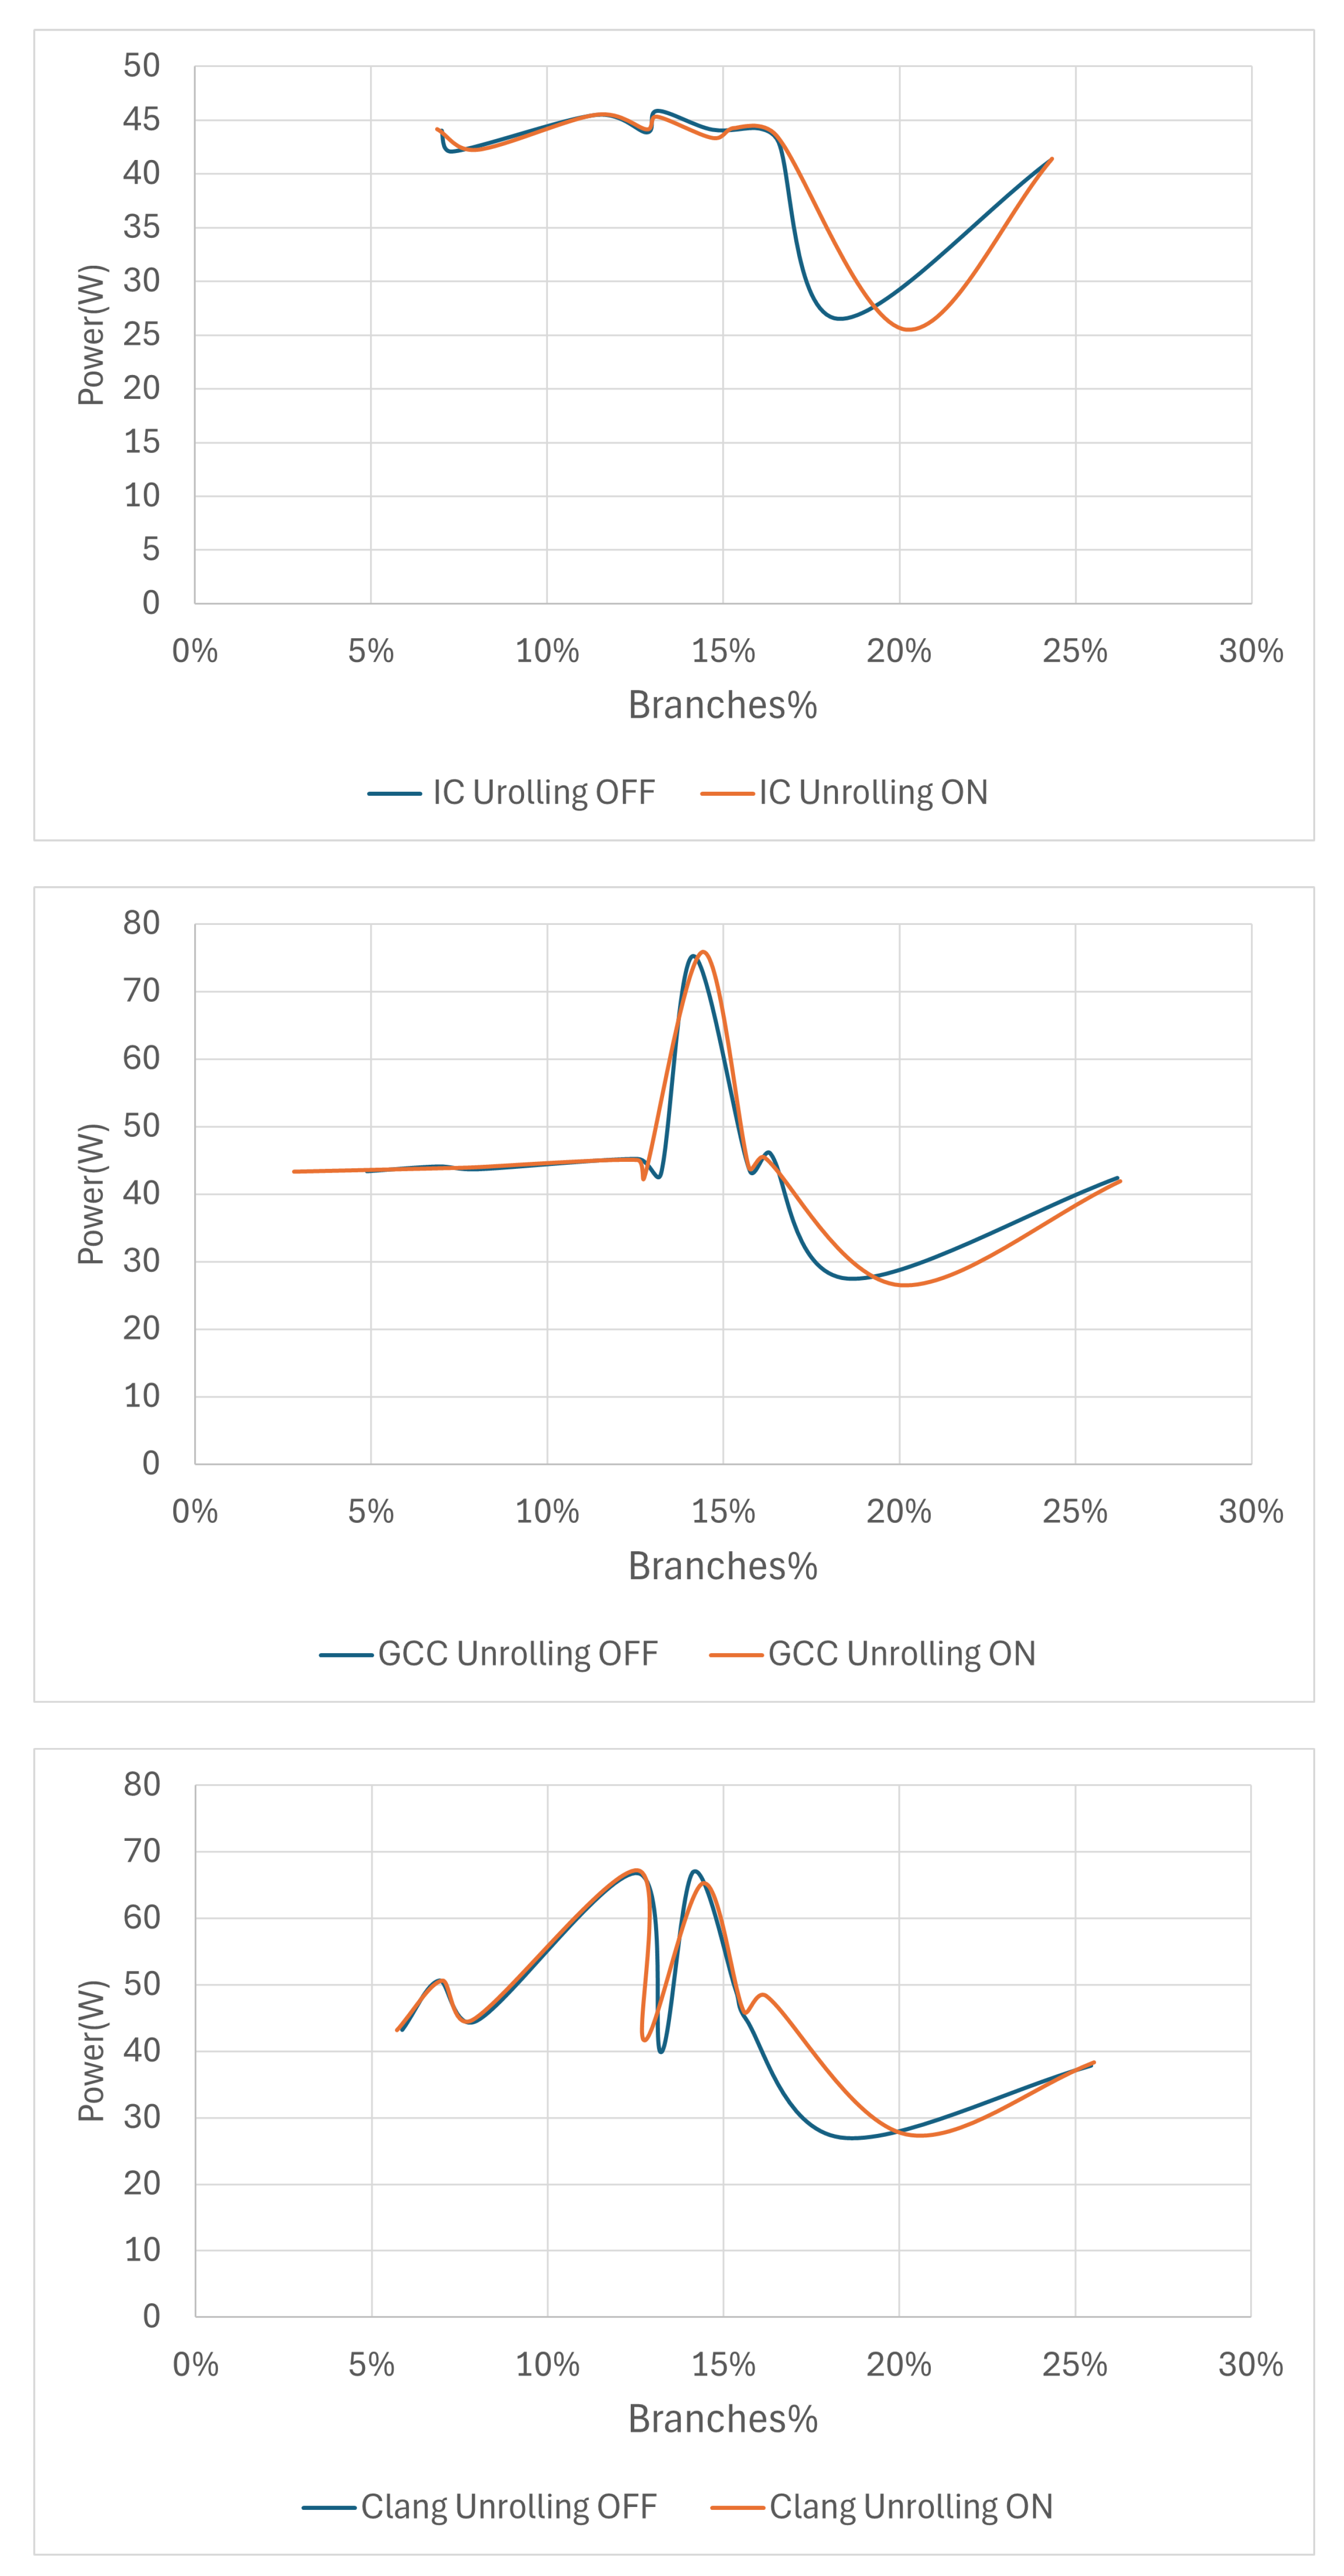
To assess the correlation between the density of branch instructions and power consumption we plotted, as shown in
Figure 6, the branch percentages versus the average power for the 10 benchmarks. As shown in the figures, each compiler exhibits distinct power consumption profiles, which suggests differences in how they implement loop unrolling and manage branch instructions. For the three compilers, power consumption patterns for loop unrolling OFF and ON remain notably similar when the branch percentage is below 16%. However, beyond this threshold, the impact of loop unrolling on power consumption becomes increasingly evident across all three compilers. Across all compilers, the figures indicate that the lowest power consumption occurs at approximately 18% branch density when loop unrolling is disabled, whereas with loop unrolling enabled, the minimum power consumption shifts to around 20% branch density.
Given that all benchmarks were compiled with minimal optimization at the -O1 level, the observed shifts in minimum power consumption across different branch densities with and without loop unrolling can be explained through several facets of how compilers handle optimizations at this basic level. The -O1 optimization level generally focuses on basic optimizations that aim to reduce code size and execution time without a significant increase in compile time. At this level, optimizations that substantially alter the execution flow, such as aggressive loop unrolling, are typically minimal. Therefore, the effects observed when loop unrolling is toggled ON might not be as pronounced as they would be at higher optimization levels (like -O2 or -O3), but they are still significant enough to affect power consumption patterns. Even minimal loop unrolling at this level(-O1) can alter the number of branch instructions and their distribution within the code. The shift in branch density that minimizes power usage from 18% to 20% with unrolling suggests that even subtle changes in the loop structure can impact how efficiently branches are executed, which in turn affects power consumption.
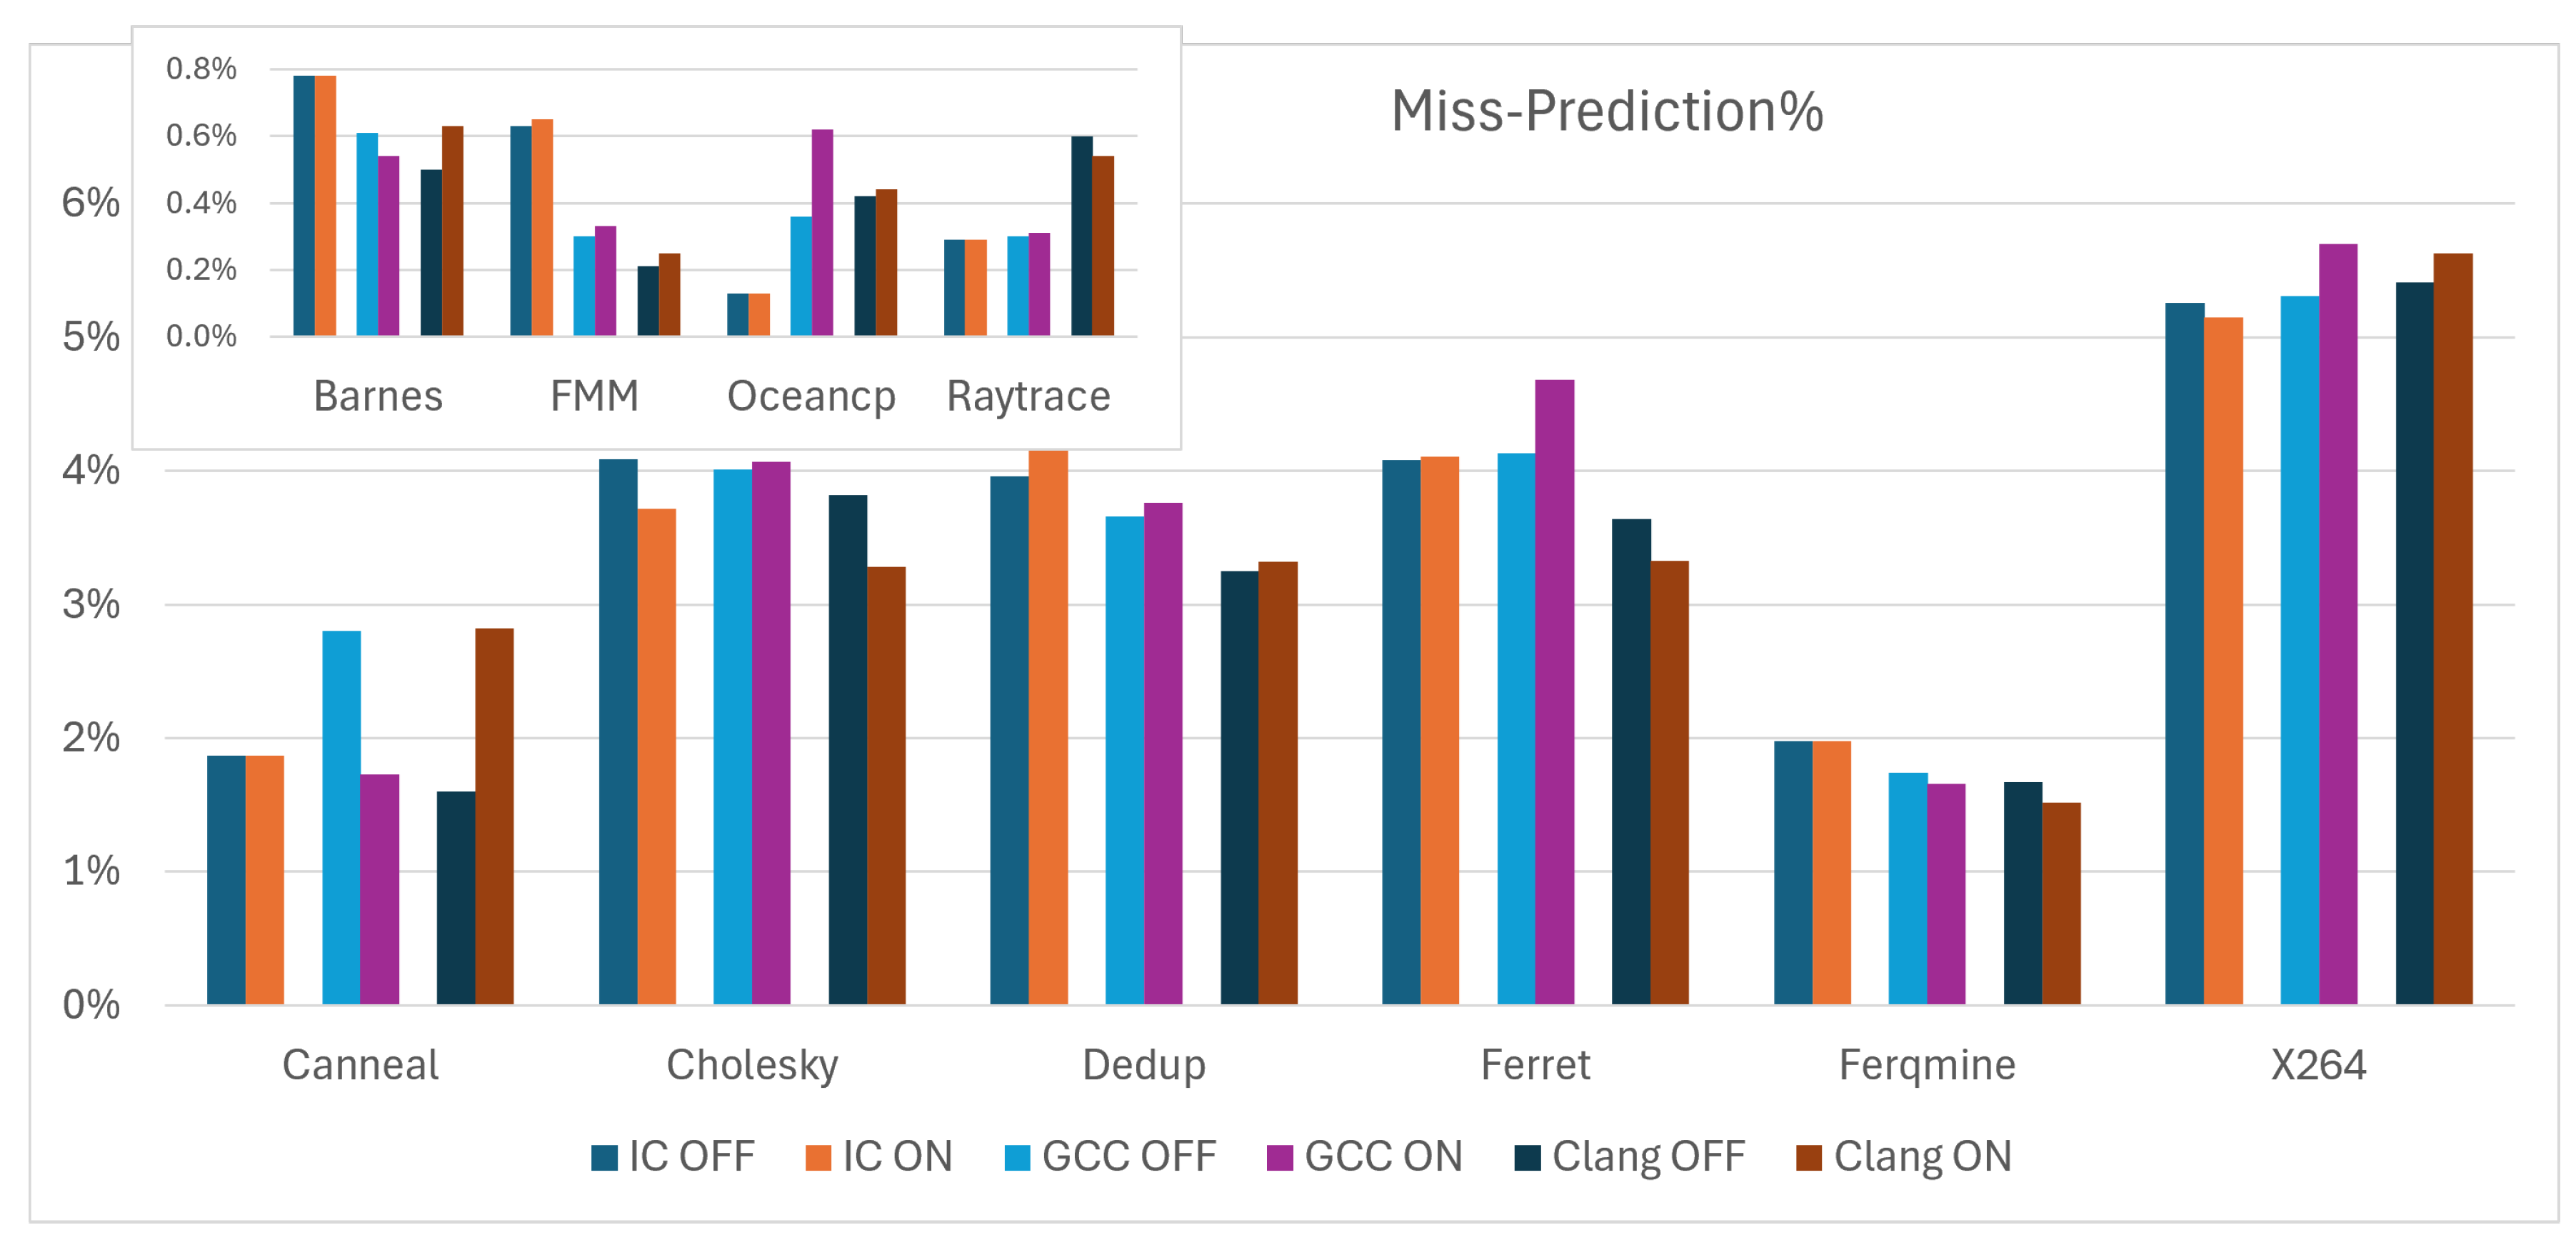
The miss-prediction percentages for each of the ten benchmarks are shown in
Figure 7. The graph shows notable differences in miss-prediction rates between the different compilers and the unrolling settings. This indicates that the branch prediction efficiency and the effectiveness of loop unrolling vary by the compiler and the specific structure of each benchmark. In most cases, loop unrolling increases the miss-prediction rate. IC Compiler shows the lowest differences in miss-prediction between unrolling OFF and ON. In most cases, with the Clang compiler, unrolling increases the miss-prediction rate.
The Canneal benchmarks exhibited significant changes in miss-prediction rates when compiled with GCC and Clang, with the direction of these changes varying inversely with respect to the loop unrolling state for each compiler. The Canneal benchmark itself involves simulated annealing algorithms which can be heavily dependent on conditional logic and potentially irregular data patterns. These characteristics can make the benchmark particularly sensitive to how branches are managed by the compiler, especially when structural changes are made through optimizations like loop unrolling.
5.2. Spectre Mitigations Data Exploration
In this section, the collected data from the 10 benchmarks are explored when Spectre V1 and V2 mitigation techniques are applied. A discussion of these data is provided in the next section.
5.2.1. Spectre Variant 1 Mitigations
Spectre V1 mitigation techniques are applied by IC and Clang compilers (No direct Spectre V1 mitigation flag is available in the GCC compiler).
The two strategies CCBM and SLD represent two approaches, by IC and Clang compilers respectively, to mitigate vulnerabilities related to the Spectre V1. Depending on the compiler version and the underlying architecture, CCBM implementation uses serializing instructions like lfence which act to ensure that all loads and stores are completed as seen by the processor before any subsequent instruction is executed. SLD strategy makes the compiler insert additional code around load operations that could potentially be used in a speculative execution attack. This hardening is generally implemented by ensuring that any data loaded speculatively cannot be used until it has been verified that the speculative path taken was correct. If the path is incorrect, the effects of the speculative execution are discarded.
Since CCBM applies a broad remedy to all conditional branches due to its universal application of the mitigation technique, while SLD is more focused on specific load operations that might be exploited, we expect CCBM to affect performance more than SLD.
The TPM is an IC compiler strategy specifically designed to mitigate Spectre V1 vulnerabilities by applying fixes based on identified vulnerable patterns in the code. It is programmed to recognize certain code patterns that are known to be susceptible to Spectre V1 attacks.
While CCBM and TPM concentrate on conditional branches, SLD adds protective layers around load operations to ensure that any data loaded speculatively cannot be used in a way that reveals sensitive information until it has been validated that the speculative path taken was correct and safe. So TPM is expected to have the lowest performance impact among the three mitigation strategies.
Table 6,
Table 7,
Table 8,
Table 9 and
Table 10 explore the data of energy, execution time, and number of instructions, respectively, for the 10 benchmarks when compiler-applied Spectre V1 mitigation techniques are in effect.
When the Spectre V1 PoC code is compiled using all the available strategies designed to mitigate Spectre V1 in both the IC and Clang compilers, the secret is completely hidden. This indicates that all mitigation strategies provide the same level of security effectiveness. This can be explained by the fact that the PoC code contains well-known vulnerabilities, allowing all strategies—whether comprehensive or targeted—to achieve the same level of security effectiveness.
5.2.2. Spectre Variant 2 Mitigations
Table 9,
Table 10 and
Table 11 present data, of the same metrics, for the 10 benchmarks under compiler-applied Spectre V2 mitigation techniques. We can categorize these data, based on the specific aspects they target, as follows:
IBIT and IBET strategies that mitigate vulnerabilities in indirect branches.
FCIT and FCET strategies that are designed to secure direct function calls.
FRIT strategy that focuses on securing function returns.
RT and RTET strategies that offer broader protection against speculative execution through multiple aspects of function handling.
The data are ordered in every table according to this categorization.
5.3. Mitigation Data Discussion
In this subsection, we discuss and justify the collected data when Spectre V1 and V2 mitigations are applied compared to the baseline data discussed in
Section 5.1. Our comparative analysis method calculates the percentage deviation of metric data collected after the implementation of mitigation techniques from their corresponding baseline values. This approach expresses the difference as a percentage, thereby providing a normalized measure of the impact. This normalization facilitates comparisons across datasets of varying scales and offers a clear view of the relative impact of the mitigations across these different datasets.
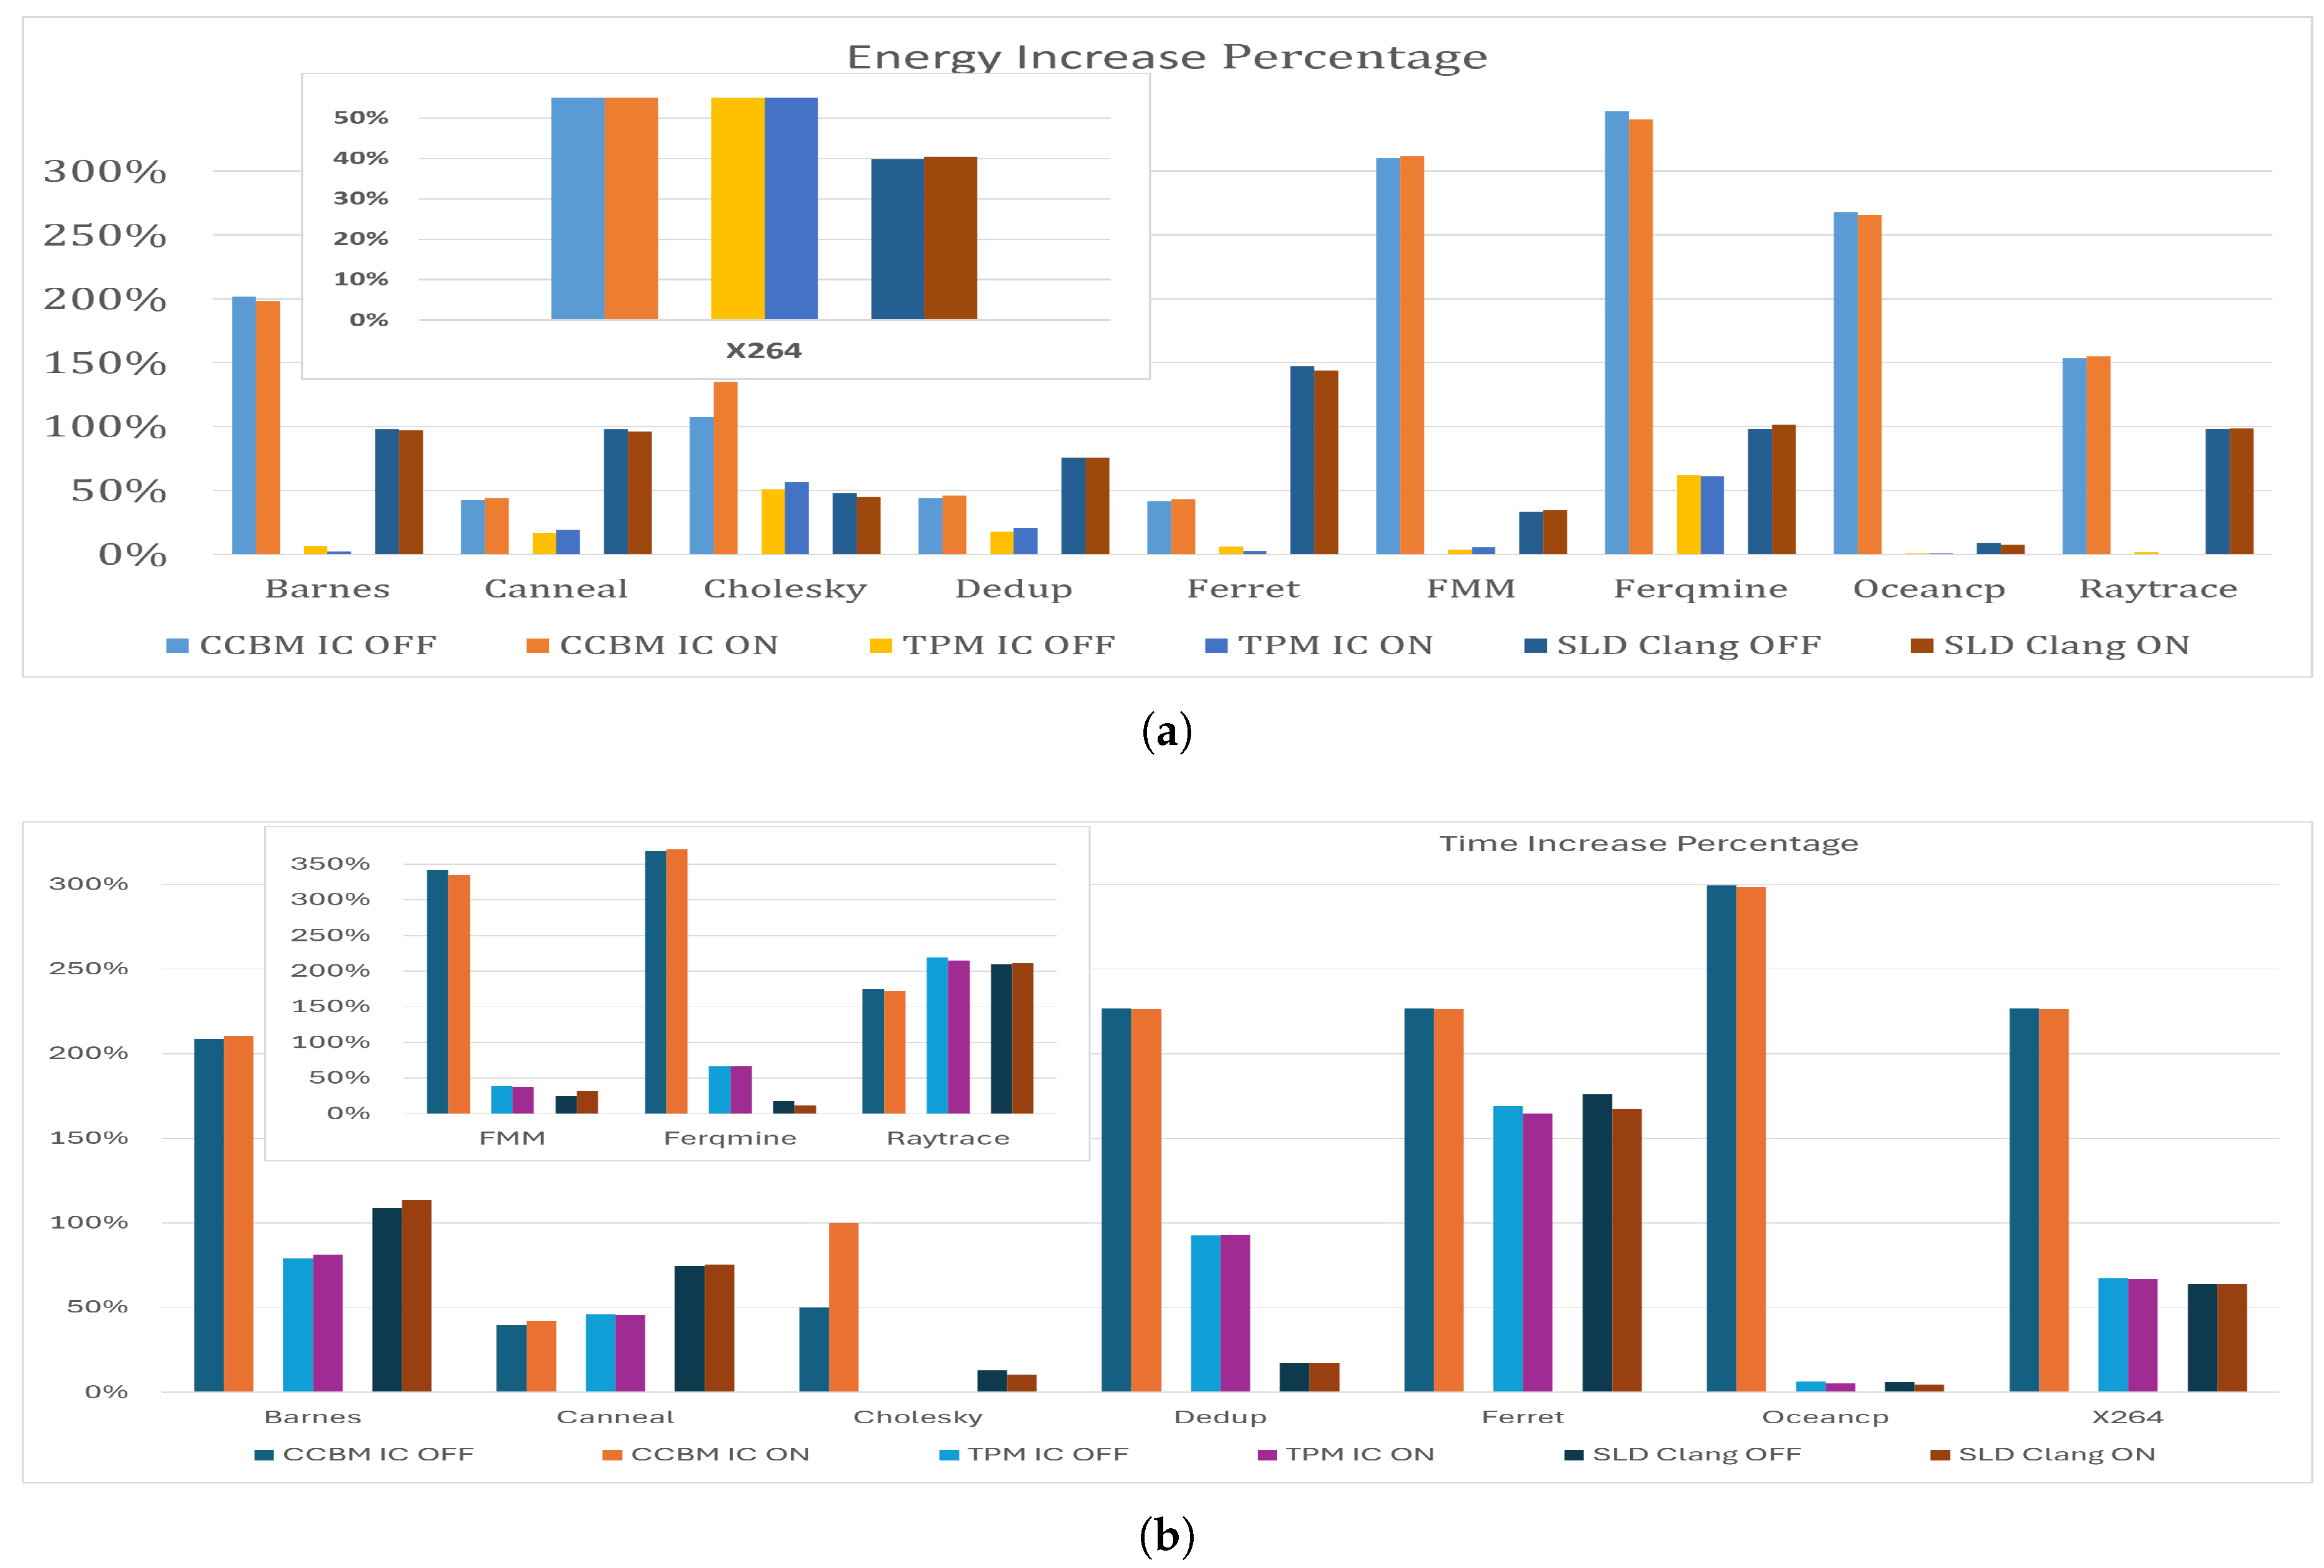
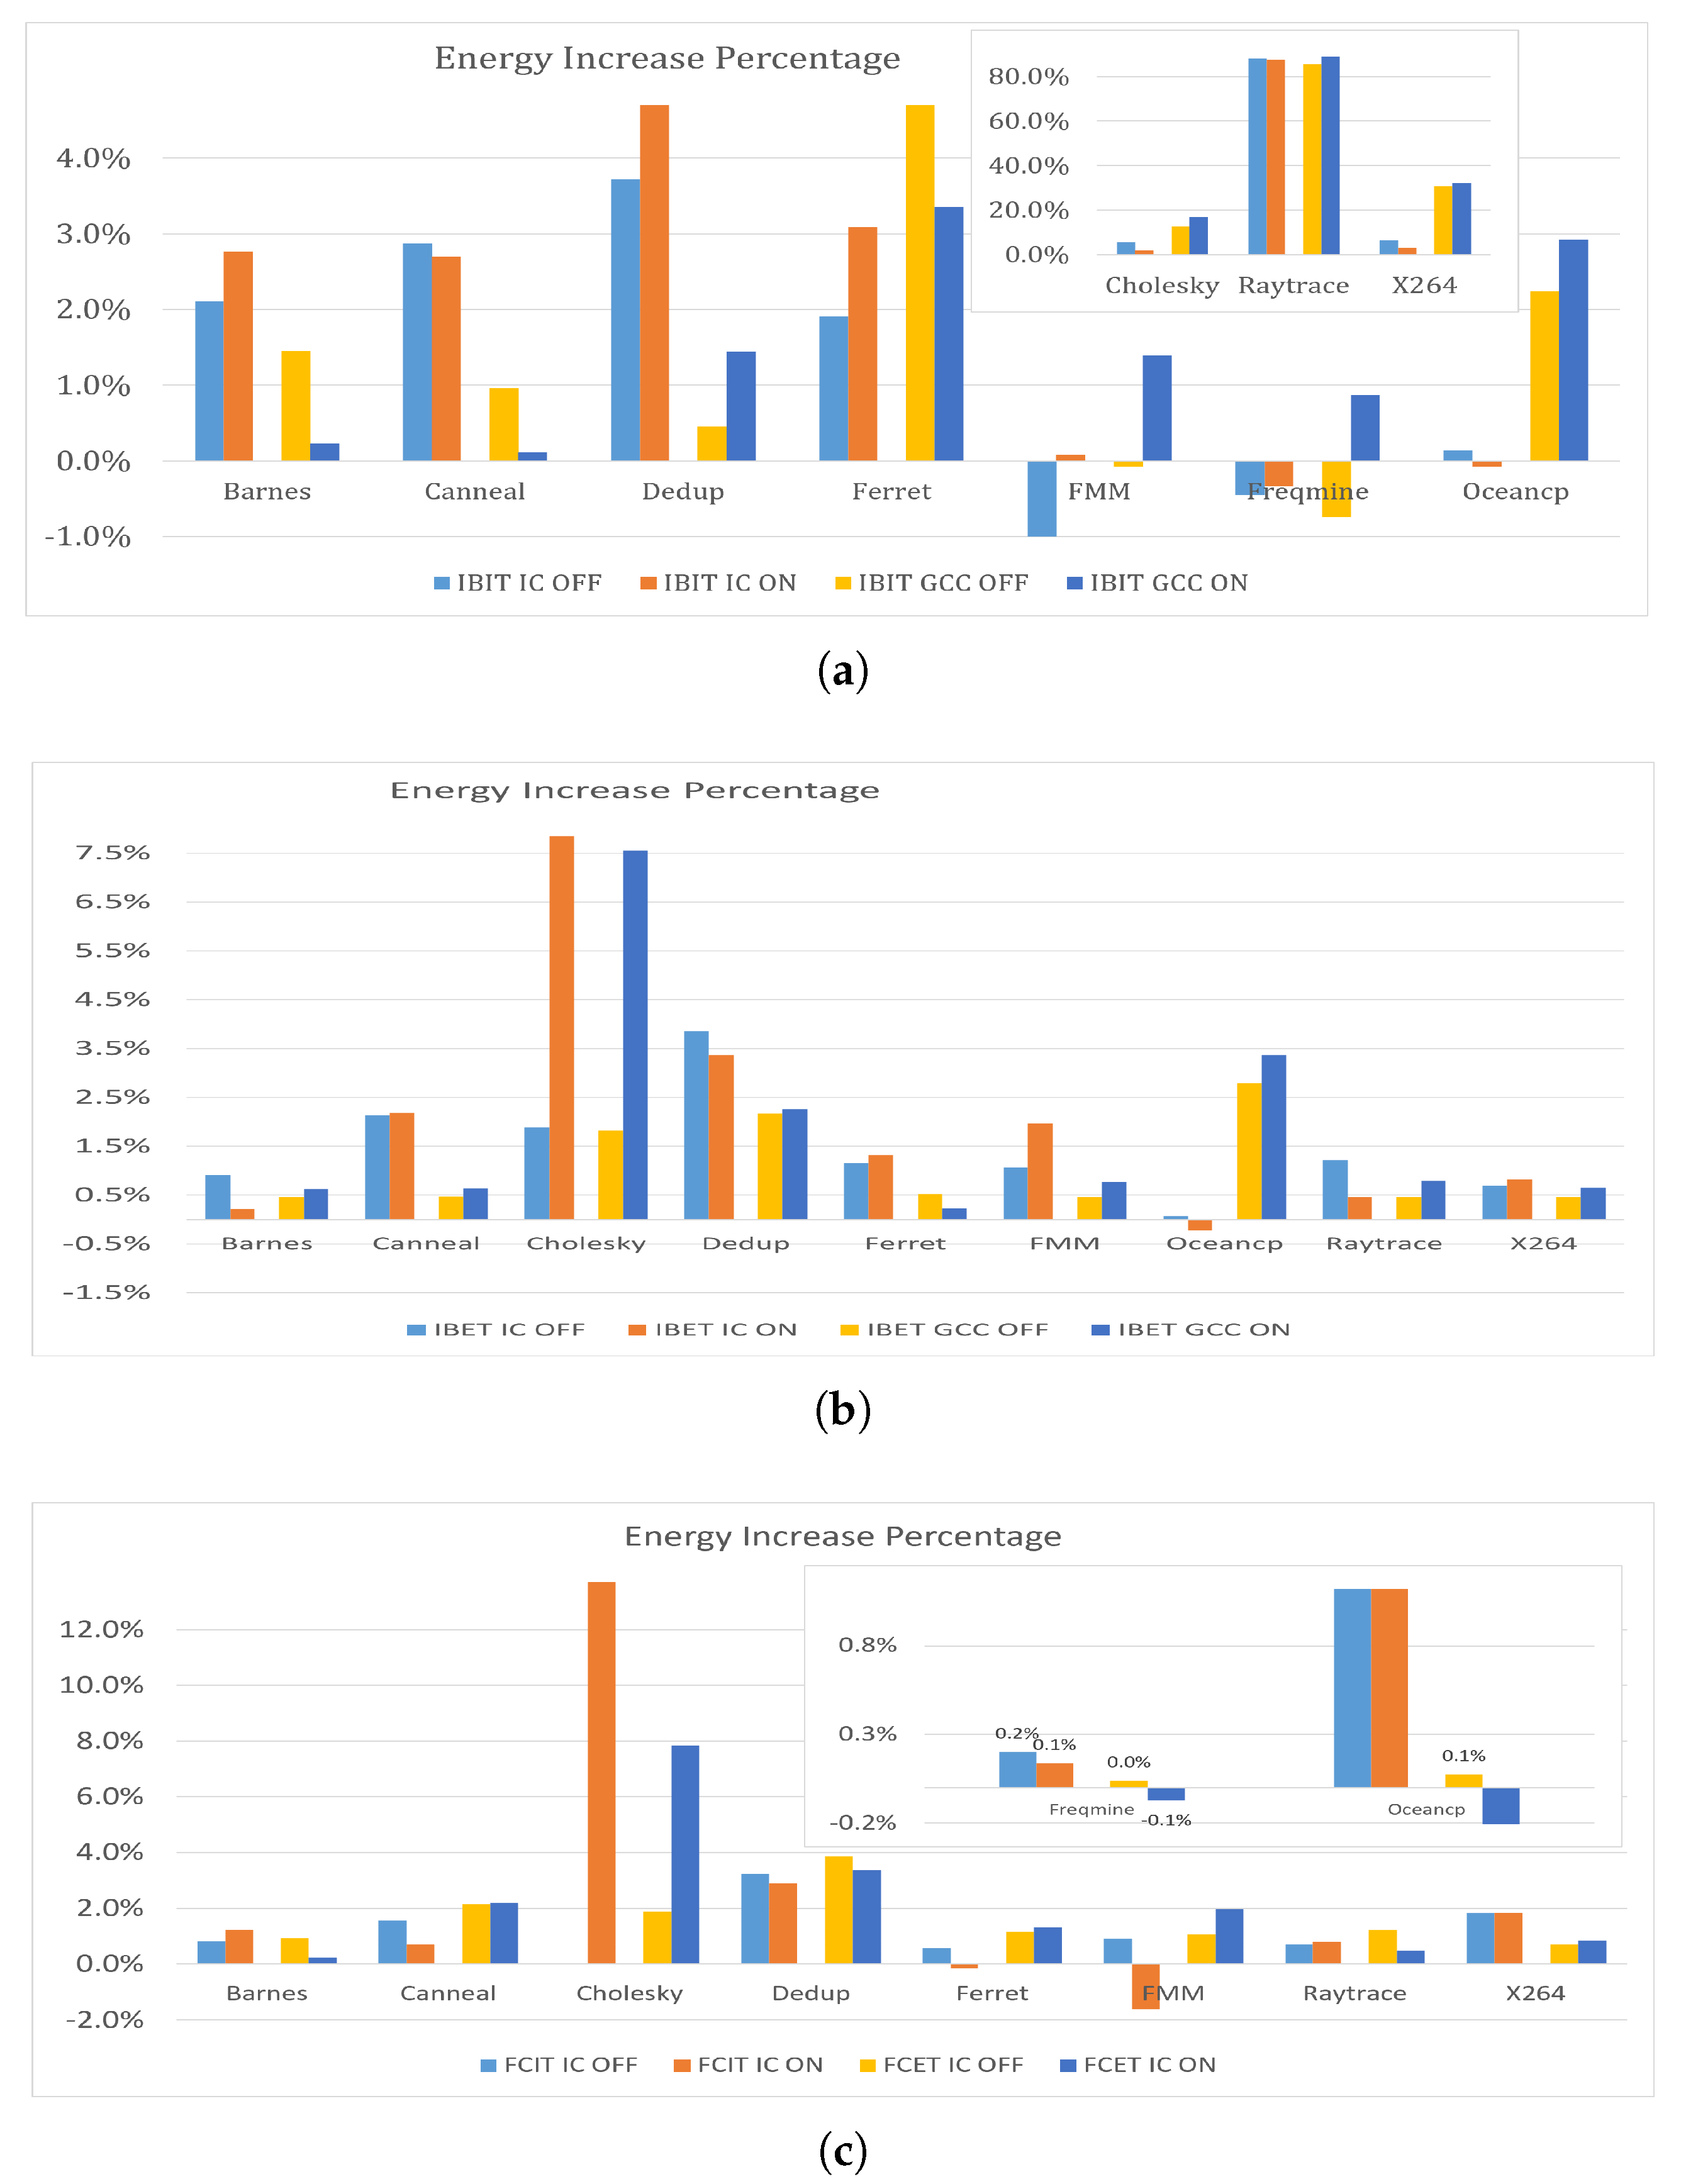
Figure 8 shows the percentage increase in energy consumption and execution times across various benchmarks when Spectre V1 mitigations (CCBM, TPM, and SLD) are applied, using IC and Clang compilers, compared the no-mitigations scenario.
The CCBM mitigation is characterized by its comprehensive application to all conditional branches, which results in significant energy consumption increases across various benchmarks. The increases range from 41.7% to 347.0%, with an average of 165.7%. CCBM also leads to considerable increases in execution times, ranging from 39.61% to 371.33%, with an average of 218.58%. The high energy consumption and execution time underscore the intensive nature of the broad security fixes applied by CCBM. In contrast, TPM targets specific vulnerable patterns, leading to a generally lower increase in energy consumption. The ranges are much narrower and lower, from 0.3% to 152.5%, with an average increase of 32.1%. It also shows a more moderate impact on execution times, ranging from 0.00% to 219.36%, with an average increase of 78.05%. This approach indicates a more energy and time optimization strategy that enhances security without excessively taxing the system’s efficiency.
The SLD strategy, which hardens speculative load operations, exhibits a wide variance in its impact on energy consumption, ranging from 7.7% to 147.2%, with an average of 74.4%. Similar to its impact on energy, SLD impacts execution times with increases ranging from 4.50% to 211.14%, averaging 70.83%. While generally moderate, the impact on execution times can vary significantly depending on the specific application, suggesting a need to consider the application in use. In terms of security, SLD might generally be considered more secure than TPM due to its broader approach to mitigating speculative execution risks, especially in scenarios involving complex attacks that exploit speculative data loads. However, TPM is highly effective for known patterns.
The percentage increase in the number of instructions varies significantly among the mitigation strategies applied. When CCBM is implemented, the increase ranges from 0% to 148.5%, with an average of 29.4%. In contrast, TPM results in a change that ranges from a decrease of 1.6% to an increase of 3.8%, with an average increase of 0.8%. Meanwhile, SLD leads to a range from a decrease of 2.2% to an increase of 137.2%, with an average increase of 48%. Notably, the application of TPM and SLD results in a reduction in the number of instructions for some benchmarks, indicating a potential optimization or more efficient code execution under these strategies.
Given that all benchmarks were compiled with -O1 optimization level and the single-threaded option, there are specific implications for how Spectre V1 mitigations impact the number of instructions. At this level of optimization, the compiler attempts to reduce code size and execution time without performing extensive optimizations that might obscure the flow of control within the code. This level is likely to preserve more of the original structure of the code, which can help in clearly implementing and understanding the mitigations but might not aggressively increase the number of instructions. Sequential compilation optimizes for single-threaded execution, which can simplify the implementation of Spectre mitigations by focusing on a linear execution path. However, this might lead to a more straightforward insertion of security checks and barriers without the complex interactions of multi-threaded optimizations.
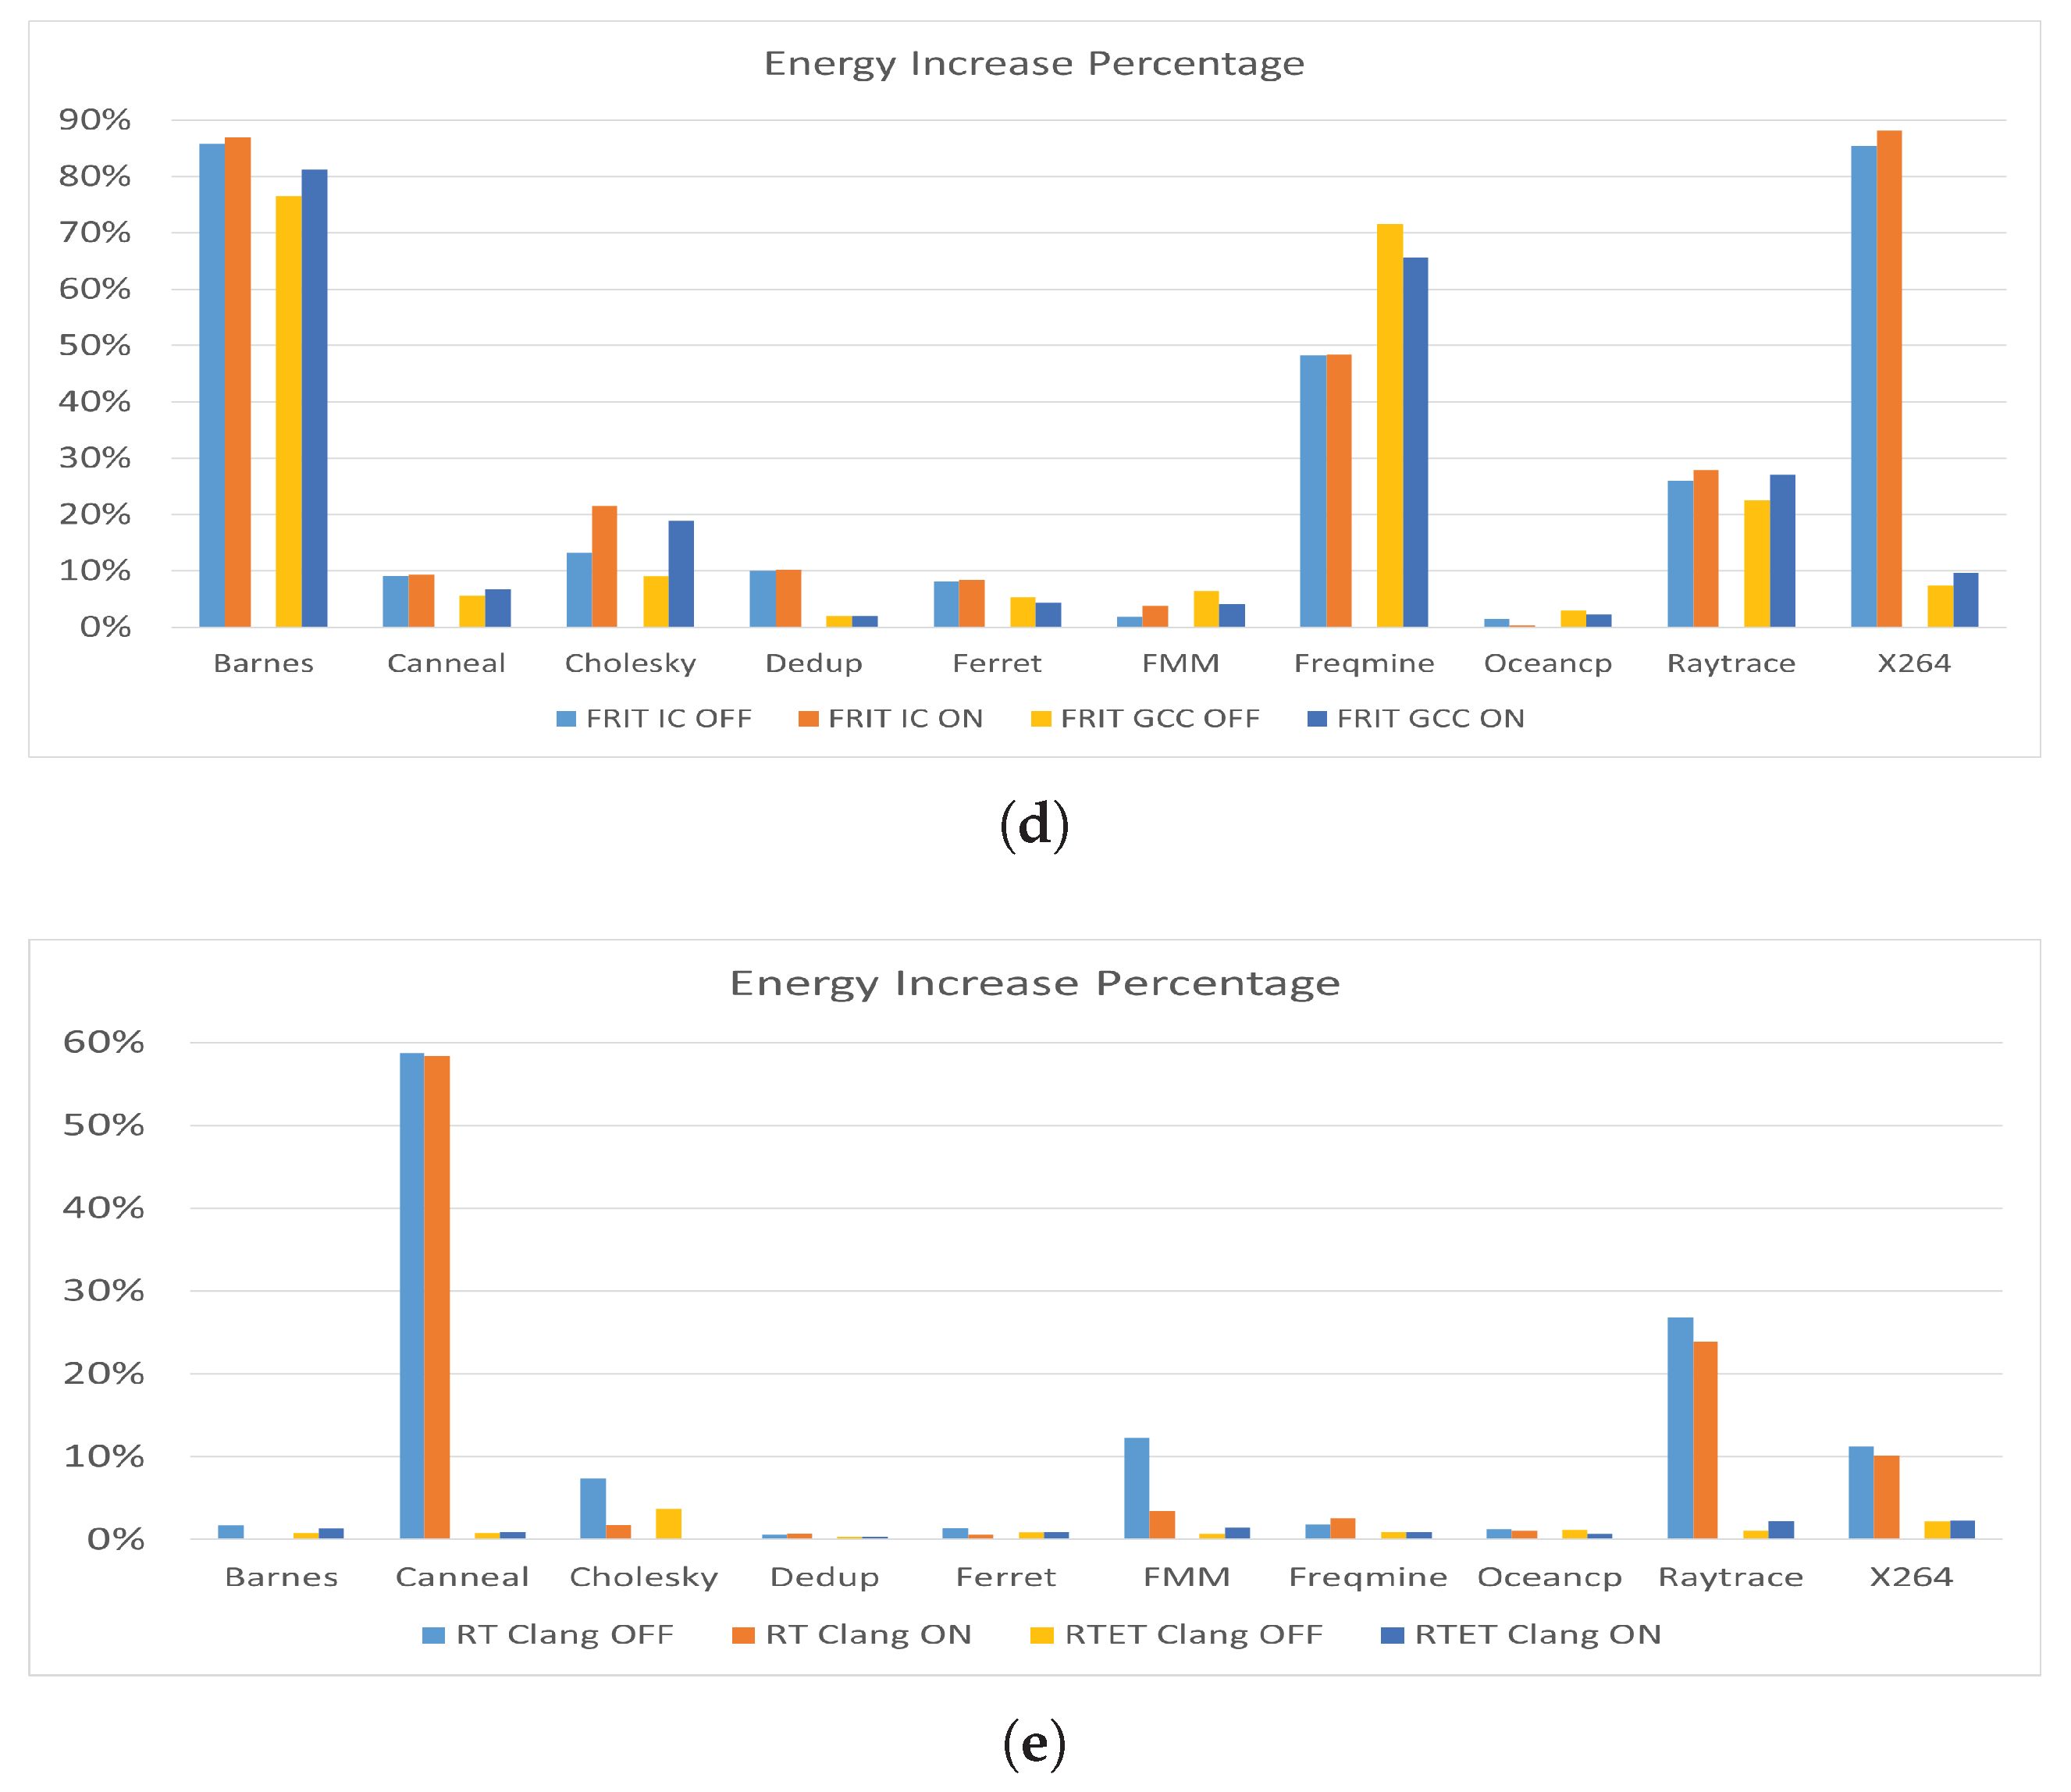
Figure illustrates the energy impact of applying Spectre V2 mitigations across the benchmarks. On average, the implementation of these mitigations results in a 10.4% increase in energy consumption. Notably, in certain instances, the application of specific mitigations has enhanced energy efficiency. For example, the use of the IBIT mitigation with the FMM and Freqmine benchmarks has led to improved energy consumption, demonstrating that the effects of these mitigations can vary significantly depending on the specific benchmark and mitigation technique employed. The fact that some benchmarks show improved energy consumption under certain mitigations indeed suggests that these mitigations could incorporate optimizations that not only secure the processor against speculative execution attacks but also enhance overall execution efficiency.
Spectre V2 mitigations can often be more contained and selectively applied, potentially leading to less disruption in overall system performance compared to the broader and more invasive mitigations required for Spectre V1. This can explain why Spectre V2 might be perceived as having a lesser impact than Spectre V1.
The observation that loop unrolling leads to an increase in energy consumption in the majority of cases, both when Spectre V1 and V2 mitigations are applied and when no mitigations are present, provides important insights into the inherent effects of loop unrolling on energy usage, independent of security measures. These data suggest that the process of loop unrolling itself, while potentially improving execution efficiency under certain conditions, can inherently increase energy demands.
Table 12 presents the power percentage increase or decrease when different Spectre V1 and V2 mitigation strategies are applied across the 10 benchmarks. Generally, there is a significant decrease in average power in about half of the cases, reaching up to -75% as observed with the CCBM strategy, with an average reduction of -11%. Conversely, in the other half of the cases, there is an increase in average power, averaging 1% with the TPM strategy when omitting Cholesky and X264 as outlier values. The highest decrease with the CCBM strategy can be explained by the nature of the lfence instruction used in the CCBM strategy. This instruction causes the CPU to wait until all previous instructions been completed before executing the next one, which can create pipeline bubbles, leading to idle cycles where the CPU is not performing useful work. This waiting period reduces the CPU’s instantaneous power usage. Thus, while the power draw at any given moment may be lower, the prolonged duration of operation results in higher cumulative energy consumption. The IBET strategy follows CCBM in terms of power reduction. This can be justified by the nature of the IBET strategy, which uses external thunks for indirect branches to mitigate Spectre V2, acting as a barrier to speculative execution. Similarly, the SLD strategy also contributes to power reduction, as it inserts additional code around load operations to limit speculative execution. Speculative execution, even though it increases instantaneous power, ultimately saves total energy consumption. This highlights the importance of speculative execution in saving energy, as the increase in instantaneous power is offset by the reduction in execution time. However, speculative execution compromises security, despite enhancing energy and time efficiency. This supports the hypothesis that improvements in one or two dimensions of energy, performance, and security typically result in a compromise in the other one or two dimensions.
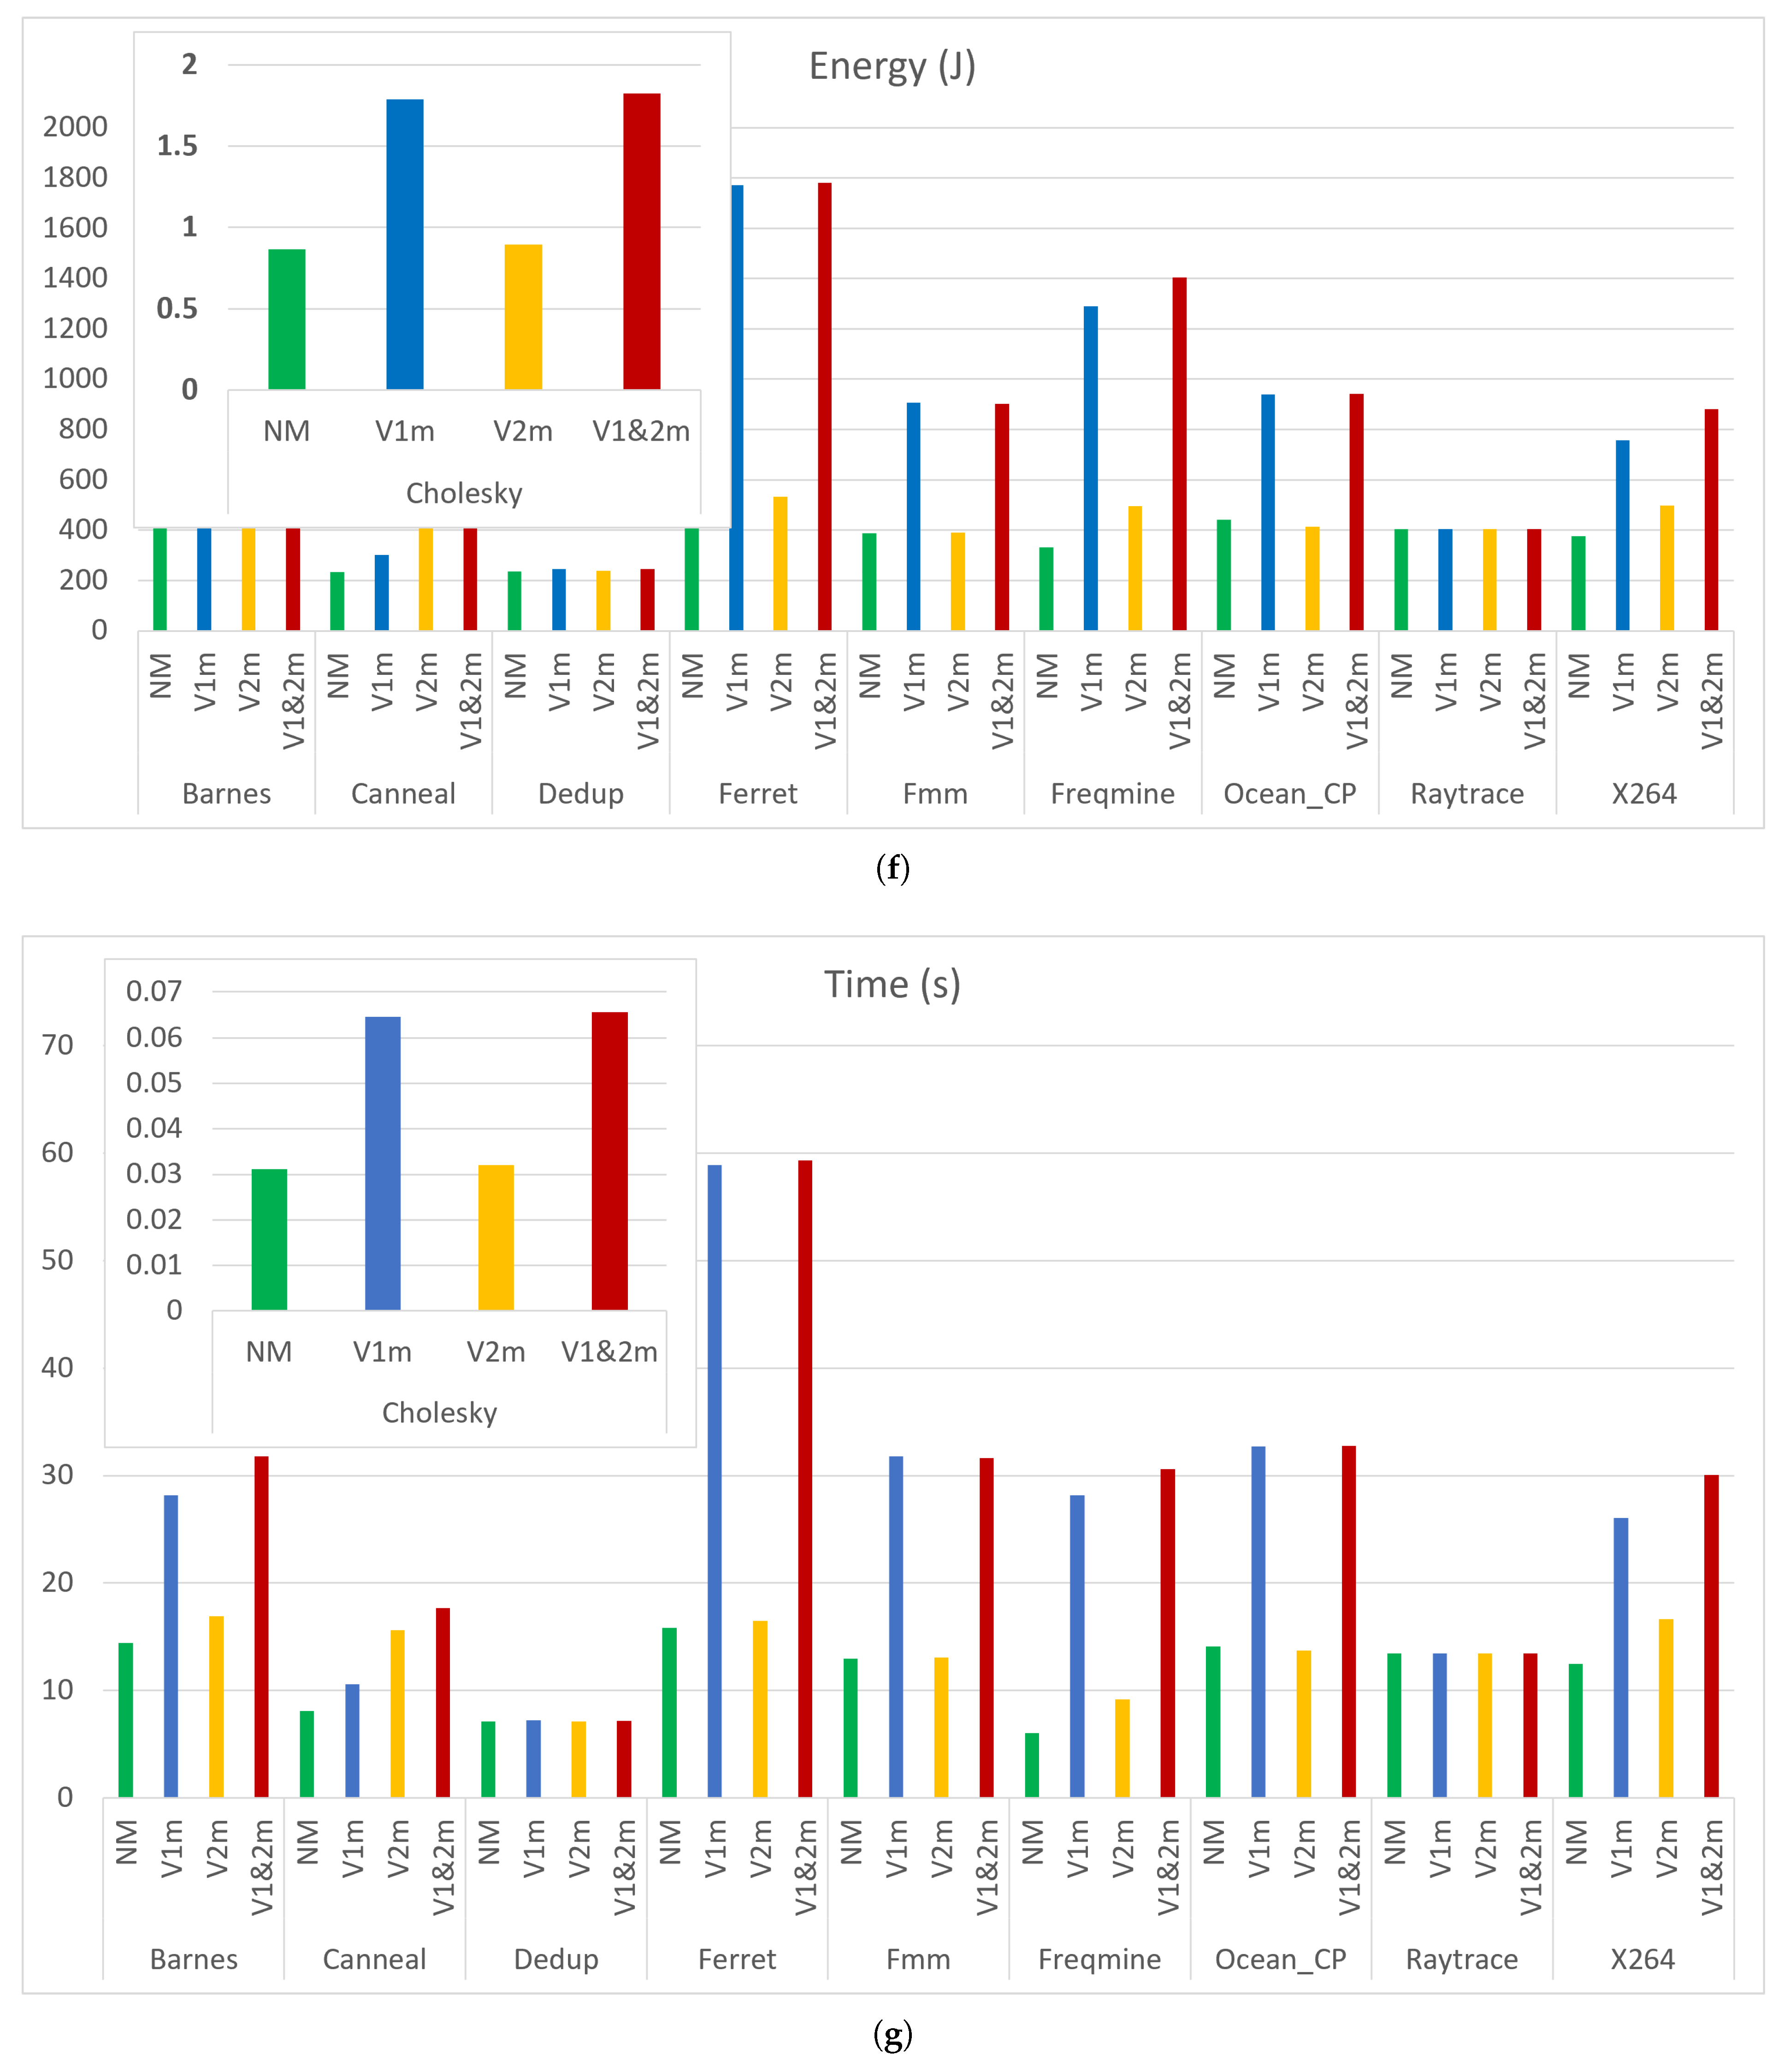
To assess how Spectre V1 and V2 mitigations interact and affect system efficiency when they are applied together, we compiled the 10 benchmarks, using IC compiler, under four different scenarios: no-mitigation, Spectre V1 mitigation only (CCBM), Spectre V2 mitigation only (IBIT) and, combined Spectre V1 and V2 mitigations (CCBM & IBIT). To eliminate any confounding variables related to compiler optimizations that could distort the results, all benchmarks were compiled with zero optimization level (-O0). This ensures that the results are purely reflective of the mitigation techniques’ impacts, without any enhancements or complications introduced by compiler optimizations. The results are shown in
Figure 10 and
Table 13 illustrate the interaction percentages in time and energy. The interaction percentages are relatively small, with none exceeding 3.77% in absolute value. That means the combined mitigations behave in a mostly additive manner, with only slight enhancements or reductions in their impacts.
5.4. Summary of Findings
This subsection summarizes the main findings in this paper.
Generally, there is a correlation between energy consumption and execution time. Benchmarks that take longer to execute also tend to consume more energy.
Even though disabling loop unrolling engages additional components such as DBP, enabling loop unrolling generally results in higher energy consumption because it demands more immediate CPU resources, leading to bursts of intensive computation that temporarily raise power usage. Furthermore, the larger code size from unrolled loops can lead to increased cache usage and more cache misses, which are costly in terms of energy consumption.
The cumulative data indicates that the IC Compiler yields the highest total time and energy consumption, Clang delivers the lowest total execution time, while GCC achieves the lowest total energy consumption.
The cumulative data, also, indicates that enabling loop unrolling generally results in higher energy consumption but reduces the overall execution time. This suggests that while loop unrolling can optimize performance by decreasing runtime, it may also increase the energy demands of the processes.
Different benchmarks exhibit varying responses to loop unrolling.
Different compilers and loop unrolling settings can lead to significant variations in energy consumption, highlighting the importance of selecting the appropriate compiler and optimization settings tailored to the specific computational tasks of an application to ensure optimal performance and energy efficiency.
There are only slight differences in the number of instructions executed among the three compilers and shows minimal differences between cases with and without loop unrolling, generally favoring the scenario where unrolling is enabled.
Typically, a higher number of instructions correlates with increased computation time and energy usage. However, a compiler may generate fewer but more complex instructions which could require more cycles per instruction or involve more resource-intensive operations.
Developers should consider not only the compiler optimization level but also how different compilers interpret and execute the code of specific algorithms because load characteristics can significantly impact the binary code generated by different compilers.
Loop unrolling affects the branch instructions percentage depending on the compiler type behavior and workload characteristics.
During the unrolling process, compilers may introduce additional conditional logic to handle edge cases which can increase the total percentage of branch instructions.
When a loop contains branch instructions, unrolling it multiple times increases the total percentage of branch instructions due to the repetition of these branches.
Even minimal loop unrolling can alter the number of branch instructions and their distribution within the code which in turn affects power consumption.
In most cases, loop unrolling increases the miss-prediction rate.
When Spectre V1 mitigation is applied, the CCBM strategy, which applies the mitigation to all conditional branches, results in the highest increase in energy consumption and execution times compared to SLD and TPM.
The TPM strategy results in the lowest energy consumption and execution times among the three Spectre V1 mitigation strategies, as it specifically targets only the code patterns vulnerable to Spectre V1 attacks, making it highly effective for known patterns.
The number of instructions generally increases with the three Spectre V1 strategies. However, TPM and SLD result in a reduction in the number of instructions for some benchmarks, indicating potential optimization is applied under these strategies.
Spectre V2 mitigations are less aggressive than Spectre V1 mitigations in terms of energy consumption and execution times because they are more contained and selectively applied, compared to the broader and more invasive mitigations required for Spectre V1.
Loop unrolling increases energy consumption in most cases, regardless of whether Spectre V1 and V2 mitigations are applied or not, highlighting its inherent impact on energy usage independent of security measures.
When Spectre V1 and V2 mitigations are applied together, they generally exhibit additive behavior.
Even though applying Spectre mitigations increases energy consumption and execution time, it reduces the average power in about half of the cases. This is because Spectre mitigations limit speculative execution in various ways. This finding underscores the significance of speculative execution in conserving energy, as the increase in instantaneous power that accompanies speculative execution is offset by the reduction in execution time.
6. Conclusions
In computing systems, the relationship between performance based on time, energy (in total or as rates of consumption), and security may generally be represented as a triangle with a fixed area, meaning that any enhancement in one or two dimensions typically results in a compromise in the other one or two dimensions. This hypothesis remains valid, as seen across the architectures of modern CPUs. Components designed to improve performance, such as cache memory and branch predictors, have become security vulnerabilities prone to exploitation. They can and, sometimes, are used to reveal sensitive information, especially in high-volume servers with valuable workloads.
The performance enhancements at both the hardware and software levels lead to security compromises. One of the results of this study further supports this view, as illustrated by the improvements arising from compiler unrolling optimization. They enhanced the speed but, even at the lowest possible optimization level (-O1), at the same time, increased energy consumption.
This research comprehensively investigates this balance by examining the energy implications of various Spectre V1 and V2 mitigation strategies on performance and security. Through this investigation, we aim to highlight the trade-offs in implementing security measures and how these affect power consumption and execution time. The findings underscore the need for optimized mitigation techniques that minimize power and energy overhead while ensuring robust protection against side-channel vulnerabilities.
The cumulative results from the no-mitigation case indicate that the Clang compiler delivers the lowest total execution time, while the GCC compiler achieves the lowest total energy consumption. However, the performance and energy efficiency resulting from the compilers varied significantly from one benchmark to the other. This finding underscores the importance of selecting the appropriate compiler tailored to the specific computational tasks of an application to ensure optimal performance and energy efficiency. To understand why one compiler outperforms another at the benchmark level, researchers need to conduct more detailed analyses of the benchmarks at the basic software unit levels, such as algorithms, data structures, control flow constructs, and memory access patterns. In particular, those that contribute to generating branches. This analysis would provide compiler developers with the guidance they need to extract optimal power efficiency on top of performance.
The study results indicate that comprehensive mitigation processes, such as the CCBM strategy, impose high costs on systems in terms of energy consumption and performance. In contrast, mitigations like the TPM strategy that only targets the code patterns vulnerable to side-channel attacks are highly effective for known patterns. It would also explain why Spectre V2 mitigations, compared to Spectre V1 ones, are less aggressive in energy consumption and execution times. Spectre V2 mitigations are more contained and selectively applied, whereas Spectre V1 requires broader and more invasive mitigations. Therefore, compiler developers must enhance the ability to detect these vulnerable code patterns and apply targeted mitigations to specific regions in the code.
The results also indicate that a compiler, in an attempt to optimize code size, may generate fewer but more complex instructions, as observed with the Freqmine benchmark. These complex instructions could require more cycles per instruction or involve more resource-intensive operations, leading to increased energy consumption and a degradation in performance. Compiler developers should be aware of this potential trade-off to ensure that optimization strategies do not inadvertently compromise overall system efficiency.
By exploring these diverse applications, our research not only broadens the understanding of Spectre mitigation strategies but also emphasizes the universal need for balancing security with energy efficiency across various technological domains. This broader perspective enhances the relevance and impact of our findings, providing a foundational framework that can influence future security protocols and energy management practices in the evolving landscape of computing technologies.
This study’s findings can be applied to diverse computing environments, including IoT, mobile devices, cloud computing, and embedded systems. Modern CPUs rely on speculative execution as a fundamental feature, with branch instructions constituting a significant portion of workloads. Implementing effective mitigation strategies can achieve significant power savings at the CPU level. When aggregated across processors, these savings can drive substantial improvements in energy efficiency at larger scales, including clusters, data centers, and large-scale HPC environments.
A limitation of the study was the lack of precise tools for assessing the effectiveness of mitigation measures directly on the benchmarks themselves. The researchers employed a proof of concept, which provided some indications of the mitigation’s efficiency. However, this approach did not allow for a thorough evaluation, particularly when comparing different Spectre mitigation strategies. As a result, our understanding of the relative effectiveness of these strategies remains somewhat limited.
For future work, in addition to compiler-based, researchers can extend this investigation to other types of mitigations for the Spectre family of vulnerabilities, such as those incorporated in the operating system and the microcode. These strategies differ in their cost of implementation and operation as well. By comparing them, researchers can gain valuable insights into choosing the appropriate mix of solutions for various operational environments. Specifying their power and energy impact adds a layer of nuance to the insights. It could help offer guidance to enhance our understanding of how different mitigations perform from a combined perspective. It would also lead to more sophisticated security strategies that help balance system performance and energy concerns.
Funding
This research received no external funding.
Conflicts of Interest
The authors declare no conflict of interest.
Abbreviations
The following abbreviations are used in this manuscript:
| CCBM |
Comprehensive Conditional Branch Mitigation |
| DBP |
Dynamic Branch Predictor |
| FCET |
Function Calls External Thunk |
| FCIT |
Function Calls Inline Thunk |
| FRIT |
Function Returns Inline Thunk |
| GCC |
GNU Compiler Collection |
| HPC |
High-Performance Computing |
| IBET |
Indirect Branches External Thunk |
| IBIT |
Indirect Branches Inline Thunk |
| IC |
Intel Compiler |
| O0, O1, O2, O3 |
Compiler Optimization Levels |
| PMU |
Power Management Unit |
| RAPL |
Running Average Power Limit |
| RT |
Return Trampoline |
| RTET |
Return Trampolines External Thunk |
Appendix A. Data Tables
The appendix contains a comprehensive record of the data collected from the experiment described in this paper.
Table A1.
Energy Consumption of 10 Benchmarks Measured in Jules
Table A1.
Energy Consumption of 10 Benchmarks Measured in Jules
| Variant |
Mitig. Strategies |
Compiler |
unroll |
Barnes |
Canneal |
Cholesky |
Dedup |
Ferret |
FMM |
Freqmine |
Oceancp |
Raytrace |
X264 |
| No mitigation |
IC |
OFF |
161 |
106 |
1 |
573 |
241 |
127 |
1232 |
178 |
230 |
243 |
| ON |
162 |
106 |
1 |
573 |
241 |
127 |
1232 |
178 |
230 |
244 |
| GCC |
OFF |
164 |
90 |
1 |
591 |
246 |
134 |
390 |
170 |
235 |
248 |
| ON |
164 |
90 |
1 |
591 |
246 |
129 |
413 |
170 |
233 |
248 |
| Clang |
OFF |
145 |
81 |
1 |
600 |
260 |
129 |
345 |
169 |
346 |
249 |
| ON |
145 |
81 |
1 |
600 |
261 |
128 |
345 |
170 |
346 |
248 |
| Spectre V1 |
CCBM |
IC |
OFF |
485 |
151 |
2 |
826 |
341 |
522 |
5504 |
653 |
583 |
613 |
| ON |
482 |
152 |
2 |
838 |
346 |
520 |
5424 |
651 |
586 |
611 |
| TPM |
IC |
OFF |
172 |
123 |
1 |
676 |
256 |
132 |
1998 |
179 |
234 |
244 |
| ON |
166 |
126 |
1 |
694 |
248 |
134 |
1984 |
180 |
231 |
244 |
| SLD |
Clang |
OFF |
286 |
160 |
1 |
1053 |
642 |
171 |
683 |
184 |
685 |
398 |
| ON |
286 |
159 |
1 |
1054 |
636 |
172 |
696 |
183 |
687 |
400 |
| Spectre V2 |
IBIT |
IC |
OFF |
164 |
109 |
1 |
594 |
245 |
126 |
1226 |
178 |
432 |
259 |
| ON |
167 |
108 |
1 |
604 |
249 |
127 |
1228 |
178 |
431 |
252 |
| GCC |
OFF |
166 |
91 |
1 |
593 |
258 |
134 |
387 |
174 |
435 |
324 |
| ON |
165 |
90 |
1 |
599 |
254 |
131 |
416 |
175 |
440 |
327 |
| IBET |
IC |
OFF |
163 |
108 |
1 |
595 |
243 |
129 |
1232 |
178 |
233 |
245 |
| ON |
162 |
108 |
1 |
593 |
244 |
129 |
1231 |
178 |
231 |
246 |
| GCC |
OFF |
164 |
90 |
1 |
604 |
248 |
134 |
385 |
175 |
236 |
249 |
| ON |
165 |
91 |
1 |
604 |
246 |
130 |
412 |
176 |
235 |
250 |
| FCIT |
IC |
OFF |
162 |
107 |
1 |
591 |
242 |
129 |
1234 |
180 |
232 |
247 |
| ON |
164 |
106 |
1 |
590 |
241 |
125 |
1234 |
180 |
232 |
249 |
| FCET |
IC |
OFF |
166 |
108 |
1 |
594 |
244 |
124 |
1239 |
180 |
229 |
250 |
| ON |
163 |
109 |
1 |
592 |
247 |
125 |
1231 |
179 |
228 |
247 |
| FRIT |
IC |
OFF |
299 |
115 |
1 |
630 |
260 |
130 |
1825 |
180 |
290 |
450 |
| ON |
303 |
115 |
1 |
632 |
262 |
131 |
1828 |
179 |
294 |
459 |
| GCC |
OFF |
288 |
95 |
1 |
602 |
260 |
142 |
668 |
175 |
287 |
266 |
| ON |
297 |
96 |
1 |
603 |
256 |
135 |
684 |
174 |
296 |
272 |
| RT |
Clang |
OFF |
147 |
128 |
1 |
604 |
264 |
144 |
351 |
171 |
438 |
317 |
| ON |
145 |
129 |
1 |
605 |
262 |
132 |
354 |
172 |
429 |
314 |
| RTET |
Clang |
OFF |
146 |
82 |
1 |
602 |
263 |
130 |
348 |
171 |
349 |
291 |
| ON |
147 |
82 |
1 |
602 |
263 |
130 |
348 |
171 |
354 |
292 |
Table A2.
Run Time of 10 Benchmarks Measured in Seconds
Table A2.
Run Time of 10 Benchmarks Measured in Seconds
| Variant |
Mitig. Strategies |
Compiler |
unroll |
Barnes |
Canneal |
Cholesky |
Dedup |
Ferret |
FMM |
Freqmine |
Oceancp |
Raytrace |
X264 |
| No mitigation |
IC |
OFF |
3.74 |
2.55 |
0.02 |
13.60 |
5.43 |
2.88 |
28.08 |
3.90 |
5.01 |
5.51 |
| ON |
3.71 |
2.54 |
0.02 |
13.56 |
5.44 |
2.91 |
27.90 |
3.91 |
5.07 |
5.52 |
| GCC |
OFF |
3.75 |
2.11 |
0.02 |
13.51 |
5.34 |
3.10 |
5.17 |
3.91 |
5.18 |
5.61 |
| ON |
3.73 |
2.14 |
0.02 |
13.44 |
5.40 |
3.04 |
5.44 |
3.92 |
5.16 |
5.65 |
| Clang |
OFF |
3.21 |
2.13 |
0.02 |
13.44 |
5.29 |
3.22 |
5.14 |
3.91 |
5.17 |
5.62 |
| ON |
3.15 |
2.11 |
0.02 |
13.41 |
5.39 |
3.06 |
5.28 |
3.93 |
5.14 |
5.62 |
| Spectre V1 |
CCBM |
IC |
OFF |
11.55 |
3.56 |
0.03 |
44.44 |
17.74 |
12.72 |
131.68 |
15.58 |
13.76 |
18.00 |
| ON |
11.52 |
3.60 |
0.04 |
44.24 |
17.75 |
12.67 |
131.50 |
15.57 |
13.80 |
18.01 |
| TPM |
IC |
OFF |
3.92 |
2.93 |
0.03 |
15.77 |
6.30 |
3.07 |
46.77 |
3.96 |
5.15 |
6.39 |
| ON |
3.77 |
2.99 |
0.02 |
15.73 |
6.31 |
3.11 |
46.54 |
3.96 |
5.09 |
6.40 |
| SLD |
Clang |
OFF |
6.70 |
3.72 |
0.02 |
26.20 |
14.61 |
4.00 |
10.02 |
4.14 |
16.00 |
9.21 |
| ON |
6.72 |
3.69 |
0.02 |
26.14 |
14.40 |
4.02 |
10.29 |
4.11 |
15.99 |
9.21 |
| Spectre V2 |
IBIT |
IC |
OFF |
3.75 |
2.55 |
0.02 |
15.77 |
6.29 |
2.93 |
27.60 |
3.89 |
9.78 |
6.39 |
| ON |
3.77 |
2.56 |
0.02 |
15.72 |
6.31 |
2.95 |
27.59 |
3.93 |
9.81 |
6.40 |
| GCC |
OFF |
3.76 |
2.14 |
0.02 |
13.32 |
5.64 |
3.12 |
5.13 |
3.94 |
9.83 |
7.38 |
| ON |
3.74 |
2.13 |
0.02 |
13.44 |
5.53 |
3.06 |
5.56 |
3.93 |
9.93 |
7.43 |
| IBET |
IC |
OFF |
3.67 |
2.55 |
0.02 |
13.55 |
12.07 |
6.40 |
62.44 |
8.67 |
11.14 |
12.25 |
| ON |
3.68 |
2.55 |
0.02 |
13.56 |
12.10 |
6.47 |
62.04 |
8.69 |
11.27 |
12.27 |
| GCC |
OFF |
3.74 |
2.13 |
0.02 |
13.60 |
5.36 |
3.21 |
5.11 |
3.93 |
5.20 |
5.81 |
| ON |
3.75 |
2.16 |
0.02 |
13.62 |
5.39 |
3.14 |
5.48 |
3.94 |
5.17 |
5.74 |
| FCIT |
IC |
OFF |
3.70 |
2.53 |
0.02 |
13.59 |
5.41 |
2.96 |
27.76 |
3.94 |
5.07 |
5.53 |
| ON |
3.72 |
2.52 |
0.02 |
13.58 |
5.45 |
2.87 |
27.75 |
3.95 |
4.95 |
5.55 |
| FCET |
IC |
OFF |
3.80 |
2.57 |
0.02 |
14.46 |
5.39 |
2.89 |
27.91 |
3.94 |
5.00 |
5.63 |
| ON |
3.70 |
2.55 |
0.02 |
13.60 |
5.42 |
2.86 |
27.72 |
3.93 |
4.98 |
5.68 |
| FRIT |
IC |
OFF |
6.91 |
2.72 |
0.02 |
15.66 |
6.25 |
3.01 |
41.65 |
3.95 |
6.40 |
6.35 |
| ON |
6.97 |
2.69 |
0.02 |
15.62 |
6.23 |
3.03 |
41.66 |
3.90 |
6.50 |
6.36 |
| GCC |
OFF |
6.66 |
2.25 |
0.02 |
13.58 |
5.56 |
3.31 |
9.46 |
3.94 |
6.39 |
6.07 |
| ON |
6.91 |
2.25 |
0.02 |
13.31 |
5.50 |
3.12 |
9.63 |
3.92 |
6.51 |
6.17 |
| RT |
Clang |
OFF |
3.34 |
3.04 |
0.02 |
15.53 |
5.75 |
3.38 |
5.94 |
3.87 |
9.88 |
7.23 |
| ON |
3.32 |
3.03 |
0.02 |
15.50 |
5.68 |
3.10 |
6.10 |
3.88 |
9.70 |
7.19 |
| RTET |
Clang |
OFF |
3.32 |
2.56 |
0.02 |
14.41 |
5.39 |
3.17 |
5.57 |
3.88 |
9.27 |
6.78 |
| ON |
3.33 |
2.45 |
0.02 |
14.38 |
5.33 |
2.91 |
5.72 |
3.88 |
9.10 |
6.75 |
Table A3.
Number of Executed Instructions of 10 Benchmarks Measured in Billions Except Cholesky Benchmark Measured in Millions.
Table A3.
Number of Executed Instructions of 10 Benchmarks Measured in Billions Except Cholesky Benchmark Measured in Millions.
| Variant |
Mitig. Strategies |
Compiler |
unroll |
arnes |
Canneal |
Cholesky |
Dedup |
Ferret |
FMM |
Freqmine |
Oceancp |
Raytrace |
X264 |
| No mitigation |
IC |
OFF |
40.4 |
5.7 |
1.8 |
81 |
41 |
37.2 |
206.8 |
24.4 |
23.1 |
34.8 |
| ON |
40.6 |
5.7 |
1.8 |
81 |
40 |
37.1 |
206.7 |
24.4 |
23.1 |
34.8 |
| GCC |
OFF |
39.5 |
5.6 |
1.7 |
80 |
40 |
41.3 |
216.5 |
19.5 |
24.2 |
34.7 |
| ON |
39.5 |
5.6 |
1.6 |
80 |
40 |
41.4 |
216.5 |
19.5 |
24.2 |
34.7 |
| Clang |
OFF |
38.5 |
5.7 |
1.6 |
79 |
40 |
39.3 |
222.5 |
20.5 |
23.2 |
33.6 |
| ON |
40.5 |
5.7 |
1.8 |
78 |
40 |
40.4 |
223.4 |
21.4 |
23.3 |
33.7 |
| Spectre V1 |
CCBM |
IC |
OFF |
84.7 |
6.0 |
2.0 |
81 |
41 |
92.2 |
233.3 |
25.6 |
24.9 |
34.2 |
| ON |
84.8 |
6.0 |
1.8 |
81 |
41 |
92.2 |
233.3 |
25.5 |
24.9 |
34.7 |
| SLD |
Clang |
OFF |
63.2 |
13.6 |
1.9 |
81 |
41 |
67.6 |
52.8 |
28.0 |
35.5 |
47.5 |
| ON |
62.8 |
13.6 |
1.8 |
81 |
41 |
61.9 |
52.6 |
27.8 |
35.4 |
47.2 |
| TPM |
IC |
OFF |
40.7 |
5.7 |
1.9 |
81 |
41 |
38.2 |
209.5 |
24.4 |
23.1 |
34.8 |
| ON |
40.7 |
5.7 |
1.8 |
81 |
41 |
38.1 |
209.6 |
24.4 |
23.1 |
34.9 |
| Spectre V2 |
IBIT |
IC |
OFF |
40.4 |
5.7 |
1.7 |
81 |
41 |
37.4 |
206.7 |
24.4 |
25.1 |
35.9 |
| ON |
40.3 |
5.7 |
1.8 |
81 |
41 |
37.4 |
206.8 |
24.4 |
25.1 |
36.0 |
| GCC |
OFF |
39.6 |
5.6 |
1.6 |
80 |
40 |
41.5 |
216.5 |
19.5 |
26.3 |
35.7 |
| ON |
39.5 |
5.6 |
1.6 |
79 |
38 |
40 |
220.5 |
17.1 |
26.2 |
35.5 |
| IBET |
IC |
OFF |
40.3 |
5.7 |
1.9 |
81 |
40 |
39.8 |
222.0 |
24.5 |
23.1 |
35.4 |
| ON |
40.4 |
5.7 |
1.8 |
81 |
39 |
40.5 |
223.1 |
24.5 |
23.1 |
35.6 |
| GCC |
OFF |
39.5 |
4.7 |
1.8 |
79 |
40 |
39.6 |
216.5 |
19.5 |
24.2 |
31.4 |
| ON |
39.5 |
4.2 |
1.7 |
79 |
37 |
40.5 |
220.5 |
17.1 |
23.1 |
30.2 |
| FCIT |
IC |
OFF |
40.5 |
5.7 |
2.1 |
81 |
40 |
37.0 |
245.1 |
24.4 |
23.1 |
34.3 |
| ON |
41.6 |
5.7 |
1.7 |
81 |
37 |
37.1 |
301.7 |
24.4 |
23.1 |
34.8 |
| FCET |
IC |
OFF |
40.4 |
5.7 |
1.8 |
81 |
41 |
37.1 |
206.8 |
24.4 |
23.1 |
34.7 |
| ON |
40.5 |
5.7 |
2.0 |
81 |
38 |
37.1 |
206.8 |
24.4 |
23.1 |
34.8 |
| FRIT |
IC |
OFF |
59.0 |
5.7 |
1.9 |
81 |
40 |
37.7 |
290.6 |
24.4 |
23.9 |
34.6 |
| ON |
59.2 |
5.7 |
2.0 |
81 |
39 |
37.8 |
210.7 |
24.4 |
23.9 |
34.8 |
| GCC |
OFF |
56.1 |
5.7 |
1.7 |
79 |
40 |
42.5 |
222 |
19.5 |
25.1 |
35 |
| ON |
57.5 |
5.7 |
1.6 |
79 |
39 |
40.0 |
225.8 |
17.1 |
25.0 |
34.5 |
| RT |
Clang |
OFF |
51 |
26 |
2 |
87 |
47 |
39.4 |
42.8 |
17.9 |
24.9 |
39 |
| ON |
41.2 |
26.1 |
1.9 |
87 |
42 |
37.9 |
41.2 |
17.8 |
24.9 |
38.7 |
| RTET |
Clang |
OFF |
51.0 |
26 |
2.1 |
87 |
48 |
40.5 |
42.9 |
17.9 |
25.1 |
39 |
| ON |
53.4 |
26.2 |
1.9 |
87 |
47 |
43.1 |
43.5 |
17.8 |
24.9 |
38.8 |
Table A4.
Branch Instructions Percentage of 10 Benchmarks
Table A4.
Branch Instructions Percentage of 10 Benchmarks
| Variant |
Mitig. Strategies |
Compiler |
unroll |
Barnes |
Canneal |
Cholesky |
Dedup |
Ferret |
FMM |
Freqmine |
Oceancp |
Raytrace |
X264 |
| No mitigation |
IC |
OFF |
16.6 |
24.3 |
18.3 |
7.3 |
16.0 |
14.7 |
12.8 |
11.4 |
13.1 |
7.0 |
| ON |
16.5 |
24.3 |
20.2 |
8.0 |
15.3 |
14.7 |
12.8 |
11.4 |
13.1 |
6.9 |
| GCC |
OFF |
15.7 |
26.2 |
18.5 |
8.0 |
16.3 |
13.2 |
14.1 |
4.9 |
12.6 |
6.9 |
| ON |
15.7 |
26.3 |
20.0 |
7.9 |
16.2 |
12.8 |
14.4 |
2.8 |
12.6 |
7.0 |
| Clang |
OFF |
15.6 |
25.4 |
18.3 |
8.0 |
15.3 |
13.2 |
14.1 |
5.9 |
12.6 |
6.9 |
| ON |
15.6 |
25.5 |
20.2 |
7.9 |
16.2 |
12.8 |
14.4 |
5.7 |
12.6 |
7.0 |
| Spectre V1 |
CCBM |
IC |
OFF |
18.1 |
24.9 |
16.6 |
7.9 |
16.4 |
17.9 |
13.9 |
11.3 |
13.9 |
8.1 |
| ON |
18.0 |
25.1 |
19.1 |
8.0 |
17.0 |
17.9 |
13.9 |
11.3 |
14.0 |
7.8 |
| TPM |
IC |
OFF |
16.6 |
24.1 |
19.7 |
8.1 |
17.3 |
14.8 |
12.7 |
11.4 |
13.1 |
7.0 |
| ON |
16.6 |
24.1 |
22.9 |
7.4 |
15.4 |
14.9 |
12.7 |
11.4 |
13.1 |
7.1 |
| SLD |
Clang |
OFF |
14.7 |
22.1 |
20.0 |
9.1 |
17.3 |
11.0 |
13.8 |
4.1 |
12.1 |
6.6 |
| ON |
14.6 |
22.1 |
23.3 |
8.4 |
16.9 |
11.3 |
13.9 |
4.0 |
12.1 |
6.6 |
| Spectre V2 |
IBIT |
IC |
OFF |
16.5 |
24.2 |
19.3 |
7.3 |
15.4 |
14.8 |
12.8 |
11.4 |
17.0 |
7.0 |
| ON |
16.6 |
24.3 |
19.6 |
7.3 |
15.3 |
14.8 |
12.8 |
11.4 |
16.9 |
7.0 |
| GCC |
OFF |
15.8 |
26.2 |
20.6 |
8.1 |
17.8 |
13.2 |
14.1 |
4.9 |
16.2 |
8.4 |
| ON |
15.7 |
26.2 |
17.4 |
7.9 |
16.3 |
12.8 |
14.4 |
2.8 |
16.2 |
8.5 |
| IBET |
IC |
OFF |
16.5 |
24.3 |
16.7 |
6.8 |
16.2 |
11.6 |
12.3 |
11.4 |
13.1 |
7.1 |
| ON |
16.6 |
24.4 |
21.2 |
6.6 |
15.7 |
10.8 |
11.8 |
11.3 |
13.1 |
7.0 |
| GCC |
OFF |
15.7 |
24.1 |
18.1 |
7.3 |
15.2 |
10.6 |
14.1 |
4.8 |
12.1 |
6.3 |
| ON |
15.8 |
24.2 |
17.8 |
7.1 |
15.0 |
10.4 |
14.4 |
2.8 |
12.6 |
5.3 |
| FCIT |
IC |
OFF |
16.6 |
24.3 |
16.9 |
6.6 |
14.9 |
14.7 |
15.0 |
11.4 |
13.1 |
8.7 |
| ON |
16.5 |
24.4 |
22.3 |
7.6 |
16.3 |
14.7 |
15.2 |
11.4 |
13.1 |
8.2 |
| FCET |
IC |
OFF |
16.6 |
24.4 |
17.6 |
6.1 |
15.2 |
14.7 |
12.8 |
11.4 |
13.1 |
7.2 |
| ON |
16.5 |
24.3 |
19.0 |
7.6 |
16.0 |
14.7 |
12.8 |
11.4 |
13.2 |
6.7 |
| FRIT |
IC |
OFF |
18.4 |
24.5 |
19.9 |
7.8 |
16.7 |
14.9 |
16.2 |
11.4 |
14.5 |
6.7 |
| ON |
18.3 |
24.5 |
17.9 |
6.0 |
15.2 |
14.8 |
14.0 |
11.4 |
14.5 |
7.0 |
| GCC |
OFF |
17.4 |
26.3 |
19.7 |
8.1 |
17.8 |
13.4 |
15.0 |
4.9 |
13.8 |
7.1 |
| ON |
17.3 |
26.3 |
18.7 |
7.8 |
16.3 |
12.8 |
15.3 |
2.8 |
13.8 |
7.2 |
| RT |
Clang |
OFF |
17.4 |
23.6 |
20.1 |
8.2 |
18.4 |
17.1 |
14.6 |
6.4 |
15.4 |
7.4 |
| ON |
16.8 |
23.4 |
25.6 |
7.6 |
18.1 |
16.5 |
14.5 |
6.3 |
15.5 |
7.3 |
| RTET |
Clang |
OFF |
17.5 |
25.6 |
17.3 |
8.3 |
18.2 |
17.1 |
14.8 |
6.4 |
15.5 |
8.0 |
| ON |
17.9 |
25.2 |
19.3 |
7.7 |
18.3 |
16.5 |
14.2 |
6.2 |
15.3 |
7.6 |
Table A5.
Branch Miss-Prediction Percentage of 10 Benchmarks
Table A5.
Branch Miss-Prediction Percentage of 10 Benchmarks
| Variant |
Mitig. Strategies |
Compiler |
unroll |
Barnes |
Canneal |
Cholesky |
Dedup |
Ferret |
FMM |
Freqmine |
Oceancp |
Raytrace |
X264 |
| No mitigation |
IC |
OFF |
0.8 |
1.9 |
4.1 |
4.0 |
4.1 |
0.6 |
2.0 |
0.1 |
0.3 |
5.3 |
| ON |
0.8 |
1.9 |
3.7 |
4.2 |
4.1 |
0.7 |
2.0 |
0.1 |
0.3 |
5.2 |
| GCC |
OFF |
0.6 |
2.8 |
4.0 |
3.7 |
4.1 |
0.3 |
1.7 |
0.4 |
0.3 |
5.3 |
| ON |
0.5 |
1.7 |
4.1 |
3.8 |
4.7 |
0.3 |
1.7 |
0.6 |
0.3 |
5.7 |
| Clang |
OFF |
0.5 |
1.6 |
3.8 |
3.2 |
3.6 |
0.2 |
1.7 |
0.4 |
0.6 |
5.4 |
| ON |
0.6 |
2.8 |
3.3 |
3.3 |
3.3 |
0.2 |
1.5 |
0.4 |
0.5 |
5.6 |
| Spectre V1 |
CCBM |
IC |
OFF |
0.5 |
1.9 |
4.2 |
3.9 |
4.1 |
0.2 |
1.7 |
0.2 |
0.3 |
5.0 |
| ON |
0.5 |
1.9 |
4.7 |
3.5 |
4.0 |
0.2 |
1.6 |
0.2 |
0.3 |
4.8 |
| TPM |
IC |
OFF |
0.8 |
1.9 |
4.5 |
3.7 |
4.0 |
0.6 |
1.9 |
0.1 |
0.3 |
5.3 |
| ON |
0.8 |
1.9 |
3.4 |
3.8 |
4.0 |
0.5 |
1.9 |
0.1 |
0.3 |
5.2 |
| SLD |
Clang |
OFF |
0.5 |
1.6 |
3.9 |
10.3 |
8.0 |
4.5 |
0.3 |
0.3 |
9.7 |
8.7 |
| ON |
0.5 |
1.7 |
3.4 |
10.3 |
7.8 |
4.5 |
0.3 |
0.3 |
9.7 |
8.6 |
| Spectre V2 |
IBIT |
IC |
OFF |
0.8 |
1.9 |
4.1 |
3.9 |
4.1 |
0.8 |
1.9 |
0.1 |
9.7 |
5.3 |
| ON |
0.8 |
1.9 |
4.2 |
3.8 |
4.1 |
0.8 |
1.9 |
0.1 |
9.7 |
5.3 |
| GCC |
OFF |
0.6 |
2.8 |
3.7 |
3.7 |
4.5 |
0.3 |
1.8 |
0.4 |
9.7 |
10.6 |
| ON |
0.6 |
2.8 |
4.8 |
3.8 |
5.0 |
0.3 |
1.7 |
0.6 |
9.7 |
10.8 |
| IBET |
IC |
OFF |
0.8 |
1.9 |
4.3 |
4.0 |
4.0 |
0.4 |
1.9 |
0.6 |
9.1 |
10.3 |
| ON |
0.8 |
1.9 |
3.7 |
4.1 |
3.9 |
0.4 |
1.9 |
0.5 |
9.0 |
10.4 |
| GCC |
OFF |
0.6 |
1.7 |
3.9 |
3.8 |
4.0 |
0.4 |
1.8 |
0.4 |
0.3 |
11.3 |
| ON |
0.6 |
1.7 |
4.2 |
4.0 |
4.2 |
0.3 |
1.7 |
0.6 |
0.3 |
11.2 |
| FCIT |
IC |
OFF |
0.8 |
1.9 |
3.9 |
3.6 |
3.5 |
0.6 |
1.7 |
0.1 |
0.3 |
5.5 |
| ON |
0.8 |
1.9 |
3.4 |
3.8 |
3.5 |
0.6 |
1.5 |
0.1 |
0.3 |
5.3 |
| FCET |
IC |
OFF |
0.8 |
1.9 |
4.3 |
4.2 |
5.3 |
0.6 |
2.0 |
0.1 |
0.3 |
5.0 |
| ON |
0.8 |
1.9 |
4.0 |
4.1 |
5.2 |
0.6 |
2.0 |
0.1 |
0.3 |
4.9 |
| FRIT |
IC |
OFF |
4.9 |
3.4 |
3.9 |
4.0 |
4.2 |
0.6 |
5.4 |
0.1 |
12.3 |
10.6 |
| ON |
4.9 |
3.5 |
3.9 |
3.9 |
4.3 |
0.6 |
8.1 |
0.1 |
12.3 |
10.4 |
| GCC |
OFF |
5.7 |
3.6 |
3.6 |
3.9 |
5.7 |
0.6 |
9.6 |
0.4 |
12.3 |
7.7 |
| ON |
5.7 |
3.6 |
4.6 |
3.9 |
6.3 |
0.6 |
9.1 |
0.6 |
12.3 |
7.9 |
| RT |
Clang |
OFF |
0.8 |
0.8 |
3.7 |
2.5 |
5.0 |
5.3 |
0.8 |
0.3 |
10.9 |
9.6 |
| ON |
0.6 |
0.8 |
2.9 |
2.1 |
5.1 |
5.5 |
0.4 |
0.3 |
10.8 |
9.6 |
| RTET |
Clang |
OFF |
0.8 |
0.7 |
4.2 |
4.1 |
2.5 |
2.0 |
1.1 |
0.3 |
1.1 |
6.3 |
| ON |
0.6 |
0.6 |
3.9 |
4.0 |
3.0 |
2.2 |
1.1 |
0.3 |
1.0 |
6.3 |
Table A6.
Average Power of 10 Benchmarks Measured in Watts
Table A6.
Average Power of 10 Benchmarks Measured in Watts
| Variant |
Mitig. Strategies |
Compiler |
unroll |
Barnes |
Canneal |
Cholesky |
Dedup |
Ferret |
FMM |
Freqmine |
Oceancp |
Raytrace |
X264 |
| No mitigation |
IC |
OFF |
42.9 |
41.2 |
26.5 |
42.1 |
44.2 |
44.1 |
43.9 |
45.5 |
45.9 |
44.0 |
| ON |
43.6 |
41.4 |
25.5 |
42.2 |
44.3 |
43.3 |
44.1 |
45.5 |
45.3 |
44.2 |
| GCC |
OFF |
43.5 |
42.4 |
27.5 |
43.7 |
46.1 |
43.0 |
75.3 |
43.4 |
45.2 |
44.1 |
| ON |
43.9 |
41.9 |
26.5 |
43.9 |
45.4 |
42.4 |
75.8 |
43.3 |
45.0 |
43.8 |
| Clang |
OFF |
44.9 |
37.8 |
27.0 |
44.6 |
49.1 |
39.8 |
67.0 |
43.2 |
66.8 |
50.6 |
| ON |
46.0 |
38.3 |
27.5 |
44.7 |
48.3 |
41.6 |
65.3 |
43.2 |
67.2 |
50.6 |
| Spectre V1 |
CCBM |
IC |
OFF |
42.0 |
42.2 |
37.3 |
18.6 |
19.2 |
41.0 |
41.8 |
41.9 |
42.4 |
11.2 |
| ON |
41.8 |
42.1 |
30.5 |
18.9 |
19.4 |
41.0 |
41.2 |
41.8 |
42.5 |
33.9 |
| TPM |
IC |
OFF |
43.7 |
42.0 |
27.7 |
42.8 |
40.6 |
42.9 |
42.7 |
45.2 |
45.3 |
95.8 |
| ON |
43.9 |
42.0 |
41.0 |
44.1 |
39.2 |
42.8 |
42.6 |
45.5 |
45.3 |
95.4 |
| SLD |
Clang |
OFF |
42.6 |
42.9 |
39.5 |
40.2 |
44.0 |
42.8 |
68.1 |
44.4 |
42.8 |
43.2 |
| ON |
42.5 |
43.0 |
38.5 |
40.3 |
44.1 |
42.7 |
67.6 |
44.5 |
43.0 |
43.4 |
| Spectre V2 |
IBIT |
IC |
OFF |
43.7 |
42.4 |
28.0 |
37.6 |
38.9 |
42.9 |
44.4 |
45.7 |
44.2 |
40.4 |
| ON |
44.0 |
42.2 |
26.0 |
38.4 |
39.4 |
42.8 |
44.5 |
45.2 |
43.9 |
39.3 |
| GCC |
OFF |
44.0 |
42.2 |
31.0 |
44.5 |
45.7 |
42.7 |
75.3 |
44.0 |
44.2 |
43.9 |
| ON |
43.9 |
42.1 |
31.0 |
44.6 |
45.8 |
42.8 |
74.8 |
44.5 |
44.2 |
44.0 |
| IBET |
IC |
OFF |
44.2 |
42.1 |
27.0 |
43.9 |
20.1 |
20.1 |
19.7 |
20.5 |
20.9 |
19.9 |
| ON |
44.0 |
42.1 |
27.5 |
43.7 |
20.2 |
19.9 |
19.8 |
20.4 |
20.5 |
20.0 |
| GCC |
OFF |
43.8 |
42.2 |
28.0 |
44.4 |
46.1 |
41.7 |
75.3 |
44.4 |
45.2 |
42.8 |
| ON |
44.0 |
41.8 |
28.5 |
44.3 |
45.6 |
41.4 |
75.1 |
44.5 |
45.3 |
43.4 |
| FCIT |
IC |
OFF |
43.8 |
42.2 |
26.5 |
43.5 |
44.6 |
43.3 |
44.4 |
45.6 |
45.6 |
44.6 |
| ON |
44.0 |
42.0 |
29.0 |
43.4 |
44.1 |
43.2 |
44.4 |
45.6 |
46.8 |
44.7 |
| FCET |
IC |
OFF |
43.6 |
41.9 |
29.0 |
41.0 |
45.2 |
42.8 |
44.4 |
45.6 |
45.6 |
44.4 |
| ON |
43.9 |
42.7 |
29.5 |
43.5 |
45.6 |
43.6 |
44.4 |
45.5 |
45.8 |
43.5 |
| FRIT |
IC |
OFF |
43.2 |
42.2 |
30.0 |
40.2 |
41.5 |
43.0 |
43.8 |
45.5 |
45.2 |
70.8 |
| ON |
43.4 |
42.8 |
31.0 |
40.4 |
41.9 |
43.2 |
43.9 |
45.8 |
45.2 |
72.1 |
| GCC |
OFF |
43.2 |
42.0 |
30.0 |
44.3 |
46.6 |
42.9 |
70.6 |
44.3 |
44.9 |
43.8 |
| ON |
43.0 |
42.5 |
31.5 |
45.3 |
46.5 |
43.1 |
70.9 |
44.3 |
45.4 |
44.0 |
| RT |
Clang |
OFF |
43.9 |
42.1 |
29.0 |
38.8 |
45.8 |
42.6 |
59.0 |
44.2 |
44.3 |
43.8 |
| ON |
43.6 |
42.3 |
28.0 |
39.0 |
46.1 |
42.5 |
58.0 |
44.2 |
44.1 |
43.6 |
| RTET |
Clang |
OFF |
43.8 |
31.7 |
28.0 |
41.7 |
48.6 |
40.7 |
62.4 |
44.0 |
37.6 |
42.9 |
| ON |
44.1 |
33.3 |
27.5 |
41.9 |
49.3 |
44.4 |
60.8 |
44.0 |
38.8 |
43.1 |
References
- Kocher, P.; Horn, J.; Fogh, A.; Genkin, D.; Gruss, D.; Haas, W.; Hamburg, M.; Lipp, M.; Mangard, S.; Prescher, T.; et al. Spectre attacks: Exploiting speculative execution. Communications of the ACM 2020, 63, 93–101. [Google Scholar] [CrossRef]
- Canella, C.; Van Bulck, J.; Schwarz, M.; Lipp, M.; Von Berg, B.; Ortner, P.; Piessens, F.; Evtyushkin, D.; Gruss, D. A systematic evaluation of transient execution attacks and defenses. In Proceedings of the 28th USENIX Security Symposium (USENIX Security 19); 2019; pp. 249–266. [Google Scholar]
- Herzog, B.; Reif, S.; Preis, J.; Schröder-Preikschat, W.; Hönig, T. The price of Meltdown and Spectre: Energy overhead of mitigations at operating system level. In Proceedings of the Proceedings of the 14th European Workshop on Systems Security, 2021; pp. 8–14.
- Spreitzer, R.; Moonsamy, V.; Korak, T.; Mangard, S. Systematic classification of side-channel attacks: A case study for mobile devices. IEEE communications surveys & tutorials 2017, 20, 465–488. [Google Scholar]
- Kocher, P.C. Timing attacks on implementations of Diffie-Hellman, RSA, DSS, and other systems. In Proceedings of the Advances in Cryptology—CRYPTO’96: 16th Annual International Cryptology Conference Santa Barbara, California, 1996 Proceedings 16. Springer, 1996, USA August 18–22; pp. 104–113.
- Tromer, E.; Osvik, D.A.; Shamir, A. Efficient cache attacks on AES, and countermeasures. Journal of Cryptology 2010, 23, 37–71. [Google Scholar] [CrossRef]
- Götzfried, J.; Eckert, M.; Schinzel, S.; Müller, T. Cache attacks on Intel SGX. In Proceedings of the Proceedings of the 10th European Workshop on Systems Security, 2017; pp. 1–6.
- Moradi, A.; Shalmani, M.T.M.; Salmasizadeh, M. A generalized method of differential fault attack against AES cryptosystem. In Proceedings of the Cryptographic Hardware and Embedded Systems-CHES 2006: 8th International Workshop, Yokohama, Japan, 2006. Proceedings 8. Springer, 2006, October 10-13; pp. 91–100.
- Pessl, P.; Gruss, D.; Maurice, C.; Schwarz, M.; Mangard, S. {DRAMA}: Exploiting {DRAM} Addressing for {Cross-CPU} Attacks. In Proceedings of the 25th USENIX security symposium (USENIX security 16); 2016; pp. 565–581. [Google Scholar]
- Das, M.; Sardar, B.; Banerjee, A. Attacks on branch predictors: an empirical exploration. In Proceedings of the Information Systems Security: 11th International Conference, ICISS 2015, Kolkata, India, 2015. Proceedings 11. Springer, 2015, December 16-20; pp. 511–520.
- Evtyushkin, D.; Riley, R.; Abu-Ghazaleh, N.C.; ECE. ; Ponomarev, D. Branchscope: A new side-channel attack on directional branch predictor. ACM SIGPLAN Notices 2018, 53, 693–707. [Google Scholar] [CrossRef]
- Yarom, Y.; Falkner, K. {FLUSH+ RELOAD}: A high resolution, low noise, l3 cache {Side-Channel} attack. In Proceedings of the 23rd USENIX security symposium (USENIX security 14); 2014; pp. 719–732. [Google Scholar]
- Irazoqui, G.; Inci, M.S.; Eisenbarth, T.; Sunar, B. Wait a minute! A fast, Cross-VM attack on AES. In Proceedings of the Research in Attacks, Intrusions and Defenses: 17th International Symposium, RAID 2014, Gothenburg, Sweden, 2014. Proceedings 17. Springer, 2014, September 17-19; pp. 299–319.
- Gülmezoğlu, B.; Inci, M.S.; Irazoqui, G.; Eisenbarth, T.; Sunar, B. A faster and more realistic flush+ reload attack on AES. In Proceedings of the Constructive Side-Channel Analysis and Secure Design: 6th International Workshop, COSADE 2015, Berlin, Germany, 2015. Revised Selected Papers 6. Springer, 2015, April 13-14; pp. 111–126.
- Gruss, D.; Kraft, E.; Tiwari, T.; Schwarz, M.; Trachtenberg, A.; Hennessey, J.; Ionescu, A.; Fogh, A. Page cache attacks. In Proceedings of the Proceedings of the 2019 ACM SIGSAC Conference on Computer and Communications Security, 2019; pp. 167–180.
- Gruss, D. Software-based microarchitectural attacks. it-Information Technology 2018, 60, 335–341. [Google Scholar] [CrossRef]
- Yarom, Y.; Genkin, D.; Heninger, N. CacheBleed: a timing attack on OpenSSL constant-time RSA. Journal of Cryptographic Engineering 2017, 7, 99–112. [Google Scholar] [CrossRef]
- Lipp, M.; Schwarz, M.; Gruss, D.; Prescher, T.; Haas, W.; Mangard, S.; Kocher, P.; Genkin, D.; Yarom, Y.; Hamburg, M. Meltdown. arXiv preprint arXiv:1801.01207, arXiv:1801.01207 2018.
- Van Bulck, J.; Minkin, M.; Weisse, O.; Genkin, D.; Kasikci, B.; Piessens, F.; Silberstein, M.; Wenisch, T.F.; Yarom, Y.; Strackx, R. Foreshadow: Extracting the keys to the intel {SGX} kingdom with transient {Out-of-Order} execution. In Proceedings of the 27th USENIX Security Symposium (USENIX Security 18); 2018; pp. 991–1008. [Google Scholar]
- Chen, G.; Chen, S.; Xiao, Y.; Zhang, Y.; Lin, Z.; Lai, T.H. Sgxpectre: Stealing intel secrets from sgx enclaves via speculative execution. In Proceedings of the 2019 IEEE European Symposium on Security and Privacy (EuroS&, 2019, P). IEEE; pp. 142–157.
- Schwarz, M.; Schwarzl, M.; Lipp, M.; Masters, J.; Gruss, D. Netspectre: Read arbitrary memory over network. In Proceedings of the Computer Security–ESORICS 2019: 24th European Symposium on Research in Computer Security, Luxembourg, 2019, Proceedings, Part I 24. Springer, 2019, September 23–27; pp. 279–299.
- Kiriansky, V.; Waldspurger, C. Speculative buffer overflows: Attacks and defenses. arXiv preprint arXiv:1807.03757, arXiv:1807.03757 2018.
- Weisse, O.; Van Bulck, J.; Minkin, M.; Genkin, D.; Kasikci, B.; Piessens, F.; Silberstein, M.; Strackx, R.; Wenisch, T.F.; Yarom, Y. Foreshadow-NG: Breaking the virtual memory abstraction with transient out-of-order execution. Technical report 2018. [Google Scholar]
- Mohammadian Koruyeh, E.; Khasawneh, K.; Song, C.; Abu-Ghazaleh, N. Spectre Returns! Speculation Attacks using the Return Stack Buffer. arXiv e-prints 2018, arXiv–1807. [Google Scholar]
- Wang, G.; Chattopadhyay, S.; Gotovchits, I.; Mitra, T.; Roychoudhury, A. oo7: Low-overhead defense against spectre attacks via program analysis. IEEE Transactions on Software Engineering 2019, 47, 2504–2519. [Google Scholar] [CrossRef]
- Khasawneh, K.N.; Koruyeh, E.M.; Song, C.; Evtyushkin, D.; Ponomarev, D.; Abu-Ghazaleh, N. Safespec: Banishing the spectre of a meltdown with leakage-free speculation. In Proceedings of the 2019 56th ACM/IEEE Design Automation Conference (DAC). IEEE; 2019; pp. 1–6. [Google Scholar]
- Dong, X.; Shen, Z.; Criswell, J.; Cox, A.; Dwarkadas, S. Spectres, virtual ghosts, and hardware support. In Proceedings of the Proceedings of the 7th International Workshop on Hardware and Architectural Support for Security and Privacy, 2018; pp. 1–9.
- Mcilroy, R.; Sevcik, J.; Tebbi, T.; Titzer, B.L.; Verwaest, T. Spectre is here to stay: An analysis of side-channels and speculative execution. arXiv 2019, arXiv:1902.05178 2019. [Google Scholar]
- Behrens, J.; Belay, A.; Kaashoek, M.F. Performance evolution of mitigating transient execution attacks. In Proceedings of the Proceedings of the Seventeenth European Conference on Computer Systems, 2022; pp. 251–265.
- Al-Mulhem, M.; Al-Shaikh, R. Performance Evaluation of Intel and Portland Compilers Using Intel Westmere Processor. In Proceedings of the 2011 Second International Conference on Intelligent Systems, Modelling and Simulation. IEEE; 2011; pp. 261–266. [Google Scholar]
- Sun, C.; Le, V.; Zhang, Q.; Su, Z. Toward understanding compiler bugs in GCC and LLVM. In Proceedings of the Proceedings of the 25th international symposium on software testing and analysis, 2016; pp. 294–305.
- Alqurashi, F.S.; Al-Hashimi, M. An Experimental Approach to Estimation of the Energy Cost of Dynamic Branch Prediction in an Intel High-Performance Processor. Computers 2023, 12, 139. [Google Scholar] [CrossRef]
- Aljabri, N.; Al-Hashimi, M.; Saleh, M.; Abulnaja, O. Investigating power efficiency of mergesort. The Journal of Supercomputing 2019, 75, 6277–6302. [Google Scholar] [CrossRef]
- Jenkins, I.R.; Anantharaman, P.; Shapiro, R.; Brady, J.P.; Bratus, S.; Smith, S.W. Ghostbusting: Mitigating Spectre with intraprocess memory isolation. In Proceedings of the Proceedings of the 7th Symposium on Hot Topics in the Science of Security, 2020; pp. 1–11.
- Saini, S.; Hood, R.; Chang, J.; Baron, J. Performance evaluation of an Intel Haswell-and Ivy Bridge-based supercomputer using scientific and engineering applications. In Proceedings of the 2016 IEEE 18th International Conference on High Performance Computing and Communications; 2016, IEEE 14th International Conference on Smart City; IEEE 2nd International Conference on Data Science and Systems (HPCC/SmartCity/DSS). IEEE; pp. 1196–1203.
- Khan, K.N.; Hirki, M.; Niemi, T.; Nurminen, J.K.; Ou, Z. Rapl in action: Experiences in using rapl for power measurements. ACM Transactions on Modeling and Performance Evaluation of Computing Systems (TOMPECS) 2018, 3, 1–26. [Google Scholar] [CrossRef]
Figure 1.
Experiment Design Block Diagram.
Figure 1.
Experiment Design Block Diagram.
Figure 2.
Energy consumption of 10 benchmarks without Spectre mitigation, with OFF and ON indicating the unrolling state.
Figure 2.
Energy consumption of 10 benchmarks without Spectre mitigation, with OFF and ON indicating the unrolling state.
Figure 3.
Running times of 10 benchmarks without Spectre mitigation, with OFF and ON indicating the unrolling state.
Figure 3.
Running times of 10 benchmarks without Spectre mitigation, with OFF and ON indicating the unrolling state.
Figure 4.
Number of executed instructions of 10 benchmarks without Spectre mitigation. OFF and ON indicates the unrolling state.
Figure 4.
Number of executed instructions of 10 benchmarks without Spectre mitigation. OFF and ON indicates the unrolling state.
Figure 5.
Percentage of branch instructions of 10 benchmarks without Spectre mitigation, with OFF and ON indicating the unrolling state.
Figure 5.
Percentage of branch instructions of 10 benchmarks without Spectre mitigation, with OFF and ON indicating the unrolling state.
Figure 6.
Branch instruction density versus power consumption in the three compilers.
Figure 6.
Branch instruction density versus power consumption in the three compilers.
Figure 7.
Miss-prediction rate of 10 benchmarks without Spectre mitigation, with OFF and ON indicating the unrolling state.
Figure 7.
Miss-prediction rate of 10 benchmarks without Spectre mitigation, with OFF and ON indicating the unrolling state.
Figure 8.
This figure compares the energy consumption and execution time of 10 benchmarks under Spectre V1 mitigation application, with OFF and ON indicating the unrolling state. (a) shows the increased percentage of energy consumption, while (b) shows the increased percentage of time.
Figure 8.
This figure compares the energy consumption and execution time of 10 benchmarks under Spectre V1 mitigation application, with OFF and ON indicating the unrolling state. (a) shows the increased percentage of energy consumption, while (b) shows the increased percentage of time.
Figure 9.
This figure compares the energy consumption of 10 benchmarks under Spectre V2 mitigation applications, with OFF and ON indicating the unrolling state. (a) Increased percentage of energy consumption when IC and GCC IBIT are applied. (b) Increased percentage of energy consumption when IC and GCC IBET are applied. (c) Increased percentage of energy consumption when IC FCIT and FCET are applied. (d) Increased percentage of energy consumption when IC and GCC FRIT are applied. (e) Increased percentage of energy consumption when Clang RT and RTET are applied.
Figure 10.
This figure compares the 10 benchmarks under four different conditions: no-mitigation, Spectre V1 mitigation only, Spectre V2 mitigation only, and the combined application of both V1 and V2 mitigations. (a) shows the energy consumption for each condition. (b) shows the execution times, illustrating the individual and combined effects of the Spectre mitigations on performance and energy efficiency.
Table 1.
Spectre Attack Mitigation Strategies
Table 1.
Spectre Attack Mitigation Strategies
| Strategy |
Description |
| No-Mitigation |
In this strategy, the code is compiled without any mitigation.
This strategy used as a baseline for otherstrategies. |
| Comprehensive Conditional Branch Mitigation (CCBM) |
Mitigates Spectre V1 by applying fixes to all conditional branches. |
| Targeted Pattern Mitigation (TPM) |
Mitigates Spectre V1 by applying fixes to patterns of code that are
known to be susceptible to speculative execution attacks. |
| Speculative Load Defense (SLD) |
Mitigates Spectre V1 by hardening speculative loads to prevent
data leakage through speculative execution paths. |
| Indirect Branches Inline Thunk (IBIT) |
Mitigates Spectre V2 by using inline thunks for indirect branches
to prevent speculative execution vulnerabilities. Thunks are
small code snippets that act as intermediaries to redirect the
execution flow, ensuring that speculative execution does not
bypass security checks. |
| Indirect Branches External Thunk (IBET) |
Mitigates Spectre V2 by using external thunks for indirect
branches, isolating branch targets to prevent speculative execution
vulnerabilities. |
| Function Calls Inline Thunk (FCIT) |
Mitigates Spectre V2 by using inline thunks for function calls
to prevent speculative execution vulnerabilities. |
| Function Calls External Thunk (FCET) |
Mitigates Spectre V2 by using external thunks for function calls to
prevent speculative execution vulnerabilities. |
| Function Returns Inline Thunk (FRIT) |
Mitigates Spectre V2 by using external thunks for function returns
to prevent speculative execution vulnerabilities. |
| Return Trampoline (RT) |
Mitigates Spectre V2 by using return trampolines to prevent
speculative execution vulnerabilities. Return trampolines replace
indirect jumps and calls with returns to secure speculative paths. |
| Return Trampolines External Thunk (RTET) |
Mitigates Spectre V2 by using external return trampolines to
prevent speculative execution vulnerabilities. |
Table 2.
Benchmarks characteristics used in experiment
Table 2.
Benchmarks characteristics used in experiment
| Benchmark |
Workload Type |
Computational Characteristics |
| Barnes |
N-Body Simulation |
Tree-based n-body method; irregular memory access patterns |
| Canneal |
Optimization |
Simulated annealing; high memory usage, intensive data manipulation |
| Cholesky |
Dense Matrix Factorization |
Matrix operations; high computational intensity, data dependencies |
| Dedup |
Compression |
Data duplication; disk I/O intensive, moderate CPU usage |
| Ferret |
Content-Based Similarity Search |
Search and retrieval; intensive communication between processes |
| FMM |
N-Body Simulation |
Fast multi-pole method; hierarchical computations, high data locality |
| Freqmine |
Data Mining |
Frequent item set mining; intensive computation, irregular memory access |
| Oceancp |
Ocean Simulation |
Climate modeling; stencil computations, high data locality |
| Raytrace |
Image Rendering |
Ray tracing; high computational intensity, data locality |
| X264 |
Video Encoding |
H.264 video encoding; high computation, data streaming, real-time processing |
Table 3.
Corresponding Compiler Flags for Mitigation Strategies and Targeted Spectre Variants
Table 3.
Corresponding Compiler Flags for Mitigation Strategies and Targeted Spectre Variants
| Strategy |
Flag |
Compiler(s) |
Spectre
Variant |
| CCBM |
-mconditional-branch=all-fix |
IC |
V1 |
| TPM |
-mconditional-branch=pattern-fix |
IC |
V1 |
| SLD |
-mspeculative-load-hardening |
Clang |
V1 |
| IBIT |
-mindirect-branch=thunk-inline |
IC, GCC |
V2 |
| IBET |
-mindirect-branch=thunk-extern |
IC, GCC |
V2 |
| FCIT |
-mfunction-call=thunk-inline |
IC |
V2 |
| FCET |
-mfunction-call=thunk-extern |
IC |
V2 |
| FRIT |
-mfunction-return=thunk-inline |
IC |
V2 |
| RT |
-mretpoline |
Clang |
V2 |
| RTEX |
-mretpoline-external-thunk |
Clang |
V2 |
Table 4.
Machine Specification.[
32]
Table 4.
Machine Specification.[
32]
| Processor : Intel(R) Xeon(R) CPU E5-2680 v3 @ 2.50GHz |
|---|
| # of physical cores: 12 |
# of logical cores: 24 |
L1d cache: 3K |
| L1i cache: 32K |
L2 cache: 256K |
L3 cache: 30720K |
| Operating System: Lubuntu 18.04.6 LTS |
Kernal: 4.15. |
Table 5.
Total energy and time of 10 benchmarks when no Spectre mitigation is applied
Table 5.
Total energy and time of 10 benchmarks when no Spectre mitigation is applied
| Compiler |
Unrolling |
Total
Energy(W) |
Total Running
Times (s) |
| IC |
OFF |
3086 |
70.72 |
| ON |
3090 |
70.58 |
| GCC |
OFF |
2263 |
47.7 |
| ON |
2280 |
47.94 |
| Clang |
OFF |
2355 |
47.15 |
| ON |
2358 |
47.11 |
Table 6.
Energy consumption of 10 benchmarks measured in joules when compiler variant 1 mitigations are applied.
Table 6.
Energy consumption of 10 benchmarks measured in joules when compiler variant 1 mitigations are applied.
Mitigation
Strategies |
Compiler |
unroll |
Barnes |
Canneal |
Cholesky |
Dedup |
Ferret |
FMM |
Freqmine |
Oceancp |
Raytrace |
X264 |
| CCBM |
IC |
OFF |
485 |
151 |
2 |
826 |
341 |
522 |
5504 |
653 |
583 |
613 |
| ON |
482 |
152 |
2 |
838 |
346 |
520 |
5424 |
651 |
586 |
611 |
| TPM |
IC |
OFF |
172 |
123 |
1 |
676 |
256 |
132 |
1998 |
179 |
234 |
244 |
| ON |
166 |
126 |
1 |
694 |
248 |
134 |
1984 |
180 |
231 |
244 |
| SLD |
Clang |
OFF |
286 |
160 |
1 |
1053 |
642 |
171 |
683 |
184 |
685 |
398 |
| ON |
286 |
159 |
1 |
1054 |
636 |
172 |
696 |
183 |
687 |
400 |
Table 7.
Execution time of 10 benchmarks measured in seconds when compiler variant 1 mitigations are applied.
Table 7.
Execution time of 10 benchmarks measured in seconds when compiler variant 1 mitigations are applied.
Mitigation
Strategies |
Compiler |
unroll |
Barnes |
Canneal |
Cholesky |
Dedup |
Ferret |
FMM |
Freqmine |
Oceancp |
Raytrace |
X264 |
| CCBM |
IC |
OFF |
11.55 |
3.56 |
0.03 |
44.44 |
17.74 |
12.72 |
131.68 |
15.58 |
13.76 |
18 |
| ON |
11.52 |
3.6 |
0.04 |
44.24 |
17.75 |
12.67 |
131.5 |
15.57 |
13.8 |
18.01 |
| TPM |
IC |
OFF |
6.7 |
3.72 |
0.02 |
26.2 |
14.61 |
4 |
10.02 |
4.14 |
16 |
9.21 |
| ON |
6.72 |
3.69 |
0.02 |
26.14 |
14.4 |
4.02 |
10.29 |
4.11 |
15.99 |
9.21 |
| SLD |
Clang |
OFF |
3.92 |
2.93 |
0.03 |
15.77 |
6.3 |
3.07 |
46.77 |
3.96 |
5.15 |
6.39 |
| ON |
3.77 |
2.99 |
0.02 |
15.73 |
6.31 |
3.11 |
46.54 |
3.96 |
5.09 |
6.4 |
Table 8.
Number of executed instructions for 10 benchmarks (measured in billions; Cholesky in millions) when compiler variant 1 mitigations are applied.
Table 8.
Number of executed instructions for 10 benchmarks (measured in billions; Cholesky in millions) when compiler variant 1 mitigations are applied.
Mitigation
Strategies |
Compiler |
unroll |
Barnes |
Canneal |
Cholesky |
Dedup |
Ferret |
FMM |
Freqmine |
Oceancp |
Raytrace |
X264 |
| CCBM |
IC |
OFF |
84.7 |
6.0 |
2.0 |
81.0 |
41.0 |
92.2 |
233.3 |
25.6 |
24.9 |
34.2 |
| ON |
84.8 |
6.0 |
1.8 |
81.0 |
41.0 |
92.3 |
233.3 |
25.5 |
24.9 |
34.7 |
| TPM |
IC |
OFF |
40.7 |
5.7 |
1.9 |
81.0 |
41.0 |
38.2 |
209.5 |
24.4 |
23.1 |
34.8 |
| ON |
40.7 |
5.7 |
1.8 |
81.0 |
41.0 |
38.1 |
209.6 |
24.4 |
23.1 |
34.9 |
| SLD |
Clang |
OFF |
63.2 |
13.6 |
1.9 |
81.0 |
41.0 |
67.6 |
52.8 |
28.0 |
35.5 |
47.5 |
| ON |
62.8 |
13.6 |
1.8 |
81.0 |
41.0 |
61.9 |
52.6 |
27.8 |
35.4 |
47.2 |
Table 9.
Energy consumption of 10 benchmarks measured in joules when compiler variant 2 mitigations are applied.
Table 9.
Energy consumption of 10 benchmarks measured in joules when compiler variant 2 mitigations are applied.
Mitigation
Strategies |
Compiler |
unroll |
Barnes |
Canneal |
Cholesky |
Dedup |
Ferret |
FMM |
Freqmine |
Oceancp |
Raytrace |
X264 |
| IBIT |
IC |
OFF |
164 |
109 |
1 |
594 |
245 |
126 |
1226 |
178 |
432 |
259 |
| ON |
167 |
108 |
1 |
604 |
249 |
127 |
1228 |
178 |
431 |
252 |
| GCC |
OFF |
166 |
91 |
1 |
593 |
258 |
134 |
387 |
174 |
435 |
324 |
| ON |
165 |
90 |
1 |
599 |
254 |
131 |
416 |
175 |
440 |
327 |
| IBET |
IC |
OFF |
163 |
108 |
1 |
595 |
243 |
129 |
1232 |
178 |
233 |
245 |
| ON |
162 |
108 |
1 |
593 |
244 |
129 |
1231 |
178 |
231 |
246 |
| GCC |
OFF |
164 |
90 |
1 |
604 |
248 |
134 |
385 |
175 |
236 |
249 |
| ON |
165 |
91 |
1 |
604 |
246 |
130 |
412 |
176 |
235 |
250 |
| FCIT |
IC |
OFF |
162 |
107 |
1 |
591 |
242 |
129 |
1234 |
180 |
232 |
247 |
| ON |
164 |
106 |
1 |
590 |
241 |
125 |
1234 |
180 |
232 |
249 |
| FCET |
IC |
OFF |
166 |
108 |
1 |
594 |
244 |
124 |
1239 |
180 |
229 |
250 |
| ON |
163 |
109 |
1 |
592 |
247 |
125 |
1231 |
179 |
228 |
247 |
| FRIT |
IC |
OFF |
299 |
115 |
1 |
630 |
260 |
130 |
1825 |
180 |
290 |
450 |
| ON |
303 |
115 |
1 |
632 |
262 |
131 |
1828 |
179 |
294 |
459 |
| GCC |
OFF |
288 |
95 |
1 |
602 |
260 |
142 |
668 |
175 |
287 |
266 |
| ON |
297 |
96 |
1 |
603 |
256 |
135 |
684 |
174 |
296 |
272 |
| RT |
Clang |
OFF |
147 |
128 |
1 |
604 |
264 |
144 |
351 |
171 |
438 |
317 |
| ON |
145 |
129 |
1 |
605 |
262 |
132 |
354 |
172 |
429 |
314 |
| RTET |
Clang |
OFF |
146 |
82 |
1 |
602 |
263 |
130 |
348 |
171 |
349 |
291 |
| ON |
147 |
82 |
1 |
602 |
263 |
130 |
348 |
171 |
354 |
292 |
Table 10.
Execution time of 10 benchmarks measured in seconds when compiler variant 2 mitigations are applied.
Table 10.
Execution time of 10 benchmarks measured in seconds when compiler variant 2 mitigations are applied.
Mitigation
Strategies |
Compiler |
unroll |
Barnes |
Canneal |
Cholesky |
Dedup |
Ferret |
FMM |
Freqmine |
Oceancp |
Raytrace |
X264 |
| IBIT |
IC |
OFF |
3.75 |
2.55 |
0.02 |
15.77 |
6.29 |
2.93 |
27.6 |
3.89 |
9.78 |
6.39 |
| ON |
3.77 |
2.56 |
0.02 |
15.72 |
6.31 |
2.95 |
27.59 |
3.93 |
9.81 |
6.4 |
| GCC |
OFF |
3.76 |
2.14 |
0.02 |
13.32 |
5.64 |
3.12 |
5.13 |
3.94 |
9.83 |
7.38 |
| ON |
3.74 |
2.13 |
0.02 |
13.44 |
5.53 |
3.06 |
5.56 |
3.93 |
9.93 |
7.43 |
| IBET |
IC |
OFF |
3.67 |
2.55 |
0.02 |
13.55 |
12.07 |
6.4 |
62.44 |
8.67 |
11.14 |
12.25 |
| ON |
3.68 |
2.55 |
0.02 |
13.56 |
12.1 |
6.47 |
62.04 |
8.69 |
11.27 |
12.27 |
| GCC |
OFF |
3.74 |
2.13 |
0.02 |
13.6 |
5.36 |
3.21 |
5.11 |
3.93 |
5.2 |
5.81 |
| ON |
3.75 |
2.16 |
0.02 |
13.62 |
5.39 |
3.14 |
5.48 |
3.94 |
5.17 |
5.74 |
| FCIT |
IC |
OFF |
3.7 |
2.53 |
0.02 |
13.59 |
5.41 |
2.96 |
27.76 |
3.94 |
5.07 |
5.53 |
| ON |
3.72 |
2.52 |
0.02 |
13.58 |
5.45 |
2.87 |
27.75 |
3.95 |
4.95 |
5.55 |
| FCET |
IC |
OFF |
3.8 |
2.57 |
0.02 |
14.46 |
5.39 |
2.89 |
27.91 |
3.94 |
5 |
5.63 |
| ON |
3.7 |
2.55 |
0.02 |
13.6 |
5.42 |
2.86 |
27.72 |
3.93 |
4.98 |
5.68 |
| FRIT |
IC |
OFF |
6.91 |
2.72 |
0.02 |
15.66 |
6.25 |
3.01 |
41.65 |
3.95 |
6.4 |
6.35 |
| ON |
6.97 |
2.69 |
0.02 |
15.62 |
6.23 |
3.03 |
41.66 |
3.9 |
6.5 |
6.36 |
| GCC |
OFF |
6.66 |
2.25 |
0.02 |
13.58 |
5.56 |
3.31 |
9.46 |
3.94 |
6.39 |
6.07 |
| ON |
6.91 |
2.25 |
0.02 |
13.31 |
5.5 |
3.12 |
9.63 |
3.92 |
6.51 |
6.17 |
| RT |
Clang |
OFF |
3.34 |
3.04 |
0.02 |
15.53 |
5.75 |
3.38 |
5.94 |
3.87 |
9.88 |
7.23 |
| ON |
3.32 |
3.03 |
0.02 |
15.5 |
5.68 |
3.1 |
6.1 |
3.88 |
9.7 |
7.19 |
| RTET |
Clang |
OFF |
3.32 |
2.56 |
0.02 |
14.41 |
5.39 |
3.17 |
5.57 |
3.88 |
9.27 |
6.78 |
| ON |
3.33 |
2.45 |
0.02 |
14.38 |
5.33 |
2.91 |
5.72 |
3.88 |
9.1 |
6.75 |
Table 11.
Number of executed instructions for 10 benchmarks (measured in billions; Cholesky in millions) when compiler variant 2 mitigations are applied.
Table 11.
Number of executed instructions for 10 benchmarks (measured in billions; Cholesky in millions) when compiler variant 2 mitigations are applied.
Mitigation
Strategies |
Compiler |
unroll |
Barnes |
Canneal |
Cholesky |
Dedup |
Ferret |
FMM |
Freqmine |
Oceancp |
Raytrace |
X264 |
| IBIT |
IC |
OFF |
40.4 |
5.7 |
1.7 |
81.0 |
41.0 |
37.4 |
206.7 |
24.4 |
25.2 |
35.9 |
| ON |
40.3 |
5.7 |
1.8 |
81.0 |
41.0 |
37.4 |
206.8 |
24.4 |
25.2 |
36.0 |
| GCC |
OFF |
39.6 |
5.6 |
1.6 |
80.0 |
40.0 |
41.5 |
216.5 |
19.5 |
26.3 |
35.7 |
| ON |
39.5 |
5.6 |
1.6 |
79.0 |
38.0 |
40.0 |
220.5 |
17.1 |
26.2 |
35.5 |
| IBET |
IC |
OFF |
40.3 |
5.7 |
1.9 |
81.0 |
40.0 |
39.8 |
222.0 |
24.5 |
23.1 |
35.4 |
| ON |
40.4 |
5.7 |
1.8 |
81.0 |
39.0 |
40.6 |
223.1 |
24.5 |
23.1 |
35.7 |
| GCC |
OFF |
39.5 |
4.7 |
1.8 |
79.0 |
40.0 |
39.6 |
216.5 |
19.5 |
24.2 |
31.4 |
| ON |
39.5 |
4.3 |
1.7 |
79.0 |
37.0 |
40.5 |
220.5 |
17.1 |
23.2 |
30.3 |
| FCIT |
IC |
OFF |
40.5 |
5.7 |
2.1 |
81.0 |
40.0 |
37.0 |
245.1 |
24.4 |
23.1 |
34.3 |
| ON |
41.6 |
5.7 |
1.7 |
81.0 |
37.0 |
37.1 |
301.7 |
24.4 |
23.1 |
34.8 |
| FCET |
IC |
OFF |
40.4 |
5.7 |
1.8 |
81.0 |
41.0 |
37.1 |
206.8 |
24.4 |
23.1 |
34.7 |
| ON |
40.5 |
5.7 |
2.0 |
81.0 |
38.0 |
37.1 |
206.8 |
24.4 |
23.1 |
34.8 |
| FRIT |
IC |
OFF |
59.0 |
5.7 |
1.9 |
81.0 |
40.0 |
37.7 |
290.6 |
24.4 |
23.9 |
34.6 |
| ON |
59.2 |
5.7 |
2.0 |
81.0 |
39.0 |
37.8 |
210.7 |
24.4 |
23.9 |
34.8 |
| GCC |
OFF |
56.1 |
5.7 |
1.7 |
79.0 |
40.0 |
42.5 |
222.0 |
19.5 |
25.1 |
35.0 |
| ON |
57.6 |
5.7 |
1.6 |
79.0 |
39.0 |
40.0 |
225.8 |
17.1 |
25.0 |
34.5 |
| RT |
Clang |
OFF |
51.0 |
26.0 |
2.0 |
87.0 |
47.0 |
39.4 |
42.8 |
17.9 |
24.9 |
39.0 |
| ON |
41.3 |
26.1 |
1.9 |
87.0 |
42.0 |
37.9 |
41.2 |
17.8 |
24.9 |
38.7 |
| RTET |
Clang |
OFF |
51.0 |
26.0 |
2.1 |
87.0 |
48.0 |
40.5 |
42.9 |
17.9 |
25.1 |
39.0 |
| ON |
53.4 |
26.2 |
1.9 |
87.0 |
47.0 |
43.1 |
43.5 |
17.8 |
24.9 |
38.8 |
Table 12.
Power percentage increase/decrease when Spectre V1 and V2 mitigations are applied. The percentage symbol (%) is omitted in this table for clarity.
Table 12.
Power percentage increase/decrease when Spectre V1 and V2 mitigations are applied. The percentage symbol (%) is omitted in this table for clarity.
Mitigation
Strategies |
Compiler |
Unroll |
Barnes |
Canneal |
Cholesky |
Dedup |
Ferret |
FMM |
Freqmine |
Oceancp |
Raytrace |
X264 |
| CCBM |
IC |
OFF |
-2 |
2 |
41 |
-56 |
-57 |
-7 |
-5 |
-8 |
-8 |
-75 |
| ON |
-4 |
2 |
20 |
-55 |
-56 |
-5 |
-7 |
-8 |
-6 |
-23 |
| TPM |
IC |
OFF |
2 |
2 |
5 |
2 |
-8 |
-3 |
-3 |
-1 |
-1 |
118 |
| ON |
1 |
1 |
61 |
5 |
-12 |
-1 |
-3 |
0 |
0 |
116 |
| SLD |
Clang |
OFF |
-5 |
13 |
46 |
-10 |
-10 |
8 |
2 |
3 |
-36 |
-15 |
| ON |
-8 |
12 |
40 |
-10 |
-9 |
3 |
4 |
3 |
-36 |
-14 |
| IBIT |
IC |
OFF |
2 |
3 |
6 |
-11 |
-12 |
-3 |
1 |
0 |
-4 |
-8 |
| ON |
1 |
2 |
2 |
-9 |
-11 |
-1 |
1 |
-1 |
-3 |
-11 |
| GCC |
OFF |
1 |
0 |
13 |
2 |
-1 |
-1 |
0 |
1 |
-2 |
0 |
| ON |
0 |
0 |
17 |
2 |
1 |
1 |
-1 |
3 |
-2 |
0 |
| IBET |
IC |
OFF |
3 |
2 |
2 |
4 |
-55 |
-54 |
-55 |
-55 |
-54 |
-55 |
| ON |
1 |
2 |
8 |
4 |
-54 |
-54 |
-55 |
-55 |
-55 |
-55 |
| GCC |
OFF |
1 |
0 |
2 |
2 |
0 |
-3 |
0 |
2 |
0 |
-3 |
| ON |
0 |
0 |
8 |
1 |
0 |
-2 |
-1 |
3 |
1 |
-1 |
| FCIT |
IC |
OFF |
2 |
2 |
0 |
3 |
1 |
-2 |
1 |
0 |
-1 |
1 |
| ON |
1 |
1 |
14 |
3 |
0 |
0 |
1 |
0 |
3 |
1 |
| FCET |
IC |
OFF |
2 |
2 |
9 |
-3 |
2 |
-3 |
1 |
0 |
-1 |
1 |
| ON |
1 |
3 |
16 |
3 |
3 |
1 |
1 |
0 |
1 |
-2 |
| FRIT |
IC |
OFF |
1 |
2 |
13 |
-5 |
-6 |
-2 |
0 |
0 |
-2 |
61 |
| ON |
0 |
3 |
22 |
-4 |
-5 |
0 |
0 |
1 |
0 |
63 |
| GCC |
OFF |
-1 |
-1 |
9 |
1 |
1 |
0 |
-6 |
2 |
-1 |
-1 |
| ON |
-2 |
1 |
19 |
3 |
2 |
2 |
-6 |
2 |
1 |
0 |
| RT |
Clang |
OFF |
-2 |
10 |
7 |
-15 |
-7 |
7 |
-14 |
2 |
-51 |
-16 |
| ON |
-6 |
9 |
2 |
-15 |
-5 |
2 |
-13 |
2 |
-52 |
-16 |
| RTET |
Clang |
OFF |
-2 |
-16 |
4 |
-7 |
-1 |
2 |
-7 |
2 |
-44 |
-15 |
| ON |
-4 |
-13 |
0 |
-6 |
2 |
7 |
-7 |
2 |
-42 |
-15 |
Table 13.
Correlation Percentages between V1 and V2 Mitigation
Table 13.
Correlation Percentages between V1 and V2 Mitigation
| Benchmark |
Time |
Energy |
Benchmark |
Time |
Energy |
| Barnes |
3.77% |
8.10% |
Fmm |
-1.02% |
-0.96% |
| Canneal |
-2.15% |
-2.60% |
Freqmine |
-2.18% |
-3.44% |
| Cholesky |
0.23% |
0.42% |
Ocean_CP |
1.44% |
3.26% |
| Dedup |
-0.58% |
-0.60% |
Raytrace |
0.09% |
-0.08% |
| Ferret |
-0.43% |
-1.10% |
X264 |
-0.50% |
0.30% |
|
Disclaimer/Publisher’s Note: The statements, opinions and data contained in all publications are solely those of the individual author(s) and contributor(s) and not of MDPI and/or the editor(s). MDPI and/or the editor(s) disclaim responsibility for any injury to people or property resulting from any ideas, methods, instructions or products referred to in the content. |
© 2024 by the authors. Licensee MDPI, Basel, Switzerland. This article is an open access article distributed under the terms and conditions of the Creative Commons Attribution (CC BY) license (http://creativecommons.org/licenses/by/4.0/).