Submitted:
24 December 2024
Posted:
25 December 2024
You are already at the latest version
Abstract
This study investigated the impact of ESG score on the Corporate financial performance of non-financial firms (NFFs) listed in the Nigerian exchange group. In this study disclosure of ESG is considered and quantified using sentence counting (ESG Score) and financial performance is measured by Return on Assets (ROA), Return on Equity (ROE) and Book Value to Equity (BTE) which is a combination of accounting and market-based variables.Findings of the study revealed that the relationship between ESG score and Corporate financial performance in Nigerian’s non-financial firms (NFFs) has a wide landscape. The positive correlations observed between ESG score and ROA/ROE signified the potential for favorable financial outcomes associated with heightened ESG engagement. However, the unexpected negative association between ESG score and BTE introduced complexity to the relationship, indicating a potential trade-off with financial leverage. The implication of these findings is that Nigerian’s non-financial firms need to navigate the incorporation of ESG initiatives judiciously. While reaping potential benefits in terms of ROA and ROE, NFFs should carefully consider the impact it has on financial leverage. This necessitates a strategic approach that balances the social responsibility agenda with the optimization of financial structures. The study recommends NFFs to establish mechanisms for continuous monitoring and evaluation of the impact of ESG practices on various financial indicators. This involves regularly assessing the outcomes of ESG initiatives and making adjustments to ensure they are not mere diversion of companies’ resources.
Keywords:
Environmental
; Social and Governance (ESG)
; Financial Performance
; Firms
; Return on equity
; Return on Asset
; Book value to Equity
Introduction
Over the last two decades, environmental, social and governance (ESG) has become a high-profile public issue. Many organizations have faced growing pressure from various stakeholder groups (e.g., customers, government, employees, and competitors) to address a wide array of social and environmental issues this has led to increased competition, firms have responded to this pressure by developing environmental, social and governance (ESG) strategies or initiatives (Rui et al..,2019; Porter & Kramer 2006). Several researchers argue that the growing popularity of ESG around the world is as a result of the repeated failures of laws and regulations protecting stakeholders, therefore raising the need from stakeholders to protect their own interests by putting pressure on firms to engage in ESG activities. (Bénabou & Tirole, 2010; De Bettignies & Robinson, 2018). In recent times, the sustainable approach of firms in Nigeria is almost non-existent in most of the sectors, with firms more concerned with immediate profitability without recourse to socio-environmental consequences. Therefore, firms main goal moved from maximizing benefits of stockholders only to that of stakeholders (Becchetti et al., 2012). As a result, Nigerian firms started to focus on ESG initiatives in order to gain their stakeholders’ trust, to enhance their competitive position, boost the image of the firm and therefore, achieving better financial performance. (Obafemi et al.,2018; Elif Akben-Selcuk, 2019; Shafat Maqbooln & Nasir Zameer, 2017).
Currently, firms increasingly recognize the importance of generating profits, improving society and the environment. However, such activities have often been separated from a firm’s core business which is not related to its shareholder value, this could reduce their contribution to the firm’s short and long-term performance. For example, Tang et al. (2012) argue that ESG engagement is only essential if the firms are to benefit from their ESG strategy.
According to Lins et al. (2017) high-ESG firms performed better than low-ESG firms during the recent financial crisis. Research has shown that ESG disclosures can be beneficial in several ways. It can be used by investor for forecasting purposes. Investors are interested in the company’s future Financial Performance (FP) for their investment decisions. For instance, firms with high-quality ESG reports have several benefits like increased efficiency, communication tool with stakeholders, easy access to bank loans and benefits to the capital market. (Dhaliwal, et al., 2012). In contrast, firms that do not produce ESG reports can be confronted with problems like bad reputation about the company to the extent of damage of the financial performance. ESG impacts society’s concerns and is also a way of achieving even development across the nation’s states. While the primary purpose of ESG is to give back to the community and provide positive social value via carrying out philanthropic activities, these activities can be referred to as bases for development in the country, especially in developing nations like Nigeria, where the peoples’ needs far exceed available government’s resources. ESG is important in developing countries due to the rapidly growing economies, market growth and trade expansion for business organizations. As a result of the increasing inability of the government (especially developing economies) to single-handedly tackle the economic and environmental challenges of its citizens, ESG has been identified as a viable way through which the private sector can help partner with the government to shoulder the responsibilities of growth and development of the economy. Also, the rapid growth of the socio-economic needs of Nigeria are so numerous that corporate organizations must intervene to help salvage the economic situations in Nigeria. Interestingly, ESG remains one of the strategic ways through which this could be attained. However, there is a contention that sustainable development extends beyond the realm of ESG alone. It is asserted that non-financial information holds significant importance for company managers striving to attain their environmental objectives (Hank et al., 2013). According to Skare & Golja (2014) a bigger share of socially responsible firms in an economy is related to higher economic growth. Galant & Cadez (2017) infers that corporate ESG is also a significant determinant of economic growth at the level of an economy. ESG encompasses how companies handle environmental, social, and governance factors in their decision-making processes. Essentially, it's about companies considering and transparently sharing their performance in these areas to ensure accountability and informed investment choices (Zhao et al., 2018).
The definitions of firm’s performance have several wide varieties proposed in the literature. The relationship between ESG score and firm performance has been looked at from both accounting and market definitions. (Ronald & Syed, 2015) Today`s competitive and dynamic market environment has created new sets of challenges for any business which are not related to economics only. Firms must bridge the gaps in economic as well as social systems in other to survive and thrive. Maximizing shareholder`s wealth is every time essential but fulfilling that condition alone is no more valid in measuring financial prosperity (Senarante & Wijesinghe, 2011).
The scope of this study is based on secondary data obtained from annual report of non-financial firms listed in the Nigerian exchange group ranging from 2012-2022, Central Bank of Nigeria Statistical Bulletin, and other empirical sources. The selection of 30 non-financial firms for the period of 2012-2022 in the Nigerian market is justified for several reasons:
- Data Availability and Accessibility: Data on ESG score and financial performance (ROA, ROE and BTE) are typically available for this period, and are also actively present in the stock market allowing for a comprehensive analysis.
- Long-Term Trends: Analyzing over 10 years provides insights into long-term trends and allows researchers to observe the long-term impact of ESG score on return on assets (ROA), return on equity (ROE), and book value to equity (BTE).
- Market Capitalization
This study suffered some limitations like any other research. First, this study focused only on non-financial firms listed on the Nigerian exchange group within the scope of 2012-2022. Second, the study focused on the Nigerian setting consequently the external validity is low. The results cannot be generalized to other population outside the Nigerian Market. Lastly, the measurement method for ESG performance, was done based on annual reports which were self-reported disclosures by the firms. The ESG activities reported by firms might be overstated, these may produce biased results. However, this paper contributes to the current literature by providing evidence to future researchers as to the impact of ESG score on CFP of non-financial firms in the Nigerian market. Also, the findings contribution is crucial for understanding how businesses can create value beyond profit. The findings of this research have practical implications and are beneficial to the following groups: Executives, managers, employees, regulators, investors and auditors to enable them make informed decisions, while giving actionable insights for businesses looking to integrate ESG into their operations.
Review of Literature
Currently, there exist different ESG frameworks:
The ISO 26000 is one of the comprehensive and internationally recognized frameworks, the International Standard for Social Responsibility, published by the International Organization for Standardization in 2010. Another widely used framework is the GRI Standards, the global standards for sustainability reporting, developed by the Global Reporting Initiative (GRI) since 1997. The UN Global Compact, is the world's largest corporate sustainability initiative, launched by the United Nations in 2000. It also promotes UN Sustainable Development Goals (SDGs), which is the global agenda for social, environmental, and economic transformation by 2030.
Finally in 2011 SASB (Sustainability Accounting Standards Board) whose primary focus was specifically to provide investors with relevant information through creating sustainability standards. In 2020, SASB and GRI announced a collaboration, aiming to create better transparency and trust among firms. This collaboration of GRI and SASB (Sustainability Accounting Standards Board) is one of the most important frameworks for sustainability reporting. This study adopts this framework as it is relevant, credible, consistent, and useful for companies and its stakeholders. it also shows the relationships between the study's variables as illustrated below:
In theory, a lot have been linked to ESG such as the stakeholder theory proposed by Freeman (1984) “which has the protection of the interest of all relevant parties to a business as its tenet”. The stakeholder theory perspective emphasizes the importance of sustainable and responsible business practices that benefit not only shareholders but also society at large. Environmental, social, and governance (ESG) criteria align closely with stakeholder theory, as they encompass factors such as environmental impact, social responsibility, and corporate governance practices, which are central to addressing the needs and concerns of various stakeholders (El Ghoul et al., 2011).
The agency theory as propounded by Jensen and Meckling (1976) assumes that transactions costs and information costs exist which is incurred by the principal to influence the agents to work in their interest an example is bonus compensation to increase company’s profit. However, this theory outlines that ESG disclosures are used to decrease the agency costs and to reduce the existing information asymmetries between agents and principal showing that they are not working in their own interest.
In 1979, Carroll described ESG as follows: “The social responsibility of business encompasses the economic, legal, ethical, and discretionary expectations that society has of organizations at a given point in time.” Carroll's model aligns with ESG criteria, where economic responsibilities correspond to governance, legal responsibilities relate to compliance with regulations (part of governance), ethical responsibilities align with social factors, and philanthropic responsibilities correlate with environmental considerations. This integration emphasizes the importance of addressing environmental impacts, fostering social equity, and maintaining transparent governance structures to fulfill broader societal expectations and achieve sustainable development (Carroll, 1991; Elkington, 1998; Lozano, 2016).
In 1994, Lindblom’s legitimacy theory in the context of Environmental, Social, and Governance (ESG) issues, emphasizes the importance of organizations maintaining their social legitimacy by aligning their actions with societal norms and expectations. It suggests that companies need to engage in ESG practices not only to meet legal requirements but also to gain legitimacy and maintain a positive reputation. Research by Kolk and Perego (2010) highlights that organizations that actively engage in ESG activities are more likely to be perceived as legitimate and trustworthy by stakeholders, including investors, customers, employees, and communities.
This study is anchored on signaling theory proposed by Spence (1973) which suggested that entities with exclusive information can transmit reliable signals to reduce information asymmetry. According to the signal theory, companies engage in ESG activities to send positive signals about their commitment to sustainability, social responsibility, and good governance. These signals are meant to influence stakeholders' beliefs and behaviors by demonstrating the organization's values and intentions. Through ESG disclosures and actions, organizations aim to align their signals with stakeholder expectations and gain trust and support. Research by Hawn and Ioannou (2016) provides empirical evidence supporting the application of signal theory in the ESG context. They found that companies with higher ESG ratings were more likely to be perceived as more socially responsible, which influenced stakeholders' investment decisions.
Several existing literatures showed a positive relationship between ESG Score and financial performance than negative relationship. For instance, Cheng et al… (2017) examined a global sample of companies and found a positive relationship between ESG and financial performance. The researchers used a matched sample methodology and included variables such as return on assets (ROA) and Tobin's Q to assess financial performance. Hawn and Ioannou (2018) explored a large cross section of firms and found a positive relationship between ESG performance and innovation performance. The researchers used a fixed-effects regression analysis and included variables such as patents, research and development (R&D) expenses to assess innovation performance. In a study focusing on Europe, Flammer and Luo (2017) found a positive association between ESG ratings and credit ratings. The study used a panel data analysis and included variables such as credit default swap spreads and ESG ratings to assess the relationship. Wang et al… (2016) “examines the impact of mandatory ESG (ESG) reporting on firms’ financial reporting quality using a quasi-natural experiment in China that mandating a subset of firms to report their ESG activities starting in 2008”. The findings show that by improving financial reporting quality, mandatory ESG disclosure will mitigate information asymmetry. Maqbool et al… (2017) “examines the relationship between ESG and financial performance in the Indian context. Secondary data has been collected for 28 Indian commercial banks listed in Bombay stock exchange (BSE), for the period of 10 years (2007–16). The findings indicate that ESG exerts positive impact on financial performance of the Indian banks”. Emezi (2015) examined the relationship between Nigeria Breweries PLC and Lafarge Africa PLC's profitability and ESG using profit after tax and investment data obtained from secondary sources on their annual reports covering the years 2005 through 2014. After using simple regression, the research showed that the variables had a positive connection. (Uadiale & Fagbemi, 2012; Famiyeh, 2017; Hategan & Curea-Pitorac's 2017)
On the contrary, some studies have found a negative relationship between ESG and firm Performance. A study by Dimson et al… (2019) examined a global sample of companies and found a negative relationship between ESG performance and stock returns. The researchers used a long-term investment approach and included variables such as ESG ratings and stock returns to assess the relationship. In a study focusing on the United States, Friede et al… (2020) found a negative association between ESG performance and financial performance. The study utilized a panel data analysis and included variables such as return on assets (ROA) and Tobin's Q to assess financial performance. Derwall et al… (2017) examined a large sample of firms and found a negative relationship between ESG performance and risk-adjusted stock returns. The researchers used a regression analysis and included variables such as ESG ratings and stock returns to assess the relationship. (Serafeim, 2018; Madugba & Okafor, 2016; Oyewumi et al.., 2018; Geylani, & Roberts, 2012; Peng & Yang, 2014).
Due to recent changes and several arguments as to if environmental, social and governance positively or negatively impacts firm performance, some argue in favor of ESG, others say it is simply a diversion of company resource. Hence the need to look at what the position is for non-financial firms quoted in the Nigerian Stock Exchange. Therefore, this study investigates the impact of ESG score on corporate financial performance of non-financial firms quoted on the Nigeria Stock Exchange from 2012 to 2022. This was specifically done by evaluating the impact of ESG Score on ROA, ROE and BTE of non-financial firms quoted on the Nigeria Exchange group.
The following hypotheses was tested in this study;
H1: There is a positive relationship between ESG score and ROA of the non-financial firms quoted on the Nigerian exchange group.
H2: There is a positive relationship between ESG score and ROE of the non-financial firms quoted on the Nigerian exchange group.
H3: There is a positive relationship between ESG score and Book value to equity of the non-financial firms quoted on the Nigerian exchange group.
Methodology
The study design adopted two approaches combining ex post facto and cross-sectional design. It took a chronological approach using data covering ten financial years, 2012 to 2022 for non-financial firms listed on the Nigerian stock exchange. The ex post facto design is appropriately chosen to analyze historical data without researcher manipulation which naturally examines the long-term impact of ESG score on return on assets (ROA), return on equity (ROE), and book value to equity (BTE). This research relied on the acquisition of data through the extraction of information from the annual reports of the 30 selected non-financial firms for the period of 2012-2022. The annual reports are the most prominent resources of information regarding different key financial metrics and ESG activities.
Model Specification
The functional form of linear regression model will be adopted in this study given by;
Y = f(x); FP =f(ESG)
To capture the study objective, the explicit form of finance was adopted; were FP = ROA, ROE, BTE
ESG = Environmental + Social + Governance. Control Variables = Firm Size, Exchange rate and Interest rate
Model One: ROAit = β0+ β1 ESGit + β2 FSZit + β3 EXRit + β4 ITRit + ε
Model Two: ROEit = β0+ β1 ESGit + β2 FSZit + β3 EXRit + β4 ITRit + ε
Model Three: BTEit = β0+ β1 ESGit + β2 FSZit + β3 EXRit + β4 ITRit + ε
Environmental= Carbon emission+ Water usage+ Waste mgt+ energy efficiency;
Social= Diversity and inclusion+ Labor practice+ Community engagement +Human right; Governance= board diversity+ executive compensation+ shareholder right + anticorruption policies.
FP = Financial Performance;
ESG = Environmental Social and Governance;
ROE = Return on equity (Net Income/Total Equity); ROA = Return on Asset (Net Income/Total Asset);
BTE = Book value to Equity (Total Asset/Total Equity);
Β0, β1 Estimated coefficients of variables used; µ= Error term.
This model is adopted from (Rosshikapoor, 2014; Oikonomou et al. 2018) of which the result in this way can be comparable to prior studies. Several research indicates that majority of the studies that used rating-based and perceptual-based measures were conducted in developed countries where ESG is a well-developed concept (Giannarakis, 2014; Nybakk and Panwar 2015). For developing countries where ESG is still a new concept, disclosure-based and financial measures are found to be more prevalent. This study adopted disclosure-based/content analysis measure as this research looked at the Nigerian Market which is a developing country (Ahmad et al. 2014; Trang & Yekini 2014; Tuhin 2014). This literature identifies two different measures used for measuring FP: accounting-based performance measure and market-based performance measure. These methods cater for different aspects of performance, accounting based profit measures are criticized for being back-ward looking, while market-based performance measures are characterized by their forward-looking aspects and reflects expectations of shareholders concerning future performance of the company (Wahla, Shah & Hussain, 2012; Shan & McIver, 2011). In this study the book value to equity was used as a market- based measure and ROA and ROE as the accounting-based measure for FP.
Presentation and Discussion of Results
Descriptive Statistics

Table 1.
Descriptive Statistics of the Study Variables.
| ROA | ROE | BTE | ESG SCORE | FSZ | EXR | ITR | |
|---|---|---|---|---|---|---|---|
| Mean | 0.066 | 0.206 | 2.621 | 0.706 | 7.474 | 284.436 | 15.834 |
| Median | 0.060 | 0.138 | 2.086 | 0.667 | 7.554 | 305.790 | 16.723 |
| Maximum | 1.510 | 4.338 | 14.512 | 0.917 | 10.302 | 489.890 | 19.327 |
| Minimum | -0.996 | -1.159 | -3.116 | 0.500 | 5.311 | 157.311 | 11.550 |
| Std. Dev. | 0.170 | 0.455 | 1.893 | 0.064 | 0.902 | 104.639 | 2.201 |
| Skewness | 0.398 | 4.701 | 2.357 | 0.321 | 0.161 | 0.370 | -0.665 |
| Kurtosis | 31.514 | 37.350 | 13.334 | 3.164 | 3.083 | 2.201 | 2.641 |
| Jarque-Bera | 9255.633 | 14427.000 | 1467.700 | 4.985 | 1.259 | 13.501 | 21.572 |
| Probability | 0.000 | 0.000 | 0.000 | 0.083 | 0.533 | 0.001 | 0.000 |
Source: EViews 10 (2024).
Return on Assets (ROA):
Return on Assets (ROA) measures a firm's efficiency in generating profits from its total assets. The mean ROA of 0.066 indicates that, on the average, firms in the sample generate a positive return of 6.6% on their assets. However, the presence of outliers is suggested by the higher median of 0.060. The substantial range between the minimum (-0.996) and maximum (1.510) values underscores significant variability in the performance of assets across the sample. The standard deviation of 0.170 reflects the dispersion of ROA values around the mean. These findings imply that some firms experience exceptionally high or low returns on their assets, potentially influencing overall profitability.
Return on Equity (ROE):
Return on Equity (ROE) signifies a company's profitability in relation to its equity. The mean ROE of 0.206 indicates an average return of 20.6%, while the lower median of 0.138 suggests potential skewness influenced by outliers. The wide range from -1.159 to 4.338 highlights substantial variability in ROE across the sample. A standard deviation of 0.455 indicates the extent of dispersion around the mean. These statistics suggest that some firms exhibit significantly higher or lower returns on equity, possibly influencing investor perceptions and strategic decision-making.
Book Value to Equity (BTE):
Book Value to Equity (BTE) is a measure of financial leverage. The mean BTE of 2.621 implies an average book value 2.6 times the equity. However, the presence of outliers is indicated by the median of 2.086. The wide range from -3.116 to 14.512 signifies considerable variability in financial structures among the sampled firms. The standard deviation of 1.893 underscores the dispersion of BTE values. This variation suggests diverse financial strategies, potentially impacting risk and financial stability for different firms.
ESG Score:
Environmental, Social and Governance (ESG) represents a firm's commitment to societal and environmental concerns. The mean ESG score of 0.706 indicates a positive average commitment level, with a relatively symmetrical distribution suggested by the median of 0.667. The limited range from 0.500 to 0.917 implies a narrow spectrum of ESG practices among the sampled firms. The low standard deviation of 0.064 signifies little variability, suggesting a consistent level of social responsibility. These findings suggest a relatively uniform dedication to ESG among the firms, potentially influencing stakeholder relationships and reputation.
Firm Size (FSZ):
Firm Size (FSZ) reflects the magnitude of firms in the sample. The mean firm size of 7.474 indicates an average size, while the median of 7.554 hints at potential outliers. The moderate ranges from 5.311 to 10.302 suggests a diverse distribution of company sizes. The standard deviation of 0.902 signifies the dispersion of firm size values. These statistics imply variations in the scale of operations among firms, potentially influencing market presence, resource allocation, and strategic considerations.
Exchange Rate (EXR):
Exchange Rate (EXR) represents the average currency exchange rates faced by the firms. The mean EXR of 284.436 suggests an average exchange rate, with potential outliers indicated by the median of 305.790. The substantial ranges from 157.311 to 489.890 underscores considerable variability in exchange rates across the sample. The high standard deviation of 104.639 reflects the dispersion of EXR values. These findings imply that firms deal with a broad range of exchange rates, which may impact international transactions, financial performance, and risk exposure.
Interest Rate (ITR):
Interest Rate (ITR) represents the prevailing interest rates. The mean ITR of 15.834 indicates an average interest rate, with potential outliers suggested by the median of 16.723. The moderate ranges from 11.550 to 19.327 implies variability in interest rates among the sampled firms. The standard deviation of 2.201 signifies the dispersion of interest rate values. These statistics suggest diverse financing conditions for firms, potentially influencing borrowing costs, investment decisions, and overall financial health.
Correlation Analysis
The Pearson correlation method was adopted to investigate the relationship among the study variables and also to check if there exist multicollinearity among the variables of the study.
Table 2, Table 3 and Table 4 provides Pearson’s correlation matrix of the model. The results showed that the pairwise Pearson’s correlation coefficients ranged from -0.013 to 0.39. This indicated that all the pairwise Pearson’s correlation coefficients were less than 1. The implication is to expect an absence of multicollinearity among regressors in the estimated regression model.
Regression Analysis
Statement of Research Objective One
Model One: ROAit = β0+ β1 ESGit + β2 FSZit + β3 EXRit + β4 ITRit + ε
The Hausman Test is utilized in Table 4.3.1 to evaluate the suitability of incorporating correlated random effects in the model. The test summary indicates a Chi-Square statistic of 7.453 with 4 degrees of freedom, leading to a probability (Prob.) value of 0.114. The Chi-Square statistic reflects the discrepancy between the estimates obtained from the fixed effects and random effects models. The computed probability of 0.114 exceeds the standard significance limit of 0.05 in this instance. Consequently, according to the findings of the Hausman Test, there is not enough evidence to dismiss the null hypothesis that the random effects model is suitable.
In Table 4.3.2, a random effects regression model is applied to examine the relationship between the dependent variable, Return on Assets (ROA), and various independent variables. The results are as follows:
The intercept term (C) is not statistically significant (Coefficient = -0.090, Std. Error = 0.313, t-Statistic = -0.286, Prob. = 0.775), suggesting that, on average, there is no significant impact on ROA when other variables are held constant.
The variable ESG_SCORE has a statistically significant positive impact on ROA (Coefficient = 0.415, Std. Error = 0.182, t-Statistic = 2.274, Prob. = 0.024). This implies that an increase in ESG score is associated with a significant positive change in ROA. Firms emphasizing ESG may experience enhanced financial performance as it could means that these firms are more efficient and productive at managing its balance sheet to generate profit.
The variable FSZ is not statistically significant (Coefficient = 0.013, Std. Error = 0.039, t-Statistic = 0.327, Prob. = 0.744), indicating that firm size does not have a significant impact on ROA in the context of the model.
Exchange Rate (EXR) exhibits a statistically significant negative impact on ROA (Coefficient = 0.000, Std. Error = 0.000, t-Statistic = -2.811, Prob. = 0.005). This suggests that an increase in the exchange rate is associated with a significant decrease in ROA. Fluctuations in exchange rates negatively influence financial performance. The volatility of business environment with regards to exchange rate affects firms’ financial performance negatively through import price, producer price and consumer price.
Interest Rate (ITR) is not statistically significant (Coefficient = -0.008, Std. Error = 0.006, t-Statistic = -1.421, Prob. = 0.157), indicating that interest rates do not have a significant impact on ROA in the specified model.
The overall model's goodness-of-fit is reflected in an R-squared of 0.5787, indicating that approximately 57.87% of the variation in ROA is explained by the model. The F-statistic of 1.8234 with a corresponding p-value of 0.0081 suggests that the model is statistically significant. The Durbin-Watson statistic of 1.954 indicates the absence of autocorrelation.
In summary, ESG Score positively influence ROA, while exchange rates negatively impact it. The non-significance of firm size and interest rate variables suggests that, in the context of this model, they do not play a significant role in explaining variations in ROA. These findings offer valuable insights for strategic decision-making, emphasizing the importance of ESG and considering the impact of exchange rates on financial performance.
Statement of Research Objective Two
Model Two: ROEit = β0+ β1 ESGit + β2 FSZit + β3 EXRit + β4 ITRit + ε
The Hausman Test is utilised in Table 4.3.3 to evaluate the suitability of incorporating correlated random effects in the model. The test summary indicates a Chi-Square statistic of 5.402 with 4 degrees of freedom, leading to a probability (Prob.) value of 0.248. The Chi-Square statistic reflects the discrepancy between the estimates obtained from the fixed effects and random effects models. The computed probability of 0.248 exceeds the standard significance limit of 0.05 in this instance. Consequently, according to the findings of the Hausman Test, there is not enough evidence to dismiss the null hypothesis that the random effects model is suitable.
In Table 4.3.4, a random effects regression model is employed to examine the relationship between the dependent variable, Return on Equity (ROE), and various independent variables. The results are as follows:
The intercept term (C) is marginally significant (Coefficient = 1.459, Std. Error = 0.812, t-Statistic = 1.795, Prob. = 0.074), suggesting a potential impact on ROE when other variables are held constant.
The variable ESG_SCORE has a statistically significant positive impact on ROE (Coefficient = 1.192, Std. Error = 0.473, t-Statistic = 2.520, Prob. = 0.025). This implies that an increase in ESG score is associated with a significant positive change in ROE. Firms emphasizing ESG may experience enhanced return on equity, as ESG helps to enhance reputation and firms’ image.
Firm Size (FSZ) exhibits a statistically significant negative impact on ROE (Coefficient =-0.202, Std. Error = 0.102, t-Statistic = -1.976, Prob. = 0.045). This suggests that larger firms may experience a decrease in return on equity, potentially indicating challenges related to efficiency or risk management as firms grow in size.
Exchange Rate (EXR) is not statistically significant (Coefficient = 0.316, Std. Error = 0.344, t-Statistic = 0.919, Prob. = 0.359), indicating that, in the context of the model, exchange rates do not have a significant impact on ROE.
Interest Rate (ITR) is not statistically significant (Coefficient = -0.001, Std. Error = 0.015, t-Statistic = -0.042, Prob. = 0.967), suggesting that interest rates do not have a significant impact on ROE in the specified model.
The overall model's goodness-of-fit is reflected in an R-squared of 0.528, indicating that approximately 52.8% of the variation in ROE is explained by the model. The F-statistic of 6.471 with a corresponding p-value of 0.000 suggests that the model is statistically significant. The Durbin-Watson statistic of 2.103 indicates no autocorrelation.
In summary, ESG Score positively influence ROE, while firm size has a negative impact, indicating potential challenges for larger firms. The non-significance of exchange rates and interest rates suggests that, in the context of this model, they do not play a significant role in explaining variations in ROE.
Statement of Research Objective Three
Model Three: BTEit = β0+ β1 ESGit + β2 FSZit + β3 EXRit + β4 ITRit + ε
The Hausman Test is utilised in Table 4.3.5 to evaluate the suitability of incorporating correlated random effects in the model. The test summary indicates a Chi-Square statistic of 5.377 with 4 degrees of freedom, leading to a probability (Prob.) value of 0.251. The Chi-Square statistic reflects the discrepancy between the estimates obtained from the fixed effects and random effects models. The computed probability of 0.251 exceeds the standard significance limit of 0.05 in this instance. Consequently, according to the findings of the Hausman Test, there is not enough evidence to dismiss the null hypothesis that the random effects model is suitable.
In Table 4.3.6, a random effects regression model is applied to explore the relationship between the dependent variable, Book Value to Equity (BTE), and various independent variables. The results are as follows:
The intercept term (C) is not statistically significant (Coefficient = -4.595, Std. Error = 2.879, t-Statistic = -1.596, Prob. = 0.112), indicating that, on average, there is no significant impact on BTE when other variables are held constant.
The variable ESG_SCORE has a statistically significant negative impact on BTE (Coefficient = -3.932, Std. Error = 1.676, t-Statistic = -2.347, Prob. = 0.029). This implies that an increase in ESG score is associated with a significant negative change in the book value to equity ratio. Firms emphasizing ESG may experience a decrease in this financial leverage metric.
Firm Size (FSZ) exhibits a statistically significant positive impact on BTE (Coefficient = 1.338, Std. Error = 0.361, t-Statistic = 3.702, Prob. = 0.000). This suggests that larger firms have a significantly higher book value to equity ratio, indicating potentially greater financial leverage.
Exchange Rate (EXR) is not statistically significant (Coefficient = 0.000, Std. Error = 0.001, t-Statistic = 0.234, Prob. = 0.815), indicating that, in the context of the model, exchange rates do not have a significant impact on BTE.
Interest Rate (ITR) is marginally not statistically significant (Coefficient = -0.080, Std. Error = 0.052, t-Statistic = -1.543, Prob. = 0.124), suggesting that interest rates may not have a significant impact on BTE in the specified model.
The overall model's goodness-of-fit is reflected in an R-squared of 0.439, indicating that approximately 43.9% of the variation in BTE is explained by the model. The F-statistic of 6.553 with a corresponding p-value of 0.000 suggests that the model is statistically significant. The Durbin-Watson statistic of 1.914 indicates potential autocorrelation.
In summary, ESG score negatively influence the book value to equity ratio, while firm size has a positive impact. The non-significance of the intercept term, exchange rates, and the marginal significance of interest rates suggest that these factors may not play a significant role in explaining variations in BTE.
Discussion of Findings
ESG Score and Return on Assets
The ESG Score in relation to Return on Assets (ROA) provides valuable insights into the financial dynamics of Nigerian’s non-financial firms. The mean ROA of 0.066, accompanied by a statistically significant positive correlation (r = 0.045, p = 0.024) and a significant positive coefficient for ESG score in the regression (Coefficient = 0.415, Std. Error = 0.182, t-Statistic = 2.274, Prob. = 0.024), suggests that firms with robust ESG engagement tend to experience higher returns on assets.
This aligns with the empirical findings of Cheng et al (2017) in a global sample of companies showcasing the positive association between ESG and firm financial performance. Also, Maqbool et al… (2017) findings indicated that ESG exerts positive impact on financial performance of the Indian banks. The consistent positive relationship observed in our study resonates with the argument that a strategic ESG agenda can contribute to enhanced financial outcomes for firms (Hawn et al., 2018; Busch et al., 2019).
The positive correlation between ESG Score and ROA in Nigerian’s non-financial firms can be interpreted through the lens of agency theory. This theory posits that firms, as agents, act on behalf of stakeholders, and the alignment of their interests is crucial for organizational success. Effective ESG practices can be seen as a mechanism to mitigate agency conflicts by fostering trust and goodwill with stakeholders, leading to improved financial performance.
Carroll's model, encompassing economic, legal, ethical, and philanthropic responsibilities, further supports our findings. The positive relationship between ESG Score and ROA implies that firms integrating social and environmental responsibilities into their operations are not only meeting legal and ethical obligations but also enhancing economic performance.
ESG Score and Return on Equity
The exploration of ESG Score in relation to Return on Equity (ROE) provides significant insights into the financial dynamics of Nigerian’s non-financial firms. The mean ROE of 0.206, coupled with a statistically significant positive correlation (r = 0.049, p = 0.025) and a substantial positive coefficient for ESG score in the regression (Coefficient = 1.192, Std. Error = 0.473, t-Statistic = 2.520, Prob. = 0.025), collectively suggests that firms with elevated ESG engagement tend to achieve higher returns on equity.
This finding aligns with the study of Shimizu and Okazaki (2020), which identified a positive impact of ESG score on the financial performance focusing on the Japan market. Additionally, the research by Wang et al. (2016) supports our findings, indicating that mandatory ESG reporting can enhance financial reporting quality. These consistent positive associations resonate with the broader notion that ESG practices play a vital role in positively influencing various financial metrics.
The positive correlation between ESG score and ROE in Nigerian’s non-financial firms can be understood through the lens of Stakeholder Theory. According to this theory, businesses operate within a network of relationships with various stakeholders, and the integration of ESG practices is seen as a means of addressing stakeholder concerns. Positive relationships with stakeholders, fostered through ESG initiatives, can contribute to enhanced firm’s performance, as reflected in higher returns on equity.
Additionally, signal theory where ESG activities act as quality signals, indicating a firm's commitment to sustainable practices and ethical governance, thereby reducing information asymmetry and attracting investors seeking sustainable investment opportunities, resulting in improved financial performance.
ESG Score and Book value to Equity
The examination of ESG Score in relation to Book Value to Equity (BTE) provides valuable insights into the financial structures of Nigerian’s non-financial firms. The mean BTE of 2.621, accompanied by a statistically significant negative correlation (r = -0.035, p = 0.029) and a substantial negative coefficient for ESG score in the regression (Coefficient =-3.932, Std. Error = 1.676, t-Statistic = -2.347, Prob. = 0.029), suggests that higher ESG score are associated with lower book value to equity ratios.
This finding aligns with the study of Oyewumi et al. (2018) in Nigeria, which emphasizes that ESG investment might have limited impact on corporate financial performance. The mixed results reported in previous studies (Madugba & Okafor, 2016;) underline the context-specific nature of the ESG and financial performance relationship, influenced by factors such as the stage of ESG in the country, the time period covered, and the industry sector.
The negative association between ESG score and Book Value to Equity (BTE) in Nigerian’s non-financial firms can be interpreted through the Resource-Based View (RBV). According to RBV, firms leverage resources and capabilities to gain a competitive advantage. In this context, ESG practices may be perceived as a diversion of resources towards social and environmental initiatives, potentially impacting financial leverage. Firms may prioritize ESG at the expense of optimizing their financial structure, leading to lower book value to equity ratios.
Legitimacy theory also provides insights, suggesting that firms engaging in ESG integration may prioritize building a positive image rather than optimizing financial metrics. While ESG initiatives contribute to social legitimacy, they might not align with financial leverage optimization, leading to the observed negative relationship with BTE.
Conclusion
The detailed analysis of the relationship between ESG score and financial performance in Nigerian’s NFFs has revealed a nuanced landscape. The positive correlations observed between ESG score and Return on Assets (ROA) and Return on Equity (ROE) signify the potential for favorable financial outcomes associated with heightened ESG engagement. However, the unexpected negative association between ESG score and Book Value to Equity (BTE) introduces complexity to this relationship, indicating a potential trade-off with financial leverage.
The positive connections between ESG score and ROA, as well as ESG score and ROE, suggest that firms emphasizing social responsibility tend to experience improved returns on both assets and equity. This aligns with the broader narrative that responsible business practices can positively impact specific financial metrics. However, the negative relationship between ESG score and BTE implies that while ESG initiatives may enhance certain financial aspects, they could be linked to lower book value to equity ratios, signaling a potential challenge in optimizing financial leverage.
The implication of these findings is that Nigerian NFFs need to navigate the incorporation of ESG initiatives judiciously. While reaping potential benefits in terms of ROA and ROE, firms should carefully consider the impact on financial leverage, as indicated by the negative association with BTE. This necessitates a strategic approach that balances the social responsibility agenda with the optimization of financial structures.
Based on the results from the study, the following suggestions were made:
First, Nigerian firms should engage in strategic ESG agenda that can contribute to enhanced financial outcome. Second, Nigerian firms should invest more in the area of sustainability as a form of ESG thereby ensuring that the people could achieve the much-needed development. Third, based on a negative relationship between ESG and BTE, the researcher suggests that in implementing ESG programmes, firms should pay attention to long term strategic planning as ESG practices impacts financial metrics differently. Fourth, establish mechanisms for continuous monitoring and evaluation of the impact of ESG practices on various financial indicators. This involves regularly assessing the outcomes of ESG initiatives and making adjustments to ensure they are not mere diversion of companies’ resources. Fifth, actively engage with various stakeholders, including customers, employees, and communities, to understand their expectations and concerns regarding ESG practices. This inclusive approach can help tailor ESG initiatives that resonate positively with stakeholders and contribute to financial success
References
- Adriana Galant; Simon Cadez. ESG and financial performance relationship: a review of measurement approaches. Economic Research- Ekonomska Istraživanja 2017, 30, 676–693. [Google Scholar] [CrossRef]
- Ahmad, W. S, Almsafir, M. K, Al-Smadi, A. W. Does ESG lead to improve in firm financial performance? Evidence from Malaysia. International Journal of Economics and Finance 2014, 6, 126–138. [Google Scholar]
- Akanksha Shukla, Geetika and Nimesh Shukla. Business Perspectives and Research 2021, 10, 101–120.
- Amee, I. D. Voluntary vs. mandatory ESG. International Journal for Innovative Research in Multidisciplinary Field 2017, 3, 204–208, https://www.globalreporting.org/Pages/default.aspx. [Google Scholar]
- Amole, B. Adebiyi, S. & Awolaja, A. ESG and profitability in Nigeria Bank. A causal Relationship. Research Journal of Finance and Accounting 2012, 3, 6–17. [Google Scholar]
- Aras, G. , Aybars A., Kutlu O. Investigating the relationship between ESG and financial performance in emerging markets. Managing corporate performance 2010, 59, 229–254. [Google Scholar] [CrossRef]
- Baird, P. L. , Geylani, P. C., & Roberts, J. A. Corporate social and financial performance re-examined: Industry effects in a linear mixed model analysis. Journal of Business Ethics 2012, 109, 367–388. [Google Scholar] [CrossRef]
- Becchetti, L. , Ciciretti, R., Hasan, I., & Kobeissi, N. ESG and shareholder's value. Journal of Business Research 2012, 65, 1628–1635. [Google Scholar] [CrossRef]
- Bénabou, R. , Tirole, J. Individual and ESG. Economica 2010, 77, 1–19. [Google Scholar] [CrossRef]
- Busch, T. , Friede, G., & Giner, B. ESG and financial performance: Aggregated evidence from more than 2000 empirical studies. Journal of Sustainable Finance & Investment 2019, 9, 210–233. [Google Scholar]
- Carroll, A. B. The pyramid of ESG: Toward the moral management of organizational stakeholders. Business Horizons 1991, 34, 39–48. [Google Scholar] [CrossRef]
- Changhong Zhao, Yu Guo, Jiahai Yuan, Mengya Wu, Daiyu Li, Yiou Zhou and Jiangang Kang. ESG and Corporate Financial Performance: Empirical Evidence from China’s Listed Power Generation Companies. Sustainability 2018, 10, 2607. [Google Scholar] [CrossRef]
- Chen, T. , Dong, H. and Lin, C. Institutional shareholders and ESG. Journal of Financial Economics 2020, 135, pp.483–504. [Google Scholar] [CrossRef]
- Cheng, B. , Ioannou, I., & Serafeim, G. ESG and access to finance. Strategic Management Journal 2017, 38, 1665–1685. [Google Scholar]
- De Bettignies, J. , Robinson, D.T. When is social responsibility socially desirable? J. Labor Econom. 2018, 36, 1023–1072. [Google Scholar] [CrossRef]
- Derwall, J. , Koedijk, K., & Ter Horst, J. A tale of values-driven and profit-seeking social investors. Journal of Banking & Finance 2017, 73, 188–201. [Google Scholar]
- Dhaliwal, D. S. , Radhakrishnan, S., Tsang, A., & Yang, Y. G. Nonfinancial disclosure and analyst forecast accuracy: International evidence on ESG disclosure. Accounting Review 2012, 87, 723–759, .disclosures measures. REVISTA ESPAÑOLA DE FINANCIACIÓN Y. [Google Scholar] [CrossRef]
- Dimson, E. , Karakas, O., & Li, X. Active ownership. Review of Financial Studies 2019, 32, 2564–2612. [Google Scholar]
- El Ghoul, S. , Guedhami, O., Kwok, C. C. Y., & Mishra, D. R. Does ESG affect the cost of capital? Journal of Banking & Finance 2011, 35, 2388–2406. [Google Scholar] [CrossRef]
- Elkington, J. (1998). Partnerships from Cannibals with Forks: The Triple Bottom Line of 21st-Century Business. Environmental Quality Management 1998, 8, 37–51. [Google Scholar] [CrossRef]
- Emezi, C. N. N. (2015). The impact of ESG (ESG) on organization profitability. International Journal of Business and Management.
- Famiyeh, S. ESG and firm's performance: Empirical evidence. Social Responsibility Journal 2017, 13, 390–406. [Google Scholar] [CrossRef]
- Flammer, C. , & Luo, J. ESG as an employee governance tool: Evidence from a quasi-experiment. Strategic Management Journal 2017, 38, 163–183. [Google Scholar]
- Freeman, R. E. (1984). Strategic management: A stakeholder approach. Pitman.
- Friede, G. , Busch, T., & Bassen, A. ESG and financial performance: Unraveling the link. SSRN Electronic Journal, 2022.
- Giannarakis, G. Corporate Governance and financial characteristic effects on the extent of ESG disclosure. Social Responsibility Journal, 10(4), 569–590. Governance: An International Review 2014, 20, 432–450. [Google Scholar]
- Hank, C. , Alewine, & Dan N. Stone. How does environmental accounting information influence attention and investment? International Journal of Accounting and Information Management 2013, 21, 22–52. [Google Scholar]
- Hategan, C. , & Curea-Pitorac, R. Testing the Correlations between Corporate Giving, Performance and Firm Value. Sustainability 2017, 9, 1–20. [Google Scholar]
- Hawn, O. , & Ioannou, I. Mind the gap: The interplay between external and internal actions in the case of ESG. Strategic Management Journal 2016, 37, 2569–2588. [Google Scholar]
- Imhanze, I. , & Belonwu, S. The Nigerian code of corporate governance: A call for appropriate enforcement mechanisms. SSRN Electronic Journal, 2019, 1–9.Implications of National Institutions and Industry Risk Characteristics. Corporate. [CrossRef]
- Jensen, M. C. , & Meckling, W. H. Theory of the firm: Managerial behaviour, agency costs and ownership structure. Journal of Financial Economics 1976, 1, 305–360. [Google Scholar] [CrossRef]
- Khan, M. , Serafeim, G., & Yoon, A. Corporate sustainability: First evidence on materiality. The Accounting Review 2018, 94, 297–332. [Google Scholar]
- Kolk, A. , & Perego, P. Determinants of the adoption of sustainability assurance statements: An international investigation. Business Strategy and the Environment 2010, 19, 182–198. [Google Scholar]
- Lins, K.V. , Servaes, H., Tamayo, A. Social capital, trust, and firm performance: the value of ESG during the financial crisis. J. Financ 2017, 72, 1785–1824. [Google Scholar] [CrossRef]
- Lozano, R. Aligning Organizational Learning and Strategic Management with Environmental Sustainability: A Model Based on the Triple Bottom Line Framework. Sustainability Science 2016, 11, 1–14. [Google Scholar]
- Madugba, J. U. , & Okafor, M. C. (2016). Impact of ESG on financial performance: Evidence from listed banks in Nigeria. Expert Journal of Finance 2016, 4, 1–9, . https://finance.expertjournals.com/ark:/16759/EJF_401madugba1- 9-1.pdf.. [Google Scholar]
- Meyer, Y. Initiatives aimed at ensuring transparency and accountability in the Nigerian petroleum industry: A critical appraisal of the Nigeria Extractive Industry Transparency Initiative (NEITI), the NEITI Act and the Petroleum Industry Governance Bill (PIGB). Southern African Public Law 2019, 34, 1–28. [Google Scholar] [CrossRef]
- Nybakk, E. Panwar, R. Understanding instrumental motivations for social responsibility engagement in a micro-firm context. Business Ethics: A European Review 2015, 24, 18–33. [Google Scholar] [CrossRef]
- Obafemi, R. Oyewumi, Oluwabunmi A. Ogunmeru, Collins S. Oboh. Investment in ESG, disclosure practices, and financial performance of banks in Nigeria. Future Business Journal 2018, 4, 195–205. [Google Scholar]
- Oikonomou, I. , Brooks, C., & Pavelin, S. The effects of corporate social performance on the cost of corporate debt and credit ratings. Financial Review 2014, 49, 49–75. [Google Scholar]
- Osemeke, L. , Adegbite, S., & Adegbite, E. ESG initiatives in Nigeria. In: Idowu, S. (Ed.), Key Initiatives in ESG: Global Dimension of ESG in Corporate Entities. Switzerland: Springer, 2016, Cham. [CrossRef]
- Ozili, P. K. Corporate governance research in Nigeria: a review. SN Business & Economics 2020, 1, 1–32. [Google Scholar] [CrossRef]
- Park, K. , & Lee, S. ESG and financial performance: Evidence from South Korea. Sustainability 2021, 13, 4313. [Google Scholar]
- Peng, C. W. , & Yang, M. L. The effect of corporate social performance on financial performance: The moderating effect of ownership concentration. Journal of Business Ethics 2014, 123, 171–182. [Google Scholar] [CrossRef]
- Permana, R. B. Mandatory or voluntary ESG? Experience from Indonesia. SSRN Electronic Journal, 2019, 1–11.qualitative approaches. Boston, MA: Allyn and Bacon. [CrossRef]
- Ronald, W. Masulis, Syed Walid Reza, Agency Problems of Corporate Philanthropy, The Review of Financial Studies, Volume 28, Issue 2, 15, Pages 592–636. 20 February. [CrossRef]
- Rosshikapoor Moenna. ESG and Financial Performance: An Empirical Analysis on EU’s top fifty Listed Companies. Erasmus School of Economics Section Accounting, 2014, Auditing and Control.
- Samanthi Senarante and Nayomi Wijesinghe. Impact of Disclosure of ESG on Corporate Financial Performance in Bank, 2011, Finance and Insurance Sector in Sri Lanka.
- Serafeim, G. The role of the corporation in society: An alternative view and opportunities for future research. Business & Society 2018, 57, 591–610. [Google Scholar]
- Shafat Maqbooln and, M. Nasir Zameer. ESG and financial performance: An empirical analysis of Indian bank. Future Business Journal 2018, 4, 84–93. [Google Scholar]
- Shan, Y. G. , & McIver, R. P. Corporate governance mechanisms and financial performance in China: panel data evidence on listed non-financial companies. Asia Pacific Business Review 2011, 17, 301–324. [Google Scholar] [CrossRef]
- Skare, M. , & Golja, T. The impact of government ESG supporting policies on economic growth. Journal of policy modeling 2014, 36, 562–577. [Google Scholar] [CrossRef]
- Shimizu, K. , & Okazaki, K. Environmental, social, and governance performance and firm value: Evidence from Japanese firms. Pacific-Basin Finance Journal 2020, 62, 101326. [Google Scholar]
- Spence, M. Job Market Signaling. The Quarterly Journal of Economics 1973, 87, 355–374. [Google Scholar] [CrossRef]
- Staub-Bisang, M. Independent Capital Group: The Importance of Sustainable Value Creation as an Investment Criterion. In: D'heur, M. (eds) Sustainable Value Chain Management. ESG, Sustainability, Ethics & Governance. Springer, 2015, Cham. [CrossRef]
- Tapang, A. T. , Uklala, A. P., Bassey, B. E., Ezuwore-Obodoekwe, C. N., Onyeanu, E. O.Ozoji, A. P., Ojiakor, I. P., Takon, S. M., Obim, E. N., & Obo, E. B. Mediating effect of firm size on ESG cost and financial performance of listed non-financial companies in Nigeria. Academy of Accounting and Financial Studies Journal 2021, 25, 115, https://www.researchgate.net/publication/355741741_mediating_effect_of_firm_size_on_corporate_social_responsibility_cost_and_financial_performance_of_listed_non-_financial_companies_in_nigeria. [Google Scholar]
- Trang, H. N. T. Yekini, L. S. Investigating the link between ESG and financial performance: Evidence from Vietnamese listed companies. British Journal of Arts and Social Sciences.
- Tuhin, M. H. Does ESG expenditure affect financial performance of Islamic banks in Bangladesh? Middle East Journal of Business 2014, 9, 44–50. [Google Scholar] [CrossRef]
- Uadiale, O. M. , & Fagbemi, T. O. ESG and financial performance in developing economies: The Nigerian experience. Journal of Economics and Sustainable Development 2012, 3, 44–54. [Google Scholar]
- Visser, W. ESG in Developing Countries, Oxford: Oxford University Press, 2008, Vol.59 No.3, 2010.
- Wahla, K. , Shah, S., & Hussain, Z. Impact of ownership structure on firm performance evidence from non-financial listed companies at Karachi Stock Exchange. International Research Journal of Finance and Economics 2012, 84, 7–13, Retrieved from http://bit.ly/2Gl9nWG. [Google Scholar]
- Xue Wang, Feng Cao, Kangtao Ye. Mandatory ESG (ESG) Reporting and Financial Reporting Quality: Evidence from a Quasi-Natural Experiment. J Bus Ethics, 2016. Springer Science Business Media Dordrecht. [CrossRef]
- Zhi Tang, Clyde Eiríkur Hull and Sandra Rothenberg. How ESG Engagement Strategy Moderates the ESG–Financial Performance Relationship. Journal of management Studies, 2012. [CrossRef]
Figure 1.
Study Conceptual Framework. Adopted by Author.
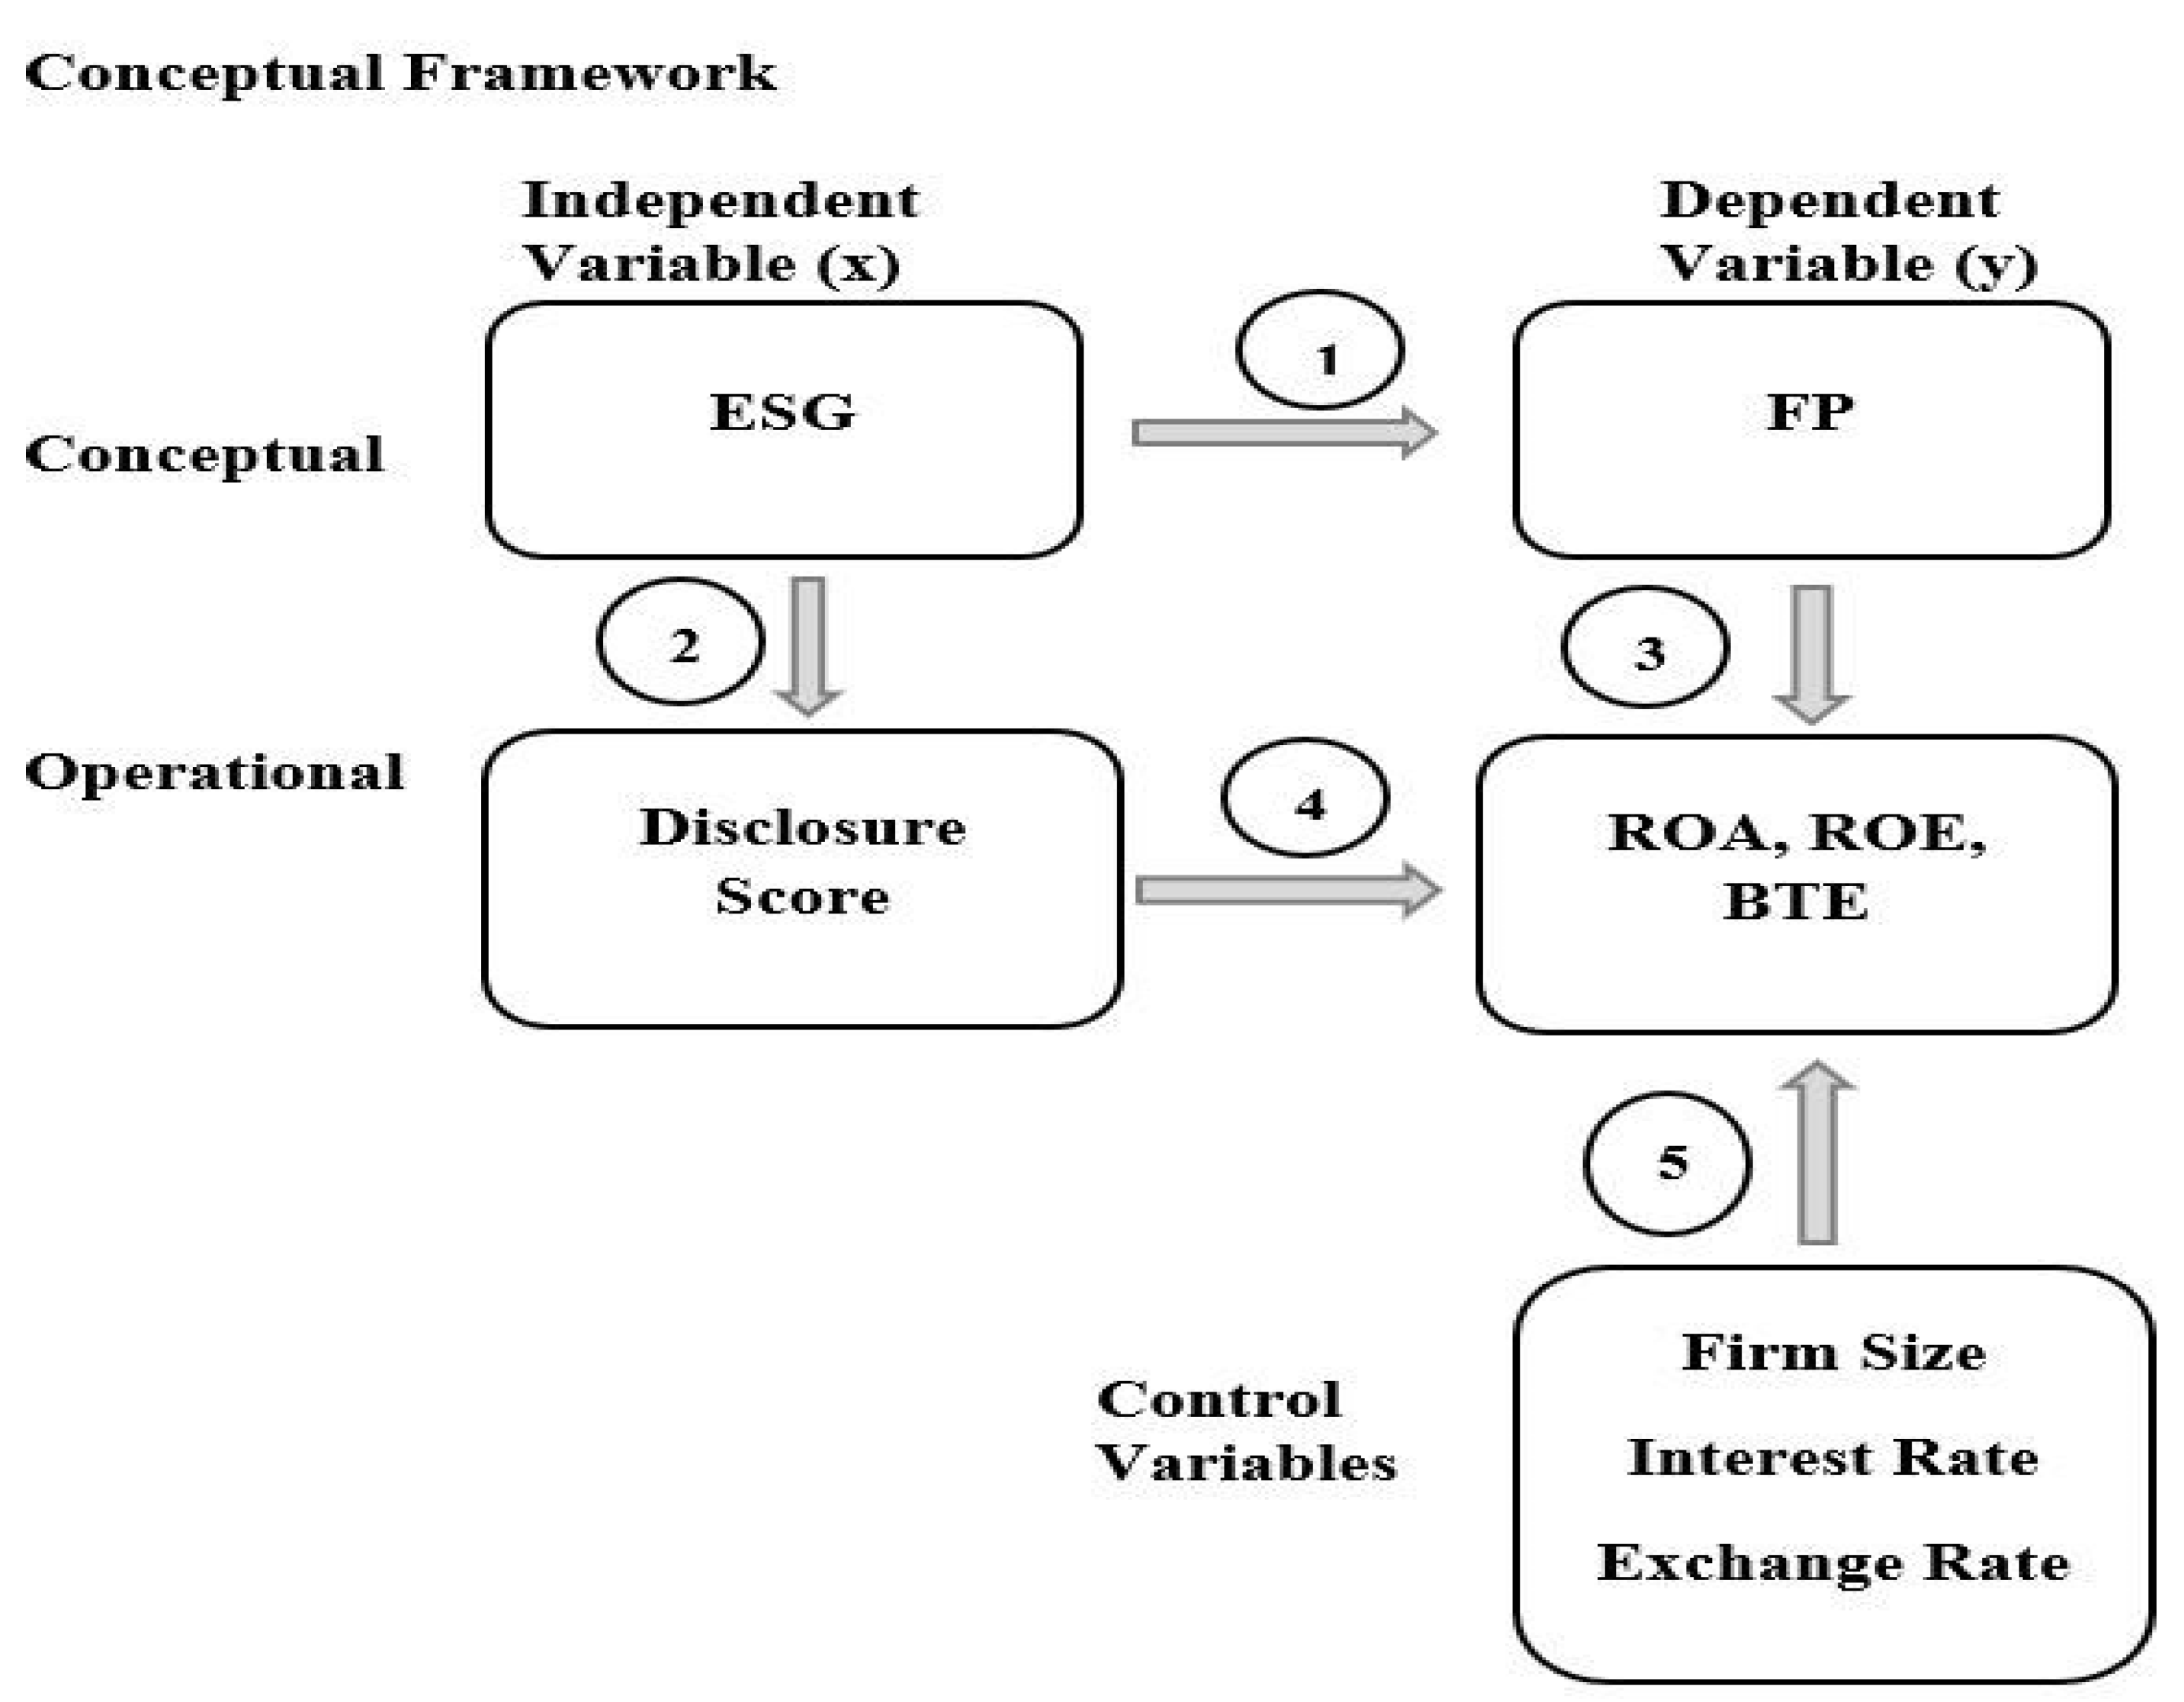
Table 2.
Correlation for ROA.
| ROA | ESG SCORE | FSZ | EXR | ITR | |
|---|---|---|---|---|---|
| ROA | 1.000 | ||||
| ESG SCORE | 0.045 | 1.000 | |||
| FSZ | 0.033 | 0.001 | 1.000 | ||
| EXR | -0.112 | 0.394 | 0.066 | 1.000 | |
| ITR | 0.021 | 0.015 | -0.034 | -0.540 | 1.000 |
Source: EViews 10 (2024).
Table 3.
Correlation for ROE.
| ROE | ESG_SCORE | FSZ | EXR | ITR | |
|---|---|---|---|---|---|
| ROE | 1.000 | ||||
| ESG_SCORE | 0.049 | 1.000 | |||
| FSZ | 0.024 | 0.001 | 1.000 | ||
| EXR | 0.045 | 0.394 | 0.066 | 1.000 | |
| ITR | -0.013 | 0.015 | -0.034 | -0.540 | 1.000 |
Source: EViews 10 (2024).
Table 4.
Correlation for BTE.
| BTE | ESG_SCORE | FSZ | EXR | ITR | |
|---|---|---|---|---|---|
| BTE | 1.000 | ||||
| ESG_SCORE | -0.035 | 1.000 | |||
| FSZ | 0.198 | 0.001 | 1.000 | ||
| EXR | 0.089 | 0.394 | 0.066 | 1.000 | |
| ITR | -0.132 | 0.015 | -0.034 | -0.540 | 1.000 |
Source: EViews 10 (2024).
Table 4.3.1.
Hausman Test.
| Correlated Random Effects - Hausman Test | |||
| Test Summary | Chi-Sq. Statistic | Chi-Sq. d.f. | Prob. |
| Cross-section random | 7.453 | 4 | 0.114 |
Source: EViews 10 (2024).
Table 4.3.2.
Random Effect Regression for Model One.
| Cross-section random effects test equation: | ||||
| Dependent Variable: ROA | ||||
| Method: Panel Least Squares | ||||
| Variable | Coefficient | Std. Error | t-Statistic | Prob. |
| C | -0.090 | 0.313 | -0.286 | 0.775 |
| ESG_SCORE | 0.415 | 0.182 | 2.274 | 0.024 |
| FSZ | 0.013 | 0.039 | 0.327 | 0.744 |
| EXR | 0.000 | 0.000 | -2.811 | 0.005 |
| ITR | -0.008 | 0.006 | -1.421 | 0.157 |
| Effects Specification | ||||
| R-squared | 0.5787 | Mean dependent var | 0.066 | |
| Adjusted R-squared | 0.5107 | S.D. dependent var | 0.170 | |
| F-statistic | 1.8234 | Durbin-Watson stat | 1.954 | |
| Prob(F-statistic) | 0.0081 | |||
Source: EViews 10 (2024).
Table 4.3.3.
Hausman Test.
| Correlated Random Effects - Hausman Test | |||
| Test Summary | Chi-Sq. Statistic | Chi-Sq. d.f. | Prob. |
| Cross-section random | 5.402 | 4 | 0.248 |
Source: EViews 10 (2024).
Table 4.3.4.
Random Effect Regression for Model Two.
| Cross-section random effects test equation: | ||||
| Dependent Variable: ROE | ||||
| Method: Panel Least Squares | ||||
| Variable | Coefficient | Std. Error | t-Statistic | Prob. |
| C | 1.459 | 0.812 | 1.795 | 0.074 |
| ESG_SCORE | 1.192 | 0.473 | 2.520 | 0.025 |
| FSZ | -0.202 | 0.102 | -1.976 | 0.045 |
| EXR | 0.316 | 0.344 | 0.919 | 0.359 |
| ITR | -0.001 | 0.015 | -0.042 | 0.967 |
| Effects Specification | ||||
| R-squared | 0.528 | Mean dependent var |
0.206 | |
| Adjusted R-squared | 0.456 | S.D. dependent var | 0.455 | |
| F-statistic | 6.471 | Durbin-Watson stat |
2.103 | |
| Prob(F-statistic) | 0.000 | |||
Source: EViews 10 (2024).
Table 4.3.5.
Hausman Test.
| Correlated Random Effects - Hausman Test | |||
| Test Summary | Chi-Sq. Statistic | Chi-Sq. d.f. | Prob. |
| Cross-section random | 5.377 | 4 | 0.251 |
Source: EViews 10 (2024).
Table 4.3.6.
Random Effect Regression for Model Three.
| Cross-section random effects test equation: | ||||
| Dependent Variable: BTE | ||||
| Variable | Coefficient | Std. Error | t-Statistic | Prob. |
| C | -4.595 | 2.879 | -1.596 | 0.112 |
| ESG_SCORE | -3.932 | 1.676 | -2.347 | 0.029 |
| FSZ | 1.338 | 0.361 | 3.702 | 0.000 |
| EXR | 0.000 | 0.001 | 0.234 | 0.815 |
| ITR | -0.080 | 0.052 | -1.543 | 0.124 |
| Effects Specification | ||||
| R-squared | 0.439 | Mean dependent var | 2.621 | |
| Adjusted R-squared | 0.372 | S.D. dependent var | 1.893 | |
| F-statistic | 6.553 | Durbin-Watson stat | 1.914 | |
| Prob(F-statistic) | 0.000 | |||
Source: EViews 10 (2024).
Disclaimer/Publisher’s Note: The statements, opinions and data contained in all publications are solely those of the individual author(s) and contributor(s) and not of MDPI and/or the editor(s). MDPI and/or the editor(s) disclaim responsibility for any injury to people or property resulting from any ideas, methods, instructions or products referred to in the content. |
© 2024 by the authors. Licensee MDPI, Basel, Switzerland. This article is an open access article distributed under the terms and conditions of the Creative Commons Attribution (CC BY) license (http://creativecommons.org/licenses/by/4.0/).
Copyright: This open access article is published under a Creative Commons CC BY 4.0 license, which permit the free download, distribution, and reuse, provided that the author and preprint are cited in any reuse.


