Submitted:
24 December 2024
Posted:
24 December 2024
You are already at the latest version
Abstract
Background: Concentrated deep seawater is rich in minerals, including magnesium (Mg), sodium (Na), potassium (K), and calcium (Ca), commonly used in multivitamin. When these minerals are served as solid forms, their nature are highly hygroscopic, making them prone in absorbing moisture. Consequently, development of a non-hygroscopic solid dosage form derived from mineral-rich concentrated deep seawater is highly in need. Methods: Prior formulation stage, the quality of the deep seawater was verified through physical, chemical, and biological assessments based on available Quality Standard. To provide solid form with moisture resistance, the deep seawater concentrate was formulated into granule by using fillers: Avicel® PH 102 and Lactose with 10% Florite® as dessicant. Comprehensive evaluations of the granules including organoleptic, physical properties such as Flow rate, Angle of repose, Compressibility and Loss on Drying had been conducted. These parameters were also evaluated during stability study for five months of storage. Advance verifications were also been performed by using instruments such as Differential Scanning Calorimetry (DSC), X-ray Diffraction (XRD), and Scanning Electron Microscopy (SEM). Results: The results indicated that the optimum moisture protection was provided by granule formulation using Avicel® PH 102 as filler (G-Av) either with or without addition of Florite® 10%. Stability study showed that the protection was effective either in ambient temperature or climatic chamber storage. Conclusions: Avicel PH 102 as filler provided moisture protection for deep seawater granules which highly hygroscopic in nature.
Keywords:
deep seawater
; granule
; hygroscopic
; multivitamin
; minerals
1. Introduction
Rich mineral content of seawater has led to its extensive utilization for salt production. Indonesia has 43,052.10 hectares of salt land, with approximately 59.7% dedicated to salt production [1]. Salt harvesting produces a product known as bittern—a concentrated seawater solution with high mineral content. Bitterns contain substantial amounts of potassium (K), calcium (Ca), and magnesium (Mg), which are highly beneficial for health applications.
Currently, seawater mineral concentrate has been utilized in health sector as a raw material for supplements and multivitamins due to high mineral content [2]. As the demand for minerals grows, synthetic mineral sources from mining are diminishing, making concentrated seawater to be a viable alternative. Indonesia has very long coastline thus provide natural resource for deep seawater as raw material for mineral concentrate. Despite abundant potential of source, the quality of these materials has not been extensively studied. Therefore, the standardization of quality to be used as raw materials for multivitamin is highly needed. The quality of deep seawater as raw material can be assessed through the physical, chemical, and biological parameters [3]. The official standard concerning the quality of water for health purposes including pharmaceutical grade material for oral formulations such as multivitamin has not been published. Yet, the available standard was adopted from those for drinking water with some additional quality standards.
Due to the increased community income and quality life standard, the trend of healthy lifestyle and disease prevention has also been increased thus the needs for multivitamins to improve health and nutrient intake are also growing up. In the pharmaceutical sector, it is imperative to characterize and standardize the raw materials thoroughly to guarantee the safety and quality of final product. With regards to deep seawater as raw material for supplement, pollution number is one of the factors contributing to the quality. Consumption of contaminated seawater whether due to physical, chemical, or microbiological pollutants exceeding human tolerance levels can pose serious health risks and safety [4].
Deep seawater concentrate has enormous potential to be used as a raw material in the development of supplements as a source of minerals in multivitamins [2]. Seawater is a natural resource that is abundantly available and will never run out without the need to be cultivated. Standardization, which is a must in maintaining the quality of raw materials for pharmaceutical preparations, must also be applied in the development of the concentrates as a source of raw materials for supplements. To enhance and broaden insights concerning the safety and quality of deep seawater concentrate, validation and quality control need to be employed as requirement of pharmaceuticals raw material. Due to lack of compendial method, the quality control including physical, chemical, and biological parameters in this experiment were based on the reference of Seawater Quality standard by the Indonesian Ministry of Environment and Forestry year 2016. Quantitative determination of mineral/metal content can be done using ICP-OES (Inductively Coupled Plasma – Optical Emission Spectrometry) and XRF (X-Ray fluorescence) [5,6].
The uniform shape of the granules provides good homogeneity in the mixing process as well as ability in dosage adjustment, thus more practical and efficient in the manufacturing process whether in the form of tablets, capsules, or other solid-form products [7]. According to previous research, high mineral content in solid material gives very hygroscopic properties to the powder due to susceptibility in absorbing moisture [8]. Zhang et al. has conducted research related to the hygroscopic properties of the mineral content by studying the properties of sodium and potassium salts during storage [9]. The hygroscopic character of pharmaceutical raw materials is influenced by various things, including the stages of the process, manufacturing, packaging, storage, and distribution. This property also greatly affects the stability, appearance, and efficiency of the raw material. Therefore, it is important to study and classify the problem of raw materials based on their hygroscopic properties and provide the information of product handling of these materials [10].
In the development of pharmaceutical and nutraceutical, the solid dosage forms such as tablets, capsules, and powders that are hygroscopic in nature greatly affect the physicochemical stability, therapeutic performance, and shelf life of the product. The formulation strategies that have been used to overcome this problems in the form of oral solid preparations of drugs/nutraceuticals are; (1) film coating, (2) encapsulation by spray drying or coagulation, (3) co-processing with excipients, and (4) crystal engineering by co-crystallization [11]. Mabrouki (2022) has conducted research related to the formulation and development of tablets from Herniaria Glabra L extract which is known to be hygroscopic, and improved its properties and physical stability by using a film coating system [12].
In the context of developing a non-hygroscopic solid pharmaceutical dosage forms derived from deep seawater concentrate which is rich in minerals as main ingredient for supplements and multivitamins, further research is highly needed related to its stability and formulation. By preparing the material with good quality and stability, the potential of deep seawater concentrate as a source of minerals for supplements will increase thus will provide greater benefits in supporting human’s health and welfare [13,14]. This study aims to provide information on the quality of mineral concentrates from deep seawater to fulfill requirement of pharmaceutical grade in the form of granules as a source of raw material for minerals and multivitamins. The information provided includes the standardization of product as raw materials for supplements and formulation aspects to improve the stability of deep seawater which is very hygroscopic granule to have better stability so that they can be used as raw material for multivitamin. Moisture protection of these material will increase its stability which lead to the ensurement of the micronutrients availability in the form of vitamins, minerals, and trace elements that play a main role in providing the nutrients needed to support optimal growth and development in children [15].
2. Results
2.1. Quality Parameters of Deepsea Water Concentrate
2.1.1. Physical Parameters
Due to lack of compendial requirements, the physical parameters to evaluate the quality of water concentrate were based on the standard quality criteria for drinking water and seawater [16,17]. The results were compared between the sample from Madura seawater, Indonesia with that available in market and shown in Table 1.
2.1.2. Chemical Parameters
2.1.3. Biological Parameters
2.1.4. Chemical Analysis of Deep Seawater Concentrate
The analysis was conducted to determine the chemical content of the sample qualitative and quantitatively. It was preformed both by XRF (X-Ray Fluorescence) and ICP-OES (Inductively Coupled Plasma–Optical Emission Spectrometry) as shown in Table 4.
2.2. Formulations and Stability Study of Deep Seawater Granule
The granulation were conducted by using two types of filler to which Lactose and Avicel® 200 to evaluate the effect of different type of filler. Based on the organoleptic assessment, it is observed that the granules were white for G-Av and G-Av+Fl, whereas G-Lact and G-Lact+Fl were white-yellow. They were odorless, and showed a granular form.
G-AV : Avicel® Granules
G-AV+FL : Avicel® Granules + FLORITE® 10%
G-Lact : Lactose Granules
G-Lact+Fl : Lactose Granules + FLORITE® 10%
Regarding stability during storage at room temperature, granules G-Av, G-Av+Fl, and G-Lact+Fl exhibited good stability, while G-Lact granules was instable and become higroscopic powder. The formula GF3, that which using lactose as filler without the addition of drying agent, begins to liquefy after three days of storage.
Evaluation on the flow rate of the granules showed that the addition of Florite as drying agent improved the flowability either by using Avicel or Lactose as filler (Figure 1 a). This finding is inline with the result of angle of repose as shown in Figure 1 b. The compressibility/Carr’s index results are shown in Figure 1 c.
Following the preparation of seawater concentrate granules, their physical stability underwent analysis by using parameter of LoD based on selectivity on moisture protection reason. The results provided in Figure 2 showed moisture stability of granules at two different conditions after five months of storage.
2.3. Physical Stability Study of Granules Using Instruments
The dried mineral granules from seawater concentrate which had been successfully produced using optimization formula in previous stage were introduced to stability study for five months of storage and the stability parameters of the granules we analyzed by using instruments. Higroscopicity as the main problem of high mineral content solid materials were analyzed in terms of thermal behavior by DSC, their crystallinity by XRD and confirmation of morphological performances by SEM.
2.3.1. Thermal Analysis by DSC
The thermal behaviour were conducted on all seawater granule formulations including lactose granules (G-Lact), lactose granules with Florite® 10% (G-Lact+Fl), Avicel® granules (G-Av), and Avicel® granules with Florite® 10% (G-Av+Fl) (Figure 3).
Stability studies on the thermal behaviour of the granules were conducted after five months of storage (Figure 4). The studies on granule using lactose as filler were performed to formula lactose granules (G-Lact), lactose granules with Florite® 10% (G-Lact+Fl), as well as Lactose and Florite powder for comparison study (Figure 4a). Accordingly, stability studies on granule with Avicel PH 102 as filler were conducted to formula Avicel® granules (G-Av) and Avicel® granules with FLORITE® 10% (G-Av+Fl) after formulation (0) and after five months of storage in two conditions: room temperature (RT) and climatic chamber (CC) as well as to Avicel PH 102 (Av) powder for comparison (Figure 4b). During the stability study, it was revealed that the granules with Lactose as filler had been melted at around two weeks of storage, thus could not undergo further stability study.
2.3.2. XRD Analysis
The XRD diffraction patterns of deep seawater granules using fillers of Avicel®, Avicel® with Florite® 10%, lactose, and lactose with Florite® 10%, is shown in Figure 5.
The results from stability study on XRD pattern were conducted to formulation using Avicel as fillers due to the failure of Lactose Granules formulation to stand during the study (Figure 6a). Characterization by XRD during stability studies on granule with Avicel PH 102 as filler were conducted to formula Avicel® granules (G-Av(0)) and Avicel® granules with Florite® 10% (G-Av+Fl(0)) after formulation and after five months of storage in two conditions: room temperature (RT) and climatic chamber (CC) as well as to Avicel PH 102 (Av) powder for comparison (Figure 6b).
2.3.3. Morphology Study by Scanning Electron Microscope
3. Discussion
Analysis of Quality Parameters and Contaminants
- Physical Parameters
Physical parameter testing is crucial to determine the quality of the sample and can be used as preliminary visual screening. Physical characteristics of the deep seawater concentrate were conducted on both the sample from Madura seawater and marketed concentrate water as standard (Table 1). As parameters, the quality standard to be examined were those which used as quality criteria for drinking water and seawater [16,17].
Color testing using spectrophotometry revealed that the sample of seawater concentrate from Madura had a Pt/Co scale value of 333, while that of marketed product was 570. Higher Pt/Co scale values indicate greater water turbidity or color intensity, often attributed to high organic content [21]. Both samples exceeded the permitted quality requirements range for drinking water (Pt/Co scale value of 15) and demonstrated more intense turbidity due to more concentrated seawater thus higher content of minerals and other chemical components.
Upon organoleptic examination, Madura’s seawater concentrate displayed a distinct aroma which may attributed to higher salt after many of coacervation during concentration process. The marketed product from seawater mineral also possessed a faint odor, albeit less pronounced compared to that from Madura’s seawater.
In terms of total suspended solids (TSS) analysis by gravimetric method, it was found that both Madura’s seawater and the marketed product exhibited values of < 7.7. This suggests that TSS in both samples which comprise as solid particle impurities like mud, dust, organic substances, and dissolved particles were within the acceptable range for drinking water standards.
- b.
- Chemical Parameters
Chemical parameter testing was conducted to assess the quality of the samples. Due to lack of compendial standard, the parameter of quality to be examined were basen on those which used as for drinking water and seawater [16,17].
Based on their chemical characteristics (Table 2) it was found that the pH of both Madura seawater and the marketed product seawater mineral were in the range of permissible value for drinking water standards. The pH of seawater is influenced by its carbon dioxide content, which generates carbonate and bicarbonate ions, releasing hydrogen ions and consequently increasing the seawater’s pH. However, during the evaporation process, most of the alkaline components—such as carbonate and bicarbonate ions—evaporate into calcium carbonate. This leads to a lower pH in the seawater concentrate compared to natural seawater [2].
The salinity value of Madura seawater concentrate was 311%, while marketed product was 283%. High salinity value of both samples was due to the evaporation process, which led to an increase in salt concentration containing minerals such as magnesium and potassium [22]. This process also affects the Baumé degree, which influences the density of the fluid with a linear relationship. Higher Baume degree resulted in higher salinity [1].
The dissolved oxygen content of Madura seawater concentrate had a value of 2.1 mg/L, while that of the marketed product was 3.1 mg/L. However, both samples had the DO levels below the permissible range of at least 6 mg/L. This can be attributed to the evaporation process during production of the concentrate, which cause a decrease in oxygen levels as dissolved oxygen molecules bound to water can also evaporate. As shown in previous data, evaporation process also affected the salinity values of the samples, to which higher salinity leads to decreased solubility of dissolved oxygen [23]. Biological oxygen demand (BOD) value of Madura seawater was 304 mg/L, which obviously did not meet the permissible quality standard of 2 mg/L. The discrepancy could be attributed to the evaporation process, which elevates the BOD value. As water evaporates, it leaves all the containing mineral behind to be more concentrated, thereby increasing the concentration of residual matter. Additionally, evaporation contributes to higher salinity levels, resulting in reduced dissolved oxygen content. The reduction in oxygen availability hence can elevate BOD levels, as decomposer organisms require oxygen to degrade organic matter [24].
The results indicated that Ammonia level in both samples were below the maximum value of 1.5 mg/L (according to Indonesia’s Minister of Health Regulation No. 492/2010 regarding Drinking Water Quality Requirements). The ammonia level in Madura seawater was lower than that of the marketed product. High level of ammonia can lead to unpleasant odors of water due to contaminants such as organic waste and chemicals. Furthermore, it can disrupt the digestive system, causing symptoms like nausea, abdominal pain, and diarrhea. Therefore, level of ammonia can be emphasized as one of the important factor in maintaining water quality to be within permissible limits [25].
Phosphate level of Madura seawater had a value within the acceptable drinking water quality standard, which must be below 0.2 mg/L. It exhibited lower phosphate level (0.096 mg/L), even when compared to the marketed product seawater which was 0.23 mg/L. A low level of phosphate signifies better water quality as phosphate is considered as a crucial nutrient compound that significantly impacts water productivity. In aquatic environments, phosphorus exists in the form of dissolved inorganic compounds, namely orthophosphate and polyphosphate. Elevated phosphate levels can trigger eutrophication and uncontrolled algae proliferation, leading to the release of algal toxins that pose health risks to both humans and animals [26].
The results of nitrate level determination from both samples showed that their values were less than the allowable drinking water quality standard, which must be less than 10 mg/L. Nitrate is a nutrient that supports protein synthesis in animals and plants. When the concentration exceeds 0.2 mg/L, it can lead to eutrophication and algae blooming which will impact the ecosystem biodiversity and water quality. Biochemical processes resulted from the oxidation of nitrogen compounds can influence nitrate level in water. Nitrate level can also be influenced by factors such as pH, temperature, dissolved oxygen, and salinity [27]. Nitrite is an intermediate form between ammonia and nitrate that quickly converts to more stable form of nitrate. Nitrite level of Madura seawater was 0.0047 mg/L, while that of marketed product was 0.004 mg/L. which are in the range of allowable drinking water quality standard. In natural water bodies, nitrite levels are generally low due to the presence of oxygen, which stabilizes its properties. Nitrite is toxic because it prevents oxygen from being transported when bound to hemoglobin in the blood, making it an important parameter in determining seawater quality. Several factors influencing nitrite levels in water are including temperature, lighting, microbial activity, and the biochemical balance present in the aquatic ecosystem [28].
Based on cyanide level testing, both samples comply with the permissible drinking water quality standard of less than 0.02 mg/L. Cyanide is a highly toxic non-metal compound that can significantly impact the health of marine organisms. Sources of cyanide include industrial waste and illegal fishing practices that use cyanide, both of which can severely damage marine life and even cause death. Factors influencing cyanide levels in aquatic environments include human activities involving cyanide (i.e., industrial discharges) and environmental factors (e.g., pH and temperature) that affect cyanide solubility. Cyanide exposure can lead to fatal poisoning, with risks of transmission through the consumption of seafood from contaminated marine organisms.[19,29].
Madura seawater concentrate sample showed a sulfide concentration of 0.011 mg/L, while the marketed seawater product exhibited a lower concentration (<0.005 mg/L). Hydrogen sulfide is a natural gas produced by the decomposition of organic materials containing metals by anaerobic bacteria. Hydrogen sulfide levels in aquatic environments increase when organic matter content is higher thus decrease the dissolved oxygen levels [30]. Madura seawater revealed higher level of sulfide which mean that the surrounding area of sample contained more organic living materials than that of marketed seawater area. Nevertheless, both samples had sulfide levels within the permissible limits for drinking water as specified by WHO, which is less than 0.05 mg/L. Levels of hydrogen sulfide exceeding 0.05 mg/L can be identified by a distinctive odor and taste, similar to that of rotten eggs.
Hydrocarbon pollution in aquatic environments can arise from offshore oil production and transportation, waste disposal, oil spills, and biomass burning. While certain hydrocarbons can be biogenically produced by bacteria or through the natural chemical degradation of lipids, petrogenic sources often serve as the primary contributors to hydrocarbon pollution in coastal regions [31]. Total hydrocarbon level test measured by using gas chromatography method showed that the Madura seawater sample exhibited total hydrocarbon levels as much as than 0.79 mg/L, which is within the permissible limits for surface water as set by the WHO, which is 10 mg/L. It can be concluded that seashore area of Madura can provide the deep seawater with good quality from point of view hydrocarbon pollution.
Total phenol compound testing using the continuous flow analyzer (CFA) method on sampel of Madura seawater concentrate found that total phenol concentration was 0.0016 mg/L. This level was in the range of permissible drinking water quality standard which must be less than 0.002 mg/L. The general toxicity threshold for phenol ranges from 9 to 25 mg/L for both humans and aquatic life. Phenolic compounds are organic substances that can be widely distributed in natural aquatic environments. These compounds tend to persist in the environment for extended periods and exhibit toxic effects. The presence of phenolic compounds in water can be as result from several factors including : natural sources where phenolic compounds were formed through biochemical processes in marine environments, as well as human activities that contribute to waste disposal and oil pollution [32].
Surfactant (detergent) level of both samples exhibited values over the water quality standard (0.02 mg/L). The seawater concentrate sample from Madura showed a surfactant level of 1.8 mg/L, while that from the market product displayed a higher level (2.9 mg/L). Detergents, comprised mainly of synthetic organic chemicals known as surfactants, possess cleansing properties and are generally considered xenobiotic, featuring polar head groups and non-polar tails. The presence of detergents in water can lead to eutrophication, foam production, toxic effects on aquatic fauna, and a decline in water quality. Moreover, detergents can induce poisoning and irritation of the eyes and skin in humans [33]. The elevated surfactant levels are likely attributable to factors such as waste discharge from human activities near the seawater sampling site.
The presence of oil and fat in natural water will interfere with biological life in surface and create unsightly film. It will spread over the surface in a thin layer and block the oxygen which needed by plants and animals living in the water. Film layer formation impedes gas diffusion and photosynthesis, resulting in unpleasant odors and hazardous gases, while oil emulsions can obstruct the respiratory systems of aquatic biota and organisms on the sea body [34]. The quality standard of oil and fat level in drinking water is less than 0.2 mg/L. The seawater concentrate from Madura demonstrated an oil and fat level of < 0.11 mg/L, thus it is in the range of requirement level.
- c.
- Biological Parameters
Biological parameter testing is essential to evaluate the quality of water focusing on two key parameters: fecal coliform and total coliform (Table 3). Upon conducting fecal coliform testing, it was found that both samples failed to meet the drinking water quality standard (0 per 100 ml of sample) accoring to Indonesia’s Minister of Health Regulation No. 492/2019 regarding Drinking Water Quality Requirements. Both the seawater concentrate sample from Madura and the marketed product exhibited fecal coliform bacterial counts of < 10 CFU. The World Health Organization (WHO) established the risk of disease from drinking water based on the category of indicator organisms measured in 100 ml of water sample. In this context, the presence of 1–10 fecal coliforms indicates as low risk [35]. The seawater concentrate sample from Madura, is a natural material that has not undergone microbial reduction or elimination process. Thus, it is imperative to incorporate microbial reduction or elimination during manufacturing processes. This can be achieved by adding antimicrobial agents or conducting sterilization procedures on raw materials of the seawater concentrate to ensure that the fecal coliform quality parameter aligns with permissible drinking water standards.
Total coliform count of both samples exhibited values that fail to meet the drinking water quality standard (0 per 100 ml of the sample) according to Indonesia’s Minister of Health Regulation No. 492/2019 concerning Drinking Water Quality Requirements. Total coliforms encompass organisms capable of thriving and reproducing in water, comprising various types of gram-negative aerobic and facultative anaerobic bacilli that do not produce spores. They can originated from fecal matter or surrounding water body. While total coliforms generally do not induce illnesses, their presence signifies bacterial proliferation [36]. The detection of total coliforms underscores the necessity for sterilization procedures or the introduction of antimicrobials to the seawater concentrate of Madura, to ensure compliance with the drinking water quality standard. Other alternative is to find deeper spot of water collection to which fecal matter from daily life waste will not pollute the waterbody.
The deep seawater mineral concentrate currently lacks of standard or quality guideline. Hence, when quality parameters of drinking water outlined by the National Standardization Agency (SNI) has been employed, several parameters fall short due to the influence of the evaporation process during seawater concentrate production. These parameters include color, the Pt/Co scale value, distinctive odor, salinity, dissolved oxygen, BOD, pH, total phenol, surfactants, fecal coliform as well as total coliform.
Quantitative Chemical Analysis of Deep Seawater Concentrate
The analysis of deep seawater concentrates were conducted using XRF (X-Ray Fluorescence) and ICP-OES (Inductively Coupled Plasma–Optical Emission Spectrometry) methods due to their capability of simultaneous multi-element detection, detection speed, and high sensitivity and wide detection range [37,38,39]. The results from these two instruments were compared to study the ease and sensitivity to be used in mineral content analysis. The results indicated that the seawater concentrate either from Madura or as marketed products contained the major component of Magnesium (Mg), Chloride (Cl), Potassium (K), Calcium (Ca), Sodium (Na), and Boron (B) (Table 4).
The difference between mineral content detected from marketed products compared with deep seawater from Madura when analized by using XRF and ICP-OES either in qualtitative or quantities of the elements was contributed to the variation in sample treatment between XRF and ICP-OES analysis. In XRF method, the samples do not need to undergo destruction due to its capability to analyze both solid and liquid samples without prior destruction or dissolution. However, this can result in a higher matrix effect, which potentially affecting the results [37]. Seawater concentrate, which was formerly processed into a concentrated form, can precipitate salts during storage [40]. ICP-OES analysis cannot be conducted directly into solid samples. The sample must be dissolved, requiring the digestion of solids with acid [5]. Mostly, aqua regia—consisting of HNO3 and HCl in a 1:3 ratio—has been used for this purpose. Acid digestion can alter the form of elements which some of them are not easily soluble or ionized. It can break down the complex compounds or minerals, releasing the elements [5]. The differences in sample treatment and the matrix composition of the sample of XRF and ICP-OES analyses can affect the results potentially leading to discrepancies between the outcomes. XRF can detect greater number of elements than ICP-OES. However, in terms of trace elements, ICP-OES demonstrates the ability to detect elements at lower concentrations, ranging from 0.0365 to 18625.8 mg/L, whereas XRF operates within a higher detection range, from 6.61 to 188319 mg/L. In contrast, for detection of broader range of elements with higher concentrations, the XRF method is more suitable.
Based on the data, the Madura seawater concentrate contained mineral which are essential for supplement including major content of magnesium (Mg), chloride (Cl), potassium (K), calcium (Ca), iron (Fe), copper (Cu), and sodium (Na) in the amount which meet the requirements for mineral daily intake as multivitamin supplement. Furthermore, heavy metals such as mercury (Hg), lead (Pb), cadmium (Cd), and arsenic (As) were not detected from Madura seawater concentrate, indicating its safety in terms of raw materials for multivitamin supplement.
Formulation and Stability Study of Deep Seawater Granules using Different Types of Fillers
Seawater concentrate is concentrated liquid of deep seawater rich in minerals needed for supplement/multivitamin. In terms of stability, raw materials of pharmaceutical dosage forms will be better in solid form either as powders or granules because not only of being stable, but it also provide other advantages, namely ease in practical use, handling and distribution. The deepsea water as raw materials for multivitamins, most of which are minerals, had been changed from a liquid to solid in the form of granules. The method of drying and stabilizing the granules during time of storage became the biggest challenge. Previous research has proven that high mineral content will make solid preparations to be hygroscopic. To overcome this problem, it is necessary to select the optimum diluent and dessicant/drying agent. Lactose has been used as filler for the reason of affordable price to reduce production unit costs while microcrystalline cellulose was expected to provide better drying capability. The study on multifactor influencing granule’s stability had been elaborated to provide comprehensive data on developing granule of deep seawater as raw material for multivitamin.
Upon formulation, evaluation on the flow rate of all granules exhibited good flow properties (exceeding 10 g/s flow rates, Figure 1 a). Among others formulation, Lactose granules (G-Lact) revealed highest flowability which due to bigger particle size compared that with Microcrystalline Cellulose (Avicel PH 102). The result was inline with the previous finding that big particle size exhibit better flowability [41].
In contrast, Angle of Repose determination exhibited better flowability of Avicel granules compared with those using Lactose as filler (Figure 1.b). The small values of Angle of repose from Lactose granules were attributed to the hygroscopic nature of the material, which causes the granules to absorb moisture from the air and stick together in the funnel [42,43]. Flowability were increase as measured by smaller values of Angles to less than 25 after addition of Florite as dying agent. The findings supported previous study which found that moisture contents coats the particles to enhance the sticking ability thus increase particle interaction and large angle of repose.
Based on the compressibility/Carr’s index results shown in Figure 1c, all formulations exhibited good compressibility values ranging from 5 to 20%, except for G-Av (25.71%). Compressibility refers to the ability of a material to reduce in volume under certain pressure [44]. Formula G-Av had smaller granule sizes compared to others. Granule size affects the compressibility; smaller granules tend to have higher compressibility percentages, while larger one will exhibit lower percentages [45].
The production of granules requires consideration of stability and ease in distribution. To enhance the stability, desiccant is essentially needed to counteract the hygroscopic nature of the mineral content in granules. In this experiment, Florite® was employed as the desiccant at concentration of 10%. It is a synthetic calcium silicate with outstanding liquid absorption capability up to approximately five times its weight. It is also reported to have compressibility improvement properties [46].
Stability of formula G-Av, G-Av+Fl, and G-Lact+Fl granules at room temperature remained stable, while formula G-Lact melted at the third days of storage. Granules using Avicel® as a filler (G-Av and G-Av+Fl) demonstrated good stability until five months of storage either at room temperature (Figure 2a) or during stress stability at climatic chamber (Figure 2b). As addition to serve as filler, Avicel® also provided the adsorbent capability thus reducing hygroscopic properties [47,48].
Accordingly, the granule formula using lactose as fillers G-Lact and G-Lact+Fl (lactose filler and Florite as a dessicant) in the first month had been melted thus cannot continue the stability testing (Figure 2a and Figure 2b). At early stage of in process evaluation, G-Lact granules had been obtained and was more hygroscopic compared to G-Lact+Fl granules, meaning that Florite affected the hygroscopic properties of the resulting granules. Nevertheless, these granules could not survive and liquified at two weeks of storage. It can be concluded that the type of filler had more dominant influence on the formulation than the desiccant.
The results indicated that Avicel® as model of Mycrocrystalline cellulose derivate can effectively maintain the stability and quality of the higroscopic granules with high mineral content of seawater concentrate. Thus the moisture protection of deepsea water in form of solid material (granule) have been successfully developed
Thermal Behavior Analysis of Granules by DSC Testing
Differential scanning calorimetry (DSC) testing aims to observe the melting point shift and the transition point of the sample. DSC can also be used as a parameter for stability testing [49]. The thermal analysis of deep seawater granule formulations—including Avicel® granules (G-Av), Avicel® granules with Florite® 10% (G-Av+Fl), lactose granules (G-Lact), and lactose granules with Florite® 10% (G-Lact+Fl)—were conducted by using DSC (Figure 3). The results in Figure 3 showed that addition of drying agent (Florite®) had improve the melting point of the granule to become higher. Notably, there are differences in the melting peaks between granule with Lactose and those with Avicel as filler. This shift in melting point correlated with enhanced stability of the granules containing Florite® 10% showing greater thermal stability. Similarly, differences in thermal transition points were observed in lactose granules (G-Lact) and lactose granules with Florite® (G-Lact+Fl), indicating that the addition of Florite® positively impacted the stability of the granules. Melting point of Florite is 1.540oC; Lactose is 201-202oC , and Avicel® is 260 -270oC [50,51].
The distinct differences in the thermal behavior of the two formulations (Figure 4a and Figure 4b) was due to different physical properties of Lactose (crystalline) and Avicel/Microcryastalline Cellulose (semicrystalline). This hypothesis will be discussed XRD analysis section. During stability study, Avicel® granules (G-Av) and Avicel® granules with Florite® (G-Av+Fl) showed more robust formulation suggesting that the type of filler highly influenced the stability of the granules. Granules with lactose as filler could not stand the stability testing and begun to melt on the second week of storage, thus further observation on stability testing could not be continued (Figure 4a). Hygroscopic properties of lactose granules was not only due to chemical property of lactose but also larger particle size and porosity of the granule. The granules using Avicel PH 102 as filler were successfully revealed the good stability until five months of storage by showing similarly difractogram either in room temperature or climatic chamber. Slight shift of melting points were found when comparing formulation using Florite as drying agent with that without it.
XRD Analysis
The purpose of using XRD analysis is to identify crystalline phases within the material [52,53]. Based on the x-ray diffraction patterns of the mineral granules with various fillers and Florite® as drying agent, it was evident that the peak intensities were apparently differ among the samples. Lactose granules and lactose granules with Florite® 10% exhibited sharp and high diffraction peaks due to crystalline property of lactose as filler. In contrast, Avicel® granules and Avicel® granules with Florite® 10% addition, as well as Avicel® powder displayed less pronounced crystalline patterns (Figure 5 and Figure 6b). The diffraction pattern of Avicel® was characterized by its microcrystalline structure, resulting in broad peaks due to its low crystallinity [54]. Notably, the addition of Florite® 10% to the mineral granules did not alter the crystalline form of the filler as exhibited by lactose (Figure 6a). Thus, the granules failed in stability study which were performed for five months of storage. The results were inline with previous data on LoD and DSC thermogram (Figure 2 and Figure 4). In conclusion, the formulation of moisture resistant granules containing deep seawater which physically stabile were succesfully developed by using Avicel PH 102 as filler either by addition or not of dessicant/drying agent.
Study on Morphology and Surface Particles by Using Scanning Electron Microscopy (SEM)
SEM analysis were conducted to characterize the morphology and structure of the deep seawater granules. SEM also aids in determining the structure and homogeneity of particles [55]. Based on the morphological observations of granules with Avicel® as filler, and Avicel® granules with Florite® 10% addition, it was found that Avicel® granules with addition of Florite exhibited a more porous morphology compared to other formulations (Figure 7) resulted in increased LoD (Figure 2a) as well as higher melting points either in Avicel or Lactose filler formulations (Figure 3).
The morphological analysis of granules with lactose as filler revealed that the granules with Florite® 10% addition were physically improved in morphology compared with that without drying agent. Lactose powder typically appear as heterogeneous flakes, whereas at day of formulation, the granules with lactose filler exhibited a dense, non-porous texture. Few hours after granulation, the stability problem arose and they inherently became hygroscopic (G-lact, Figure 8), leading to melted particle. With Florite addition as drying agent, the granules were more stable, showing a porous particle morphology. In term of hygroscopicity, porous morphology tends to be more adsorptive due to its larger surface area to interact with surrounding molecules. Materials with porous morphology can absorb and retain moisture more efficiently [56]. Nevertheless, adsoprtive property of drying agent at 10% concentration was not strong enough to stabilize higroscopic nature of Lactose, thus these formulations failed in stability study which was performed for five months of storage. Based on stability testing, the finding of this study was that deep seawater concentrate can be produced into granules by employing Avicel® as fillers (Figure 9). The addition of Florite® 10% as drying agent was the most favorable outcomes due to more individualized particle after the study either at room temperature or climatic chamber (Figure 9).
4. Materials and Methods
4.1. Deep Seawater Concentrate Production
The production of deep seawater concentrate involved a natural evaporation process conducted within greenhouse salt ponds. Initially, seawater with a density ranging between 3–4°Bé was transferred to a containment pond until it attained a density of 5°Bé. Subsequently, it underwent a series of stages: passing through salt channels until achieving a density of 7°Bé, flowing onto salt tables until reaching a density of 27°Bé, and finally, being left until salt deposition occurs at a density of 32°Bé. The transformation of seawater into salt deposits typically spans around 40 days. Following this, the supernatant was drained until reach a density of 35°Bé, and the deposition of sodium until a density of 36°Bé was attained, thus yielding seawater concentrate [2].
4.2. Determination of Quality Parameters from Deepsea Water Concentrate
4.2.1. Physical Parameters
The determination of the quality of the samples (deep seawater from Madura, Indonesia and that from marketed product as standard) based on physical parameters were including color, odor and total suspended solid. Color parameter standard was conducted following the Indonesian National Standard (SNI) No. 6989.80.2011 on Water and Wastewater, utilizing the spectrophotometric color testing method at wavelengths between 450 and 465 nm. Total suspended solids analysis was carried out by the gravimetric method as outlined in SNI 06-6989.3-2004 on Water and Wastewater - Part 3: Gravimetric Testing Method for Total Suspended Solids (TSS).
4.2.2. Chemical Parameters
The pH analysis was conducted by using ion analyzer. The salinity of the samples were analyzed by employing a salt meter. Total dissolved oxygen levels in the samples were assessed through electrometric analysis. BOD (Biological Oxygen Demand) analysis was conducted based on SNI standard No. 6989.72:2009 utilizing titrimetric method. The Ammonia level in the samples were analyzed based on the guidelines in SNI 19-6964.3-2003 by using Indophenol Blue Spectrophotometry, at absorbance wavelength of 640 nm. Phosphate levels were analyzed based on the protocols outlined in SNI No. 06-6989.31-2005 on Water and Wastewater: by Employing Ascorbic Acid Spectrophotometry at wavelength of 880 nm. Nitrate analysis complied with the standards outlined in SNI 19-6964-7-2003 utilizing Cadmium Reduction Spectrophotometry at wavelength of 543 nm. Total nitrite analysis followed the procedures outlined in SNI 19-6989.9-2004 by Spectrophotometry Utilizing Sulfanilamide, at a wavelength of 543 nm. Total cyanide analysis was conducted by using ion analyzer method. Sulfide analysis was conducted based on SNI 19-6964.4-2003 regarding Seawater Quality by Methylene Blue Spectrophotometry at 670 nm. Total hydrocarbon analysis was carried out using the GC-MS (Gas Chromatography Mass Spectrometry) method, as stipulated by the US EPA (Environmental Protection Agency) 5030 & 5035 regulations from 2003. Analysis on total phenolic compounds was performed using the CFA (Continuous Flow Analyzer) method. Level of Surfactant in the samples were analyzed following the standards set by SNI 06-6989.51-2005 for Testing Anionic Surfactant Content by Methylene Blue Spectrophotometry, at wavelength of 652 nm. Oil and fat analysis were conducted by using FTIR (Fourier-transform infrared spectroscopy).
4.2.3. Biological Parameters
Coliform analysis was conducted following the guidelines outlined in the 23rd edition of the APHA (American Public Health Association) Standard Methods for the Examination of Water and Waste Water. Total coliform analysis adhered to procedure 9222 B, detailing the Standard Procedure for Total Coliform Membrane Filtration Using Endo Media, while fecal coliform analysis followed procedure 9222 D, which pertained to the Thermotolerant (Fecal Coliform) Procedure with Membrane Filter.
4.3. Chemical Content Analysis of Deep Seawater Concentrates
Chemical contents of deep seawater samples were analyzed by using XRF (X-Ray Fluorescence) (Rigaku Nex CG®). The tests were conducted by adjusting the helium gas at flow rate 0.66 L/minute with a pressure of 10–15 psi. Before analysis, the XRF instrument was calibrated using an “MCA calibration sample” [57].
Chemical content of the samples were also analized by ICP-OES (Inductively Coupled Plasma–Optical Emission Spectrometry) (Agilent 700 Series ICP-OES®). The calibration was performed using pre-prepared calibration solutions. Samples underwent destruction beforehand due to their propensity for precipitation and the instrument’s sensitivity. Standard solutions for each element under analysis were prepared initially. Following the completion of testing with ICP-OES, the results from both XRF and ICP-OES analyses were compared [58].
4.4. Production of Deep Seawater Granules
4.4.1. Formulation of Deep Seawater Granules
The granules were formulated by using two types of fillers to which Lactose and Microcrystalline celullulose (Avicel® PH 102) either by using Florite as dessicant/drying agent or not. The formula of the granules shown in Table 5. The granules were prepared in Fluid bed Dryer by spraying Deep seawater concentrate containing Amylum 10% as binder into the filler powder. After finishing the spraying process, the granules were dried for 15 minutes, Florite® was added as dessicant and were ready for furhter process including physical evaluation and stability study.
4.4.2. Evaluation of Granules
- Organoleptic Evaluation
The mineral granules underwent organoleptic evaluation, including assessments of color and shape. Additionally, the granules were exposed to open air to ascertain their stability.
- b.
- Flow Properties Evaluation
Granule as much as 25 gram was passed through a flow tester, and the time taken for the sample to flow was recorded.
- c.
- Angle of Repose
Granule sample was carefully poured into a flow tester. Upon opening the bottom part, the radius (r) and height (h) of the powder heap were measured and caculated using the following formula.
- d.
- Compressibility/Carr’s Index
Compressibility characterizes the material’s capacity to decrease in volume under pressure, with optimal compressibility falling within the 5–20% range [59]. The compressibility factor was calculated using the following formula.
- e.
- Loss on Drying (LoD)
One gram of granule was placed into a moisture balance apparatus. The apparatus was set to a temperature of 105°C until constant weight was obtained. The results were observed on the screen upon completion. Regular checks were conducted every month over 5 month [60].
- f.
- Content Analysis with ICP-OES
In the analysis employing ICP-OES (Agilent 700 Series ICP-OES®), calibration was meticulously conducted using readily available calibration solutions. Granules earmarked for analysis underwent prior disintegration due to their susceptibility to precipitation, given the instrument’s sensitivity. Standard solutions for each element were prepared beforehand, paving the way for subsequent sample testing [58].
- g.
- Stability Testing
The physical stability tests of the granules were carried out for 5 months using climatic chamber (40±2°C, RH 75±5%) and at room temperature (25±2°C, RH 70±5%). To evaluate moisture protection ability of the system, physical stability testing of granules were performed including organoleptics, LoD, DSC, XRD and SEM [61].
- h.
- Quality Parameter Testing of Granules Using Instruments
Advance characterization on granules were conducted by evaluation of thermal behaviour using DSC, crystallinity by XRD and morphology by SEM pictures. Differential scanning calorimetry (DSC) can be used to measure changes in enthalphy due to changes in the physical and chemical properties of a sample. The principle of Differential Scanning Calorimetry (DSC) is to measure the difference in heat flow between a sample and a reference as the temperature changes. The DSC testing in this study (Shimadzu 60A plus) was conducted by putting the sample (5-10 mg) into the crimping (sample pan) and the nitrogen and oxygen gas base were also turned on. The difference in heat flow between the sample and the reference were noted as the temperature changes.
The resulting data was plotted as a function of temperature, which results in a DSC curve [62].
Determination of the powder X-ray diffraction (Malvern Panalytical's) pattern of the granules were recorded using a Cu anode X-ray tube, the generator voltage and current were 40 kV and 30 mA with an angle of 2θ in increments of 2 ̊C/min. [63].
SEM (Scanning Electron Microscopy) study of the granule used an electron microscope (JED-2300 Analysis Station) for viewing the morphology of the surface of the granules. The working principle of SEM is that the sample is placed at the bottom of the electron column. The electrons in the sample are scattered and captured by the electron detector. Photomultipliers convert voltage signals into images on PC screens. The magnification used in this test were 200x, 1,000x and 10,000x magnification [64].
5. Conclusions
Madura deep seawater concentrate contained magnesium (Mg), chloride (Cl), potassium (K), calcium (Ca), iron (Fe), copper (Cu), and sodium (Na) and was potential sources to as be used mineral source in the development of multivitamins preparation. Standardization study from this spot had been conducted and revealed that it was fulfill most requirement of drinking water defined by the 2016 Marine Water Quality Monitoring report by Indonesia’s Ministry of Environment and Forestry, as preliminary standard for pharmaceutical excipients.
The formulation of deep seawater into granule had been successfully conducted and it can be concluded that Avicel PH 102 (as derivate of microcrystalline cellulose) was the most potential filler to provide good properties and stability of the granule., in term of moisture protection of highly hygroscopic granules. The addition Flourite as powder dryer has improved the physical properties of the granules.
Author Contributions
Conceptualization, A.Y.C., S.S, B.R, Y.W.W; methodology, A.Y.C., B.H., S.E.M. ; formal analysis, B.H. ; investigation, B.H., S.E.M; writing—original draft preparation B.H. ; writing—review and editing, A.Y.C., Y.W.W., M.M, ; visualization, B.H. .; supervision, B.R., S.S. and A.Y.C. All authors have read and agreed to the published version of the manuscript.
Funding
This research was funded by The National Research and Innovation Agency (BRIN) and Indonesia Endowment Fund for Education Agency (LPDP), Republic of Indonesia year 2023/2024 Batch number 4. .
Data Availability Statement
I state the datasets used and/or analysed during the current study available from the corresponding author on reasonable request. (corresponding author: anis.yohana.chaerunisaa@unpad.ac.id).
Acknowledgments
The authors thank The National Research and Innovation Agency (BRIN) and Indonesia Endowment Fund for Education Agency (LPDP), Republic of Indonesia for funding the research throuh Research and Innovation for Advance Indonesia Grant (RIIM) year 2023/2024, Batch number 4.
Conflicts of Interest
The authors declare no conflicts of interest.
References
- Apriani, M.; Hadi, W.; Masduqi, A. Physicochemical Properties of Sea Water and Bittern in Indonesia: Quality Improvement and Potential Resources Utilization for Marine Environmental Sustainability. J. Ecol. Eng. 2018, 19, 1–10. [CrossRef]
- Sriwidodo ; Umar, A.K. ; Megawati, E. ; Butarbutar, M. ; Wathoni, N. ; Alaydrus, S. Physicochemical Characterization of Concentrated Mineral and Magnesium Isolate of Sea Water Pamekasan Madura. Int. J. Res. Pharm. Sci. 2020, 11, 2154–2157.
- Mahmoud, M.G.; El-Khir, E.A.; Ebeid, M.H.; Mohamed, L.A.; Fahmy, M.A.; Shaban, K.S. An Assessment on the Coastal Seawater Quality of the Gulf of Suez, Egypt. J. Environ. Prot. (Irvine,. Calif). 2020, 11, 34–47. [CrossRef]
- Landrigan, P.J.; Stegeman, J.J.; Fleming, L.E.; Allemand, D.; Anderson, D.M.; Backer, L.C.; Brucker-Davis, F.; Chevalier, N.; Corra, L.; Czerucka, D.; et al. Human Health and Ocean Pollution. Ann. Glob. Heal. 2020, 86, 1–64. [CrossRef]
- Barin, Juliano S; Mello, Paola A.; Mesko, Marcia F. and Duarte, Fabio A.; Flores, E.M.M. Determination of Elemental Impurities in Pharmaceutical Products and Related Matrices by ICP-Based Methods: A Review. Anal. Bioanal. Chem. 2016, 408, 4547–4566.
- Marguí, E.; Queralt, I.; de Almeida, E. X-Ray Fluorescence Spectrometry for Environmental Analysis: Basic Principles, Instrumentation, Applications and Recent Trends. Chemosphere 2022, 303, 135006. [CrossRef]
- Jadav, M.; Pal, V.; Pandit, H.; Suthar, N.; Pithadia, A.; Jha, L.L. Formulation, Optimization and Evaluation of Nutraceutical Effervescent Granules Containing Curcumin and Ascorbic Acid by Fusion Technique Using Full Factorial Design. J. Nat. Remedies 2023, 23, 1509–1516. [CrossRef]
- Guo, L.; Gu, W.; Peng, C.; Wang, W.; Jie Li, Y.; Zong, T.; Tang, Y.; Wu, Z.; Lin, Q.; Ge, M.; et al. A Comprehensive Study of Hygroscopic Properties of Calcium-and Magnesium-Containing Salts: Implication for Hygroscopicity of Mineral Dust and Sea Salt Aerosols. Atmos. Chem. Phys. 2019, 19, 2115–2133. [CrossRef]
- Zhang, H.; Gu, W.; Li, Y.J.; Tang, M. Hygroscopic Properties of Sodium and Potassium Salts as Related to Saline Mineral Dusts and Sea Salt Aerosols. J. Environ. Sci. (China) 2020, 95, 65–72. [CrossRef]
- Anbarasan, A.; Nataraj, J.; Shanmukhan, N.; Radhakrishnan, A. Effect of Hygroscopicity on Pharmaceutical Ingredients, Methods to Determine and Overcome: An Overview. Available online www.jocpr.com J. Chem. Pharm. Res. 2018, 10, 61–67.
- Ng, L.H.; Kim, J.; Ling, U.; Hadinoto, K. Formulation Strategies to Improve the Stability and Handling of Oral Solid Dosage Forms of Highly Hygroscopic Pharmaceuticals and Nutraceuticals. 2022.
- El Mabrouki, H.; Kaukhova, I.E. Formulation and Development of Aqueous Film Coating for Moisture Protection of Hygroscopic Herniaria Glabra L. Tablets. Turkish J. Pharm. Sci. 2022, 19, 153–160. [CrossRef]
- Weyh, C.; Krüger, K.; Peeling, P.; Castell, L. The Role of Minerals in the Optimal Functioning of the Immune System. Nutrients 2022, 14, 1–15. [CrossRef]
- Petersen, S. Marine Mineral Resources. Encycl. Mar. Geosci. 2015, 1–10. [CrossRef]
- Breik, L.; Tatucu-Babet, O.A.; Ridley, E.J. Micronutrient Intake from Enteral Nutrition in Critically Ill Adults: A Systematic Review of Randomised Controlled Trials. Aust. Crit. Care 2022, 35, 564–574. [CrossRef]
- 2016; 16. Indonesian Ministry of Environment and Forestry Sea Water Quality Monitoring; Indonesian Ministry of Environment and Forestry, 2016.
- Republic of Indonesia Government Regulations Implementation of Environmental Protection and Management.
- Minister of Health of the Republic of Indonesia Regulation of the Minister of Health of the Republic of Indonesia No 492/Menkes/PER/IV/2010 Concerning Drinking Water Quality Requirements.
- Madeira, D.; Andrade, J.; Leal, M.C.; Ferreira, V.; Rocha, R.J.; Rosa, R.; Calado, R. Synergistic Effects of Ocean Warming and Cyanide Poisoning in an Ornamental Tropical Reef Fish. Front. Mar. Sci. 2020, 7.
- Dumka, N. J.; Kingdom, A. Total Hydrocarbon Concentrations (THC) in Surface Water, Sediments and Biota from Otamiri River, Rivers State, Nigeria. IJCS 2018, 6, 2743–2748.
- Mascarenhas, V.; Keck, T. Marine Optics and Ocean Color Remote Sensing. In Proceedings of the YOUMARES 8; 2018; pp. 41–54.
- Alaydrus, S.; Umar, A.; Sriwidodo, S.; Diantini, A.; Wathoni, N.; Amalia, R. Characterization and Acute Oral Toxicity of Concentrated Minerals of Pamekasan Madura Seawater. J. Adv. Pharm. Technol. Res. 2021, 12, 305–309. [CrossRef]
- Debelius, B.; Gómez-Parra, A.; Forja, J.M. Oxygen Solubility in Evaporated Seawater as a Function of Temperature and Salinity. Hydrobiologia 2009, 632, 157–165. [CrossRef]
- Rajendiran, T.; Sabarathinam, C.; Panda, B.; Elumalai, V. Influence of Dissolved Oxygen, Water Level and Temperature on Dissolved Organic Carbon in Coastal Groundwater. Hydrology 2023, 10. [CrossRef]
- O’Connor Šraj, L.; Almeida, M.I.G.S.; McKelvie, I.D.; Kolev, S.D. Determination of Trace Levels of Ammonia in Marine Waters Using a Simple Environmentally-Friendly Ammonia (SEA) Analyser. Mar. Chem. 2017, 194, 133–145. [CrossRef]
- Wu, X.; Hou, L.; Lin, X.; Xie, Z. Application of Novel Nanomaterials for Chemo- and Biosensing of Algal Toxins in Shellfish and Water; Elsevier Inc., 2019; ISBN 9780128144978.
- Banerjee, P.; Garai, P.; Saha, N.C.; Saha, S.; Sharma, P.; Maiti, A.K. A Critical Review on the Effect of Nitrate Pollution in Aquatic Invertebrates and Fish. Water. Air. Soil Pollut. 2023, 234, 1–14. [CrossRef]
- Ciji, A.; Akhtar, M.S. Nitrite Implications and Its Management Strategies in Aquaculture: A Review. Rev. Aquac. 2020, 12, 878–908. [CrossRef]
- Hofer, H.T.B.; Ng, P.C.; Witeof, A.E.; Mahon, S.B.; Brenner, M.; Boss, G.R.; Bebarta, V.S. A Review on Ingested Cyanide: Risks, Clinical Presentation, Diagnostics, and Treatment Challenges. J Med Toxicol 2019, 15, 128–133.
- WHO Hydrogen Sulfide in Drinking-Water.
- Dumka, N.J. Total Hydrocarbon Concentrations (THC) in Surface Water, Sediments and Biota from Otamiri River, Rivers State, Nigeria. IJCS 2018, 6, 2743–2748.
- Mainali, K. Phenolic Compounds Contaminants in Water: A Glance. Cur Trends Civ. Struct Eng 2020, 4.
- Abd El-Gawad, H.S. Aquatic Environmental Monitoring and Removal Efficiency of Detergents. Water Sci. 2014, 28, 51–64. [CrossRef]
- Khozanah; Yogaswara, D.; Wulandari, I. Oil and Grease (OG) Content in Seawater and Sediment Of The Jakarta Bay and Its Surrounding. IOP Conf.Ser Earth Environ. Sci. 2015, 789.
- Gruber, J.S.; Ercumen, A.; Colford Jr, J.M. Coliform Bacteria as Indicators of Diarrheal Risk in Household Drinking Water: Systematic Review and Metaanalysis. PLoS One 2014, 9.
- WHO Guidelines for Drinking-Water Quality; 4th ed. ; World Health Organization: Geneva, 2011; 36. WHO Guidelines for Drinking-Water Quality; 4th ed.; World Health Organization: Geneva, 2011.
- Moriya, T. Analysis of Trace Impurities in Pharmaceutical Products Using Polarized EDXRF Spectrometer NEX CG. Rigaku J. 2013, 29, 19–21.
- Nölte, J. ICP Emission Spectrometry: A Practical Guide; 2nd ed.; Wiley-VCH: Weinheim, 2021.
- Singh, V.K. ; Kawai, J. ; Tripathi, D.K. X-Ray Fluorescence in Biological Sciences: Principles, Instrumentation, and Applications; Wiley Publisher: Hoboken, 2022.
- Na, C.; Park, H.; Jho, E.H. Utilization of Waste Bittern from Saltern as a Source for Magnesium and an Absorbent for Carbon Dioxide Capture. Env. Sci Pollut Res. 2017, 24, 22980–22989.
- Kudo, Y.; Yasuda, M.; Matsusaka, S. Effect of Particle Size Distribution on Flowability of Granulated Lactose. Adv. Powder Technol. 2020, 31, 121–127. [CrossRef]
- Juarez-Enriquez, E.; Olivas, G.I.; Zamudio-Flores, P.B.; Ortega-Rivas, E.; Perez-Vega, S.; Sepulveda, D.R. Effect of Water Content on the Flowability of Hygroscopic Powders. J. Food Eng. 2017, 205, 12–17. [CrossRef]
- Shah, D.S.; Moravkar, K.K.; Jha, D.K.; Lonkar, V.; Amin, P.D.; Chalikwar, S.S. A Concise Summary of Powder Processing Methodologies for Flow Enhancement. Heliyon 2023, 9, e16498. [CrossRef]
- Berkenkemper, S.; Klinken, S.; Kleinebudde, P. Investigating Compressibility Descriptors for Binary Mixtures of Different Deformation Behavior. Powder Technol. 2023, 424, 118571. [CrossRef]
- Baumgartner, A.; Planinšek, O. Effect of Process Parameters in High Shear Granulation on Characteristics of a Novel Co-Processed Mesoporous Silica Material. Eur. J. Pharm. Sci. 2023, 188. [CrossRef]
- Tomita ph Florite. 2018.
- Rowe, C.R.; Sheskey, J.P.; Owen, C.S. Hanbook of Pharmaceutical Excipients Sixth Edition; Sixth Edit.; RPS Publishing, 2009.
- Nofrerias, I.; Nardi, A.; Suñé-Pou, M.; Suñé-Negre, J.M.; García-Montoya, E.; Pérez-Lozano, P.; Ticó, J.R.; Miñarro, M. Comparison between Microcrystalline Celluloses of Different Grades Made by Four Manufacturers Using the SeDeM Diagram Expert System as a Pharmaceutical Characterization Tool. Powder Technol. 2019, 342, 780–788. [CrossRef]
- Almoselhy, R.I.M. Applications of Differential Scanning Calorimetry (DSC) in Oils and Fats Research. A Review. Am. Res. J. Agric. 2020, 6, 1–9. [CrossRef]
- Bonnaud, P.A.; Ji, Q.; Van Vliet, K.J. Effects of Elevated Temperature on the Structure and Properties of Calcium-Silicate-Hydrate Gels: The Role of Confined Water. Soft Matter 2013, 9, 6418–6429. [CrossRef]
- Rowe, R. C., Sheskey, P. J., & Quinn, M.E. Handbook Pharmaceutical Excepients (6th Ed.); by the Pharmaceutical Press, 2009.
- Rafiu, R. Khulna University of Engineering and Technology Department of Materials Science and Engineering Course Title Materials Characterization Sessional X-Ray Diffraction ( XRD ) Analysis Name : Rifat Rafiu. 2024, 0–7. [CrossRef]
- Ali, A.; Chiang, Y.W.; Santos, R.M. X-Ray Diffraction Techniques for Mineral Characterization: A Review for Engineers of the Fundamentals, Applications, and Research Directions. Minerals 2022, 12. [CrossRef]
- Ulbrich, M.; Bültena, M.; Braun, B.; Meißner, K.; Bussert, R.; Flöter, E. Specific Modification of Granular Potato Starch by Means of Partial Debranching Using Pullulanase. Starch/Staerke 2023, 2300154, 1–14. [CrossRef]
- El-Naggar, N.E.A.; El-Malkey, S.E.; Abu-Saied, M.A.; Mohammed, A.B.A. Exploration of a Novel and Efficient Source for Production of Bacterial Nanocellulose, Bioprocess Optimization and Characterization. Sci. Rep. 2022, 12, 1–22. [CrossRef]
- Velarde, L.; Nabavi, M.S.; Escalera, E.; Antti, M.L.; Akhtar, F. Adsorption of Heavy Metals on Natural Zeolites: A Review. Chemosphere 2023, 328, 138508. [CrossRef]
- Marguí, E.; Queralt, I. Sample Preparation for X-Ray Fluorescence Analysis. Encycl. Anal. Chem. 2024, 1–29. [CrossRef]
- Icp, S.; Emission, O. Agilent 700 Series ICP Optical Emission Spectrometers User’s Guide 2 Agilent 700 Series ICP Optical Emission Spectrometers User’s Guide Notices Manual Part Number Instrument Manufacturing. 2018.
- Abdelfattah, D.S.E.; Fouad, M.A.; Elmeshad, A.N.; El-Nabarawi, M.A.; Elhabal, S.F. Formulation and Stability Evaluation of Anti-Obesity Nutraceuitcal Blend of White Kidney Bean Extract (Phaseolus Vulgaris L.), Propolis Ethanolic Extract and Crpic3. Int. J. Appl. Pharm. 2024, 16, 225–235. [CrossRef]
- In Republic of Indonesia Ministry of Health Indonesian Pharmacopoeia Edition V; Ministry of Health of the Republic of Indonesia: Jakarta, 2014; 60. Republic of Indonesia Ministry of Health Indonesian Pharmacopoeia Edition V; Ministry of Health of the Republic of Indonesia: Jakarta, 2014.
- Kholodenko, A.L. Applications of Contact Geometry and Topology in Physics. Appl. Contact Geom. Topol. Phys. 2013, 02, 1–475. [CrossRef]
- Leyva-Porras, C.; Cruz-Alcantar, P.; Espinosa-Sol, V.; Saavedra-Leos, M.Z. Application of Differential Scanning Calorimetry (DSC) and Modulated Differential Scanning. Polymers (Basel). 2019, 12, 1–21.
- Ermrich, M.; Opper, D. X-Ray Powder Diffraction for the Analyst; 2011; ISBN 6754-6762.
- Mohammed; A. Abdullah Scanning Electron Microscopy (SEM): A Review. Proc. 2018 Int. Conf. Hydraul. Pneum. - HERVEX 2018, 77–85.
Figure 1.
Effect of Florite® addition as drying agent on (a) Flow Rate, (b) Angle of Repose, and (c) Carr’s Index Value of granules.
Figure 1.
Effect of Florite® addition as drying agent on (a) Flow Rate, (b) Angle of Repose, and (c) Carr’s Index Value of granules.
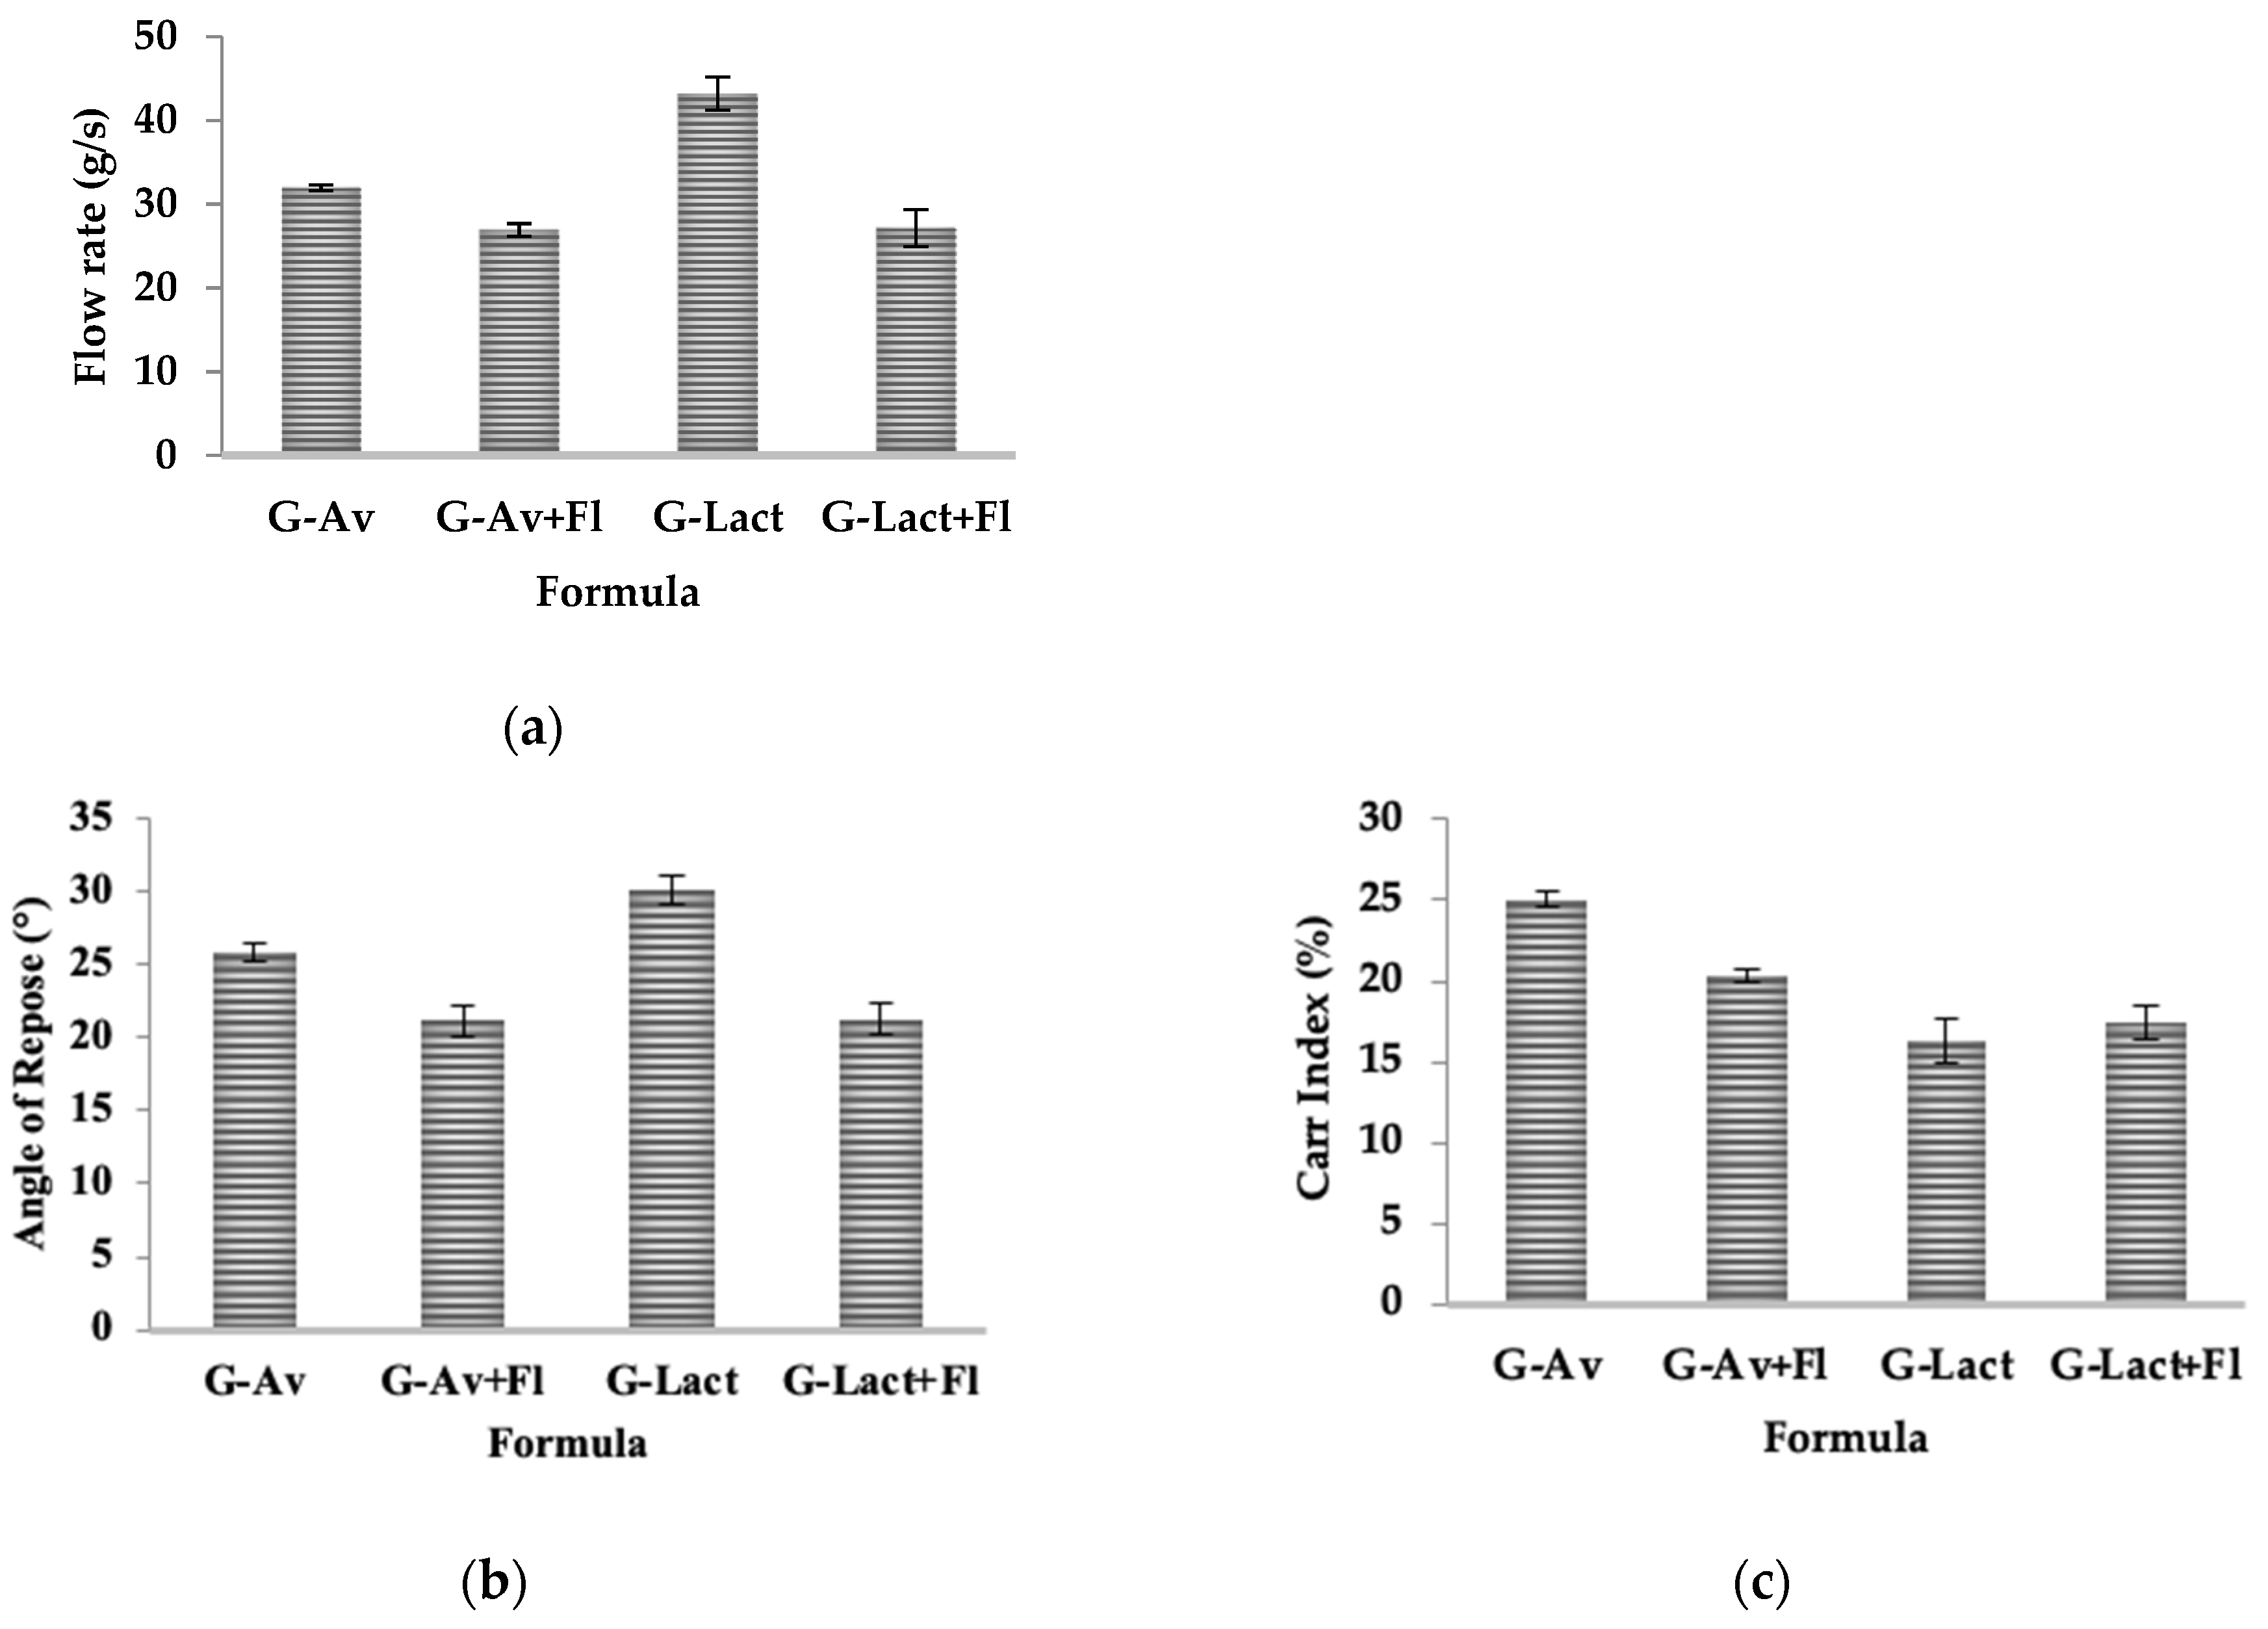
Figure 2.
Effect of Florite® addition as drying agent on LoD values of granules (a) room temperature and (b) climatic chamber after stability study 0, 1, 2, 3, 4, and 5 months of storage.
Figure 2.
Effect of Florite® addition as drying agent on LoD values of granules (a) room temperature and (b) climatic chamber after stability study 0, 1, 2, 3, 4, and 5 months of storage.
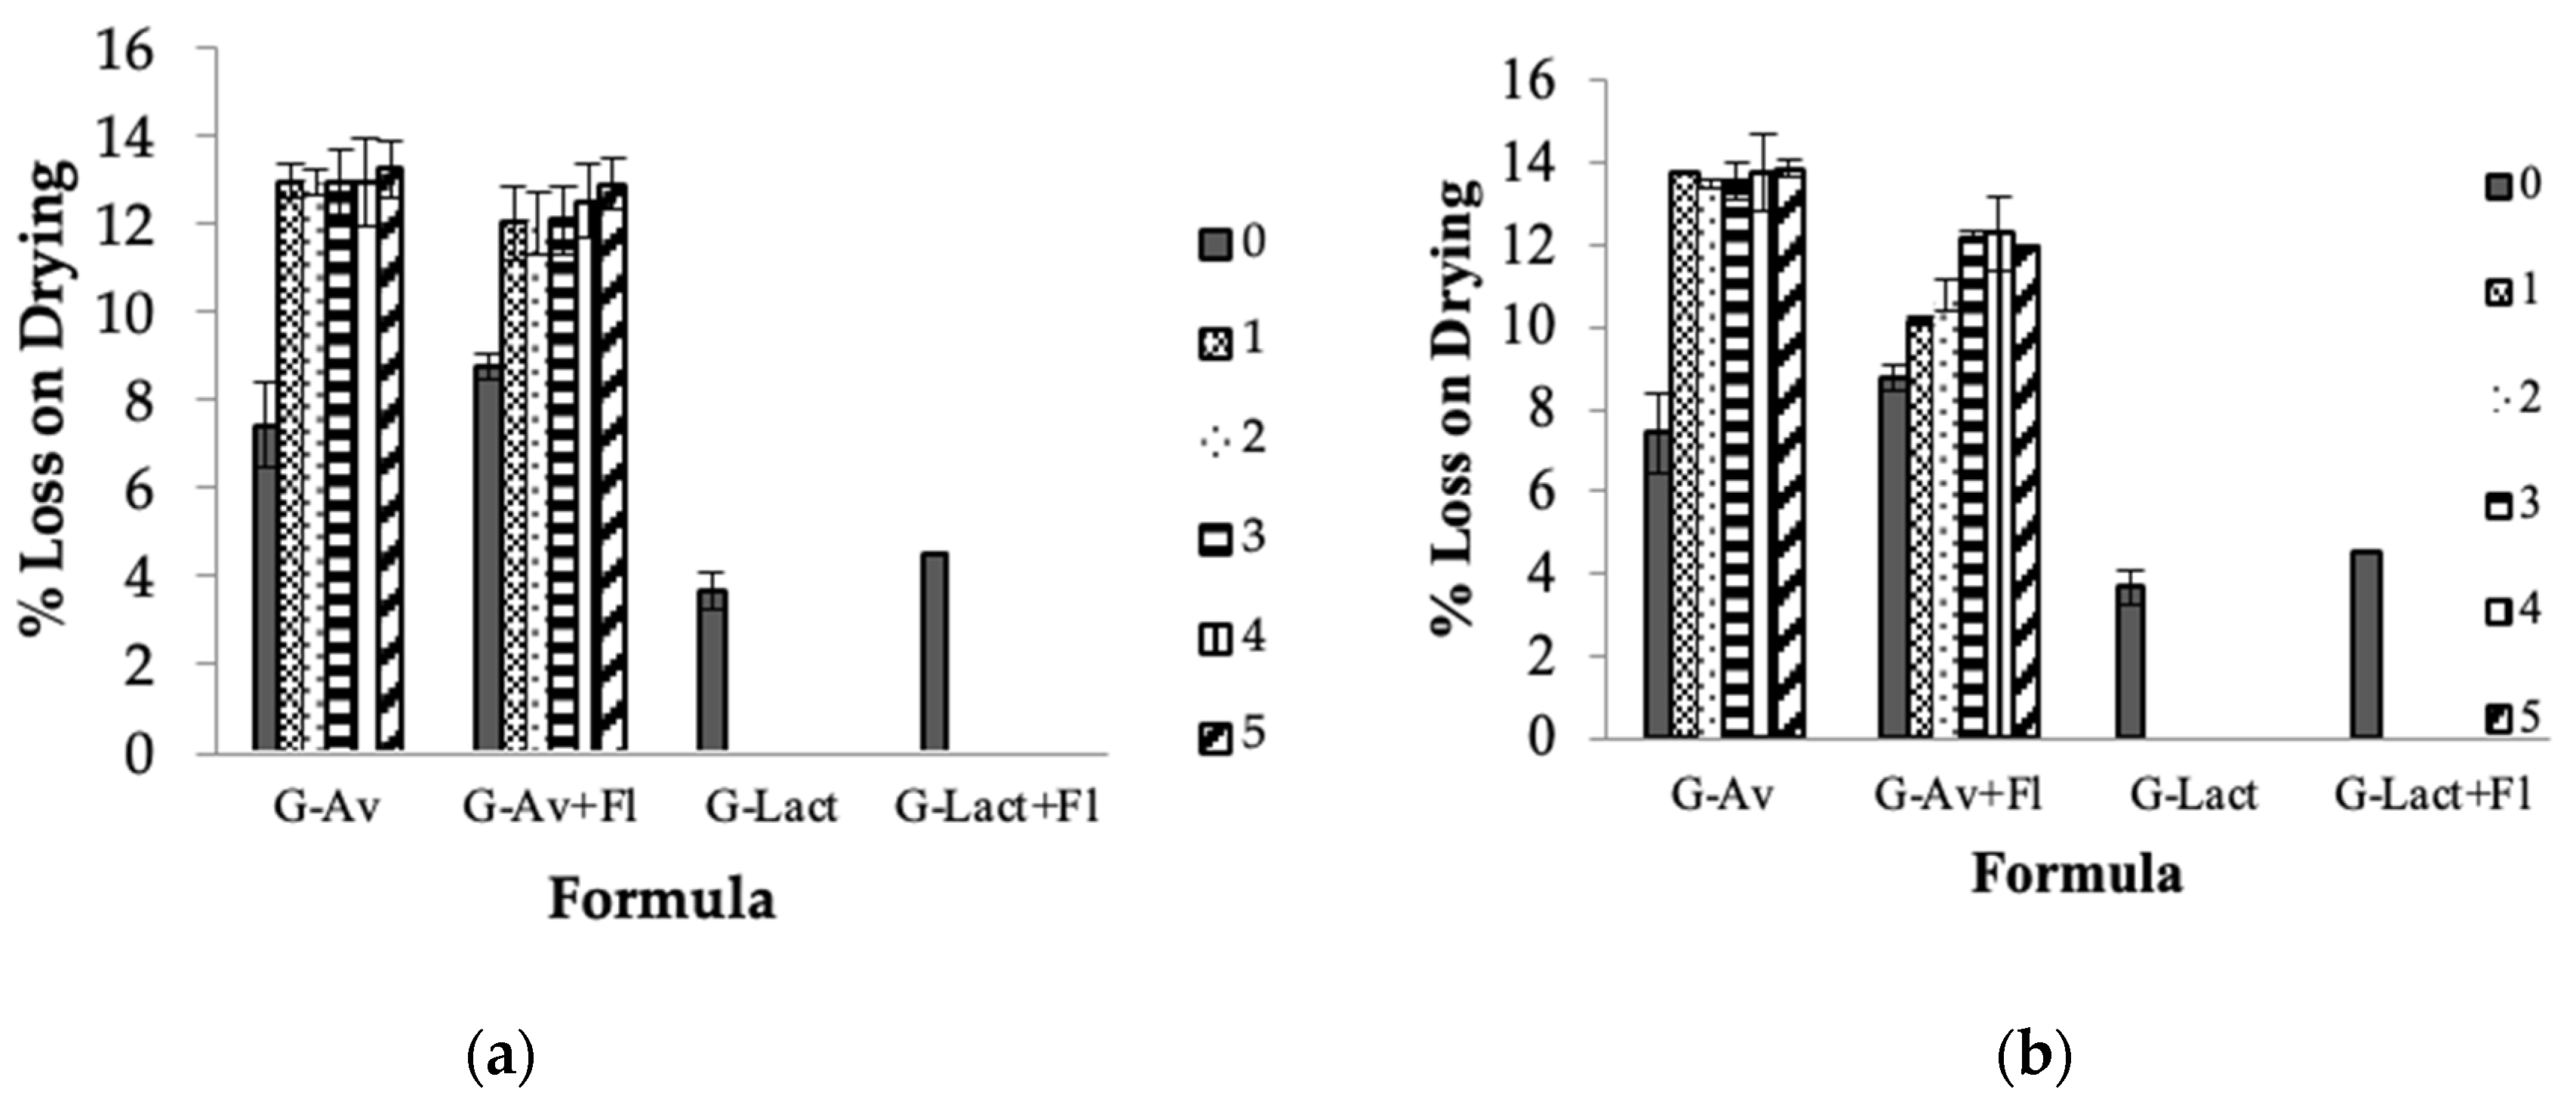
Figure 3.
DSC thermogram of Deep Seawater Granules using different filler.
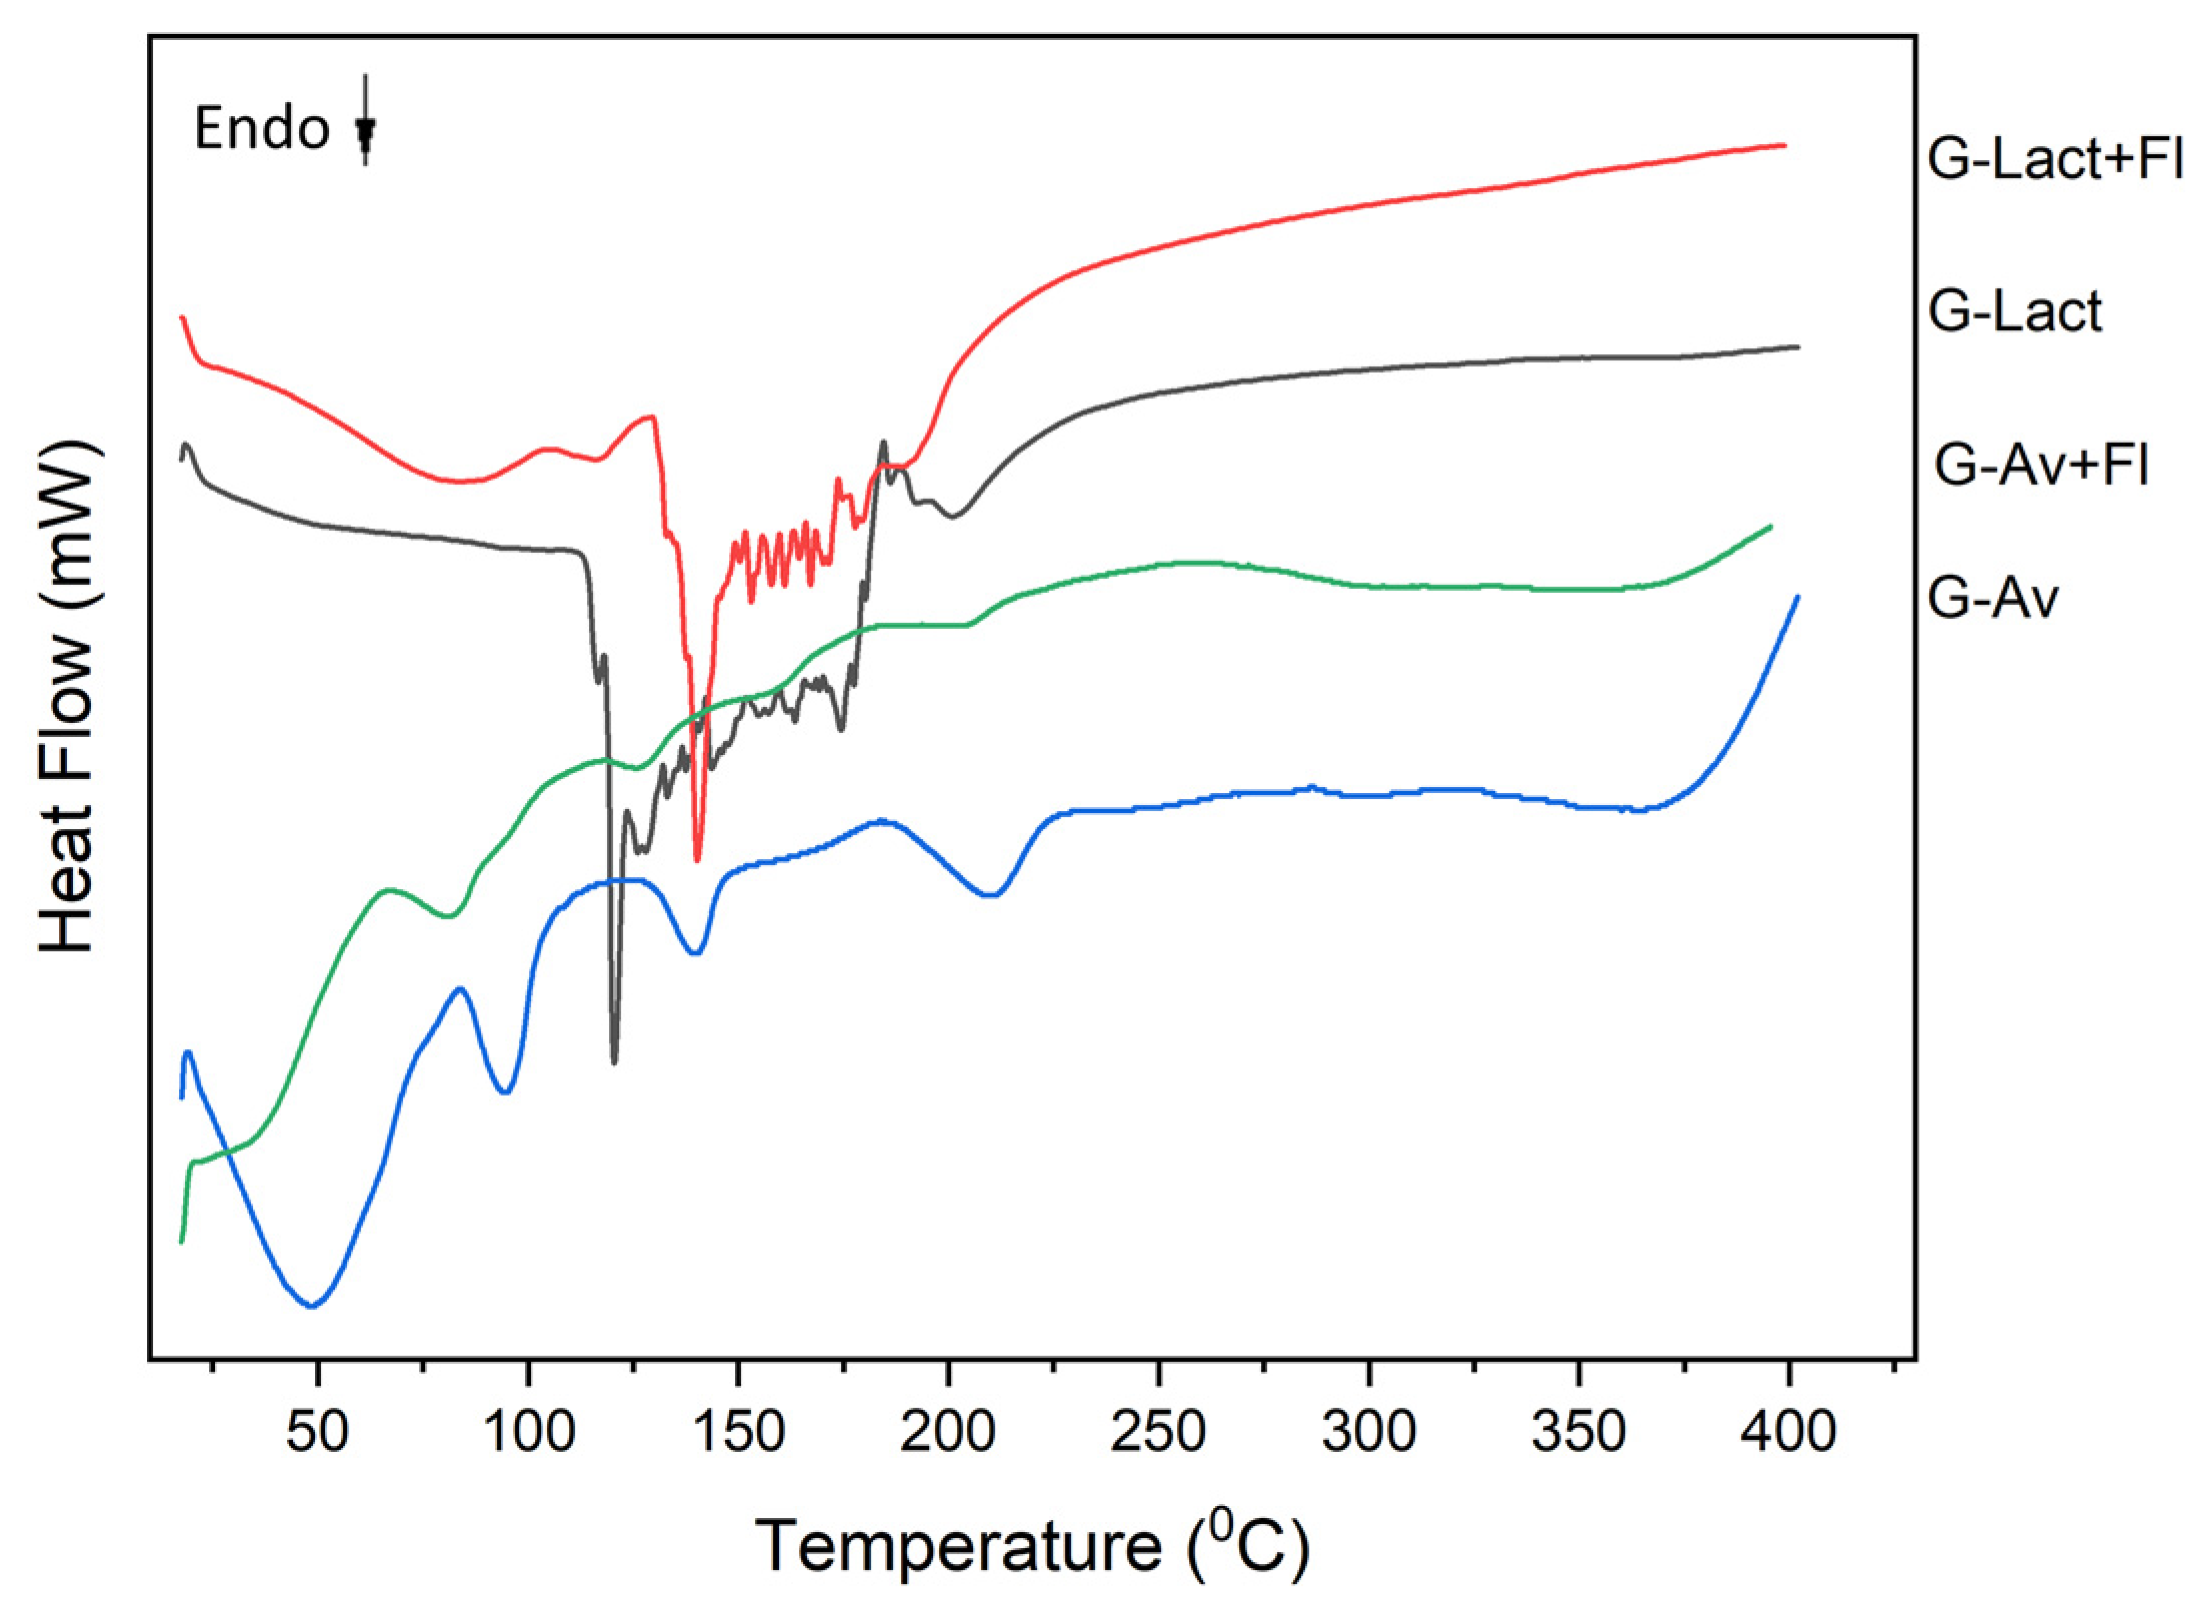
Figure 4.
DSC thermogram of deep seawater Granules using (a) Lactose and (b) Avicel® PH 102 as fillers at day of formulation (0) and after five months of storage at room temperature (RT) and Climatic Chamber (CC).
Figure 4.
DSC thermogram of deep seawater Granules using (a) Lactose and (b) Avicel® PH 102 as fillers at day of formulation (0) and after five months of storage at room temperature (RT) and Climatic Chamber (CC).
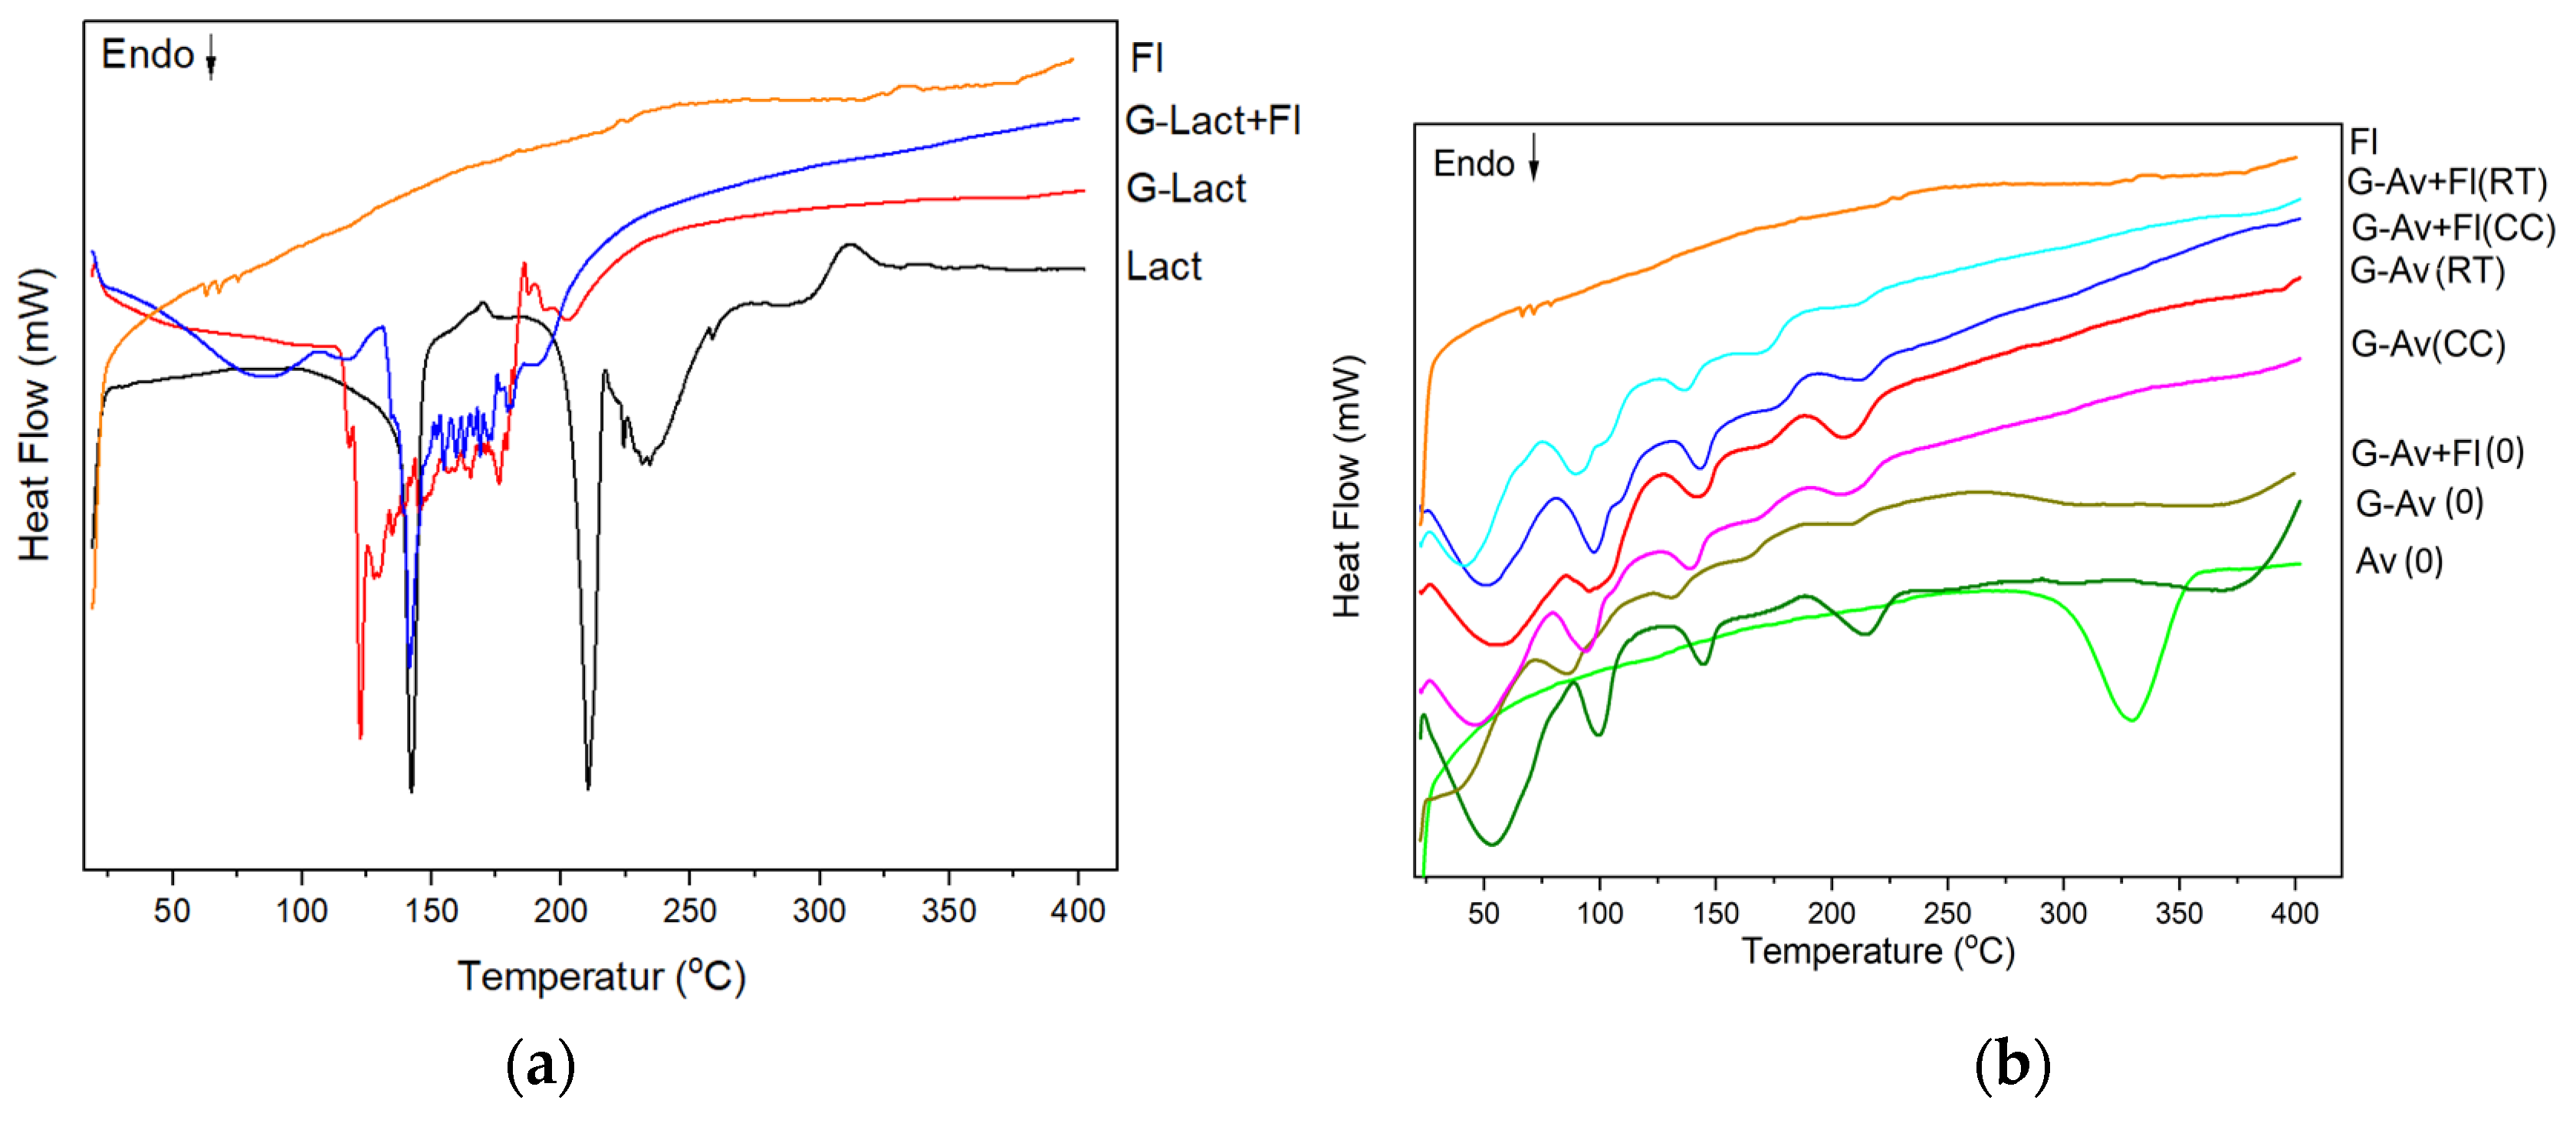
Figure 5.
XRD diffraction patterns of Deep Seawater Granules using different fillers.
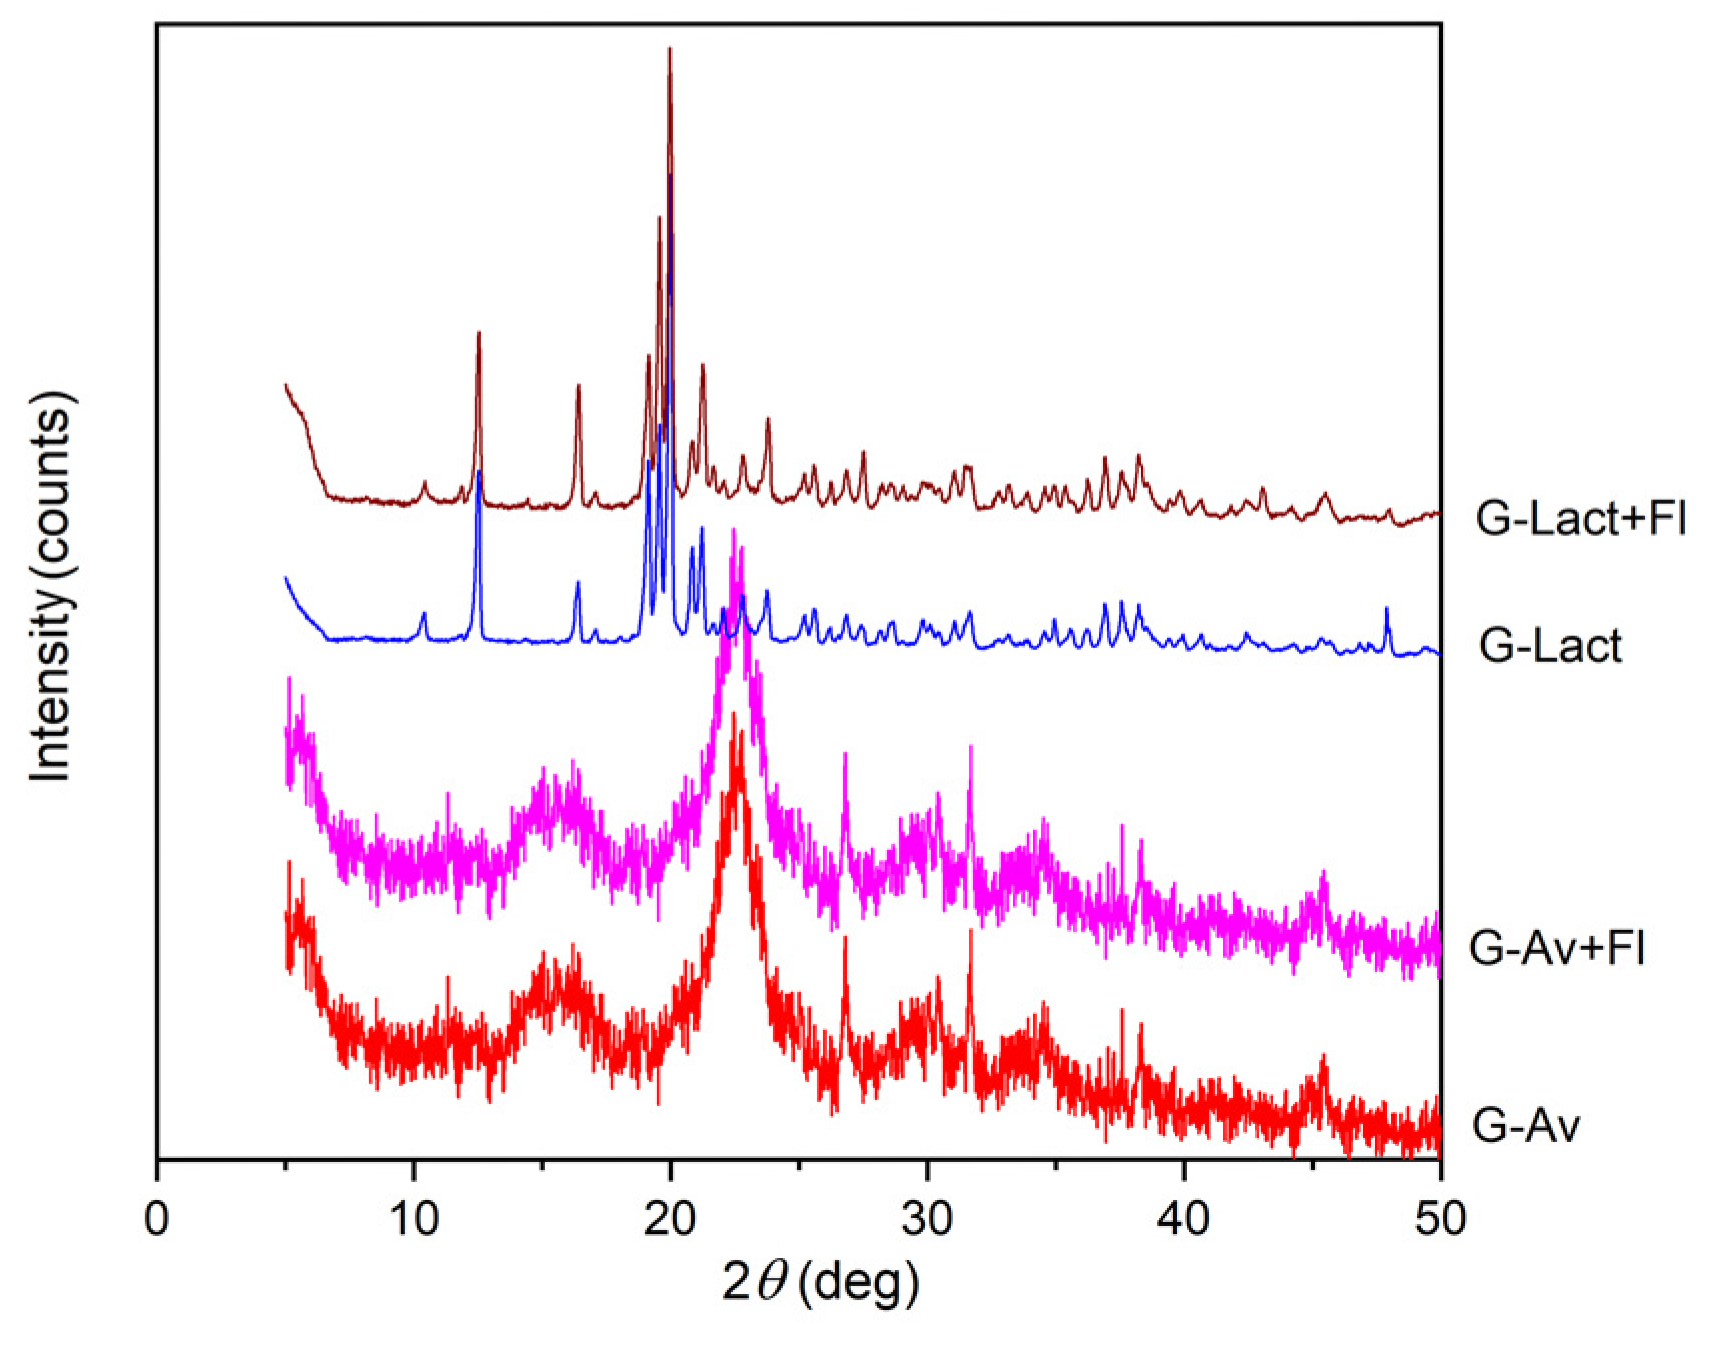
Figure 6.
Difractograms of deep seawater Granules using (a) Lactose and (b) Avicel® PH 102 as fillers at day of formulation (0) and after five months of storage at room temperature (RT) and Climatic Chamber (CC).
Figure 6.
Difractograms of deep seawater Granules using (a) Lactose and (b) Avicel® PH 102 as fillers at day of formulation (0) and after five months of storage at room temperature (RT) and Climatic Chamber (CC).
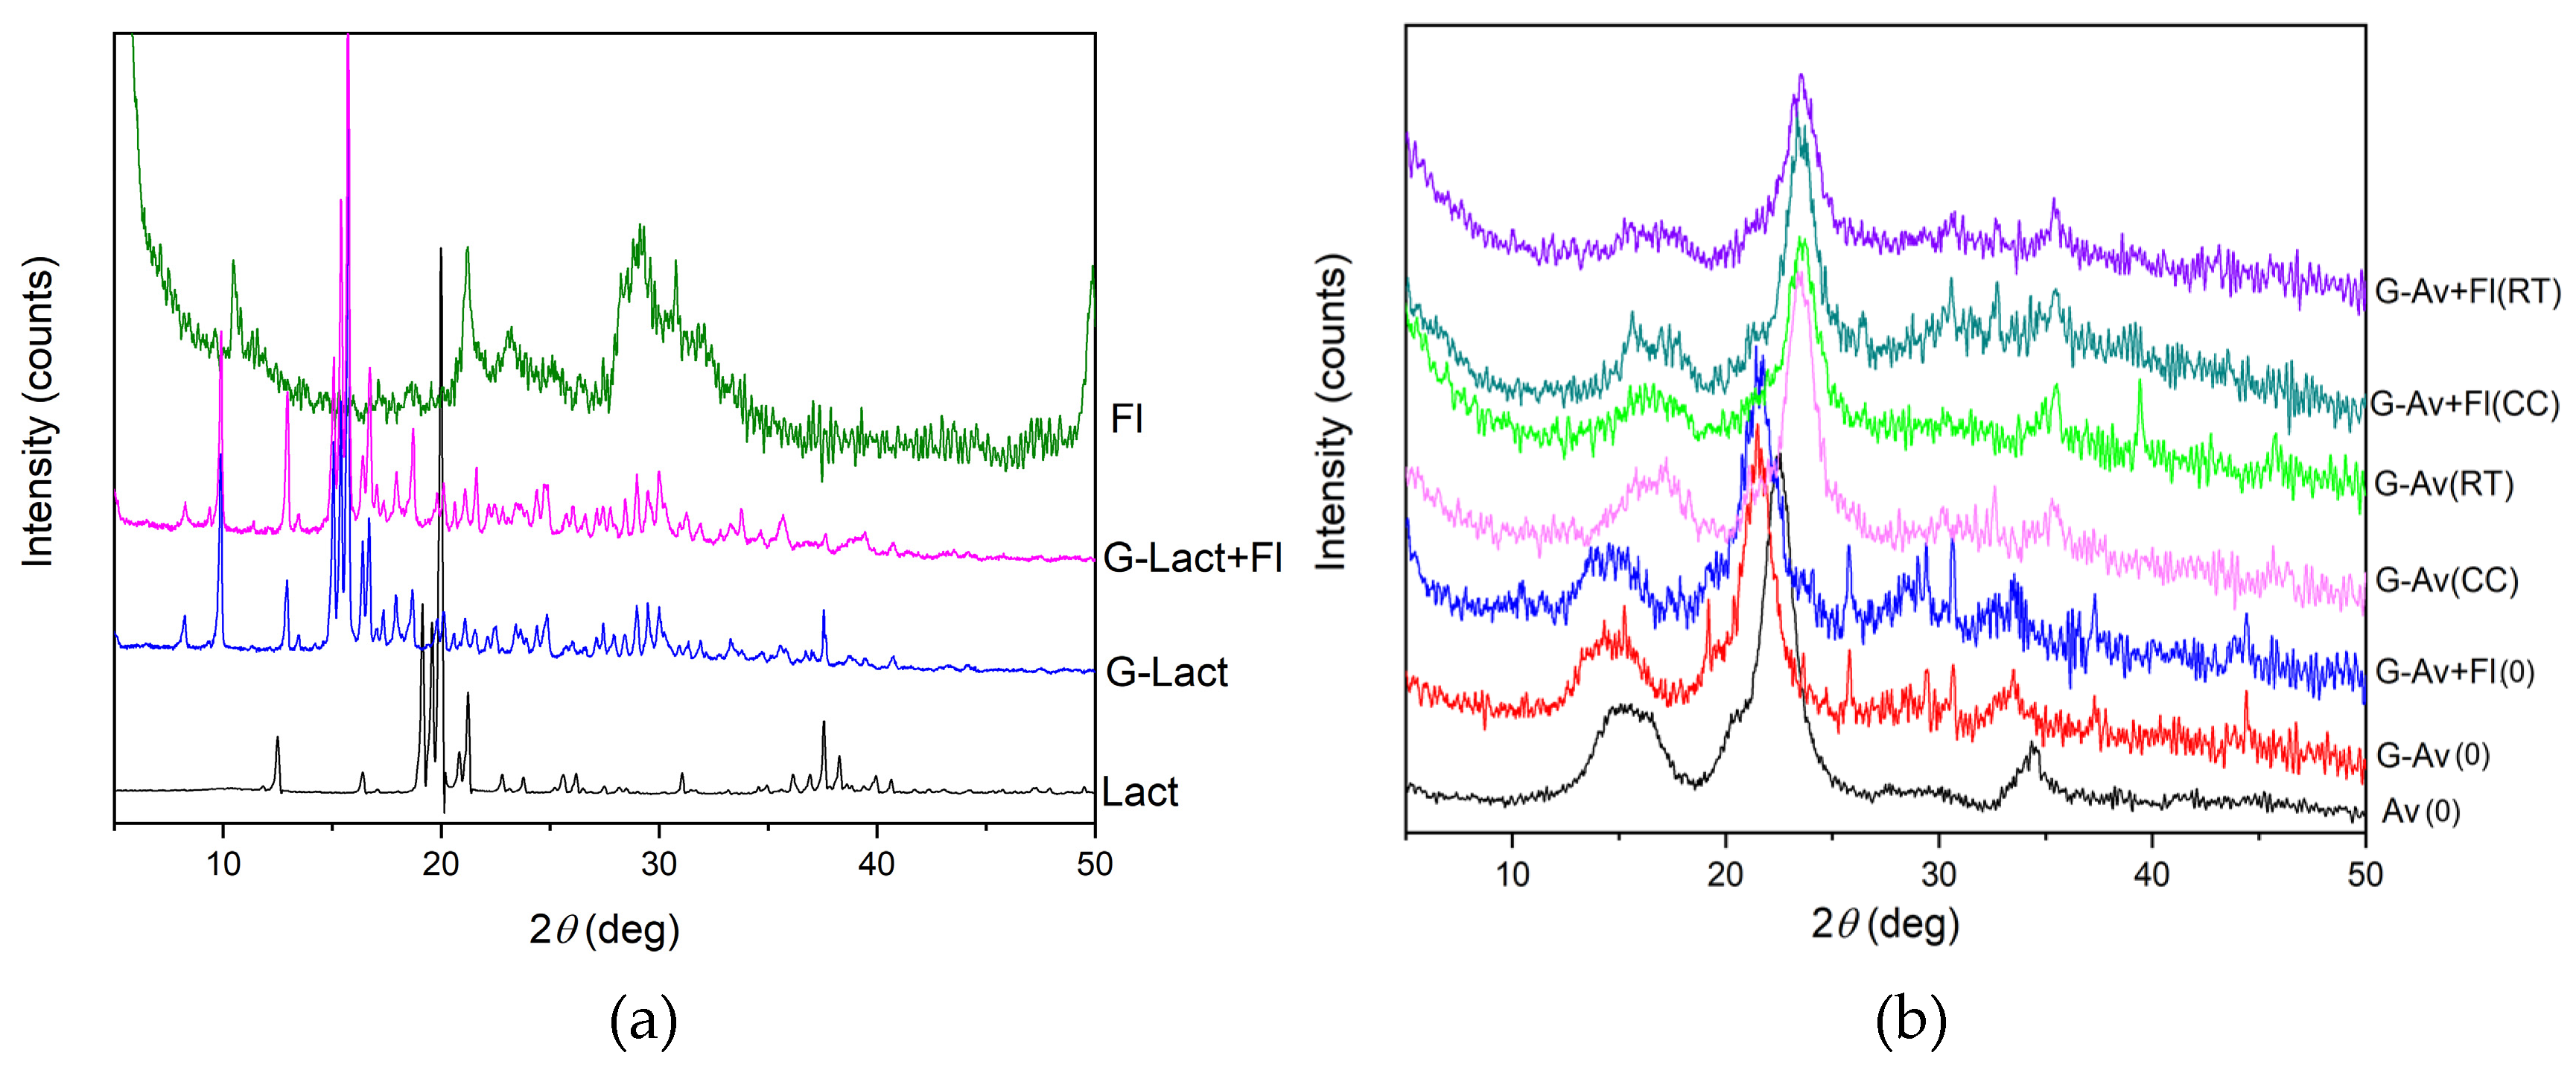
Figure 7.
Morphology of deep seawater granules using Avicel as filler (G-Av); Avicel® with Florite® 10% (G-Av+Fl); Avicel® powder (Av) and Florite® powder (Fl) using magnification of (a) 200 x; (b) ) 1.000 x; and (c) 10.000 x.
Figure 7.
Morphology of deep seawater granules using Avicel as filler (G-Av); Avicel® with Florite® 10% (G-Av+Fl); Avicel® powder (Av) and Florite® powder (Fl) using magnification of (a) 200 x; (b) ) 1.000 x; and (c) 10.000 x.
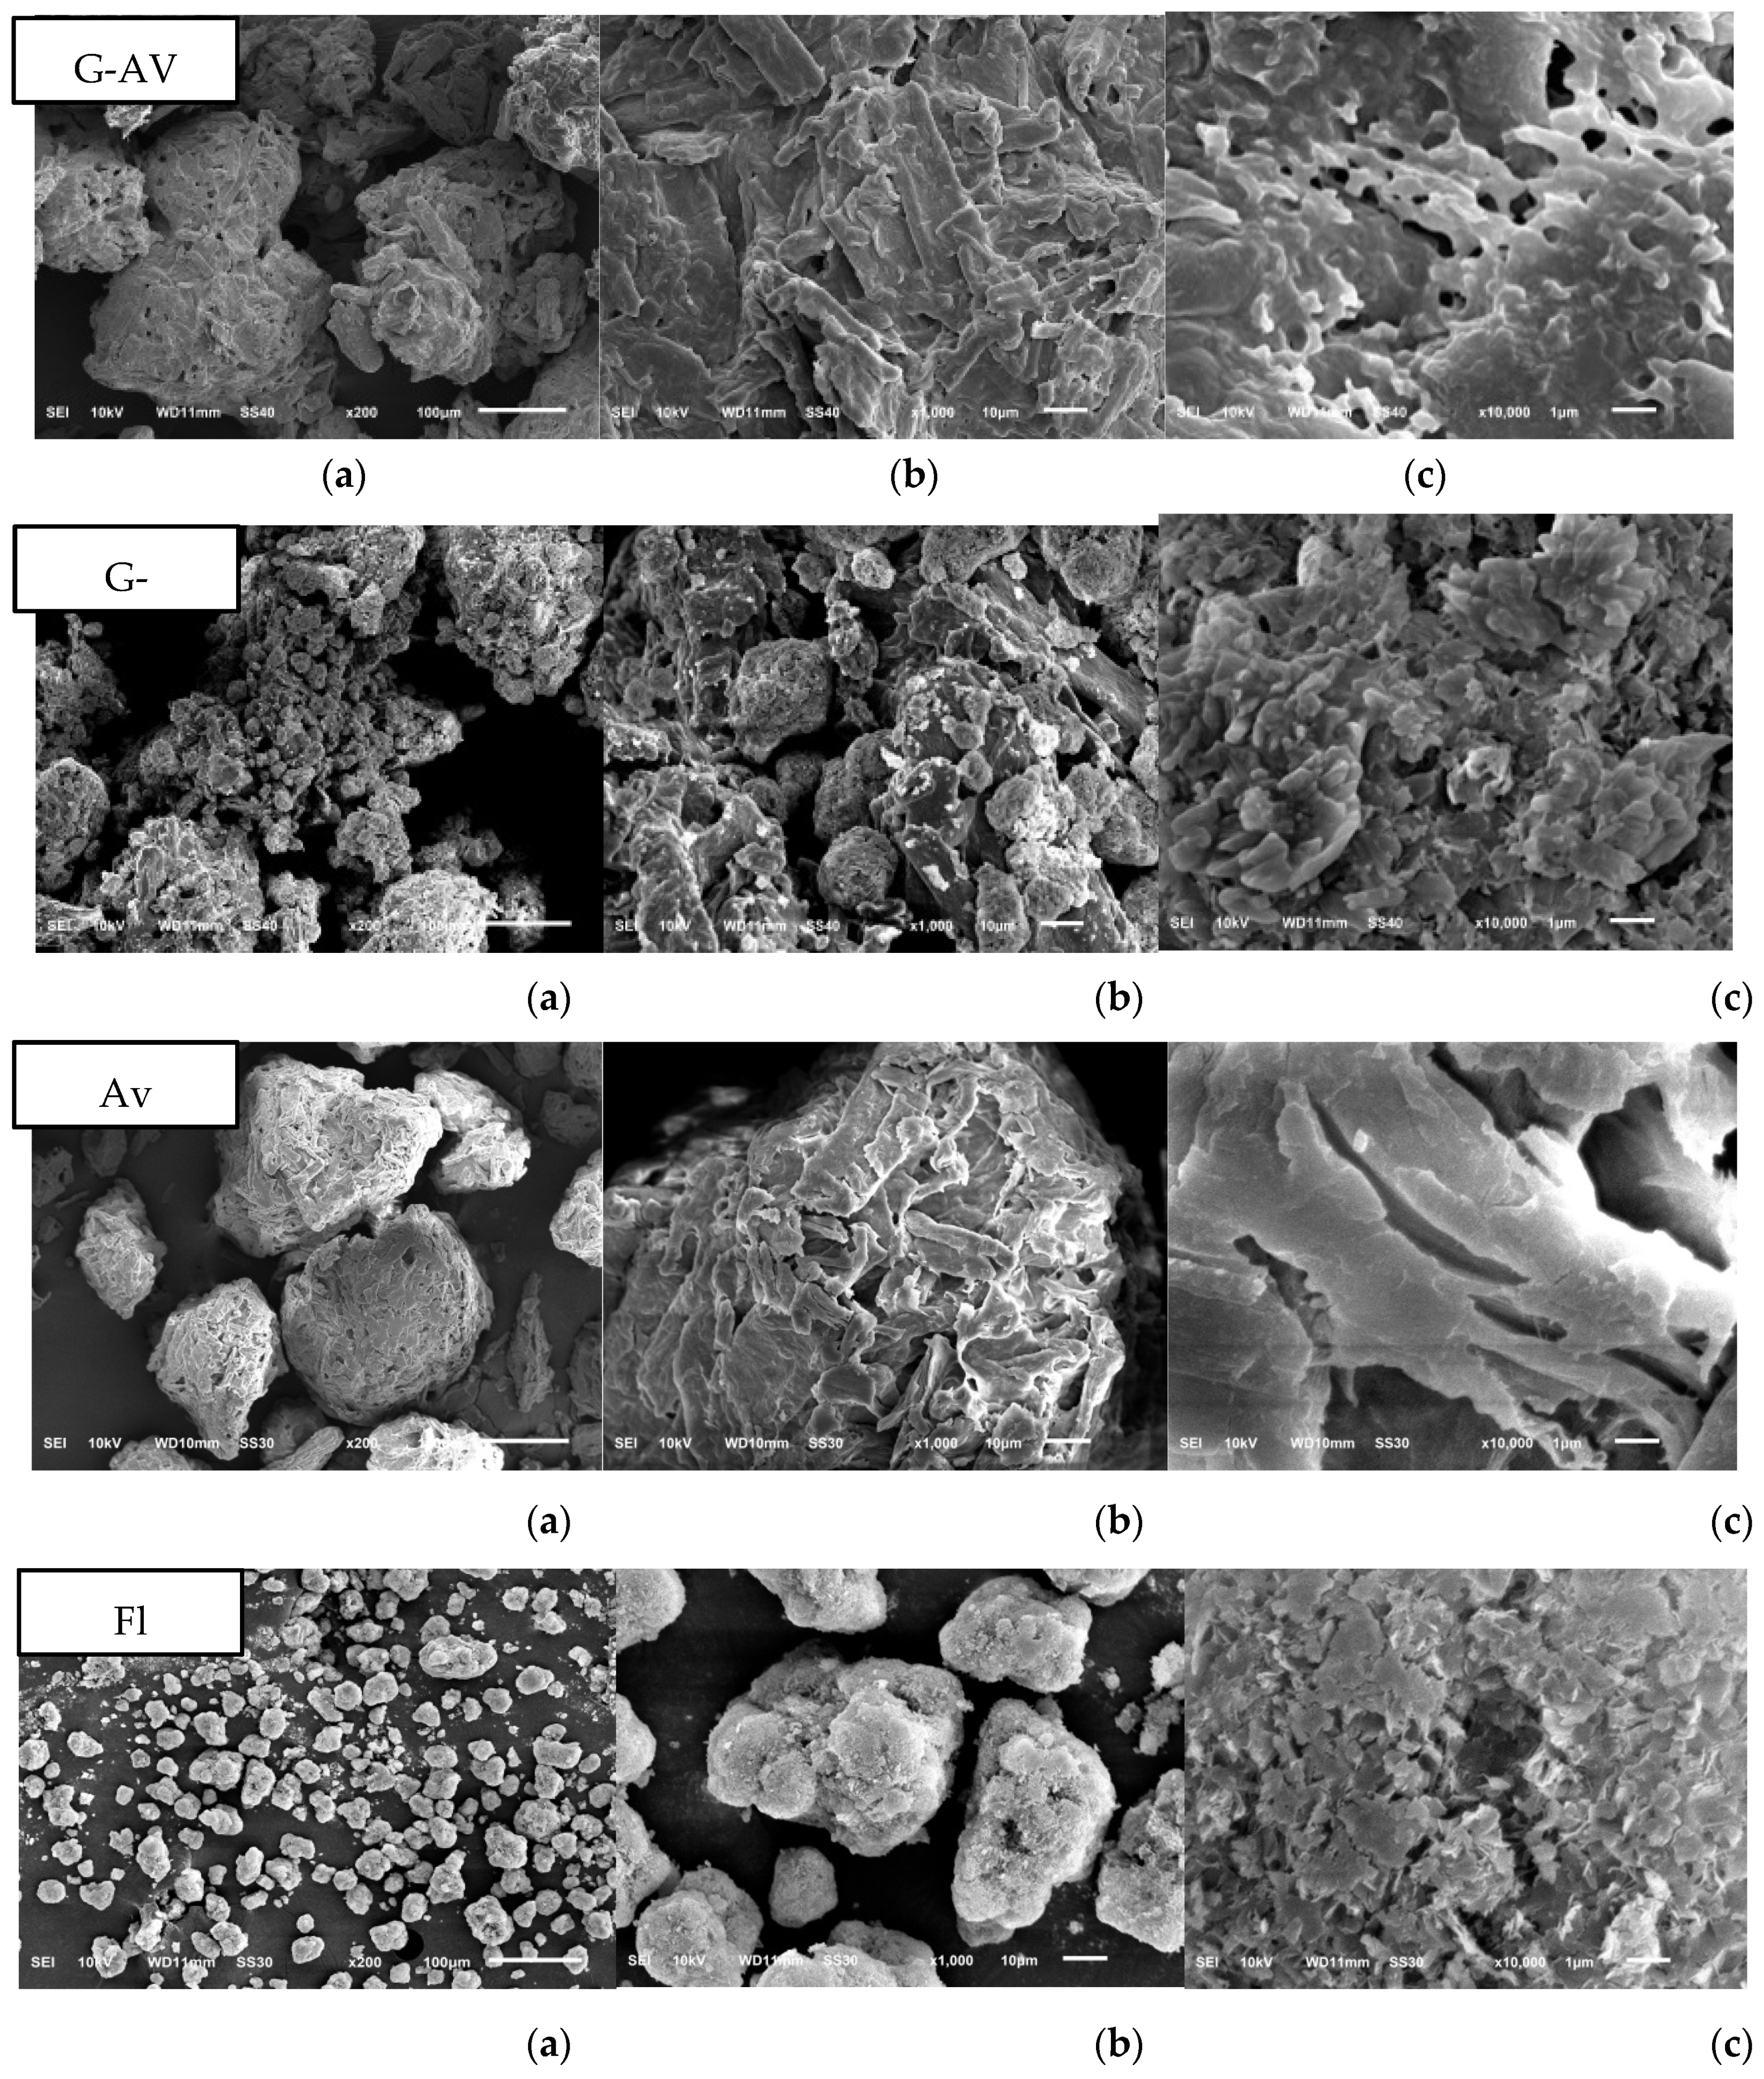
Figure 8.
Morphology of deep seawater granules using Lactose as filler (G-Lact); Lactose with Florite® 10% (G-Lact+Fl); and Lactose (Lact) powder using magnification of (a) 200 x; (b) ) 1.000 x; and (c) 10.000 x
Figure 8.
Morphology of deep seawater granules using Lactose as filler (G-Lact); Lactose with Florite® 10% (G-Lact+Fl); and Lactose (Lact) powder using magnification of (a) 200 x; (b) ) 1.000 x; and (c) 10.000 x
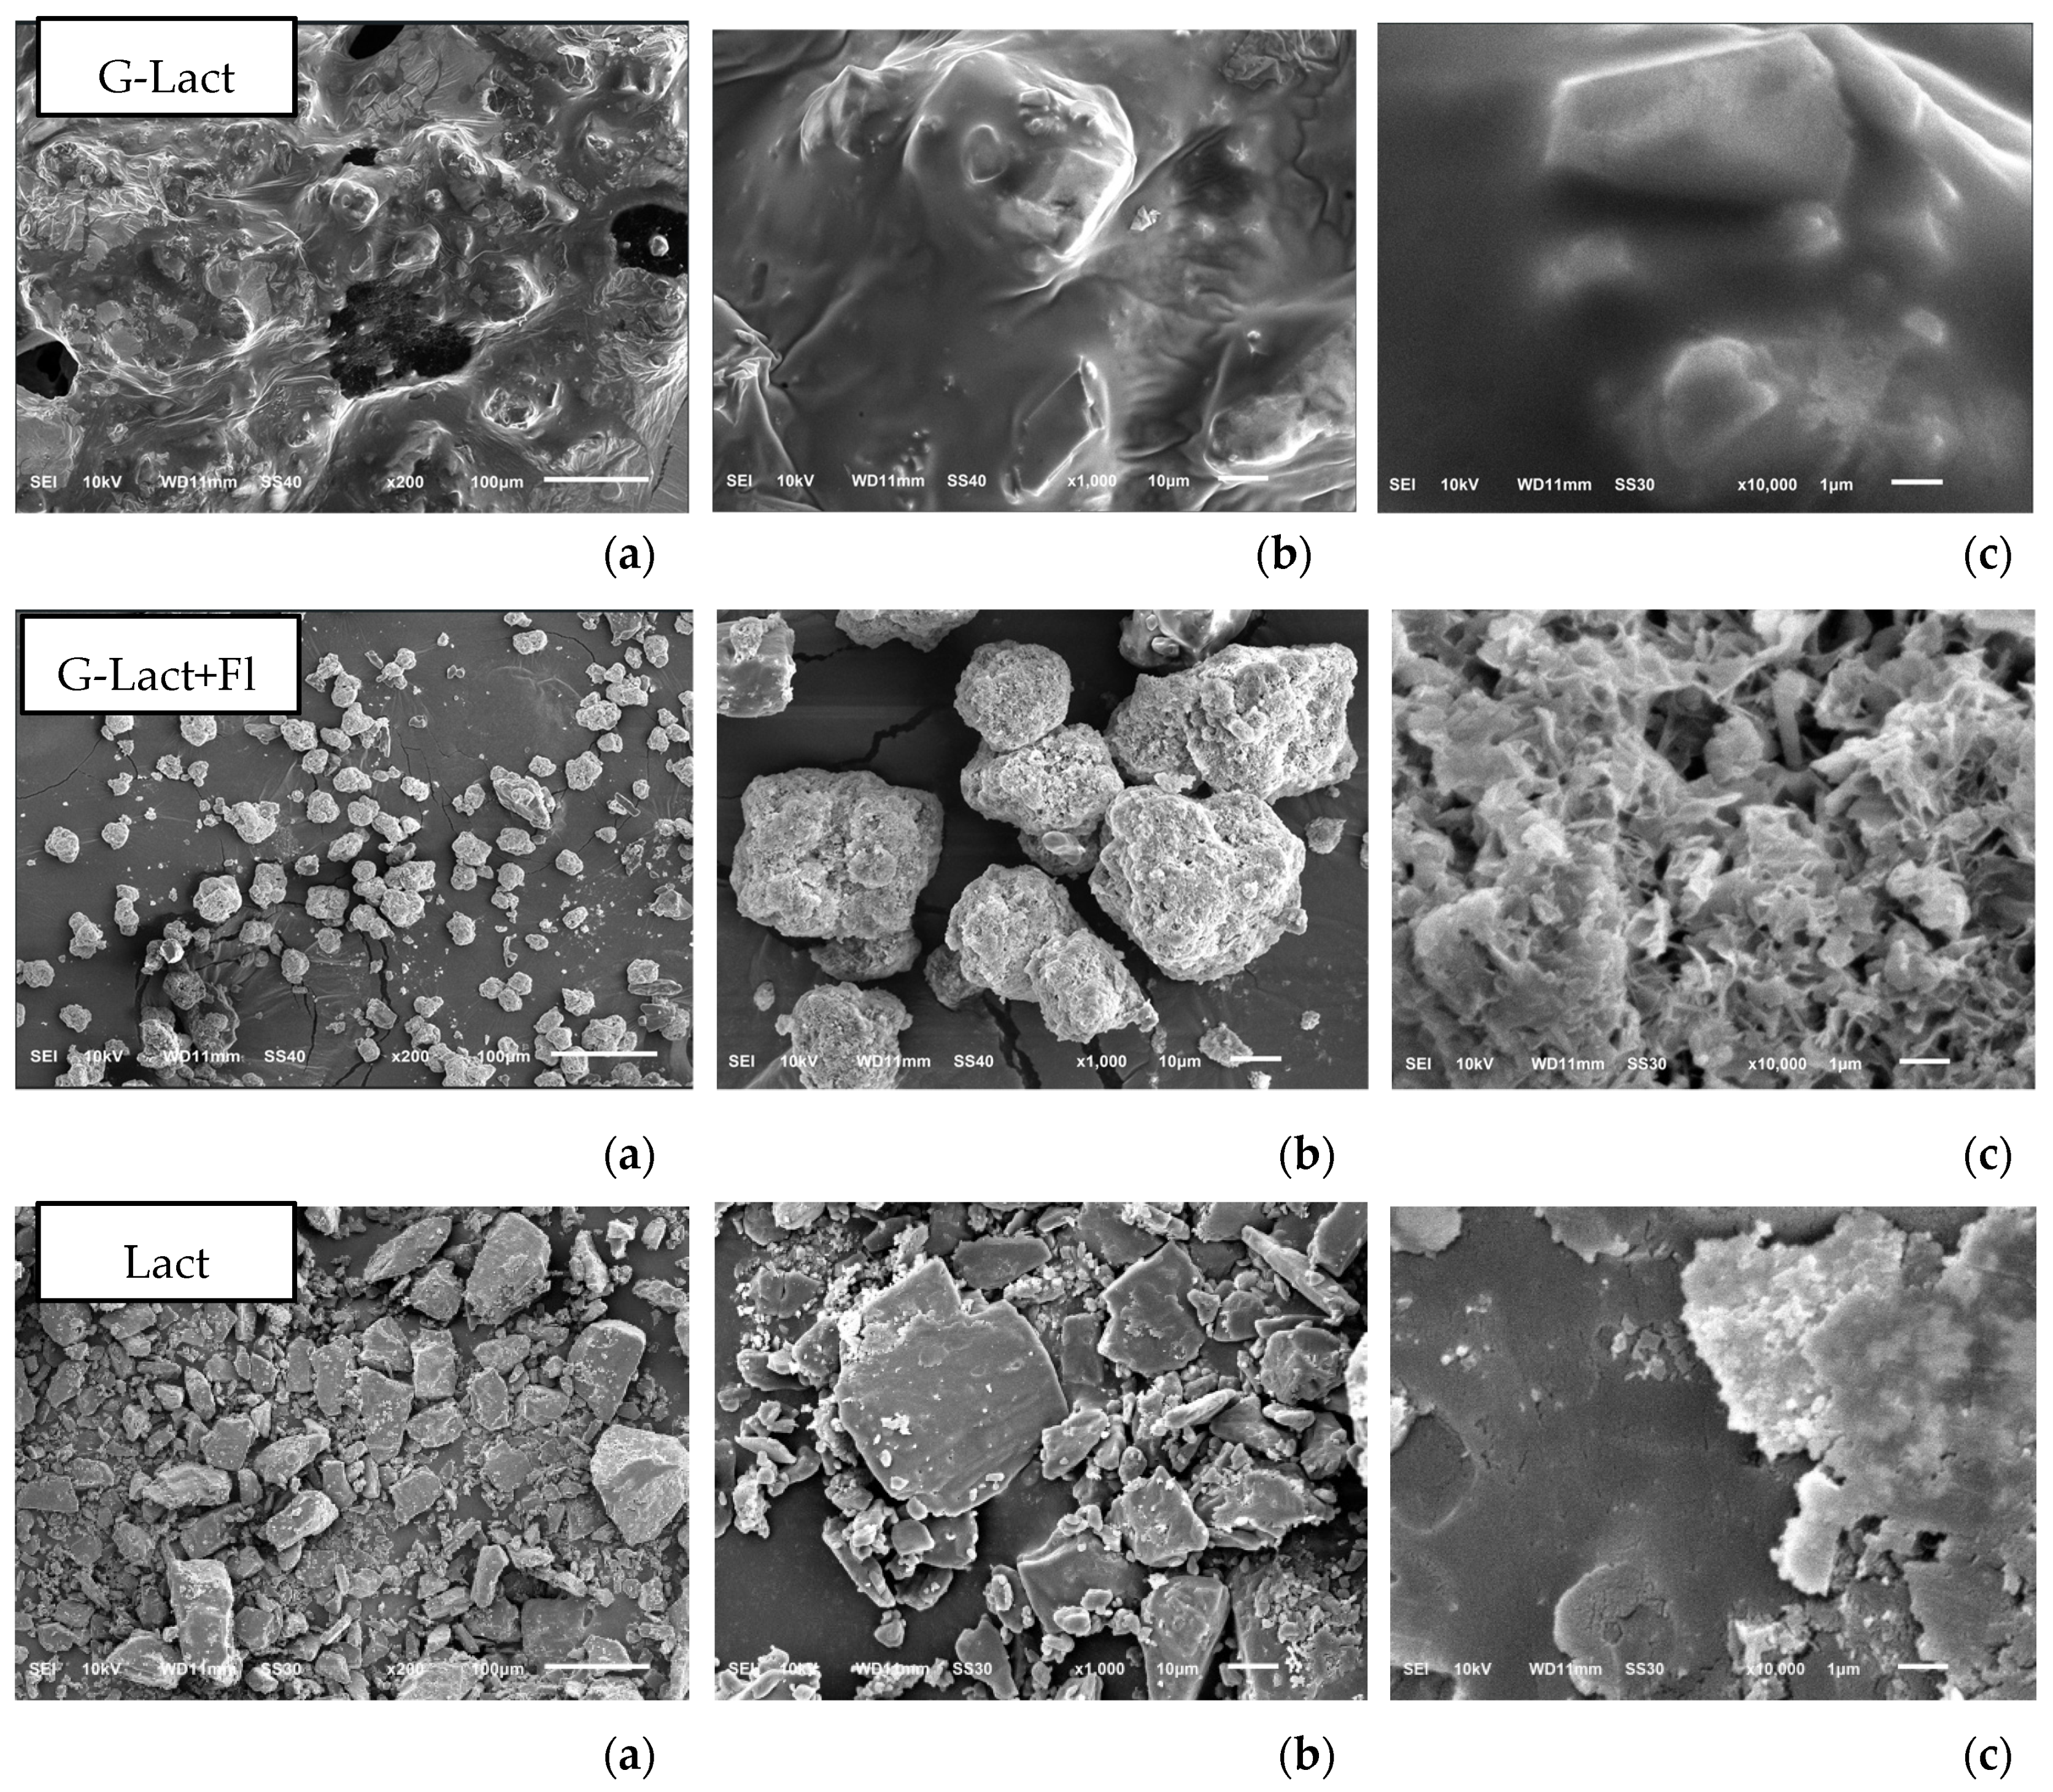
Figure 9.
Morphology of deep seawater granules after 5 months of stability study from granule using Avicel as filler (G-Av); Avicel® with Florite® 10% (G-Av+Fl); at room temperature (RT) and at climatic chamber (CC) using magnification of (a) 200 x; (b) ) 1.000 x; and (c) 10.000.
Figure 9.
Morphology of deep seawater granules after 5 months of stability study from granule using Avicel as filler (G-Av); Avicel® with Florite® 10% (G-Av+Fl); at room temperature (RT) and at climatic chamber (CC) using magnification of (a) 200 x; (b) ) 1.000 x; and (c) 10.000.
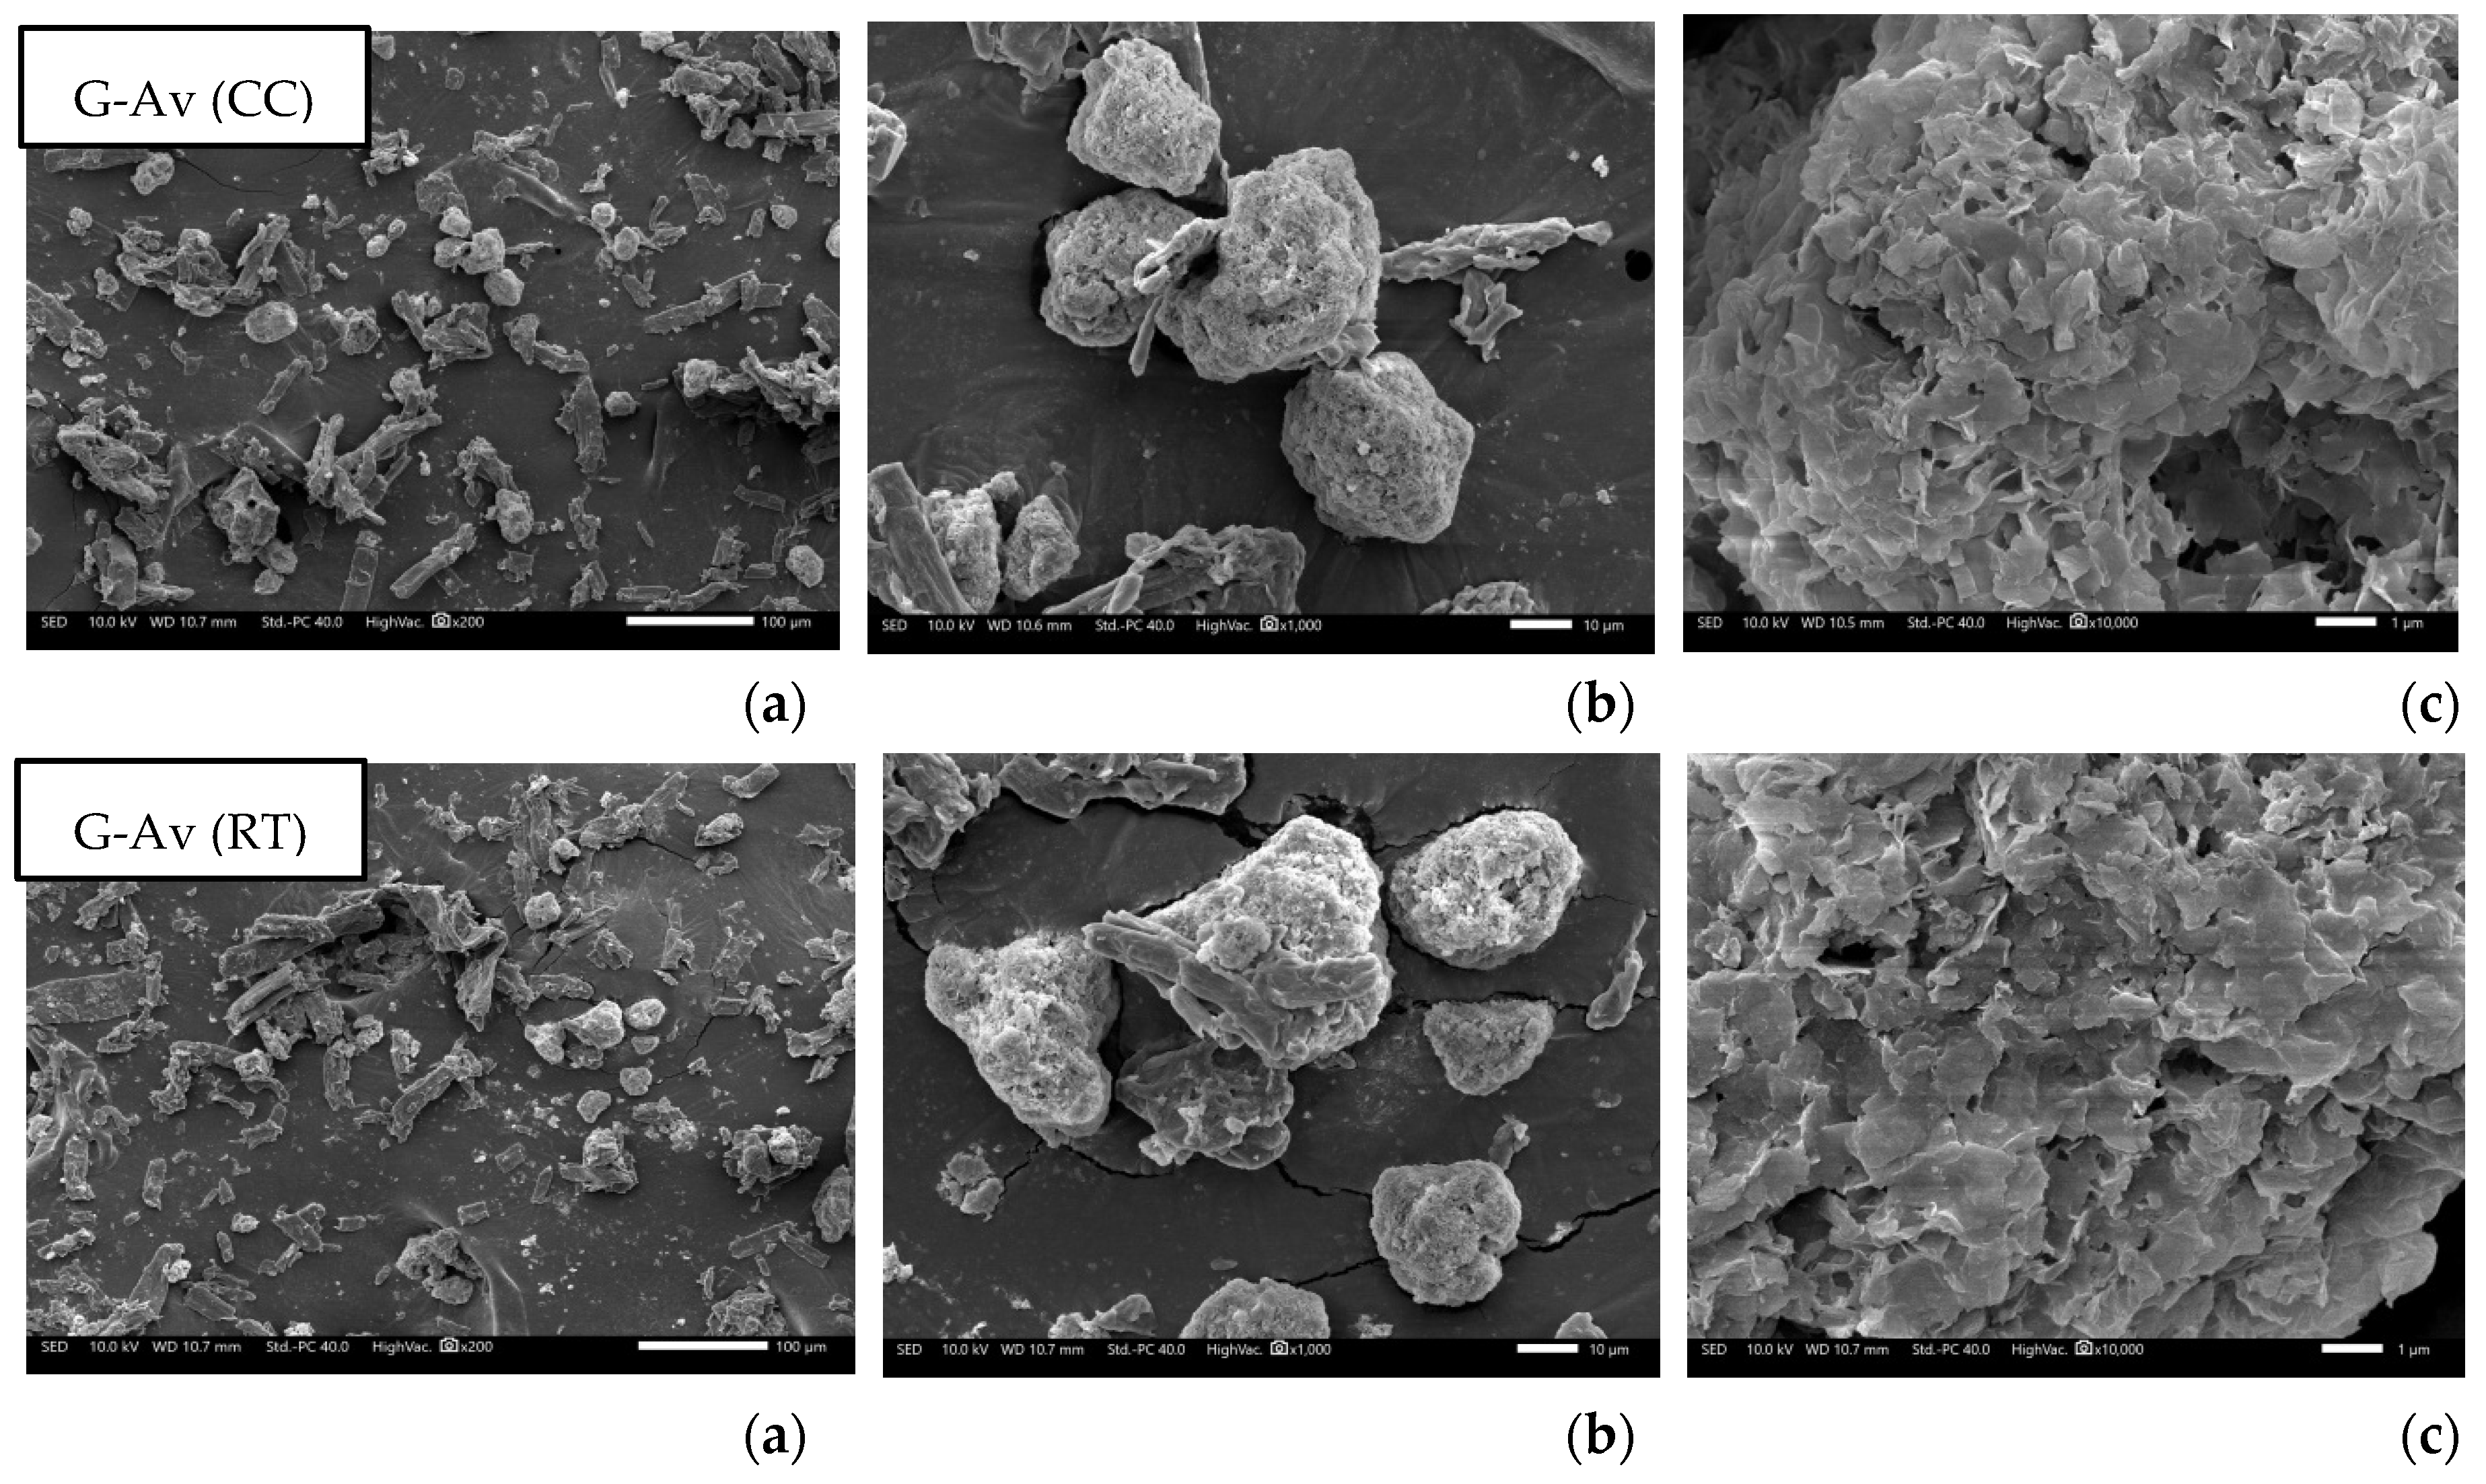
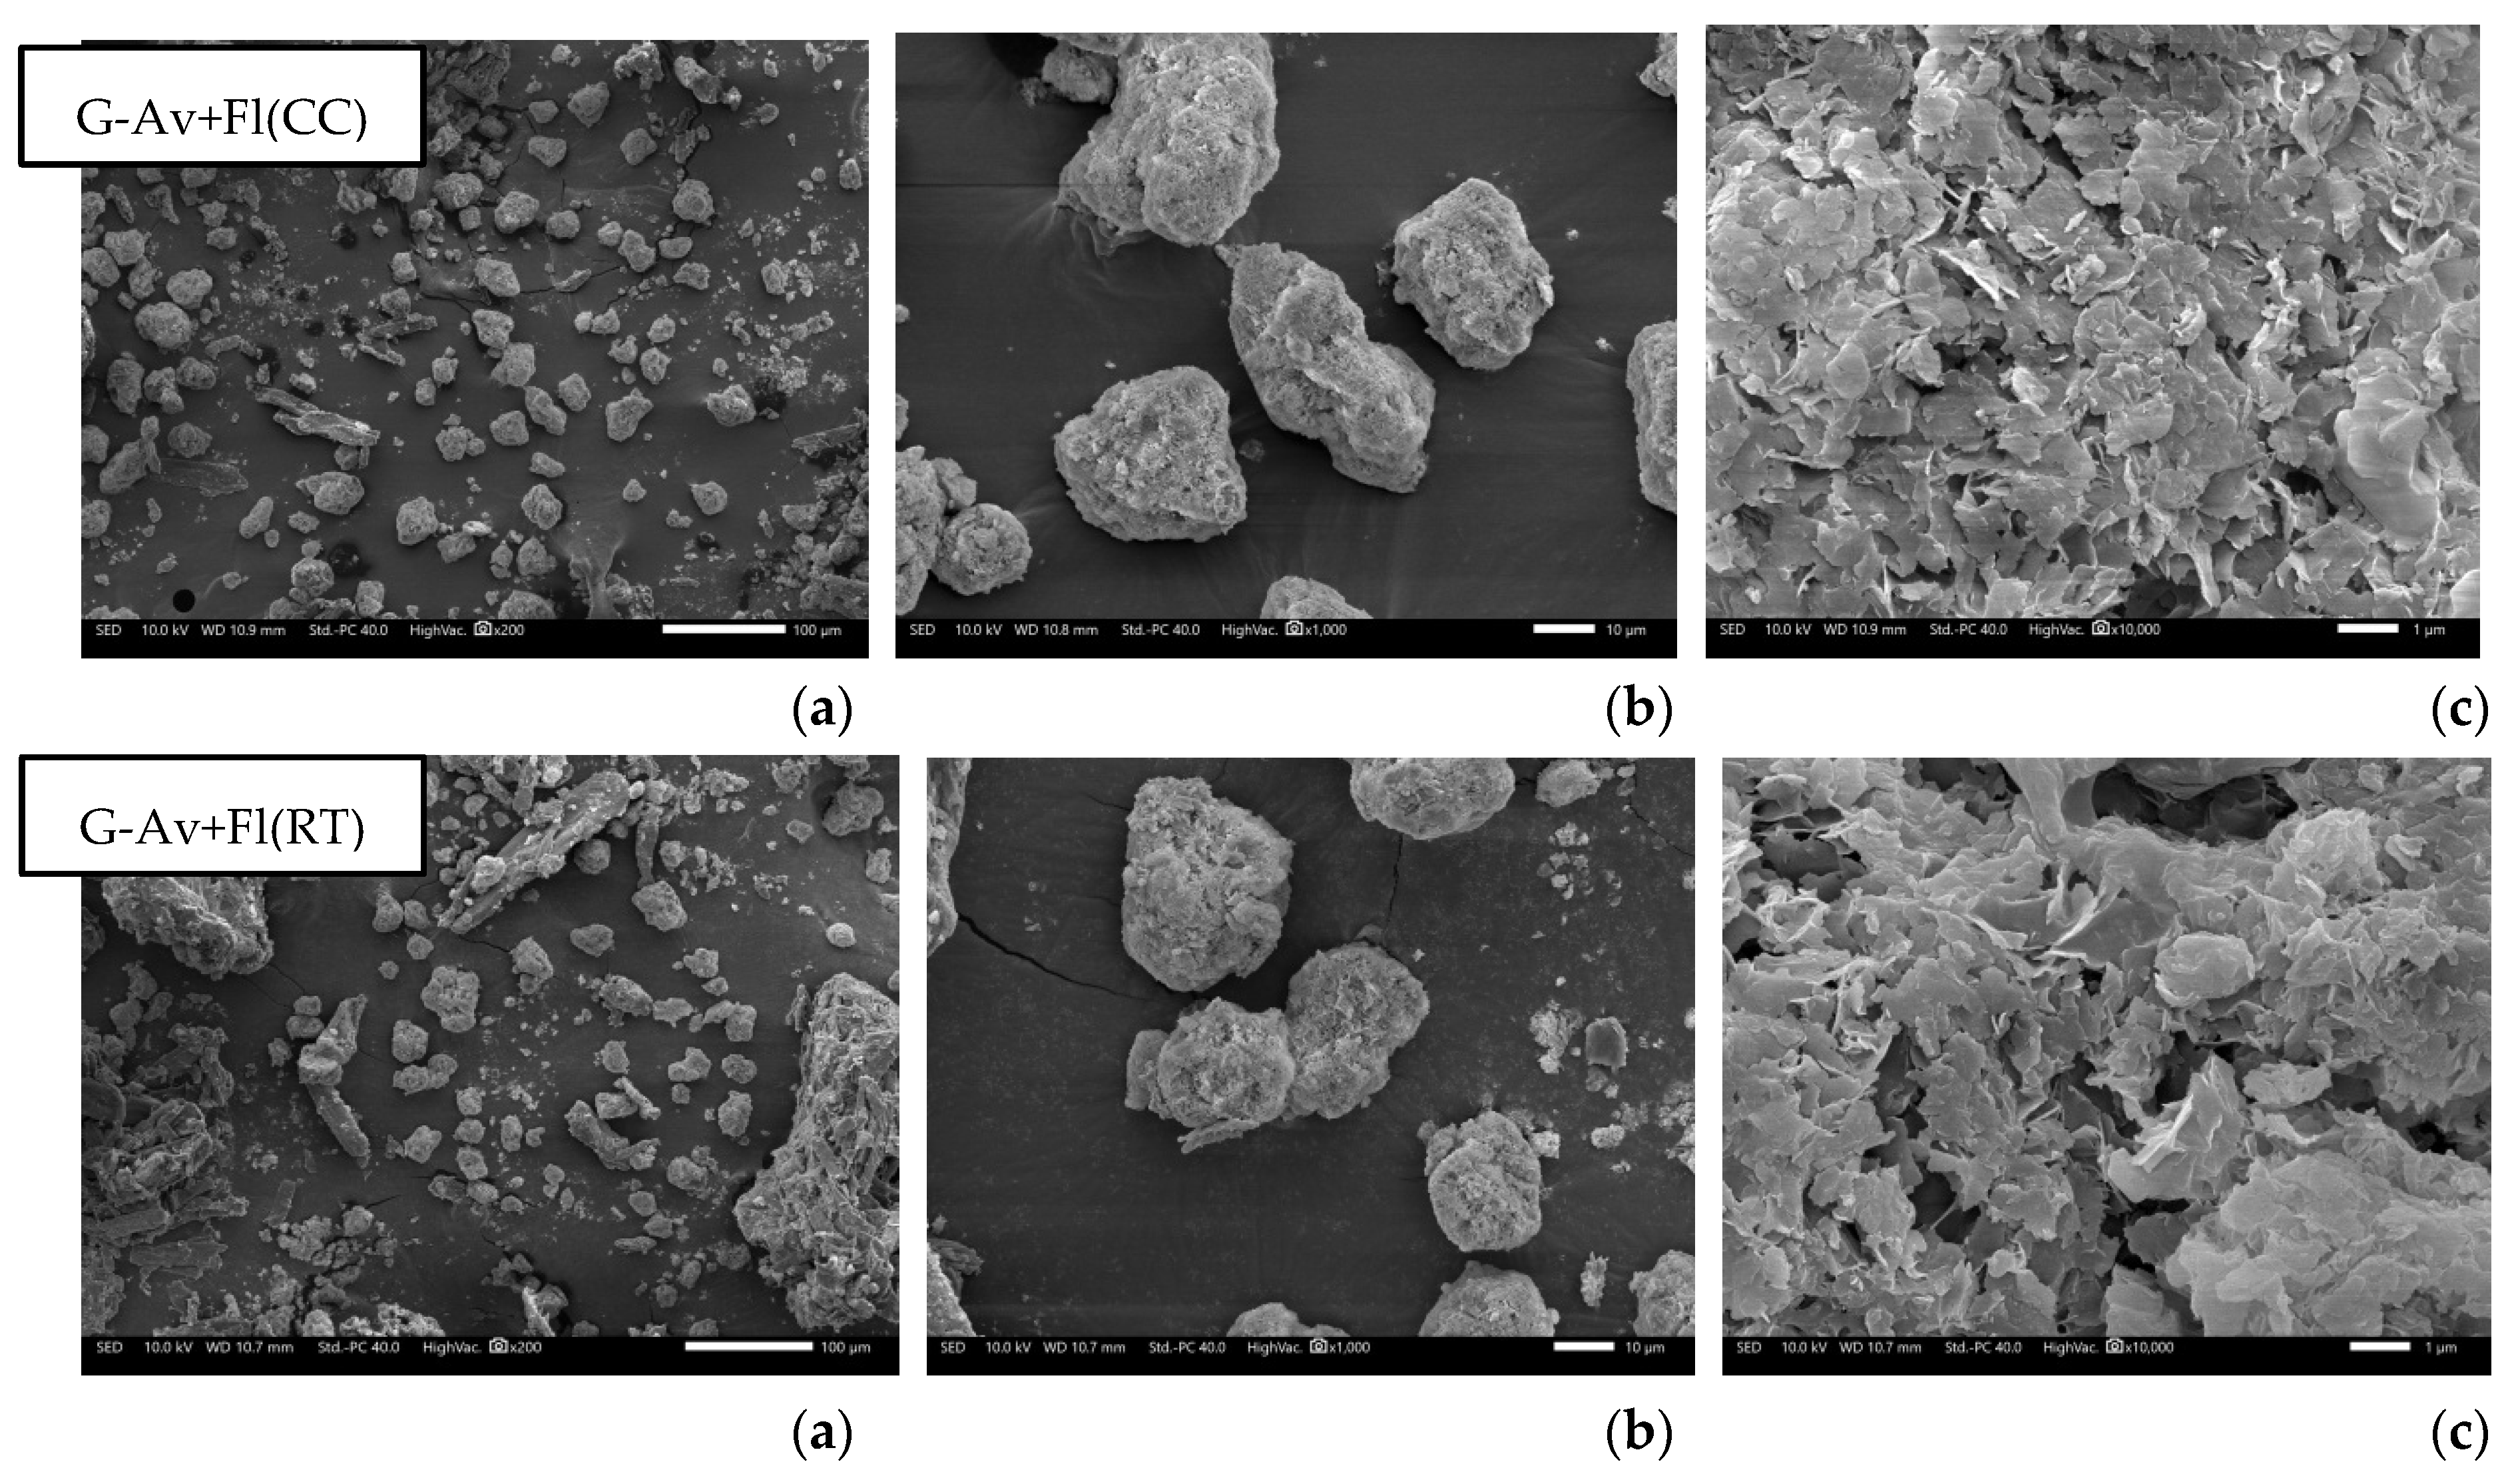

Table 1.
Physical Parameters of deep seawater concentrate.
| Parameters | Unit | Samples | Drinking Water Quality Standards | Seawater Quality Standards | Reference(s) | |||
| Grow up | Market Product | Marine Life | Port Facilities | Marine Tourism | ||||
| Color | Pt/Co Scale | 333 | 570 | 15 | - | - | 30 | [16,17] |
| Odor | Slightly Odorous | Slightly Odorous | Odorless | Natural | Odorless | Odorless | [16,17] | |
| Total Suspended Solids (TSS) | m/L | < 7.7 | < 7.7 | 40 | Coral = 20 Mangrove = 80 Seagrass = 20 |
80 | 20 | [16,17] |
Table 2.
Chemical Parameters of deep seawater concentrate.
| Parameters | Unit | Samples | Drinking Water Quality Standards | Seawater Quality Standards | Reference(s) | |||
| Grow up | Market Products | Marine Life | Port Facilities | Marine Tourism | ||||
| pH | Pt/Co Scale | 5.3 | 6.6 | 6–9 | 7–8.5 | 6.5–8.5 | 7–8.5 | [16,17] |
| Salinity | % | 311 | 283 | 33–34 | Natural Coral = 33–34 Mangrove = 33–34 Seagrass = 33–34 |
Natural | Natural | [16] |
| Dissolved Oxygen (DO) | mg/L | 2.1 | 3.1 | 6 | > 5 | - | > 5 | [16,17] |
| Biological Oxygen Demand (BOD) | mg/L | 304 | - | 6 | 20 | - | 10 | [16,17] |
| Ammonia | mg/L | 0.77 | 1.2 | 1.5 | 0.3 | 0.3 | - | [16,18] |
| Phosphate | mg/L | 0.096 | 0.23 | 0.2 | 0.015 | 0.015 | [16,17] | |
| Nitrate | mg/L | 0.084 | 0.097 | 10 | 0.008 | - | 0.008 | [16,17] |
| Nitrite | mg/L | 0.0047 | < 0.004 | 0.06 | 0.06 | 0.06 | 0.06 | [16,17] |
| Cyanide | mg/L | 0.011 | 0.005 | 0.02 | 0.5 | - | - | [16,17] |
| Sulfide | mg/L | 0.011 | 0.015 | 0.05 | 0.01 | 0.03 | 0 | [16,19] |
| Total Hydrocarbons | mg/L | < 0.79 | - | 10 | - | 1 | - | [16,20] |
| Total Phenolic Compounds | mg/L | 0.0016 | - | 0.002 | 0.002 | 0.002 | 0 | [16,17] |
| Surfactants | MBAS | 1.8 | 2.9 | 0.2 | 1 | 1 | 0.001 | [16,17] |
| Oil and fat | mg/L | <0,11 | - | 1 | 1 | 5 | 1 | [16,17] |
Table 3.
Biological Parameters of deep seawater concentrate.
| Parameters | Quality Standard Unit | Sample | Drinking Water Quality Standards | Seawater Quality Standards | Reference(s) | |||
| Grow up | Market Products | Marine Life | Port Facilities | Marine Tourism | ||||
| Fecal Coliform | Total amount per 100 ml sample (CFU) | < 10 | < 10 | 0 | - | 200 | [16,17] | |
| Total Coliform | Total amount per 100 ml sample (CFU) | 14 | <10 | 0 | 1.000 | 1000 | 1000 | [16,17] |
Table 4.
Analysis of Seawater Concentrate Using XRF and ICP-OES.
| Essential Minerals | ||||
| Elements | Samples (mg/l) | Market Product (mg/l) | ||
| XRF | ICP-OES | XRF | ICP-OES | |
| Mg | 138000 | 61817.1466 | 53200 | 1656.2590 |
| Cl | 626000 | * | 160000 | * |
| K | 82300 | 72888.7852 | 21500 | 172141.0630 |
| Ca | 8370 | 527.9098 | 0 | 94.4760 |
| On | 0 | 350.7511 | 0 | 643.0545 |
| B | 0 | 110.1492 | 0 | 154.7290 |
| Cr | 0 | < 0.0001 | 2.56 | < 0.0001 |
| With | 18.0 | < 0.0001 | 7.46 | < 0.0001 |
| Fe | 26.1 | < 0.0001 | 0 | 0.0095 |
| Mn | 0 | < 0.0001 | 0 | 4.3815 |
| Zn | 0 | < 0.0001 | 0 | 1.0785 |
| Toxic Minerals | ||||
| To the | 0 | < 0.0001 | 0 | 6.4350 |
| In | 0 | * | 0 | * |
| Tl | 0 | < 0.0001 | 0 | < 0.0001 |
| As | 0 | < 0.0001 | 0 | < 0.0001 |
| Hg | 0 | < 0.0001 | 0 | < 0.0001 |
| Cd | 0 | < 0.0001 | 0 | < 0.0001 |
| Pb | 0 | < 0.0001 | 0 | < 0.0001 |
| Non-essential and Non-toxic Minerals | ||||
| S | 79000 | * | 20700 | * |
| Br | 19100 | * | 3010 | * |
| Yes | 5340 | * | 1870 | * |
| Rb | 790 | * | 49.9 | * |
| Sn | 325 | <0.0001 | 78.6 | <0.0001 |
| Ta | 31.2 | * | 11.4 | * |
| In | 26 | <0.0001 | 0 | <0.0001 |
*not conducted.
Table 5.
Formula for Deep Seawater Granules.
| No | Formula | Filler | Desiccant | Binder (%) |
|---|---|---|---|---|
| 1 | G-AV | Avicel® PH 102 | - | Amylum 10 |
| 2 | G-Av- Fl | Avicel® PH 102 | Floritis® | Amylum 10 |
| 3 | G-Lact | Lactose | - | Amylum 10 |
| 4 | G-Lact-Fl | Lactose | Floritis® | Amylum 10 |
Disclaimer/Publisher’s Note: The statements, opinions and data contained in all publications are solely those of the individual author(s) and contributor(s) and not of MDPI and/or the editor(s). MDPI and/or the editor(s) disclaim responsibility for any injury to people or property resulting from any ideas, methods, instructions or products referred to in the content. |
© 2024 by the authors. Licensee MDPI, Basel, Switzerland. This article is an open access article distributed under the terms and conditions of the Creative Commons Attribution (CC BY) license (http://creativecommons.org/licenses/by/4.0/).
Copyright: This open access article is published under a Creative Commons CC BY 4.0 license, which permit the free download, distribution, and reuse, provided that the author and preprint are cited in any reuse.


