
Submitted:
23 December 2024
Posted:
25 December 2024
You are already at the latest version
Abstract
Background: Increasing evidence suggests that serum carotenoids, an objective indicator of fruit and vegetable consumption, promote the development of cancer and other cardiometabolic diseases. Several studies have demonstrated the role of food insecurity in adverse health outcomes. This raises the question of whether the interplay of food insecurity and low carotenoid levels results in a disproportionately higher mortality burden.
Methods: In the National Health and Nutrition Examination Survey (2001-2006), we incorporated data on serum carotenoids (α-carotene, β-carotene, β-cryptoxanthin, total lycopene, and lutein/zeaxanthin) and food security from 12,355 US adults aged ≥20. All-cause, cancer, and cardiovascular disease (CVD) mortality were ascertained by linkage to the National Death Index through December 31, 2019. Cox regression was utilized to estimate hazard ratios (HRs) and 95% confidence intervals (CIs).
Results: After adjusting for sociodemographics, lifestyle, diet quality, and underlying medical conditions, all-cause mortality was significantly lower in individuals with higher levels of serum carotenoids (HRs [95% CIs] for the highest vs. lowest quartiles=0.70 [0.61-0.81] for α-carotene, 0.74 [0.63-0.87] for β-carotene, 0.78 [0.66-0.91] for β-cryptoxanthin, 0.65 [0.52-0.81] for lycopene, and 0.70 [0.61-0.79] for lutein/zeaxanthin). When stratified by food security status, these inverse associations were observed exclusively among individuals with high food security, with no associations among those with marginal, low, or very low food security (P-interaction=0.02 for lycopene, 0.08 for lutein/zeaxanthin, and >0.05 for the others).
Conclusions: In this nationally representative sample of US adults, low serum carotenoids and food insecurity were jointly associated with increased risk of mortality, even after controlling for a broad spectrum of sociodemographic, lifestyle/diet, and clinical risk factors. Our findings underscore the urgent need for social risk-targeted nutritional programs to reduce health disparities in the US.
Keywords:
Diet
; Food Security
; Health Outcomes
Introduction
Increasing evidence suggests that serum carotenoids, an objective indicator of fruit and vegetable consumption, promote the development of cancer and other cardiometabolic diseases [1,2,3]. The health-promoting effects of fruits and vegetables appear primarily attributable to diverse nutritional components, including vitamins, fiber, and carotenoids, which possess antioxidant and anti-inflammatory properties [1]. In particular, carotenoids, abundant in colorful fruits and vegetables, have attracted significant attention due to their potent ability to scavenge reactive oxygen species (ROS), which can cause damage to DNA, RNA, and proteins involved in metabolism. This action plays a key role in mitigating various ROS-related disorders, including cancer, CVD, neurodegenerative diseases, and chronic inflammation [4,5] A growing body of epidemiological evidence has indicated that dietary consumption, as well as serum concentrations of carotenoids, confer protective effects against the risk of developing and/or dying from the aforementioned diseases in the general population [3,6,7,8,9,10,11]
Moreover, several studies have demonstrated the role of food insecurity, encompassing factors like food accessibility and affordability resulting in adverse health outcomes [12,13,14]. Specifically, food insecurity, defined as the inability to access adequate and safe foods due to financial constraints [15], can lead to insufficient fruit and vegetable intake, resulting in poor diet quality [16,17,18,19,20]. Food security status may significantly influence the health benefits derived from fruits and vegetables by directly controlling the total amount consumed and/or the overall quality of an individual’s diet. Furthermore, it is also possible that the functionality and bioavailability of carotenoids may be dependent upon food security status.
We investigated whether the combined impact of food insecurity and carotenoid levels influenced mortality risk from cancer, cardiometabolic diseases, and all causes among US adults in the National Health and Nutrition Examination Survey.
Materials and Methods
Study Population
This study is based on the National Health and Nutrition Examination Survey (NHANES), an ongoing biennial health examination that represents the noninstitutionalized civilian population of the US. Detailed information on the NHANES has been documented elsewhere [21]. We utilized data from the 2001-2002, 2003-2004, and 2005-2006 waves of NHANES, which included serum concentrations of carotenoids, including α-carotene, β-carotene, β-cryptoxanthin, total lycopene, and lutein/zeaxanthin, along with the food security assessments using the USDA Household Food Security Survey Module [22]. Individuals aged 20 years or older with at least one valid serum carotenoid measurement were initially screened as the eligible analytic sample. Participants who did not complete food security assessment or reported being pregnant, or lacked follow-up information were excluded from the analysis, leaving a final unweighted sample of 12,355 (Figure S1).
Assessment of Carotenoids
Serum concentrations of α-carotene, β-carotene (the sum of Trans-β-carotene and Cis-β-carotene), β-cryptoxanthin, total lycopene, and lutein/zeaxanthin were measured by high-performance liquid chromatography (HPLC) during the NHANES 2001-2002 and 2005-2006 cycles. In 2003-2004, carotenoids were quantified using a comparable HPLC technique and subsequently transformed by regression analysis into carotenoid readings that were equivalent to those obtained from the HPLC method. Total lycopene was not measured in 2001-2002. The laboratory protocols and quality control assessments for measuring serum carotenoids have been described previously [23,24,25]. To investigate the association with mortality outcomes, serum carotenoid levels were categorized into quartiles according to the distribution of the study population.
Assessment of Food Security Status
Food security status was evaluated using the USDA Household Food Security Survey Module, which comprises 18 questions for households with children under 18 years of age and 10 items for households without children [22]. Based on the affirmative responses to the questions concerning the preceding 12 months, food security status was classified into four levels: 1) High food security indicates no issues or constraints regarding food access; 2) Marginal food security reflects one or two signs, usually related to anxiety about food adequacy or shortage with minimal or no changes in dietary habits or food consumption; 3) Low food security denotes diminished quality, variety, or desirability of the diet with minimal or no evidence of decreased food consumption; and 4) Very low food security exhibits multiple signs of disrupted eating patterns and diminished food intake [26].
Ascertainment of Mortality
Mortality outcomes were confirmed through linkage to death certificate records from the National Death Index, with follow-up duration computed from the date of survey participation through December 31, 2019 [27]. The underlying causes of death were defined by the International Classification of Diseases, Tenth Revision (ICD-10) codes, including cancer (C00–C97) and CVD (heart diseases, I00-I09, I11, I13, I20-I51; cerebrovascular diseases, I60-I69).
Covariates
Information on sociodemographics, lifestyle factors, dietary quality/patterns, and other health-related characteristics were collected during the questionnaire survey. Covariates were selected a priori—included were age (years), sex (male and female), self-reported race/ethnicity (non-Hispanic White, non-Hispanic Black, Hispanic, Others), educational attainment (below high school, high school graduate, college or above), family income-to-poverty ratio (<1.30, 1.30 to <3.50, ≥3.50), smoking status (never smokers who smoked fewer than 100 cigarettes during their lifetime, former smokers who had smoked more than 100 cigarettes but quit smoking, current smokers who continued to smoke), physical activity (inactive, moderate, vigorous; determined based on participation in walking or cycling, moderate, and vigorous activities over the past 30 days), alcohol consumption (none, light-to-moderate defined as >0 to ≤2 drinks/day for men and >0 to ≤1 drink/day for women, heavy as >2 drinks/day for men and >1 drink/day for women over the past 12 months), obesity status (body mass index <18.5, 18.5-24.9, 25.0-29.9, or ≥30.0 kg/m2; underweight, normal, overweight, and obese, respectively), use of dietary supplement (yes, no), Healthy Eating Index (HEI) representing overall diet quality and adherence to the Dietary Guidelines for Americans [28], and underlying medical conditions, including history of cancer and CVD (heart failure, coronary heart disease, stroke), diabetes (self-reported doctor diagnosis, taking insulin or oral hypoglycemic medication), and hypertension (self-reported doctor diagnosis, taking antihypertensive treatment).
Statistical Analysis
To accommodate the complex survey design and generate nationally representative estimates, all analyses incorporated sample weights, strata, and primary sampling units. Baseline characteristics across food security status were compared using the chi-square test for categorical variables and the one-way analysis of variance test for continuous variables. Cox proportional hazards regression was used to estimate the hazard ratios (HRs) and 95% confidence intervals (CIs) for mortality outcomes in associated with serum carotenoids and food security status. The lowest quartile of serum carotenoids was modeled as the reference. Follow-up time was calculated using person months from the date of survey participation to either the date of death or the end of the mortality follow-up period, whichever came first. The aforementioned covariates were incorporated into the statistical model in a sequential manner: 1) the basic models were adjusted for sociodemographic factors only, including age, sex, race/ethnicity, education, and family income-to-poverty ratio; and 2) the final models further included smoking status, physical activity, alcohol consumption, obesity status, dietary supplement use, HEI, history of cancer and CVD, diabetes, and hypertension. Linear trends were tested using median values of each quartile of serum carotenoids. Stratified analyses were conducted to evaluate whether food security status would modify the primary associations between serum carotenoids and mortality outcomes. Interactions of serum carotenoids and food security status were assessed using a multiplicative interaction term. Restricted cubic spline regression was used to evaluate potential non-linear or linear associations between serum carotenoid levels and mortality, utilizing the 20th percentiles as a reference and fitting three knots at the 5th, 50th, and 95th percentiles. To minimize the impact of extreme outliers, the analysis eliminated the top 3% of each carotenoid. All statistical analyses were performed using SAS 9.4 (SAS Institute Inc., Cary, NC). A two-sided P less than 0.05 was considered statistically significant.
Results
Between 2001 and 2006, the weighted prevalence of high, marginal, low, and very low food security among US adults aged ≥20 years was 83.5%, 6.0%, 6.5%, and 4.0%, respectively (Table 1). Individuals facing any challenges with food access were more likely to be younger, belong to racial or ethnic minoritized groups, possess lower educational attainment, and have a low household income (p<0.001). Notably, a majority of those in the very low food security group—63.3% for very low food security, 59.5% for low food security, and 46.8% for marginal food security—fell into a family income below 130% of the federal poverty level, allowing them to qualify for the Supplemental Nutrition Assistance Program. Furthermore, food-insecure individuals were more likely to report adverse health behaviors such as such as current tobacco use, physical inactivity, excessive alcohol use, and obesity while showing a lower likelihood of taking nutritional supplements or achieving higher HEI scores (p<0.001). In terms of underlying clinical conditions, a higher proportion of cancer survivors was observed in the high food security group (8.9%) compared to the very low food security group (4.8%), while the prevalence of diabetes was markedly elevated in the very low food security group (11.8%) relative to the high food security group (7.2%).
Overall serum carotenoid levels, except β-cryptoxanthin, appeared to decrease gradually as the severity of food insecurity intensified (Figure 1 and Table S1). The mean serum concentrations of high food security compared to very low food security were 4.59 µg/dL vs. 2.95 µg/dL for α-carotene (p<0.001), 20.18 µg/dL vs. 12.96 µg/dL for β-carotene (p<0.001), 9.15 µg/dL vs. 7.78 µg/dL for β-cryptoxanthin (p=0.29), 43.31 µg/dL vs. 40.58 µg/dL for total lycopene (p=0.009), and 16.19 µg/dL vs. 13.31 µg/dL for lutein/zeaxanthin (p<0.001).
During a mean follow-up of 14.6 years, a total of 3,216 deaths were confirmed, including 665 deaths from cancer and 1,046 deaths from CVD (Table 2). After controlling for sociodemographics, individuals experiencing any food access issues had a 24% to 69% increased risk of death from all causes and CVD compared to those with high food security (p-trend<0.001 and 0.009, respectively). Even after further adjustment for lifestyle factors, diet quality, and preexisting medical conditions, very low food security was associated with a 1.57- and 1.45-fold increase in all-cause and CVD mortality, respectively, compared to high food security (multivariable-adjusted HR [95% CI]=1.57 [1.07-1.76] for all-causes and 1.45 [1.03-2.03] for CVD). In contrast, serum carotenoids were inversely associated with all-cause, cancer, and CVD mortality. After adjusting for age, sex, race/ethnicity, education, and family income-to-poverty ratio, the highest quartiles of α-carotene, β-carotene, β-cryptoxanthin, total lycopene, and lutein/zeaxanthin revealed a 36% to 60% risk reduction in all mortality outcomes relative to the lowest quartiles (p-trend<0.01 for all). After adjusting for all potential covariates, higher levels of blood carotenoids were still associated with a significant reduction in all-cause mortality (multivariable-adjusted HRs [95% CIs] for the highest vs. lowest quartiles=0.70 [0.61-0.81] for α-carotene, 0.74 [0.63-0.87] for β-carotene, 0.78 [0.66-0.91] for β-cryptoxanthin, 0.65 [0.52-0.81] for lycopene, and 0.70 [0.61-0.79] for lutein/zeaxanthin; p-trend=0.002 for β-cryptoxanthin and <0.001 for others). Similar trends were observed for cancer and CVD mortality.
The protective effect of serum carotenoids on all-cause mortality appeared to differ depending on food security status (Table 3). When stratified by food security status, the inverse associations of serum carotenoids remained significant only among individuals reporting high food security, with multivariable-adjusted HRs (95% CIs) for the highest vs. lowest quartiles being 0.70 (0.59-0.83) for α-carotene, p-trend<0.001; 0.75 (0.62-0.90) for β-carotene, p-trend=0.004; 0.77 (0.66-0.91) for β-cryptoxanthin, p-trend=0.003; 0.64 (0.50-0.80) for total lycopene, p-trend<0.001; and 0.70 (0.61-0.80) for lutein/zeaxanthin, p-trend<0.001. Meanwhile, no associations were found among those encountering marginal, low, or very low food security. Significant interaction with food security status was indicated for total lycopene and lutein/zeaxanthin (p-interaction=0.02 for lycopene, 0.08 for lutein/zeaxanthin). Results for cancer and CVD mortality are given in Tables S2 and S3; however, the overall estimates for food-insecure individuals were unstable due to the limited number of cancer-related deaths.
Dose-response relationships between serum carotenoids and all-cause mortality are shown in Figure 2. Restricted cubic spline analyses, adjusting for all potential covariates, suggested that the association of α-carotene, β-carotene, β-cryptoxanthin, total lycopene, and lutein/zeaxanthin with all-cause mortality followed a non-linear inverse dose-response pattern in individuals with high food security (p for non-linearity<0.001 for all), as well as those with marginal, low, and very low food security (p for non-linearity<0.05 for all).
Discussion
In this nationally representative sample of US adults, the inverse associations between serum carotenoids and mortality outcomes were modified by food security status. Higher serum concentrations of α-carotene, β-carotene, β-cryptoxanthin, total lycopene, and lutein/zeaxanthin were linked to a significant reduction in all-cause, cancer, and CVD mortality in US adults; however, the protective effects of serum carotenoids were evident only among those without food insecurity. Meanwhile, individuals experiencing food insecurity were not expected to gain life expectancy benefits from carotenoids. Notably, we evaluated α-carotene, β-carotene, β-cryptoxanthin, lycopene, lutein, and zeaxanthin, which represent over 95% of total carotenoids [29,30,31,35,36]
Consistent with our findings, the Alpha-Tocopherol, Beta-Carotene Cancer Prevention (ATBC) study, consisting of 29,103 men, demonstrated a significant inverse association between serum concentrations of β-carotene and the risk of deaths due to all causes, CVD, heart disease, stroke, cancer, respiratory disease, diabetes mellitus, and others, with multivariable-adjusted HRs for the highest versus lowest quintiles ranging from 0.21 to 0.73 (all p-trend<0.001) [6]. A recent study also found a 25% to 39% reduction in cancer-related mortality linked to the highest quartile of serum α-carotene, trans-β-carotene, cis-β-carotene, β-cryptoxanthin, lutein/zeaxanthin, trans-lycopene, and total carotenoids, after controlling for potential confounders, but did not take food insecurity into account.8 Of note, the beneficial effects of serum carotenoids on mortality outcomes were similarly observed among older populations [37,38,39,40], and those with chronic conditions [41,42,43,44]. Moreover, in an NHANES study of 3,107 adults with type 2 diabetes [45], higher levels of serum β-carotene, unlike other carotenoids, were associated with an increased risk of cardiovascular mortality, suggesting a possible transition to pro-oxidant effects of β-carotene under a highly oxidative environment [46,47].
Importantly, our findings indicate that the potential health properties of carotenoids may be affected by individuals’ food security status, with diminished benefits observed among those with marginal, low, and very low food security. Food insecurity is acknowledged as a significant concern that leads to insufficient consumption of fruits and vegetables and poor-quality diets [16,17,18,19,20], thereby resulting in adverse health outcomes [48,49]. Food insecurity is defined as limited access to sufficient nutritious food due to financial constraints, which may be linked to hunger [15] and poor diet quality even if caloric requirements are maintained [50]. Indeed, we observed that HEI-2015 component scores for total fruits, whole fruits, total vegetables, and greens and beans decreased gradually with increasing severity of food insecurity (Table S4). Moreover, a previous study indicated that food-insecure individuals consumed fewer fruits and vegetables compared to their food-secure counterparts [51]. The baseline characteristics of our study population varied significantly based on food security status, which may explain, in part, the observed differences in the carotenoid-mortality associations across food security levels, consistent with other research [49,52]. Furthermore, it is commonly recognized that those with food insecurity often reside in suboptimal food environments, including food deserts [53,54].
This prospective investigation allowed us to evaluate the association between serum carotenoids and mortality outcomes in the context of food security status, a current major public health concern. The strengths of the study include our ability to evaluate serum carotenoids, an objective measure of fruit and vegetable intake, along with a four-tier classification of food security status, facilitated more accurate estimates by minimizing misclassification bias. Additionally, our nationally representative sample of US adults, combined with a long follow-up period and extensive data, supported rigorous analyses that accounted for subgroup differences in food insecurity severity. These analyses also included comprehensive adjustments for confounding factors, including sociodemographic, lifestyle, diet quality, dietary supplement use, and underlying comorbid conditions. The findings provide new evidence of the differential health benefits of serum carotenoids depending on individuals’ socioeconomic backgrounds, highlighting food insecurity as a manifestation of health disparities. Nevertheless, several limitations should be noted. First, serum carotenoids and food security status were measured only once at baseline, which limited our ability to assess time-varying associations. Second, despite using validated questionnaires and established laboratory measurements, we cannot fully rule out the possibility of measurement errors. Third, residual bias may result from unmeasured confounders. Finally, insufficient sample sizes, such as cancer mortality, resulted in risk estimates that were either not statistically significant or less reliable.
Conclusions
In this nationally representative sample of US adults, low serum carotenoids and food insecurity were jointly associated with increased risk of mortality, even after controlling for a broad spectrum of sociodemographic, lifestyle and clinical risk factors. These results suggest that insufficient fruit and vegetable consumption resulting from food insecurity may exacerbate the disease burden. Our findings underscore the urgent need to implement social risk-targeted nutritional programs to reduce health disparities in the US population.
Supplementary Materials
The following supporting information can be downloaded at the website of this paper posted on Preprints.org.
Author Contributions
Dr. Yang, Ms. Washington, and Dr. Braithwaite had full access to all the data in the study and will take full responsibility for the integrity of the data and the accuracy of the data analysis. Concept and design: Crane, Braithwaite. Acquisition, analysis, or interpretation of data: All authors. Drafting of the manuscript: Yang, Washington, Ratcliffe. Critical revision of the manuscript for important intellectual content: All authors. Statistical analysis: Yang, Washington. Administrative, technical, or material support: Ratcliffe, Marissa Supervision: Yang, Crane, Braithwaite.
Funding
This work was supported by the University of Florida Health Cancer Center, supported in part by state appropriations provided in Florida Statute § 381.915 and the National Cancer Institute of the NIH under award No. P30CA247796 and R01CA249506-03S1. The funder had no role in the design and conduct of the study, collection, management, analysis, and interpretation of the data; preparation, review, or approval of the manuscript; and decision to submit the manuscript for publication.
Acknowledgments
We express our gratitude to the staff and researchers of the National Health and Nutrition Examination Survey for their committed endeavors. Furthermore, we are indebted to the participants of the National Health and Nutrition Examination Survey, as this work would not be possible without their contribution. In addition, we extend our gratitude to Himanshi Verma, BS, of the University of Florida, for her support in the preparation and editing of the manuscript. She did not receive any financial recompense from our organization in exchange for their assistance.
Conflicts of Interest
Dr. Crane and Braithwaite reported receiving research grants from the National Institutes of Health (NIH). No other disclosures were reported.
Disclaimer
The content is solely the responsibility of the authors and does not necessarily represent the official views of the NIH or the State of Florida.
References
- Slavin JL, Lloyd B. Health benefits of fruits and vegetables. Adv Nutr Bethesda Md. 2012;3(4):506-516. [CrossRef]
- Wallace TC, Bailey RL, Blumberg JB, et al. Fruits, vegetables, and health: A comprehensive narrative, umbrella review of the science and recommendations for enhanced public policy to improve intake. Crit Rev Food Sci Nutr. 2020;60(13):2174-2211. [CrossRef]
- Aune D, Giovannucci E, Boffetta P, et al. Fruit and vegetable intake and the risk of cardiovascular disease, total cancer and all-cause mortality—a systematic review and dose-response meta-analysis of prospective studies. Int J Epidemiol. 2017;46(3):1029-1056. [CrossRef]
- Fiedor J, Burda K. Potential role of carotenoids as antioxidants in human health and disease. Nutrients. 2014;6(2):466-488. [CrossRef]
- Landrum JT, ed. Carotenoids: Physical, Chemical, and Biological Functions and Properties. CRC Press; 2010.
- Huang J, Weinstein SJ, Yu K, Männistö S, Albanes D. Serum Beta Carotene and Overall and Cause-Specific Mortality: A Prospective Cohort Study. Circ Res. 2018;123(12):1339-1349. [CrossRef]
- Fujii R, Tsuboi Y, Maeda K, Ishihara Y, Suzuki K. Analysis of Repeated Measurements of Serum Carotenoid Levels and All-Cause and Cause-Specific Mortality in Japan. JAMA Netw Open. 2021;4(6):e2113369. [CrossRef]
- Zhang C, Li K, Xu SN, Zhang JK, Ma MH, Liu Y. Higher serum carotenoid concentrations were associated with the lower risk of cancer-related death: Evidence from the National Health and Nutrition Examination Survey. Nutr Res. 2024;126:88-98. [CrossRef]
- Leermakers ET, Darweesh SK, Baena CP, et al. The effects of lutein on cardiometabolic health across the life course: a systematic review and meta-analysis. Am J Clin Nutr. 2016;103(2):481-494. [CrossRef]
- Rowles JL, Erdman JW. Carotenoids and their role in cancer prevention. Biochim Biophys Acta BBA - Mol Cell Biol Lipids. 2020;1865(11):158613. [CrossRef]
- Voutilainen S, Nurmi T, Mursu J, Rissanen TH. Carotenoids and cardiovascular health. Am J Clin Nutr. 2006;83(6):1265-1271. [CrossRef]
- Mook K, Laraia BA, Oddo VM, Jones-Smith JC. Food Security Status and Barriers to Fruit and Vegetable Consumption in Two Economically Deprived Communities of Oakland, California, 2013-2014. Prev Chronic Dis. 2016;13:E21. [CrossRef]
- Pessoa MC, Mendes LL, Gomes CS, Martins PA, Velasquez-Melendez G. Food environment and fruit and vegetable intake in a urban population: A multilevel analysis. BMC Public Health. 2015;15(1):1012. [CrossRef]
- Aggarwal A, Monsivais P, Cook AJ, Drewnowski A. Does diet cost mediate the relation between socioeconomic position and diet quality? Eur J Clin Nutr. 2011;65(9):1059-1066. [CrossRef]
- Rabbitt MP, Reed-Jones M, Hales LJ, Burke MP, United States. Department of Agriculture. Economic Research Service. Household Food Security in the United States in 2023. Economic Research Service, U.S. Department of Agriculture; 2024. [CrossRef]
- Hanson KL, Connor LM. Food insecurity and dietary quality in US adults and children: a systematic review. Am J Clin Nutr. 2014;100(2):684-692. [CrossRef]
- Jun S, Cowan AE, Dodd KW, et al. Association of food insecurity with dietary intakes and nutritional biomarkers among US children, National Health and Nutrition Examination Survey (NHANES) 2011-2016. Am J Clin Nutr. 2021;114(3):1059-1069. [CrossRef]
- Leung CW, Tester JM. The Association between Food Insecurity and Diet Quality Varies by Race/Ethnicity: An Analysis of National Health and Nutrition Examination Survey 2011-2014 Results. J Acad Nutr Diet. 2019;119(10):1676-1686. [CrossRef]
- Leung CW, Epel ES, Ritchie LD, Crawford PB, Laraia BA. Food Insecurity Is Inversely Associated with Diet Quality of Lower-Income Adults. J Acad Nutr Diet. 2014;114(12):1943-1953.e2. [CrossRef]
- Litton MM, Beavers AW. The Relationship between Food Security Status and Fruit and Vegetable Intake during the COVID-19 Pandemic. Nutrients. 2021;13(3):712. [CrossRef]
- Centers for Disease Control and Prevention (CDC). National Center for Health Statistics (NCHS). National Health and Nutrition Examination Survey Data. Department of Health and Human Services, Centers for Disease Control and Prevention. Available online: https://www.cdc.gov/nchs/nhanes/about_nhanes.htm.
- Rabbitt MP, Reed-Jones M, Hales LJ, Burke MP. Household Food Security in the United States in 2023 (Report No. ERR-337). U.S. Department of Agriculture, Economic Research Service.
- Centers for Disease Control and Prevention (CDC). Laboratory Procedure Manual. Vitamin A, Vitamin E, and Carotenoids in Serum NHANES 2001–2002. Available online: https://wwwn.cdc.gov/nchs/data/nhanes/public/2001/labmethods/l06vit_b_met_aecar.pdf.
- Centers for Disease Control and Prevention (CDC). Laboratory Procedure Manual. A / E / Carotene Vitamin Profile in Serum NHANES 2003–2004. Available online: https://wwwn.cdc.gov/nchs/data/nhanes/public/2003/labmethods/l45vit_c_met_vitae_carotenoids.pdf.
- Centers for Disease Control and Prevention (CDC). Laboratory Procedure Manual. Vitamin A, Vitamin E, and Carotenoids in Serum NHANES 2005–2006. Available online: https://wwwn.cdc.gov/nchs/data/nhanes/public/2005/labmethods/vitaec_d_met_aecar.pdf.
- United States Department of Agriculture Economic Research Service. Definitions of Food Security. Accessed November 11, 2024. Available online: https://www.ers.usda.gov/topics/food-nutrition-assistance/food-security-in-the-u-s/definitions-of-food-security/.
- National Center for Health Statistics. The Linkage of National Center for Health Statistics Survey Data to the National Death Index — 2019 Linked Mortality File (LMF): Linkage Methodology and Analytic Considerations, June 2022. Available online: https://www.cdc.gov/nchs/data/datalinkage/public-use-linked-mortality-file-description.pdf.
- Krebs-Smith SM, Pannucci TE, Subar AF, et al. Update of the Healthy Eating Index: HEI-2015. J Acad Nutr Diet. 2018;118(9):1591-1602. [CrossRef]
- Bufka J, Vaňková L, Sýkora J, Křížková V. Exploring carotenoids: Metabolism, antioxidants, and impacts on human health. J Funct Foods. 2024;118:106284. [CrossRef]
- Maiani G, Periago Castón MJ, Catasta G, et al. Carotenoids: Actual knowledge on food sources, intakes, stability and bioavailability and their protective role in humans. Mol Nutr Food Res. 2009;53(S2). [CrossRef]
- Khachik F, Spangler CJ, Smith JC, Canfield LM, Steck A, Pfander H. Identification, quantification, and relative concentrations of carotenoids and their metabolites in human milk and serum. Anal Chem. 1997;69(10):1873-1881. [CrossRef]
- Institute of Medicine (US) Panel on Dietary Antioxidants and Related Compounds. Dietary Reference Intakes for Vitamin C, Vitamin E, Selenium, and Carotenoids. National Academies Press (US); 2000. Available online: http://www.ncbi.nlm.nih.gov/books/NBK225483/.
- Kim JH, Na HJ, Kim CK, et al. The non-provitamin A carotenoid, lutein, inhibits NF-κB-dependent gene expression through redox-based regulation of the phosphatidylinositol 3-kinase/PTEN/Akt and NF-κB-inducing kinase pathways: Role of H2O2 in NF-κB activation. Free Radic Biol Med. 2008;45(6):885-896. [CrossRef]
- Murillo AG, Fernandez ML. Potential of Dietary Non-Provitamin A Carotenoids in the Prevention and Treatment of Diabetic Microvascular Complications. Adv Nutr. 2016;7(1):14-24. [CrossRef]
- Kaulmann A, Bohn T. Carotenoids, inflammation, and oxidative stress--implications of cellular signaling pathways and relation to chronic disease prevention. Nutr Res N Y N. 2014;34(11):907-929. [CrossRef]
- Rao AV, Rao LG. Carotenoids and human health. Pharmacol Res. 2007;55(3):207-216. [CrossRef]
- Buijsse B, Feskens EJM, Schlettwein-Gsell D, et al. Plasma carotene and alpha-tocopherol in relation to 10-y all-cause and cause-specific mortality in European elderly: the Survey in Europe on Nutrition and the Elderly, a Concerted Action (SENECA). Am J Clin Nutr. 2005;82(4):879-886. [CrossRef]
- Bates CJ, Hamer M, Mishra GD. Redox-modulatory vitamins and minerals that prospectively predict mortality in older British people: the National Diet and Nutrition Survey of people aged 65 years and over. Br J Nutr. 2011;105(1):123-132. [CrossRef]
- Lauretani F, Semba RD, Dayhoff-Brannigan M, et al. Low total plasma carotenoids are independent predictors of mortality among older persons: the InCHIANTI study. Eur J Nutr. 2008;47(6):335-340. [CrossRef]
- Buijsse B, Feskens EJ, Schlettwein-Gsell D, et al. Plasma carotene and α-tocopherol in relation to 10-y all-cause and cause-specific mortality in European elderly: the Survey in Europe on Nutrition and the Elderly, a Concerted Action (SENECA). Am J Clin Nutr. 2005;82(4):879-886. [CrossRef]
- Zhu X, Cheang I, Tang Y, et al. Associations of Serum Carotenoids With Risk of All-Cause and Cardiovascular Mortality in Hypertensive Adults. J Am Heart Assoc. 2023;12(4):e027568. [CrossRef]
- Lin B, Liu Z, Li D, Zhang T, Yu C. Associations of serum carotenoids with all-cause and cardiovascular mortality in adults with MAFLD. Nutr Metab Cardiovasc Dis. 2024;34(10):2315-2324. [CrossRef]
- Han GM, Meza JL, Soliman GA, Islam KMM, Watanabe-Galloway S. Higher levels of serum lycopene are associated with reduced mortality in individuals with metabolic syndrome. Nutr Res. 2016;36(5):402-407. [CrossRef]
- Peng X, Zhu J, Lynn HS, Zhang X. Serum Nutritional Biomarkers and All-Cause and Cause-Specific Mortality in U.S. Adults with Metabolic Syndrome: The Results from National Health and Nutrition Examination Survey 2001–2006. Nutrients. 2023;15(3):553. [CrossRef]
- Qiu Z, Chen X, Geng T, et al. Associations of Serum Carotenoids With Risk of Cardiovascular Mortality Among Individuals With Type 2 Diabetes: Results From NHANES. Diabetes Care. 2022;45(6):1453-1461. [CrossRef]
- Krinsky NI, Mayne ST, Sies H, eds. Carotenoids in Health and Disease. 0 ed. CRC Press; 2004. [CrossRef]
- Wang XD, Russell RM. Procarcinogenic and anticarcinogenic effects of beta-carotene. Nutr Rev. 1999;57(9 Pt 1):263-272. [CrossRef]
- Chang R, Javed Z, Taha M, et al. Food insecurity and cardiovascular disease: Current trends and future directions. Am J Prev Cardiol. 2022;9:100303. [CrossRef]
- Ma H, Wang X, Li X, et al. Food Insecurity and Premature Mortality and Life Expectancy in the US. JAMA Intern Med. 2024;184(3):301. [CrossRef]
- Seligman HK, Schillinger D. Hunger and Socioeconomic Disparities in Chronic Disease. N Engl J Med. 2010;363(1):6-9. [CrossRef]
- Litton MM, Beavers AW. The Relationship between Food Security Status and Fruit and Vegetable Intake during the COVID-19 Pandemic. Nutrients. 2021;13(3):712. [CrossRef]
- Hong YR, Wang R, Case S, Jo A, Turner K, Ross KM. Association of food insecurity with overall and disease-specific mortality among cancer survivors in the US. Support Care Cancer. 2024;32(5):309. [CrossRef]
- Odoms-Young A, Brown AGM, Agurs-Collins T, Glanz K. Food Insecurity, Neighborhood Food Environment, and Health Disparities: State of the Science, Research Gaps and Opportunities. Am J Clin Nutr. 2024;119(3):850-861. [CrossRef]
- Bevel MS, Tsai MH, Parham A, Andrzejak SE, Jones S, Moore JX. Association of Food Deserts and Food Swamps With Obesity-Related Cancer Mortality in the US. JAMA Oncol. 2023;9(7):909. [CrossRef]
Figure 1.
Serum Concentrations of Carotenoids across Food Security Status.
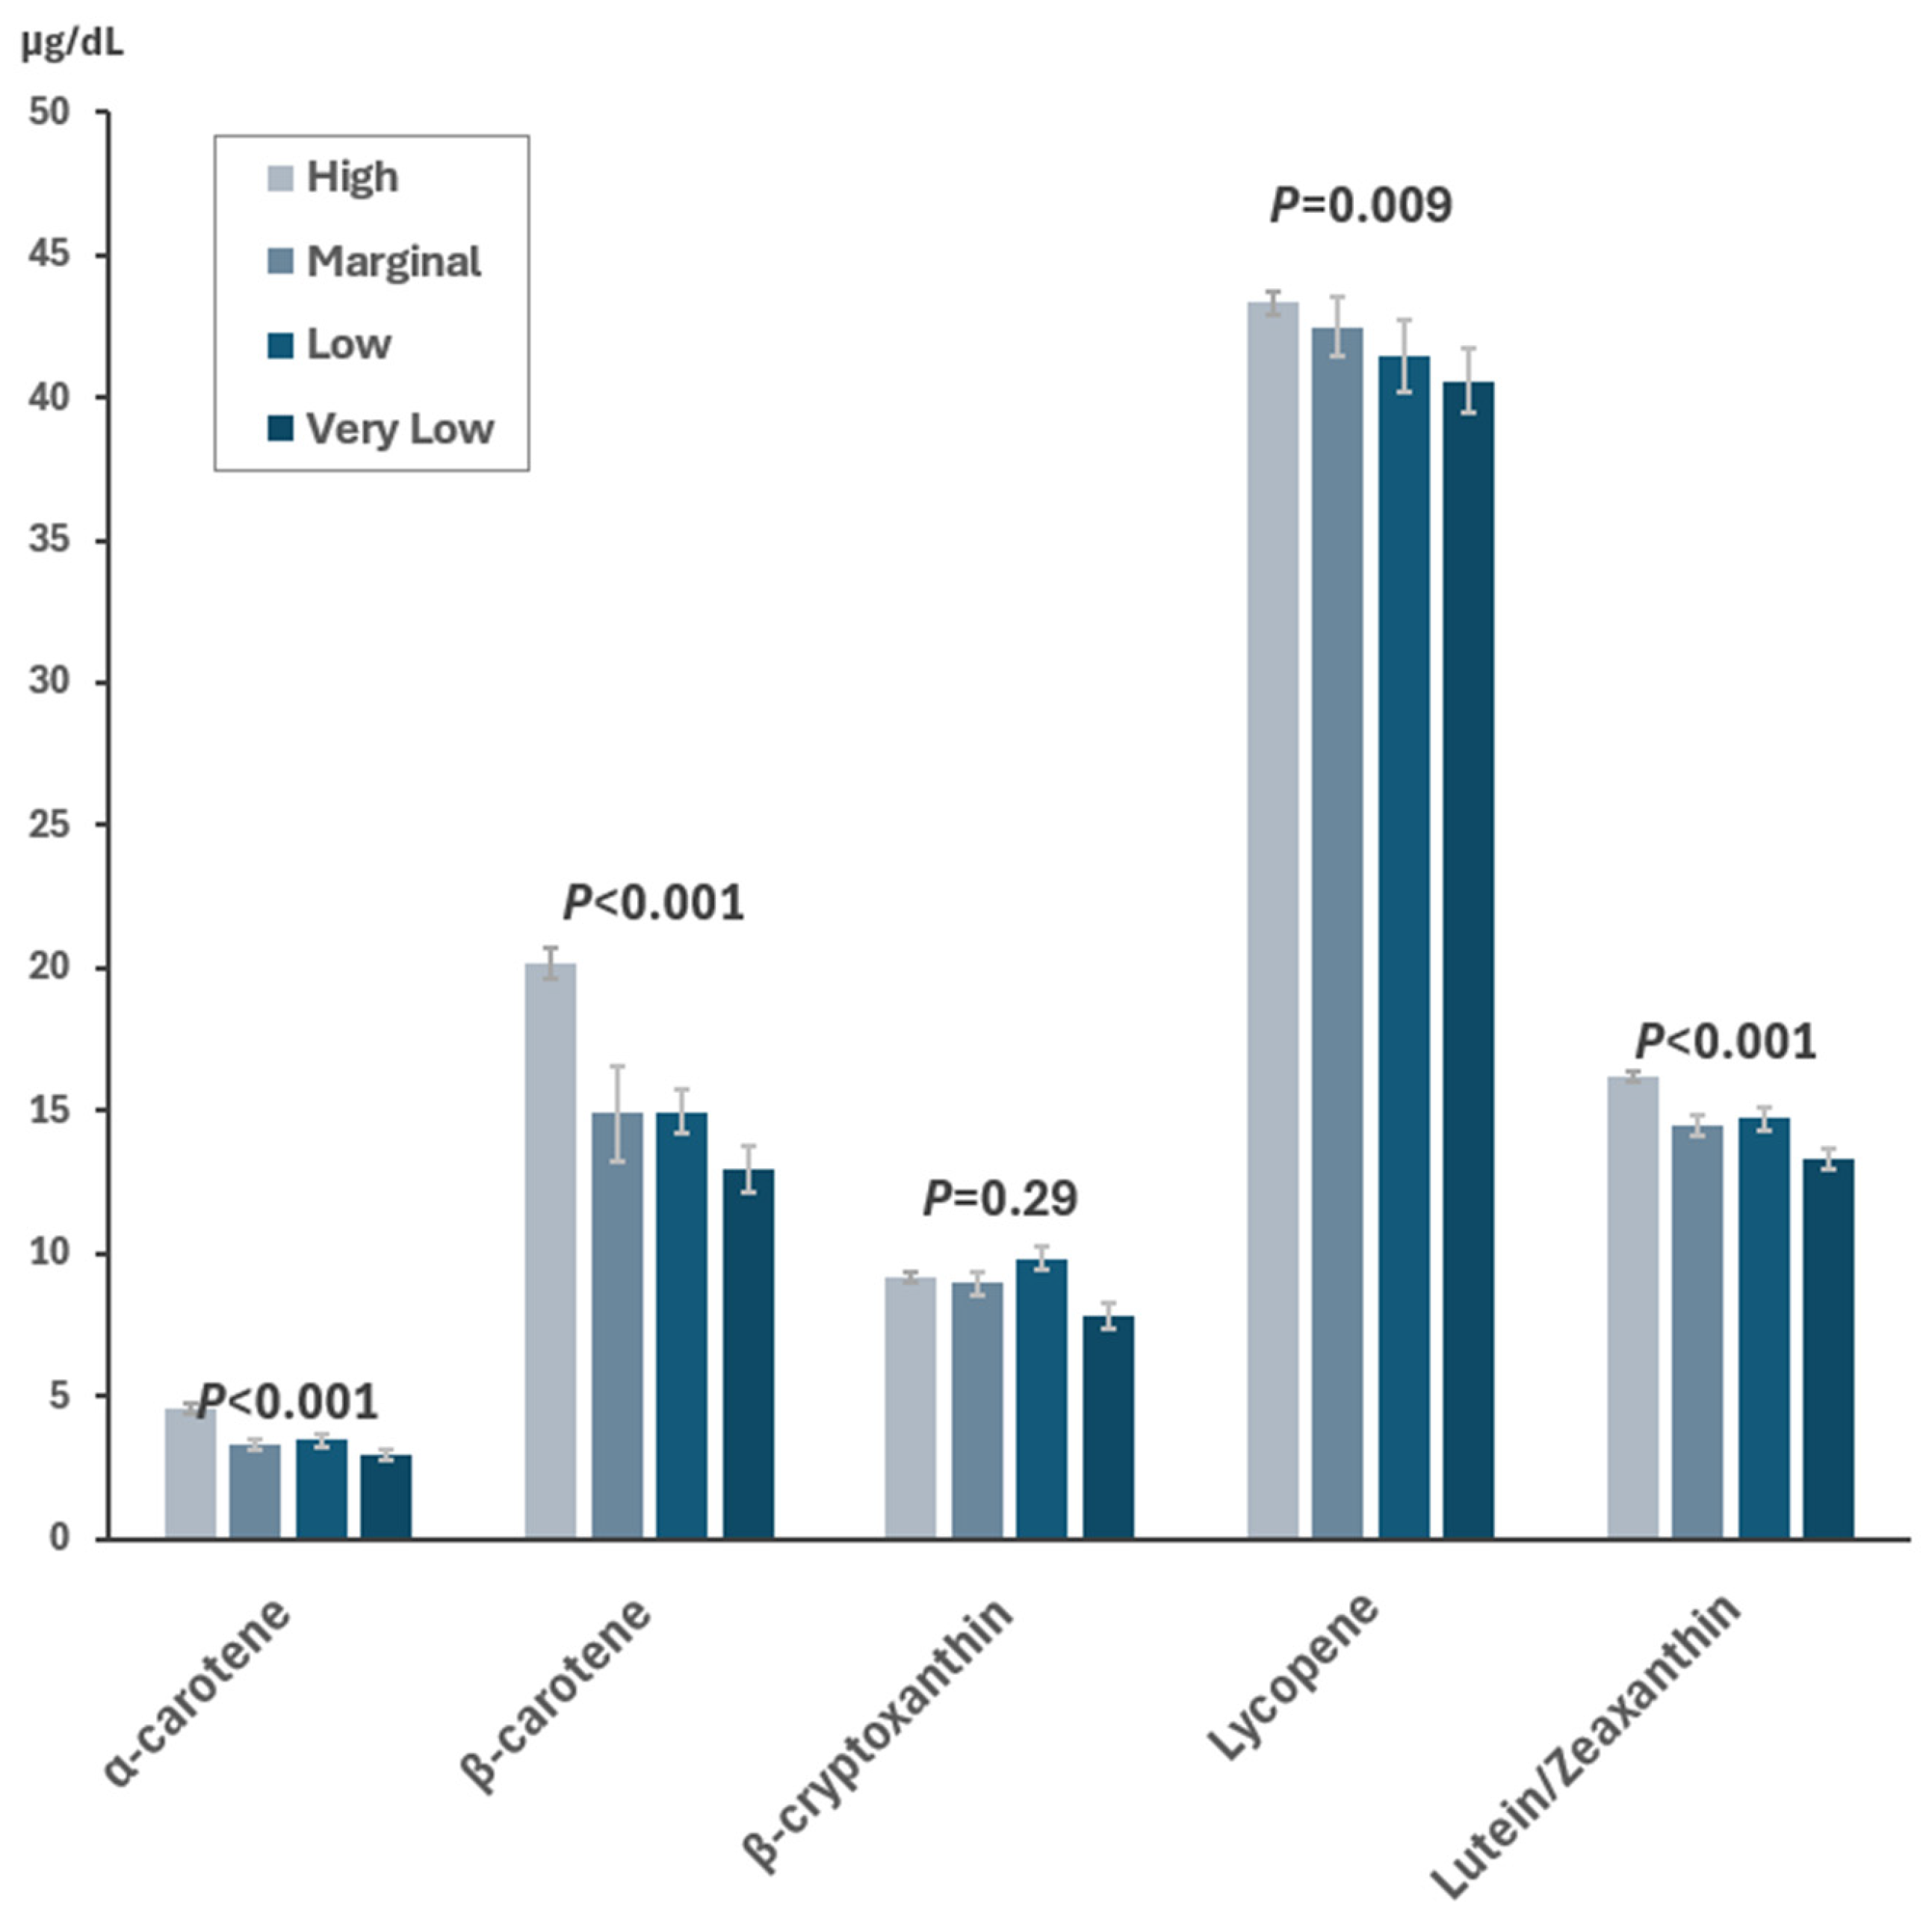
Figure 2.
Dose-response Relationship Between Serum Concentrations of Carotenoids and All-Cause Mortality. Solid lines represent the hazard ratios and dashed lines represent the 95% confidence intervals. The 20th percentile of each carotenoid level was designated as the reference, with three knots fitted at the 5th, 50th, and 95th percentiles. To minimize the impact of extreme outliers, individuals with the highest 3% of each carotenoid were omitted from the analysis. All models were adjusted for age, sex, race/ethnicity, education, family income-to-poverty ratio, smoking status, leisure-time physical activity, alcohol consumption, obesity status, healthy eating index, dietary supplement use, and history of cancer, cardiovascular disease, diabetes, and hypertension.
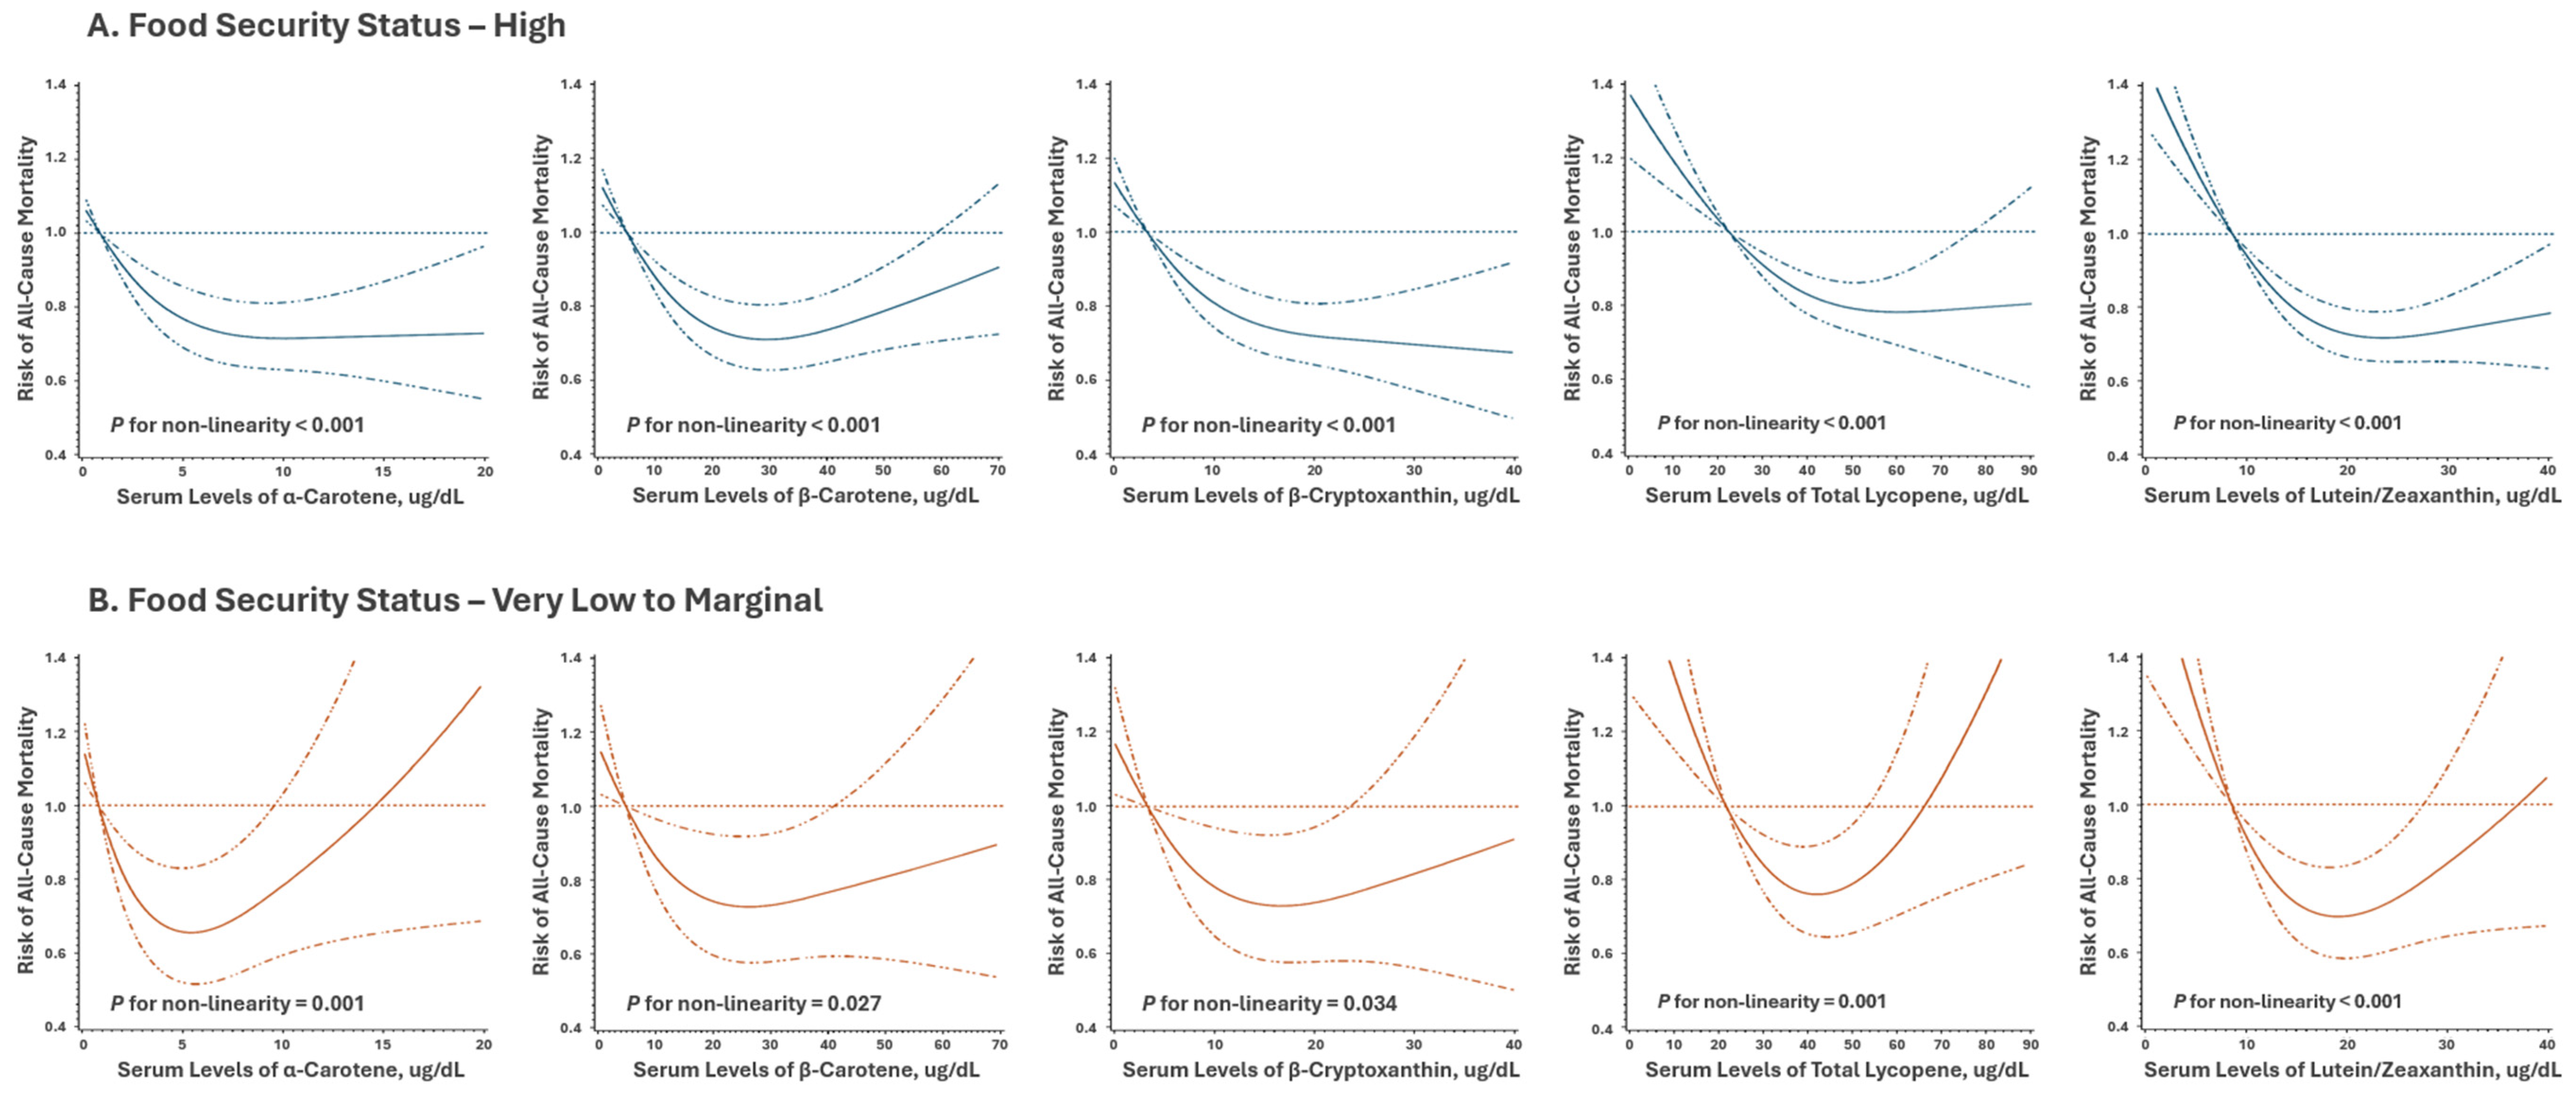

Table 1.
Baseline Characteristics by Food Security, NHANES 2001-2006.
| Food Security Status | |||||
|---|---|---|---|---|---|
| High n=9,721 |
Marginal n=945 |
Low n=1,115 |
Very Low n=574 |
P | |
| Age, years | 47.6 ± 0.4 | 42.4 ± 0.8 | 40.2 ± 0.6 | 41.2 ± 0.9 | <0.001 |
| Sex, male | 5,017 (49.6) | 443 (44.7) | 549 (47.2) | 283 (46.2) | 0.004 |
| Race/ethnicity | |||||
| NH-White | 5,709 (77.4) | 311 (52.8) | 301 (46.9) | 205 (50.6) | <0.001 |
| NH-Black | 1,831 (9.1) | 248 (19.4) | 240 (16.3) | 166 (20.1) | |
| Hispanic | 1,806 (8.5) | 361 (23.9) | 543 (32.7) | 175 (23.0) | |
| Others | 375 (5.0) | 25 (3.9) | 31 (4.1) | 28 (6.3) | |
| Educational Attainment | |||||
| Below high school | 2,335 (14.7) | 411 (31.4) | 591 (40.0) | 273 (38.4) | <0.001 |
| High school graduate | 2,353 (25.2) | 245 (29.9) | 244 (26.0) | 141 (29.1) | |
| College or above | 5,033 (60.1) | 289 (38.7) | 280 (34.0) | 160 (32.5) | |
| Family Income-to-Poverty Ratio | |||||
| <1.30 | 1,646 (11.9) | 523 (46.8) | 735 (59.5) | 403 (63.3) | <0.001 |
| 1.30 to <3.50 | 3,971 (63.6) | 372 (45.3) | 351 (36.8) | 166 (35.2) | |
| ≥3.50 | 4,104 (51.5) | 50 (7.8) | 29 (3.7) | 5 (1.5) | |
| Smoking Status | |||||
| Never | 4,987 (51.4) | 444 (43.4) | 522 (42.8) | 235 (38.8) | <0.001 |
| Former | 2,784 (26.4) | 205 (21.0) | 229 (19.7) | 93 (14.4) | |
| Current | 1,950 (22.2) | 296 (35.6) | 364 (37.4) | 246 (46.8) | |
| Leisure-time Physical Activity a | |||||
| Inactive | 3,197 (27.4) | 378 (35.5) | 487 (39.9) | 232 (36.1) | <0.001 |
| Moderate | 3,554 (36.4) | 317 (34.4) | 367 (32.4) | 226 (40.0) | |
| Vigorous | 2,970 (36.2) | 250 (30.2) | 261 (27.7) | 116 (23.9) | |
| Alcohol Consumption b | |||||
| None | 4,067 (36.4) | 478 (45.9) | 528 (43.1) | 266 (44.2) | <0.001 |
| Light-to-moderate | 2,963 (31.4) | 146 (15.5) | 187 (19.2) | 92 (14.6) | |
| Heavy | 2,691 (32.2) | 321 (38.6) | 400 (37.7) | 216 (41.2) | |
| Body Mass Index, kg/m2 | |||||
| Underweight (<18.5) | 154 (1.6) | 12 (1.6) | 23 (3.1) | 9 (1.8) | <0.001 |
| Normal (18.5 to 24.9) | 2,852 (31.7) | 247 (25.1) | 311 (30.3) | 163 (30.2) | |
| Overweight (25.0 to 29.9) | 3,574 (35.2) | 324 (32.5) | 380 (31.4) | 193 (31.6) | |
| Obese (>30) | 3,141 (31.4) | 362 (40.8) | 401 (35.2) | 209 (36.4) | |
| Dietary Supplement Use | 5,238 (56.2) | 360 (39.4) | 354 (36.9) | 188 (35.9) | <0.001 |
| Healthy Eating Index c | 52.8 ± 0.3 | 47.8 ± 0.6 | 48.3 ± 0.5 | 47.1 ± 0.6 | <0.001 |
| Underlying Clinical Conditions | |||||
| Cancer | 981 (8.9) | 70 (8.8) | 58 (4.8) | 27 (4.8) | <0.001 |
| Cardiovascular disease | 943 (6.8) | 94 (8.3) | 93 (6.9) | 57 (7.4) | 0.57 |
| Diabetes | 994 (7.2) | 118 (9.6) | 134 (8.2) | 77 (11.8) | 0.002 |
| Hypertension | 3,334 (29.2) | 306 (30.5) | 308 (23.9) | 193 (30.1) | 0.08 |
Abbreviation: NH, non-Hispanic; LTPA, leisure-time physical activity. Continuous variables are represented by their means ± standard errors. Categorical variables are displayed as numbers with corresponding percentages. The numbers represent the actual size of the study sample, while the corresponding percentages reflect the survey-weighted values. a. Determined based on participation in walking or cycling, moderate, and vigorous activities over the past 30 days. b. Heavy drinking was defined as the consumption of over 2 drinks per day for men or over 1 drink per day for women, and light-to-moderate drinking was described as consuming 2 drinks or fewer per day for men or 1 drink or fewer per day for women. c. Overall diet quality score evaluated using the Healthy Eating Index 2015: the higher scores, the better quality of diet.
Table 2.
Association of Food Security Status, Serum Carotenoid Concentrations, and Mortality Outcomes.
Table 2.
Association of Food Security Status, Serum Carotenoid Concentrations, and Mortality Outcomes.
| All Causes | Cancer | Cardiovascular Disease | |||||||||
|---|---|---|---|---|---|---|---|---|---|---|---|
| No. of Death |
HR (95% CI) b | HR (95% CI) c | No. of Death |
HR (95% CI) b | HR (95% CI) c | No. of Death |
HR (95% CI) b | HR (95% CI) c | |||
| Food Security | |||||||||||
| High | 2,663 | 1 (ref.) | 1 (ref.) | 550 | 1 (ref.) | 1 (ref.) | 878 | 1 (ref.) | 1 (ref.) | ||
| Marginal | 227 | 1.34 (1.12-1.60) | 1.21 (1.01-1.46) | 55 | 1.12 (0.80-1.55) | 0.98 (0.69-1.38) | 71 | 1.40 (1.01-1.94) | 1.26 (0.90-1.76) | ||
| Low | 205 | 1.24 (1.01-1.53) | 1.07 (0.86-1.33) | 38 | 0.79 (0.56-1.12) | 0.70 (0.48-1.01) | 59 | 1.16 (0.85-1.60) | 0.97 (0.69-1.35) | ||
| Very low | 121 | 1.57 (1.20-2.05) | 1.37 (1.07-1.76) | 22 | 1.26 (0.84-1.88) | 1.13 (0.76-1.69) | 38 | 1.69 (1.20-2.38) | 1.45 (1.03-2.03) | ||
| P trend | <0.001 | 0.01 | 0.72 | 0.58 | 0.009 | 0.12 | |||||
| α-Carotene | |||||||||||
| Q1 | 752 | 1 (ref.) | 1 (ref.) | 147 | 1 (ref.) | 1 (ref.) | 262 | 1 (ref.) | 1 (ref.) | ||
| Q2 | 834 | 0.72 (0.64-0.81) | 0.82 (0.74-0.92) | 177 | 0.71 (0.54-0.92) | 0.84 (0.64-1.10) | 269 | 0.67 (0.54-0.84) | 0.76 (0.61-0.95) | ||
| Q3 | 805 | 0.58 (0.51-0.66) | 0.75 (0.66-0.86) | 168 | 0.73 (0.55-0.96) | 0.97 (0.72-1.30) | 251 | 0.55 (0.44-0.69) | 0.72 (0.57-0.92) | ||
| Q4 | 824 | 0.48 (0.42-0.56) | 0.70 (0.61-0.81) | 173 | 0.56 (0.43-0.72) | 0.89 (0.66-1.20) | 264 | 0.44 (0.36-0.55) | 0.67 (0.53-0.84) | ||
| P trend | <0.001 | <0.001 | <0.001 | 0.67 | <0.001 | 0.002 | |||||
| β -Carotene | |||||||||||
| Q1 | 916 | 1 (ref.) | 1 (ref.) | 173 | 1 (ref.) | 1 (ref.) | 307 | 1 (ref.) | 1 (ref.) | ||
| Q2 | 811 | 0.68 (0.59-0.78) | 0.76 (0.66-0.87) | 155 | 0.79 (0.61-1.02) | 0.89 (0.68-1.15) | 276 | 0.70 (0.56-0.86) | 0.78 (0.63-0.97) | ||
| Q3 | 693 | 0.59 (0.52-0.68) | 0.73 (0.64-0.84) | 156 | 0.59 (0.46-0.76) | 0.74 (0.55-0.99) | 222 | 0.64 (0.50-0.81) | 0.81 (0.62-1.05) | ||
| Q4 | 717 | 0.53 (0.46-0.61) | 0.74 (0.63-0.87) | 165 | 0.57 (0.45-0.73) | 0.81 (0.60-1.08) | 221 | 0.50 (0.40-0.62) | 0.76 (0.58-0.99) | ||
| P trend | <0.001 | <0.001 | <0.001 | 0.09 | <0.001 | 0.08 | |||||
| β -Cryptoxanthin | |||||||||||
| Q1 | 628 | 1 (ref.) | 1 (ref.) | 114 | 1 (ref.) | 1 (ref.) | 228 | 1 (ref.) | 1 (ref.) | ||
| Q2 | 763 | 0.81 (0.71-0.92) | 0.90 (0.79-1.03) | 148 | 0.85 (0.66-1.08) | 0.92 (0.71-1.20) | 250 | 0.80 (0.64-0.99) | 0.92 (0.73-1.17) | ||
| Q3 | 808 | 0.68 (0.59-0.78) | 0.82 (0.70-0.96) | 175 | 0.54 (0.40-0.74) | 0.66 (0.48-0.90) | 253 | 0.75 (0.64-0.89) | 0.93 (0.77-1.14) | ||
| Q4 | 1,009 | 0.55 (0.47-0.64) | 0.78 (0.66-0.91) | 226 | 0.40 (0.31-0.52) | 0.56 (0.43-0.74) | 313 | 0.64 (0.50-0.82) | 0.98 (0.75-1.28) | ||
| P trend | <0.001 | 0.002 | <0.001 | <0.001 | <0.001 | 0.77 | |||||
| Total Lycopene | |||||||||||
| Q1 | 259 | 1 (ref.) | 1 (ref.) | 55 | 1 (ref.) | 1 (ref.) | 90 | 1 (ref.) | 1 (ref.) | ||
| Q2 | 379 | 0.77 (0.67-0.88) | 0.81 (0.72-0.91) | 82 | 0.86 (0.65-1.13) | 0.90 (0.69-1.17) | 124 | 0.75 (0.58-0.96) | 0.81 (0.65-1.01) | ||
| Q3 | 484 | 0.73 (0.64-0.84) | 0.79 (0.70-0.89) | 108 | 0.76 (0.57-1.02) | 0.81 (0.61-1.08) | 158 | 0.72 (0.57-0.91) | 0.81 (0.64-1.01) | ||
| Q4 | 880 | 0.56 (0.45-0.69) | 0.65 (0.52-0.81) | 173 | 0.57 (0.36-0.91) | 0.67 (0.42-1.08) | 297 | 0.57 (0.39-0.83) | 0.68 (0.47-1.00) | ||
| P trend | <0.001 | <0.001 | 0.01 | 0.06 | 0.002 | 0.03 | |||||
| Lutein/Zeaxanthin | |||||||||||
| Q1 | 814 | 1 (ref.) | 1 (ref.) | 162 | 1 (ref.) | 1 (ref.) | 282 | 1 (ref.) | 1 (ref.) | ||
| Q2 | 731 | 0.65 (0.58-0.72) | 0.71 (0.65-0.79) | 142 | 0.59 (0.48-0.74) | 0.65 (0.52-0.81) | 229 | 0.57 (0.47-0.69) | 0.63 (0.51-0.77) | ||
| Q3 | 768 | 0.58 (0.52-0.65) | 0.68 (0.61-0.77) | 165 | 0.50 (0.36-0.68) | 0.59 (0.43-0.81) | 237 | 0.50 (0.40-0.62) | 0.59 (0.47-0.74) | ||
| Q4 | 901 | 0.54 (0.48-0.61) | 0.70 (0.61-0.79) | 196 | 0.52 (0.42-0.66) | 0.69 (0.54-0.87) | 297 | 0.53 (0.45-0.62) | 0.71 (0.59-0.85) | ||
| P trend | <0.001 | <0.001 | <0.001 | 0.003 | <0.001 | <0.001 | |||||
Abbreviation: No, number; Q, quartile; HR, hazard ratio; 95% CI, 95% confidence interval; ref., reference. β-Carotene was estimated by adding up the values of trans-beta-carotene and cis-beta-carotene. Total lycopene was not available in NHANES 2001-2002. a Based on the quartile distribution of the study population. b Adjusted for age, sex, race/ethnicity, education, and family income-to-poverty ratio. c Adjusted for age, sex, race/ethnicity, education, family income-to-poverty ratio, smoking status, leisure-time physical activity, alcohol consumption, obesity status, healthy eating index, dietary supplement use, and history of cancer, cardiovascular disease, diabetes, and hypertension
Table 3.
Association between Serum Carotenoids and All-Cause Mortality: Stratified by Food Security Status.
Table 3.
Association between Serum Carotenoids and All-Cause Mortality: Stratified by Food Security Status.
| Food Security Status | ||||||||||||
|---|---|---|---|---|---|---|---|---|---|---|---|---|
| High | Marginal | Low | Very Low | |||||||||
| Serum Concentrations a |
No. of Death |
HR (95% CI) b | No. of Death |
HR (95% CI) b | No. of Death |
HR (95% CI) b | No. of Death |
HR (95% CI) b |
P Interaction |
|||
| α-Carotene | ||||||||||||
| Q1 | 629 | 1 (ref.) | 68 | 1 (ref.) | 74 | 1 (ref.) | 53 | 1 (ref.) | 0.60 | |||
| Q2 | 656 | 0.84 (0.74-0.95) | 55 | 0.67 (0.41-1.10) | 60 | 0.87 (0.54-1.41) | 34 | 0.69 (0.43-1.49) | ||||
| Q3 | 721 | 0.78 (0.68-0.90) | 58 | 0.70 (0.43-1.12) | 37 | 0.60 (0.37-0.96) | 18 | 0.52 (0.24-1.13) | ||||
| Q4 | 657 | 0.70 (0.59-0.83) | 46 | 0.62 (0.40-0.97) | 33 | 0.90 (0.48-1.71) | 16 | 1.07 (0.46-2.51) | ||||
| P trend | <0.001 | 0.04 | 0.27 | 0.49 | ||||||||
| β -Carotene | ||||||||||||
| Q1 | 528 | 1 (ref.) | 69 | 1 (ref.) | 67 | 1 (ref.) | 53 | 1 (ref.) | 0.67 | |||
| Q2 | 576 | 0.77 (0.65-0.92) | 49 | 0.67 (0.40-1.12) | 47 | 0.91 (0.50-1.67) | 21 | 0.46 (0.22-0.96) | ||||
| Q3 | 691 | 0.74 (0.62-0.88) | 47 | 0.58 (0.36-0.93) | 47 | 0.82 (0.55-1.22) | 26 | 0.82 (0.49-1.40) | ||||
| Q4 | 807 | 0.75 (0.62-0.90) | 55 | 0.76 (0.52-1.11) | 37 | 0.72 (0.40-1.30) | 17 | 0.82 (0.39-1.75) | ||||
| P trend | 0.004 | 0.08 | 0.15 | 0.48 | ||||||||
| β -Cryptoxanthin | ||||||||||||
| Q1 | 796 | 1 (ref.) | 72 | 1 (ref.) | 84 | 1 (ref.) | 57 | 1 (ref.) | 0.28 | |||
| Q2 | 666 | 0.92 (0.78-1.08) | 61 | 1.08 (0.67-1.75) | 48 | 1.00 (0.61-1.64) | 33 | 0.64 (0.35-1.16) | ||||
| Q3 | 671 | 0.86 (0.73-1.00) | 44 | 0.70 (0.41-1.20) | 31 | 0.54 (0.27-1.05) | 17 | 0.62 (0.29-1.31) | ||||
| Q4 | 526 | 0.77 (0.66-0.91) | 49 | 0.78 (0.46-1.32) | 40 | 1.00 (0.59-1.70) | 13 | 0.74 (0.35-1.56) | ||||
| P trend | 0.003 | 0.19 | 0.26 | 0.19 | ||||||||
| Total Lycopene | ||||||||||||
| Q1 | 717 | 1 (ref.) | 70 | 1 (ref.) | 61 | 1 (ref.) | 32 | 1 (ref.) | 0.02 | |||
| Q2 | 412 | 0.84 (0.72-0.96) | 33 | 0.63 (0.37-1.03) | 28 | 0.64 (0.27-1.51) | 11 | 0.75 (0.22-2.63) | ||||
| Q3 | 310 | 0.77 (0.67-0.88) | 30 | 0.66 (0.35-1.23) | 21 | 1.17 (0.46-2.94) | 18 | 0.61 (0.24-1.56) | ||||
| Q4 | 211 | 0.64 (0.50-0.80) | 17 | 0.69 (0.34-1.41) | 20 | 0.88 (0.41-1.90) | 11 | 0.61 (0.28-1.33) | ||||
| P trend | <0.001 | 0.22 | 0.98 | 0.17 | ||||||||
| Lutein/Zeaxanthin | ||||||||||||
| Q1 | 711 | 1 (ref.) | 73 | 1 (ref.) | 67 | 1 (ref.) | 50 | 1 (ref.) | 0.08 | |||
| Q2 | 628 | 0.72 (0.65-0.80) | 44 | 0.48 (0.26-0.88) | 54 | 1.17 (0.76-1.82) | 32 | 0.54 (0.29-1.03) | ||||
| Q3 | 612 | 0.70 (0.62-0.80) | 50 | 0.62 (0.40-0.96) | 44 | 0.82 (0.52-1.29) | 25 | 0.46 (0.22-1.00) | ||||
| Q4 | 701 | 0.70 (0.61-0.80) | 60 | 0.75 (0.50-1.13) | 40 | 1.06 (0.63-1.77) | 13 | 0.30 (0.12-0.71) | ||||
| P trend | <0.001 | 0.13 | 0.78 | 0.009 | ||||||||
Abbreviation: No, number; Q, quartile; HR, hazard ratio; 95% CI, 95% confidence interval; ref., reference. β-Carotene was estimated by adding up the values of trans-beta-carotene and cis-beta-carotene. Total lycopene was not available in NHANES 2001-2002. a Based on the quartile distribution of the study population. b Adjusted for age, sex, race/ethnicity, education, family income-to-poverty ratio, smoking status, leisure-time physical activity, alcohol consumption, obesity status, healthy eating index, dietary supplement use, and history of cancer, cardiovascular disease, diabetes, and hypertension.
Disclaimer/Publisher’s Note: The statements, opinions and data contained in all publications are solely those of the individual author(s) and contributor(s) and not of MDPI and/or the editor(s). MDPI and/or the editor(s) disclaim responsibility for any injury to people or property resulting from any ideas, methods, instructions or products referred to in the content. |
© 2024 by the authors. Licensee MDPI, Basel, Switzerland. This article is an open access article distributed under the terms and conditions of the Creative Commons Attribution (CC BY) license (https://creativecommons.org/licenses/by/4.0/).
Copyright: This open access article is published under a Creative Commons CC BY 4.0 license, which permit the free download, distribution, and reuse, provided that the author and preprint are cited in any reuse.


