
Submitted:
23 December 2024
Posted:
24 December 2024
You are already at the latest version
Abstract
Background: Recent research emphasizes the importance of integrating psychological-emotional factors with nutrition and body composition in athletes. This study investigates the correlations between these aspects in 36 professional rugby players, aiming to identify relationships that could optimize sports performance and overall well-being. Methods: The study sample included 36 male athletes (mean age: 24.4 ± 2.1 years, weight: 86.5 ± 7.1 kg, height: 181.8 ± 5.7 cm). Four as-sessment tools were used: SF-36 (quality of life), MEDI-LITE (Mediterranean diet adherence), IPAQ (physical activity), and body composition measures (stadiometer and BIVA). Statistical analyses, including Shapiro-Wilk test, Pearson, and Spearman correlations, were conducted to explore relationships between the variables. Results: The athletes’ mental and physical health was comparable to the general population (mean MCS = 50.5 ± 7.4, PCS = 49.6 ± 9.6). Mediterra-nean diet adherence was low (mean MEDI-LITE = 8.6 ± 2.6), while physical activity levels were high (mean IPAQ = 2560.5 ± 950.1). Body composition indicated overweight status (mean BMI = 26.15 ± 1.62 kg/m², body fat = 22 ± 4.3%). Positive correlations were observed between mental health, diet adherence, and physical activity, with a stronger link between physical activity and body composition. Conclusions: This study confirms a relationship between psychologi-cal-emotional factors, nutrition, and body composition in athletes, suggesting an integrated ap-proach to optimize performance. However, causality remains unconfirmed, and the small sample size limits generalizability. Future research should include larger, more diverse samples to expand these findings.
Keywords:
Body composition
; rugby players
; MEDI-LITE
; SF-36
; BIA
; IPAQ
; mental health
; physical activity
; athletes
1. Introduction
In recent decades, numerous scientific studies have explored the relationship between sports, nutrition, and hydration, highlighting how these factors significantly impact athletic performance and the physical well-being of athletes [1]. Specifically, nutrition has been recognized as a key element not only for maintaining health but also for enhancing physical performance, particularly among elite athletes. Similarly, proper hydration has been shown to be essential in preventing fatigue and injuries, ensuring the efficient functioning of the physiological processes involved in athletic activity [2].
In addition to these traditionally studied aspects, there is growing interest in the psychological factor in sports performance [3,4], as mental well-being and psychological conditions are now recognized as crucial elements for achieving optimal performance. More recently, research has begun to explore the link between the gut and the brain, an innovative area that reveals how nutrition can directly influence not only physical health but also psychological well-being. Preliminary studies suggest that a balanced diet that supports gut health may have positive effects on mental health, thereby indirectly enhancing athletic performance [5].
Despite these advances, the current literature still presents significant gaps regarding the analysis of the psychological aspect in elite athletes and how it integrates with variables such as body composition and dietary habits. This topic represents a promising yet underexplored field of study that could offer new perspectives on optimizing athlete performance and well-being through a more integrated approach that considers both body and mind in synergy.
This study focuses on the potential correlation between lifestyle variables and emotional factors in professional rugby players.
2. Materials and Methods
Study Population
The study was conducted in a group of 36 male professional rugby athletes, with an average weight of 86.5 ± 7.1 kg (Table 2, Figures 17 and 18), an average height of 181.8 ± 5.7 cm (Table 3, Figures 19 and 20), an average age of 24.4 ± 2.1 years (Figures 24, 25, and 26), an average BMI of 26.1 ± 1.6 kg/m², and an average of 7 years of sports experience.
Each participant provided written informed consent for the data treatment. The administration of the questionnaires and the collection of anthropometric data took place during a routine training period, ensuring that the responses accurately reflected the athletes' typical physical and psychological state. Among the questionnaires used, the SF-36, IPAQ, and MEDI-LITE were included.
SF-36 Questionnaire
The SF-36 questionnaire [6] was used to assess health-related quality of life, divided into eight areas: physical functioning, role limitations due to physical and emotional problems, bodily pain, general health, vitality, social functioning, and mental health. From these dimensions two summary indices can be calculated: the Physical Component Summary (PCS) and the Mental Component Summary (MCS).
To combine the different scales that make up the SF-36 into two summary indices, each scale is standardized. This is done by subtracting the average score of the reference population from the subject's score and dividing the result by the standard deviation of the population. This process ensures that the scores of the different scales are comparable. The formula used is as follows:
Z scale = (P scale - μ scale) / σ scale
Where:
- P scale is the raw score of the scale for the individual.
- μ scale is the mean score of the scale in the reference population.
- σ scale is the standard deviation of the scale in the reference population.
After standardization, each scale is weighted by a specific coefficient that reflects the contribution of that scale to the physical or mental health score. The 8 scales do not have the same weight in the two indices (PCS and MCS). Some scales have a greater impact on physical health (such as physical functioning or bodily pain), while others primarily affect mental health (such as mental health or vitality).
- For the PCS: The scales of physical functioning (0.42), physical role limitations (0.35), and bodily pain (0.32) have a higher weight. Emotional role limitations (-0.19), mental health (-0.22), social functioning (-0.01), general health (0.25), and vitality (0.3) have a lower weight.
- For the MCS: The scales of mental health (0.49), vitality (0.24), and emotional role limitations (0.43) have a higher weight. Physical functioning (-0.23), physical role limitations (-0.12), bodily pain (-0.1), social functioning (0.27), general health (-0.02), and vitality (0.24) have a lower weight.
Once standardized and weighted, the scales are summed to obtain two overall indices: the Physical Component Summary (PCS) and the Mental Component Summary (MCS). The general formulas to calculate the summary indices are:
PCS = Σ (Zscale x Wscale)
MCS =Σ(Zscale xWscale)
Where:
Z scale is the standardized score for each scale.
W scale is the weight assigned to each scale for the MCS.
The PCS and MCS indices are interpreted in relation to a reference population with an average score of 50 and a standard deviation of 10. Therefore, a score above 50 indicates physical or mental health above the population average, while a score below 50 indicates health below the average.
These two indices provide a concise overview of an individual's physical and mental health, allowing for the identification of potential issues or strengths in these areas.
IPAQ
The IPAQ was administered to assess the physical activity level of the athletes [7]. This tool classifies individuals based on the amount of physical activity performed, allowing for the distinction between light, moderate, and vigorous activity levels. During the interview, participants were asked to describe in detail the number, type, and duration of their training sessions. The data was then divided by 7 to obtain the average daily training time, which, when added to other daily activities performed by each individual, enabled the precise calculation of the Exercise Energy Expenditure (EEE), measured in METs.
In more detail, each type of activity is assigned a MET value (an energy cost unit for the activity):
- Vigorous activity: 8.0 MET
- Moderate activity: 4.0 MET
- Walking: 2.5 MET for slow pace, 3.0 MET for moderate pace, and 3.3 MET for brisk pace.
The IPAQ score is expressed in MET-minutes per week, calculated by multiplying the specific MET value by the number of minutes per day and the number of days the activity was performed. For each activity level (vigorous, moderate, walking), a MET-minutes score is obtained, and these are summed to get the total IPAQ score. After calculating the total score, the individual is classified into one of the following three categories:
- Inactive: 699 or fewer METs per week (cells marked in red).
- Sufficiently active: Between 700 and 2519 METs per week (cells marked in yellow).
- Active or very active: 2520 or more METs per week (cells marked in green).
MEDI-LITE Questionnaire
The MEDI-LITE was used to assess adherence to the Mediterranean diet guidelines, considered a protective factor for cardiovascular health and general well-being [8,9]. The questionnaire examines dietary habits on a daily and weekly basis, providing parameters for various components of the diet. Each component is scored from 0 to 2 based on the frequency of consumption. The scores for each food group are summed to obtain a total score ranging from 0 to 18:
- Low score (≤ 8): Indicates poor adherence to the Mediterranean diet.
- Moderate score (9–11): Indicates moderate adherence to the Mediterranean diet.
- High score (≥ 12): Indicates high adherence to the Mediterranean diet.
Body Composition Analysis
Following the administration of the questionnaires, each athlete underwent measurements of weight and height, which were taken using a stadiometer. During these measurements and the bioelectrical impedance analysis (BIA), participants were required to wear only underwear.
Subsequently, a bioimpedance examination was conducted using the Akern BIA 101 BIVA® PRO device [10,11,12]. All tests were performed around 7 p.m., prior to training, with an external temperature of 8°C and an internal temperature of 22°C, no dietary restrictions were imposed on the participants. They followed a non-specific dietary protocol. This approach was chosen to reflect the athletes' actual physical conditions during a typical training day, and to highlight any behaviors and habits that might not be ideal for maximizing athletic performance. All participants were in good health at the time of the examination, and none had pacemakers or other electronic devices implanted. It should be noted, however, that the results might have been slightly influenced by the fact that one of the participants had recently recovered from a prolonged illness.
Each subject was placed one by one on a reclining table, lying in a supine position with the body completely relaxed. The arms were positioned approximately 30° away from the trunk, and the legs were spread at about 45°, to prevent contact between the limbs, which could interfere with the electrical current flow and result in inaccurate measurements. For the same reason, all jewelry and metallic objects were removed. Before applying the electrodes, the skin area to be measured was cleaned with an alcohol-soaked cloth and, if necessary, shaved.
The first electrode was placed on the dorsal side of the right foot, over the first metatarsal joint. The second electrode was placed on the right heel, at the back of the foot.
The test was only conducted five minutes after the athlete had assumed the correct position, allowing sufficient time for the physiological and more uniform redistribution of body fluids due to gravity.
Participants were instructed to remain still, relaxed, and silent throughout the measurement process.
Statistical Analysis
The data obtained were tabulated, and the mean and standard deviation for each variable derived from the questionnaires, anthropometric analysis, and BIA were calculated. Additionally, weight and height were categorized into ranges (5 kg for weight and 5 cm for height) to provide a quicker overview of the data relative to the reference population. For the same purpose, the age of the participants was represented using a histogram.
For each variable of interest, a normality test (Shapiro-Wilk test) was performed with an alpha level of 0.05 (95% significance level) to assess whether the data distribution followed a normal (Gaussian) distribution.
Finally, the degree of linear correlation between each pair of variables was analyzed using Pearson’s linear correlation method, when both variables met the assumption of normality, or Spearman’s linear correlation method when one or both variables did not follow a normal distribution. For the latter method, it was also necessary to perform a rank calculation, which involves assigning an ordinal number (or rank) to each data point based on its relative position within the dataset, for any variable with a non-normal distribution.
The results obtained from the two statistical methods were tabulated. Correlations with values between -0.7 and -0.5, and between 0.5 and 0.7 (indicating moderate positive or negative trends), were highlighted in yellow. More significant correlations, with values between -1 and -0.7, or between 0.7 and 1 (indicating strong positive or negative correlations), were highlighted in red.
3. Results
All data are expressed as mean ± SD. All the data were within the normal range, with the exception of the MEDILite score, which was below the normal range. All the athletes of the rugby team were enrolled, with the exception of subject no. 14 due to his recent recovery from a prolonged injur.y
SF-36 Questionnaire
The data obtained from the SF-36 questionnaire reveal that all three areas related to physical health exhibit the following mean values:
- Physical Functioning: 98.19 ± 4.95
- Role Limitations due to Physical Health: 84.72 ± 25.55
- Physical Pain: 79.31 ± 19.84
The three areas related to psychological and emotional health show the following mean values:
- Role Limitations due to Emotional Problems: 70.39 ± 39.67
- Mental Health: 69.22 ± 17.88
- Social Functioning: 72.22 ± 21.36
The two areas related to general health show the following mean values:
- General Health: 72.08 ± 15.32
- Vitality: 60.28 ± 14.97
Finally, the change in health over time shows a mean value of:
- Health Change: 56.25 ± 25.62
It is also noticeable that the values related to psychological-emotional health and health change exhibit greater variability compared to those related to physical health and general health:
- Mean Standard Deviation of the three areas related to physical health: 16.78
- Mean Standard Deviation of the three areas related to psychological-emotional health: 26.3
- Mean Standard Deviation of the two areas related to general health: 15.15
- Standard Deviation of the health change variable: 25.62
The Physical Component Summary (PCS) and the Mental Component Summary (MCS) show values that are perfectly in line with those of the general population (standardized value of 50):
- Physical Component Summary: 49.55 ± 9.16
- Mental Component Summary: 50.48 ± 7.05
These results suggest that, on average, the athletes' perceived physical and mental health are consistent with the general population, reflecting a balanced state of health in these domains. However, the higher variability in the psychological-emotional and health change areas suggests more individual differences within the group in these aspects of well-being.
IPAQ
The administration of the IPAQ questionnaire reveals that the average level of physical activity for the athletes in the study is 3114.1 ± 1835.51 MET. A more detailed analysis shows that 22 out of the 36 athletes (61%) have a score of 2520 MET or higher, categorizing them as active or very active. Thirteen athletes, representing a significant proportion (36%), have scores between 700 and 2519 MET, thus falling into the sufficiently active category. Finally, only one athlete (3%), who has been injured, shows a score below 700 MET, placing them in the inactive category.
These results highlight that the majority of the athletes are highly active, with a small percentage falling into the less active categories, primarily due to injury or other factors affecting their activity level.
MEDI-LITE
The data obtained from the MEDI-LITE questionnaire show an average score of 8.61 ± 2.58 points, which places the athletes just above the threshold between the categories of "poor adherence to the Mediterranean diet" and "moderate adherence to the Mediterranean diet." A closer look reveals that 15 athletes (42%) fall into the poor adherence category, 16 athletes (44%) are classified in the moderate adherence category, and 5 athletes belong to the high adherence to the Mediterranean diet category.
These results suggest that the majority of athletes display moderate adherence to the Mediterranean diet, with a notable proportion showing poor adherence, and a smaller group exhibiting high adherence. This distribution indicates some variability in dietary habits among the athletes, with room for improvement in aligning with the Mediterranean diet.
Anthropometric Measurements and Bioimpedance
The measurements obtained using the stadiometer show an average weight of 86.5 ± 7.07 kg and an average height of 181.83 ± 5.66 cm. This results in an average Body Mass Index (BMI) of 26.15 ± 1.62 kg/m², which is above the 25 kg/m² threshold for the normal weight category. Analyzing the data subject by subject, only 9 athletes (25%) are within the normal weight range, while 27 athletes (75%) are classified as overweight. There are no athletes classified as underweight.

Table 1.
Averages and SD of BIA. The average values derived from the bioelectrical impedance analysis are within the normal range, except for the fat mass, which is at the upper limits.
Table 1.
Averages and SD of BIA. The average values derived from the bioelectrical impedance analysis are within the normal range, except for the fat mass, which is at the upper limits.
| BIA averages and SD. | |
| Phase Angle (Pha) | 7,13 ± 0,4° |
| Total Body Water (TBW) | 57,33 ± 3,25 % |
| Extracellular Water (ECW) | 41,07 ± 1,4 8% |
| Intracellular Water (ICW) | 58,93 ± 1,48 % |
| Tissue Hydratation (TBW/FFM) | 73,18 ± 0,24 |
| Lean Body Mass (FFM) | 78,34 ± 4,34 % |
| Fat Mass (FM) | 21,66 ± 4,34 % |
| Cell Mass (BCM) | 58,86 ± 1,68 % |
| Total Muscle Mass (MM) | 55,94 ± 3,7 % |
| Skeletal Muscle Mass (SMM) (Janssen method) | 41,29 ± 3,39 % |
| AppEndicular Skeletal Muscle Mass (ASMM) | 27,26 ± 4,7 kg |
| Basal Metabolic Rate (BMR) | 1904,28 ± 93,41 kcal |
| Total Daily Energy Expenditure (TDEE) | 3237,28 ± 158,8 kcal |
Below is a matrix illustrating the Pearson correlation coefficients between variables of interest that follow a Gaussian distribution (highlighted in blue).
Table 2.
Pearson Correlation Coefficients.
| Pearson Correlation Coefficients | |||||
| General Health | MEDI-LITE | Fat-Free Mass (FFM) | Fat Mass (FM) | SMM Janssen | |
| General Health | 1,00 | 0,06 | 0,06 | -0,06 | 0,03 |
| MEDI-LITE | 0,06 | 1,00 | 0,63 | -0,63 | 0,66 |
| Fat-Free Mass (FFM) | 0,06 | 0,63 | 1,00 | -1,00 | 0,99 |
| Fat Mass (FM) | -0,06 | -0,63 | -1,00 | 1,00 | -0,99 |
| SMM Janssen | 0,03 | 0,66 | 0,99 | -0,99 | 1,00 |
The subsequent matrix, on the other hand, represents the Spearman correlation coefficients for variables that do not follow a Gaussian distribution (highlighted in green) or between one variable that follows a Gaussian distribution and another that does not. In this case, interactions between two variables that both follow a normal distribution should not be considered.
Table 3.
Spearman Correlation Coefficients.
| Physical Functioning | Role Limitations due to Physical Health | Physical Pain | Role Limitations due to Emotional Health | Mental Health | Social Functioning | General Health | Vitality | Health Change | PCS | MCS | IPAQ | |||||||||||||||||
| Physical Functioning | 1,00 | 0,14 | 0,25 | -0,13 | -0,07 | 0,21 | 0,27 | 0,25 | 0,20 | 0,54 | -0,23 | 0,10 | ||||||||||||||||
| Role Limitations due to Physical Health | 0,14 | 1,00 | 0,56 | 0,33 | -0,06 | 0,22 | 0,17 | 0,09 | 0,16 | 0,61 | -0,05 | -0,24 | ||||||||||||||||
| Physical Pain | 0,25 | 0,56 | 1,00 | -0,04 | 0,10 | 0,34 | 0,24 | 0,36 | -0,02 | 0,76 | -0,01 | -0,06 | ||||||||||||||||
| Role Limitations due to Emotional Health | -0,13 | 0,33 | -0,04 | 1,00 | -0,05 | 0,20 | 0,14 | 0,20 | 0,00 | 0,00 | 0,60 | -0,12 | ||||||||||||||||
| Mental Health | -0,07 | -0,06 | 0,10 | -0,05 | 1,00 | -0,11 | 0,15 | -0,14 | -0,14 | -0,20 | 0,46 | 0,54 | ||||||||||||||||
| Social Functioning | 0,21 | 0,22 | 0,34 | 0,20 | -0,11 | 1,00 | 0,22 | 0,48 | 0,16 | 0,37 | 0,40 | -0,26 | ||||||||||||||||
| General Health | 0,27 | 0,17 | 0,24 | 0,14 | 0,15 | 0,22 | 1,00 | 0,37 | -0,25 | 0,50 | 0,29 | 0,14 | ||||||||||||||||
| Vitality | 0,25 | 0,09 | 0,36 | 0,20 | -0,14 | 0,48 | 0,37 | 1,00 | -0,08 | 0,44 | 0,36 | 0,01 | ||||||||||||||||
| Health Change | 0,20 | 0,16 | -0,02 | 0,00 | -0,14 | 0,16 | -0,25 | -0,08 | 1,00 | 0,05 | -0,16 | 0,08 | ||||||||||||||||
| PCS | 0,54 | 0,61 | 0,76 | 0,00 | -0,20 | 0,37 | 0,50 | 0,44 | 0,05 | 1,00 | -0,16 | -0,19 | ||||||||||||||||
| MCS | -0,23 | -0,05 | -0,01 | 0,60 | 0,46 | 0,40 | 0,29 | 0,36 | -0,16 | -0,16 | 1,00 | 0,19 | ||||||||||||||||
| IPAQ | 0,10 | -0,24 | -0,06 | -0,12 | 0,54 | -0,26 | 0,14 | 0,01 | 0,08 | -0,19 | 0,19 | 1,00 | ||||||||||||||||
| MEDI-LITE | -0,37 | -0,31 | -0,20 | -0,04 | 0,58 | -0,20 | 0,08 | -0,12 | -0,21 | -0,37 | 0,34 | 0,32 | ||||||||||||||||
| Age | 0,09 | 0,05 | -0,14 | 0,20 | -0,11 | 0,07 | -0,09 | -0,02 | 0,14 | -0,02 | 0,14 | -0,28 | ||||||||||||||||
| BMI | 0,04 | 0,16 | -0,06 | 0,29 | -0,45 | 0,17 | -0,22 | 0,09 | -0,14 | 0,03 | -0,07 | -0,71 | ||||||||||||||||
| Tissue Hydration | -0,34 | -0,23 | -0,54 | 0,17 | -0,08 | -0,12 | -0,13 | -0,30 | -0,03 | -0,43 | 0,12 | -0,18 | ||||||||||||||||
| Phase Angle (Pha) | 0,16 | 0,18 | 0,15 | 0,01 | 0,26 | 0,05 | 0,04 | 0,07 | -0,03 | -0,02 | 0,14 | 0,06 | ||||||||||||||||
| Fat-Free Mass (FFM) | -0,12 | -0,13 | -0,20 | -0,09 | 0,65 | -0,26 | -0,02 | -0,33 | 0,08 | -0,38 | 0,21 | 0,49 | ||||||||||||||||
| Fat Mass (FM) | 0,11 | 0,12 | 0,19 | 0,08 | -0,66 | 0,26 | 0,01 | 0,31 | -0,07 | 0,37 | -0,22 | -0,50 | ||||||||||||||||
| SMM Janssen | -0,11 | -0,12 | -0,22 | -0,05 | 0,62 | -0,23 | -0,02 | -0,31 | 0,07 | -0,38 | 0,23 | 0,47 | ||||||||||||||||
| MEDI-LITE | Age | BMI | Tissue Hydration | Phase Angle (Pha) | Fat Mass (FM) | SMM Janssen | ||||||||||||||||||||||
| -0,37 | 0,09 | 0,04 | -0,34 | 0,16 | 0,11 | -0,11 | ||||||||||||||||||||||
| -0,31 | 0,05 | 0,16 | -0,23 | 0,18 | 0,12 | -0,12 | ||||||||||||||||||||||
| -0,20 | -0,14 | -0,06 | -0,54 | 0,15 | 0,19 | -0,22 | ||||||||||||||||||||||
| -0,04 | 0,20 | 0,29 | 0,17 | 0,01 | 0,08 | -0,05 | ||||||||||||||||||||||
| 0,58 | -0,11 | -0,45 | -0,08 | 0,26 | -0,66 | 0,62 | ||||||||||||||||||||||
| -0,20 | 0,07 | 0,17 | -0,12 | 0,05 | 0,26 | -0,23 | ||||||||||||||||||||||
| 0,08 | -0,09 | -0,22 | -0,13 | 0,04 | 0,01 | -0,02 | ||||||||||||||||||||||
| -0,12 | -0,02 | 0,09 | -0,30 | 0,07 | 0,31 | -0,31 | ||||||||||||||||||||||
| -0,21 | 0,14 | -0,14 | -0,03 | -0,03 | -0,07 | 0,07 | ||||||||||||||||||||||
| -0,37 | -0,02 | 0,03 | -0,43 | -0,02 | 0,37 | -0,38 | ||||||||||||||||||||||
| 0,34 | 0,14 | -0,07 | 0,12 | 0,14 | -0,22 | 0,23 | ||||||||||||||||||||||
| 0,32 | -0,28 | -0,71 | -0,18 | 0,06 | -0,50 | 0,47 | ||||||||||||||||||||||
| 1,00 | -0,24 | -0,46 | 0,19 | 0,09 | -0,67 | 0,67 | ||||||||||||||||||||||
| -0,24 | 1,00 | 0,40 | 0,00 | 0,17 | 0,19 | -0,20 | ||||||||||||||||||||||
| -0,46 | 0,40 | 1,00 | 0,14 | 0,07 | 0,56 | -0,55 | ||||||||||||||||||||||
| 0,19 | 0,00 | 0,14 | 1,00 | -0,50 | -0,23 | 0,25 | ||||||||||||||||||||||
| 0,09 | 0,17 | 0,07 | -0,50 | 1,00 | -0,29 | 0,26 | ||||||||||||||||||||||
| 0,66 | -0,19 | -0,56 | 0,23 | 0,28 | -1,00 | 0,99 | ||||||||||||||||||||||
| -0,67 | 0,19 | 0,56 | -0,23 | -0,29 | 1,00 | -0,99 | ||||||||||||||||||||||
| 0,67 | -0,20 | -0,55 | 0,25 | 0,26 | -0,99 | 1,00 | ||||||||||||||||||||||
| Fat-Free Mass (FFM) | Fat Mass (FM) | SMM Janssen | ||||||||||||||||||||||||||
| -0,12 | 0,11 | -0,11 | ||||||||||||||||||||||||||
| -0,13 | 0,12 | -0,12 | ||||||||||||||||||||||||||
| -0,20 | 0,19 | -0,22 | ||||||||||||||||||||||||||
| -0,09 | 0,08 | -0,05 | ||||||||||||||||||||||||||
| 0,65 | -0,66 | 0,62 | ||||||||||||||||||||||||||
| -0,26 | 0,26 | -0,23 | ||||||||||||||||||||||||||
| -0,02 | 0,01 | -0,02 | ||||||||||||||||||||||||||
| -0,33 | 0,31 | -0,31 | ||||||||||||||||||||||||||
| 0,08 | -0,07 | 0,07 | ||||||||||||||||||||||||||
| -0,38 | 0,37 | -0,38 | ||||||||||||||||||||||||||
| 0,21 | -0,22 | 0,23 | ||||||||||||||||||||||||||
| 0,49 | -0,50 | 0,47 | ||||||||||||||||||||||||||
| 0,66 | -0,67 | 0,67 | ||||||||||||||||||||||||||
| -0,19 | 0,19 | -0,20 | ||||||||||||||||||||||||||
| -0,56 | 0,56 | -0,55 | ||||||||||||||||||||||||||
| 0,23 | -0,23 | 0,25 | ||||||||||||||||||||||||||
| 0,28 | -0,29 | 0,26 | ||||||||||||||||||||||||||
| 1,00 | -1,00 | 0,99 | ||||||||||||||||||||||||||
| -1,00 | 1,00 | -0,99 | ||||||||||||||||||||||||||
| 0,99 | -0,99 | 1,00 | ||||||||||||||||||||||||||
In each matrix, moderate correlations (or trends) are highlighted in yellow (ρ or R values between -0.7 and -0.5, or between 0.5 and 0.7), while strong correlations (ρ or R values between -1 and -0.7, or between 0.7 and 1) are marked in red. Significant correlation coefficients (Pearson's r and Spearman's ρ) are listed alongside the variables in parentheses.
We can observe that, according to Spearman's formula, mental health is moderately and positively correlated with the MEDI-LITE score (0.58), IPAQ score (0.55), lean mass (0.65) (Figure 1), and musculoskeletal mass (0.62) (Figure 2). Conversely, it shows a negative trend with fat mass (-0.66) (Figure 3).
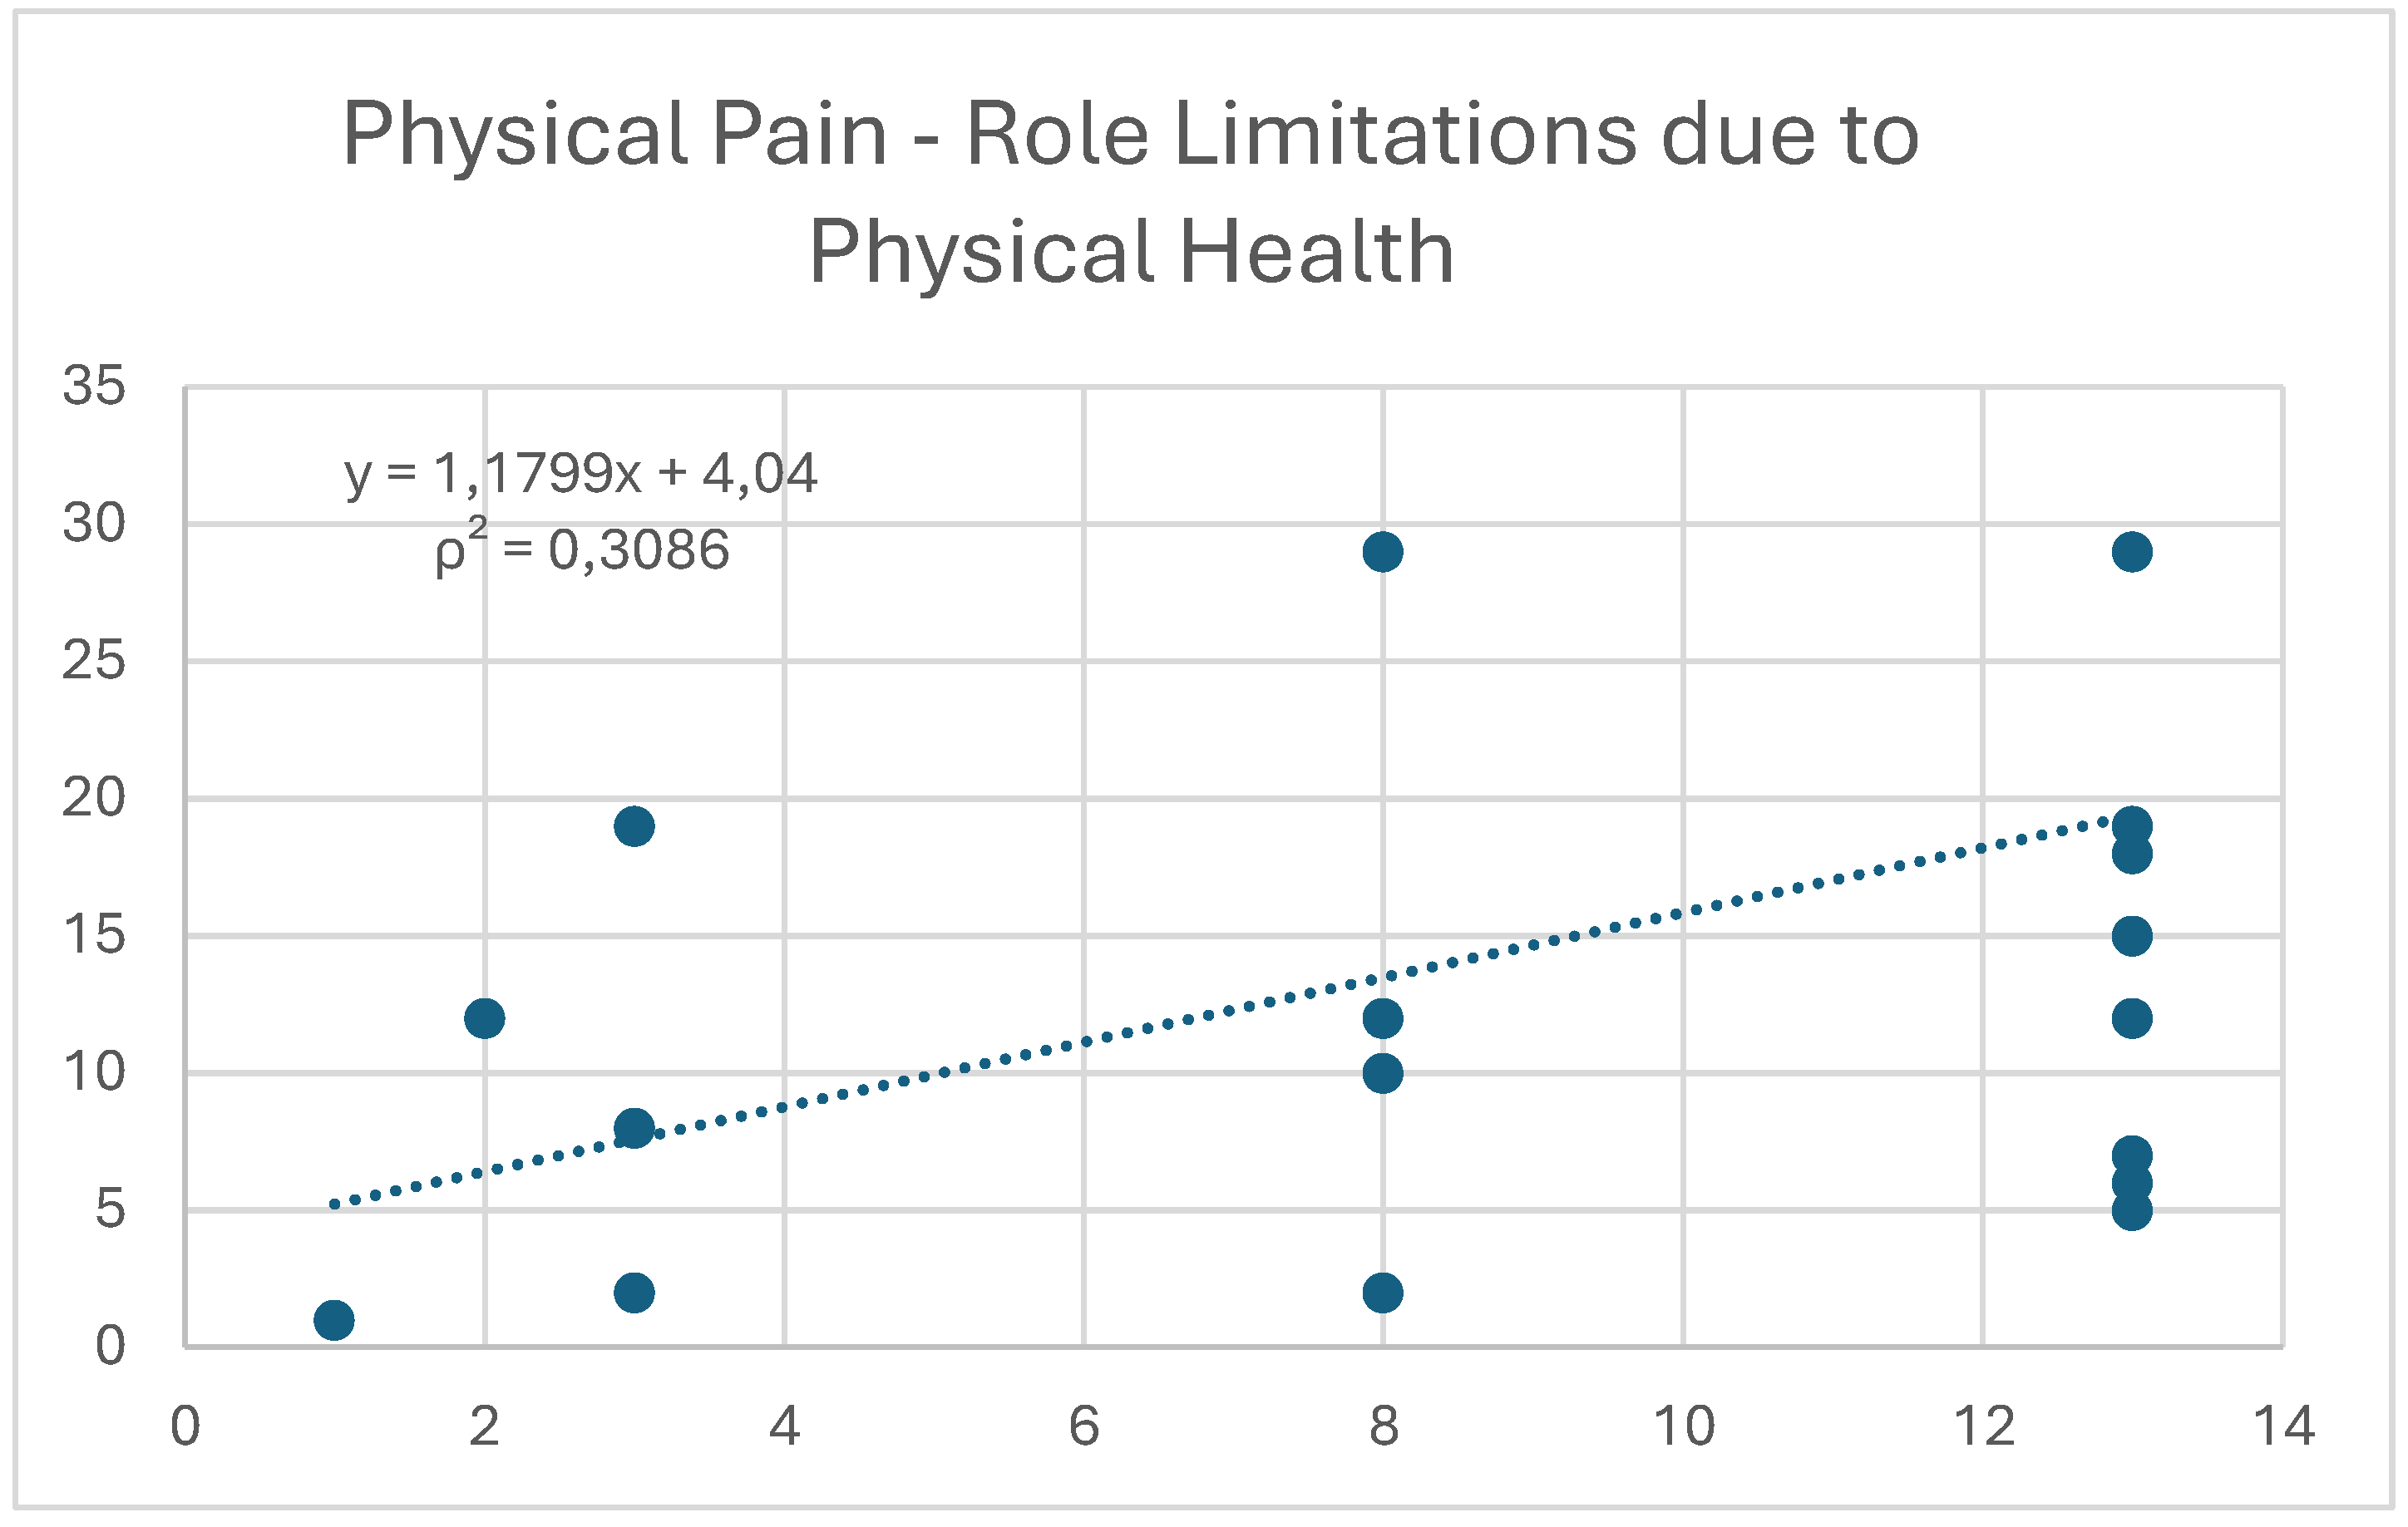
Physical pain not only shows a moderate negative correlation with tissue hydration (-0.54) (Figure 4) but also exhibits a positive trend with role limitations due to physical health (0.56) (Figure 5).
According to Pearson's formula, there is a moderate positive correlation between adherence to the Mediterranean diet and both lean mass and musculoskeletal mass (0.63 and 0.66, respectively). At the same time, the MEDI-LITE score shows a negative trend with the percentage of fat mass in subjects (-0.63). This shows how mental health can be strongly related to body composition, even in highly trained individuals. In particular, adherence to the Mediterranean diet can make a significant difference. On the other hand, a counter-trend and lower impact are evident when other variables, such as the IPAQ score, are considered.
According to Spearman, the IPAQ score is also moderately correlated with lean mass (0.54) and musculoskeletal mass (0.52). It shows a moderate negative correlation with fat mass (-0.54) and a strong negative correlation with BMI (-0.75).
All values obtained from bioelectrical impedance analysis fall within the normal ranges for individuals of the same age and sex [13].
4. Discussion
Psychological and emotional status in elite athletes has been widely studied; however, the potential correlation with other aspects of lifestyle, including body composition, has not been thoroughly investigated. The data obtained support the role of adherence to the Mediterranean diet, as well as adequate body composition, particularly in terms of hydration status. The results from the administration of the SF-36 questionnaire interestingly show that the psychological-emotional and physical health levels of the professional athletes analysed are in line with those of the general population. From the retrospective analysis conducted through the questionnaire, it appears that the health changes during the four weeks preceding the completion of the questionnaire also fall within the population's average.
What is most interesting, however, is the association found between the aforementioned variables and the psychological-emotional aspects of the professional athletes. Specifically, both adherence to the Mediterranean diet and physical activity levels were positively associated with improvements in the athletes' mental health. However, they do not seem to have the same effect. Adherence to the Mediterranean diet appears to have a greater impact, particularly in the presence of high levels of physical activity.
This could be explained by the fact that a proper intake of high-quality essential nutrients can positively influence neurotransmitter levels and neuronal plasticity, leading to better cognitive function, increased emotional resilience, and reduced depressive symptoms [14,15,16]. At the same time, the Mediterranean diet is known to reduce oxidative stress levels in the body due to its high antioxidant content. This can help decrease chronic inflammation, mitochondrial dysfunction, and impaired neurogenesis, ultimately protecting against neuronal damage caused by free radicals and contributing to the positive effects on mental health [17].
In parallel, regular physical exercise is known to stimulate endorphin production, which, along with improvements in self-perception and physical condition, helps to reduce stress levels and enhance mood [18,19]. This statement is supported by the positive correlation found in the study between psychological health and lean mass and musculoskeletal mass, as well as the negative correlation with body fat percentage.
Another significant finding is the negative correlation between physical pain and tissue hydration. Dehydration can negatively affect muscle recovery capacity, increase pain perception, and especially lower mental performance and concentration, thereby exposing the athlete to a greater risk of injury [2,20]. Physical pain is also positively correlated with the limitations in the athlete’s ability to perform daily activities, including sports.
Finally, it is interesting to note that age does not appear to correlate with any of the other considered variables. This could be explained by the relative homogeneity of the sample in this regard, which reduces the variability of this parameter.
5. Conclusions
The study results clearly highlight that the mental health of professional rugby athletes is significantly influenced by both lifestyle and body composition. Specifically, a positive correlation emerges between psychological well-being and adherence to the Mediterranean diet, as well as with levels of physical activity. These findings align with numerous scientific studies that connect the quality of diet and physical activity not only to physical health but also to the psychological-emotional domain.
The study emphasizes that body composition data, which are more tangible and easily measurable, and often used as the sole reference in overall athlete evaluation, require a more integrated approach that also takes psychological dimensions into account for maximizing sports performance and preventing injuries.
Further investigation into these aspects in future research could provide additional tools to optimize athlete health through integrated approaches that encompass diet, physical exercise, and psychological management.
Author Contributions
Conceptualization, R.P and L.S.; methodology, R.P.; validation, L.S, M.C., S.R, E.F.; formal analysis, R.B.; investigation, R.B.; resources, R.P.; data curation, R.B.; writing—original draft preparation, R.B.; writing—review and editing, R.P.; visualization, L.S.; supervision, L.S.; project administration, L.S.. All authors have read and agreed to the published version of the manuscript.
Funding
This research received no external funding.
Informed Consent Statement
Informed consent was obtained from all subjects involved in the study.
Data Availability Statement
Data are available on behalf of Prof. L Stefani.
Conflicts of Interest
The authors declare no conflicts of interest.
References
- Jeukendrup, A., & Killer, S. C. (2018). The Effects of Hydration and Nutrition on Performance in Sport: A Review. European Journal of Applied Physiology, 118(1), 1-17.
- heuvront, S. N., & Kenefick, R. W. (2014). "Dehydration: Physiology, assessment, and performance effects." Comprehensive Physiology, 4(1), 257–285.
- Weinberg, R. S., & Gould, D. (2018). Foundations of Sport and Exercise Psychology (7th ed.). Champaign, IL: Human Kinetics.
- Gucciardi, D. F., Hanton, S., & Fleming, S. (2016). "Are mental toughness and mental health contradictory concepts in elite sport? A narrative review of theory and evidence." Journal of Science and Medicine in Sport, 19(1), 8–12. [CrossRef]
- Bermon, S., et al. (2015). "The microbiota: An exercise immunology perspective." Exercise Immunology Review, 21, 70–79.
- Brazier, J E et al. “Validating the SF-36 health survey questionnaire: new outcome measure for primary care.” BMJ (Clinical research ed.) vol. 305,6846 (1992): 160-4. [CrossRef]
- Hagströmer, Maria et al. “The International Physical Activity Questionnaire (IPAQ): a study of concurrent and construct validity.” Public health nutrition vol. 9,6 (2006): 755-62. [CrossRef]
- Sofi, Francesco et al. “Validation of a literature-based adherence score to Mediterranean diet: the MEDI-LITE score.” International journal of food sciences and nutrition vol. 68,6 (2017): 757-762.
- Dinu, Monica et al. “Adherence to Mediterranean Diet Measured through Medi-Lite Score and Obesity: A Retrospective Study.” Nutrients vol. 13,6 2007. 10 Jun. 2021. [CrossRef]
- Holmes, Clifton J, and Susan B Racette. “The Utility of Body Composition Assessment in Nutrition and Clinical Practice: An Overview of Current Methodology.” Nutrients vol. 13,8 2493. [CrossRef]
- Lukaski, Henry, and Christiana J Raymond-Pope. “New Frontiers of Body Composition in Sport.” International journal of sports medicine vol. 42,7 (2021): 588-601.
- Buffa, R et al. “Bioelectrical impedance vector analysis (BIVA) for the assessment of two-compartment body composition.” European journal of clinical nutrition vol. 68,11 (2014): 1234-40. [CrossRef]
- Franssen FM, Rutten EP, Groener MT, Vanfleteren LE, Wouters EF, Spruit MA. New reference values for body composition by bioelectrical impedance analysis in the general population: results from the UK Biobank. J Am Med Dir Assoc. 2014 Jun; 15(6):448. [CrossRef]
- Gómez-Pinilla, F. (2008). "Brain foods: The effects of nutrients on brain function." Nature Reviews Neuroscience, 9(7), 568–578. [CrossRef]
- Bourre, J. M. (2006). "Effects of nutrients (in food) on the structure and function of the nervous system: Update on dietary requirements for brain." Journal of Nutrition, Health & Aging, 10(5), 377–385.
- Owen, L., et al. (2013). "The role of vitamins and minerals in mood and cognitive performance: A review." Nutrients, 5(12), 5031–504.
- Sofi, F., et al. (2010). "Adherence to Mediterranean diet and health status: Meta-analysis." BMJ, 337, a1344. [CrossRef]
- Harber, V. J., & Sutton, J. R. (1984). "Endorphins and exercise." Sports Medicine, 1(2), 154–171. [CrossRef]
- Dietrich, A., & McDaniel, W. F. (2004). "Endocannabinoids and exercise." British Journal of Sports Medicine, 38(5), 536–541.
- Armstrong, L. E., et al. (2010). "Influence of hydration status on cognitive function during exertional heat stress." Medicine & Science in Sports & Exercise, 42(11), 2265–2271.
Figure 1.
Correlation between the variables "mental health" and "lean mass.".
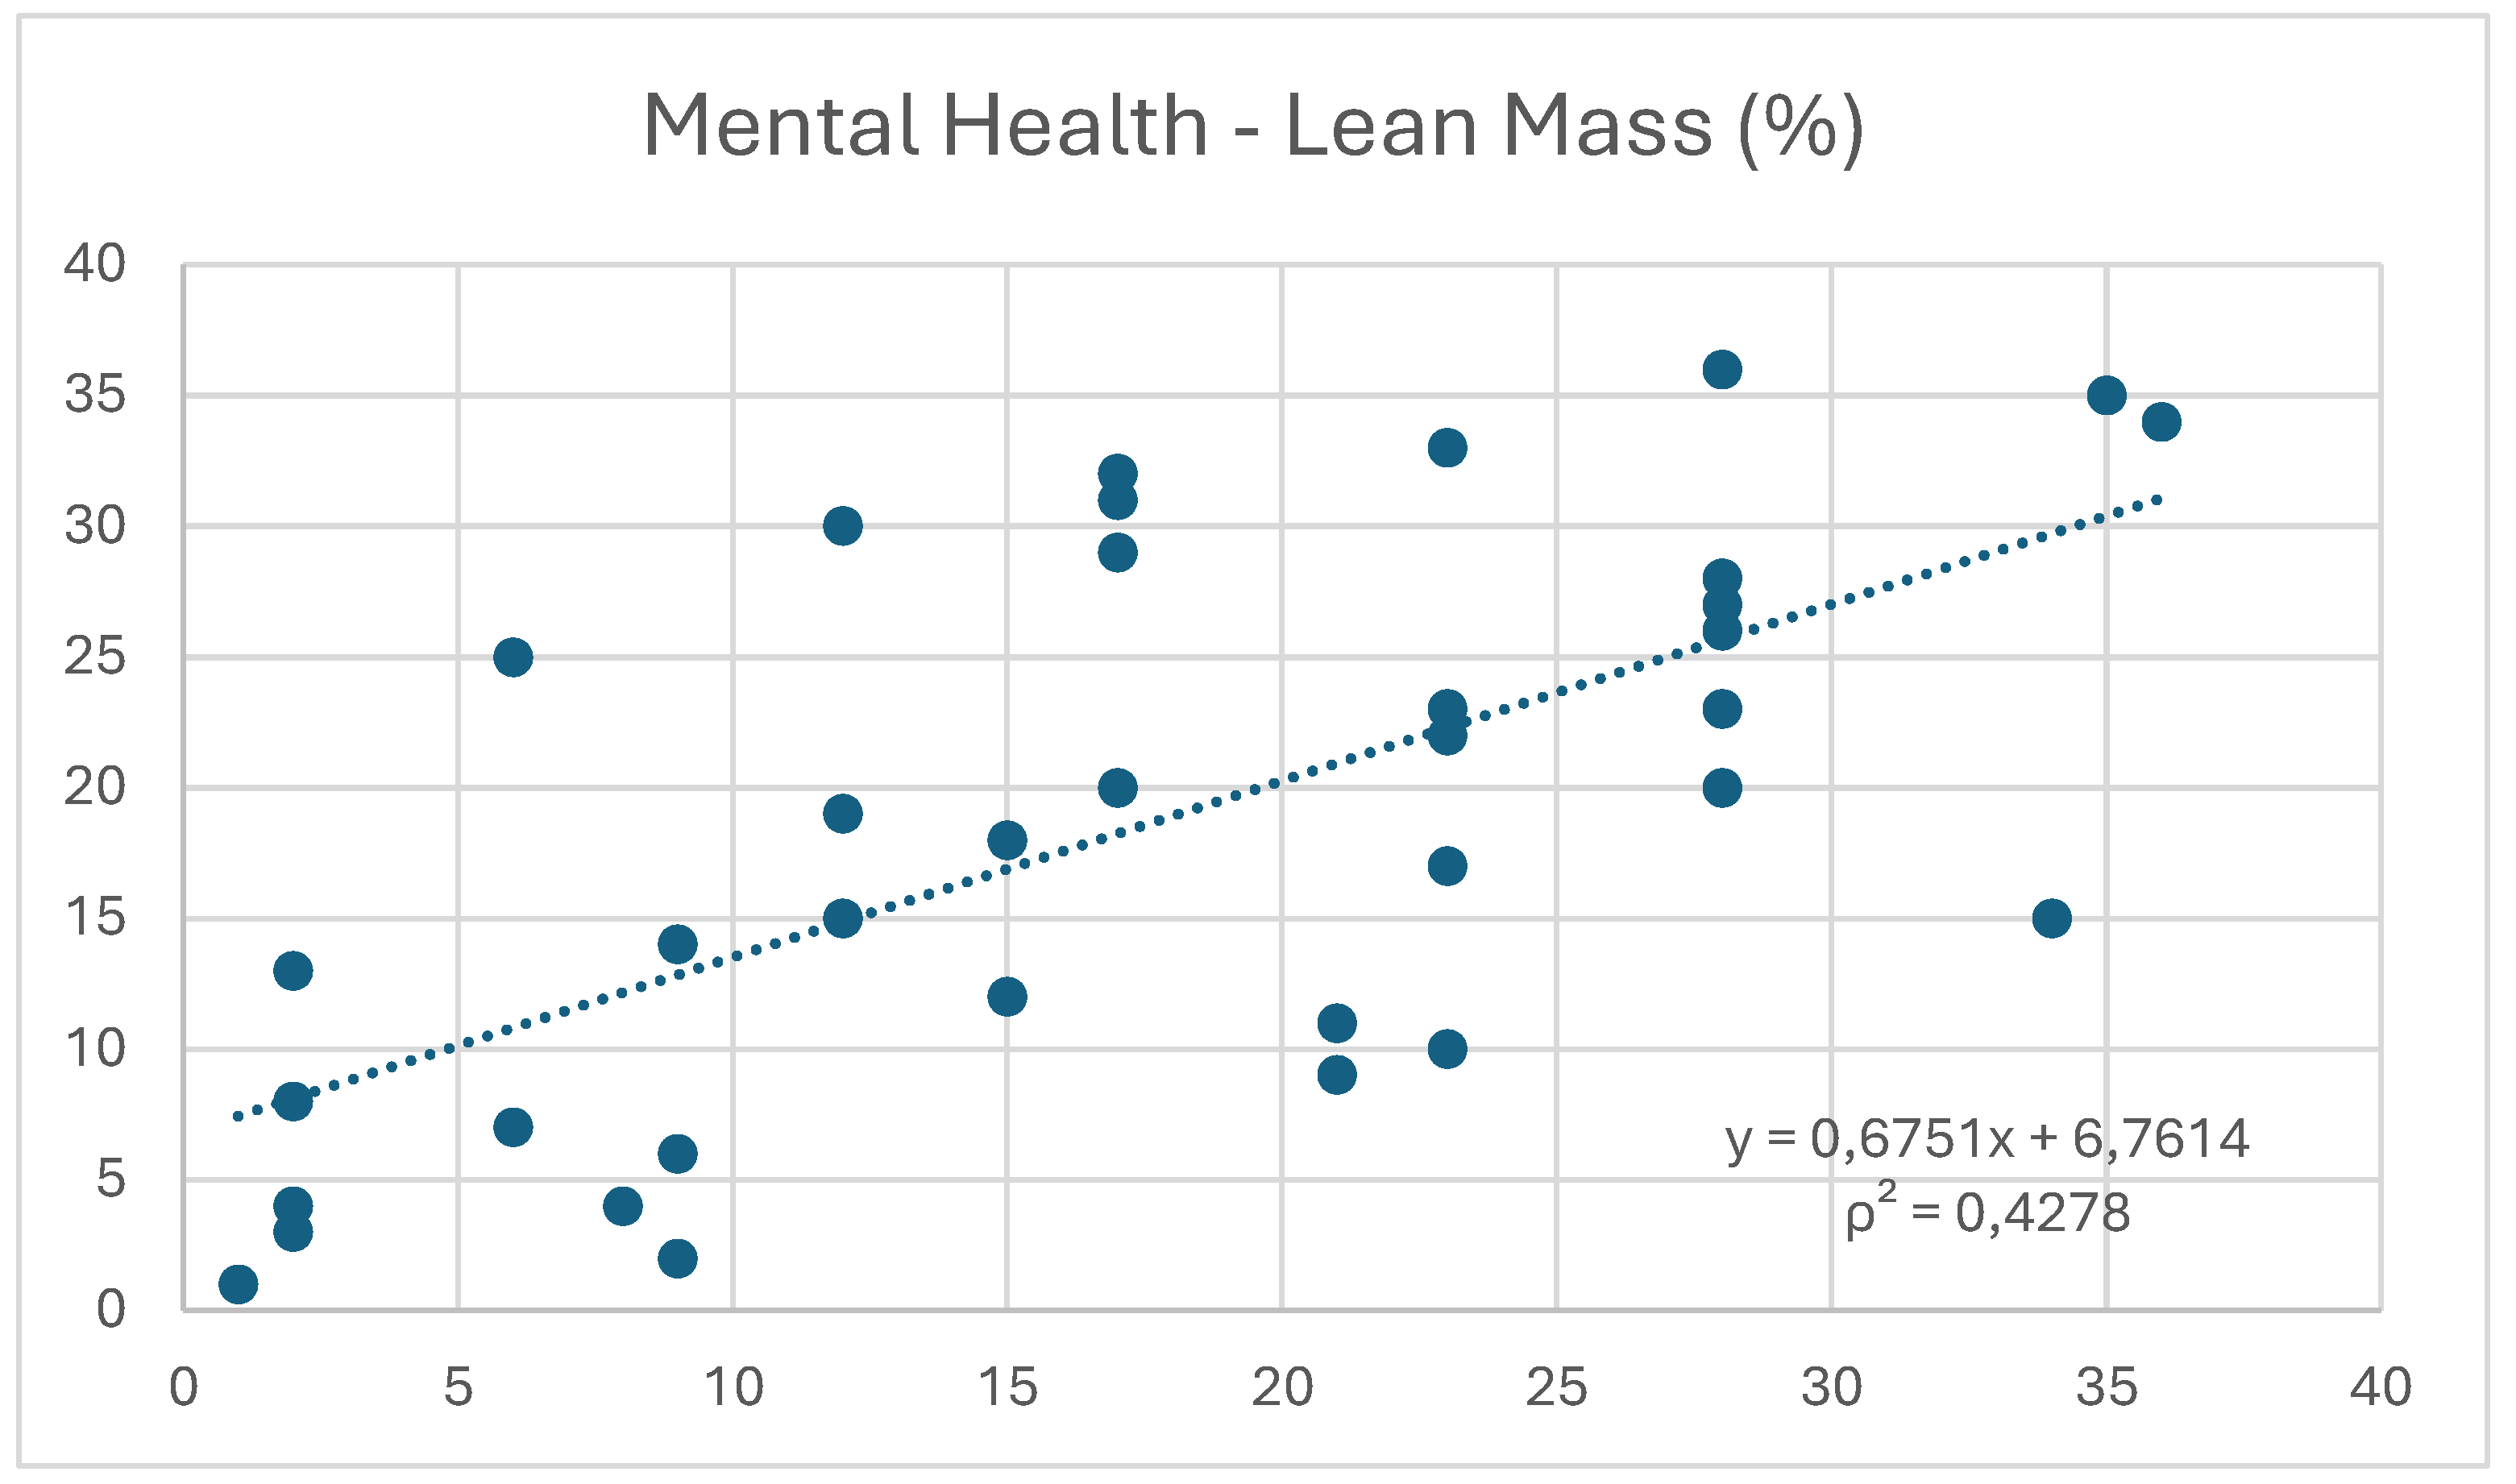
Figure 2.
Correlation between the variables "mental health" and "musculoskeletal mass.".
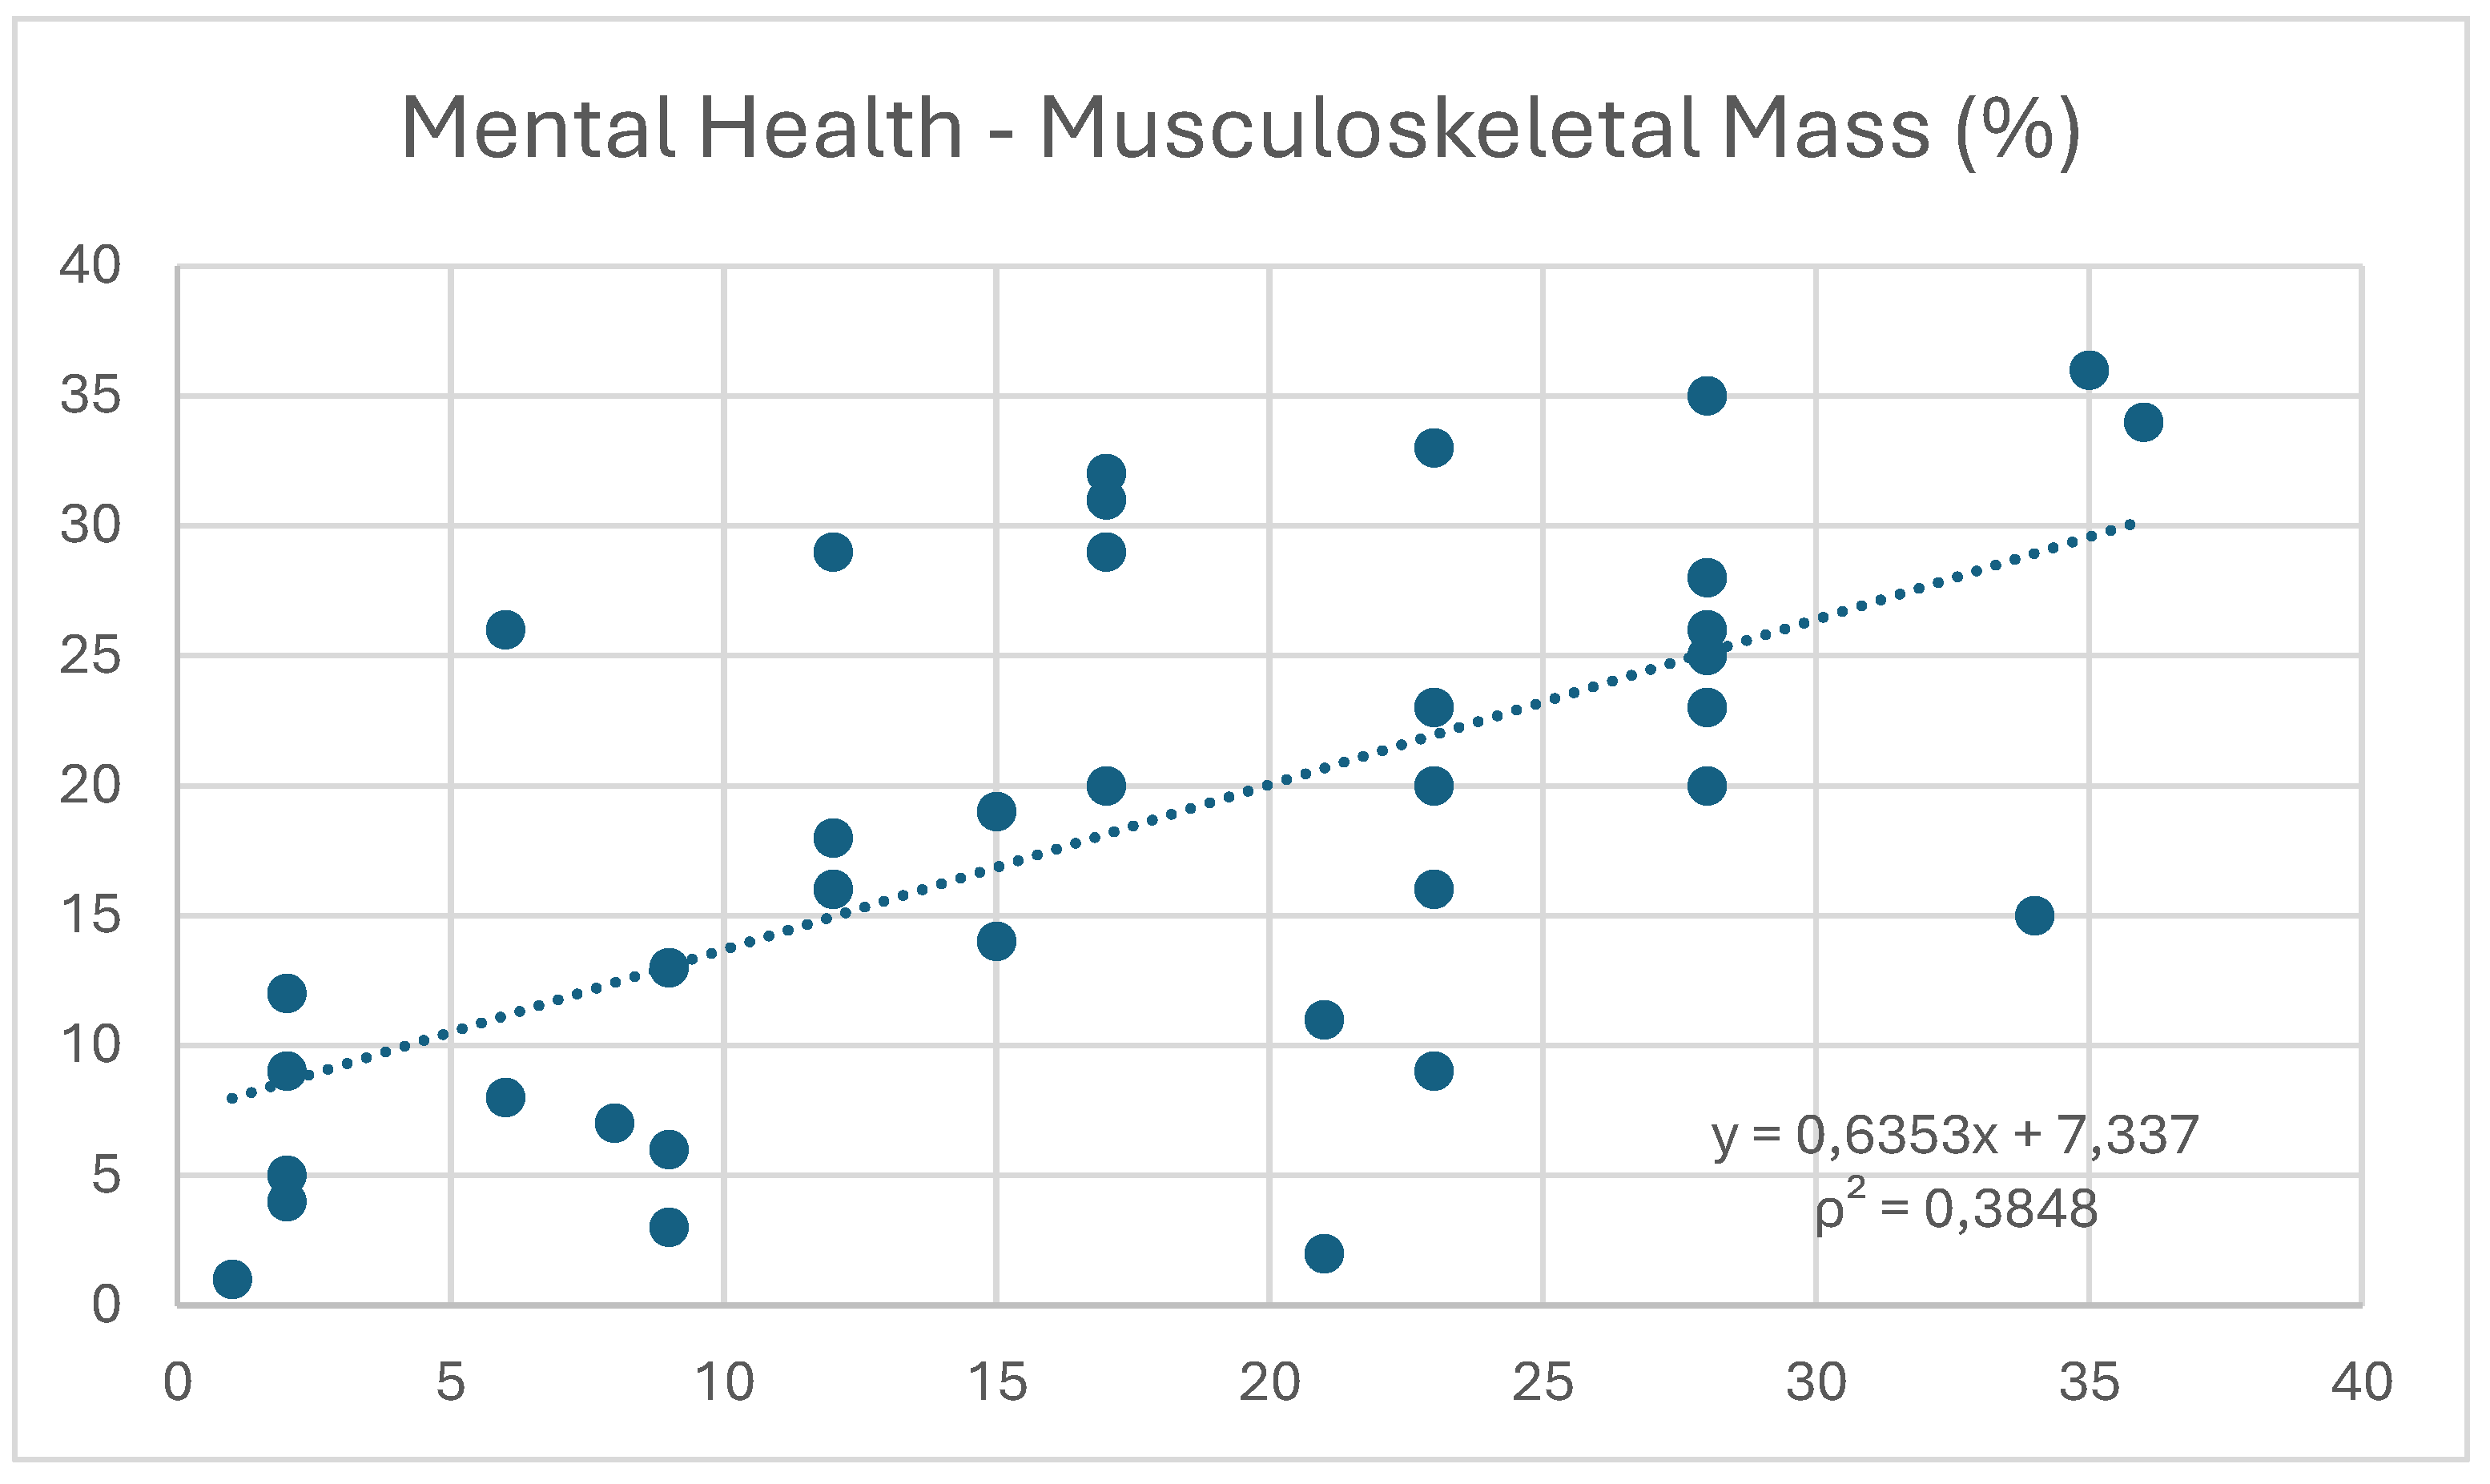
Figure 3.
Correlation between the variables "mental health" and "fat mass.".
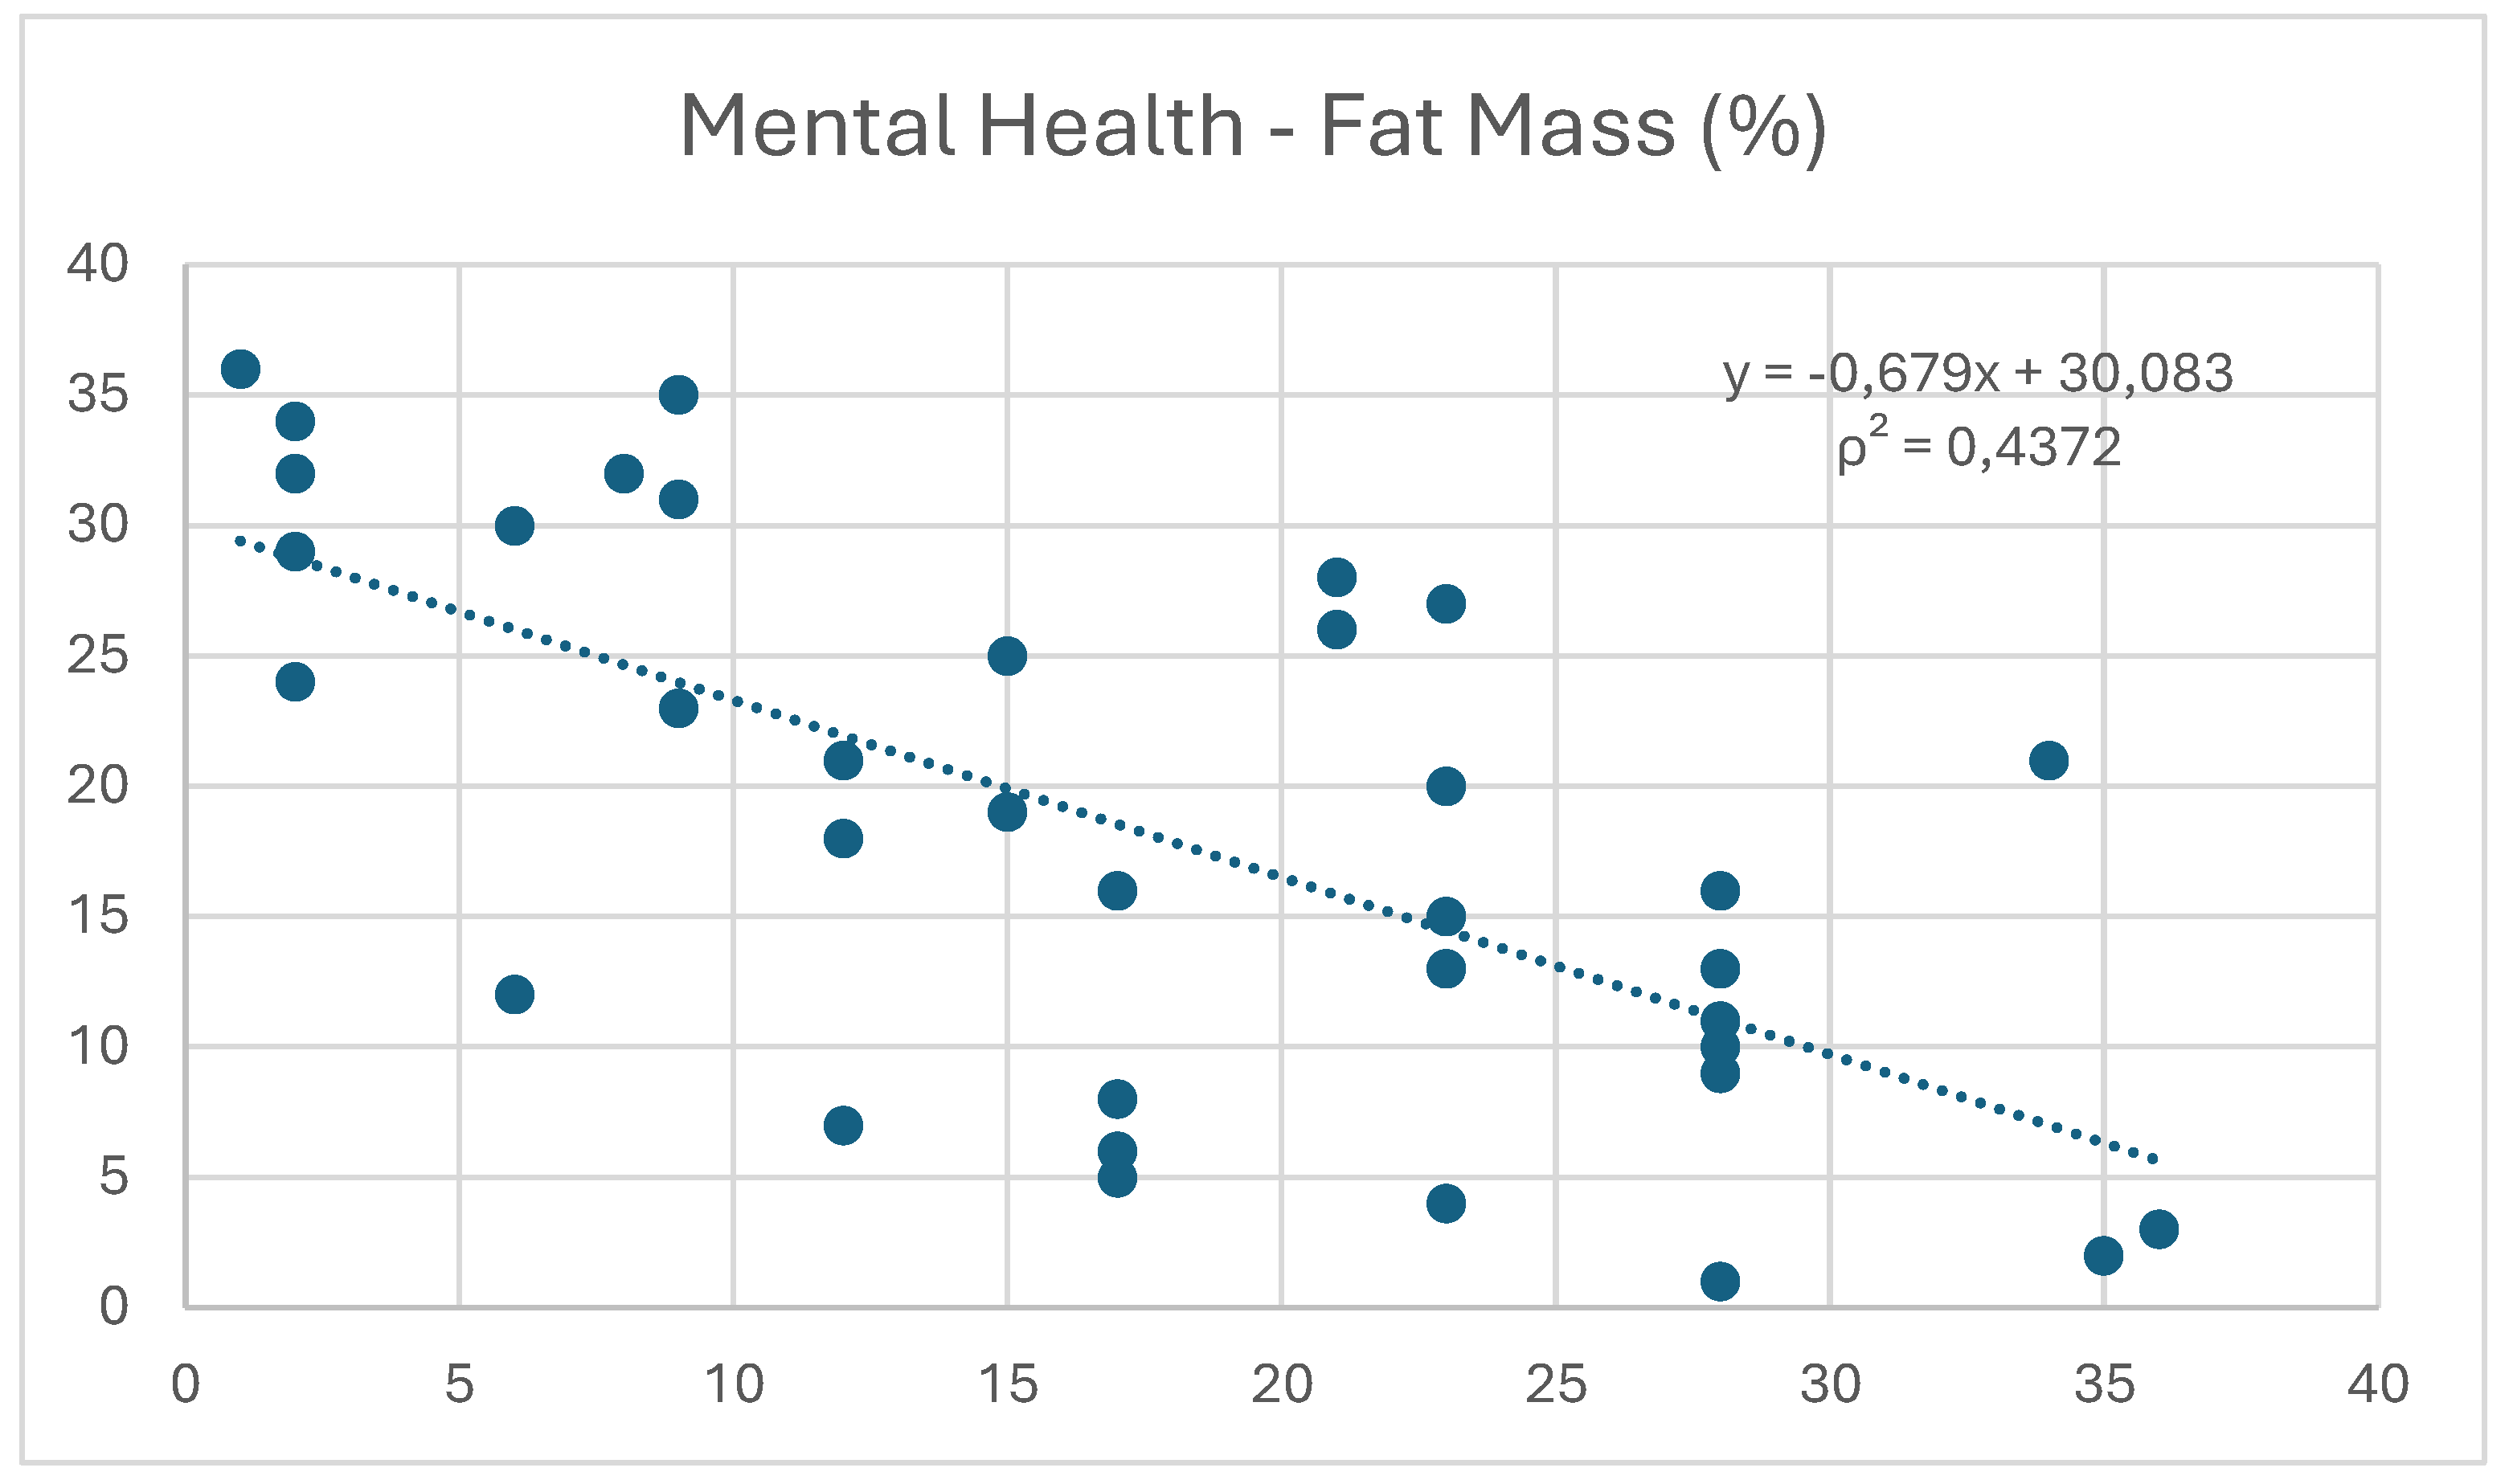
Figure 4.
Correlation between the variables "physical pain" and "tissue hydration”.
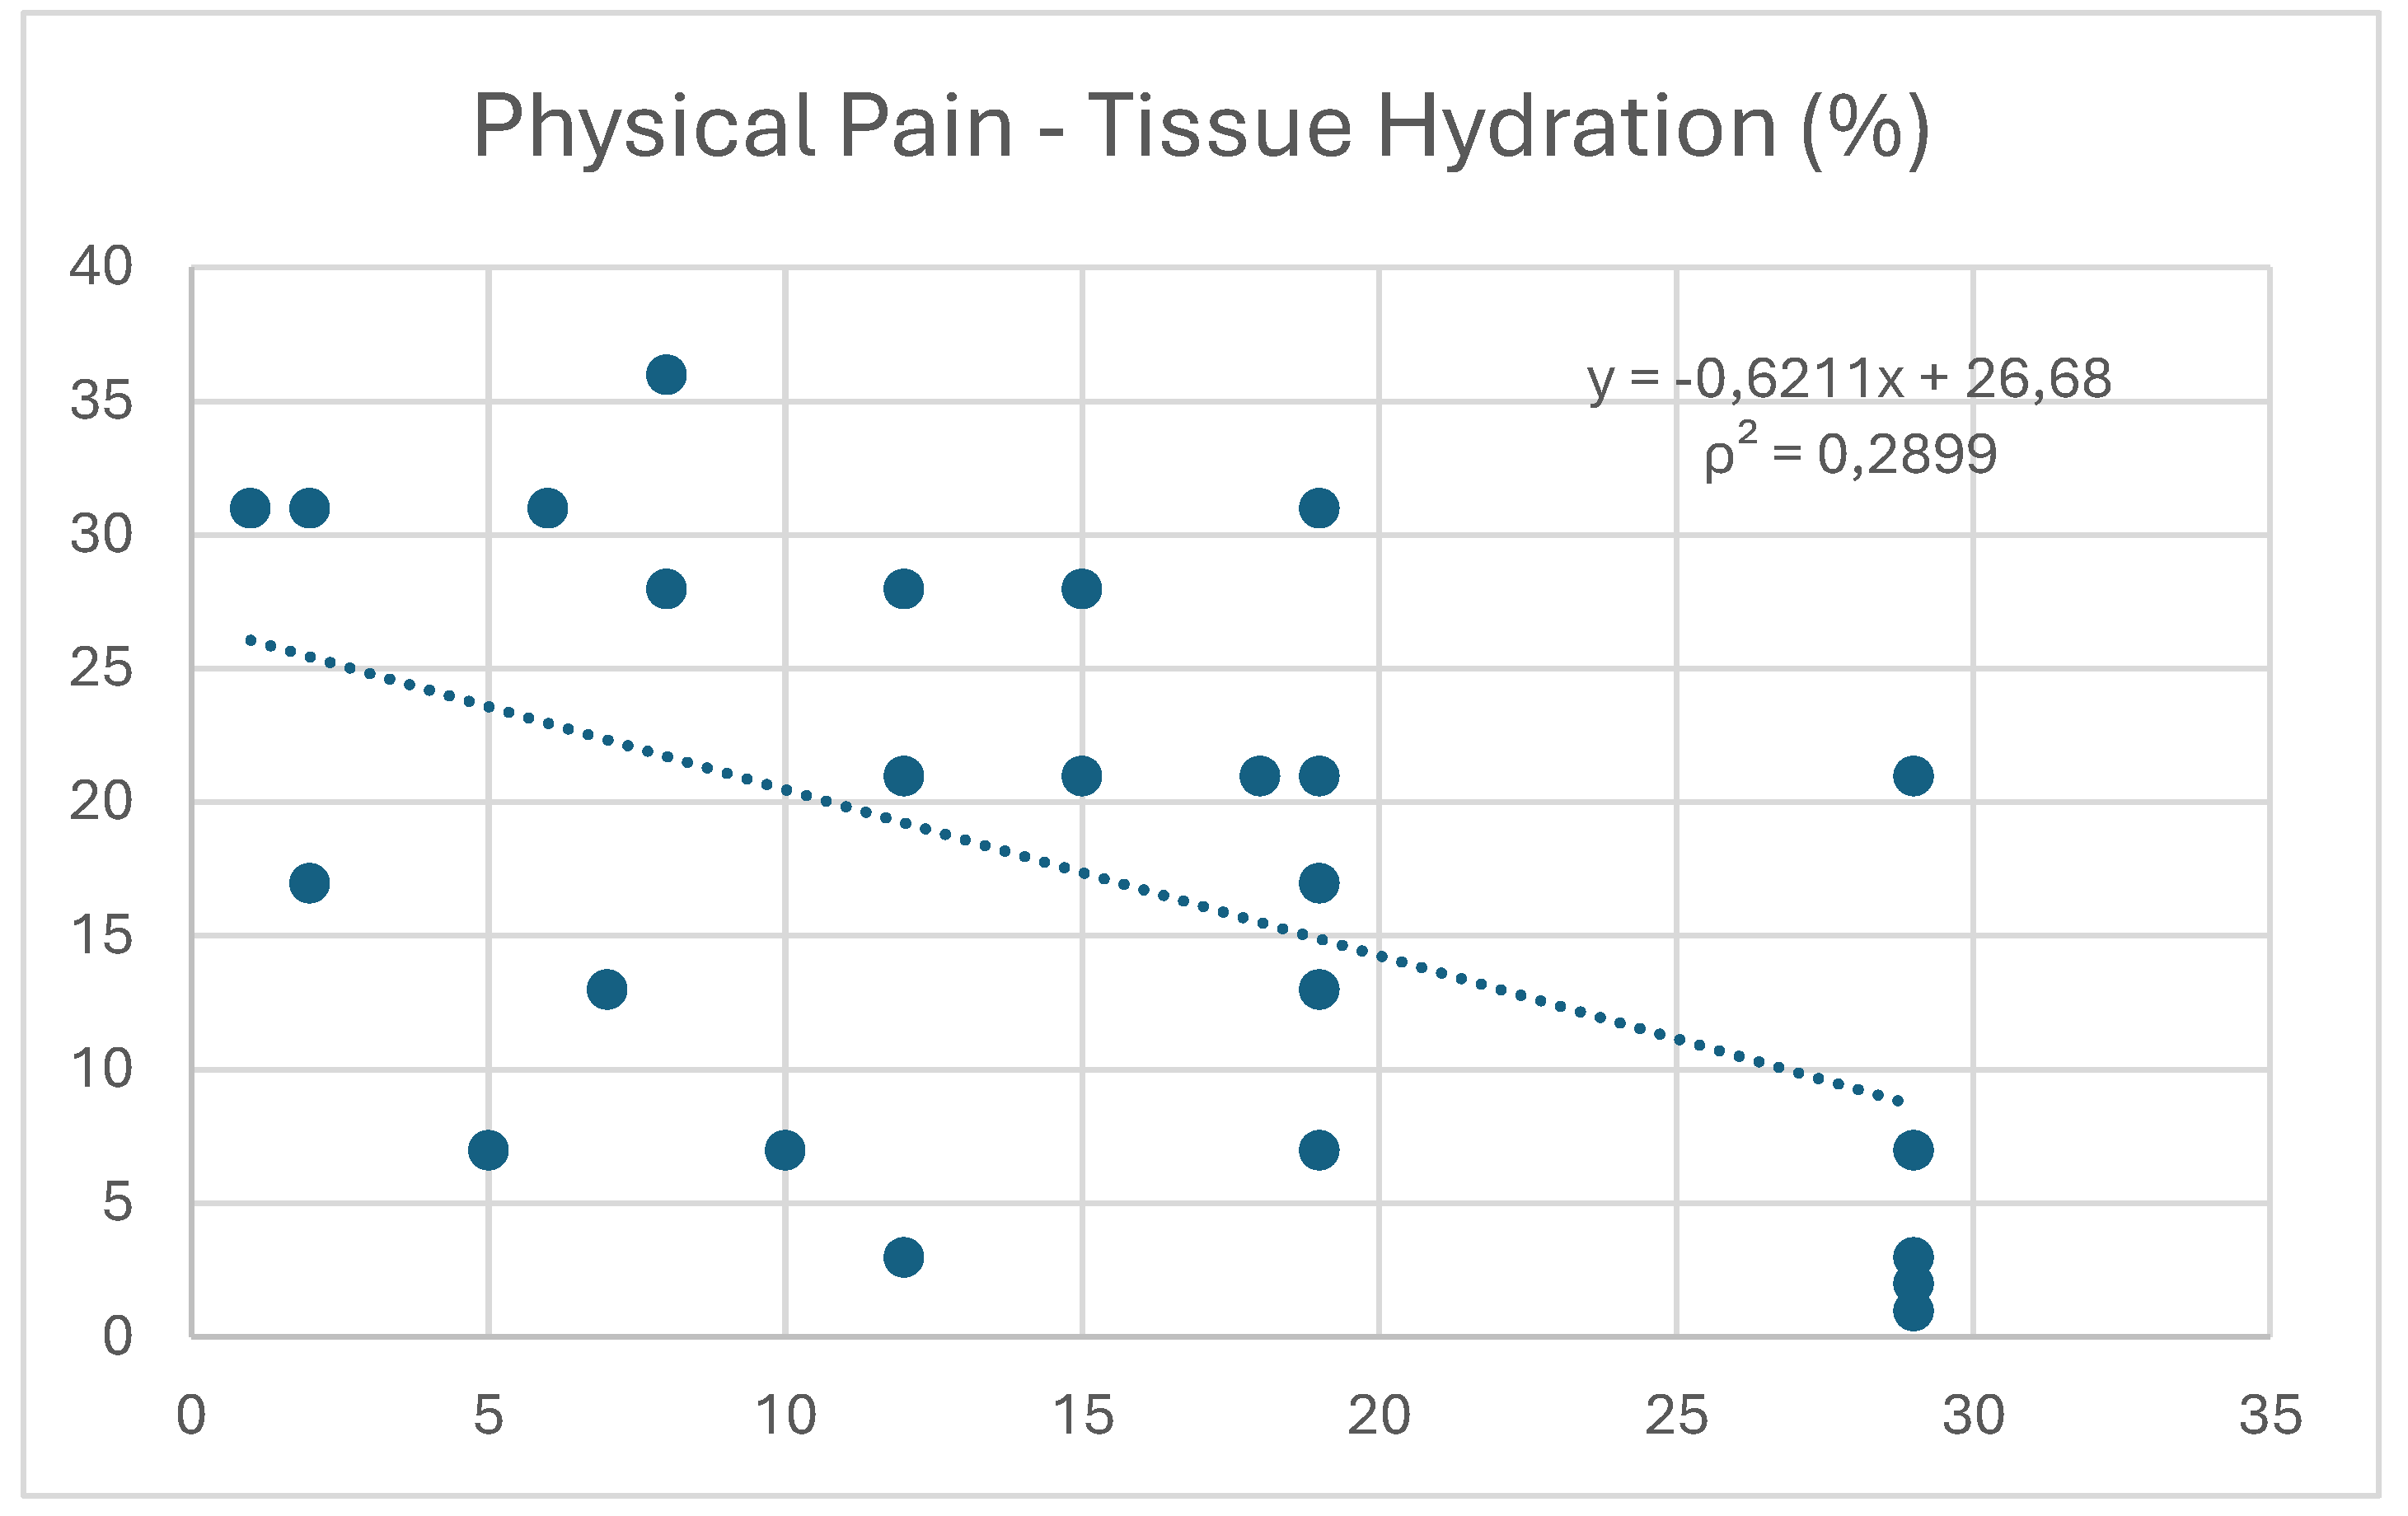
Figure 5.
Correlation between the variables "physical pain" and "role limitations” due to physical health.
Figure 5.
Correlation between the variables "physical pain" and "role limitations” due to physical health.
Disclaimer/Publisher’s Note: The statements, opinions and data contained in all publications are solely those of the individual author(s) and contributor(s) and not of MDPI and/or the editor(s). MDPI and/or the editor(s) disclaim responsibility for any injury to people or property resulting from any ideas, methods, instructions or products referred to in the content. |
© 2024 by the authors. Licensee MDPI, Basel, Switzerland. This article is an open access article distributed under the terms and conditions of the Creative Commons Attribution (CC BY) license (http://creativecommons.org/licenses/by/4.0/).
Copyright: This open access article is published under a Creative Commons CC BY 4.0 license, which permit the free download, distribution, and reuse, provided that the author and preprint are cited in any reuse.


