
Submitted:
20 December 2024
Posted:
23 December 2024
You are already at the latest version
Abstract
The purpose of the present study was to investigate whether perceptual sensitivity to the tactile stimulus is influenced by awareness of who controls the stimulus intensity. The intensity of the tactile stimulus to the participant's index finger providing each 1 s was increased by the participant or by someone else. The stimulus intensity at the perceptual threshold, when controlled by the participant, was significantly lower than when controlled by someone else, regardless of whether vision was available. This indicates that awareness of the self-control of the tactile stimulus intensity enhances tactile sensitivity. The electrodermal level immediately preceding the stimulus at the perceptual threshold was significantly lower when the participant controlled the stimulus intensity compared to when it was controlled by someone else, with the participant keeping their eyes closed. The electrodermal level immediately preceding the stimulus at the perceptual threshold was significantly greater when the participant controlled the stimulus intensity compared to when it was controlled by someone else, with the participant's eyes remaining closed throughout. These findings on the electrodermal level can be explained by the idea that cognitive stress is greater when timing at the first perception of the tactile stimulus is difficult to predict.
Keywords:
tactile perception
; efference copy
; time prediction
; self-triggered touch
; vision
; motor command
; self-control
; electrodermal activity
; electrodermal level
; galvanic skin response
1. Introduction
The tactile perceptual process depends on whether tactile stimulation of the body is triggered by oneself or by someone else. For example, cutaneous reflex during gait was attenuated when it was self-triggered [1]. The tactile perception was lower when the tickling was self-induced [2,3,4]. In those two studies, participants remained at rest when tickled by someone else, but moved the hand when tickling themselves. Perceptual sensitivity to the tactile stimulus was suppressed during reaching, grasping, or elbow or finger movement, referred to as tactile gating [5,6,7,8,9,10,11,12,13,14]. Accordingly, the attenuation of the perception during self-induced tickle may reflect tactile gating.
Tactile sensitivity was attenuated when touch was triggered by active movement, but not when it was triggered by passive movement or by someone else [15,16,17]. Efference copy of the motor command is used to predict the results of the motor command via internal model [18,19,20,21,22], and is likely generated when the tactile stimulus is self-induced. Thus, those previous findings are explained by the view that tactile sensitivity is attenuated when the tactile stimulus is predicted via efference copy of the motor command [2,17,23,24,25,26]. Based on this view, if the predictability of the tactile stimulus is the same between the self-induced and externally triggered conditions due to equal production of efference copy, tactile sensitivity should not be dependent on whether the stimulus is self-triggered or not (hypothesis 1).
Tactile sensitivity increased when time prediction of the stimulus was available, indicating that time prediction of the stimulus enhances tactile sensitivity [27]. When one tapped the left finger with the right finger, tactile sensitivity of the left finger was attenuated [16]. However, this attenuation decreased when the finger tap was delayed or advanced relative to the time at the actual tapping movement. Similarly, tactile attenuation was less when the delay of the self-triggered tactile stimulus increased [15]. One interpretation of these previous findings is that the attenuation of the tactile sensitivity depends on whether time prediction of the tactile stimulus is difficult or not. Accordingly, we established hypothesis that the difference between the perceptual sensitivity to the self-triggered tactile stimulus and that to the externally triggered tactile stimulus is derived from whether time prediction of the tactile stimulus is difficult or not (Hypothesis 2). When the intensity of the tactile stimulus is gradually increased from subthreshold to suprathreshold level, humans can predict the timing of their first perception of the stimuli by visually monitoring its intensity while actively controlling the increase themselves. Accordingly, if Hypothesis 2 is true, tactile sensitivity will differ between conditions where a participant gradually increases and visually monitors the stimulus intensity, and where the stimulus intensity is controlled by someone else without the participant's visual monitoring.
Variation of electrodermal activity represents the change in the levels of sweat in the ducts of the sweat glands [28]. Short-term stressors, such as cold pressure, stroop task, or fearful states increase electrodermal levels (EDLs) [29,30,31,32]. Self-induced postural perturbation in stance causes earlier electrodermal response compared with the externally-induced perturbation, indicating that the sympathetic response is different between the self-triggered and externally triggered postural perturbation in stance [33]. However, in this study, the self-generated trigger was made by the participant, but the externally generated trigger was made by someone other than the participant. Thus, for the former condition, efference copy of the motor command was present, but for the latter condition, it was not. Accordingly, the difference may reflect the prediction of the stimulus caused by the prediction of the perturbation via efference copy of the motor command. In the present study, to examine whether the effect of the self-generated tactile stimulus on sympathetic activity is due to the prediction of the tactile stimulus without the influence of efference copy, EDL immediately before the stimulus whose intensity was at the perceptual threshold was compared between self-controlled and externally controlled stimulus intensities, while the participant generated efference copy of the motor command in both cases.
2. Materials and Methods
2.1. Participants
Thirteen healthy humans (eleven males and two females) aged 30.8 ± 10.5 years participated in this study. The participants had no history of neurological or orthopedic disease. Twelve participants were right-handed and one was left-handed according to the Edinburgh Handedness Inventory score [34]. All participants had no history of neurological or musculoskeletal diseases. Written informed consent was obtained from all participants. The experiment was conducted according to the Declaration of Helsinki and was approved by the ethics committee of Osaka Metropolitan University (Approval number: 2023-115).
2.2. Apparatus
A participant took a sitting position in front of an actual dial controlling the intensity of the tactile stimuli and a dummy dial that did not control it. An earmuff was placed over his/her ears. Ring electrodes (SL-100-1, Unique Medical, Tokyo) were placed over the index finger of the right hand. An anode of the electrodes was placed at the proximal phalanx and a cathode was placed at the middle phalanx. The distance between the electrodes was 1.5 cm. Electrical current to those electrodes was supplied by an isolator (SS-104J, Nihon Kohden, Tokyo) attached to an electrical stimulator (SEN-8203, Nihon Kohden, Tokyo). The duration of each electrical stimulus was 500 μs. Electrodes measuring the electrodermal resistance were placed over the tips of the right middle and ring fingers (T.K.K.2701, Takei Kiki, Tokyo). Electrodermal resistance was recorded during the test trials. The analog signals of electrodermal resistance were digitized using an A/D converter (PowerLab/8sp, ADInstruments, Colorado) at a sampling rate of 10 kHz.
2.3. Baseline stimulus intensity at perceptual threshold
The stimulus intensity at the perceptual threshold, defined as the minimum stimulus intensity at which the participants could perceive the stimulus, was determined using the method of limit [35]. Firstly, an experimenter held an actual dial controlling the stimulus intensity while the stimuli were provided each 1 s and increased the stimulus intensity until the participant perceived the stimuli. Secondly, the experimenter slowly decreased the intensity from this above-threshold level until the participant did not perceive the stimuli. Finally, the experimenter slowly increased the stimulus intensity again from this below threshold level until the participant perceived the stimuli. The stimulus intensity at the moment at which the participant first perceived the stimulus in this final trial was defined as the baseline stimulus intensity at the perceptual threshold.
2.4. Practice trial
Before conducting the test trials, a practice trial was conducted. The electrical stimulus was provided each 1 s in this trial. The participant turned the actual dial controlling the stimulus intensity with the left hand so that the stimulation intensity increased from the intensity 4.7 V below the baseline stimulus intensity at the perceptual threshold until they perceived the stimulus. They kept the eyes open and watched the dial as they turned it. They memorized the speed at which the dial was turned during the practice trial so that they could replicate the same motion during the test trials.
2.5. Test trials
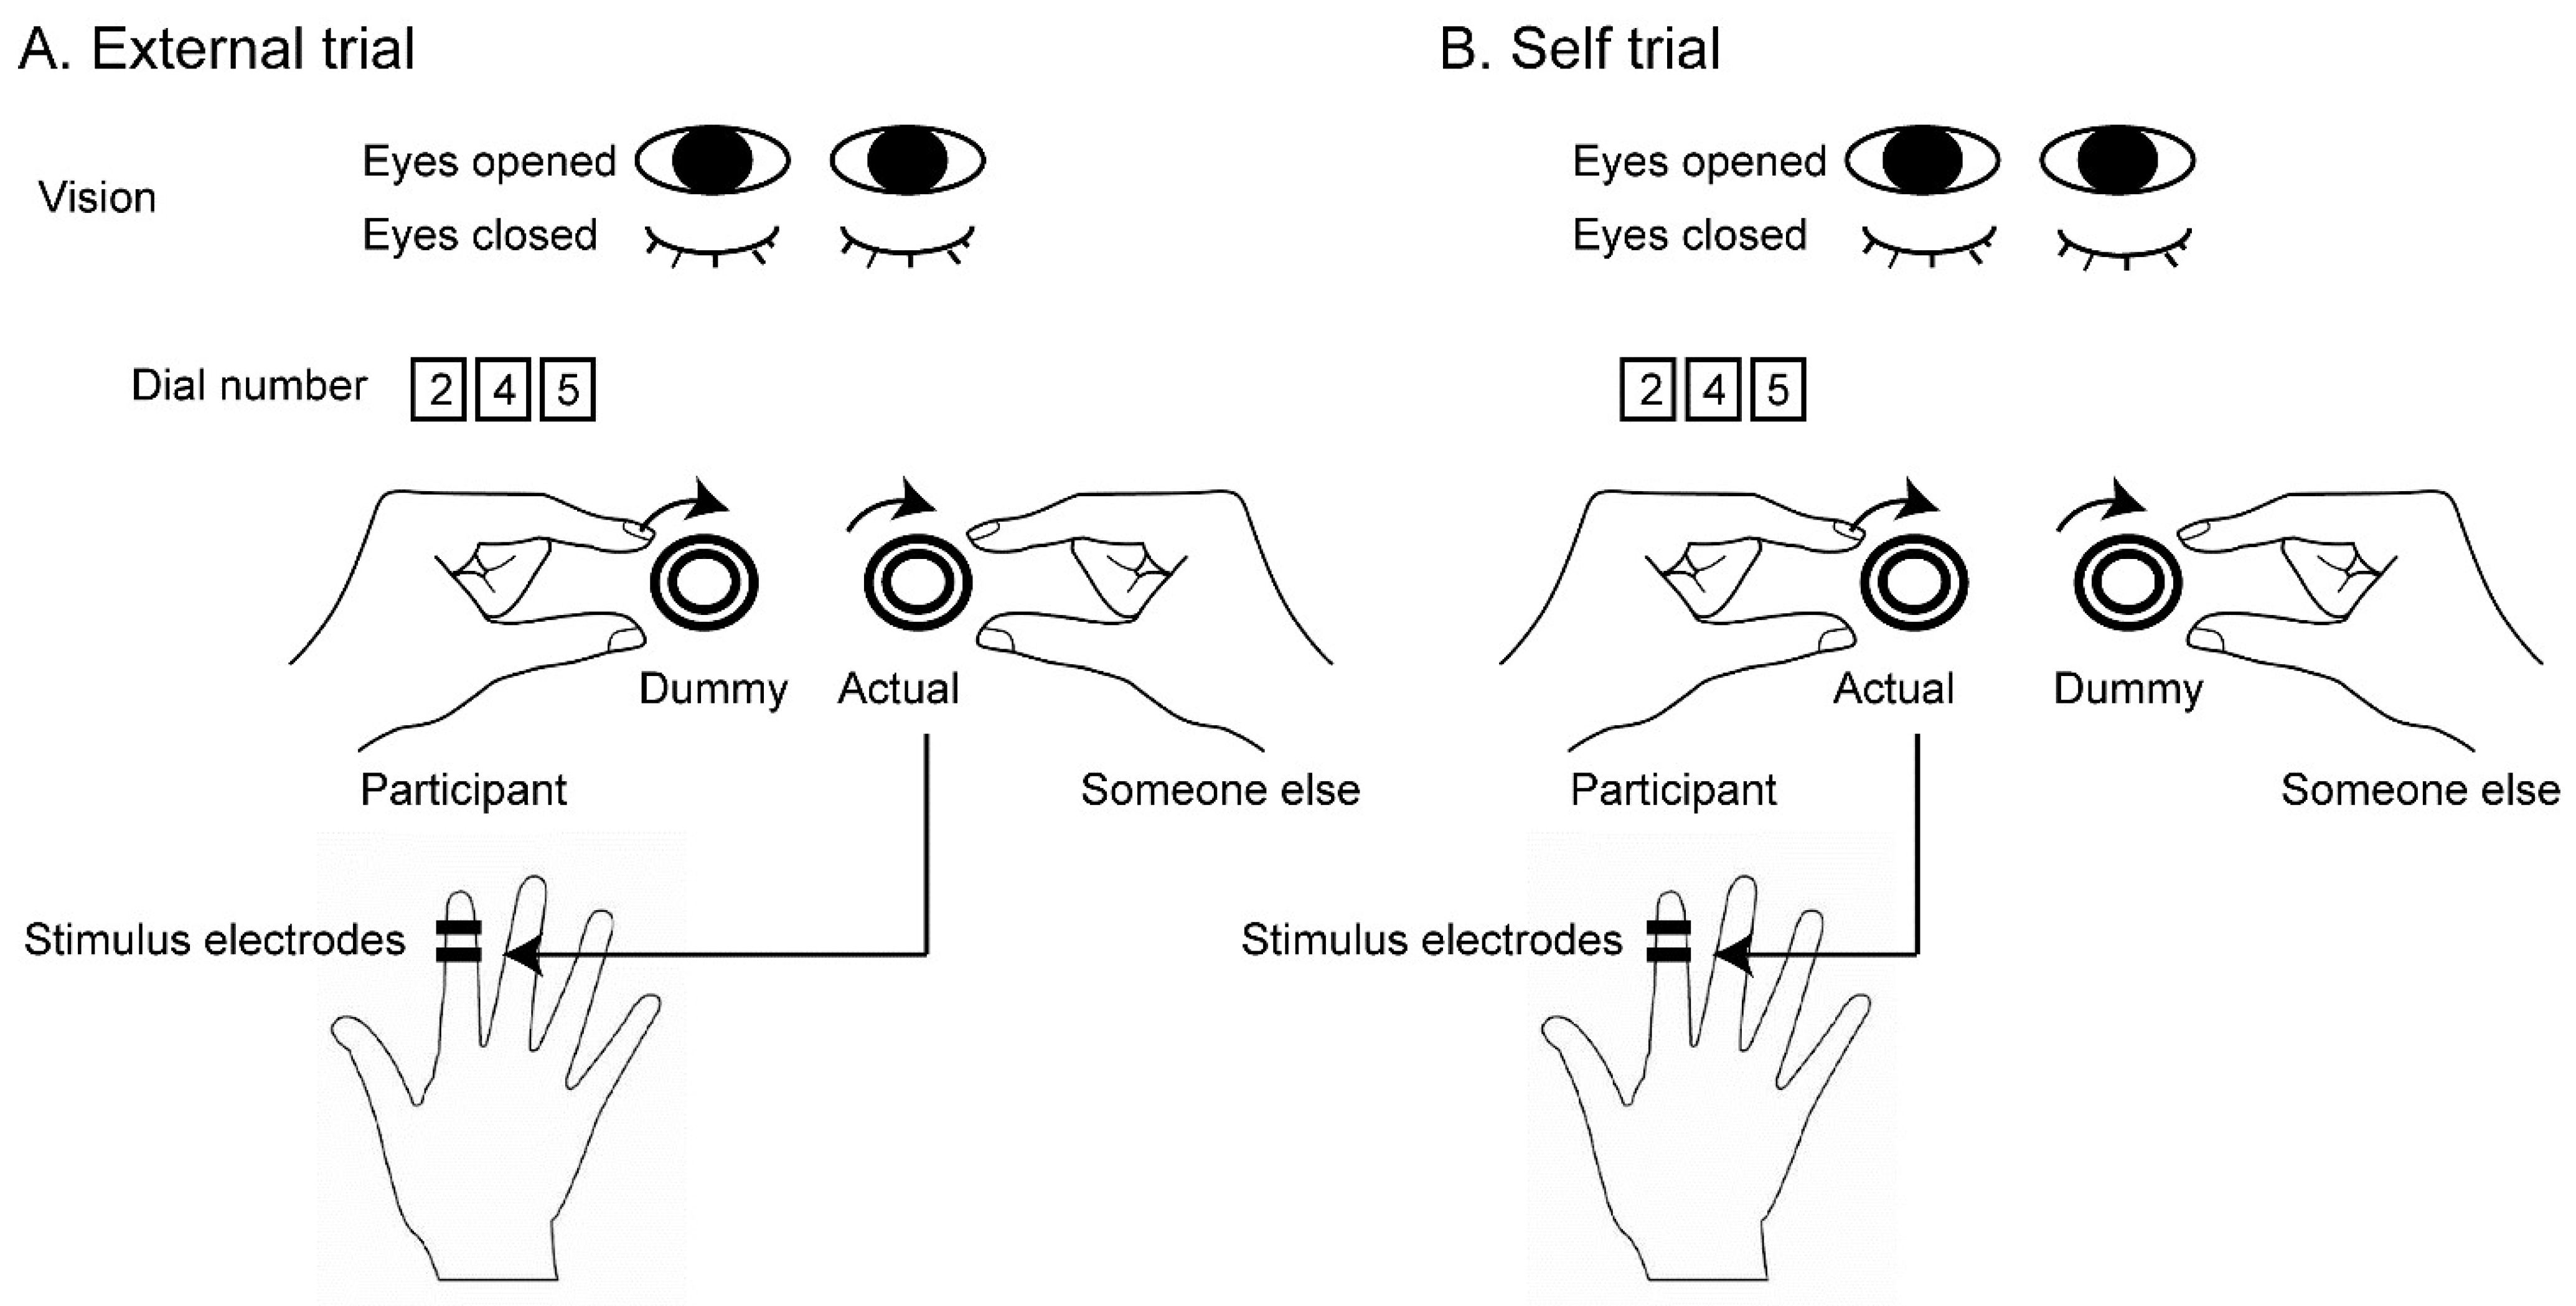
The test trials are shown in Figure 1. In the external trials, someone other than the participant held an actual dial controlling the intensity of the stimulus with the right hand, but a participant held a dummy dial where turning it with the left hand did not change the stimulus intensity (Figure 1A). Before conducting this trial, an experimenter verbally instructed the participant that the dial held by someone other than the participant was one controlling the stimulus intensity but the dial held by the participant was a dummy. In the self trials, the participant held an actual dial with the left hand but the other held a dummy dial with the right hand (Figure 1B). Before conducting this trial, the experimenter verbally instructed that the dial held by the participant was one controlling the stimulus intensity but the dial held by someone other than the participant was the dummy. To confirm that the participant understood the instruction, they repeated what the experimenter instructed. Because of this procedure, the participant was aware of the person who controlled the stimulus intensity in each trial. Each trial involved one of two vision conditions: the eyes-open condition, where the participant kept their eyes open, and the eyes-closed condition, where the participant kept their eyes closed. The participant was instructed whether to keep their eyes open or closed before each trial. In the trial in which the participant kept the eyes open, they gazed at the number of the dial turned by them.
Each trial started when the fluctuation of EDL was minimal. The participant and someone other than the participant turned the dial, and the participant verbally answered “yes” when they finally perceived the stimulus. At this point, the participant and someone other than the participant stopped turning the dial, and the experimenter recorded the number indicating the stimulus intensity in each dial. Four types of trials (self trials with the eyes open, external trials with the eyes open, self trials with the eyes closed, and external trials with the eyes closed) were conducted. Each type of trial consisted of 10 trials in an experiment. Those forty trials were randomly ordered.
Figure 1.
Experimental setup. In the external trials, a participant turns a dummy dial but someone else turns an actual dial. In the self trials, the participant turns the actual dial but someone else turns the dummy dial. The actual dial controls the stimulus intensity, but the dummy dial does not. They turn the dial to increase the stimulus intensity until the participant perceives the stimulus. In each trial, the eyes are closed or open. When the eyes are open, the participant views the number of the dial that is turned by them.
2.6. Data Analysis
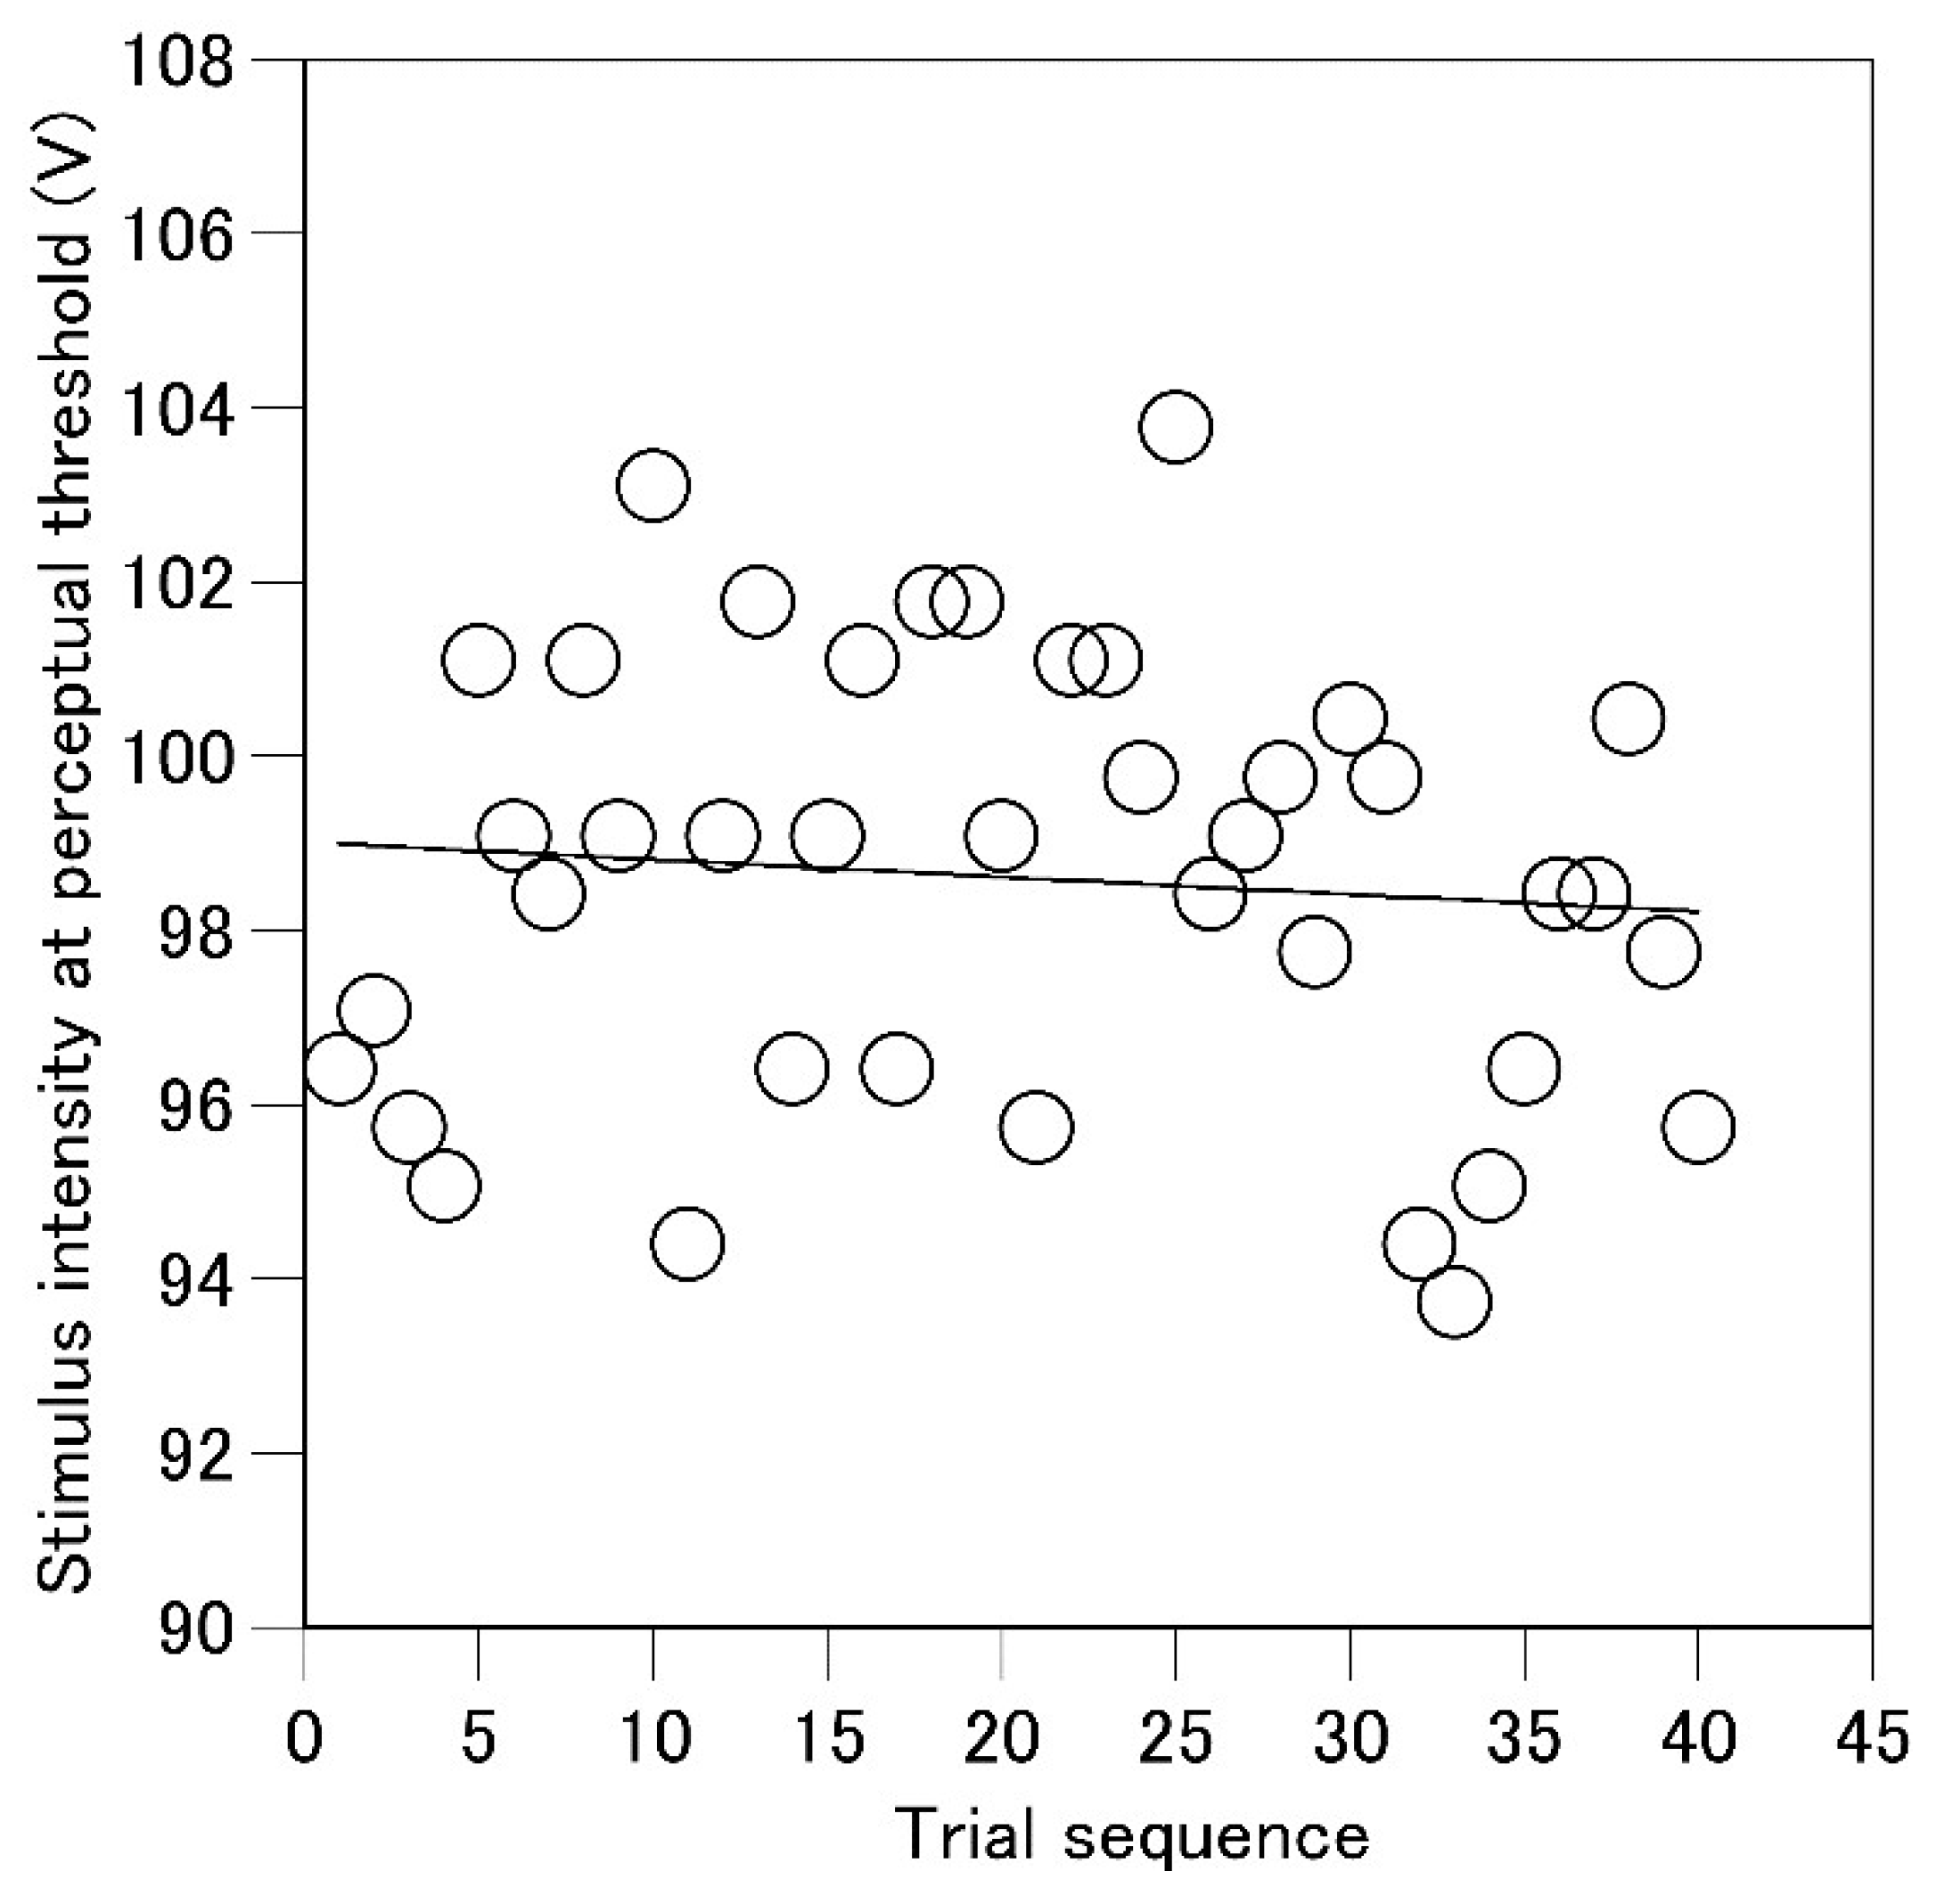
To determine the stimulus intensity at the perceptual threshold without influence of drift in the intensity across trials, an original data analysis was conducted. A regression line of the stimulus intensity at the perceptual threshold as the function of the sequence of the trials was estimated in each participant (Figure 2). This regression line represented the baseline level and trend of the change in the stimulus intensity at the perceptual threshold across the trials. Then, the residual for each stimulus intensity from this regression line was calculated. This residual represented the deviation of the stimulus intensity at the perceptual threshold from the baseline level without the influence of drift in the stimulus intensity at the perceptual threshold across the trials. Thus, the positive value of the residual means the increase in the stimulus intensity at the perceptual threshold and vice versa. Each residual was divided by the standard deviation of the residuals across the trials to calculate the z-score. The z-score indicated the stimulus intensity at the perceptual threshold as a magnification of the variability of the intensity across the trials. A positive z-score indicated an increase in the stimulus intensity at the perceptual threshold, and a negative z-score indicated a decrease in this value relative to the neutral stimulus intensity at the perceptual threshold across the trials. Pre-stimulus EDL (average EDL in the time window between 0 and 100 ms before the stimulus) in the trial in which the stimulus intensity was at the perceptual threshold was calculated.
Repeated measures two-way ANOVA for the main effect of the controller (the participant or someone other than the participant, two levels) and vision (eyes open or eyes closed, two levels) was conducted. The result of Greenhouse-Geisser's correction was reported whenever Mauchly's test of sphericity was significant. The paired t-test with Bonferroni adjustment of alpha, comparing the mean number of the dummy dial and that of the actual dial at the perceptual threshold was conducted. The alpha level was 0.05. Excel-Toukei 2016 ver. 3.21 (Social Survey Research Information, Tokyo) was used for statistical analysis. The data in the results are expressed as the mean and standard error of mean.
Figure 2.
An example of the time series of the stimulus intensity at the perceptual threshold expressed as the voltage of the stimulus and a regression line of this intensity as the function of the trial series.
Figure 2.
An example of the time series of the stimulus intensity at the perceptual threshold expressed as the voltage of the stimulus and a regression line of this intensity as the function of the trial series.
3. Results
3.1. Dial number at perceptual threshold
The dial number at the perceptual threshold, expressed as voltage, is shown in Figure 3. The number of the actual dial at the perceptual threshold was significantly greater than that of the dummy dial when the participants turned the dummy dial with their eyes open (p < 0.05). The number of the dummy dial at the perceptual threshold was significantly greater than that of the actual dial when the participants turned the actual dial with their eyes open (p = 0.046). Taken together, the number of the dial turned by the participant at the perceptual threshold was significantly lower when the participant’s eyes were open. There was no significant difference between the number of the dummy dial and that of the actual dial at the perceptual threshold when the participant kept the eyes closed either when the participant turned the dummy (p = 1.947) or actual dial (p =0.195).
3.2. Stimulus intensity at perceptual threshold
The stimulus intensity at the perceptual threshold is shown in Figure 4. There was no significant interaction between the main effect of controller and that of vision [F (1, 12) = 3.078, p = 0.105, η2p = 0.204]. There was a significant main effect of the controller [F (1, 12) = 5.206, p = 0.042, η2p = 0.303]; the stimulus intensity in the self trials was significantly lower than that in the external trials. There was no significant main effect of vision [F (1, 12) = 0.122, p = 0.733, η2p = 0.010].
3.3. Pre-stimulus EDL at perceptual threshold
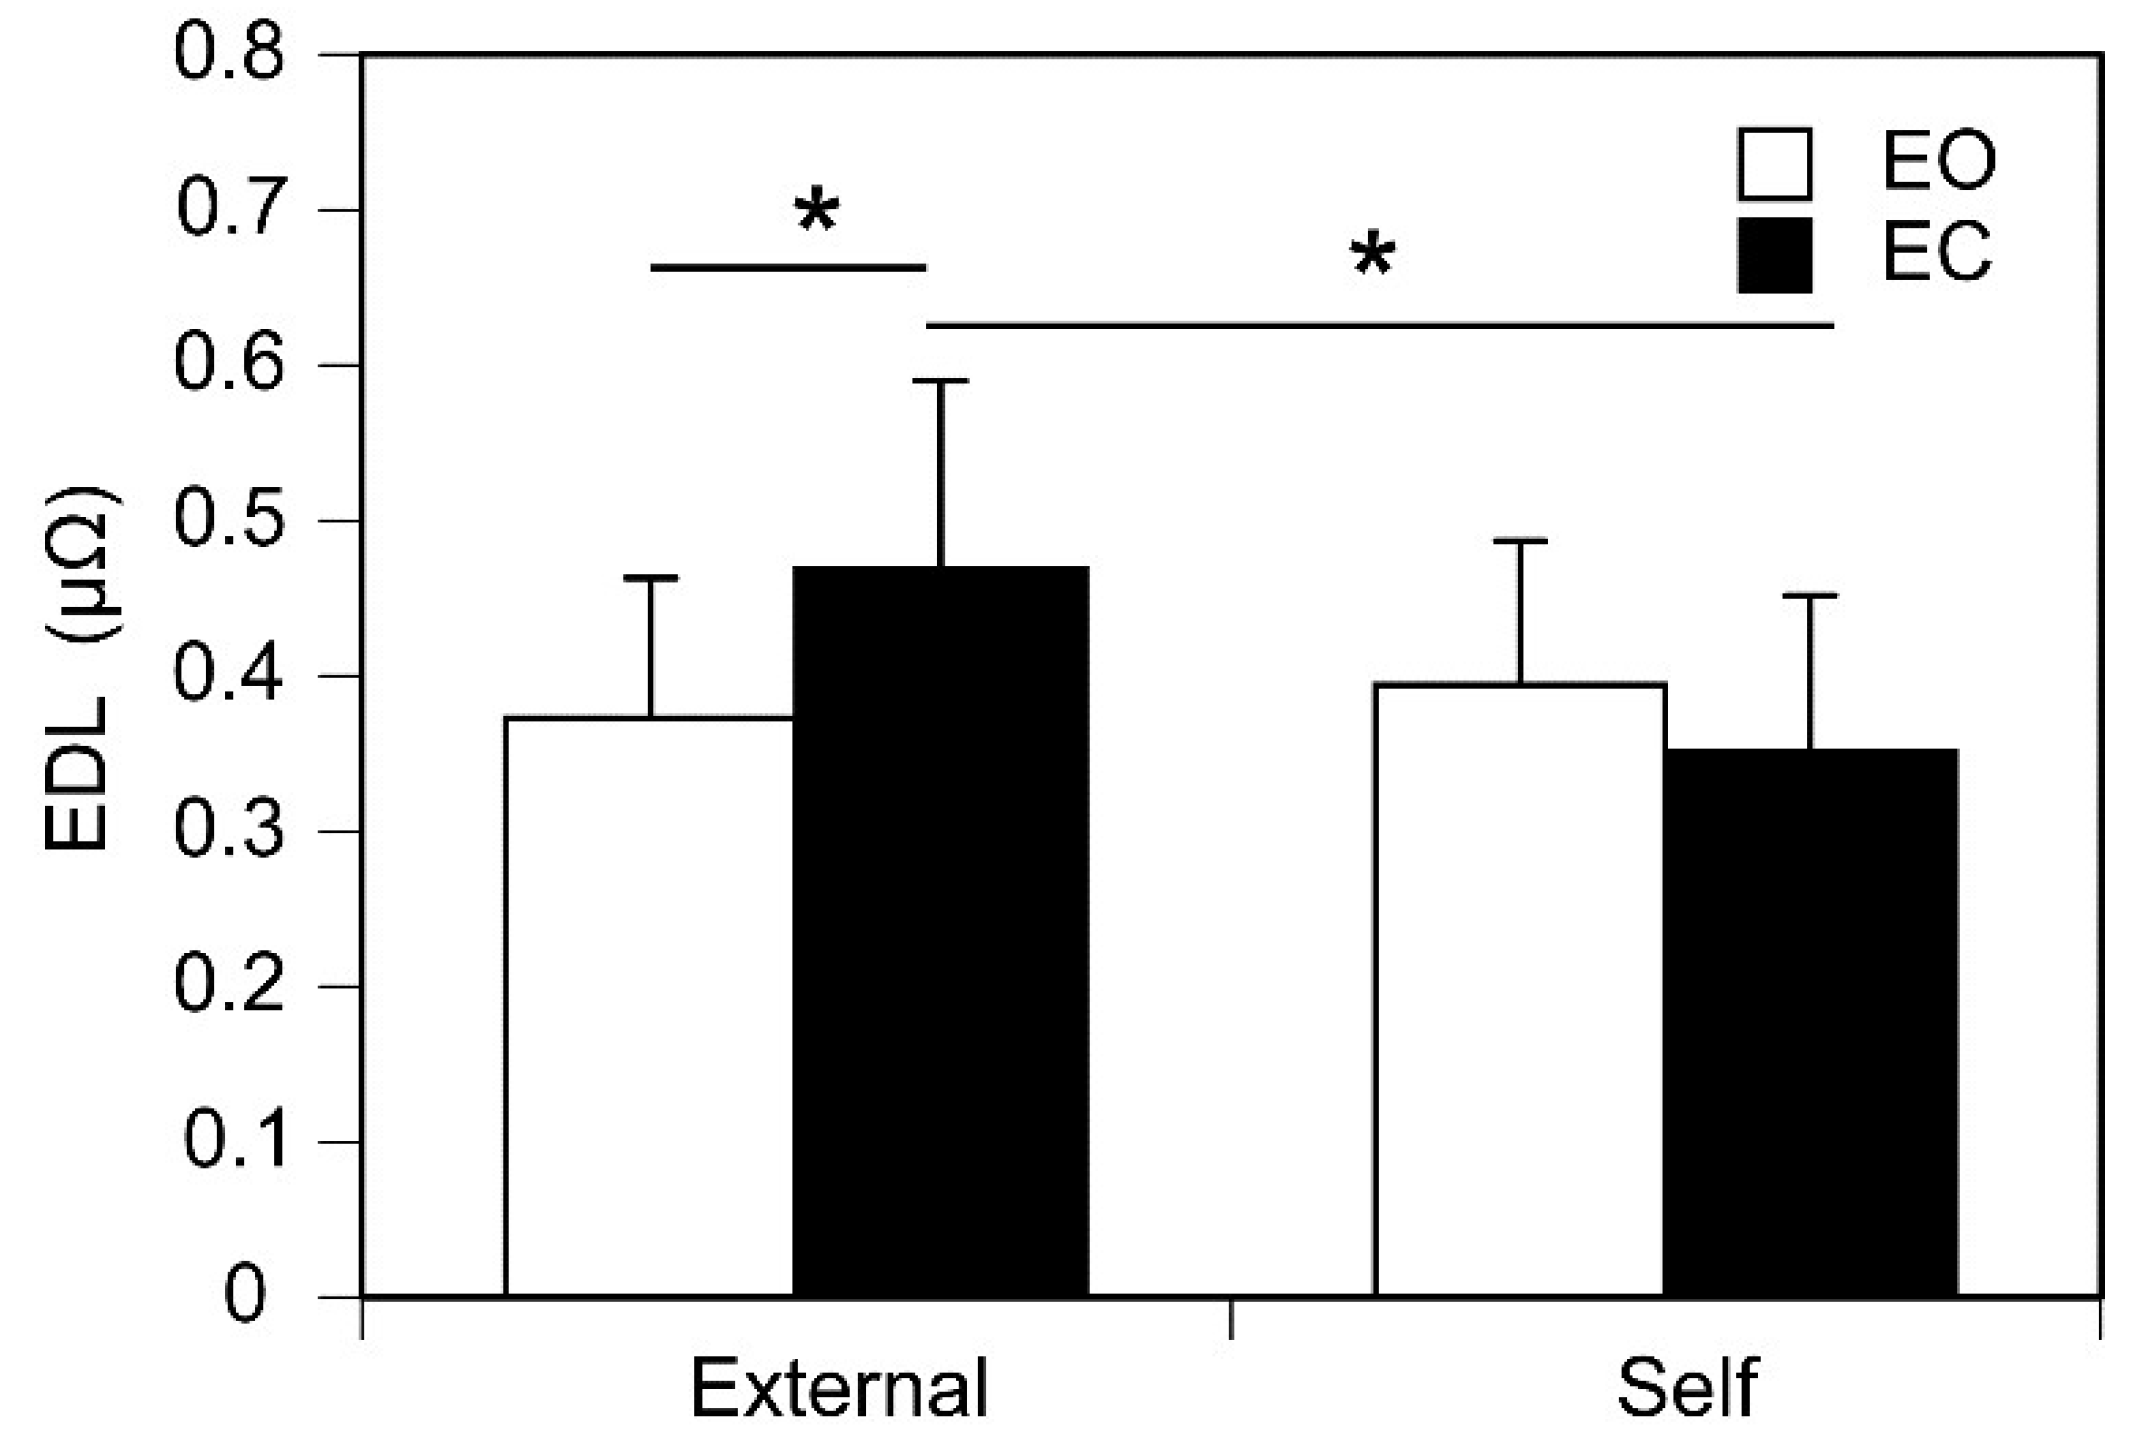
Pre-stimulus EDL immediately before the stimulus whose intensity is at the perceptual threshold is shown in Figure 5. There was no significant main effect of controller [F (1, 12) = 3.065, p = 0.106, η2p = 0.203] or vision [F (1, 12) = 0.737, p = 0.407, η2p = 0.058]. There was a significant interaction between the main effects [F (1, 12) = 5.688, p = 0.034, η2p = 0.322]. Test of simple main effect revealed that the pre-stimulus EDL at the perceptual threshold in the external trials was significantly greater than that in the self trials when the participant kept the eyes closed [F (1, 24) = 8.607, p < 0.05]. Another test of simple main effect revealed that the pre-stimulus EDL at the perceptual threshold with the eyes closed was significantly greater than that with the eyes open in the external trials [F (1, 24) = 5.109, p = 0.033].
4. Discussion
4.1. Tactile sensitivity
Tactile sensitivity was attenuated when the stimulus was self-triggered [15,16,17]. The motor command was present when the tactile stimulus was self-provided by active movement, but was absent when it was provided by someone else in those previous studies. Efference copy of the motor command enables humans to predict the somatosensation caused by the motor command execution [18,19,20,21,22]. Based on this view, efference copy of the motor command allows the participants to predict the tactile stimulus when they actively touch their body with their hand [2,14,17,23,24,25,26]. Thus, we hypothesized that the prediction of the stimulus via efference copy of the motor command is the cause of the tactile attenuation when the stimulus intensity is self-controlled (Hypothesis 1).
In the present study, the stimulus intensity at the perceptual threshold was significantly lower when the participant controlled the stimulus intensity compared to when it was controlled by someone else. This means that tactile sensitivity is greater when the stimulus intensity is self-controlled. The motor command was produced in both trials. Thus, efference copy of the motor command is not the cause of the increase in tactile sensitivity during the self-controlled tactile stimulation in the present study. Despite that, the present finding did not reject Hypothesis 1 that the attenuation of tactile sensitivity caused by self-triggered stimuli is due to the prediction of the stimulus via efference copy of the motor command.
The stimulus intensity at the perceptual threshold was lower when the time of the stimulus was predictable [27]. Based on this previous finding, we established Hypothesis 2 that time prediction of the tactile stimulus changes tactile sensitivity. However, the present finding did not support this hypothesis. The participants were familiar with the dial number controlled by them around the perceptual threshold, thanks to the preliminary practice conducted with the eyes open. This means that the participant could predict the time of the stimulus by viewing this number of the actual dial when the eyes were open. This finding was inconsistent with a previous finding that ticklishness was less when a participant viewed the hand of someone else that tickled the body of the participant [3]. The participant could view the actual dial only when they turned it, because they could view the dial turned by them. Despite that, there was no significant interaction between the controller and vision on the stimulus intensity at the perceptual threshold. Those indicate that time prediction via visual feedback of the number of the dial indicating stimulus intensity did not make a difference in tactile sensitivity between self-controlled and externally controlled stimuli. Thus, greater perceptual sensitivity to the self-controlled tactile stimuli is not likely explained by time prediction.
In the present study, an actual dial controlling the stimulus intensity was turned either by the participant or someone else. The velocity of turning the dial was not the same between those. On the one hand, the number of the dial at the perceptual threshold was lower in the dial held by the participant when the eyes were open. This means that the participant slowly turned the dial when the dial was visible. On the other hand, the number of the dial at the perceptual threshold was higher in the dial held by the participant when the eyes were closed. This means that the participant rapidly turned the dial when the dial was not visible. Taken together, the velocity of turning the dial by the participant depended on whether they kept the eyes open or not. This finding was not consistent with another finding that the stimulus intensity at the perceptual threshold was constantly lower when the dial was controlled by the participant, regardless of vision. This inconsistency indicates that the velocity of turning the dial is not the cause of the difference in tactile sensitivity between self-controlled and externally-controlled tactile stimuli.
As shown above, neither the prediction of the stimulus nor the velocity of turning the dial is the cause of the difference in tactile sensitivity between self-controlled and externally controlled tactile stimuli. The difference in the velocity of the dial between the self-controlled and externally-controlled tasks depended on vision. Despite that, the stimulus intensity at the perceptual threshold was lower when the participant controlled the stimuli intensity regardless of vision. The participant knew whether the stimulus intensity was controlled by them or by someone else before each trial began, because an experimenter instructed it before each trial. Accordingly, only the difference in the condition between the self-controlled and externally-controlled tactile stimuli is awareness of the self-control of the stimulus intensity. Therefore, the present finding is explained by the view that awareness of self-control over tactile stimulus intensity enhances tactile sensitivity.
4.2. Pre-stimulus EDL
In the present study, there was a significant interaction between the main effect of controller and that of vision on the pre-stimulus EDL. This indicates that both vision and the awareness of the self-control of the stimulus intensity interactively influence pre-stimulus EDL immediately before the tactile stimulus whose intensity is at the perceptual threshold. Test of simple main effect revealed that pre-stimulus EDL at the perceptual threshold of the self-controlled tactile stimuli was significantly lower than that at the perceptual threshold of the externally controlled tactile stimuli, especially in the eye-closure condition. Moreover, pre-stimulus EDL in the eyes-open condition was significantly lower than that in the eyes-closed condition especially when the intensity of the stimuli was externally controlled. Taken together, pre-stimulus EDL at the perceptual threshold was higher for the externally controlled tactile stimuli with the eyes closed.
Electrodermal activity is typically used for the measurement of arousal [36]. Electrodermal response by a startle probe varies with arousal level [37]. The threat-elicited electrodermal response was positively correlated with the amygdala response [38]. The amygdala is the area that responds to the fear [39]. More importantly, EDL was increased by cognitive stress [32]. Based on this, the present finding indicates that cognitive stress is greater when the participant is aware of the condition in which someone else controls the stimulus intensity and when they can not obtain information regarding the stimulus intensity via vision.
On the one hand, when the participant controls the stimulus intensity by them, they can predict the moment at the first perception of the tactile stimulus via efference copy of the motor command for turning the dial. On the other hand, the participant awares that they can not predict it via efference copy when stimulus intensity is externally controlled. When the eyes are closed, the participant can not predict the moment at the first perception of the tactile stimulus via viewing the number of the dial indicating the stimulus intensity. Thus, the present finding is explained by the view that cognitive stress is greater when timing at the first perception of the tactile stimulus is difficult to predict.
5. Conclusions
The stimulus intensity at the perceptual threshold, when controlled by the participant, was significantly lower than when controlled by someone else, regardless of vision. This indicates that awareness of the self-control of the tactile stimulus intensity enhances tactile sensitivity. The electrodermal level immediately preceding the stimulus at the perceptual threshold was significantly lower when the participant controlled the stimulus intensity compared to when it was controlled by someone else, with the participant keeping their eyes closed. The electrodermal level immediately preceding the stimulus at the perceptual threshold was significantly greater when the participant controlled the stimulus intensity compared to when it was controlled by someone else, with the participant's eyes remaining closed throughout. These findings can be explained by the idea that cognitive stress is greater when timing at the first perception of the tactile stimulus is difficult to predict.
Author Contributions
Conceptualization, K.H.; methodology, K.H.; validation, K.H.; formal analysis, H.O.; investigation, H.O., S.F, H.K., T.K., H.G., M.F. K.H.; data curation, H.O., K.H.; writing—original draft preparation, H.O.; writing—review and editing, K.H.; visualization, K.H.; supervision, K.H.; project administration, K.H.; All authors have read and agreed to the published version of the manuscript.
Funding
This research received no external funding.
Institutional Review Board Statement
The study was conducted in accordance with the Declaration of Helsinki, and approved by the Ethics Committee of Osaka Metropolitan University (2023-115).
Informed Consent Statement
Informed consent was obtained from all subjects involved in the study. Written informed consent has been obtained from the participants to publish this paper.
Data Availability Statement
Data is unavailable due to privacy restriction.
Acknowledgments
We sincerely appreciate the technical support provided by Mr. Tsumura at Osaka Health Science University.
Conflicts of Interest
The authors declare no conflicts of interest. The funders had no role in the design of the study; in the collection, analyses, or interpretation of data; in the writing of the manuscript; or in the decision to publish the results.
References
- Baken, B. C.; Nieuwenhuijzen, P. H.; Bastiaanse, C. M.; Dietz, V.; Duysens, J. Cutaneous reflexes evoked during human walking are reduced when self-induced. J. Physiol. 2006, 570 (Pt 1), 113–124. [CrossRef]
- Weiskrantz, L.; Elliott, J.; Darlington, C. Preliminary observations on tickling oneself. Nature. 1971 230(5296), 598-599.
- Claxton, G. Why can't we tickle ourselves? Percept. Mot. Skills. 1975, 41(1), 335–338. 10.2466/pms.1975.41.1.335.
- Blakemore, S.-J. , Wolpert, D. M., & Frith, C. D. (1998). Central cancellation of self-produced tickle sensation. *Nature Neuroscience, 1*(7), 635–640. [CrossRef]
- Angel, R. W.; Malenka, R. C. Velocity-dependent suppression of cutaneous sensitivity during movement. Exp. Neurol. 1982, 77(2), 266-274. [CrossRef]
- Chapman, C. E.; Bushnell, M. C.; Miron, D.; Duncan, G. H.; Lund, J. P. Sensory perception during movement in man. Exp. Brain Res. 1987, 68, 516–524. [Google Scholar] [CrossRef]
- Post, L. J.; Zompa, I. C.; Chapman, C. E. Perception of vibrotactile stimuli during motor activity in human subjects. Exp. Brain Res. 1994, 100, 107–120. [Google Scholar] [CrossRef] [PubMed]
- Williams, S. R.; Chapman, C. E. Time course and magnitude of movement-related gating of tactile detection in humans. II. Effects of stimulus intensity. J. Neurophysiol. 2000, 84(2), 863-875. [CrossRef]
- Colino, F. L.; Binsted, G. Time course of tactile gating in a reach-to-grasp and lift task. J. Mot. Behav. 2016, 48(5), 390-400. [CrossRef]
- Gertz, H.; Voudouris, D.; Fiehler, K. Reach-relevant somatosensory signals modulate tactile suppression. J. Neurophysiol. 2017, 117(6), 2262-2268. [CrossRef]
- Voudouris, D.; Fiehler, K. Enhancement and suppression of tactile signals during reaching. J. Exp. Psychol. Hum. Percept. Perform. 2017, 43(6), 1238. [CrossRef]
- Fraser, L. E.; Fiehler, K. redicted reach consequences drive time course of tactile suppression. Behav. Brain Res. 2018, 350, 54–64. [Google Scholar] [CrossRef] [PubMed]
- Manzone, D. M.; Inglis, J. T.; Franks, I. M.; Chua, R. Relevance-dependent modulation of tactile suppression during active, passive and pantomime reach-to-grasp movements. Behav Brain Res. 2018, 339, 93–105. [Google Scholar] [CrossRef] [PubMed]
- Voudouris, D.; Broda, M. D.; Fiehler, K. Anticipatory grasping control modulates somatosensory perception. J. Vis. 2019, 19(5): 4-4. [CrossRef]
- Blakemore, S. J.; Frith, C. D.; Wolpert, D. M. Spatio-temporal prediction modulates the perception of self-produced stimuli. J. Cogn. Neurosci. 1999, 11(5), 551–559. [CrossRef]
- Bays, P. M.; Wolpert, D. M.; Flanagan, J. R. Perception of the consequences of self-action is temporally tuned and event driven. Curr. Biol. 2005, CB, 15(12), 1125–1128. [CrossRef]
- Kilteni, K.; Engeler, P.; Ehrsson, H. H. Efference copy is necessary for the attenuation of self-generated touch. iScience. 2020, 23(2), 100843. [CrossRef]
- Wolpert, D. M.; Miall, R. C.; Kawato, M. Internal models in the cerebellum. Trends Cogn. Sci. 1998, 2(9), 338–347. [CrossRef]
- Wolpert, D. M.; Ghahramani, Z. Computational principles of movement neuroscience. Nat. Neurosci. 2000, 3 Suppl, 1212–1217. [CrossRef]
- Wolpert, D. M.; Flanagan, J. R. Motor prediction. Curr. Biol. 2001, CB, 11(18), R729–R732. [CrossRef]
- Davidson, P. R. , & Wolpert, D. M. (2005). Widespread access to predictive models in the motor system: A short review. Journal of Neural Engineering, 2(3), S313–S319. [CrossRef]
- Franklin, D. W., & Wolpert, D. M. (2011). Computational mechanisms of sensorimotor control. Neuron. 72(3), 425–442. [CrossRef]
- Kilteni, K., & Ehrsson, H. H. (2022). Predictive attenuation of touch and tactile gating are distinct perceptual phenomena. iScience. 25(4), 104077. [CrossRef]
- Bays, P. M. , Flanagan, J. R., & Wolpert, D. M. (2006). Attenuation of self-generated tactile sensations is predictive, not postdictive. *PLoS Biology, 4*(2), e28. [CrossRef]
- Bays, P. M. , & Wolpert, D. M. (2008). Predictive attenuation in the perception of touch. In P. Haggard, Y. Rossetti, & M. Kawato (Eds.), Attention and performance XXII: Sensorimotor foundations of higher cognition (pp. 339-358). Oxford University Press. [CrossRef]
- Blakemore, S.-J. , Wolpert, D. M., & Frith, C. D. (2000). Why can't you tickle yourself? *NeuroReport, 11*(11), R11–R16. [CrossRef]
- Kunimura, H.; Oda, H.; Kawasaki, T.; Gao, H.; Fukuda, S.; Hiraoka, K. Effect of spatial and temporal prediction on tactile sensitivity. Brain Sci. 2024, 14(8), 749. 10.3390/brainsci14080749.
- Edelberg, R. Electrodermal mechanisms: A critique of the two-effector hypothesis and a proposed replacement. Progress in Electrodermal Research. 1993, 7–29. [Google Scholar]
- Kreibig, S. D.; Wilhelm, F. H.; Roth, W. T.; Gross, J. J. Cardiovascular, electrodermal, and respiratory response patterns to fear- and sadness-inducing films. Psychophysiology. 2007, 44(5), 787–806. [CrossRef]
- Reinhardt, T.; Schmahl, C.; Wüst, S.; Bohus, M. Salivary cortisol, heart rate, electrodermal activity and subjective stress responses to the Mannheim Multicomponent Stress Test (MMST). Psychiatry Res. 2012, 198(1), 106–111. [CrossRef]
- Posada-Quintero, H. F.; Florian, J. P.; Orjuela-Cañón, A. D.; Chon, K. H. Highly sensitive index of sympathetic activity based on time-frequency spectral analysis of electrodermal activity. Am J Physiol Regul Integr Comp Physiol. 2016, 311, R582–R591. [Google Scholar] [CrossRef] [PubMed]
- Posada-Quintero, H. F.; Florian, J. P.; Orjuela-Cañón, A. D.; Chon, K. H. Electrodermal activity is sensitive to cognitive stress under water. Front Physiol. 2018, 8, 1128. [Google Scholar] [CrossRef] [PubMed]
- Kawasaki, T.; Oda, H.; Sawaguchi, Y.; Kunimura, H.; Hiraoka, K. Sympathetic response to postural perturbation in stance. Front Hum Neurosci. 2021, 15, 763582. [Google Scholar] [CrossRef] [PubMed]
- Oldfield, R. C. The assessment and analysis of handedness: the Edinburgh inventory. Neuropsychologia. 1971, 9(1), 97-113. [CrossRef]
- Ehrenstein, W. H.; Ehrenstein, A. Psychophysical Methods. In Modern Techniques in Neuroscience Research (pp. 1211-1241). 1999.
- Tronstad, C.; Amini, M.; Bach, D. R.; Martinsen, Ø. G. Current trends and opportunities in the methodology of electrodermal activity measurement. Physiol. Meas., 2022, 43(2), 10.1088/1361-6579/ac5007. [CrossRef]
- Witvliet, C. V.; Vrana, S. R. Psychophysiological responses as indices of affective dimensions. Psychophysiol. 1995, 32(5), 436–443. [CrossRef]
- Wood, K. H.; Ver Hoef, L. W.; Knight, D. C. The amygdala mediates the emotional modulation of threat-elicited skin conductance response. Emotion (Washington, D.C.). 2014, 14(4), 693–700. [CrossRef]
- LeDoux, J. The amygdala. Curr. Biol., 2007, CB, 17(20), R868–R874. [CrossRef]
Figure 3.
The dial number at the perceptual threshold. Bars represent the mean and error bars represent the standard error of mean. Each asterisk indicates a significant difference in the intensity between the controllers (p < 0.05). EO, the eyes open; EC, the eyes closed.
Figure 3.
The dial number at the perceptual threshold. Bars represent the mean and error bars represent the standard error of mean. Each asterisk indicates a significant difference in the intensity between the controllers (p < 0.05). EO, the eyes open; EC, the eyes closed.
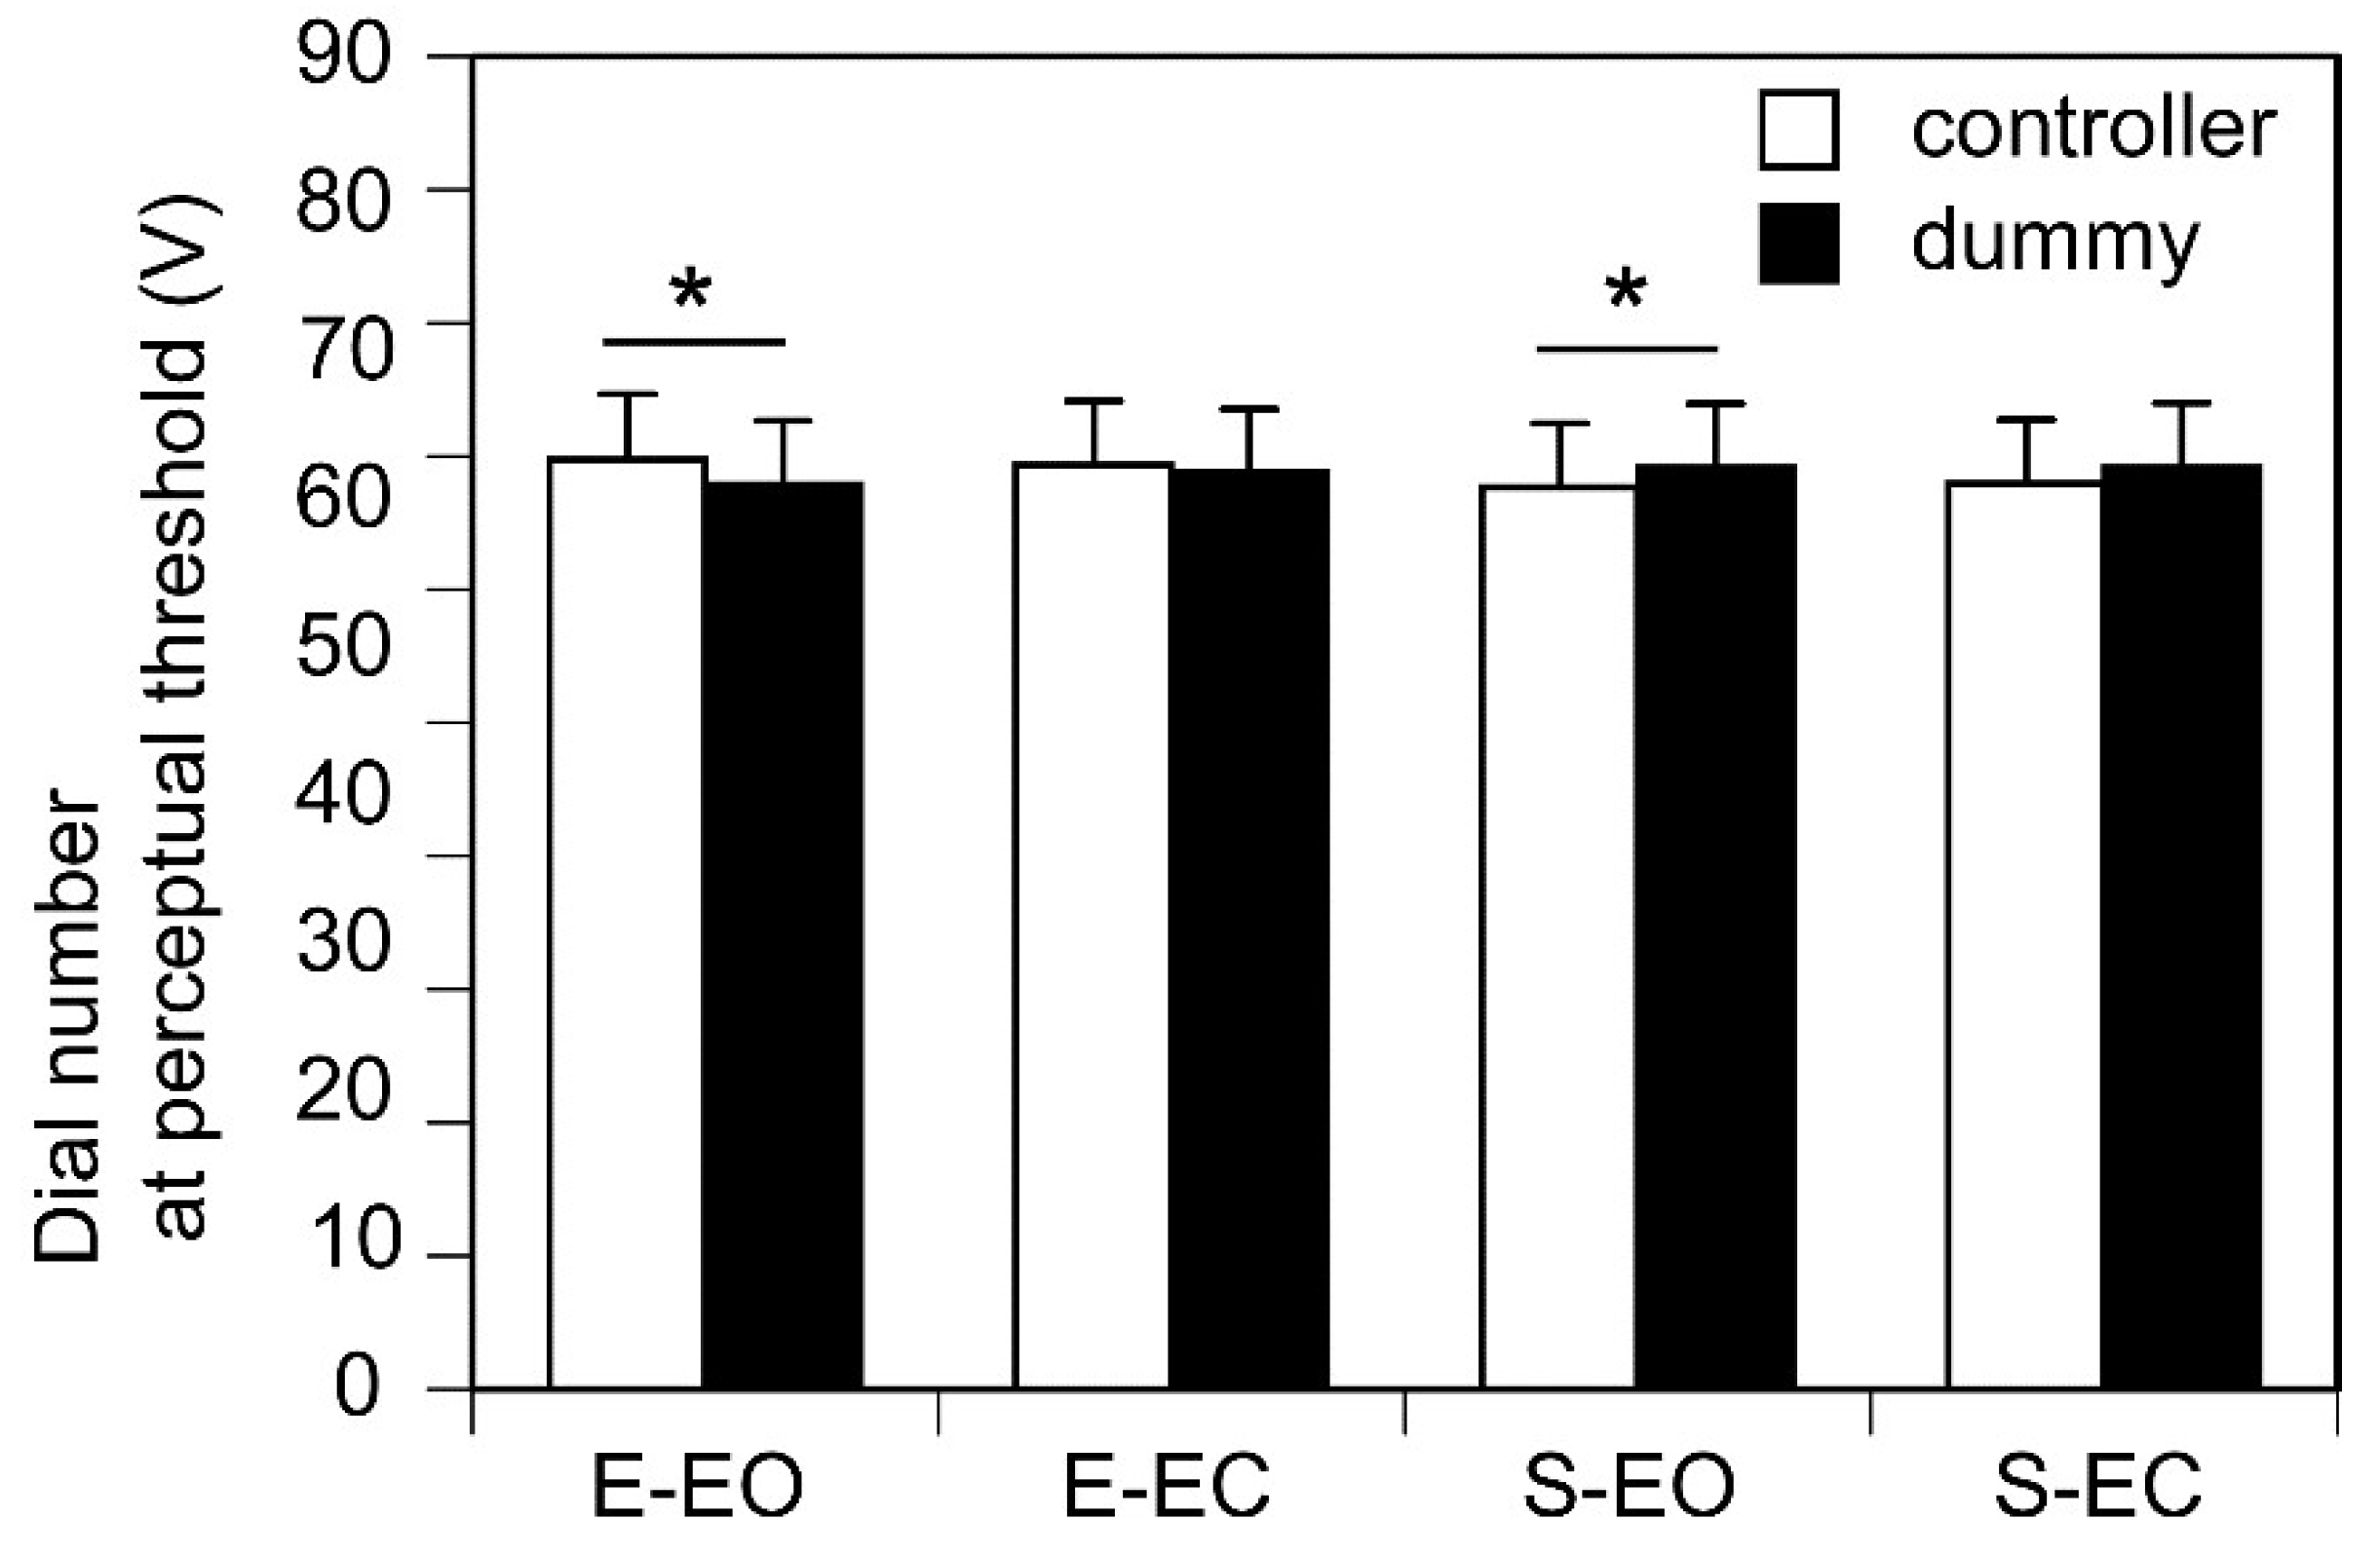
Figure 4.
The stimulus intensity at the perceptual threshold expressed as z-score of residuals. Bars represent the mean and error bars represent the standard error of mean. An asterisk indicates a significant main effect (p < 0.05). EO, the eyes open; EC, the eyes closed.
Figure 4.
The stimulus intensity at the perceptual threshold expressed as z-score of residuals. Bars represent the mean and error bars represent the standard error of mean. An asterisk indicates a significant main effect (p < 0.05). EO, the eyes open; EC, the eyes closed.
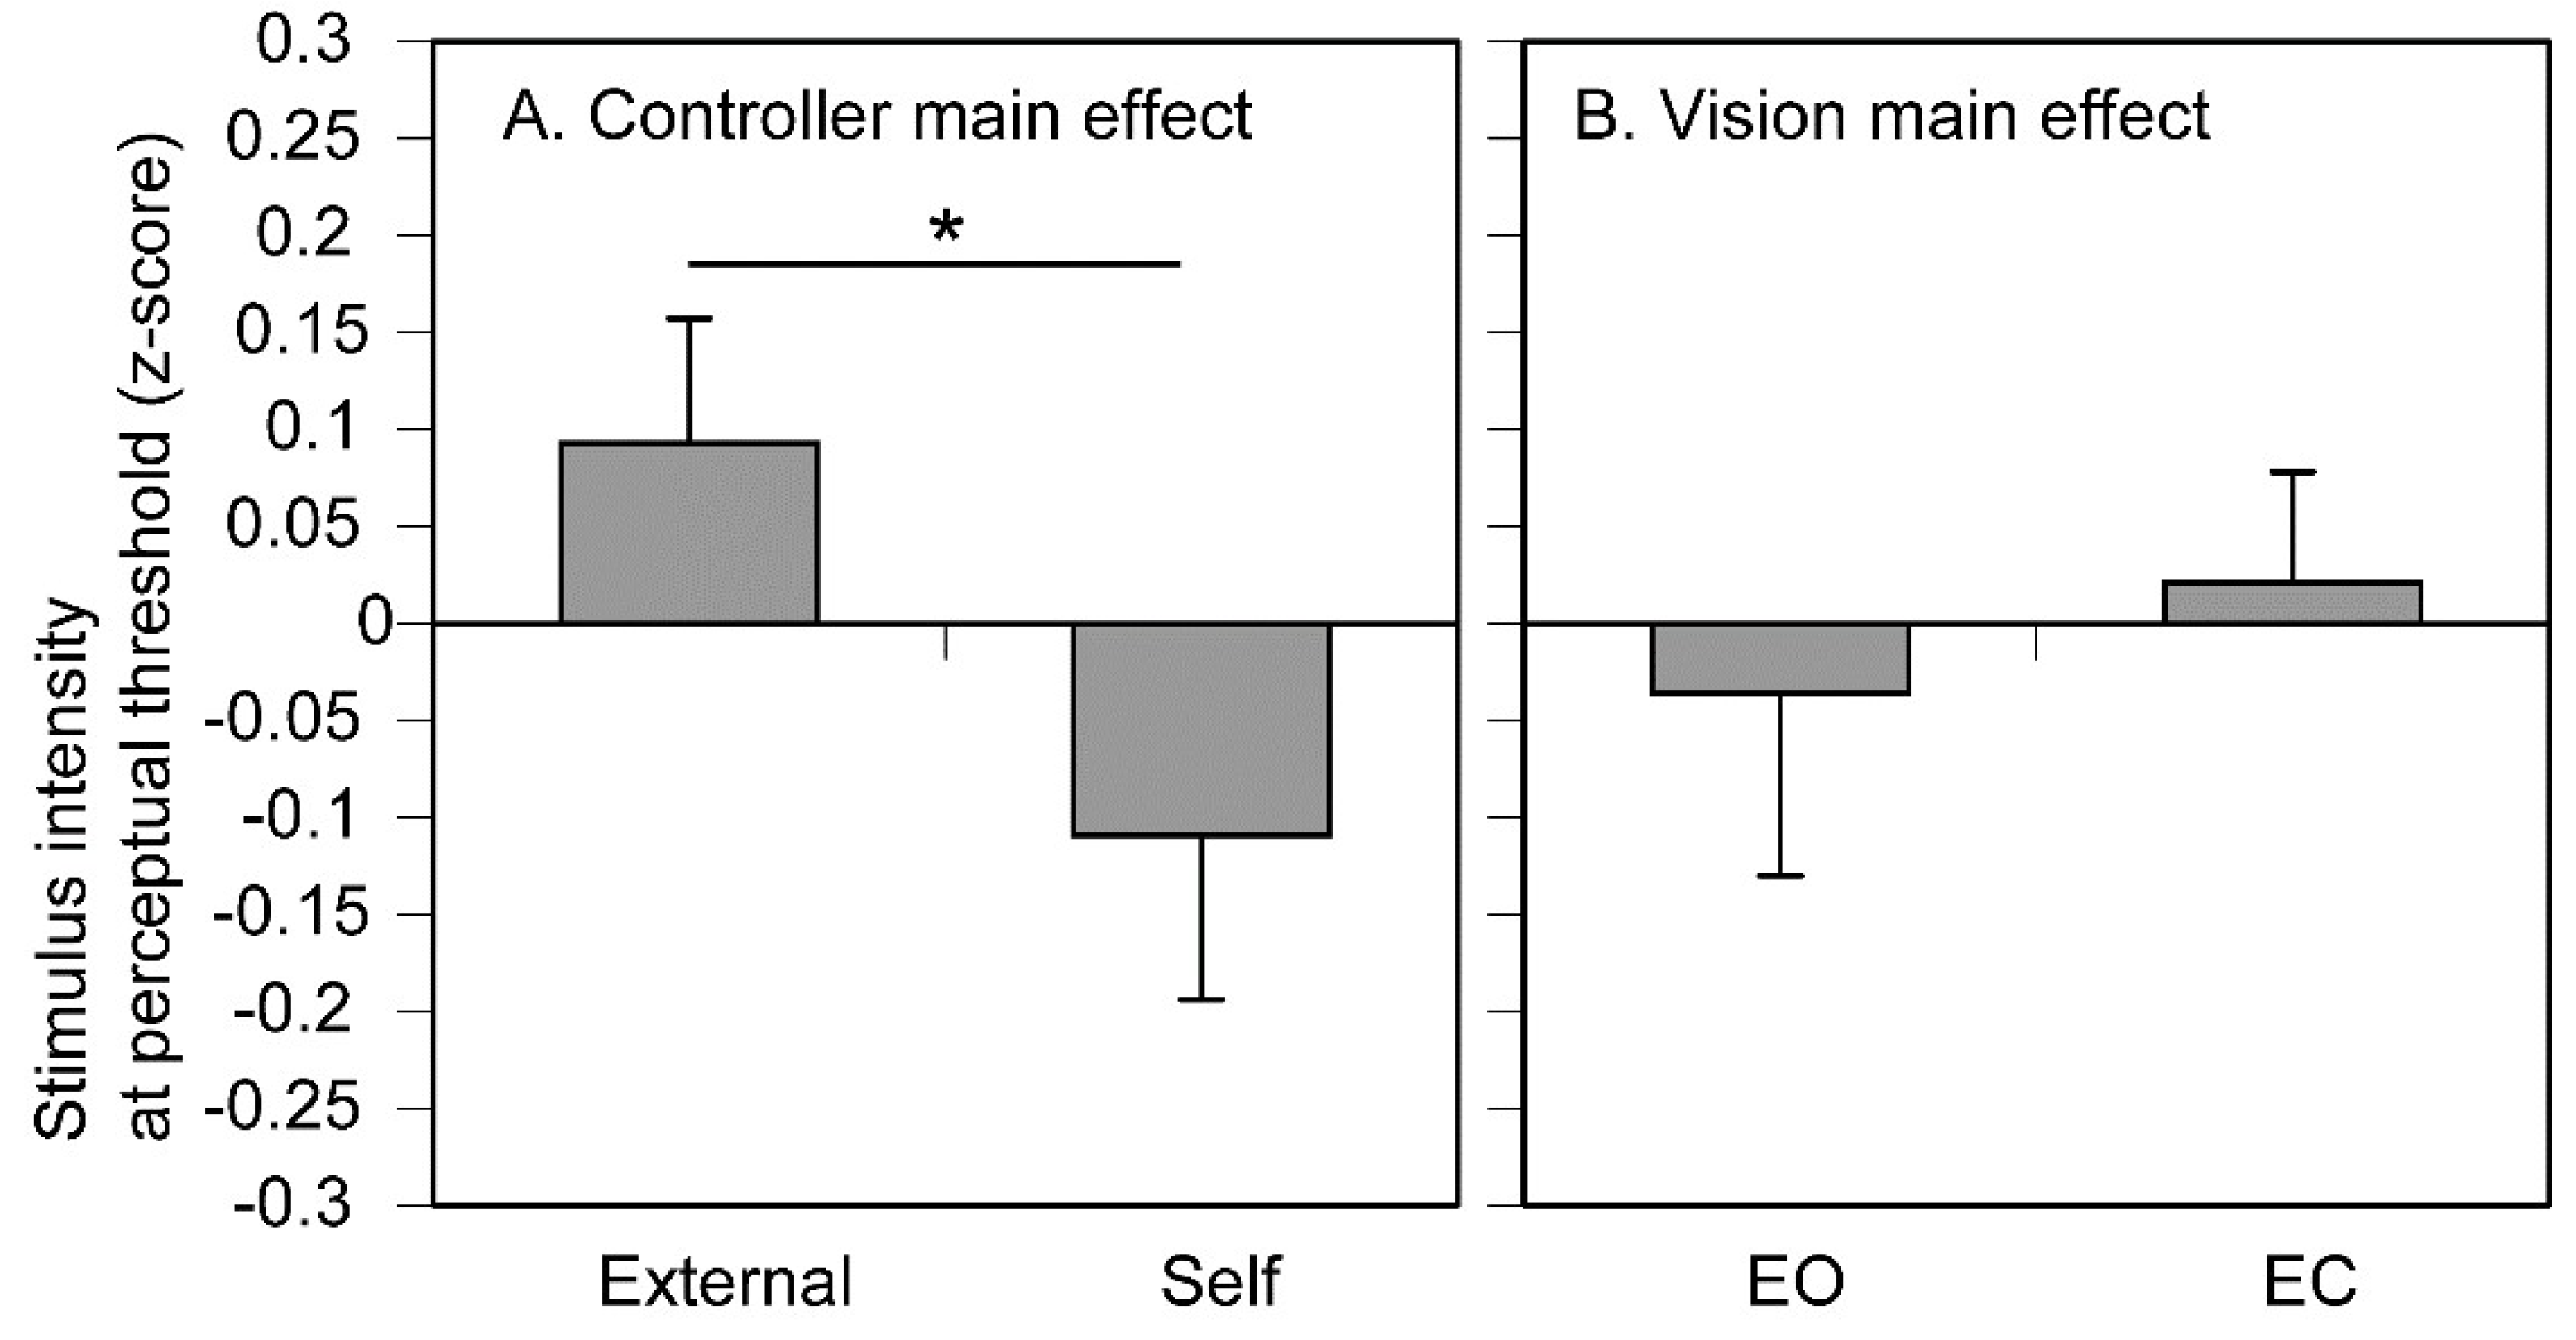
Figure 5.
Pre-stimulus EDL immediately before the tactile stimulus at the perceptual threshold. Bars represent the mean and error bars represent the standard error of mean. Asterisks indicate significant simple main effects (p < 0.05). EDL, electrodermal level; EO, the eyes open; EC, the eyes closed.
Disclaimer/Publisher’s Note: The statements, opinions and data contained in all publications are solely those of the individual author(s) and contributor(s) and not of MDPI and/or the editor(s). MDPI and/or the editor(s) disclaim responsibility for any injury to people or property resulting from any ideas, methods, instructions or products referred to in the content. |
© 2025 by the authors. Licensee MDPI, Basel, Switzerland. This article is an open access article distributed under the terms and conditions of the Creative Commons Attribution (CC BY) license (https://creativecommons.org/licenses/by/4.0/).
Copyright: This open access article is published under a Creative Commons CC BY 4.0 license, which permit the free download, distribution, and reuse, provided that the author and preprint are cited in any reuse.


