Submitted:
20 December 2024
Posted:
23 December 2024
You are already at the latest version
Abstract
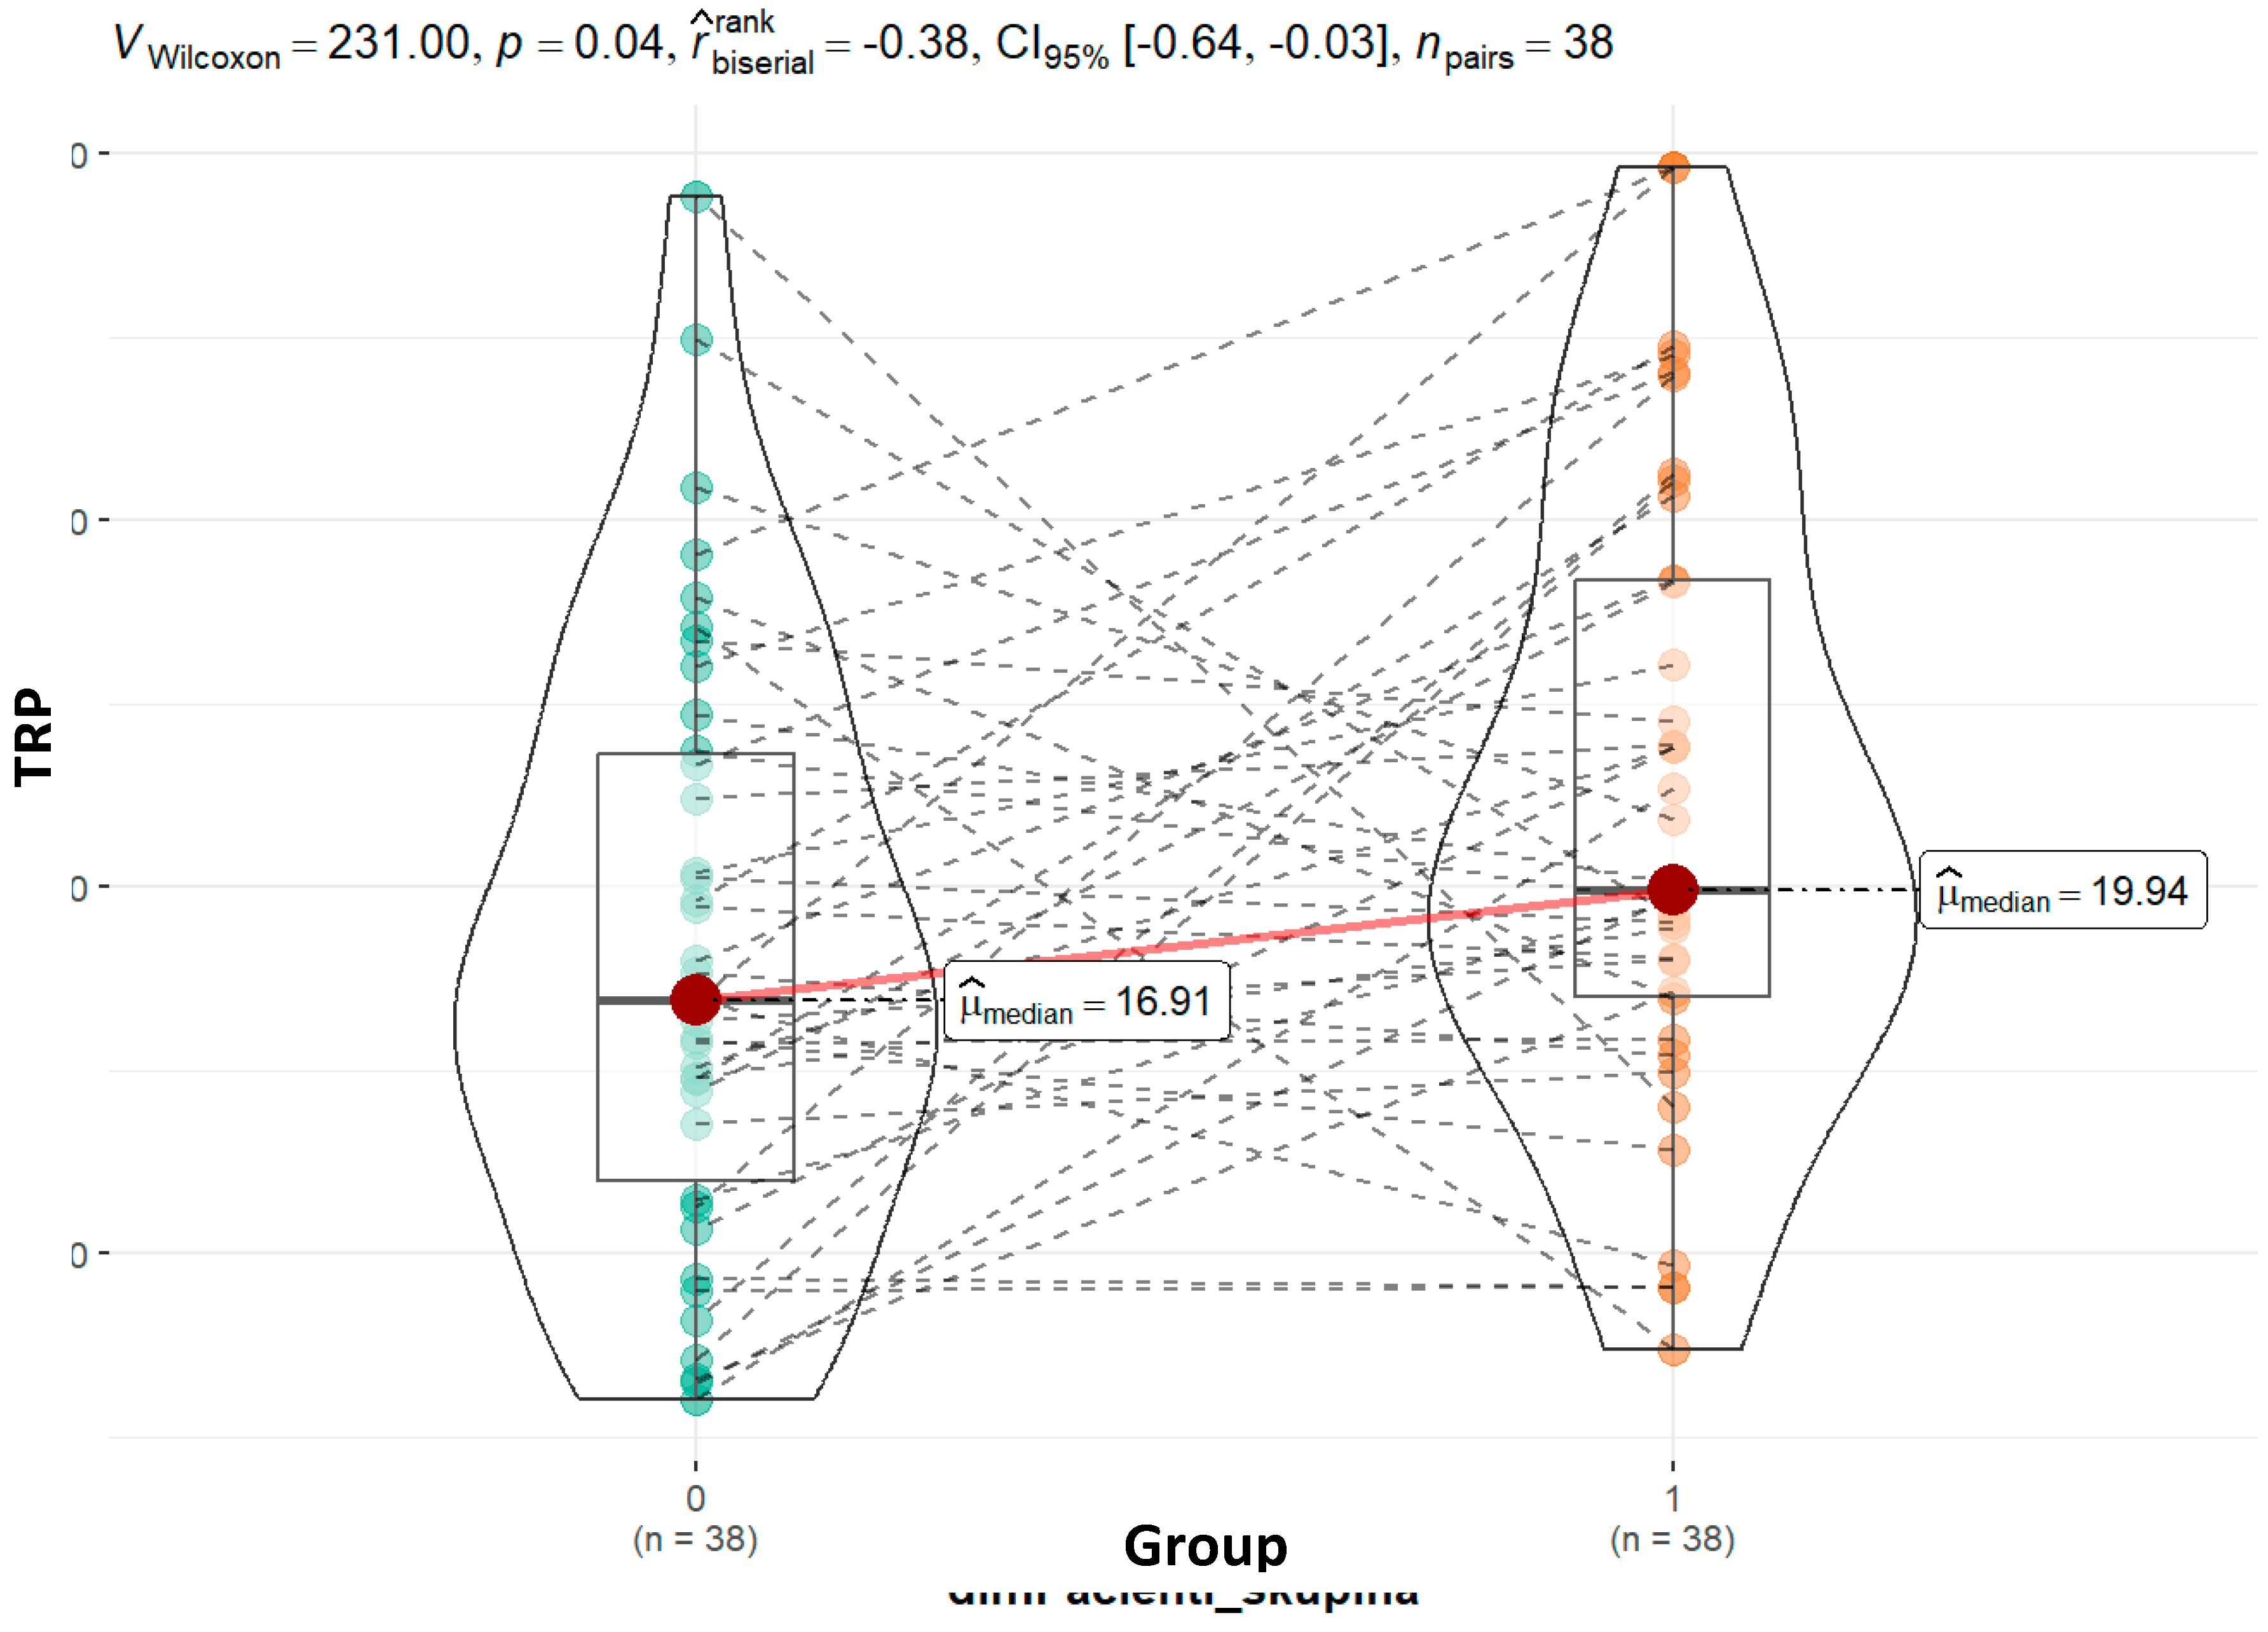
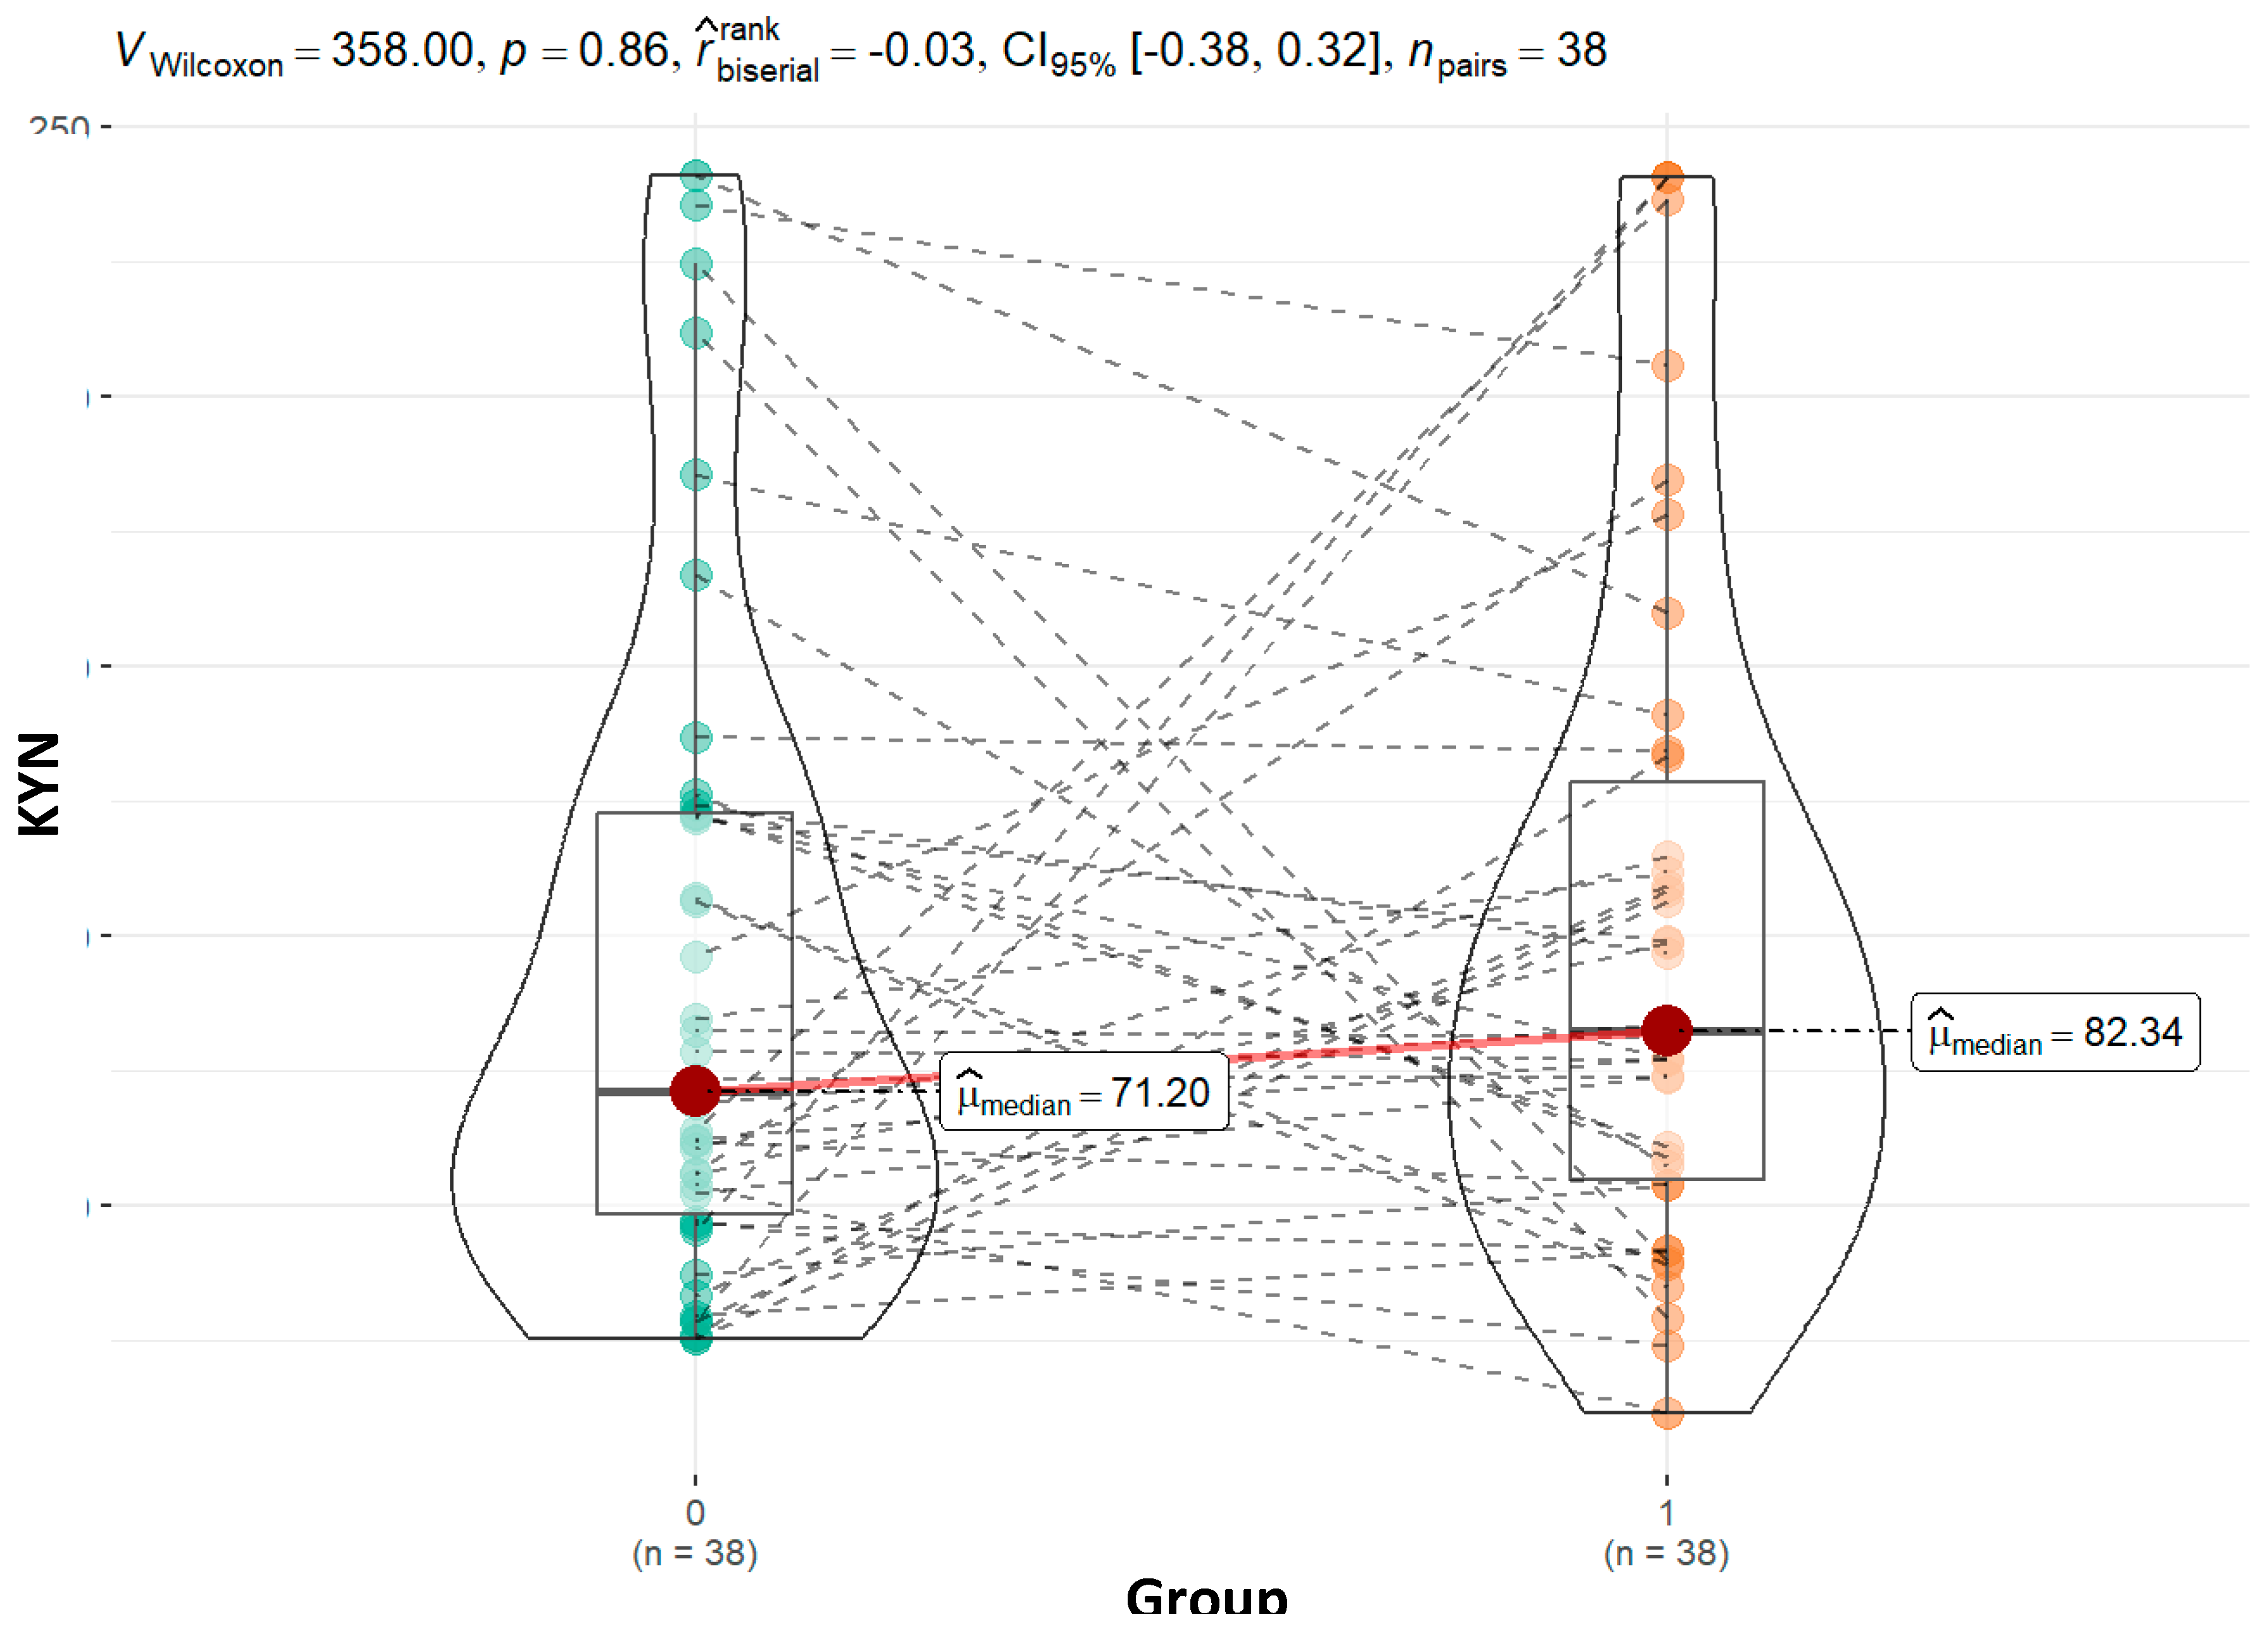
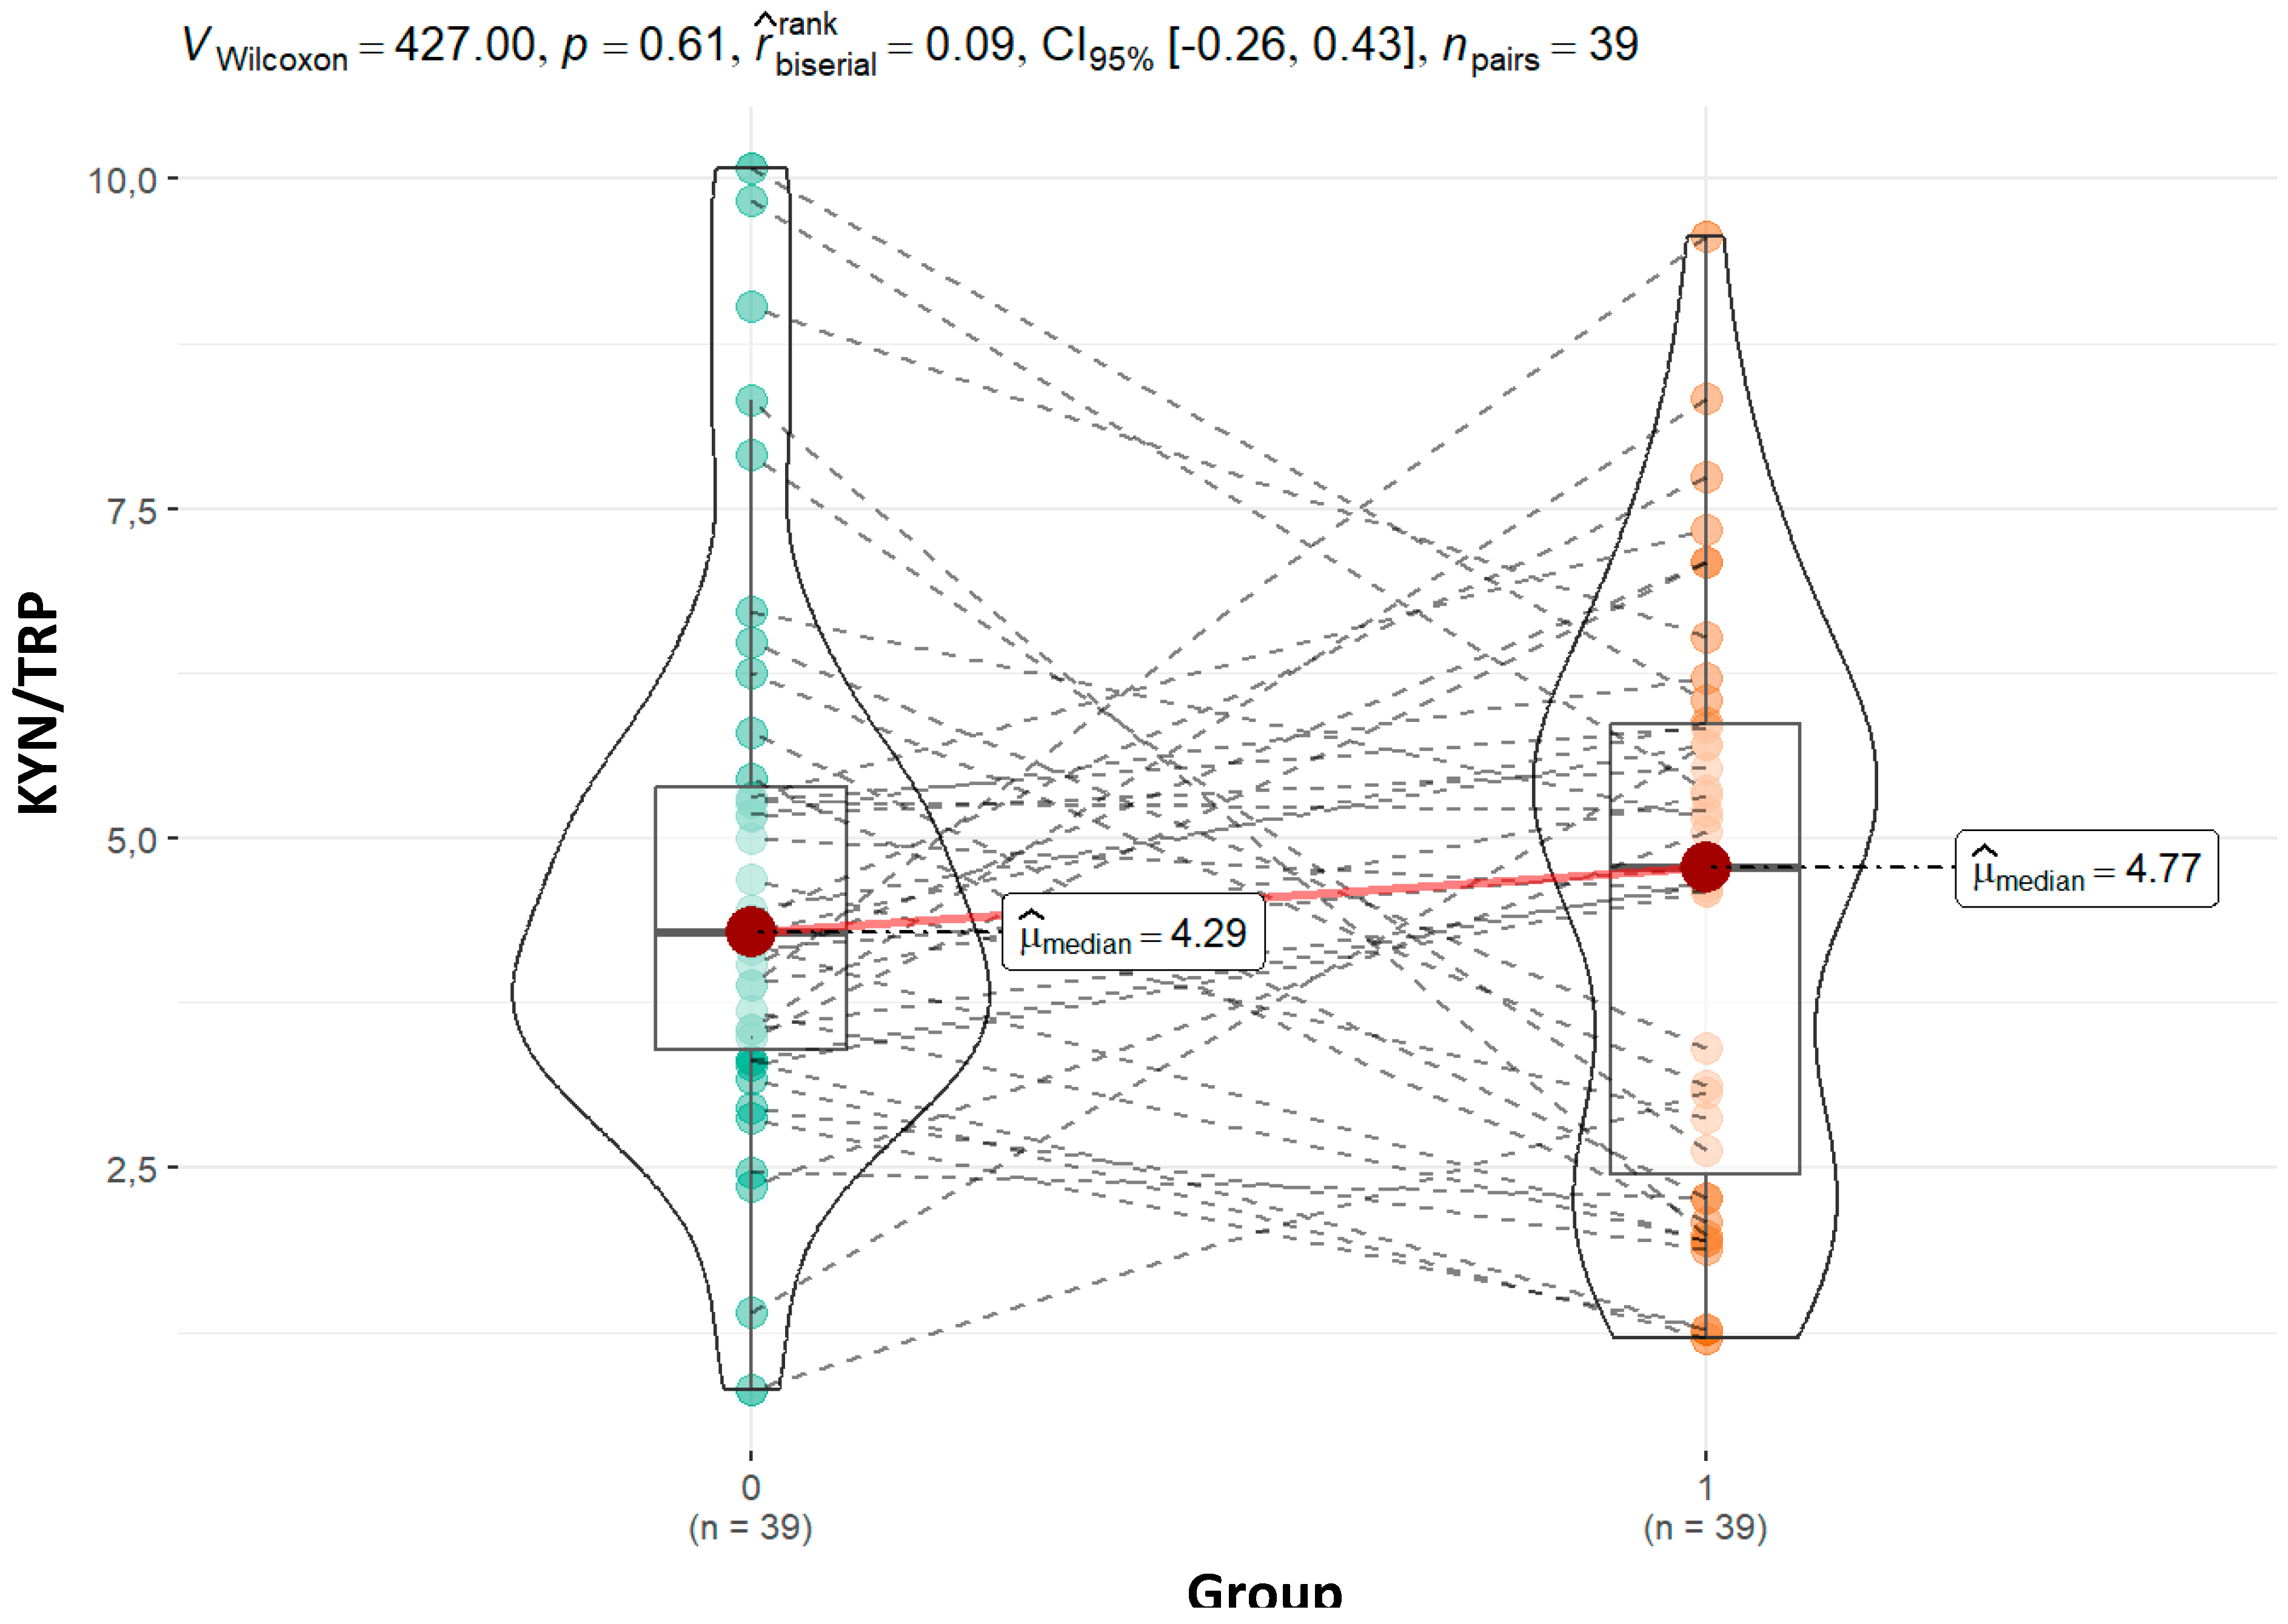
Autism spectrum disorder (ASD) has been associated with disruptions in tryptophan (TRP) metabolism, affecting the production of key neuroactive metabolites. Investigating these metabolic pathways could yield valuable biomarkers for ASD severity and progression. We included 44 children with ASD and 44 healthy controls, members of the same family. ASD group average age was 10.7 years while control group was 9.4 years. Urinary tryptophan metabolites were quantified via liquid chromatography - mass spectrometry operating multiple reaction monitoring (MRM). Urinary creatinine was analysed on an Advia 2400 analyser using the Jaffe reaction. Statistical comparisons were made between ASD subgroups based on CARS scores. Our study's findings indicate that children with ASD have higher tryptophan concentrations (19.94 vs. 16.91; p = 0.04) than their siblings. Kynurenine was found at higher levels in children with ASD compared to controls (82.34 vs. 71.20; p=0.86), although this difference was not statistically significant. ASD group showed trends of higher KYN/TRP ratios and altered TRP/IAA and TRP/5-HIAA ratios, correlating with symptom severity. Although the numbers of the two groups were different, our findings suggest that mild and severe illnesses involve separate mechanisms. However, further comprehensive studies are needed to validate these ratios as diagnostic tools for ASD.
Keywords:
Introduction
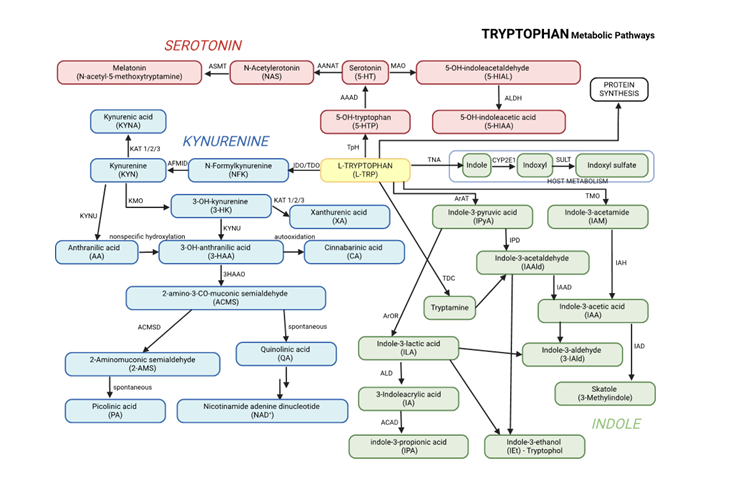
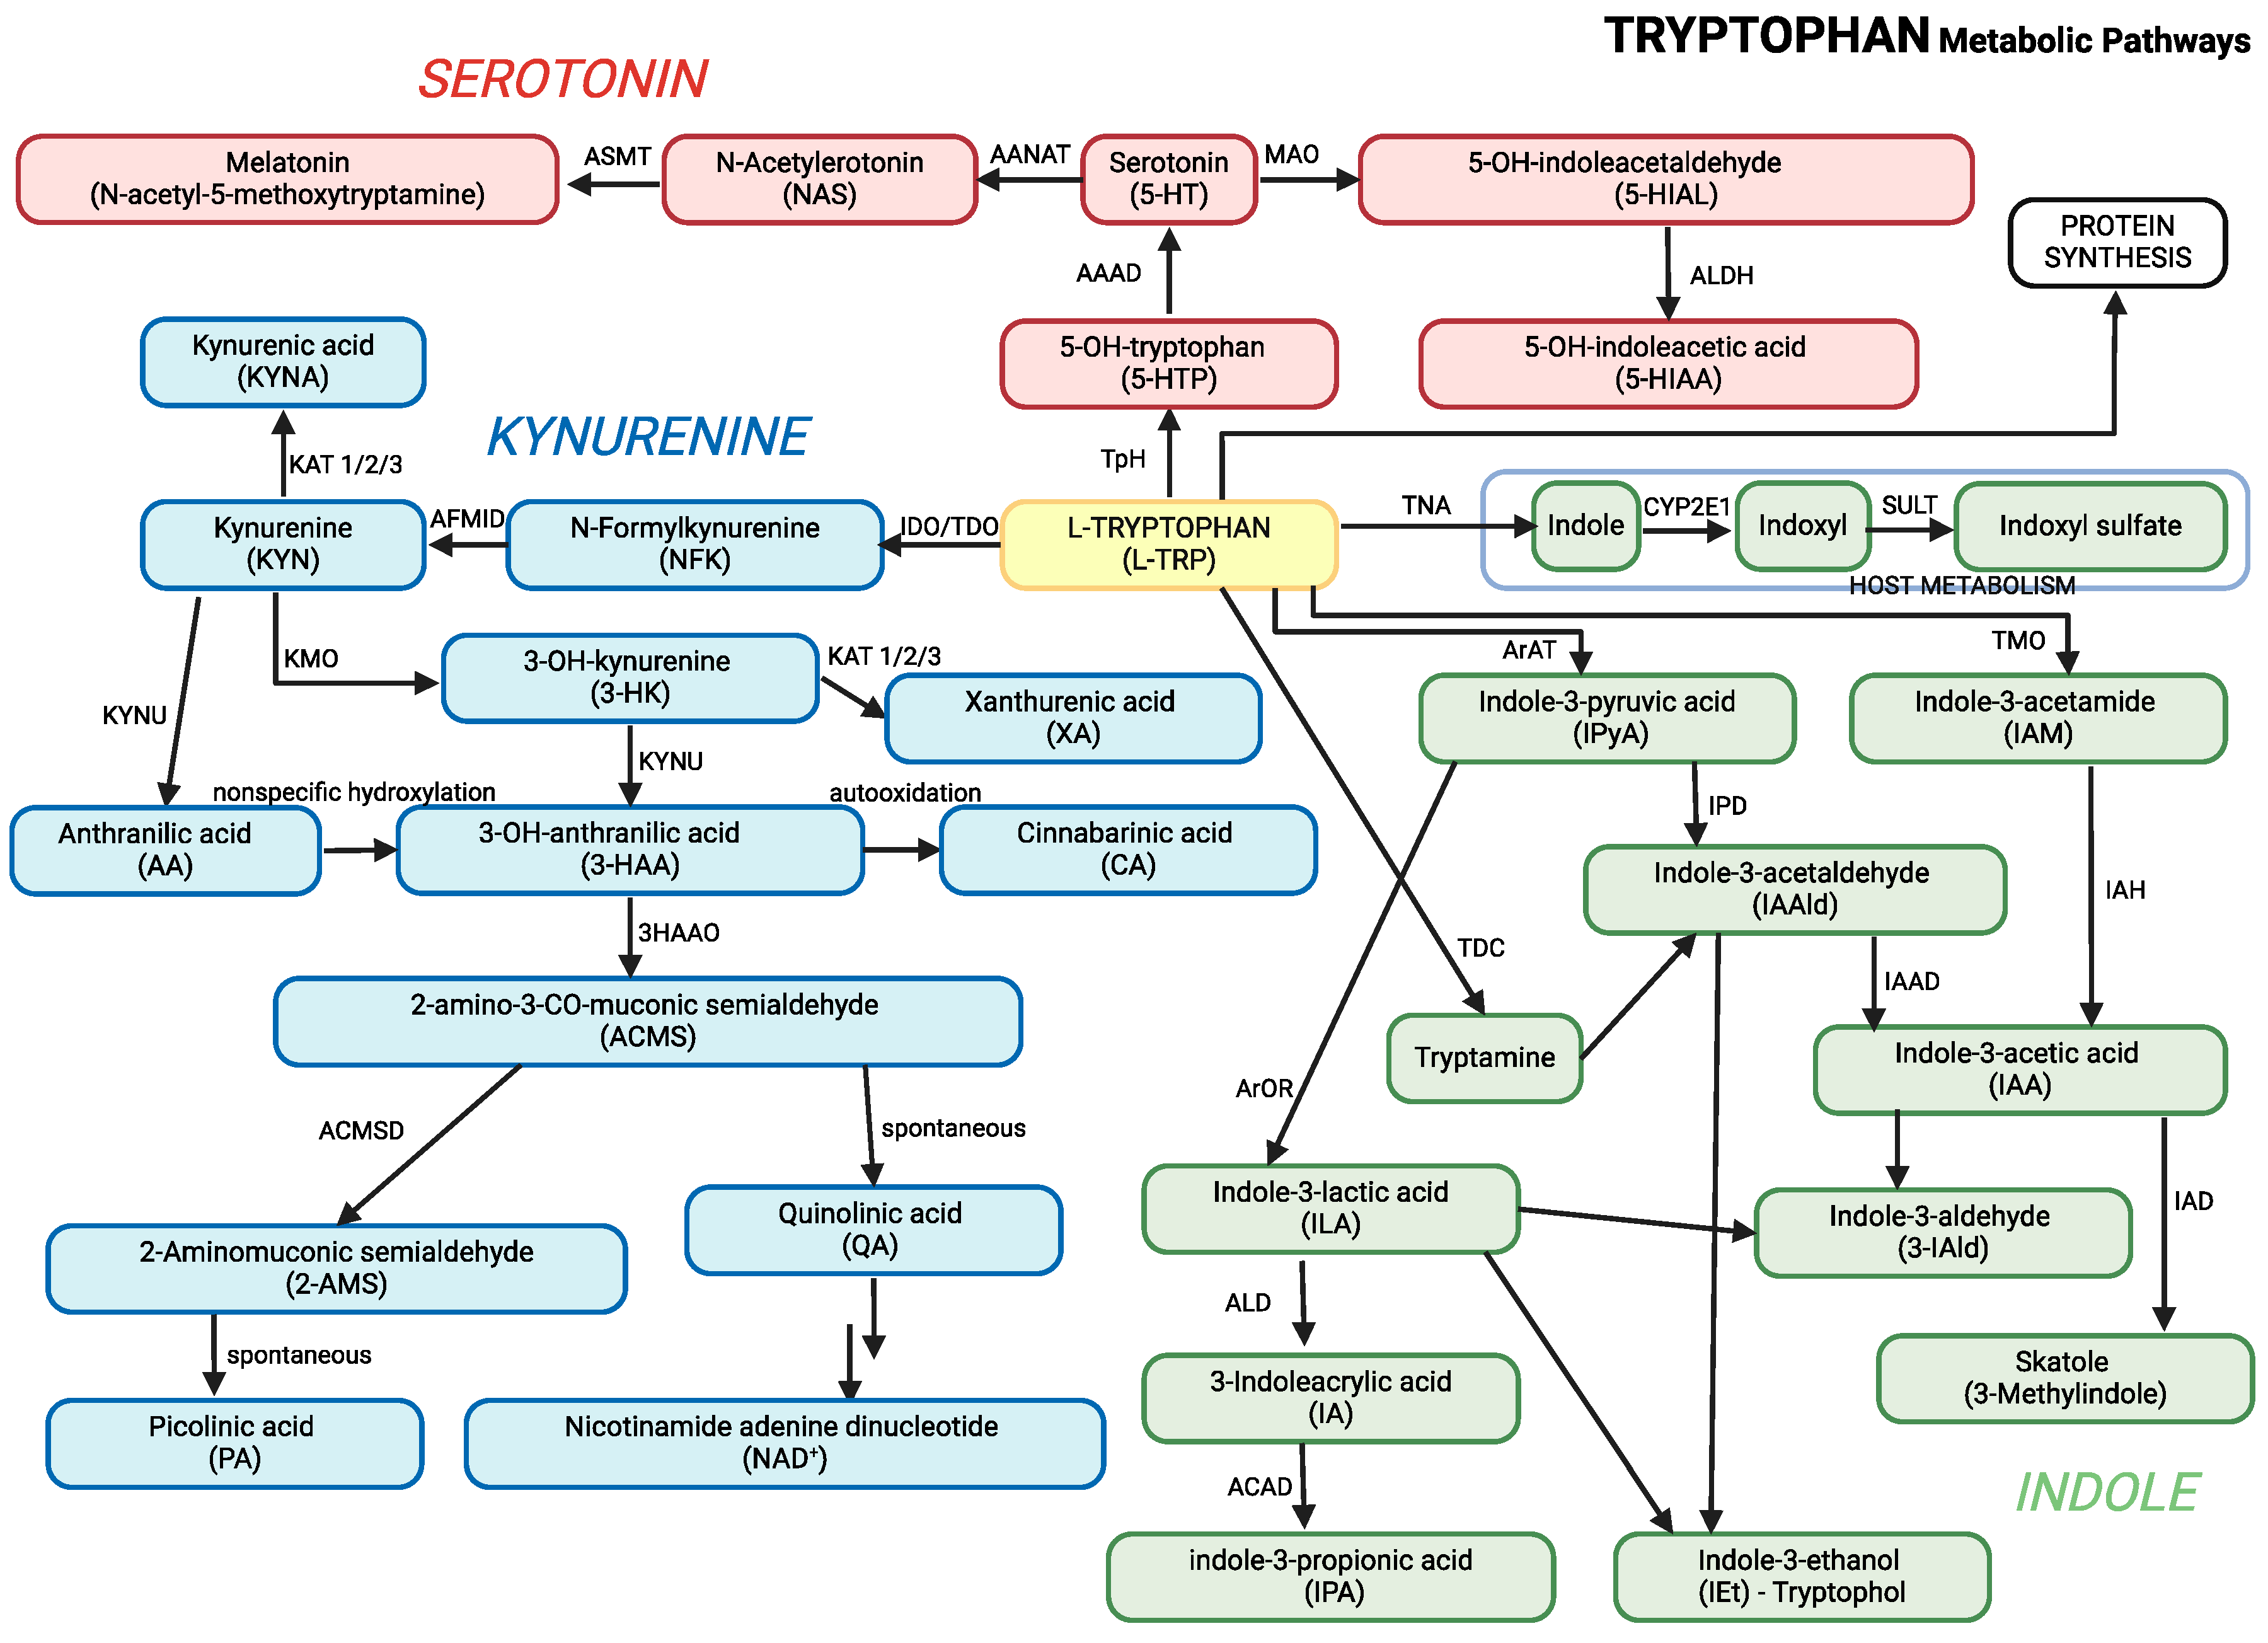
- Kynurenine Pathway: Enzymes such as indoleamine 2,3-dioxygenase (IDO) and tryptophan 2,3-dioxygenase (TDO) convert tryptophan into kynurenine. The pathway generates metabolites like kynurenic acid, which has neuroprotective effects, and quinolinic acid, which becomes neurotoxic when accumulated to excess.
- Serotonin Pathway: Tryptophan is converted into serotonin, a neurotransmitter involved in regulating mood, sleep, and behavior. Serotonin is further broken down into 5-hydroxyindoleacetic acid (5-HIAA), a marker of serotonin turnover.
- Indole Pathway: The gut microbiota plays a significant role in converting tryptophan into indole derivatives such as indole-3-acetic acid (IAA), indole-3-lactic acid (ILA), and indole-3-propionic acid (IPA). These metabolites are crucial for gut health and regulating the gut-brain axis.
Materials and Methods
Subjects
Collection of Urine Samples
Analysis
Metabolite Analysis - Urine Sample Preparation (Pavlova et al., 2017)
Mass Spectrometry Metabolite Analysis
Determination of Creatinine in Urine
Statistical Analysis
Results

| 0 (N=44) | 1 (N=44) | |
|---|---|---|
| Control (0), Patients (1) | ||
| Male (M) | 23 (52,3%) | 36 (81,8%) |
| Female (F) | 21 (47,7%) | 8 (18,2%) |
| Age | ||
| Mean (SD) | 9,36 (3,51) | 10,68 (3,19) |
| Median (Q1, Q3) | 9,35 (6,80, 11,38) | 10,70 (8,38, 13,00) |
| Min - Max | 0,90 - 16,70 | 4,90 - 17,00 |
Discussion
Conclusions
Supplementary Materials
References
- Adams, J. B., Johansen, L. J., Powell, L. D., Quig, D., & Rubin, R. A. (2011). Gastrointestinal flora and gastrointestinal status in children with autism--comparisons to typical children and correlation with autism severity. BMC Gastroenterology, 11. [CrossRef]
- Almulla, A. F., Thipakorn, Y., Tunvirachaisakul, C., & Maes, M. (2023). The tryptophan catabolite or kynurenine pathway in autism spectrum disorder; a systematic review and meta-analysis. Autism Research, 16(12), 2302–2315. [CrossRef]
- American Psychiatric Association. (2013). Diagnostic and Statistical Manual of Mental Disorders 5. American Psychiatric Association. [CrossRef]
- Badawy, A. A. B. (2017). Kynurenine Pathway of Tryptophan Metabolism: Regulatory and Functional Aspects. International Journal of Tryptophan Research : IJTR, 10(1). [CrossRef]
- Chang, H.-M., Klausen, C., & Leung, P. C. K. (2013). Antimüllerian hormone inhibits follicle-stimulating hormone-induced adenylyl cyclase activation, aromatase expression, and estradiol production in human granulosa-lutein cells. Fertility and Sterility, 100(2), 585-92.e1. [CrossRef]
- Chawla, N. V., Bowyer, K. W., Hall, L. O., & Kegelmeyer, W. P. (2002). SMOTE: Synthetic minority over-sampling technique. Journal of Artificial Intelligence Research. [CrossRef]
- Core, T. R. D. (2018). A Language and Environment for Statistical Computing. In R Foundation for Statistical Computing (Vol. 2).
- Daly, E., Tricklebank, M. D., & Wichers, R. (2019). Neurodevelopmental roles and the serotonin hypothesis of autism spectrum disorder. The Serotonin System: History, Neuropharmacology, and Pathology, 23–44. [CrossRef]
- Esposito, D., Cruciani, G., Zaccaro, L., Di Carlo, E., Spitoni, G. F., Manti, F., Carducci, C., Fiori, E., Leuzzi, V., & Pascucci, T. (2024). A Systematic Review on Autism and Hyperserotonemia: State-of-the-Art, Limitations, and Future Directions. Brain Sciences, 14(5), 481. [CrossRef]
- Ethan, A., Atkinson, E., Dougherty, G., Lennon, R., Hanson, A., Goergen, K., Lundt, E., Broderick, B., Mccullough, M., & Heinzen, M. E. (2022). Package ‘ arsenal ’ R topics documented : 1.
- Frye, R. E., Casanova, M. F., Fatemi, S. H., Folsom, T. D., Reutiman, T. J., Brown, G. L., Edelson, S. M., Slattery, J. C., & Adams, J. B. (2016). Neuropathological mechanisms of seizures in autism spectrum disorder. Frontiers in Neuroscience, 10(MAY), 198043. [CrossRef]
- Gabriele, S., Sacco, R., & Persico, A. M. (2014). Blood serotonin levels in autism spectrum disorder: A systematic review and meta-analysis. European Neuropsychopharmacology, 24(6), 919–929. [CrossRef]
- Gevi, F., Zolla, L., Gabriele, S., & Persico, A. M. (2016). Urinary metabolomics of young Italian autistic children supports abnormal tryptophan and purine metabolism. Molecular Autism, 7, 47. [CrossRef]
- Hou, Y., Li, J., & Ying, S. (2023). Tryptophan Metabolism and Gut Microbiota: A Novel Regulatory Axis Integrating the Microbiome, Immunity, and Cancer. Metabolites, 13(11). [CrossRef]
- Kałużna-Czaplińska, J., Gątarek, P., Chirumbolo, S., Chartrand, M. S., & Bjørklund, G. (2019). How important is tryptophan in human health? Critical Reviews in Food Science and Nutrition, 59(1), 72–88. [CrossRef]
- Labus, J. S., Hollister, E. B., Jacobs, J., Kirbach, K., Oezguen, N., Gupta, A., Acosta, J., Luna, R. A., Aagaard, K., Versalovic, J., Savidge, T., Hsiao, E., Tillisch, K., & Mayer, E. A. (2017). Differences in gut microbial composition correlate with regional brain volumes in irritable bowel syndrome. Microbiome, 5(1), 1–17. [CrossRef]
- Likhitweerawong, N., Thonusin, C., Boonchooduang, N., Louthrenoo, O., Nookaew, I., Chattipakorn, N., & Chattipakorn, S. C. (2021). Profiles of urine and blood metabolomics in autism spectrum disorders. Metabolic Brain Disease, 36(7), 1641–1671. [CrossRef]
- Liu, A., Zhou, W., Qu, L., He, F., Wang, H., Wang, Y., Cai, C., Li, X., Zhou, W., & Wang, M. (2019). Altered Urinary Amino Acids in Children With Autism Spectrum Disorders. Frontiers in Cellular Neuroscience, 13. [CrossRef]
- Masi, A., Breen, E. J., Alvares, G. A., Glozier, N., Hickie, I. B., Hunt, A., Hui, J., Beilby, J., Ravine, D., Wray, J., Whitehouse, A. J. O., & Guastella, A. J. (2017). Cytokine levels and associations with symptom severity in male and female children with autism spectrum disorder. Molecular Autism, 8(1), 1–11. [CrossRef]
- Morton, J. T., Jin, D. M., Mills, R. H., Shao, Y., Rahman, G., McDonald, D., Zhu, Q., Balaban, M., Jiang, Y., Cantrell, K., Gonzalez, A., Carmel, J., Frankiensztajn, L. M., Martin-Brevet, S., Berding, K., Needham, B. D., Zurita, M. F., David, M., Averina, O. V., … Taroncher-Oldenburg, G. (2023). Multi-level analysis of the gut–brain axis shows autism spectrum disorder-associated molecular and microbial profiles. Nature Neuroscience 2023 26:7, 26(7), 1208–1217. [CrossRef]
- Mughal, S., Faizy, R. M., & Saadabadi, A. (2022). Autism Spectrum Disorder. StatPearls. https://www.ncbi.nlm.nih.gov/books/NBK525976/.
- Muller, C. L., Anacker, A. M. J., & Veenstra-VanderWeele, J. (2016). The serotonin system in autism spectrum disorder: From biomarker to animal models. Neuroscience, 321, 24–41. [CrossRef]
- Osredkar, J., Gosar, D., Maček, J., Kumer, K., Fabjan, T., Finderle, P., Šterpin, S., Zupan, M., & Vrhovšek, M. J. (2019). Urinary markers of oxidative stress in children with autism spectrum disorder (ASD). Antioxidants, 8(6). [CrossRef]
- Oxenkrug, G. F. (2010). Tryptophan–Kynurenine Metabolism as a Common Mediator of Genetic and Environmental Impacts in Major Depressive Disorder: The Serotonin Hypothesis Revisited 40 Years Later. The Israel Journal of Psychiatry and Related Sciences, 47(1), 56. /pmc/articles/PMC3021918/.
- Pavlova, T., Vidova, V., Bienertova-Vasku, J., Janku, P., Almasi, M., Klanova, J., & Spacil, Z. (2017). Urinary intermediates of tryptophan as indicators of the gut microbial metabolism. Analytica Chimica Acta, 987, 72–80. [CrossRef]
- R Core Team. (2018). R: The R Project for Statistical Computing. https://www.r-project.org/.
- Raghavan, R., Anand, N. S., Wang, G., Hong, X., Pearson, C., Zuckerman, B., Xie, H., & Wang, X. (2022). Association between cord blood metabolites in tryptophan pathway and childhood risk of autism spectrum disorder and attention-deficit hyperactivity disorder. Translational Psychiatry, 12(1). [CrossRef]
- Reuter, M., Zamoscik, V., Plieger, T., Bravo, R., Ugartemendia, L., Rodriguez, A. B., & Kirsch, P. (2021). Tryptophan-rich diet is negatively associated with depression and positively linked to social cognition. Nutrition Research, 85, 14–20. [CrossRef]
- Roager, H. M., & Licht, T. R. (2018). Microbial tryptophan catabolites in health and disease. Nature Communications, 9(1), 1–10. [CrossRef]
- Rossignol, D. A., & Frye, R. E. (2012). A review of research trends in physiological abnormalities in autism spectrum disorders: immune dysregulation, inflammation, oxidative stress, mitochondrial dysfunction and environmental toxicant exposures. Molecular Psychiatry, 17(4), 389–401. [CrossRef]
- Santana-Coelho, D. (2024). Does the kynurenine pathway play a pathogenic role in autism spectrum disorder? Brain, Behavior, & Immunity - Health, 40, 100839. [CrossRef]
- Schopler, E., Reichler, R. J., DeVellis, R. F., & Daly, K. (1980). Toward objective classification of childhood autism: Childhood Autism Rating Scale (CARS). Journal of Autism and Developmental Disorders, 10(1), 91–103. [CrossRef]
- Strandwitz, P. (2018). Neurotransmitter modulation by the gut microbiota. Brain Research, 1693, 128–133. [CrossRef]
- Strati, F., Cavalieri, D., Albanese, D., De Felice, C., Donati, C., Hayek, J., Jousson, O., Leoncini, S., Renzi, D., Calabrò, A., & De Filippo, C. (2017). New evidences on the altered gut microbiota in autism spectrum disorders. Microbiome, 5(1). [CrossRef]
- Taurines, R., Schwenck, C., Westerwald, E., Sachse, M., Siniatchkin, M., & Freitag, C. (2012). ADHD and autism: differential diagnosis or overlapping traits? A selective review. ADHD Attention Deficit and Hyperactivity Disorders 2012 4:3, 4(3), 115–139. [CrossRef]
- Vovk-Ornik, N. (2015). Kriteriji za opredelitev vrste in stopnje primanjkljajev, ovir oz. motenj otrok s posebnimi potrebami. In Zavod RS za šolstvo (Issue 2).
- Wickham, H., Averick, M., Bryan, J., Chang, W., McGowan, L., François, R., Grolemund, G., Hayes, A., Henry, L., Hester, J., Kuhn, M., Pedersen, T., Miller, E., Bache, S., Müller, K., Ooms, J., Robinson, D., Seidel, D., Spinu, V., … Yutani, H. (2019). Welcome to the Tidyverse. Journal of Open Source Software, 4(43), 1686. [CrossRef]
- Xiong, X., Liu, D., Wang, Y., Zeng, T., & Peng, Y. (2016). Urinary 3-(3-Hydroxyphenyl)-3-hydroxypropionic Acid, 3-Hydroxyphenylacetic Acid, and 3-Hydroxyhippuric Acid Are Elevated in Children with Autism Spectrum Disorders. BioMed Research International, 2016. [CrossRef]
- Xue, C., Li, G., Zheng, Q., Gu, X., Shi, Q., Su, Y., Chu, Q., Yuan, X., Bao, Z., Lu, J., & Li, L. (2023). Tryptophan metabolism in health and disease. Cell Metabolism, 35(8), 1304–1326. [CrossRef]
- Yap, I. K. S., Angley, M., Veselkov, K. A., Holmes, E., Lindon, J. C., & Nicholson, J. K. (2010). Urinary metabolic phenotyping differentiates children with autism from their unaffected siblings and age-matched controls. Journal of Proteome Research, 9(6), 2996–3004. [CrossRef]
| Pathway | Key Enzymes | Key Metabolites | Function | Relevance to ASD |
|---|---|---|---|---|
| Kynurenine Pathway | Tryptophan 2,3-Dioxygenase (TDO), Indoleamine 2,3-Dioxygenase (IDO) | - Kynurenine - Kynurenic Acid - Quinolinic Acid |
- Neuroactive metabolites, immune regulation, neuroinflammation | Increased kynurenine and quinolinic acid lead to neuroinflammation and oxidative stress, contributing to ASD symptoms (Santana-Coelho, 2024). |
| Serotonin Pathway | Tryptophan Hydroxylase | - Serotonin (5-HT) - 5-Hydroxyindoleacetic Acid (5-HIAA) |
- Mood regulation, behavior, sleep | Lower serotonin levels and decreased 5-HIAA/serotonin ratios in ASD contribute to mood and behavioral issues (Chang et al., 2013; Daly et al., 2019; Gabriele et al., 2014; Muller et al., 2016) |
| Indole Pathway | Gut Microbiota | - Indole-3-Acetic Acid (IAA) - Indole-3-Lactic Acid (ILA) - Indole-3-Propionic Acid (IPA) |
- Gut health, antioxidant properties, immune modulation | Altered gut microbiota in ASD affects indole production, impacting gut-brain interactions and neurodevelopment (Morton et al., 2023). |
| Ratio | Description | Relevance to ASD | References |
|---|---|---|---|
| KYN/TRP (Kynurenine/Tryptophan) | Reflects the activity of the kynurenine pathway. | Elevated KYN/TRP ratios in ASD suggest increased kynurenine pathway activity, linked to neuroinflammation. | (Gevi et al., 2016; Rossignol & Frye, 2012) |
| IAA/TRP (Indole-3-Acetic Acid/Tryptophan) | Indicates the activity of the indole pathway. | Reduced indole derivatives in ASD reflect gut microbiota alterations, affecting gut-brain axis signaling. | (Strati et al., 2017) |
| 5-HIAA/5-HTP (5-Hydroxyindoleacetic Acid/5-Hydroxytryptophan) | Reflects serotonin turnover and synthesis efficiency. | Decreased serotonin turnover in ASD is linked to behavioral and mood disturbances. | (Adams et al., 2011) |
| IPA/TRP (Indole-3-Propionic Acid/Tryptophan) | Reflects antioxidant production via the gut microbiota. | Decreased IPA in ASD indicates reduced antioxidant defense and gut dysbiosis. | (Strati et al., 2017) |
| TRPN/TRP | Reflects serotonin and melatonin precursor production. | Lower tryptamine levels in ASD suggest impaired serotonin and melatonin synthesis. | (Likhitweerawong et al., 2021) |
| Metabolite | Control (N=44) | ASD (N=44) | CARS<36 (N=28) | CARS>36.5 (N=15) | p value | |||
|---|---|---|---|---|---|---|---|---|
| 1 | 2 | 3 | 4 | 1-2 | 1-3 | 1-4 | 3-4 | |
| Tryptophan - TRP | 0.04 | 0.06 | 0.09 | 0.74 | ||||
| Mean (SD) | 18.20 (8.17) | 22.30 (8.53) | 22.96 (9.51) | 21.74 (6.52) | ||||
| Median (Q1, Q3) | 16.91 (11.97, 23.63) |
19.94 (16.99, 28.36) |
19.81 (16.16, 33.22) | 21.37 (19.29, 25.67) | ||||
| Min - Max | 6.03 - 38.83 | 7.38 - 39.65 | 9.07 - 39.65 | 7.38 - 31.30 | ||||
| Anthranilate - ATA | 0.99 | 0.50 | 0.22 | 0.40 | ||||
| Mean (SD) | 21.21 (9.43) | 21.09 (10.78) | 23.78 (13.10) | 17.34 (7.61) | ||||
| Median (Q1, Q3) | 21.44 (14.95, 25.43) | 19.86 (13.90, 28.61) | 20.55 (13.97, 32.92) | 19.29 (10.24, 21.16) | ||||
| Min - Max | 5.52 - 50.67 | 4.52 - 50.73 | 5.04 - 53.00 | 4.52 - 29.51 | ||||
| Indole-3-acetic acid - IAA | 0.78 | 0.75 | 0.74 | 0.83 | ||||
| Mean (SD) | 1.79 (1.48) | 1.86 (1.37) | 1.97 (1.49) | 1.57 (1.07) | ||||
| Median (Q1, Q3) | 1.32 (0.70, 2.28) | 1.67 (0.88, 2.61) | 1.68 (0.83, 2.76) | 1.18 (0.88, 2.37) | ||||
| Min - Max | 0.11 - 5.84 | 0.20 - 5.80 | 0.20 - 5.80 | 0.22 - 3.53 | ||||
| Indole-3-aldehyde - IALD | 0.10 | 0.45 | 0.19 | 0.50 | ||||
| Mean (SD) | 200.29 (119.30) | 165.20 (83.91) | 172.01 (88.14) | 152.50 (76.64) | ||||
| Median (Q1, Q3) | 174.38 (102.35, 287.53) | 147.13 (104.24, 223.62) | 147.13 (111.80, 226.26) | 134.39 (91.37, 188.69) | ||||
| Min - Max | 17.43 - 455.15 | 30.44 - 358.36 | 30.44 - 358.36 | 62.03 - 313.85 | ||||
| Indole-3-acetamide - IAM | 1.00 | 0.91 | 0.96 | 0.78 | ||||
| Mean (SD) | 61.77 (37.16) | 61.78 (36.77) | 65.64 (41.31) | 57.77 (28.18) | ||||
| Median (Q1, Q3) | 55.71 (31.43, 79.18) | 57.14 (30.33, 79.70) | 57.14 (32.71, 85.72) | 58.03 (32.09, 79.70) | ||||
| Min - Max | 10.43 - 160.04 | 12.85 - 160.99 | 18.11 - 160.99 | 12.85 - 100.63 | ||||
| Indole-3-butyric acid - IBA* | 0.98 | 0.89 | 0.57 | 0.95 | ||||
| Mean (SD) | 20.13 (17.40) | 20.53 (18.82) | 21.76 (20.33) | 15.77 (13.97) | ||||
| Median (Q1, Q3) | 17.20 (8.71, 23.79) | 12.97 (8.10, 33.69) | 12.51 (7.00, 37.91) | 12.21 (8.17, 18.71) | ||||
| Min - Max | 0.81 - 75.60 | 0.03 - 68.17 | 0.03 - 68.17 | 0.40 - 44.33 | ||||
| Indole-3-lactic acid - ILA | 0.53 | 0.19 | 0.47 | 0.96 | ||||
| Mean (SD) | 1.08 (0.58) | 0.99 (0.58) | 0.94 (0.52) | 0.94 (0.51) | ||||
| Median (Q1, Q3) | 1.01 (0.61, 1.40) | 0.75 (0.59, 1.13) | 0.74 (0.67, 1.02) | 0.83 (0.52, 1.40) | ||||
| Min - Max | 0.18 - 2.41 | 0.27 - 2.67 | 0.28 - 2.39 | 0.27 - 1.80 | ||||
| Indole-3-propionic acid - IPA | 0.27 | 0.35 | 0.16 | 0.94 | ||||
| Mean (SD) | 5.13 (3.04) | 4.16 (3.11) | 4.40 (3.60) | 3.57 (1.28) | ||||
| Median (Q1, Q3) | 4.53 (3.42, 6.86) | 3.16 (2.08, 5.15) | 3.64 (1.91, 5.54) | 3.16 (2.75, 4.50) | ||||
| Min - Max | 0.20 - 13.98 | 0.00 - 13.11 | 0.00 - 13.11 | 1.27 - 5.71 | ||||
| Kynurenine - KYN | 0.86 | 1.00 | 0.28 | 0.62 | ||||
| Mean (SD) | 92.94 (61.63) | 99.77 (61.68) | 80.67 (45.97) | 99.77 (46.39) | ||||
| Median (Q1, Q3) | 71.20 (48.30, 122.81) | 82.34 (54.76, 128.66) | 77.23 (47.82, 105.30) | 97.70 (64.36, 134.02) | ||||
| Min - Max | 25.41 - 241.15 | 11.62 - 240.85 | 11.62 - 205.89 | 29.30 - 184.66 | ||||
| Methyl indole-3-acetate - MIA* | 0.80 | 0.64 | 0.86 | 0.13 | ||||
| Mean (SD) | 0.07 (0.04) | 0.08 (0.06) | 0.08 (0.05) | 0.06 (0.04) | ||||
| Median (Q1, Q3) | 0.06 (0.04, 0.10) | 0.07 (0.04, 0.11) | 0.07 (0.03, 0.11) | 0.06 (0.04, 0.07) | ||||
| Min - Max | 0.01 - 0.21 | 0.00 - 0.23 | 0.00 - 0.20 | 0.00 - 0.14 | ||||
| N-acetyl-tryptophan - NAcTRP | 0.92 | 0.54 | 0.75 | 0.26 | ||||
| Mean (SD) | 206.05 (118.34) | 200.64 (83.98) | 212.55 (87.76) | 178.41 (74.11) | ||||
| Median (Q1, Q3) | 185.08 (95.68, 279.38) | 185.54 (149.26, 252.54) | 225.92 (159.52, 265.84) | 184.49 (112.53, 217.93) | ||||
| Min - Max | 35.88 - 488.19 | 56.47 - 363.64 | 56.47 - 344.29 | 80.06 - 363.64 | ||||
| Tryptamine - TRPN | 0.10 | 0.13 | 0.72 | 0.11 | ||||
| Mean (SD) | 389.89 (209.89) | 456.33 (257.72) | 518.74 (278.95) | 365.38 (173.84) | ||||
| Median (Q1, Q3) | 389.13 (246.22, 483.64) | 441.10 (230.08, 649.44) | 528.14 (281.69, 763.43) | 391.67 (238.62, 451.97) | ||||
| Min - Max | 56.29 - 1041.14 | 63.19 - 1075.56 | 63.19 - 1075.56 | 125.02 - 653.10 | ||||
| 5-hydroxyindoleacetic acid - 5HIAA | 0.61 | 0.28 | 0.63 | 0.17 | ||||
| Mean (SD) | 48.77 (27.63) | 50.76 (25.04) | 53.62 (23.03) | 44.82 (28.83) | ||||
| Median (Q1, Q3) | 39.12 (31.35, 61.84) | 48.64 (31.03, 61.78) | 48.64 (33.60, 63.86) | 42.98 (23.75, 49.14) | ||||
| Min - Max | 17.96 - 116.40 | 9.74 - 116.26 | 24.96 - 101.83 | 9.74 - 116.26 | ||||
| 5-hydroxy-L-tryptophan - 5OHTRP | 0.15 | 0.40 | 0.01 | 0.14 | ||||
| Mean (SD) | 22.79 (12.56) | 19.13 (12.76) | 21.98 (14.30) | 14.24 (7.92) | ||||
| Median (Q1, Q3) | 22.21 (11.71, 30.28) | 18.39 (10.09, 24.31) | 21.52 (12.10, 26.27) | 12.46 (9.79, 19.67) | ||||
| Min - Max | 0.71 - 49.81 | 0.79 - 54.70 | 3.48 - 54.70 | 0.79 - 28.73 | ||||
| 5-Methoxyindoleacetate - 5MIAA* | 0.89 | 0.13 | 0.37 | 0.19 | ||||
| Mean (SD) | 15.12 (9.89) | 16.40 (13.23) | 11.43 (9.37) | 19.68 (13.52) | ||||
| Median (Q1, Q3) | 15.11 (6.53, 22.07) | 10.93 (7.69, 22.06) | 9.05 (6.86, 11.35) | 16.73 (7.84, 31.74) | ||||
| Min - Max | 0.79 - 45.27 | 1.12 - 52.02 | 0.90 - 38.93 | 4.06 - 44.47 | ||||
| U-Creatinine | 0.43 | 0.68 | 0.50 | 0.99 | ||||
| Mean (SD) | 7.58 (4.27) | 8.36 (4.76) | 8.40 (5.06) | 8.29 (4.33) | ||||
| Median (Q1, Q3) | 6.55 (4.62, 9.93) | 7.70 (4.55, 10.88) | 7.10 (4.40, 10.65) | 8.40 (5.25, 11.00) | ||||
| Min - Max | 0.10 - 18.30 | 0.70 - 18.20 | 2.30 - 18.20 | 0.70 - 15.90 | ||||
| Metabolite ratios | Control (N=43) | ASD (N=43) | CARS<36 (N=28) | CARS>36.5 (N=16) | p value | |||
|---|---|---|---|---|---|---|---|---|
| 1 | 2 | 3 | 4 | 1-2 | 1-3 | 1-4 | 3-4 | |
| KYN_TRP | 0.96 | 0.47 | 0.27 | 0.17 | ||||
| Mean (SD) | 4.47 (1.76) | 4.48 (2.20) | 4.20 (1.93) | 5.39 (2.81) | ||||
| Median (Q1, Q3) | 4.21 (3.32, 5.28) | 4.67 (2.27, 5.84) | 4.60 (2.53, 5.42) | 5.53 (3.57, 6.93) | ||||
| Min - Max | 0.82 - 9.03 | 1.20 - 9.56 | 1.20 - 8.34 | 1.27 - 10.41 | ||||
| KYN_ATA | 0.22 | 0.54 | 0.14 | 0.82 | ||||
| Mean (SD) | 4.07 (3.14) | 4.72 (2.69) | 4.34 (2.46) | 6.93 (4.63) | ||||
| Median (Q1, Q3) | 2.71 (1.98, 5.61) | 4.53 (2.83, 5.59) | 4.46 (2.83, 5.41) | 5.30 (3.41, 8.66) | ||||
| Min - Max | 0.30 - 12.54 | 0.57 - 12.81 | 0.57 - 9.85 | 2.34 - 17.01 | ||||
| TRP_IAA | 0.34 | 0.86 | 0.50 | 0.29 | ||||
| Mean (SD) | 15.32 (10.77) | 13.71 (8.80) | 13.14 (5.82) | 20.60 (19.27) | ||||
| Median (Q1, Q3) | 11.63 (6.73, 22.28) | 11.85 (7.14, 17.96) | 11.85 (9.19, 18.12) | 13.19 (6.16, 32.42) | ||||
| Min - Max | 2.12 - 40.36 | 3.09 - 44.43 | 3.09 - 22.02 | 3.44 - 63.91 | ||||
| IAA_IALD | 0.36 | 0.60 | 0.70 | 1.00 | ||||
| Mean (SD) | 0.01 (0.01) | 0.01 (0.01) | 0.01 (0.01) | 0.01 (0.00) | ||||
| Median (Q1, Q3) | 0.01 (0.00, 0.01) | 0.01 (0.01, 0.01) | 0.01 (0.01, 0.01) | 0.01 (0.01, 0.01) | ||||
| Min - Max | 0.00 - 0.03 | 0.00 - 0.02 | 0.00 - 0.03 | 0.00 - 0.02 | ||||
| TRP_IAM | 0.42 | 0.86 | 0.28 | 0.27 | ||||
| Mean (SD) | 0.39 (0.22) | 0.45 (0.32) | 0.42 (0.33) | 0.53 (0.30) | ||||
| Median (Q1, Q3) | 0.34 (0.23, 0.50) | 0.31 (0.20, 0.76) | 0.27 (0.17, 0.73) | 0.44 (0.29, 0.79) | ||||
| Min - Max | 0.10 - 1.03 | 0.02 - 1.08 | 0.02 - 1.05 | 0.19 - 1.08 | ||||
| TRP_ILA | 0.24 | 0.06 | 0.56 | 0.81 | ||||
| Mean (SD) | 21.16 (13.25) | 25.38 (14.16) | 26.08 (14.03) | 23.81 (14.36) | ||||
| Median (Q1, Q3) | 17.41 (13.06, 27.07) | 22.58 (14.49, 32.35) | 25.71 (14.21, 32.35) | 19.01 (15.41, 29.69) | ||||
| Min - Max | 4.32 - 57.27 | 0.79 - 56.88 | 0.79 - 56.88 | 5.88 - 54.20 | ||||
| TRP_NAcTRP | 0.31 | 0.07 | 0.04 | 0.43 | ||||
| Mean (SD) | 0.11 (0.07) | 0.12 (0.04) | 0.12 (0.04) | 0.13 (0.07) | ||||
| Median (Q1, Q3) | 0.09 (0.07, 0.15) | 0.12 (0.10, 0.15) | 0.13 (0.10, 0.15) | 0.11 (0.09, 0.16) | ||||
| Min - Max | 0.02 - 0.26 | 0.05 - 0.25 | 0.05 - 0.22 | 0.06 - 0.31 | ||||
| TRP_TRPN | 0.46 | 0.39 | 0.37 | 0.03 | ||||
| Mean (SD) | 0.05 (0.03) | 0.05 (0.02) | 0.04 (0.02) | 0.05 (0.02) | ||||
| Median (Q1, Q3) | 0.04 (0.03, 0.07) | 0.05 (0.03, 0.06) | 0.04 (0.03, 0.05) | 0.06 (0.05, 0.06) | ||||
| Min - Max | 0.01 - 0.13 | 0.01 - 0.09 | 0.02 - 0.09 | 0.01 - 0.09 | ||||
| TRP_5HIAA | 0.98 | 0.44 | 0.92 | 0.82 | ||||
| Mean (SD) | 0.46 (0.27) | 0.48 (0.33) | 0.39 (0.21) | 0.62 (0.48) | ||||
| Median (Q1, Q3) | 0.37 (0.27, 0.63) | 0.33 (0.22, 0.57) | 0.33 (0.23, 0.54) | 0.41 (0.21, 1.01) | ||||
| Min - Max | 0.06 - 1.17 | 0.13 - 1.32 | 0.13 - 0.98 | 0.17 - 1.72 | ||||
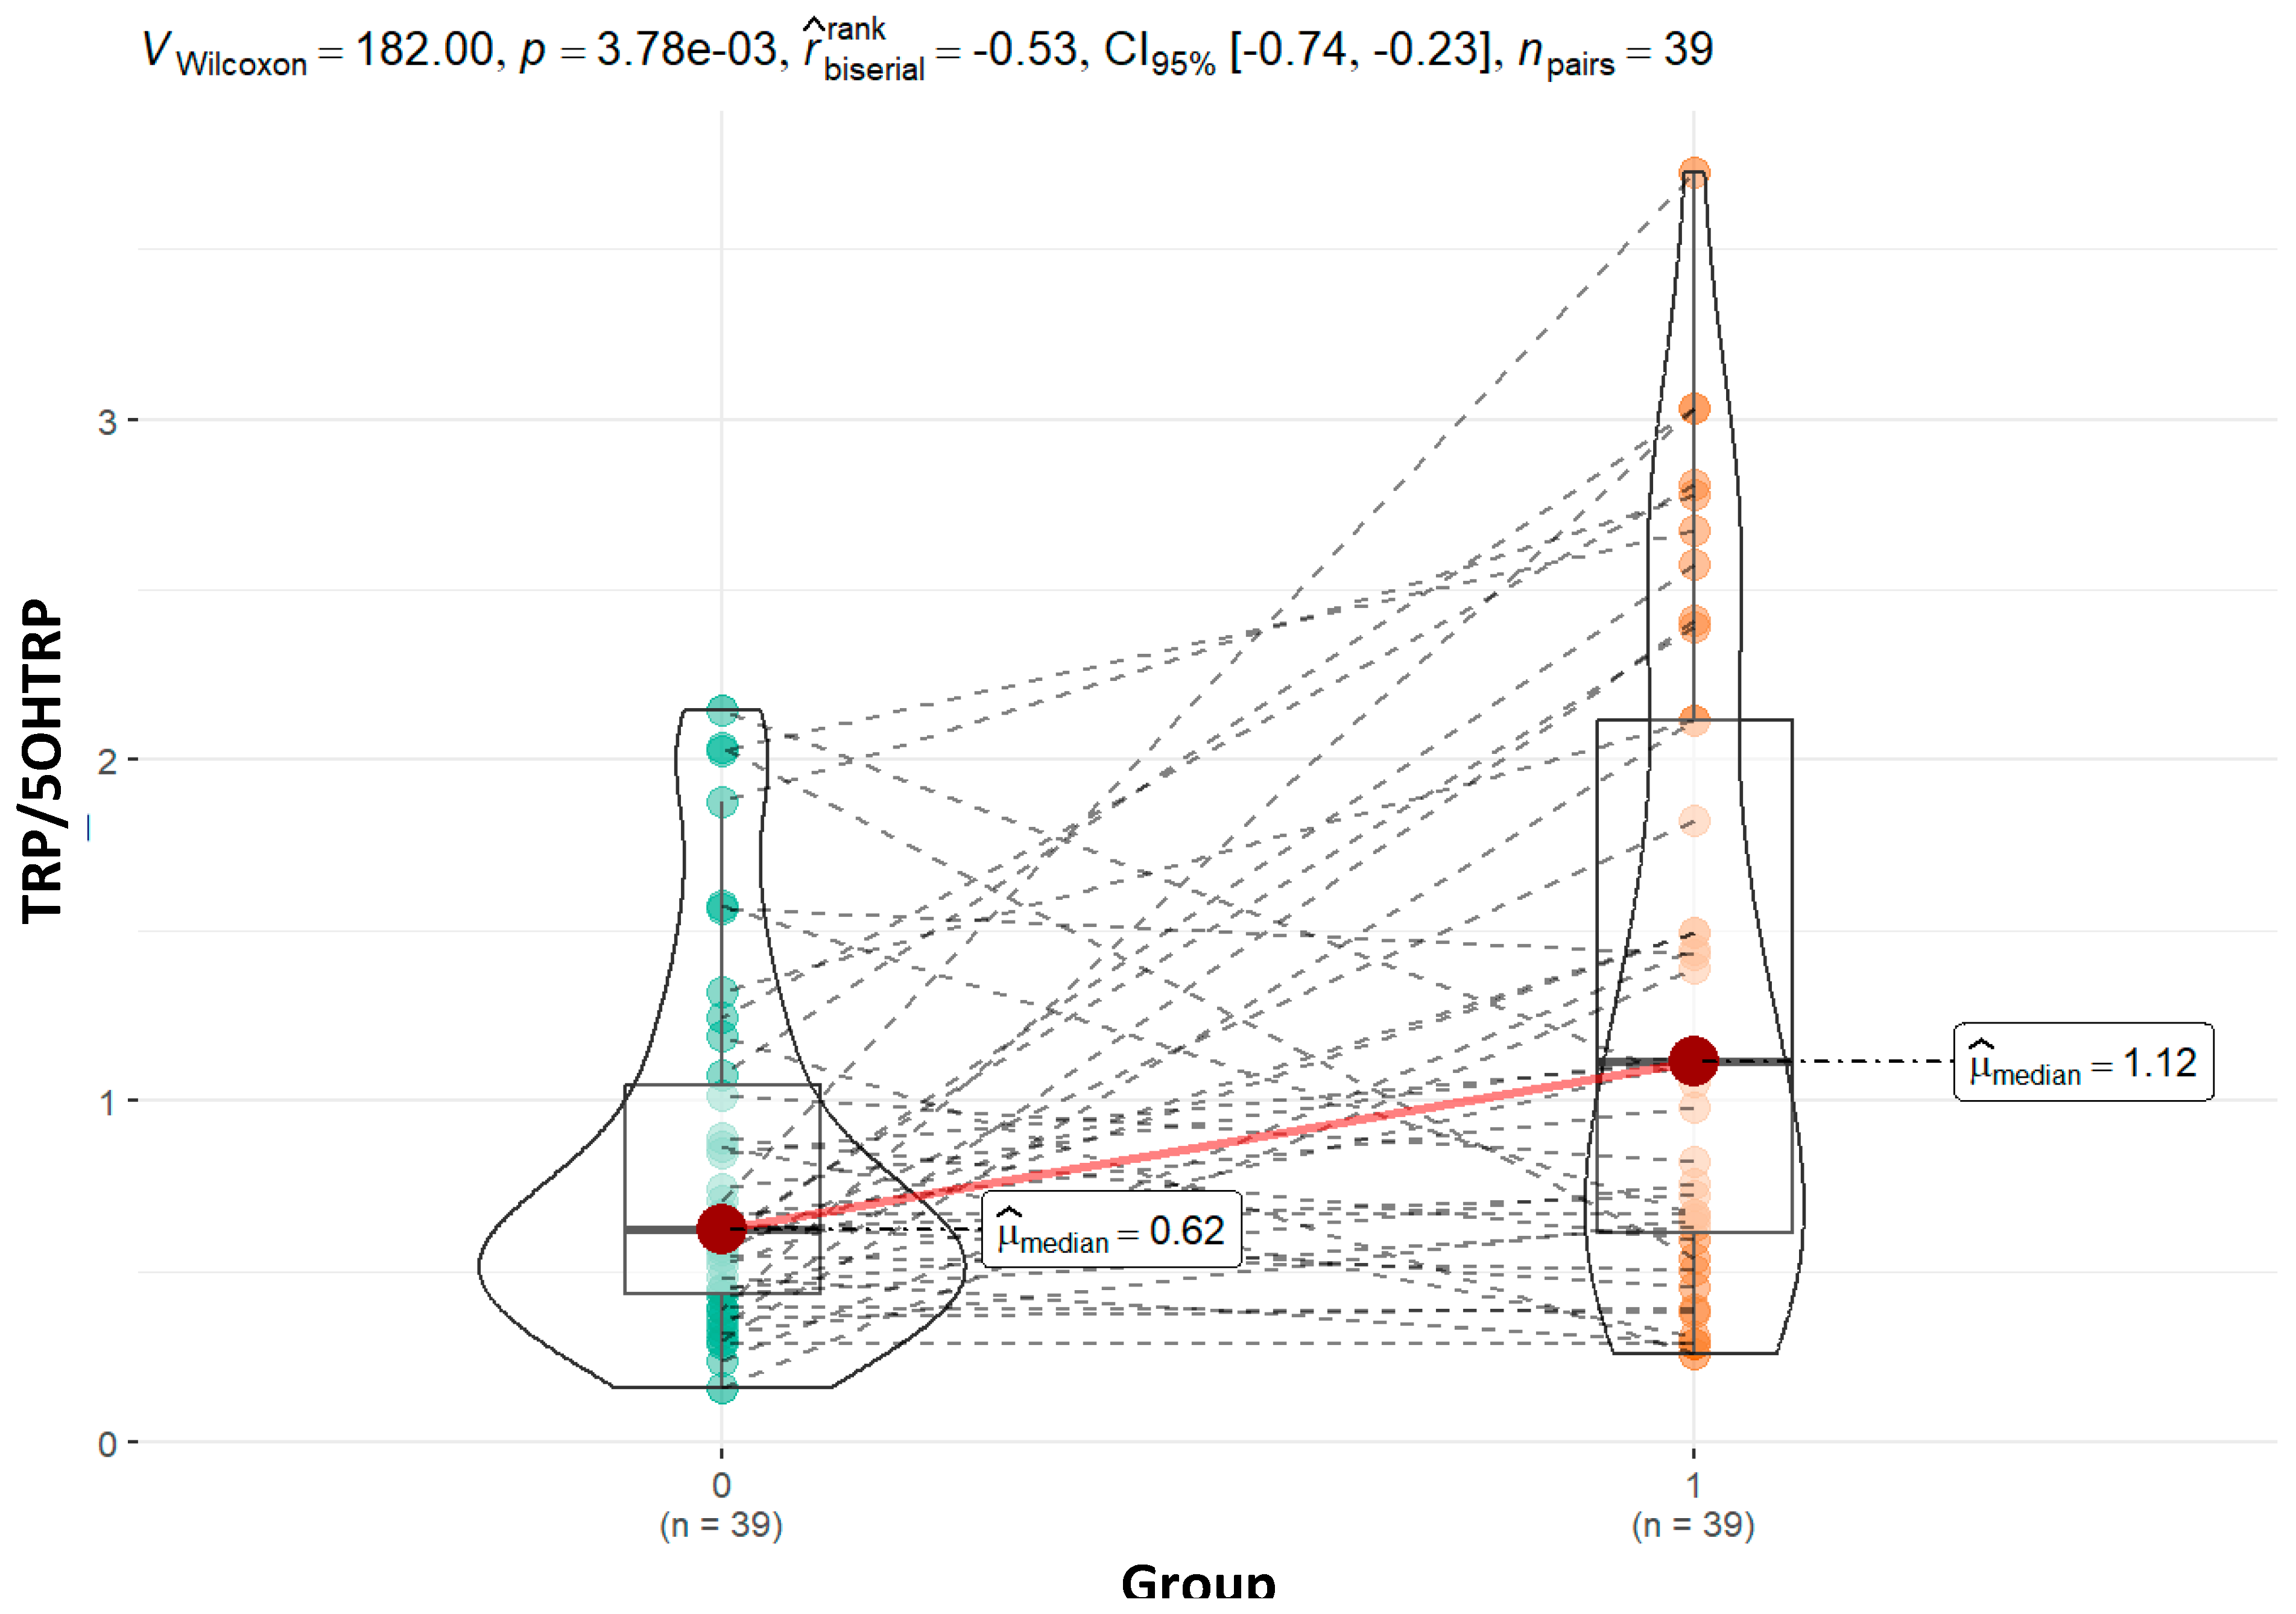
| TRP_5OHTRP | 0.01 | 0.68 | 0.001 | 0.08 | ||||
| Mean (SD) | 0.83 (0.55) | 1.28 (0.89) | 0.84 (0.54) | 1.69 (0.83) | ||||
| Median (Q1, Q3) | 0.62 (0.44, 1.07) | 1.06 (0.59, 1.83) | 0.69 (0.40, 1.12) | 1.83 (1.06, 2.39) | ||||
| Min - Max | 0.16 - 2.14 | 0.26 - 3.03 | 0.26 - 2.41 | 0.54 - 2.81 | ||||
| TRP_5MIAA | 0.04 | 0.04 | 0.52 | 0.34 | ||||
| Mean (SD) | 1.36 (0.96) | 2.25 (1.79) | 2.32 (1.76) | 1.45 (1.12) | ||||
| Median (Q1, Q3) | 1.10 (0.56, 2.11) | 1.57 (0.83, 3.84) | 1.69 (0.85, 4.01) | 1.09 (0.69, 1.95) | ||||
| Min - Max | 0.11 - 3.52 | 0.27 - 6.42 | 0.23 - 5.54 | 0.27 - 3.76 | ||||
| TRP_IPA | 0.41 | 0.74 | 0.43 | 0.67 | ||||
| Mean (SD) | 4.20 (2.86) | 4.86 (3.38) | 4.81 (3.50) | 1.41 (1.09) | ||||
| Median (Q1, Q3) | 3.83 (2.06, 5.91) | 3.81 (1.99, 6.89) | 3.73 (1.89, 6.86) | 1.15 (0.64, 1.82) | ||||
| Min - Max | 0.09 - 10.29 | 0.64 - 13.18 | 0.72 - 13.18 | 0.27 - 4.05 | ||||
| TRP_IBA | 0.49 | 0.30 | 0.63 | 0.62 | ||||
| Mean (SD) | 1.40 (1.22) | 1.53 (1.08) | 2.00 (1.67) | 4.96 (3.28) | ||||
| Median (Q1, Q3) | 0.98 (0.44, 2.08) | 1.40 (0.57, 2.32) | 1.78 (0.65, 2.71) | 4.41 (3.09, 6.48) | ||||
| Min - Max | 0.09 - 4.62 | 0.27 - 4.08 | 0.29 - 6.17 | 0.64 - 11.28 | ||||
| TRY_MIA | 0.29 | 0.50 | 0.10 | 0.19 | ||||
| Mean (SD) | 258.65 (128.65) | 307.21 (219.11) | 248.60 (165.80) | 404.21 (252.53) | ||||
| Median (Q1, Q3) | 229.38 (173.32, 344.60) | 235.91 (140.82, 456.88) | 221.01 (140.82, 329.70) | 456.88 (178.25, 604.11) | ||||
| Min - Max | 50.51 - 518.99 | 25.69 - 763.72 | 25.69 - 614.63 | 49.48 - 723.93 | ||||
| IAA_KYN | 0.81 | 0.61 | 0.67 | 0.67 | ||||
| Mean (SD) | 0.02 (0.01) | 0.02 (0.02) | 0.02 (0.02) | 0.02 (0.01) | ||||
| Median (Q1, Q3) | 0.02 (0.01, 0.03) | 0.02 (0.01, 0.03) | 0.02 (0.01, 0.03) | 0.02 (0.00, 0.02) | ||||
| Min - Max | 0.00 - 0.06 | 0.00 - 0.06 | 0.00 - 0.06 | 0.00 - 0.05 | ||||
| KYN_IALD | 0.19 | 0.12 | 0.44 | 0.93 | ||||
| Mean (SD) | 0.55 (0.44) | 0.68 (0.45) | 0.74 (0.49) | 0.68 (0.51) | ||||
| Median (Q1, Q3) | 0.38 (0.28, 0.72) | 0.60 (0.40, 0.77) | 0.61 (0.40, 0.93) | 0.60 (0.45, 0.65) | ||||
| Min - Max | 0.06 - 1.73 | 0.05 - 1.66 | 0.05 - 1.66 | 0.13 - 1.93 | ||||
| Moderate | Severe | Metabolite |
|---|---|---|
| TRP, MIA, 5HIAA, Creatinin | ||
| IAA, IAM, NAcTRP, TRPN | ||
| ATA, ILA, IPA, KYN, 5MIAA | ||
| IALD, IBA, 5OHTRP |
| Moderate | Severe | Metabolite |
|---|---|---|
| KYN-TRP, KYN-ATA, TRP-IAA, TRP-NAcTRP, TRP-5OHTRP, TRP-IPA, TRP-IBA, TRP-MIA, KYN-IALD, Creatinin | ||
| TRP-ILA | ||
| TRP-IAM, TRP-5MIAA | ||
| TRP-5HIAA |
Disclaimer/Publisher’s Note: The statements, opinions and data contained in all publications are solely those of the individual author(s) and contributor(s) and not of MDPI and/or the editor(s). MDPI and/or the editor(s) disclaim responsibility for any injury to people or property resulting from any ideas, methods, instructions or products referred to in the content. |
© 2024 by the authors. Licensee MDPI, Basel, Switzerland. This article is an open access article distributed under the terms and conditions of the Creative Commons Attribution (CC BY) license (http://creativecommons.org/licenses/by/4.0/).


