
Submitted:
21 December 2024
Posted:
23 December 2024
You are already at the latest version
Abstract
The explosive growth in the use of motor vehicles has caused many issues in ensuring road and traffic safety. The aim of this paper is to establish the trends and factors that explain traffic violations across the Republic of Kyrgyzstan from 2019 to 2023 to provide information that can be utilized by traffic management authorities. To this end we analyze the frequency and types of violations as well as the distribution of violations by date and time, geographical regions, and types of vehicles from a data set that has sourced more than 2,354,392 recorded traffic violations since Safe City Project commenced in Kyrgyzstan. The analysis defines the places and times where there is traffic, most violations of traffic laws and their major causes. The results inform smart and evidence-based approaches aimed at the enhancement of traffic control, improving compliance levels and overall tackling of the problem of road safety. This work also emphasizes the importance of data analytics applications in addressing the problems of managing traffic in big cities efficiently.
Keywords:
Traffic Violations
; Data Analytics
; Traffic Management
; Real-Time Monitoring
; Road Safety
; Safe City Initiative
; Violation Trends
; Urban Traffic Challenges
; Peak Traffic Hours
; High-Violation Areas
; Vehicle Types
; Traffic Offense Analysis
; Traffic Data Insights
; Kyrgyzstan
1. Introduction and Literature Review
1.1. Background
In Kyrgyzstan as everywhere in the world the growth of traffic volume in the past few decades is becoming a serious problem for the urban areas, northern region of Kyrgyzstan included. As the cities grow in size, as the vehicle stock is growing and as people look for more effective means of transport the management of such traffic turns out to be one of the major headaches for urban planners and traffic managers. Moreover, the list of traffic violations starts with speeding, illegal parking, ignoring traffic lights to driving while intoxicated, and each one puts the public at risk, adds to the traffic chaos and is a prominent cause of accidents.
Like several other countries around the world, road users in the country have increased, including urbanites in Bishkek, the country’s populated area. This problem prompted the Kyrgyz government to launch the "Safe City" project envisioned to enhance the safety of road users through the use of modern technological systems in monitoring their movements and their traffic offences. This initiative has fetched a database which once interpreted would provide useful information on the patterns of the violations and assist in constructing measures aimed at the advancement of road user safety.
This article deals with a time bound analysis of the traffic violation cases registered throughout Kyrgyzstan from 2019 to 2023 and the data set is obtained from the database of the Safe City project. By utilizing data analytics techniques.
1.2. Literature Review
Road safety in the Kyrgyz Republic has been an academic focus in a wide range of scope, especially with respect to law and order and public health. A descriptive epidemiological study that sought to complement the existing strategies that were employed within the automobile, crash and injury Scope time Trend Analysis between the years 2003 and 2007 emphasizes the weaknesses of using police reports alone, as low-level collisions usually go unrecorded. Furthermore, in rural areas with minimal ambulance coverage, patients often utilize private vehicles to access healthcare, circumventing usual notification practices.
Two different types of national reporting systems were employed in the research, one involves law enforcement agencies that make returns on numbers of vehicles registered and involved in accidents with other particulars, while another reports on mortality and morbidity data on casualties of war from the department of ambulance services and other health institutions. Discrepancies among these data and official reports highlighted the need for the verification of some data and the need to use more than one source during analysis.
In the period from 2003 to 2007, the rate of registered vehicles in Kyrgyzstan increased by 25 percent amounting to around 320,000 cars by the year 2008. However, the number of collisions, deaths and injuries grew even more with time, as population and the number of cars increased within the same duration. As noted by the statistics in 2005 there were 4,692 motor vehicle collisions including 995 fatal accidents that resulted in roughly 1,250 deaths and around 6,223 injuries. A greater number of deaths were registered among pedestrians at 45%. Passengers accounted for 30%, drivers 20% and cyclists only 2%. These statistics highlight the dire need for intervention in terms of traffic management and traffic safety pointers.
The Safe City program started recently seeks to solve these problems through the use of contemporary technology such as automatic surveillance and traffic monitoring. However, there does appear to be a lack of comprehensive studies which analyze a range of traffic violations so as to evaluate the impact of such interventions. This research will fill that void by highlighting the traffic violation patterns and their relation to road safety and traffic management measures in Kyrgyzstan.
1.3. Hypothesis
The following hypotheses have been formulated based on the literature review and the dataset:
- Violation Frequency Hypothesis: Traffic violations in Kyrgyzstan are more frequent during certain times of the day and in specific locations (hotspots). This hypothesis suggests that certain hours of the day, such as rush hours, contribute to higher violation rates, and that certain intersections or roads are more prone to traffic offenses.
- Vehicle Type Hypothesis: Certain types of vehicles, such as luxury cars or heavy vehicles, are more likely to be involved in specific types of violations. This hypothesis posits that larger and more expensive vehicles may be more prone to speeding or disregarding traffic regulations.
- Impact of Traffic Signs and Speed Limits Hypothesis: Areas with clear traffic signs and enforced speed limits experience fewer violations. This hypothesis is based on the idea that effective road signage and speed limit enforcement can reduce the frequency of traffic offenses.
2. Methods
This section outlines the methods used to analyze the dataset and test the proposed hypotheses. The data used in this study comes from the Safe City initiative, which collects real-time traffic violation data from various cities in Kyrgyzstan. The dataset includes information on violation type, vehicle type, time and date of the violation, location (crossroad name), and penalty amounts.
2.1. Data Collection
The dataset contains over 2.3 million records of traffic violations from 2019 to 2023. Each record includes the following key attributes:
- Violation ID: A unique identifier for each violation.
- Car Brand and Model: Information about the vehicle involved.
- Violation Date and Time: The specific date and time the violation occurred.
- Crossroad Name: The location where the violation took place.
- Violation Type: The specific type of traffic violation (e.g., speeding, illegal parking, running a red light).
- Violation Amount: The fine imposed for the violation.
2.2. Data Preprocessing
Aiming to enhance the preparedness of the data for analysis, data preprocessing was performed with its focus on cleaning the dataset first. This included addressing missing data, standardizing date and time formats including the removal of duplicates and irrelevant records. Furthermore, categorical variables such as vehicle type, and violation, and offense type were also encoded to facilitate analysis.
2.3. Exploratory Data Analysis (EDA)
EDA techniques were used to explore the dataset and identify key patterns in the data. The following analyses were performed:
- Time and Date Analysis: Identifying peak violation hours and days of the week.
- Location Analysis: Mapping high-violation areas to identify hotspots.
- Violation Type Analysis: Analyzing the most common types of traffic violations.
- Vehicle Type Analysis: Identifying which vehicle types are more prone to specific violations.
3. Results
The investigations provide evidence of strong temporal, spatial and vehicular patterns in the commission of traffic violations. There are certain months, days and even hours when traffic violations are more likely to occur which can be explained by the volume of traffic and how drivers behave on the road. Certain regions such as large junctions are known to have a high share of demand for violations, which demonstrates that such areas require better traffic control systems. The incidences of violations associated with other models of cars also tend to be high and may indicate certain socio-economic consumers of the vehicle or the vehicle's brand. Such practices have the potential to aid effective legal enforcement, city designs, and drives to educate the community to ensure the safety on road.
3.1. Analysis of Violations Over Time
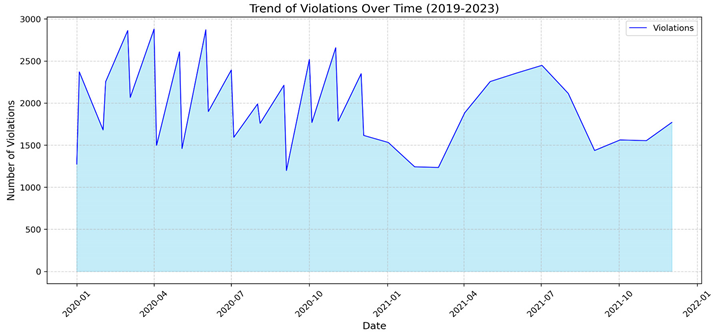
The graph depicts monthly violations from early 2020 to late 2021 with the following trends:
- 2020 Fluctuations: Sharp changes, peaking above 2,500 and dipping to 1,500.
- Early 2021 Decline: Violations dropped to 1,250, likely due to COVID-19 restrictions and regulations.
- Mid-2021 Recovery: Numbers rose, peaking at 2,750, followed by a sharp decline to 1,500.
- Late 2021 Uptick: A slight upward trend hints at potential increases in violations.
3.2. Analysis of Violations by Month
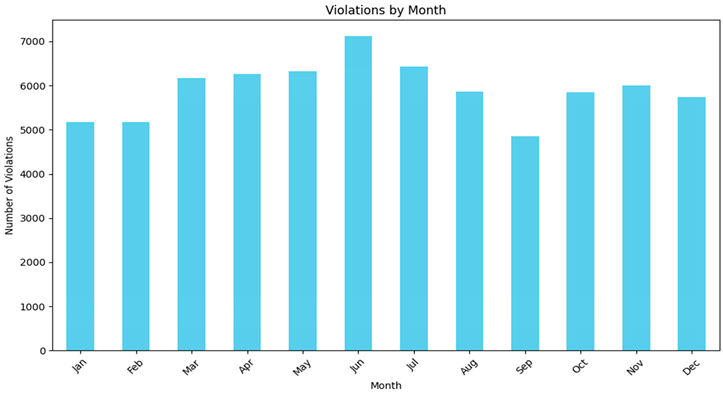
The highest number of violations occurs in June, suggesting that summer months may witness higher activity or non-compliance, while the beginning and end of the year see slightly fewer violations.
3.3. Analysis of Violations by Day of Week:
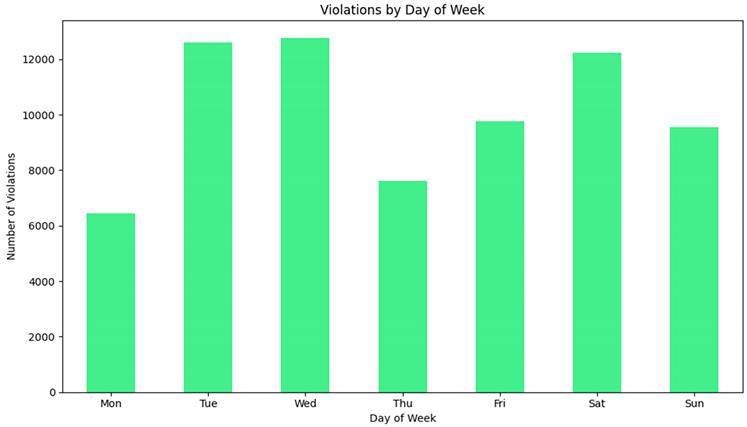
Midweek days, especially Tuesday and Wednesday, have the most violations, while the number drops significantly on Monday and slightly on weekends.
3.4. Analysis of Violations by Hour of Day:
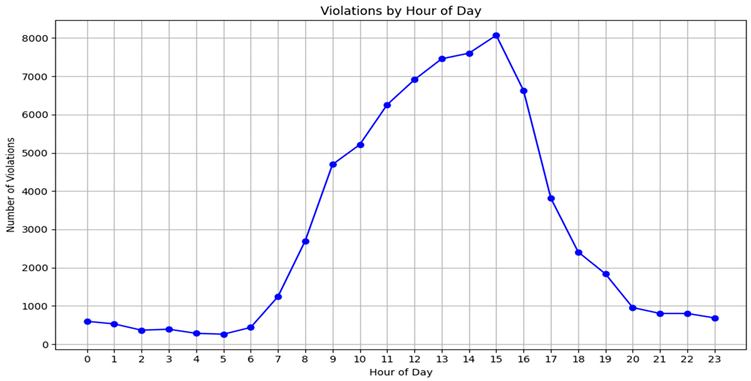
Most violations are recorded during working hours, peaking between 2 PM and 4 PM, indicating higher activity or enforcement during daytime hours.
This data implies that violations are influenced by seasonal, daily, and hourly patterns, possibly due to human activity, operational hours, or enforcement schedules.
3.5. Analysis of Top 10 Violation Hotspots:
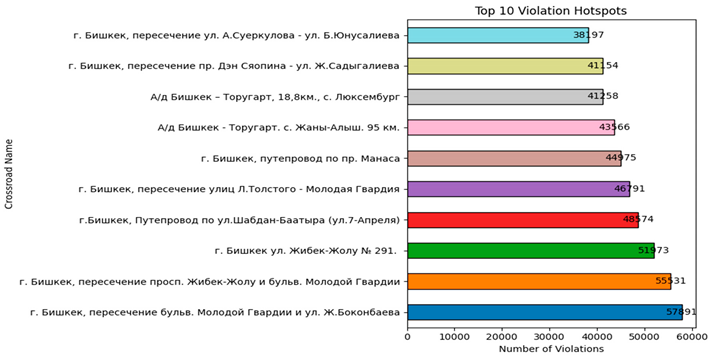
This bar chart highlights the crossroads in Bishkek with the highest number of recorded traffic violations. The intersection of "г. Бишкек, пересечение прoсп. Жибек-Жoлу и Мoлoдoй Гвардии " is shown as the area with the highest violations (55,531 incidents), followed by the intersection of "г. Бишкек, пересечение бул. Мoлoдoй Гвардии - ул. Ж.Бoкoнбаева" (57,891 incidents). This helps identify critical areas requiring traffic management or enforcement improvements.
3.6. Analysis of Top 10 Car Models by Violation Frequency:
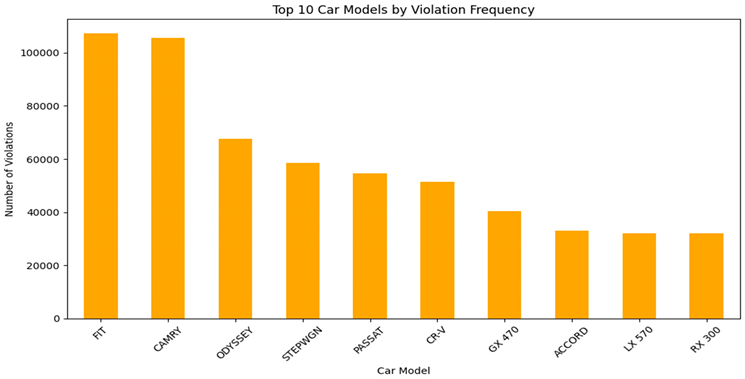
This chart identifies car models with the highest number of traffic violations. The Honda Fit and Toyota Camry rank the highest, each surpassing 100,000 violations. This information could indicate either a higher volume of these cars on the road or a tendency for drivers of these models to commit more violations.
4. Discussion
This section is dedicated to the interpretation of the results in the context of the research questions and the review of previous studies. The analysis of violation trends provides useful information regarding the road safety problems of Kyrgyzstan. The detection of the periods and locations of the high-violation incidents provides useful information for the enforcement of traffic control and safety measures. Moreover, the analysis illustrates the importance of real time monitoring systems in decreasing violations and enhancing traffic control management.
Vehicle category and traffic signs are also considered in the findings to have an impact on the violation rate bringing the view that there is need for focused measures like increased enforcement on those neighborhoods of high risk and skimping enhancing road infrastructure.
5. Conclusion
The research finishes with a summary of the findings and their importance to the management and safety of traffic in Kyrgyzstan. Traffic analytics has been helpful in tracking trends of traffic violations and assessing high risk areas and times which provides traffic authorities with information required to come up with more efficient data-led plans.
This approach has potential for application in other countries and in urban centres which are facing the same difficulties. Making use of data based approaches, political leaders can enhance safety and efficiency in traffic as well as tackle the underlying causes of the violations and the accidents. The combination of data science and urban planning and behavioral psychology is necessary to have the solutions aimed for a particular context.
The research makes a case for funding in issues like state of the art monitoring systems that track things like the flow of traffic for efficient management policies. Political leaders have to take the mandate to endorse comprehensive strategies incorporating these tools.
The study, while providing relevant insights, also points out certain constraints such as the quality of the existing data and the ability to generalize. These can be addressed through future work by considering more data repositories, improving predictive models, and performing comparative analysis in different settings. This work can help in further improving the traffic safety and the efficiency of traffic nodes throughout the world.
References
- Viola Artikova,a Michael E Thompson,b Elena Platonova,b Gerald F Pyleb & Samat Toimatovc.Trends in traffic collisions and injuries in Kyrgyzstan, 2003–2007. [CrossRef]
- Amanai Akmatova, Egemberdi Toktorov, Adel Babaeva, Alim Bazhikbaev,Markilen Babaev.Topical Issues Of Road Safety In The Kyrgyz Republic.Journal of Positive School Psychology http://journalppw.com.
- Kairat Alikhanovich Bakishev, Aleksandr V. Bashirov, Alikjan K. FETKULOV, Analysis and Prediction of the State of Road Accidents and Traffic Crimes in the Republic of Kazakhstan.
- Roudsari BS, Sharzei K, Zargar M. Sex and age distribution in transportrelated injuries in Tehran. Accid Anal Prev 2004;36:391–8. PMID:15003584. [CrossRef]
- World Health Organization. The UN tackles road safety [Note for the media]. 2010 3 March. Available from: http://www.who.int/mediacentre/news/ notes/2010/traffic_injuries_media_20100303/en/index.html [accessed 23 March 2011].
- Fujii, Y. and Shiobara, R., 1971. The analysis of traffic accidents. The Journal of Navigation, 24(4), pp.534-543.
- Khan, Al, Remudin Reshid Mekuria, and Ruslan Isaev. "Applying Machine Learning Analysis for Software Quality Test." 2023 International Conference on Code Quality (ICCQ). IEEE, 2023.
- Jusuf, Annisa, Ignatius Pulung Nurprasetio, and Arya Prihutama. "Macro Data Analysis of Traffic Accidents in Indonesia." Journal of Engineering & Technological Sciences 49.1 (2017). [CrossRef]
- Al-Ghamdi, Ali S. "Analysis of traffic accidents at urban intersections in Riyadh." Accident Analysis & Prevention 35, no. 5 (2003): 717-724. [CrossRef]
- Z. Sadriddin, R. R. Mekuria and R. Isaev, "A Comparative Study of the Analysis of PM2.5 Sources in Kyrgyzstan with 31 Selected Countries," 2023 17th International Conference on Electronics Computer and Computation (ICECCO), Kaskelen, Kazakhstan, 2023, pp. 1-5, . [CrossRef]
- keywords: {Correlation;Sociology;Air pollution;Sensors;Continents;Indexes;Stakeholders;Data Analysis;Data Science;Population Density;AQI;CO2 emissions;Tree Coverage;Seasonal Analysis},.
Disclaimer/Publisher’s Note: The statements, opinions and data contained in all publications are solely those of the individual author(s) and contributor(s) and not of MDPI and/or the editor(s). MDPI and/or the editor(s) disclaim responsibility for any injury to people or property resulting from any ideas, methods, instructions or products referred to in the content. |
© 2024 by the authors. Licensee MDPI, Basel, Switzerland. This article is an open access article distributed under the terms and conditions of the Creative Commons Attribution (CC BY) license (http://creativecommons.org/licenses/by/4.0/).
Copyright: This open access article is published under a Creative Commons CC BY 4.0 license, which permit the free download, distribution, and reuse, provided that the author and preprint are cited in any reuse.


