Submitted:
20 December 2024
Posted:
23 December 2024
You are already at the latest version
Abstract
This study examines the impact of corruption on innovation in businesses from a comparative standpoint, demonstrating that the relationship is undoubtedly heterogeneous between businesses and nations. There are two primary research questions addressed: i) In the countries under inspection does corruption help or hinder the innovative activities? ii) To what degree is the institutional framework and business strategy (domestic and international presence) influencing the relationship between corruption and innovation? We use the V and VI surveys (2012–2016 and 2018–2019) of EBRD-World Bank Business Environment and Performance Survey, with a balanced panel with 3584 establishments across 22 countries, economies of Eastern Europe and Central Asia. The findings show two key points about the link between corruption and innovation: (1) the importance of institutional settings for the link’s strength and even direction when EU and non-EU countries are compared and (2) the diverse effects of corruption at the firm-level, when foreign and domestic ownership is considered: the “greasing” effect is particularly relevant for foreign firms in weak institutional environments but appears useless, if not sanding, for foreign firms in settings with stronger controls over corruption.
Keywords:
Innovation
; corruption
; institutions
1. Introduction
This paper examines the impact of corruption-related issues on innovation.
Researchers studying international business have been compelled by globalization to look into the causes, characteristics, models, and theories of corruption as well as its relationships to legal frameworks and firm-level consequences. The problematization of corruption 1 as a source of economic risk and uncertainty is necessary in light of the goals and concerns of the global economy. Corruption is a matter of international concern as it causes uneven competition in the sense that it may impede or facilitate the successful execution of global economic strategies and its complexity is further amplified by digitalization that can act as a deterrent to it while also posing additional threats.
Two opposing perspectives on corruption were at hand. The literature has debated whether corruption "greases the wheels" or "sands them down" for countries’ development, and firms’ performance: at the macro level, only a few empirical studies have found that corruption is growth enhancing particularly, in contexts where institutions are fragile or less effective; at the micro/firm level, a growing number of empirical studies focused on firms’ performance, has produced mixed, ambiguous and even contradictory results 2.
Overall, the relationship between corruption and the likelihood of innovation, particularly at the firm level and in poor and emerging countries has not been fully explored. Despite the consensus on the negative country-level implications of corruption, its consequences for firms are less understood. In emerging markets, corruption remains a ubiquitous feature of doing business (Cuervo-Cazurra 2016). Additionally, a number of theoretical frameworks from different research streams have been applied in the literature 3; nevertheless, the majority of studies did not expressly state which theoretical framework the authors had employed. To tackle these concerns, we are driven to look into how corruption affects a company's ability to innovate.
When examining the relationship between innovation activities and corruption, a particular group of nations—the economies of Eastern Europe and Central Asia—is particularly relevant. Little progress was achieved in these areas to reduce corruption, and non-market strategies like bribery and corruption remain common. Furthermore, these nations have seen significant institutional transformations and involvement in the world economy that have led to notable regional differences in terms institutional quality, innovative performance, pervasiveness, and high tolerance for non-market strategies including corrupt activities (Krammer 2009). At the same time, in many developing countries, innovators are often subject to intense pressure from corruption, either as victims or as targets of rent-seeking activities (Ayyagari et al. 2014).
Given their relatively similar historical backgrounds and large variations in institutional quality, pervasiveness of corruption, and innovation performance, these countries are undoubtedly the ideal setting for business research (Meyer and Peng 2016) and testing the relationship between corruption and innovation. Additionally, comparing the nations that have joined the EU can provide a helpful comparison of how, over time, and in different countries due to various institutional contexts, the relationship between innovation and corruption varies, in presence of new European rules and incentives.
In this perspective we pick up some theoretical suggestions coming from institutional and agency theory standpoint. They both offer macro and micro mechanisms in coping with corruption and bribery.
The institutional and new-institutional theories address legal and regulatory frameworks, government statutes and rules, and courts as establishments of social, political, and legal norms that influence behavior and decision-making. The institutional framework affects firms’ strategies and grants them legitimacy (North 1990) addressing the role of formal and informal institutional factors 4 in shaping firms’ activities. Even the micro-perspective offered by new comparative economics can be considered as part of new institutional economics (Dallago and Casagrande, 2021).
Firm’s activities are strongly influenced by the interactions between institutions (formal and informal) and firms are under legal and social pressures to accept the standards, values, and beliefs of their surroundings. Analysed through the lens of transaction cost economics, corruption can be seen from a cost/benefit perspective; that is, it will discourage (encourage) firms and investors when the costs of the potential deal exceed (fall behind) its benefits (Rose-Ackerman 2008). Corruption can either “sand” or “grease” the wheels of business. When it “greases the wheels”, it enhances the performance and productivity of firms, representing a faster and less uncertain means to deal with bureaucratic obstacles. Conversely, corruption can “sand the wheels” by hindering firms' ordinary and innovative activities, by imposing supplementary costs amplifying uncertainty.
Institutional and neo-institutional theories present questions regarding the ways in which a corrupt, formal and informal institutional environment affects organizational legitimacy, values, corporate social responsibility, profitability, and strategic decision making (Keig et al. 2015; Lee and Hong 2012; Pantzalis et al. 2008).
From an international business viewpoint, this means that the institutional environment of the host and home countries matters. The host country, which controls corruption and upholds the rule of law, has a significant influence on the firms' mode-of-entry decision (Rodriguez et al. 2005), partner selection criteria decisions about international joint ventures (Roy and Oliver, 2009), the boards of the joint ventures (Hearn, 2015), the selection of national managers (Muellner, Klopf, and Nell, 2017), and the practice of bribery in cross-border transactions (Baughn et al., 2010; Yi, Teng, and Meng, 2017). The impact is identified even on firm's export performance (Krammer, Strange and Lashitew, 2018), earnings management (Bao and Lewellyn 2017), and foreign direct investment location, all impacted by the institutional environment of the host and home countries, of which the degree of corruption is one factor.
According to these theoretical suggestions, the quality of institutions defines the level of corruption in the host and home country, which influences the nations and firms’ behavior. The suggestion is that by improving the quality of institutions, the adverse effects of corruption can be minimized in international business.
Agency theory has treated agency problem in international business focusing on managers diverting corporate resources to maximize private benefits at the cost of shareholders because incentives are misaligned. Political institutions and the degree of corruption that influences business risk-taking decisions are related to this behavior (Boubakri et al., 2013). This clarifies the possible conflict that can arise in situations where the company's foreign subsidiaries provide bribes because of their political links with the company's headquarters (Yi et al., 2017).
In presence of competing interests, agency theory postulates that manager-controlled businesses give more bribes than shareholder-controlled businesses; providing empirical support for this idea (Chen et al., 2015). Bribery and corrupt business practices have also been linked to board features including management or shareholder-controlled enterprises and show that bribe behaviour by firms varies with ownership structure.
To date, the literature on the effects of foreign firms on corruptive practices in host economies is inconclusive. For instance, there are contradictory conclusions in the literature about the effect of corruption on FDI, with negative (Cuervo-Cazurra, 2006, Javorcik and Wei, 2009) and positive relationship (Barassi and Zhou, 2012) between corruption and FDI. Existing studies are divided between those that argue that multinational enterprises can bring about a reduction in bribery and those that argue the firms operating in international markets adapt to local conditions, norms and practices, with foreign owned firms paying larger bribes compared to domestically owned firms (Azhyrov and Masso, 2019). By studying the adjustments of multinational enterprises to corrupt environments, local market adaptation seems to prevail after entry (Couttenier and Toubal 2017) while in other cases, adjustment mechanism that originates in the previous investment in a corrupt system prevails before entry (Thede and Karpaty 2023) so that it is the past corruption experience that drives competitive advantage. In this last case corruption appears to play a “sanding or greasing the wheels” role, which depends on the timing and the enterprise's objectives. This is the case, for instance, of considering different firms’ objectives:
when corruption is associated to export decisions (Ha et al. 2021) in the developing markets where the corruption has been affirmed as a common issue and even an accepted norm (Nguyen et al. 2017), a positive impact emerges, particularly in case of powerful large-sized firms or those facing no institutional constraints. But the impact is negative on the likelihood of innovation (Lee, Wang and Ho 2020).
Applying these ideas to the relationship between corruption and innovation, the problem lies in the two opposing perspectives that exist on corruption. On the one side, innovation is impeded by corruption. An example is offered by emerging and transition countries: corruption at the firm level, in the manufacturing industry, and in regions with the worst governance or that are more corrupt has a significant negative impact on innovation (Lee Wang and Ho 2020). More contract-dependent firms are characterized by lower investment in R&D and smaller product markets in Central and Eastern Europe (Athanasouli and Goujard 2015). On the other side, as bribery makes it possible for more businesses to get beyond bureaucratic red tape and legislative barriers, speeding up transactions, corruption can actually help a company innovate more quickly as in case of India and Vietnam (Sharma and Mitra, 2015; Nguyen et al. 2016) rather than standing in the way of it.
In addressing this puzzle, we investigate the effect of corruption on firms’ innovation in a comparative perspective by showing that the link is surely not uniform across firms and countries (Iorio and Segnana 2021) and that in emerging markets, corruption remains a ubiquitous feature of doing business (Cuervo-Cazurra, 2006). Two main research questions are addressed in the present study: (a) Has corruption boosted or harmed the firm innovative activities in countries under inspection? (b) To what extent is the link between corruption and innovation mediated/ shaped by the countries’ institutional configurations and business strategy (foreign and domestic ownership)?
Our analysis shows a coexistence of a sanding effect at the country-level (more corrupted countries are less innovative) and the greasing effect at the firm-level (more corrupted firms are more innovative on average). However, there are heterogeneities at the-firm level. First, in terms of institutional environment: the greasing effect is confirmed with low corruption control so that corruption practices are a vehicle for innovation in weak institutional contexts but not in better institutional environment, where corruption is ineffective in the pursuit of innovative activities. Second, in terms of foreign and domestically-controlled ownership: the weak institutional environment in this case acts as enhancing the greasing link between corruption and innovation which appears severe and stronger among foreign-firms than among domestic firms. In this case, for being innovative, foreign firms must adapt to local conditions and corruptive practices of the host country. On the contrary, in more corruption-controlled environment, the link sands the wheels of innovation: corruption is useless for innovative domestic firms and even more useless for foreign companies. Ultimately, corruption can be useless or useful for innovative activities depending on the context and the degree of adaptation to it.
2. Data and Main Variables
The source of data is EBRD-World Bank Business Environment and Performance Survey (BEEPS), an initiative jointly launched by The European Bank for Reconstruction and Development and the World Bank group. We used data from 22 nations, all emerging markets, including more developed Central and Eastern European nations, transition economies from the Balkans and Central Asia, as well as Turkey. We used firm-level data on innovation and corruption from this survey. The main benefit of utilizing BEEPS is that data are gathered in a methodical manner using standardized questionnaires and stratified sample methodologies, which provide cross-country comparability and national representativeness. We combined the V and VI surveys, which covered the years 2012–2016 and 2018–2019, respectively, using each firm's identification number 5. This produced a balanced panel with 3584 establishments that belonged to registered enterprises 6.
UNCTADSTAT has categorized seven of the twenty-two countries as developing countries (all the Asian countries included in the sample; Turkey, Georgia and Kazakhstan, which are transcontinental countries, are also included in this group), fifteen as developed countries (all the European countries in the sample; Russia, which is transcontinental, is also included). Six of the developed countries are classified by Word Bank as high income countries: they are Russia, Latvia, Lithuania, Estonia, Slovenia, and Poland. The latter ones relate to nations like Latvia, Lithuania, Estonia, Slovenia, and Poland that have undergone both a regional economy and a national economy shift while moving from a socialist to a market economy inside the European Union (EU).
The Appendix's Table A1 lists companies by the nation that is being examined. The establishments with their own management and labor control constitute the unit of analysis for these surveys. The establishments are actual places where services are provided, business is conducted, or industrial processes occur.
Firms made up of one or more establishments are referred to as firms. About 10% of the observations show that the establishment is a component of a larger firm; in other instances, the establishment operates alone. Because of this, even though the data are surveyed at the establishment level, we nevertheless refer to firms. We also make use of control over corruption statistics from the nation in which the enterprises are located; they are World Bank Statistics' Worldwide Governance Indicators. Six aspects of governance have both aggregate and individual governance indicators available; control of corruption was chosen and used as one of them 1. The Appendix's Table A3 lists each country's values for the control of corruption in 2013 and 2018.
2.1. Main Variables
The link between corruption and innovation implies two crucial variables for our analysis. Innovations are commonly associated with major changes to a firm's products, services, and processes, typically building upon new knowledge. We consider product innovation. Data on new product introduction are obtained from BEEPS using the answers obtained from the question “In the last three years, has this establishment introduced new products or services?” This variable (named Innoprod in the following analyses) is binary, as it assumes value 1 if new product or services have been introduced, 0 otherwise. The introduction of new products represents a central aspect of firms’ strategy that not only enables organizations to introduce new products to the market but also challenges organizations to renew their technological capabilities (Wang & Chen, 2018). It provides avenues to diversify and adapt to evolving markets and determines their subsequent survival and success.
The other crucial variable is corruption. The measure of corruption records bribes at the firm level. Our bribery metric, which is based on the question, "On average, what percentage of total annual sales, or estimated total annual value, do firms like this one pay in the form of informal payments or gifts to public officials for this purpose?" is in line with the first recent research on corruption and firm strategy (Krammer, 2019). FirmCorruption is a dichotomous variable that takes values of 1 and 0 depending on whether the firm claimed it has paid anything or not and paid an informal payment of any amount.
The following analysis shows that this dichotomous variable has a considerable impact on innovation, but variations in the bribe's value have no discernible impact on the likelihood of innovation: what matters is not the amount that firms pay, but rather whether they have paid bribes or not.
We further hypothesize that the relationship between corruption and innovation is influenced by the institutional context in which the firm works. As a relevant measure of the quality of the institutional context we consider the Control of Corruption, one of the World Bank Worldwide Governance Indicators 7 (we call it Controlcorr) and we suppose that the higher the level of the country’s Control of Corruption, the lower the impact of firm corruption on innovation. To test this hypothesis, an interaction is introduced between the corruption at the firm level and the Control of Corruption (FirmCorruption#Controlcorr).
In the preliminary analysis with the purpose of clarifying this link, we categorize countries into three groups, based on descending level of Corruption.
More precisely, we consider the level of Control of Corruption in 2013 and 2018 and we classify countries according to the average between those two values:
CountryGroup 1 includes the seven countries with the highest average value of Control of Corruption (Estonia, Slovenia, Poland, Georgia, Lithuania, Latvia, Croatia), CountryGroup 2 includes eight countries with an intermediate value (Montenegro, Turkey, Belarus, Serbia, Bosnia-Herzegovina, Mongolia, Kosovo, Albania) and CountryGroup 3 includes the seven countries with the lowest average value (Kazakhstan, Moldova, Russia, Kyrgyzstan, Ukraine, Uzbekistan, Tajikistan) 8.
We are also interested in comparing the impact of corruption on innovation between domestic and foreign firms (Foreign firms are owned at least by 10% by private foreign individuals, companies or organization; the firms which are not Foreign are considered as Domestic firms). Therefore, we create the dummy variable Foreign, having value 1 for foreign firms and 0 otherwise; then we interact this variable with FirmCorruption (FirmCorruption#Foreign).
Our analysis's last stage is to determine whether the aforementioned disparity in the strength of the corruption-innovation link between domestic and foreign enterprises takes on a different sign or size depending on the institutional quality level. The final step of our analysis consists in evaluating if the above-mentioned difference between domestic and foreign firms in the intensity of the corruption-innovation link assumes a different sign or magnitude at different levels of institutional quality. For this purpose, we utilize the three groups of countries, distinguished by decreasing levels of control of corruption.
In order to lessen the possibility of confounding effects and to capture additional company characteristics that might be connected to innovation and corruption, control variables will be incorporated in the multivariate analysis. We take into account the basic innovation input, research and development (R&D), and other elements of the company's knowledge capital, such as staff training (Training) and ownership of foreign technology (ForeignTechnology).
We also include the market competitiveness among the control variables since it is a significant factor in determining product innovation 9. The number of competitors that each of the participating companies faces in the market for their primary establishment was questioned. "Too many to count" was one of the possible responses 10. Three competition levels are distinguished: Competition_low, which occurs when competitors fall between 0 and 5 (the benchmark); Competition_medium, which occurs when competitors fall between 5 and 5 but may still be counted; and Competition_high, which occurs when competitors cannot be counted (value 5 is chosen because is the median among the firms that declare a countable number of competitors).
In addition, we include a dummy variable on the firm's presence in international markets (Export) and the size of the company (Size), which is expressed as the log of the number of employees. One of the control variables in the first estimated model, which examines the relationship between FirmCorruption and CountryGroups, is the previously mentioned variable Foreign.
3. Institutional Quality, Corruption and Innovation: A Preliminary Analysis
As reported in the previous section, countries are organized in three groups, according to their level of Control of Corruption.

Table 1.
Sample of BEEPS dataset.
| Number of countries | Number of firms | |
|---|---|---|
| Group 1 | 7 | 1362 |
| Group 2 | 8 | 3068 |
| Group 3 | 7 | 2738 |
| All countries | 22 | 7168 |
Source: EBRD-World Bank Business Environment and Performance Survey (BEEPS).
For each group of countries, the Control of corruption averages 11 are reported in Table 2, together with the percentage of firms paying bribes and the percentage of innovative firms. Group 1 has the highest values of Control of Corruption associated with the lower proportion of corrupting firms and the highest value of innovative firms. Between groups of countries, a negative link is observed between corruption and innovation. The institutional quality, expressed by the Control of Corruption, decreases from Group1 to Group 2 and to Group 3. The decrease in the control of corruption corresponds to an increase in the use of corruption and a decrease in the innovative performance of companies.
Detailed information by country is reported in the Appendix (Table A1 and A2)
With an emphasis on innovation and corruption, the Table 3 below illustrates this link by comparing innovative firms using bribes to those that do not use it. Somehow, this difference could indicate the impact of corruption at the firm level, by group and in the whole sample.
Although there is a positive correlation, its strength varies greatly amongst the three country groups: in Group 1, which has the best institutional quality, companies that do not pay bribes are nearly as innovative as those that do. In Group 2, and particularly in Group 3, where institutional quality is declining, the gap between companies that pay and those that do not grows. We can conclude that the effect of corruption on the share of innovative firms is increasing when the institutional quality decreases turning from negative to positive.
This link could be different when we differentiate between domestic and foreign firms.
As foreign firms we consider the firms with at least 10% of foreign property, in line with FDI international accounts standards. The other firms are classified as domestic firms.
Table 4 shows the highest percentage of foreign firms in Group 1, characterized by lower corrupting activities in comparison with domestic firms; on the contrary, in Group 2 and 3 the smaller presence of foreign firms is associated to more frequent corrupting behavior. In each group the share of innovative activity is significantly higher among foreign firms.
The "effect" of corruption on innovation is now measured for both domestic and foreign firms, for every group of countries, and for the entire sample. The entire sample reveals negligible variations between corruption in domestic and international firms: overall the effect is positive and of similar magnitude in both categories. Group-to-group variations are more pronounced: in Group 1 where the effect of corruption is negligible for domestic firms, while it is strongly negative for foreign firms (the foreign firms paying the bribes do not include any innovative firms). In Group 2 the effect of corruption on innovation is positive and rather close for both groups of firms, while it is much stronger for foreign firms in Group 3.
3.1. The Main Hypotheses
In the previous section some empirical regularities emerge, related to countries and firms under inspection and in search of an explanation.
First, as Table 2 and Table 3 showed, in our sample the institutional settings matter for the link between corruption and innovation. At the firm level (within country) there is a positive link (greasing) when the institutional corruption control is very weak so that corruption is a sort of necessary vehicle for innovations.
Second, as Table 4 and Table 5 show, corruption could be helpful for innovative activities not only for domestic but also for foreign firms. When the overall greasing effect at the firm level is distinguished between firms with a significant share of foreign ownership and domestically-controlled firms the intensity of the link is magnified when corruption control is weak.
The theoretical considerations and the preliminary analysis lead us to develop two main hypotheses that connect innovation activities to institutional setting and corruption activities, hypotheses subject to empirical testing with multivariate analysis:
HYPO1. The intensity of the relationship between corruption and innovation at the firm level is significantly affected by institutional settings. When the institutional quality lowers, the intensity of this positive relationship increases.
HYPO2. Among foreign-owned firms, the impact of the institutional setting is enhanced: innovation is more likely to be affected by corruption when institutional quality is very poor and vice versa when institutional quality is high.
4. Estimation Strategy
For our multivariate estimation, we adopt a panel data model with random effects. We have just two periods and the fixed effect model is not particularly reliable when time periods are limited (Hill et al., 2020. Furthermore, when we study the differences between domestic and foreign firms, within-firm variability, the only one captured by fixed effects, is almost absent as very few firms change their status between domestic and foreign firms from one wave to the next.
As the dependent variable, product innovation (Innoprod), is binary, probit is an appropriate model. The interaction effect between Firm corruption and the Control of Corruption is estimated through the following Model (1):
Innoprodi,t = Φ {α0 + β1FirmCorruptioni,t + β2 Controlcorri + β3FirmCorruptioni,t* Controlcorri + Xγ + λs + ui + vit}
Where i and t are respectively firms and time. Φ denotes the cumulative standard normal distribution; Innoprod stands for the binary variable, if a product innovation has been introduced or not in the past 3 year; FirmCorruption is the binary variable with value 1 if the firm paid a bribe, Controlcorr is the Control of Corruption of the country where the firm is located (we adopt the value in 2013 for the first wave and the value in 2018 for the second wave of our dataset), X is the matrix of control variables (details in the Section 3; in this model the variable Foreign is included among the control variables) with their vector of coefficients γ; λs are sector dummies; the error term has an individual-specific time-invariant component (ui) and an idiosyncratic component (vit).
The interaction effect between Firm corruption and the kind of firm (domestic or foreign) is estimated through the following Model (2a):
Innoprodi,t = Φ {α0 + β1FirmCorruptioni,t + β2 Controlcorri + β3FirmCorruptioni,t*
Controlcorri + β4 Foreign i,t + β5FirmCorruptioni,t* Foreigni,t + Xγ + λs + ui + vit}
Foreigni,t is the binary variable with value 1 if the firm has at least a 10% of foreign property.
This model is estimated for each of the three nation groups independently as well as for the entire dataset. The modest variability and low number of observations implies that Model (2a) cannot be estimated in CountryGroup 1. Conversely, a linear probability model can be estimated for each country group. This is the rationale behind using the model known as (2b) for group comparisons.
Innoprodi,t = α0 + β1FirmCorruptioni,t + β2 Controlcorri + β3FirmCorruptioni,t*
Controlcorri + β4 Foreign i,t + β5FirmCorruptioni,t* Foreigni,t + Xγ + λs + ui + vit
In non-linear models, like probit, it is impossible to accurately determine the sign and significance of interactions in non-linear models, like probit, by simply looking at the sign, entity and significance of their coefficients: it is needed to separately estimate the marginal effects of each variable at different levels of the other (Ai & Norton, 2003). Therefore, estimates are made of the marginal effects of FirmCorruption on Innoprod at different levels of Controlcorr (Model 1) and of Foreign (Model 2a). In contrast, the coefficients in the linear probability model directly represent the size, sign, and significance of the marginal effects. The next section displays each marginal effect, along with its confidence interval, for the linear probability model and the probit model using several graphs.
4.1. Results
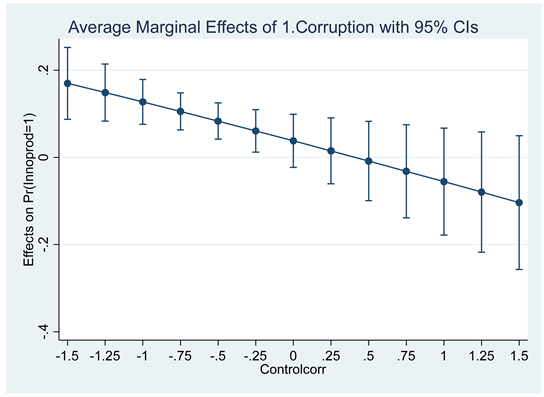
As a first step, to analyze if the firm corruption has a different effect on innovation at different levels of Control of Corruption, we estimate Model (1). Table 6 reports the results of the estimation of Model 1. The average marginal effect of FirmCorruption, separately calculated, is positive (0.073) and significant at 5%. (in the following, if not differently specified, the term significant means significant at 5% level). Graph 1 reports the estimated marginal effect of FirmCorruption at different levels of Controlcorr. It shows that the impact of firm corruption on product innovation decreases as the Control of Corruption increases. From a greatly favorable influence when Control of Corruption is low to a negative (even if not significant) impact when Control of Corruption is strong, the effect of company corruption on product innovation reduces as the Control of Corruption grows 12.
Statistics
| Dep.var.: Innoprod | |
| Number of observations | 5282 |
| Number of groups (firms) | 3292 |
| Log likelihood | -2620.6819 |
| Wald chi2 Prob > chi2 |
(41) 548.360.000 |
Graph 1 Marginal effects of FirmCorruption on Product innovation at different levels of Control of Corruption- Probit model with random effects
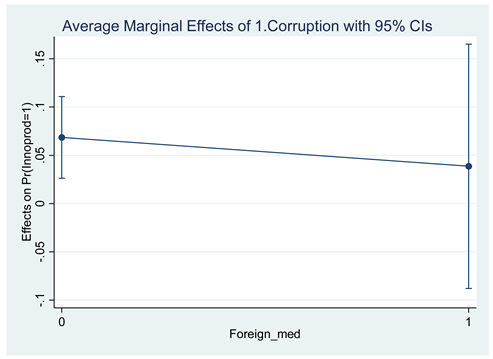
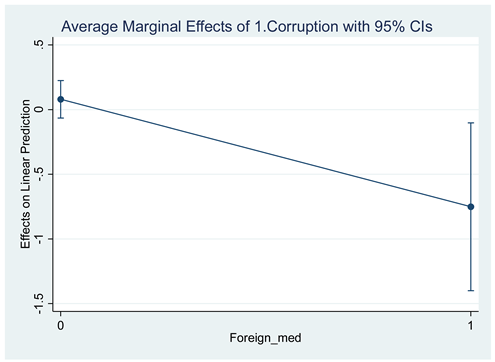
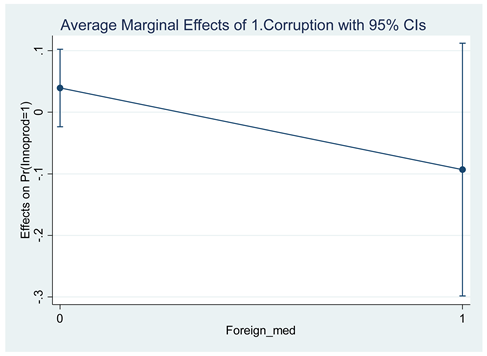
As a second step we evaluate whether or not the impact of corruption on the share of innovative firms is different between foreign and domestic units of analysis. To evaluate if the impact of FirmCorruption on the product innovation is different between Foreign and Domestic firms Model 2 is estimated, in the whole sample and in the three country groups. Both the probit model (2a) and linear probability model (2b) are estimated. Coefficients of FirmCorruption among domestic (on the left) and foreign (on the right) firms are illustrated by Graphs 2-5 as results of the probit model for the whole sample (Graph 2), of the linear probability model for CountryGroup 1 (Graph 3) and of the probit model for CountryGroup 2 and 3 (Graphs 4 and 5) 13.
There is no discernible difference in the impact between domestic and foreign enterprises when looking at the entire sample (Graph 2), but some intriguing differences show up when looking at country groups: in CountryGroup 1 (Graph 3) for domestic firms, the effect of FirmCorruption on Innoprod is positive even if not significant while for foreign firms it is negative and significant; the difference in corruption effect between domestic and foreign firm is also significant. Similarly to CountryGroup 1, in CountryGroup 2 (Graph 4) the punctual estimation of the corruption effect is positive for domestic firms and negative for foreign firms, even if the difference is not significant here.
The impact of firm corruption on Innoprod is positive and substantial for both domestic and foreign firms in CountryGroup 3 (Graph 5). In contrast to the other country groups, the influence of Firm Corruption on Innoprod has a bigger effect on foreign firms (Graph 5) 14.
Graph 2 Marginal effects of FirmCorruption on Product innovation in Domestic and Foreign firms- Probit model with random effects - All countries
Graph 3 Marginal effect of FirmCorruption on Product innovation in Domestic and Foreign firms- Linear probability model with random effects – Country Group1
Graph 4 Marginal effects of FirmCorruption on Product innovation in Domestic and Foreign firms- Probit model with random effects - Country Group 2
Graph 5 Marginal effects of FirmCorruption on Product innovation in Domestic and Foreign firms- Probit model with random effects - Country Group 3
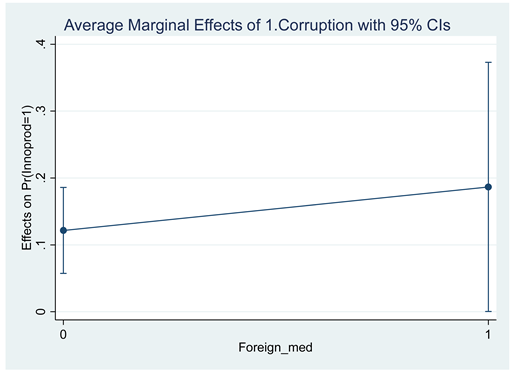
Table 7 gives a detailed framework of the marginal effects. For both domestic firms and foreign firms it displays the estimated marginal effects of FirmCorruption, according to the probit model and the linear probability model along with their significance, for the various groups of countries and the entire sample.
We may conclude that, among the foreign firms, the deviations from the average effect are amplified moving along the three Groups. Compared to the overall effect of corruption on innovation, we observe two extreme situations: surely Group 1 shows that this impact is smaller and even smaller for foreign firms (becoming negative); conversely, in Group 3 the effect of corruption on innovation is more important with a stronger impact for foreign firms.
Summing up, we conclude that both bivariate and multivariate analysis show two heterogeneous aspects of the link between corruption and innovation.
The first one is about the heterogeneous link in the country-comparison perspective in line with hypothesis 1. The overall effect of corruption on innovation is positive (in the entire sample), but it is not uniform across the sample. Descriptive statistics indicate that when countries are grouped according to decreasing levels of corruption control, the impact of corruption on product innovation is nearly neutral in the group with the highest level of control, positive but relatively limited in the group with intermediate control, and very high in the group with the lowest level of control. The inverse relationship between the intensity of the corruption-innovation link and the level of Control of corruption is thoroughly and confirmed by multivariate analysis.
In specific markets (countries) bribery can help innovators to introduce new products in line with Krammer (2017) by overcoming bureaucratic obstacles, compensating for the lack of kinship or political affiliations, and hedging against political risk, confirming the importance of political connections for firm innovative activities as in Krammer and Jimenez (2020).
The second aspect, of the heterogeneity is at the firm-level, about the ownership of the enterprises, whether domestic or foreign and is in line with hypothesis 2. In this situation, looking at the entire sample, the direction and intensity of the link between corruption and innovation do not differ significantly across domestic and foreign enterprises. But examining this issue inside each group of countries, interesting differences emerge: when the country’s institutional quality is high, for domestic firms paying a bribe is not associated with a variation of innovative capacity, but for foreign firm such association is negative; when the country’s institutional quality is low, for the foreign firms paying a bribe is a vehicle for innovation, as and more than for domestic firms.
5. Conclusions
Corruption is the subject of a vast literature because, to varying degrees, it poses a serious challenge to economies and societies around the world. The simultaneous existence of a positive impact on business performance and a negative impact on a country growth makes action to combat it necessary, but surely not trivial. Different levels of complexity arise, today further amplified by digitalization in a global world that can act as corruption-deterrent while also posing additional threats.
Many programs are based on the idea that promoting openness, liberalization and privatization are fundamental tools for fighting corruption. But what is crucial is to understand the institutional origins of corruption and its interaction with the institutional settings, taking them into account in designing polices (Rose-Ackerman and Truex, 2012; Ohnsorge and Yu, 2021). In drawing together the two, apparently distinct and disparate, discourses of corruption and globalization, corruption has emerged as a problem to the extent that it constitutes a potential barrier to the effective implementation of any kind of global economic strategies devoted to innovative behaviors, further amplified by the perverse effects of digitalization15.
Our results show a coexistence of an institutional sanding and a greasing effect at different levels of analysis (country and firm). At the firm-level or within a country, the presence of corruption implies a positive relationship between corruption and firms’ innovative activities: this link is characterized by heterogeneity, being not significant for countries with a high level of Control of corruption, (in our sample, mainly the case for EU member countries) and magnified in poorly corruption-controlled settings, where corruption practices are a significant vehicle for innovation. Furthermore, when this greasing effect at the firm-level is distinguished between firms with a significant share of foreign ownership and domestically-controlled firms, it is magnified for the foreign presence especially in specific group of countries where corruption is badly controlled. In this case, for being innovative, foreign firms must adapt to local conditions and corruptive practices of the host country. On the contrary, in more corruption-controlled environment, the link sands the wheels of innovation: corruption is useless for innovative domestic firms and even more useless for foreign companies.
This is in line with the results of the effects of foreign firms in host countries that signal the adaptation of foreign firms operating in international markets to local conditions and practices and consistent with the outcomes of foreign companies' impacts in some host nations, which indicate how businesses functioning in global marketplaces must adjust to local norms and circumstances in order to innovate. This is also consistent with corruption's uneven influence as both a required vehicle for innovation in certain circumstances and an ineffective instrument for increasing innovative activity in others.
In summary, the lesson for policymakers, is that addressing corruption and its relationship to innovation is a complicated issue with unintended consequences arising from the interplay between macro-institutional variables and micro-business strategy. Surely it shows the importance of institutional settings when comparing EU members with non-EU countries, as evidenced by the sanding and greasing impact of corruption on innovation. But it also shows the diverse effects of corruption at the firm-level, very useful and effective with increased greasing in weak institutional environments, especially important for foreign enterprises, and very useless and ineffective in environments with stronger controls over corruption. Therefore, any kind of anti-corruption policy packages need to be carefully tailored to country conditions and market and non-market business strategies.
Our results, however, are not without flaws. Firstly, while the panel data allows us to draw long-term implications of bribery strategies, future research should go into greater detail, by for instance including a better understanding of the methods for reticence-adjusted estimates of corruption. Secondly, while BEEPS is well-known as one of the best sources of data for detecting firm-level wrongdoing, it is susceptible to measurement difficulties. This requires utilizing microdata to overcome the limitations of cross-country macrodata, as well as determining the best technique for evaluating corruption in both observational and experimental data.
Notes
- 1
- Transparency International defines corruption as; the abuse of entrusted power for private gain https://www.transparency.org/en/what-is-corruption; and bribery is a subset of corruption defined as the offering, promising, or giving of something to influence an official. Corrupt transactions can be extremely simple or extremely complex. They include both grand (political) and petty (administra-tive) corruption, as well as organized and disorganized corruption. In any case, no definition of cor-ruption is fully clearly-cut. It also has many different interpretations, varying over time and context as well as by discipline. Notwithstanding the differences in definition between corruption and bribery, in this work we use the two terms as synonymous.
- 2
- Among the 50 micro-level empirical studies analyzed by Martins et al. (2020) focusing mostly on single countries, 31 studies have concluded that corruption (mostly bribery) is harmful to firm performance, whereas 19 suggest the opposite.
- 3
- Bahoo et al. (2021) in the bibliometric analysis of the literature on corruption in the discipline of economics between 1968–2019 identify seven streams of the literature.
- 4
- Voigt (2012) focus on how to measure institutions and updates the North’ view of formal and informal institutions and later Voigt (2018) identifies the difficulties in measuring in-formal institutions.
- 5
- Original data can be downloaded, , at the link https://www.beeps-ebrd.com/data/.
- 6
- Data can be downloaded, , at the link https://www.beeps-ebrd.com/data/. Some panel data are already present and downloadable on the site, but they concern previous surveys (II-IV surveys and IV-V surveys).
- 7
- Data about Control of corruption, which are not included in the regressions but only in descriptive statistics, are from the World Bank Worldwide Governance Indicators.
- 8
- From the perspective of their respective locations and histories, the three groupings of nations—which were produced by a "ranking" of the degree of control over corruption—seem to be very similar: all of the countries in the sample that belong to the European Union plus Georgia are included in CountryGroup 1; all of the countries in the sample that belong to the former Soviet Union, excluding Belarus, which has a significantly higher ranking in terms of Control of Corruption, and the Baltic countries, which share a lot of history with Western Europe, are included in CountryGroup 3.
- 9
- Measures of bribery are positively and robustly associated with innovation as in Karaman Kabadurmus and Sylwester (2022) especially for firms reporting many competitors supporting the inference that bribes facilitate innovation by allowing firms to evade regulatory obstacles.
- 10
- The complete question, numbered as E2 in the Questionnaire, is: “For the main market in which this establishment sold its main product, how many competitors did this establishment’s main product face?”.
- 11
- Weighted mean of the Control of Corruption for each country reported by the Worldwide Governance Indicator of the World Bank Group. Data by country are reported in Table A2 in the Appendix. The range for Control of Corruption is from -2.5 (minimum control of corruption) to +2.5 (maximum control, of corruption), Weights are the number of firms for each country included in the sample.
- 12
- Notice that the 95% confidence intervals do not overlap when comparing those for the lowest Controlcorr levels with those for the highest, therefore the decreasing effect of corruption when Controlcorr increases can be considered significant.
- 13
- Results of probit model are more reliable than results of linear probability model. Nevertheless, due to the limited number of cases, probit model was not estimable in CountryGroup1.
- 14
- These results do not depend on the composition and size of the country groups. We estimated a model that include a triple interaction between FirmCorruption, Controlcorr, and Foreign for the whole sample. We then computed the estimated marginal effect of FirmCorruption on innovation for both domestic and foreign firms at various levels of Control of Corruption (high, intermediate, and low levels) and the results are in line with those previously reported.
- 15
- Malik and Froese 2022.
Appendix A
Table A1.
Firms by country. Percentage of innovative firms. (product innovation), of firms paying bribes and of foreign firms.
Table A1.
Firms by country. Percentage of innovative firms. (product innovation), of firms paying bribes and of foreign firms.
| Countries | Number of Firms | % Innovative firms (product) | % Firms payingbribes |
% Foreign firms |
|---|---|---|---|---|
| Albania | 152 | 23.36 | 21.21 | 8.22 |
| Belarus | 158 | 35.24 | 4.41 | 12.66 |
| Bosnia and Herz. | 151 | 43.67 | 6.20 | 7.28 |
| Croatia | 71 | 39.44 | 6.82 | 7.75 |
| Estonia | 63 | 29.37 | 2.04 | 11.11 |
| Georgia | 110 | 25.45 | 0 | 5.91 |
| Kazakhstan | 140 | 17.69 | 9.13 | 2.86 |
| Kosovo | 78 | 48.08 | 7.69 | 0 |
| Kyrgyzstan | 147 | 40.29 | 32.76 | 19.34 |
| Latvia | 90 | 40.00 | 1.99 | 14.44 |
| Lithuania | 75 | 30.14 | 3.91 | 4.00 |
| Moldova | 142 | 32.16 | 7.75 | 8.80 |
| Mongolia | 172 | 36.63 | 16.87 | 4.65 |
| Montenegro | 69 | 21.01 | 12.50 | 8.70 |
| Poland | 194 | 31.95 | 7.04 | 4.12 |
| Russia | 400 | 16.94 | 8.44 | 3.12 |
| Serbia | 145 | 38.54 | 6.93 | 9.31 |
| Slovenia | 78 | 54.25 | 6.87 | 16.03 |
| Tajikistan | 115 | 19.65 | 10.81 | 4.35 |
| Turkey | 609 | 11.08 | 3.39 | 2.79 |
| Ukraine | 168 | 33.23 | 27.34 | 5.36 |
| Uzbekistan | 170 | 11.50 | 1.88 | 12.35 |
| TOTAL | 3.584 | 26.27 | 8.40 | 6.61 |
Source: EBRD-World Bank Business Environment and Performance Survey (BEEPS).
Table A2.
Control of corruption by country.
| Countries | 2013 | 2018 |
|---|---|---|
| Albania | -0.70 | -0.52 |
| Belarus | -0.47 | -0.19 |
| Bosnia and Herz. | -0.24 | -0.57 |
| Croatia | 0.12 | 0.13 |
| Estonia | 1.19 | 1.51 |
| Georgia | 0.47 | 0.71 |
| Kazakhstan | -0.93 | -0.5 |
| Kosovo | -0.65 | -0.52 |
| Kyrgyzstan | -1.16 | -0.95 |
| Latvia | 0.33 | 0.33 |
| Lithuania | 0.43 | 0.5 |
| Moldova | -0.75 | -0.73 |
| Mongolia | -0.48 | -0.43 |
| Montenegro | -0.25 | 0.02 |
| Poland | 0.60 | 0.64 |
| Russia | -1.01 | -0.85 |
| Serbia | -0.30 | -0.37 |
| Slovenia | 0.73 | 0.87 |
| Tajikistan | -1.28 | -1.42 |
| Turkey | -0.09 | -0.34 |
| Ukraine | -1.26 | -0.87 |
| Uzbekistan | -1.26 | -1.07 |
Source: World Bank Worldwide Governance Indicators. Values of such index range from -2.5 (minimum control of corruption) to +2.5 (maximum level of control of corruption).
Table A3.
Description of variables.
| Variable name | Kind of variable | Description |
|---|---|---|
| Innoprod | Binary | 1= In the last three years, the establishment has introduced new products or services. 0 = otherwise |
| FirmCorruption | Binary | 1= In the last three years the establishment has paid an informal payment “to get things done”. 0 = otherwise |
| CountryGroups | Categorical | 1.The establishment is located in one of the following countries: (Latvia, Lithuania, Estonia, Poland, Slovenia). 2.The establishment is located in one of the following countries: (Croatia, Serbia, Bosnia-Herzegovina, Montenegro, Albania, Kosovo, Ukraine, Belarus, Moldova, Georgia, Turkey). 3. The establishment is located in one of the following countries: Russia, Uzbekistan, Tajikistan, Kazakhstan, Kyrgyzstan, Mongolia |
| Controlcorr | Continuous | Value of Control of Corruption, from World Bank Worldwide Governance Indicators |
| Foreign | Binary | 1.The firm is owned at least by 10% by private foreign individuals, companies or organizations. 0. Otherwise |
| Competition | Ordered categorical | 1.Low: in last fiscal year, in the market where the establishment sells its main product, it faced from 0 to 5 competitors. 2. Medium: the establishment faced more than 5 competitors (but still countable) 3. High: the establishment faced uncountable competitors (“too many to count”). |
| RD | Binary | 1.In the last three years the firm spent in R&D activities, either in-house or contracted with other companies (outsourced). 0. Otherwise |
| Train | Binary | 1. In last fiscal year the establishment had formal training programs for its permanent, full-time employees. 0.Otherwise |
| Fortech | Binary | 1. The establishment uses technology licensed from a foreign-owned company, excluding office software. 0.Otherwise |
| Size | Continuous | Natural logarithm of the number of employees. |
| Export | Binary | 1. In last fiscal year a positive percentage of establishment’s sales are direct or indirect exports. 0.Otherwise |
References
- Ai, C. , and Norton, E.C. (2003). Interaction terms in logit and probit models. C. ( 80(1), 123–129. [CrossRef]
- Ashyrov, G.; Masso, J. Does corruption affect local and foreign-owned companies differently? Evidence from the BEEPS survey, Post-Communist Economies 2020, 32, 306–329. Available online: https://apisemanticscholarorg/CorpusID:202308506. [CrossRef]
- Athanasouli, D.; Goujard, A. Corruption and management practices: Firm level evidence. Journal of Comparative Economics 2015, 43, 1014–1034 . [Google Scholar] [CrossRef]
- Ayyagari, M.; Demirgüç-Kunt, A.; Maksimovic, A. Bribe payments and innovation in developing countries: Are innovating firms disproportionately affected? Journal of Financial and Quantitative Analysis 2014, 9, 51–75. [Google Scholar] [CrossRef]
- Bahoo, S.; Ilan, A.; Paltrinieri, A. Corruption in international business: A review and research agenda. International Business Review 2021, 29. [Google Scholar] [CrossRef]
- Bao, S. R.; Lewellyn, K. B. ; Ownership structure and earnings management in emerging markets. An institutionalized agency perspective, International Business Review, 2017, 26 828-838. [CrossRef]
- Barassi, M.R.; Zhou, Y. The effect of corruption on FDI: A parametric and non-parametric analysis, European Journal of Political Economy 2012, 28, 302-312. [CrossRef]
- Baughn, C.; Bodie, N.; Buchanan, M.A.; Bixby, M.B. Bribery in International Business Transactions. Journal of Business Ethics 2010, 92, 15–32. Available online: https://wwwjstororg/stable/25621541. [CrossRef]
- Boubakri, N.; Mansi, S.; Saffar, W. Political institutions, connectedness, and corporate risk-taking. J Int Bus Stud 2013, 44, 195–215. [Google Scholar] [CrossRef]
- Bukari, C.; Atta Anaman, E. ; Corruption and firm innovation: a grease or sand in the wheels of commerce? Evidence from lower-middle and upper-middle income economies. Eurasian Business Review 2021, 11, 267–302. [Google Scholar] [CrossRef]
- Chen, C.; J. B. Cullen J.B.; Parboteeah K. B. Are manager-controlled firms more likely to bribe than shareholder-controlled firms: A cross-cultural analysis. Management and Organization Review, 2015, 11, 343–3. Available online: https://wwwsciencedirectcom/science/article/pii/S0969593119309473#bbib0120. [CrossRef]
- Couttenier, M.; Toubal, F. Corruption for sales, Journal of Comparative Economics 2017, 45, 2017, 56-66. [CrossRef]
- Cuervo-Cazurra, A. Who Cares about Corruption? Journal of International Business Studies 2006, 37, 803–822. Available online: https://wwwjstororg/stable/4540385. [CrossRef]
- Cuervo-Cazurra, A. Corruption in international business. Journal of World Business 2016, 51, 35–49. [Google Scholar] [CrossRef]
- Dallago, B.; Casagrande, S. The “New Comparative Economics”: A Critical Review, in Douarin, E., Havrylyshyn, O. (eds) The Palgrave Handbook of Comparative Economics. Palgrave Macmillan, Cham. [CrossRef]
- Ha, L. T.; Thanh, T.T.; Thang, D. N.; Anh, P.T.H. E: Bribery, export decisions, and institutional constraints, 2021; 69. [CrossRef]
- Hearn, B. ; Institutional influences on board composition of international joint venture firms listing on emerging stock exchanges: Evidence from Africa. Journal of World Business 2015, 50, 205–219. Available online: https://doiorg/101016/jjwb201404006. [CrossRef]
- Hill; T. D.; Davis, A.P.;French M.T. Limitations of Fixed-Effects Models for Panel Data Sociological Perspectives 2020, 63, 357–369. [CrossRef]
- Iorio, R.; Segnana, M.L. Is paying bribes worthwhile? Corruption and innovation in middle-income countries. Eurasian Business Review 2021, 12, 475–504. [Google Scholar] [CrossRef]
- Lee, C. ; C. , Wang, C.W.; Ho, S.-J. Country governance, corruption, and the likelihood of firms’ innovation, Economic Modelling 2020, 92, 326–338. [Google Scholar] [CrossRef]
- Javorcik B., S. ; Wei S-J. ; Corruption and cross-border Investment in emerging markets: Firm level evidence, Journal of International Money and Finance 2009, 28, 605–624. [Google Scholar] [CrossRef]
- Keig, D.L.; Brouthers, L. E.; Marshall,V. B. The impact of formal and informal institutional distances on MNE corporate social performance. International Business Review 2019, 28. [Google Scholar] [CrossRef]
- Karaman Kabadurmus, F.N.; Sylwester, K. Corruption and innovation: The importance of competition. International Journal of Emerging Markets 2022, 17, 766–788. [Google Scholar] [CrossRef]
- Krammer, S.M. ; Drivers of national innovation in transition: Evidence from a panel of Eastern European countries, Research Policy 2009, 38, 845-860. [CrossRef]
- Krammer; S. M. Greasing the Wheels of Change: Bribery, Institutions, and New Product Introductions in Emerging Markets, Journal of Management, 2017, 45, 1889–1926. [CrossRef]
- Krammer, S.M.; Strange, R.; Lashitew, A. The export performance of emerging economy firms: The influence of firm capabilities and institutional environments. International Business Review 2018, 27, 218–230 . [Google Scholar] [CrossRef]
- Krammer, S.M.; Jimenez, A. Do political connections matter for firm innovation? Evidence from emerging markets in Central Asia and Eastern Europe, Technological Forecasting and Social Change, 2020, 151. [Google Scholar] [CrossRef]
- Keig, D.; Brouthers, L. E.; Marshall, V. B. 2014; 52. [CrossRef]
- Malik, A.; Froese, F.J. Corruption as a perverse Innovation: The dark side of digitalization and corruption in international business. Journal of Business Research 2022, 145, 682–693. [Google Scholar] [CrossRef]
- Martins, L.; Cerdeira, J.; Teixeira, A. Does Corruption Boost or Harm Firms’ Performance in Developing and Emerging Economies? A Firm-Level Study World Economics 2020. [CrossRef]
- Meyer, K.; Peng, M. Theoretical foundations of emerging economy business research. Journal of International Business Studies 2016, 47, 3–22. [Google Scholar] [CrossRef]
- Muellner, J.; Klopf, P.; Nell, P.C. , Trojan Horses or Local Allies: Host-country National Managers in Developing Market Subsidiaries, Journal of International Management, 2017, 23, 306-325. https://api.semanticscholar. 1579. [Google Scholar]
- Nguyen, N.A.; Doan, Q.H.; Nguyen, N.M.; Tran-Nam, B. The impact of petty corruption on firm innovation in Vietnam. Crime Law Soc Change 2016, 65, 377–394. [Google Scholar] [CrossRef]
- North, D.C. (1990), Institutions, Institutional Change and Economic Performance, 1990, Cambridge University Press.
- Ohnsorge, F. , and Yu, S. (eds.) (2021). The long shadow of informality. Challenges and policies, World Bank Publications. http://hdl.handle. 1098. [Google Scholar]
- Pantzalis, C.; Park, J.C.; Sutton, N. Corruption and valuation of multinational corporations, Journal of Empirical Finance 2008, 387-417. [CrossRef]
- Rodriguez, P.; Uhlenbruck, K.; Eden, L. Government corruption and the entry strategies of multinationals, Academy of management review, 2005, 30, 383-396. [CrossRef]
- Rose-Ackerman, S. Corruption and Government. Journal of International Peacekeeping 2008, 15, 328–343. [Google Scholar] [CrossRef]
- Rose-Ackerman, S. and Truex, R. (2012). Corruption and Policy Reform. Yale Law & Economics Research Paper No. 444. [CrossRef]
- Roy, J.- P.; Oliver, C. , International joint venture partner selection: The role of the host-country legal environment. Journal of International Business Studies 2009, 40, 779–801. Available online: https://wwwjstororg/stable/40262809. [CrossRef]
- Sharma, C.; Mitra, A. E: governance and firm performance, 2015; 37. [CrossRef]
- Thede, S.; Karpaty, P. (2023) Effects of corruption on foreign direct investment: Evidence from Swedish multinational enterprises, Journal of Comparative Economics 2023, 51. [CrossRef]
- Voigt, S. How (Not) to measure institutions Journal of Institutional Economics 2013, 9, 1–26. [CrossRef]
- Voigt, S. How to measure informal institutions, Journal of Institutional Economics, 2018, 14, 1-22. [CrossRef]
- Wang, T.; Chen, Y. Capability stretching in product innovation. Journal of Management 2018, 44, 784–810. [Google Scholar] [CrossRef]
- Yi, J. , Teng, D. & Meng, S. (2018) Foreign Ownership and Bribery: Agency and Institutional Perspectives Institutional Perspectives' International Business Review, 2018, 27, 34–45. [Google Scholar] [CrossRef]
Table 2.
Control of corruption, bribery and innovation between groups of countries.
| Control of corruption(average) | % firms paying a bribe “to get things done”* | % Innovative firms ** | |
|---|---|---|---|
| Group 1 | 0.596 | 4.40% | 34.82% |
| Group 2 | -0.337 | 7.68% | 25.85% |
| Group 3 | -0.982 | 11.41% | 22.50% |
| All countries | -0.375 | 8.40% | 26.27% |
* Percentage of firms where FirmCorruption=1 **Percentage of firms where Innoprod==1. Source: World Bank Worldwide Governance Indicators (column 2) and EBRD-World Bank Business Environment and Performance Survey (BEEPS), columns 3 and 4.
Table 3.
Corruption and innovative firms within each group.
| % Innovative firms among firms paying bribes (a)* | % Innovative firms among firms NOT paying bribes (b)** | “Effect” of corruption(a) – (b) | |
|---|---|---|---|
| Group 1 | 38.46% | 34.97% | +3.49% |
| Group 2 | 35.85% | 24.20% | +11.40% |
| Group 3 | 40.32% | 19.61% | +21.19% |
| All countries | 38.30% | 24.75% | +13.55% |
* Percentage of firms where Innoprod=1 among the firms where FirmCorruption=1 ** Percentage of firms where Innoprod=1 among the firms where FirmCorruption=0 Source: EBRD-World Bank Business Environment and Performance Survey (BEEPS).
Table 4.
Foreign and domestic firms. Corruption and innovation activities in each group of countries.
Table 4.
Foreign and domestic firms. Corruption and innovation activities in each group of countries.
| % Foreign firms* | % Corruption (Domestic firms)** | % Corruption(Foreign firms)*** | % Innovation(Domestic firms)**** | % Innovation (Foreign firms)**** | |
|---|---|---|---|---|---|
| Group 1 | 8.15% | 4.50% | 3.19% | 33.23% | 53.27% |
| Group 2 | 5.74% | 7.57% | 9.62% | 25.17% | 36.93% |
| Group 3 | 6.83% | 10.71% | 20.65% | 21.12% | 41.40% |
| All countries | 6.61% | 8.12% | 12.35% | 25.13% | 42.43% |
* Percentage of firms where Foreign=1 ** Percentage of firms where FirmCorruption=1 among the firms where Foreign=0 *** Percentage of firms where FirmCorruption=1 among the firms where Foreign=1 **** Percentage of firms where Innoprod=1 among the firms where Foreign=0 ***** Percentage of firms where Innoprod=1 among the firms where Foreign=1 Source: EBRD-World Bank Business Environment and Performance Survey (BEEPS).
Table 5.
Corruption between domestic and foreign firms by groups of countries.
| %Innovative firms among firms paying a bribe (a)* |
%Innovative firms among firms NOT paying a bribe (b)** |
“Effect” of corruption (a)-(b) |
|
|---|---|---|---|
| Group 1 | |||
| Domestic firms | 40.82% | 33.27% | +7.55% |
| Foreign firms | 0.00% | 54.44% | -54.44% |
| Group 2 | |||
| Domestic firms | 35.03% | 23.36% | +11.67% |
| Foreign firms | 46.67% | 38.30% | +8.37% |
| Group 3 | |||
| Domestic firms | 36.65% | 18.63% | +18.02% |
| Foreign firms | 65.63% | 34.43% | +31.20% |
| All countries | |||
| Domestic firms | 36.40% | 23.65% | +12.75% |
| Foreign firms | 56.00% | 41.08% | +14.92% |
* Percentage of firms where Innoprod=1 among the firms where FirmCorruption=1 and Foreign=0 (row above) or Foreign=1 (row below) ** Percentage of firms where Innoprod=1 among the firms where FirmCorruption=0 and Foreign=0 (row above) or Foreign=1 (row below) Source: EBRD-World Bank Business Environment and Performance Survey (BEEPS).
Table 6.
Model 1. Probit model with random effects.
| Variables | MODEL1 (dependent.var: Innoprod) |
|---|---|
| FirmCorruption | 0.137 (.109) |
| Controlcorr | 0.214*** (0.040) |
| FirmCorruption # Controlcorr | -0.333** (0.136) |
| Foreign | 0.241*** (0.086) |
| Competition_2 | 0.090* (0.055) |
| Competition_3 | -0.394*** (0.053) |
| R&D | 0.830***(0.061) |
| Size | 0.010(0.020) |
| Fortech | 0.247***(0.061) |
| Train | 0.383***(0.047) |
| Exports | 0.238***(0.056) |
| _constant | -0.844*** (0.108) |
| Industry dummies | Included |
*** p<0.01 ; ** p<0.05; *p<0.1. Standard error in brackets.
Table 7.
Estimated marginal effects of FirmCorruption in probit (first row) and linear probability model (second row).
Table 7.
Estimated marginal effects of FirmCorruption in probit (first row) and linear probability model (second row).
| Domestic firms (a) |
Foreign firms (b) |
|
|---|---|---|
| Group 1 | Not estimable | Not estimable |
| +0.079 | -0.752** | |
| Group 2 | +0.039 | -0.093 |
| +0.038 | -0.091 | |
| Group 3 | +0.122*** | +0.187** |
| +0.126*** | +0.201** | |
| All countries | +0.069*** | +0.039 |
| +0.068*** | +0.048 |
*** Significant at 99%; **Significant at 95%.
Disclaimer/Publisher’s Note: The statements, opinions and data contained in all publications are solely those of the individual author(s) and contributor(s) and not of MDPI and/or the editor(s). MDPI and/or the editor(s) disclaim responsibility for any injury to people or property resulting from any ideas, methods, instructions or products referred to in the content. |
© 2024 by the authors. Licensee MDPI, Basel, Switzerland. This article is an open access article distributed under the terms and conditions of the Creative Commons Attribution (CC BY) license (http://creativecommons.org/licenses/by/4.0/).
Copyright: This open access article is published under a Creative Commons CC BY 4.0 license, which permit the free download, distribution, and reuse, provided that the author and preprint are cited in any reuse.


