Submitted:
20 December 2024
Posted:
23 December 2024
You are already at the latest version
Abstract
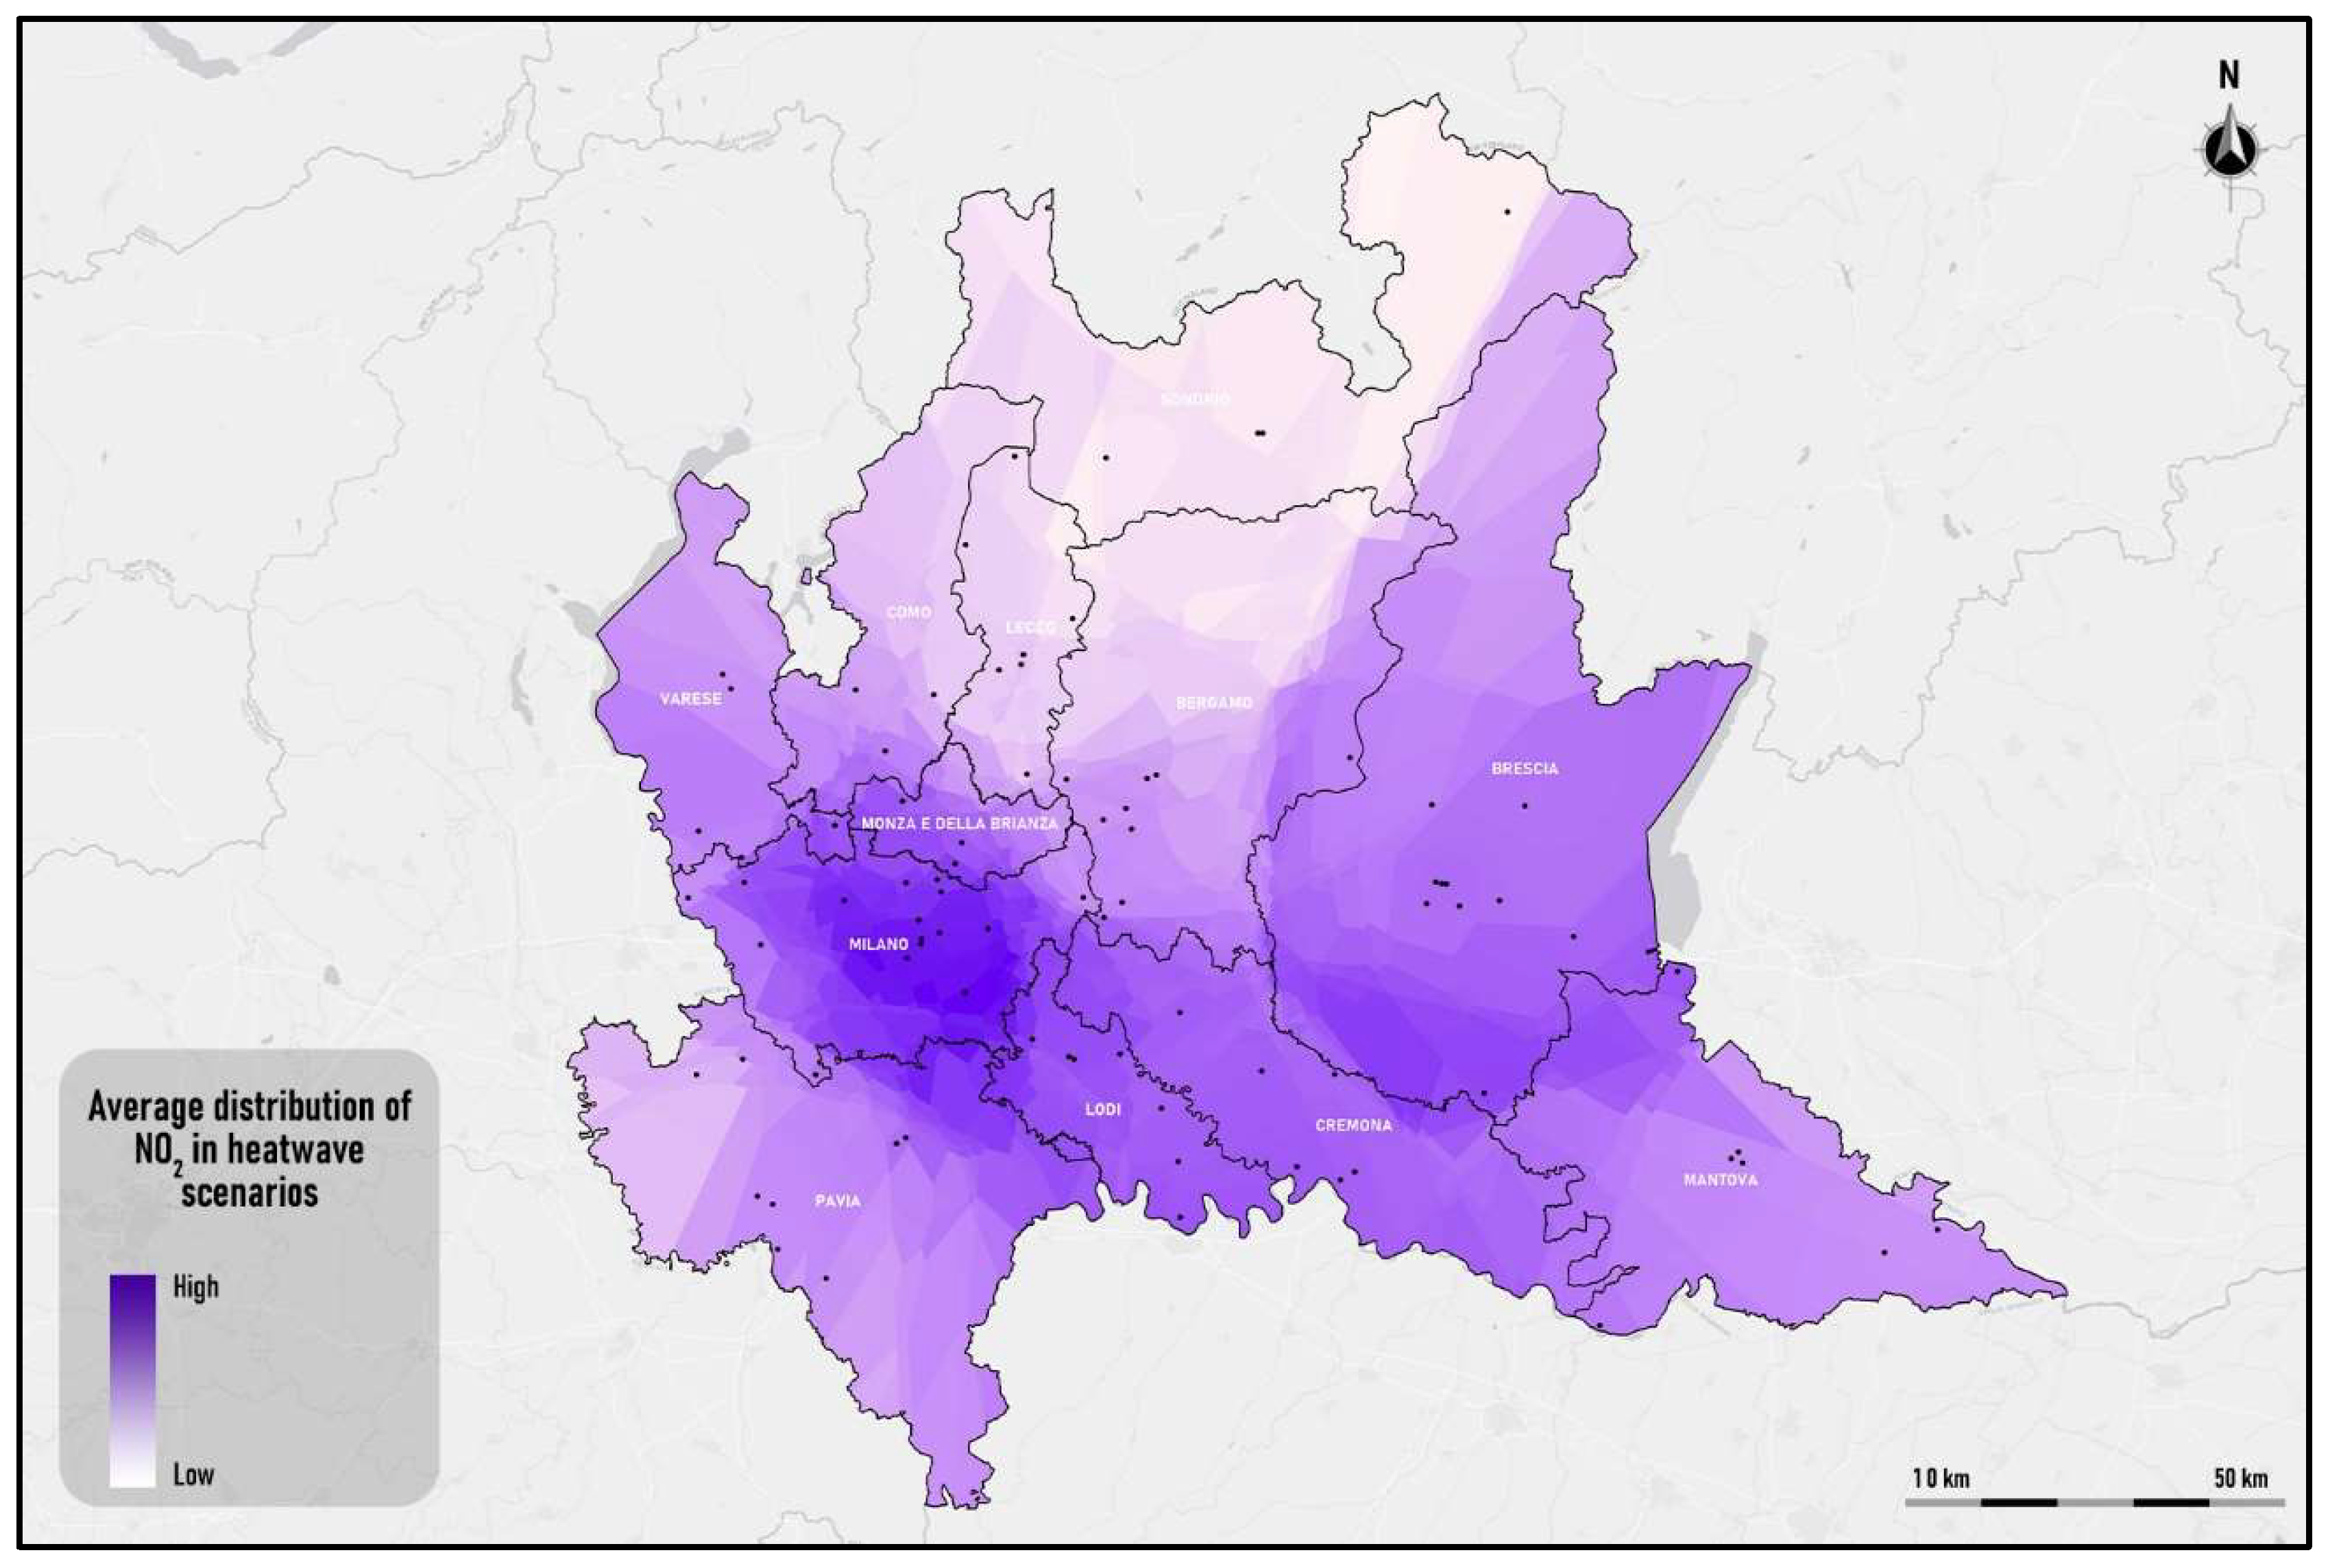
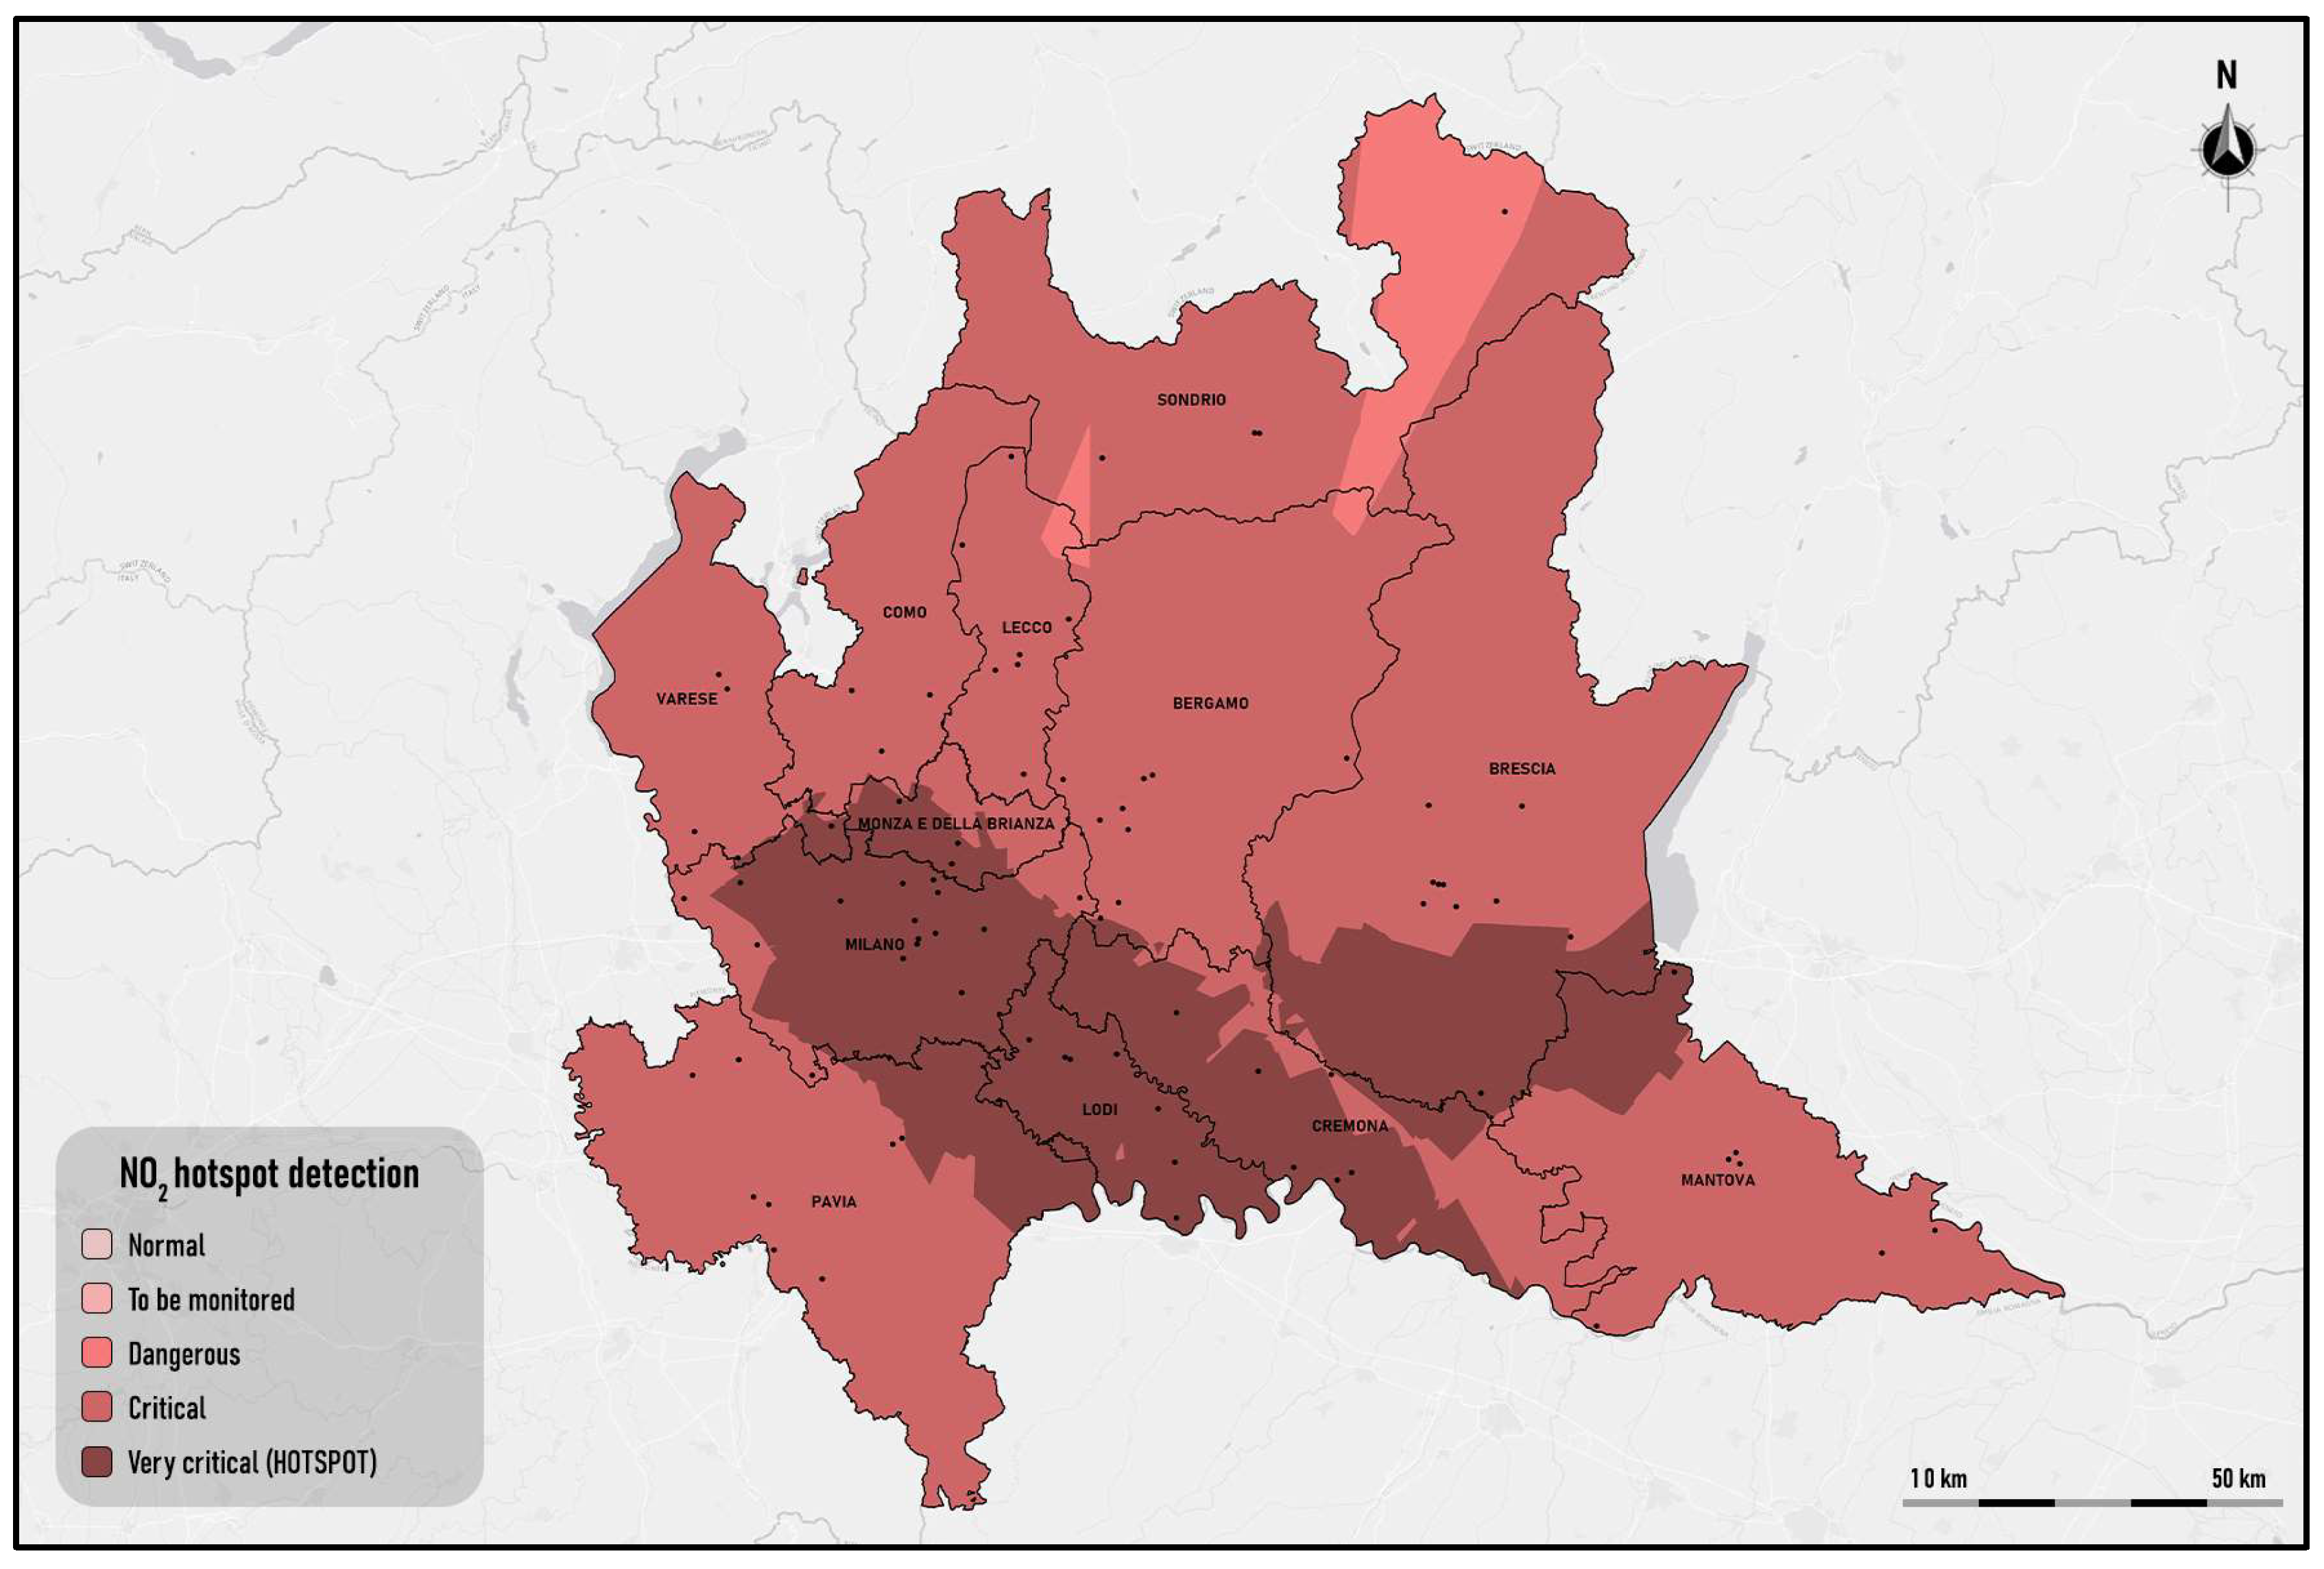
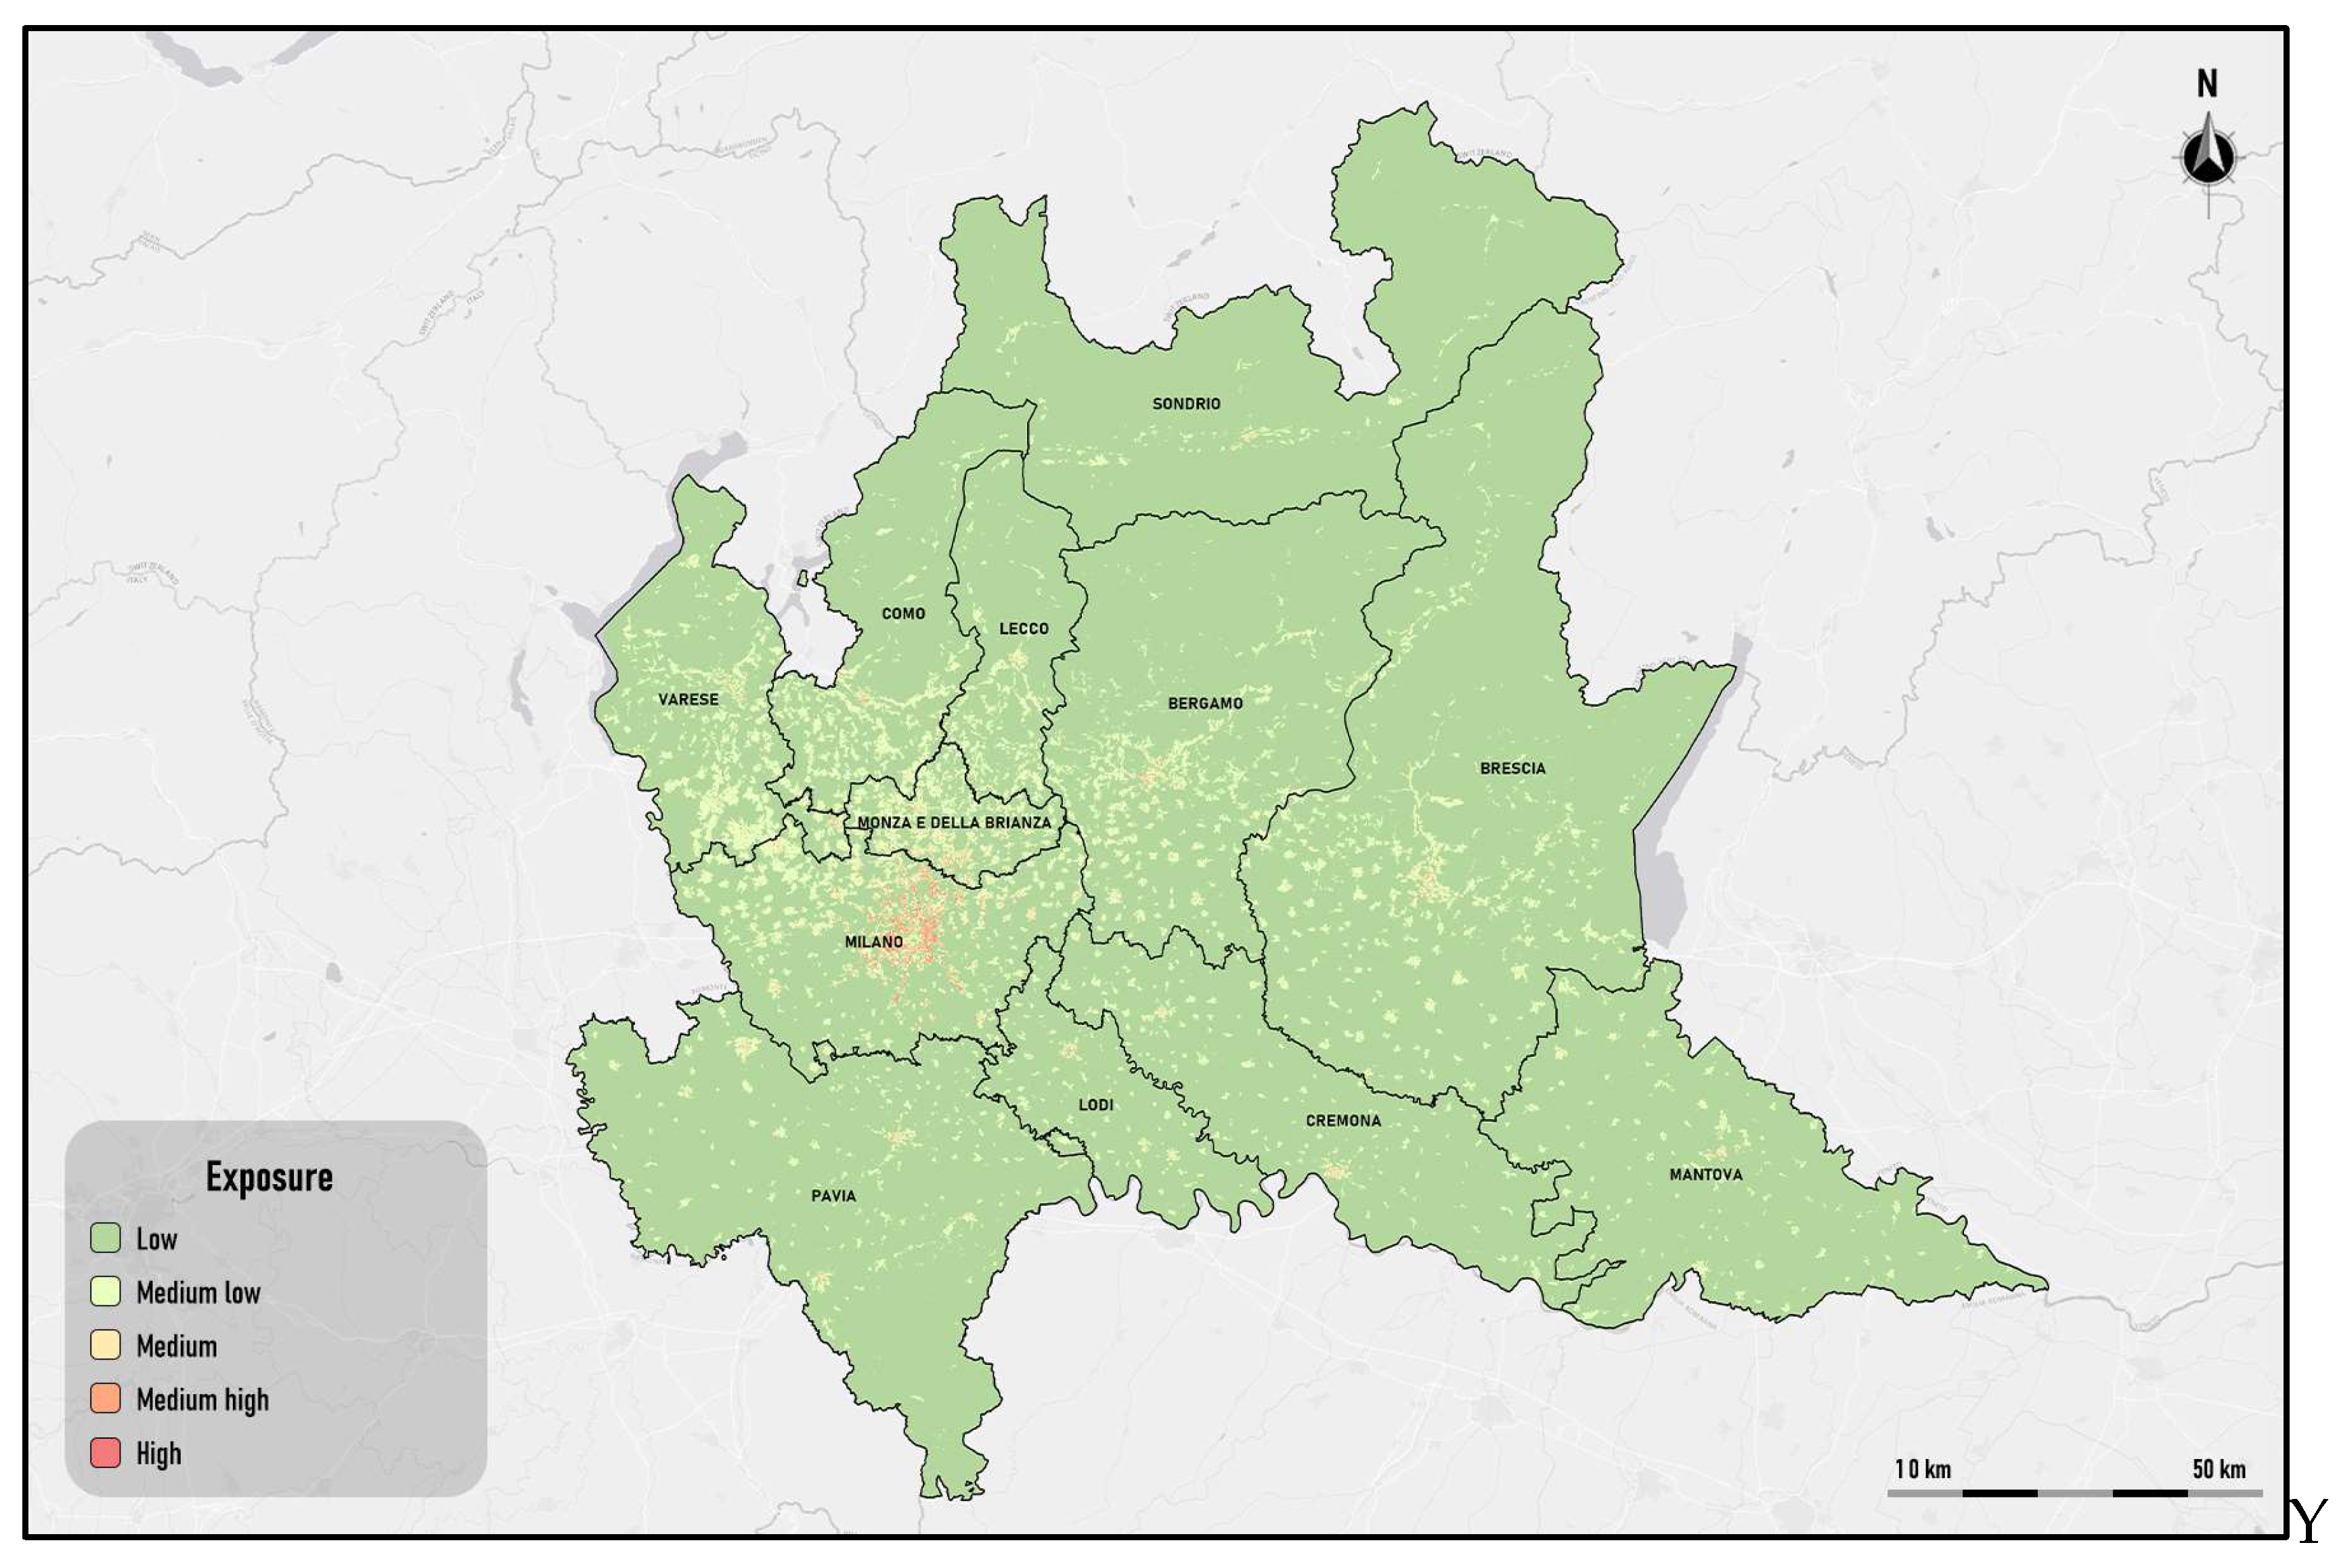
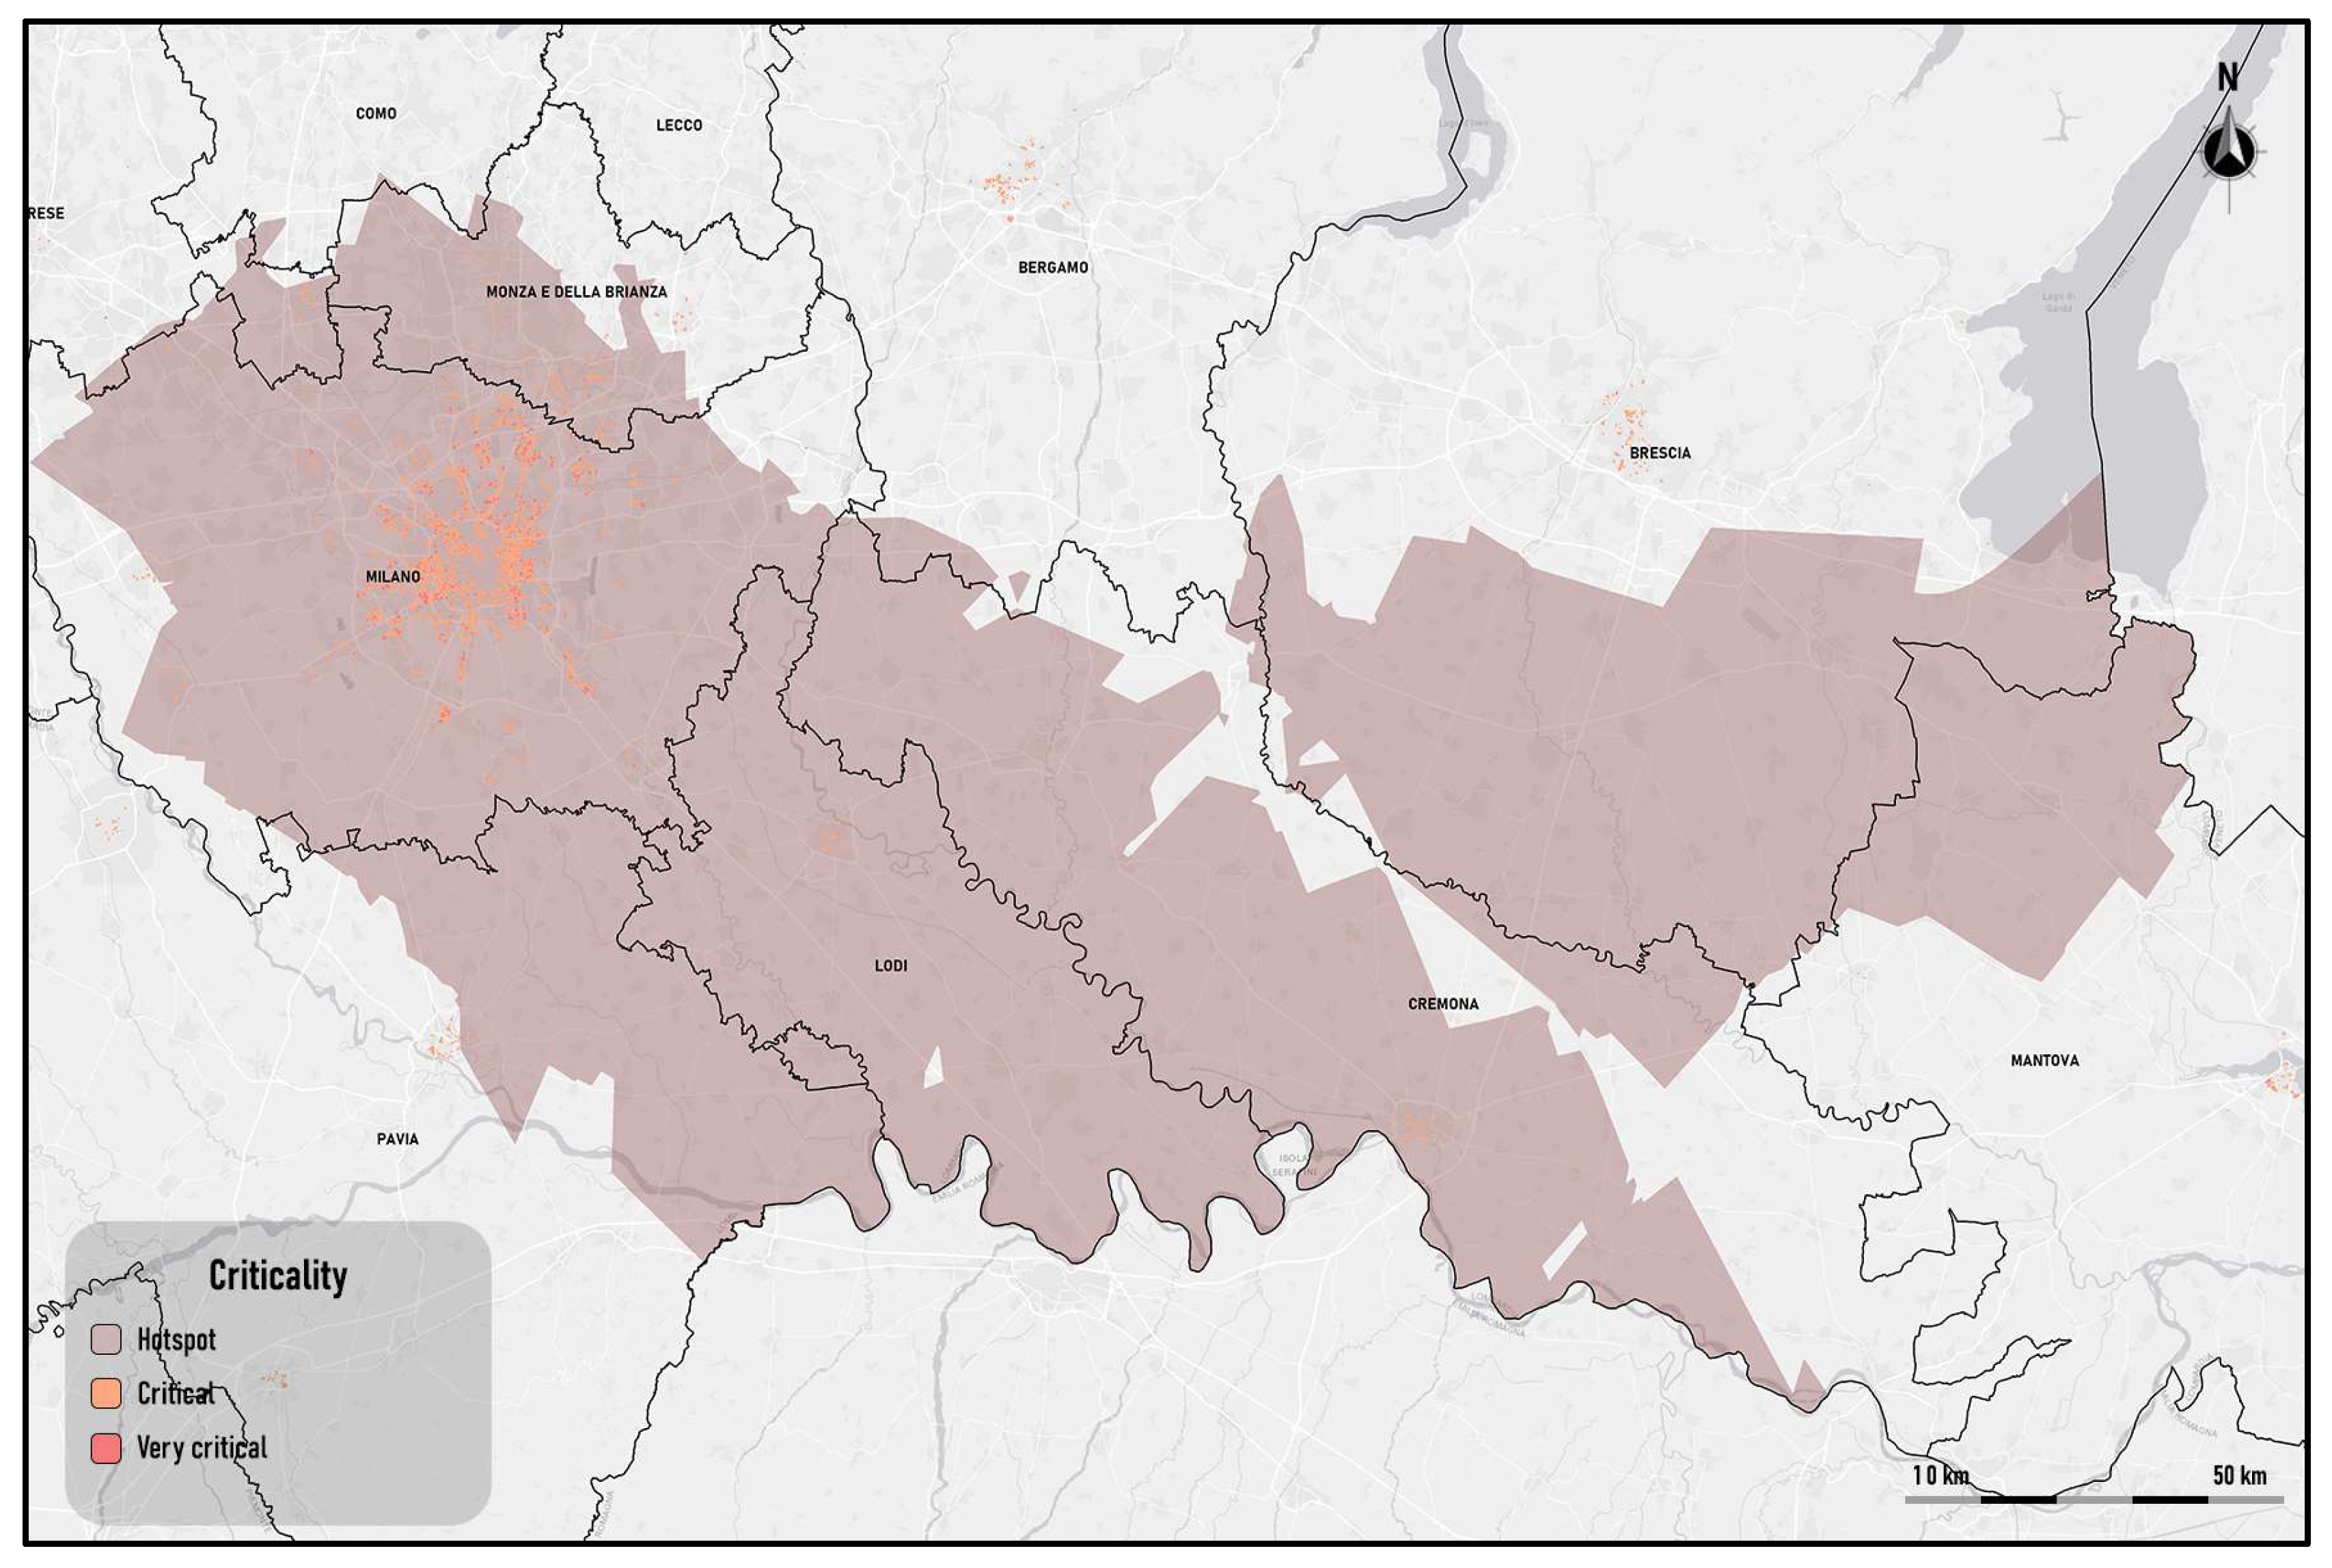
High concentrations of pollutants in urban areas generate cardiovascular and respiratory problems in citizens, which are aggravated by the persistence of summer heatwaves. For this reason, in this research a fuzzy-based method of detecting air pollutant hotspots and determining critical urban areas for air pollution during heatwaves is proposed. After acquiring the pollutant concentration values recorded by monitoring stations during heatwaves, a spatial interpolation method is applied to obtain the distribution of the pollutant concentration during heatwaves and, subsequently, a fuzzification process is performed to determine urban hotspots in which the pollutant concentration assumes critical values. Finally, the critical urban areas are determined, consisting of the areas within hotspots with high population density exposed to health risk. The method was implemented in GIS platform and tested on an urban study area in the Lombardy region, Italy, to determine the urban areas with high criticality during heatwaves that occurred in the summer months of 2024. The test results show that the method can represent a valid support for decision makers and local administrators to evaluate which are the urban areas most critical for the population due to the high rate of air pollution during heatwaves.
Keywords:
1. Introduction
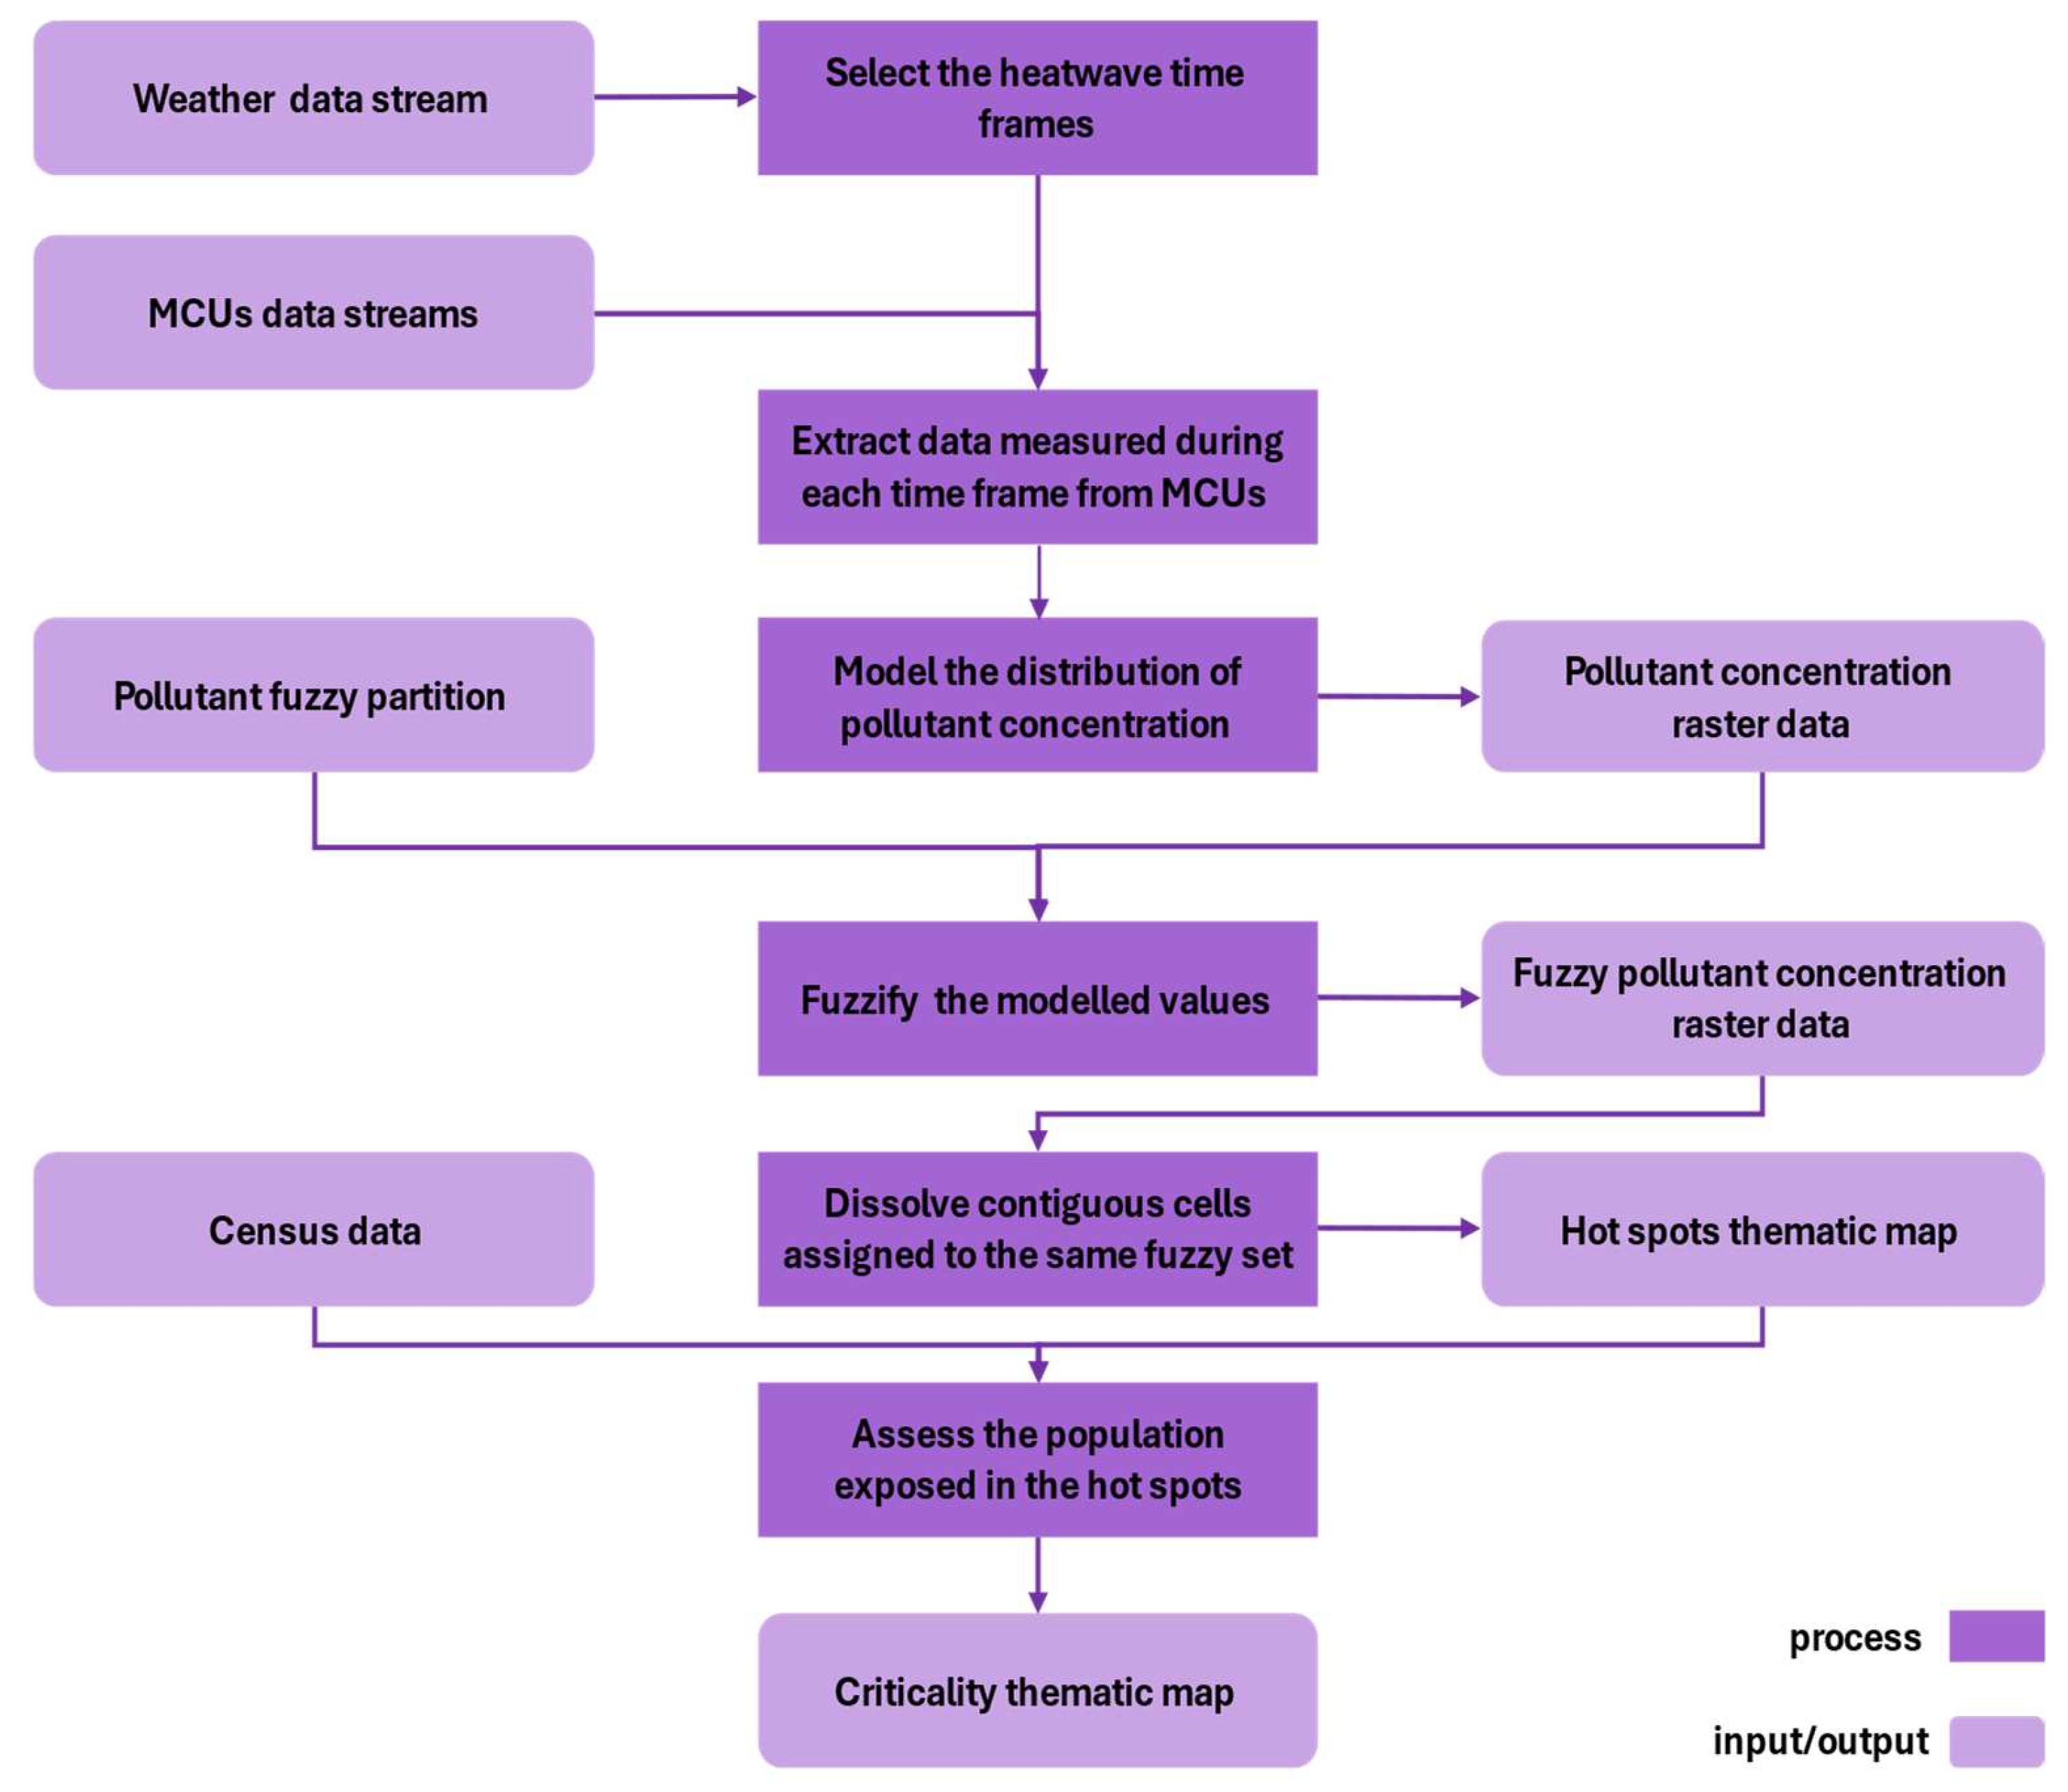
2. Materials and Methods
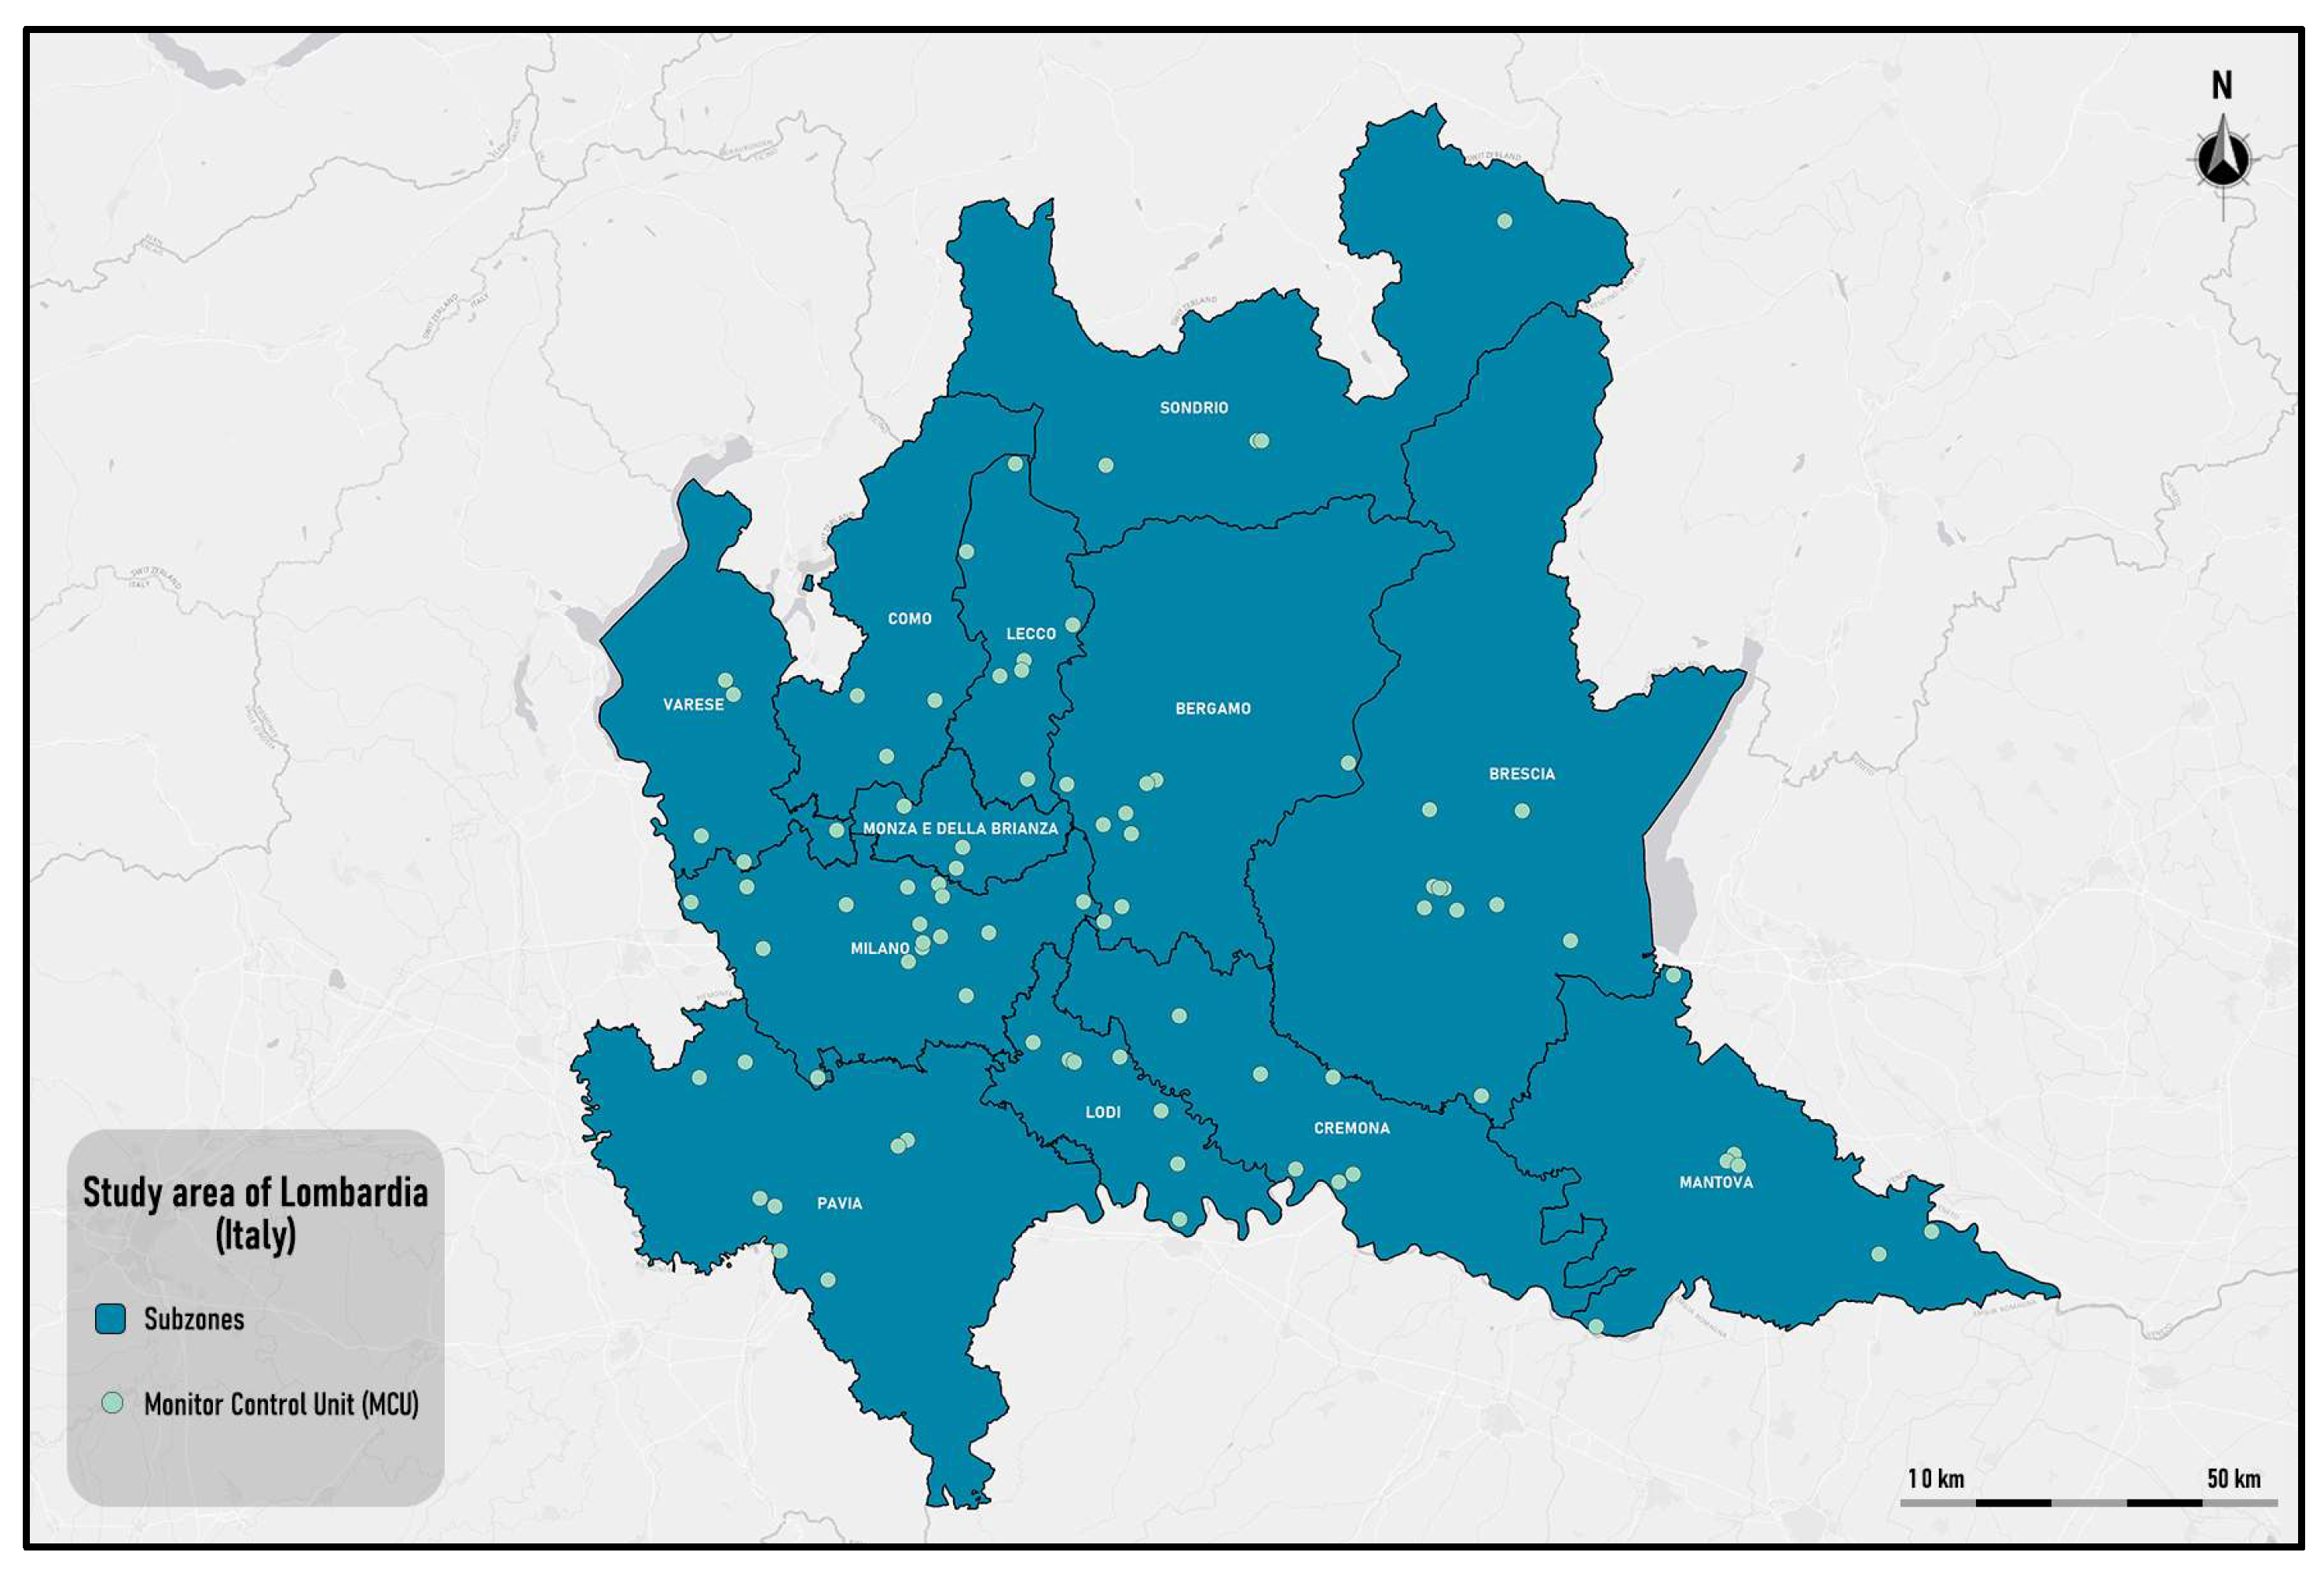
3. The Case Study
4. Results
5. Conclusion
Author Contributions
Funding
Data Availability Statement
Conflicts of Interest
References
- He, B.-J.; Ding, L.; Prasad, D. Enhancing urban ventilation performance through the development of precinct ventilation zones: A case study based on the Greater Sydney, Australia Sustain. Cities Soc. 2019, 47, 101472. [Google Scholar] [CrossRef]
- Badach, J.; Voordeckers, D.; Nyka, L.; Van Acker, M. A framework for Air Quality Management Zones—Useful GIS-based tool for urban planning: Case studies in Antwerp and Gdańsk. Build. Environ. 2020, 174, 106743. [Google Scholar] [CrossRef]
- Oji, S.; Adamu, H. Air Pollution Exposure Mapping by GIS in Kano Metropolitan Area. Pollution 2021, 7, 101–112. [Google Scholar] [CrossRef]
- Goyal, P.; Gulia, S.; Goyal, S.K. Identification of air pollution hotspots in urban areas - An innovative approach using monitored concentrations data. Science of The Total Environment 2021, 798, 149143. [Google Scholar] [CrossRef]
- Desouza, P.; Anjomshoaa, A.; Duarte, F.; Kahn, R.; Kumar, P.; Ratti, C. Air quality monitoring using mobile low-cost sensors mounted on trash-trucks: methods development and lessons learned. Sustain. Cities Soc. 2020, 60, 102239. [Google Scholar] [CrossRef]
- D’Amato, G.; Vitale, C.; De Martino, A.; Viegi, G.; Lanza, M.; et al. Effects on asthma and respiratory allergy of Climate change and air pollution. Multidiscip. Respir. Med. 2015, 10, 39. [Google Scholar] [CrossRef]
- Bartholy, J.; Pongrácz, R. A brief review of health-related issues occurring in urban areas related to global warming of 1.5 °C. Curr. Opin. Environ. Sustain. 2018, 30, 123–132. [Google Scholar] [CrossRef]
- Cardone, B.; Di Martino, F.; Miraglia, V. A GIS-Based Hot and Cold Spots Detection Method by Extracting Emotions from Social Streams. Future Internet 2023, 15, 23. [Google Scholar] [CrossRef]
- Cardone, B.; Di Martino, F.; Miraglia, V. A GIS-Based Fuzzy Model to Detect Critical Polluted Urban Areas in Presence of Heatwave Scenarios. Computers 2024, 13, 143. [Google Scholar] [CrossRef]
- Lin, Y.-P.; Chu, H.-J.; Wu, C.-F.; Chang, T.-K.; Chen, C.-Y. Hotspot Analysis of Spatial Environmental Pollutants Using Kernel Density Estimation and Geostatistical Techniques. Int. J. Environ. Res. Public Health 2011, 8, 75–88. [Google Scholar] [CrossRef]
- Wang, J.; Li, H.; Lu, H. Application of a novel early warning system based on fuzzy time series in urban air quality forecasting in China. Applied Soft Computing. 2018, 71, 783–799. [Google Scholar] [CrossRef]
- Koo, J.W.; Wong, S.W.; Selvachandran, G.; Long, H.V. Prediction of Air Pollution Index in Kuala Lumpur using fuzzy time series and statistical models. Air Quality, Atmosphere & Health. 2020, 75, 107–111. [Google Scholar] [CrossRef]
- Alyousifi, Y.; Othman, M.; Sokkalingam, R.; Faye, I.; Silva, P.C.L. Predicting Daily Air Pollution Index Based on Fuzzy Time Series Markov Chain Model. Symmetry 2020, 12, 293. [Google Scholar] [CrossRef]
- Navares, L.; Aznarte, J.L. Predicting air quality with deep learning LSTM: Towards comprehensive models. Ecol. Inform. 2020, 55, 101019. [Google Scholar] [CrossRef]
- Mao, W.; Wang, W.; Jiao, L.; Zhao, S.; Liu, A. Modeling air quality prediction using a deep learning approach: Method optimization and evaluation Sustainable. Cities Soc. 2021, 65, 102567. [Google Scholar] [CrossRef]
- Bacanin, B.N.; Sarac, M.; Budimirovic, N.; Zivkovic, M.; AlZubi, A.A.; Bashir, A.K. Smart wireless health care system using graph LSTM pollution prediction and dragonfly node localization. Sustain. Comput. Inform. Syst. 2022, 35, 100711–10.1016. [Google Scholar] [CrossRef]
- Lavana, H.; Prathik, N.R. Deep Learning-Based Air Pollution Forecasting System Using Multivariate LSTM. In Artificial Intelligence Tools and Technologies for Smart Farming and Agriculture Practices; Gupta, R.K., Jain, A., Wang, J., Bharti, S.K., Patel, S., Eds.; IGI Global Publishing: Beijing, China, 2023; pp. 101–114. [Google Scholar] [CrossRef]
- Drewil, G.I.; Al-Bahadili, R.J. Air pollution prediction using LSTM deep learning and metaheuristics algorithms. Meas. Sens. 2022, 24, 100546. [Google Scholar] [CrossRef]
- Cardone, B.; Di Martino, F. Fuzzy-Based Spatiotemporal Hot Spot Intensity and Propagation—An Application in Crime Analysis. Electronics 2022, 11, 370. [Google Scholar] [CrossRef]
- D’Ambrosio, V.; Di Martino, F.; Miraglia, M. A GIS-based framework to assess heatwave vulnerability and impact scenarios in urban systems. Scientific Report 2023, 13. [Google Scholar] [CrossRef]
- Anderson, G. Brooke; Bell, Michelle L.; Peng, Roger D. Methods to Calculate the Heat Index as an Exposure Metric in Environmental Health Research”. Environmental Health Perspectives. 2013, 121, 1111–1119. [Google Scholar] [CrossRef]
- Ruspini, E.H. A new approach to clustering. Inf. Control. 1969, 15, 22–32. [Google Scholar] [CrossRef]
- World Health Organization. WHO Global Air Quality Guidelines: Particulate Matter (PM2.5 and PM10), Ozone, Nitrogen Dioxide, Sulfur Dioxide and Carbon Monoxide. World Health Organization. 2021. Available online: https://iris.who.int/handle/10665/345329 (accessed on 1 May 2024).
- Cedeno Jimenez, J.R.; Brovelli, M.A. NO2 Concentration Estimation at Urban Ground Level by Integrating Sentinel 5P Data and ERA5 Using Machine Learning: The Milan (Italy) Case Study. Remote Sens. 2023, 15, 5400. [Google Scholar] [CrossRef]
- Tomassetti, L. , Torre, M., Tratzi, P., Paolini, V., Rizza, V., Segreto, M., & Petracchini, F. Evaluation of air quality and mobility policies in 14 large Italian cities from 2006 to 2016. Journal of Environmental Science and Health 2020, 55, 886–902. [Google Scholar] [CrossRef] [PubMed]
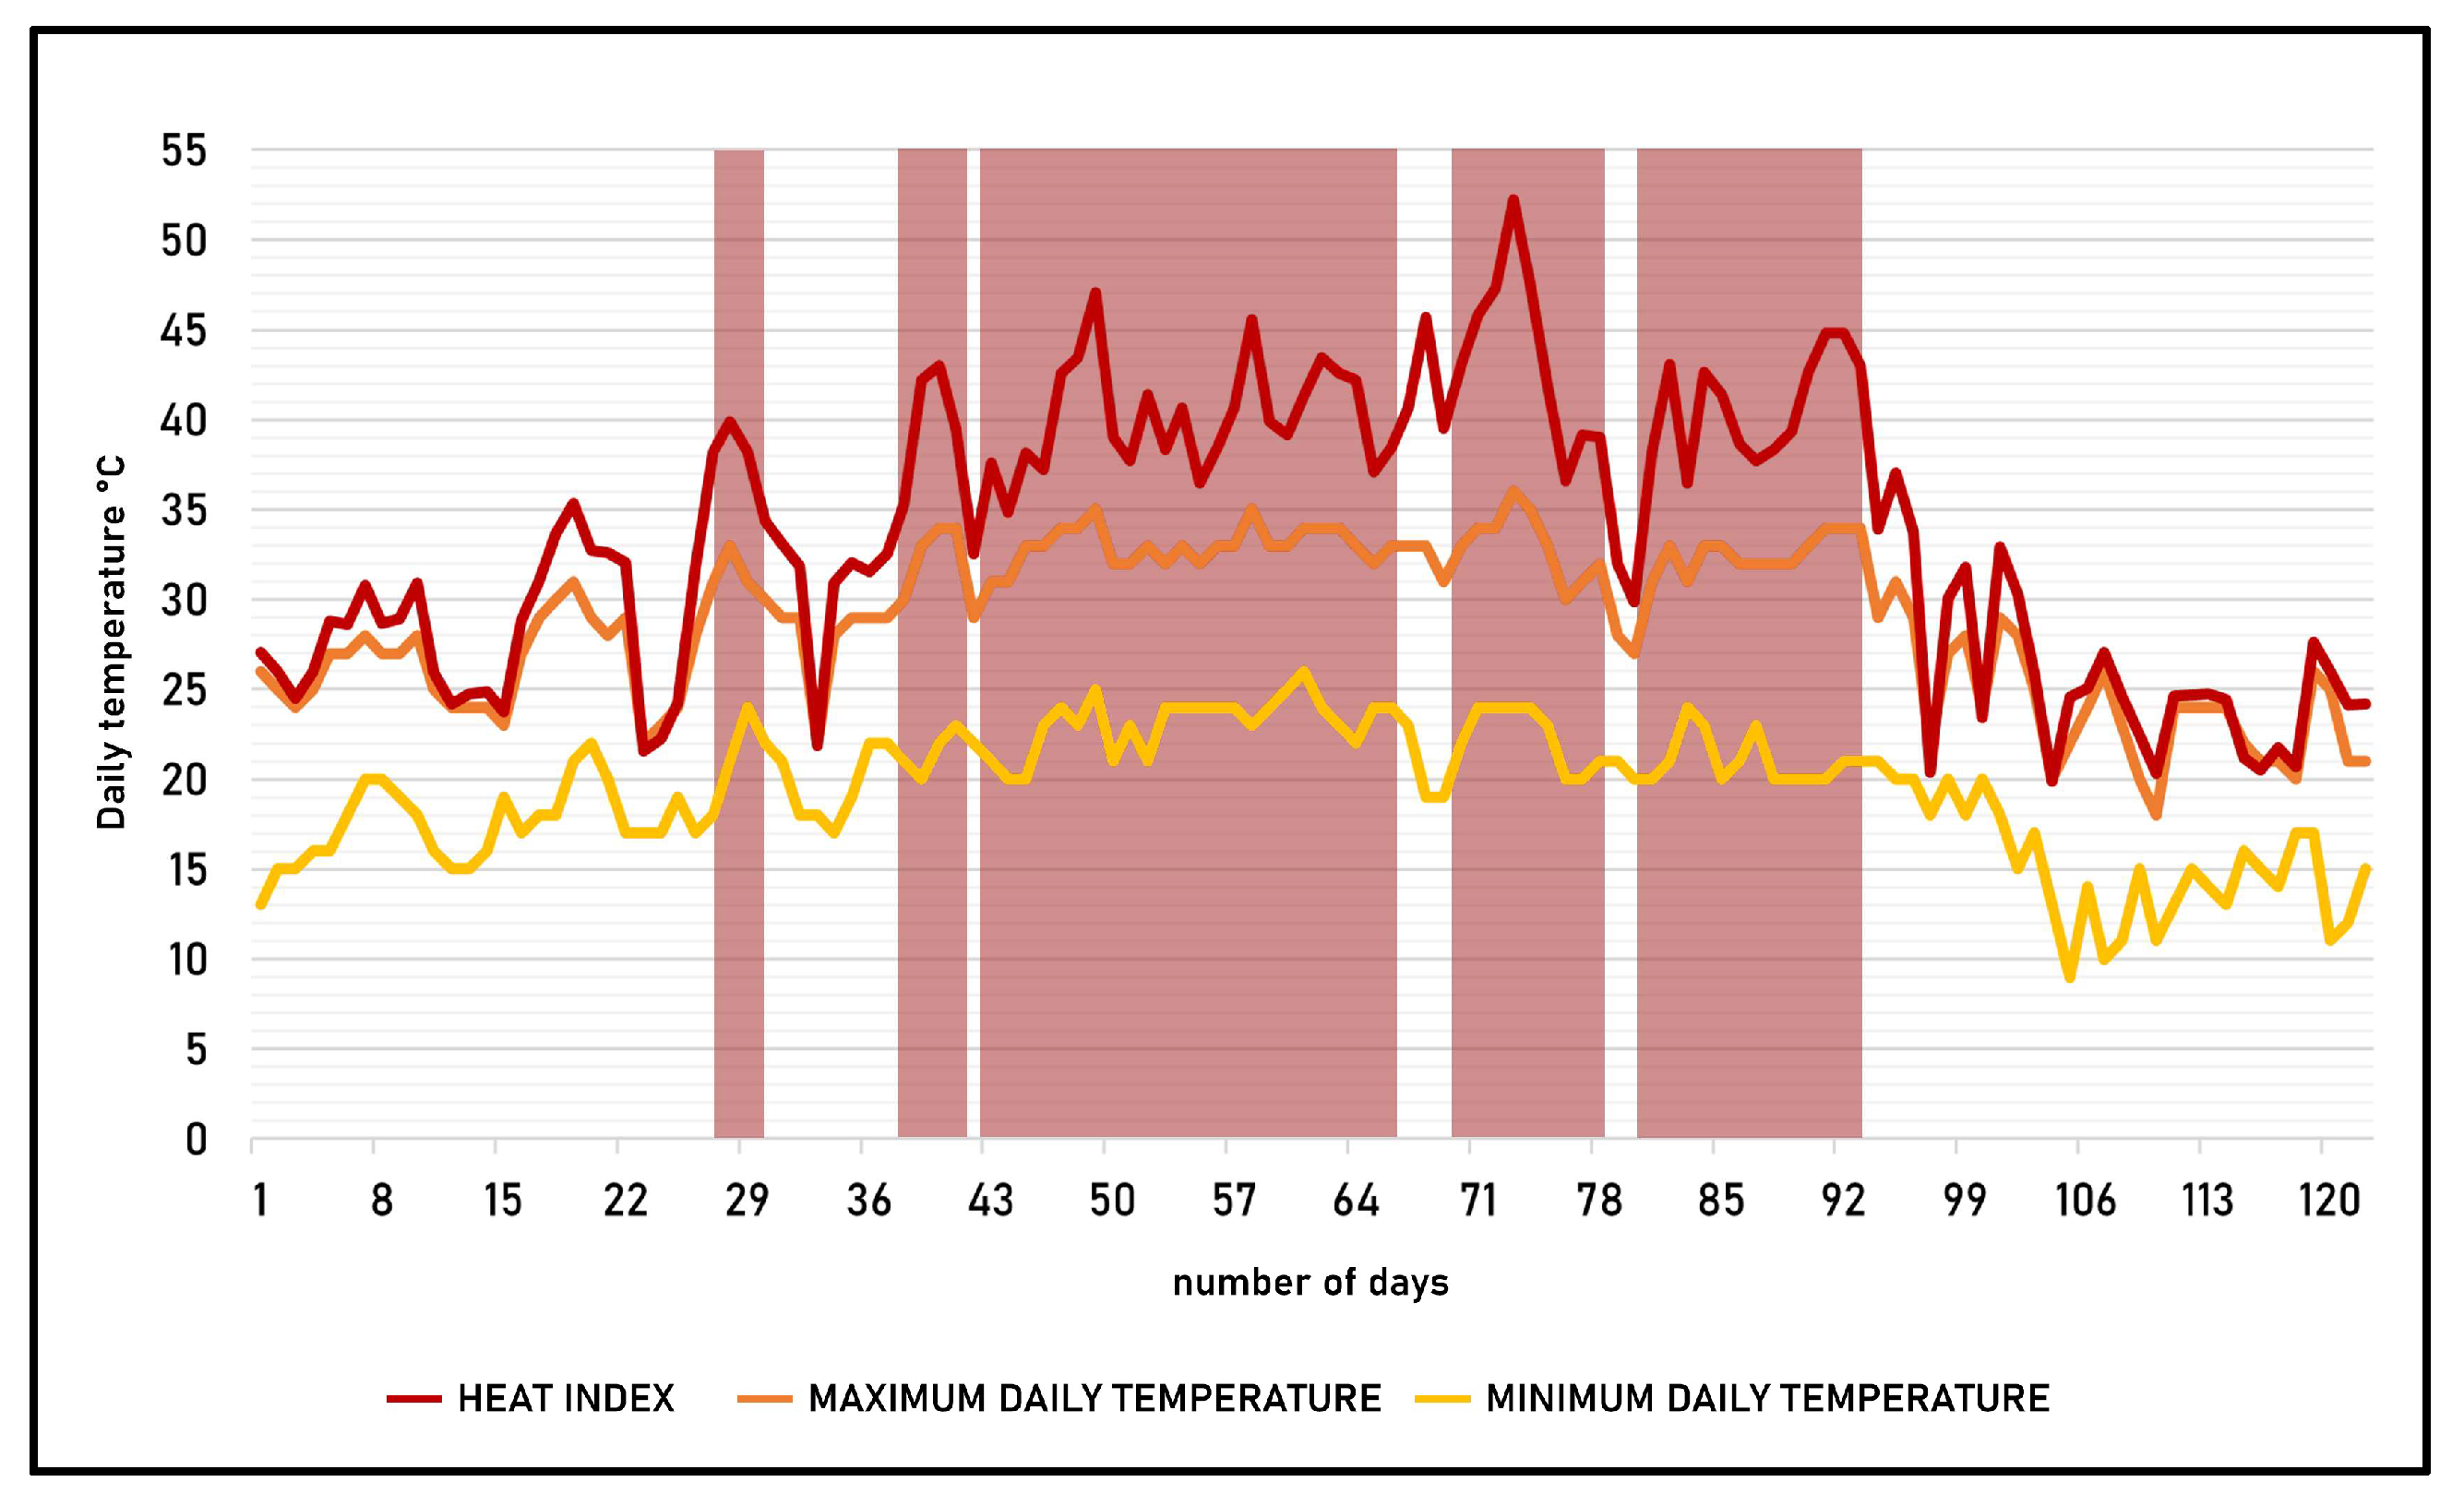
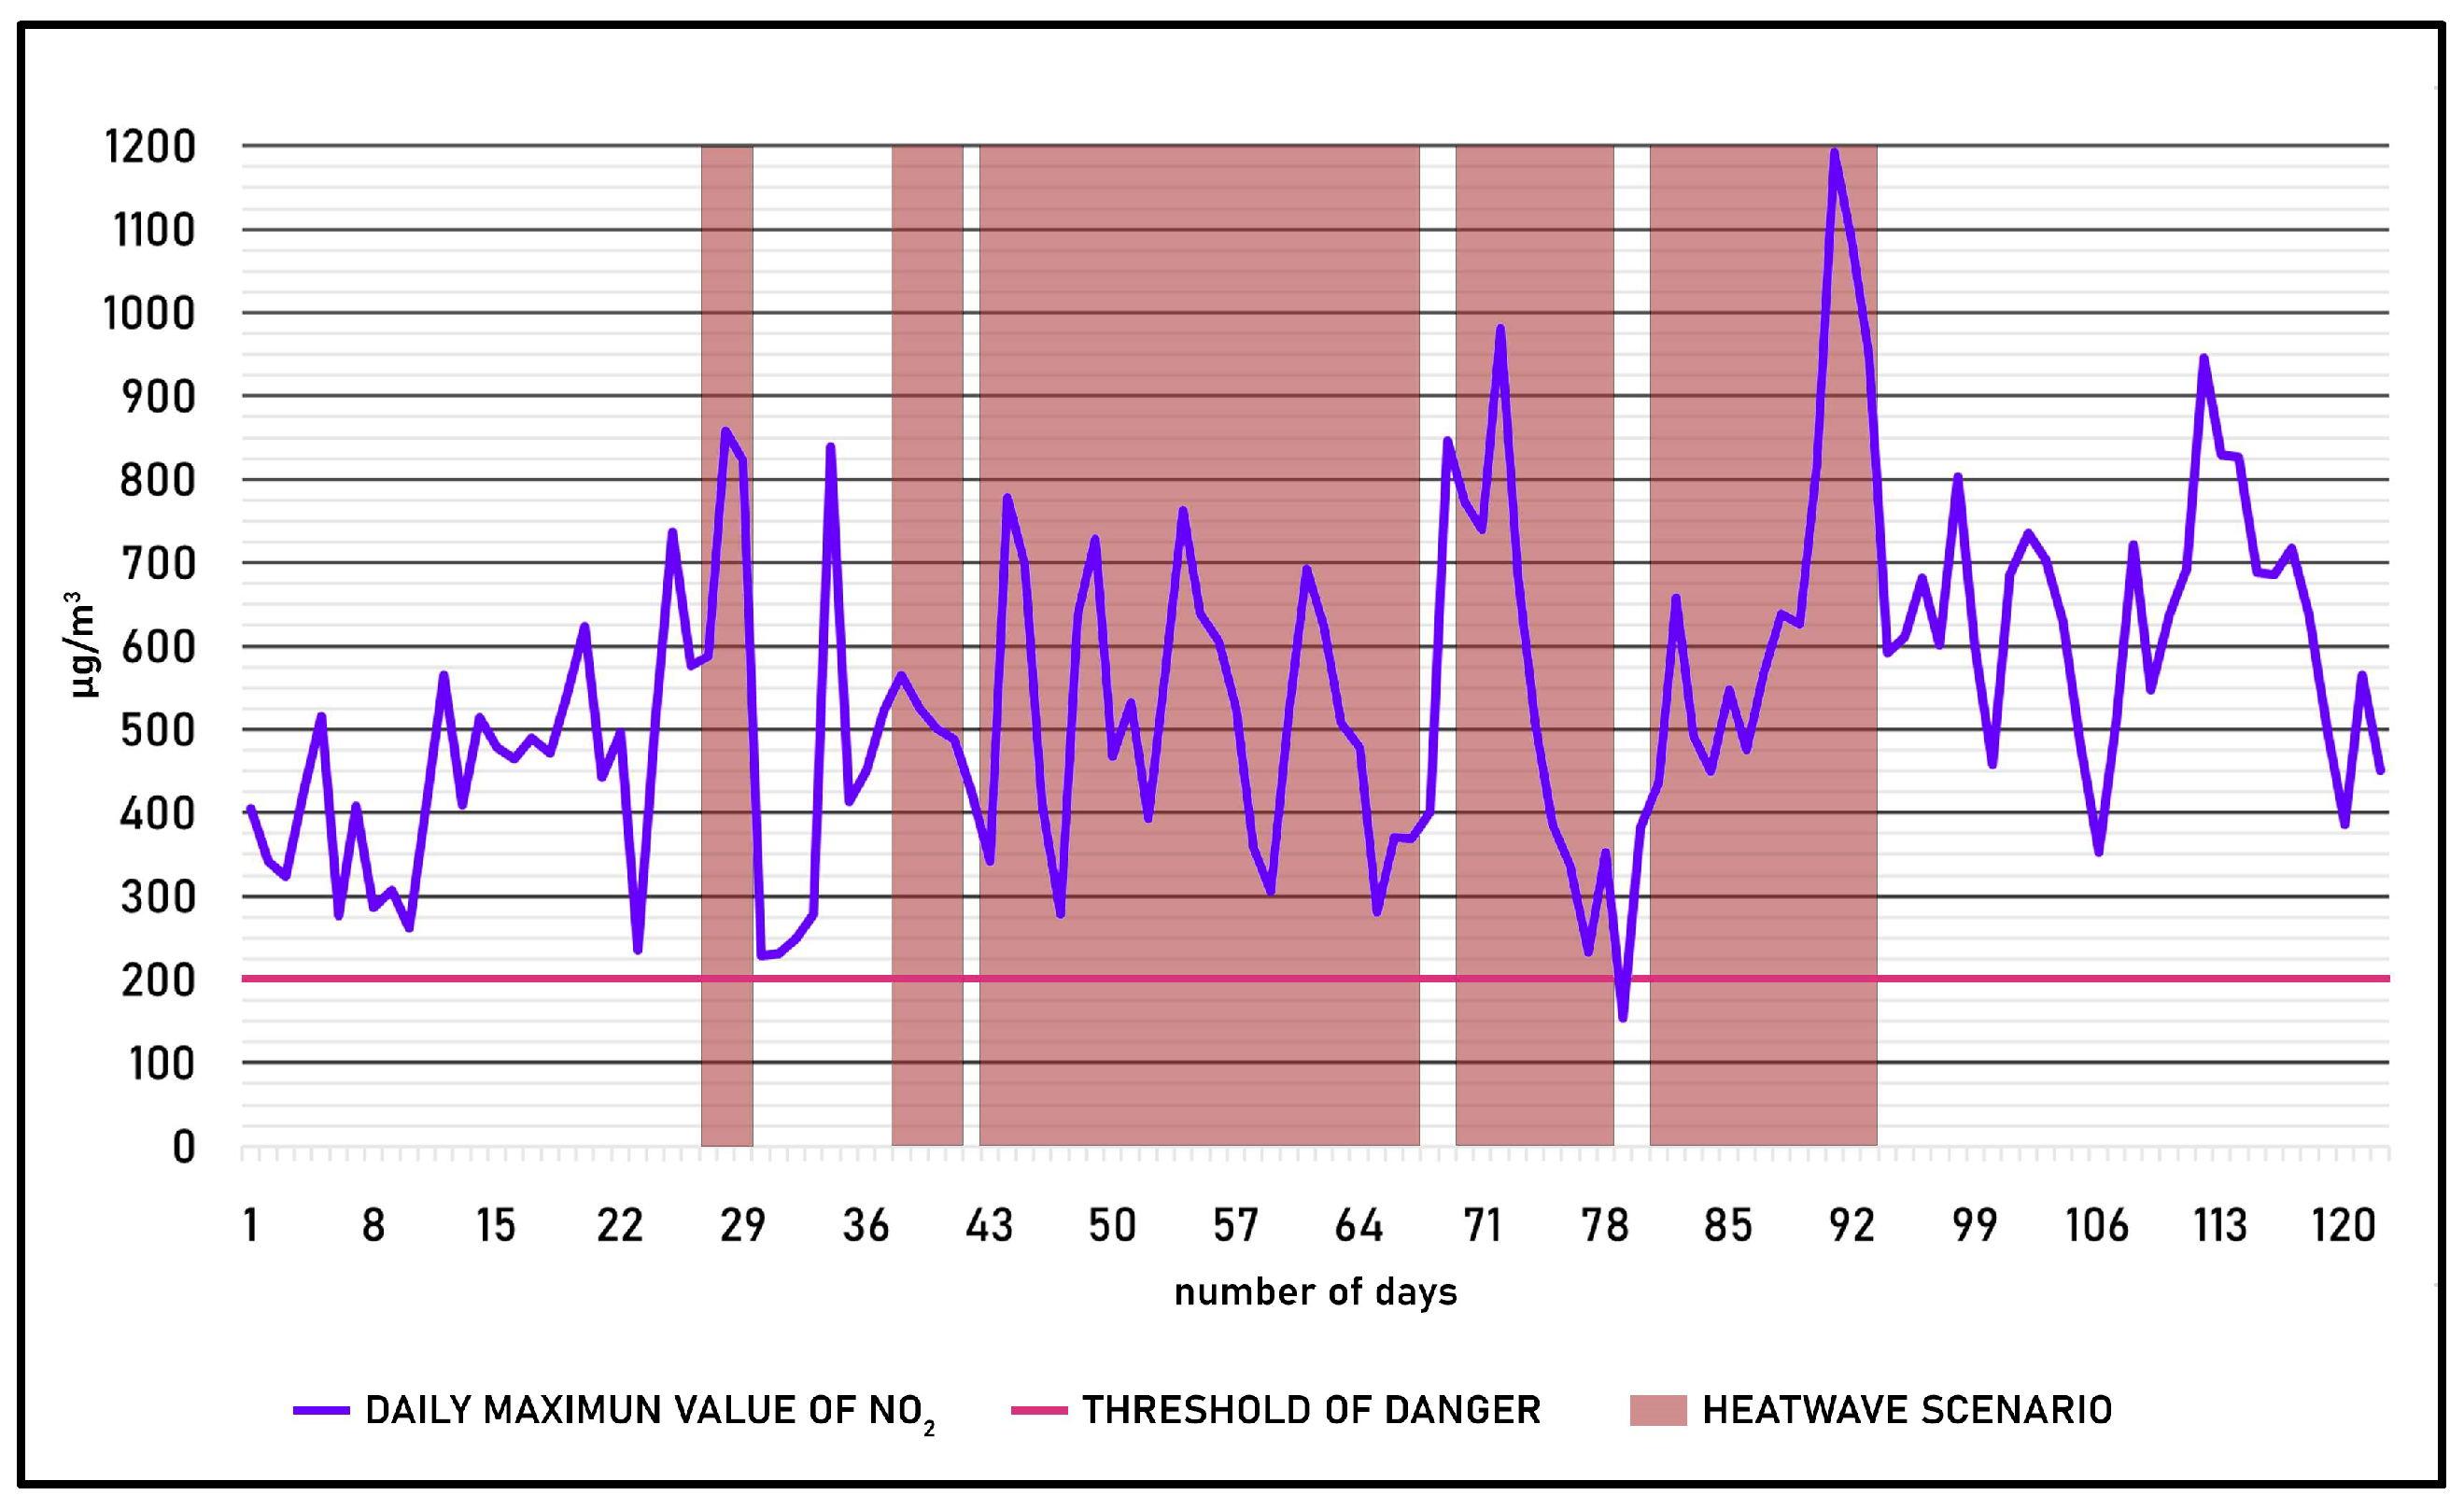

| ID Scenario | Time frame Start End |
Number of consecutive days | Day with the highest Heat Index | ||
|---|---|---|---|---|---|
| 1 | June 28 | June 30 | 3 | June 28 (+40° C) | |
| 2 | July 07 | July 11 | 4 | July 10 (+43° C) | |
| 3 | July 13 | August 06 | 25 | July 19 (+47° C) | |
| 4 | August 09 | August 17 | 9 | August 12 (+52° C) | |
| 5 | August 20 | September 01 | 13 | August 31 (+45° C) | |
| Range values [inhabitants /km2] | Class |
|---|---|
| Density < 500 | Low |
| 500 ≤ Density < 2500 | Medium low |
| 2500 ≤ Density < 5000 | Medium |
| 5000 ≤ Density < 10000 | Medium high |
| Density ≥ 10000 | High |
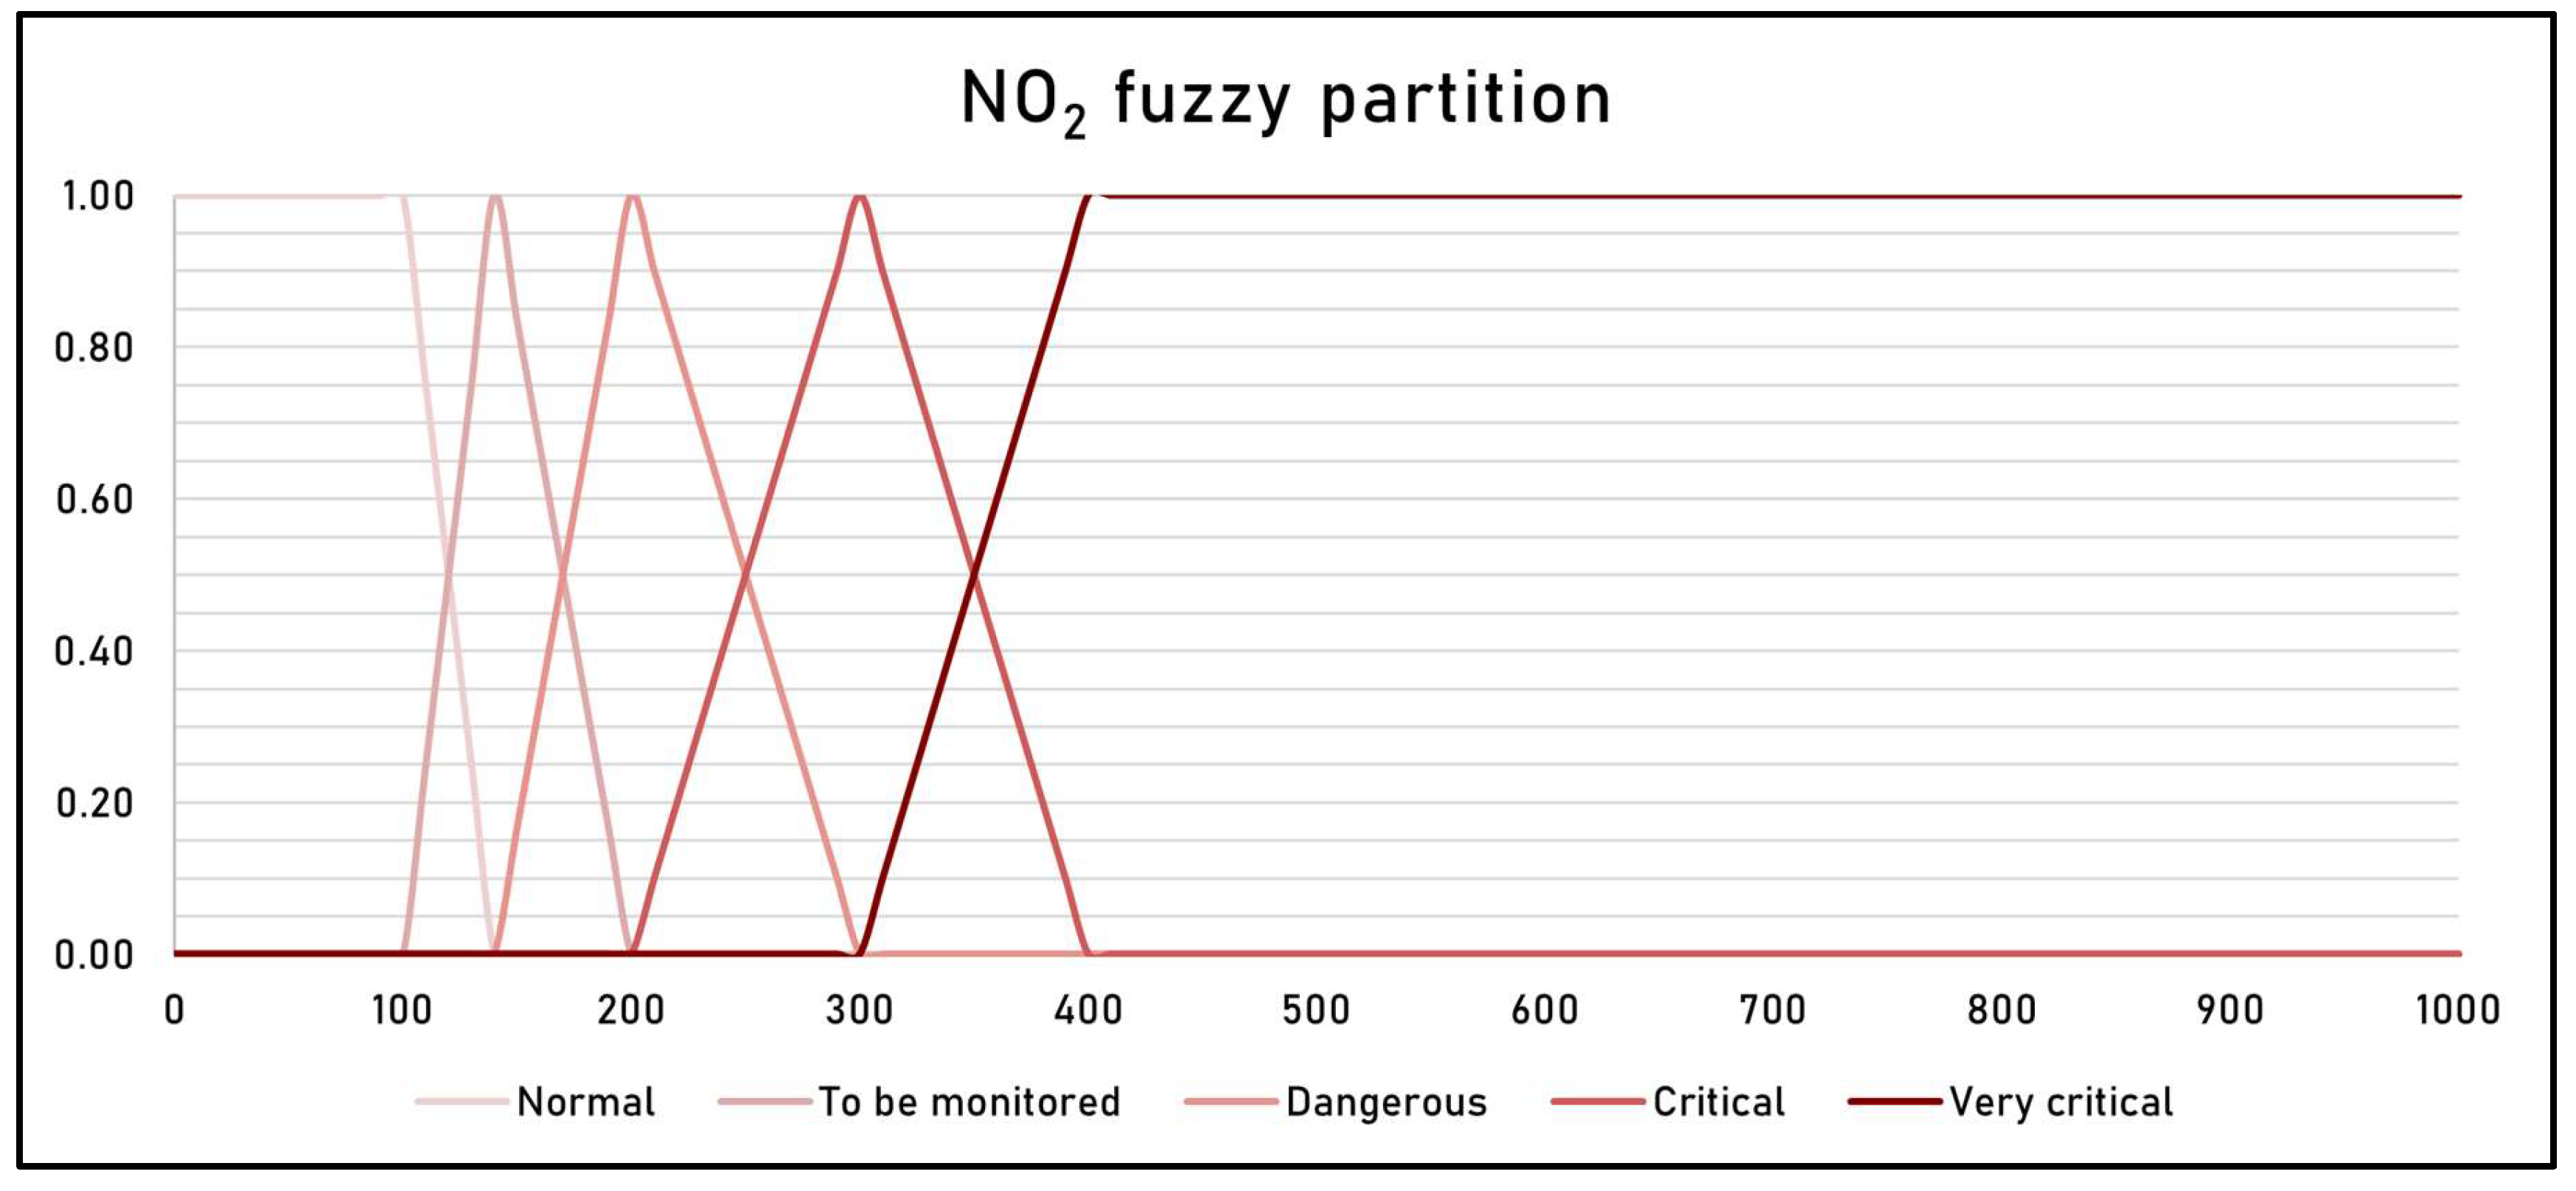
| Range values | Class | Hotspost |
|---|---|---|
| NO2 < 100 μg/m3 | Normal | - |
| 100 μg/m3 ≤ NO2 < 140 μg/m3 | To be monitored | - |
| 140 μg/m3 ≤ NO2 < 200 μg/m3 | Dangerous | - |
| 200 μg/m3 ≤ NO2 < 400 μg/m3 | Critical | - |
| NO2 ≥ 400 μg/m3 | Very critical | Hotspot |
Disclaimer/Publisher’s Note: The statements, opinions and data contained in all publications are solely those of the individual author(s) and contributor(s) and not of MDPI and/or the editor(s). MDPI and/or the editor(s) disclaim responsibility for any injury to people or property resulting from any ideas, methods, instructions or products referred to in the content. |
© 2024 by the authors. Licensee MDPI, Basel, Switzerland. This article is an open access article distributed under the terms and conditions of the Creative Commons Attribution (CC BY) license (http://creativecommons.org/licenses/by/4.0/).


