
Submitted:
18 December 2024
Posted:
20 December 2024
You are already at the latest version
Abstract
Storm surge barriers are crucial for the flood protection of the Netherlands and other Deltas. In order to guarantee a high safety level, a high closure reliability is required. In the Netherlands, the reliability of flood defenses is typically assessed based on extreme water level and wave height statistics. Yet, in case of operated flood defenses, such as storm surge barriers, the temporal clustering of successive events may be just as important. This study investigates the evolution and associated flood risk of clusters of successive storm surge peaks at the Maeslant Storm Surge Barrier in the Netherlands. Two mechanisms are considered that may lead to a series of storm surge peaks. Multi-peaked storm surges, as a consequence of tidal movement on top of the surge, are studied by means of simplified storm patterns that are widely used within the Netherlands. Clusters of surges resulting from different, but related storms are investigated by means of time series analysis of a long sea-level record close to the Maeslant Barrier. We conclude that the tendency of storms to cluster and especially the occurrence of multi-peaked storms may substantially increase the flood risk in the area behind the Maeslant Storm Surge Barrier and we envision that the influence is likely to increase with sea-level rise. The numbers are however highly uncertain due to the strong sensitivity to assumptions, model choices and applied data set. More insight in the statistics of the time evolution of extreme sea water levels is needed to better understand and ultimately to reduce these uncertainties.
Keywords:
multi-peaked storms
; storm surge barrier
; flood risk
; storm surge clusters
; operational reliability
; storm surge barrier performance
; Maeslant storm surge barrier
; compound events
1. Introduction
Early 2022, four severe storms (Corrie, Dudley, Eunice and Franklin) raged over the Netherlands, of which the latter three hit the Dutch coast in a time span of less than five days. The question is how well the Dutch flood protection system can deal with such a series of storms. Will there be enough time to recover from the previous storm?
Coastal flood risk assessments often focus on flooding caused by single extreme storm events [1,2]. Hydrological extremes in coastal areas can however also result from the simultaneous occurrence of two or more mildly extreme events [1,3,4] such as a prolonged period of high sea water levels in combination with enhanced precipitation [5] or the co-incidence of storm surges together with high river discharges [6]. Therefore, there has been an growing interest in the so-called ‘compound drivers’ that together may lead to flooding or other disasters [1,4,7].
A temporary compound event is defined as a succession of multiple (either the same or different) hazards within a short time frame [3]. One example is a cluster of storm surges over a relatively short time period. A sequence of mildly extreme storm surge events can cause similar dune erosion as a much extremer single storm surge event [2,8,9]. Likewise, Van den Brink and De Goederen [10] investigated two successive exceedances of the closure decision level of the Maeslant Storm Surge Barrier (the Netherlands), in such a short time span that there is insufficient time to fully recover from the first closure.
Storm Surge Barriers (SSB) play an important role in the flood protection of the Netherlands. Under normal conditions they are fully open to facilitate functions such as navigation, tidal exchange and ecological migration. Yet, during severe storm surges, they are closed to protect the hinterland against flooding [11]. Typically, strict standards for the operational reliability are applied to safeguard a high protection level [12].
Shortly after a closing operation, the operational reliability may temporarily deviate from the reliability at the first closure [10,13]. On the one hand, a successful closure confirms that the SSB was in good condition and that the functionality is most likely not impacted by ‘dormant failures’1. This would imply a higher operational reliability shortly after a successful closure. On the other hand, however, even during a successful operation, an SSB, and especially the Maeslant Storm Surge Barrier (MSSB), is susceptible for smaller and larger damages [10,13] which need repair to get fully operational again. Depending on the type of damage, the repair may require considerable time. In the current situation, asset management and maintenance of storm surge barriers can already be demanding [14,15] and as a result of sea level rise this may become even more challenging in future [16]. To assess the additional risk due to damage caused by the previous operation, it is important to gain insight in the probability of multiple successive storm surge peaks exceeding the closure decision level in a short time frame.
Multiple successive storm surge peaks can originate from either the same storm or from a cluster of multiple successive storms. Storm surges are often characterized by distinct oscillations on top of the surge. Especially tides and seiches are known to be able to substantially impact the maximum sea water level during the surge [17,18,19,20,21]. Likewise, tides and seiches can also cause a temporarily drop in sea water level. In case of a closed SSB, such a low may cause a negative head over the barrier, i.e., the inner basin water level is higher than the sea water level. The negative head can be an opportunity to drain the inner basin during a prolonged period of high sea water levels, but can also be a threat to the structural integrity since SSB’s are not always designed to withstand large negative heads. Either way, during a storm surge event there might be reason to temporarily open the barrier. In this study, we define a Multi-Peaked Storm (MPS) as a storm surge event during which the SSB of interest needs to close (and open) twice or more.
It has been observed that storms often show a tendency to cluster within a relatively short period of time [2,22,23,24]. This tendency is likely caused by their dependence on the same large-scale meteorological and oceanographic conditions [23]. Recently, Nieuwhuis [9] reported that about 25%-30% of the storms at Hoek van Holland (close to the Maeslant Storm Surge Barrier, Netherlands) may be considered a twin storm. This tendency to cluster also has a major impact on Storm Surge Clusters (SSC’s) during which the Maeslant Storm Surge Barrier has to close two or more times in a short period. In 2017, Van den Brink and De Goederen [10] projected that two separate closure events within a week has a return period of 300 years and within a month 150 years. The study did, however, not yet include the effect of Multi-Peaked Storms (MPS) and did not yet assess the associated risk.
In this study, we investigate the statistics (severity and timing) and impact of multiple successive storm surge peaks that may require multiple closures of the Maeslant Storm Surge Barrier (MSSB) in a short period of time. First, we investigate the MPS probability, severity and timing based on standard storm patterns that are currently used for the assessment and design of flood defenses in the Netherlands [25]. Then we assess the statistics of a cluster of multiple storm surge peaks resulting from different, but related storms on the basis of a data analysis of a long record of sea level measurements at Hoek van Holland. Finally, this information is used to assess the associated flood risk using the framework recently developed by Mooyaart et al. [12].
2. Maeslant Storm Surge Barrier (MSSB)
The Maeslant Storm Surge Barrier (MSSB) is a storm surge barrier located close to Rotterdam in the ‘Nieuwe Waterweg’ that protects over 1.5 million people against flooding. The barrier exists of two 210m wide and 17m high floating sector gates that are closed in case of severe storm surges. In normal conditions, ships can pass the barrier unimpededly as the gates are positioned in a dry dock on the side of the canal.
2.1. Water System
The MSSB is located in the Rhine-Meuse Delta where the river Meuse and two major distributaries of the river Rhine (Waal and Nederrijn/Lek) join together (Figure 1). The Delta is characterized by two major outlets that are mutually interconnected by several smaller streams. The Nieuwe Waterweg/Scheur/Nieuwe Maas is the northern outlet in which the Maeslant barrier is located.
The Haringvliet is a former estuary that was closed by the Haringvlietdam in the seventies. The Haringvlietdam is a 5km long dam that contains seventeen 56m wide discharge sluices which regulate the water level and salinity on the Haringvliet. Around low tide, the gates are (partly) opened to freely discharge on the North Sea. During high tide the sluices are only slightly opened to allow for fish migration and salt water intrusion, when there is sufficient river discharge from the Rhine and Meuse. Only in case of severe storm surges all gates are fully closed. This operation practice reduces the tidal range on the Haringvliet to about 30cm around MSL ~+0.5m.
2.2. Closing Procedure of Maeslant Barrier
The closing procedure of the MSSB starts when the water level at Rotterdam is predicted to exceed MSL +3.0m (or MSL +2.9m at Dordrecht). The operational team is mobilized, the barrier prepared for operation and the start time of the actual closing is estimated. In case of moderate Rhine discharge, the barrier is closed when the water level at the barrier exceeds MSL +2.0m. When the Rhine discharge at Lobith exceeds 6000 m3/s, the barrier is closed at low water slack to create extra storage capacity. At the end of the surge, the barrier is re-opened when the inner water level equals the outer water level again.
3. Materials and Methods
3.1. Multi-Peaked Storms (MPS)
In this study, a Multi-Peaked Storm (MPS) is defined as an extreme storm surge event during which the MSSB needs to close and open twice or more. Whereas the closing moment is solely determined by the outer water level hout, the opening is started as soon the inner water level hin equals the outer water level again. Therefore, the analysis of MPS needs to consider both, the time evolution of the outer and the time evolution of the inner water level during the storm surge event.
The outer water level hout(t) at time t is modelled as the sum of the storm surge hss(t) and the astronomical tide ht(t). In open situation, the inner water level is assumed to equal the outer water level, when the MSSB is closed the inner water level is modelled by a simple reservoir model. The statistics of the MPS are explored by means of a Monte Carlo Simulation.
3.1.1. Standard Storm Surge Patters
The evolution of the storm surge in time is described by a cosine squared function which is also used for the assessment of the Eastern Scheldt Storm Surge Barrier [26].
In Equation (1), the stochastic variables hss,mx and Tss represent the storm surge maximum and duration respectively. The extreme storm surge maxima hss,mx are modelled by the Generalized Pareto Distribution (GDP) with a threshold of 107.6cm, a shape parameter ξ = −0.062 and a scale parameter σ = 31.456 [19]. The storm duration Tss is described by a lognormal distribution with mean = 54.3hr and stdev = 18.8hr (i.e., μT = 3.938 and σT = 0.336) [26].
3.1.2. Mutual Timing of Storm Surge and Tidal Peak
Astronomical tides are characterized by distinct subdaily, daily, monthly, seasonal and interannual variability [27]. Due to its strong dependence on astronomical forces, these long-term variations are well understood and predictable and can therefore be considered a deterministic process [16,19]. Here, we model the tide in the same manner as done by Diakomopoulos et al. [19], where we focus on tides in the year 2017.
The timing of the surges is highly uncertain relative to tides. The likelihood of a storm surge occurring is subject to a strong seasonal cycle with a peak in the winter months. The probabilities that a surge occurs within a certain month are estimated on the basis of the surge data prepared by Diakomopoulos et al. [19] by dividing all identified surges that occurred in the particular month by all identified surges (Table 1).
Within a monthly lunar cycle the probability of occurrence per time unit of a storm surge can be considered more or less constant. However, the tides do effect the storm surges. As a result, the phase difference φ between the surge maximum tsurge,mx and the sub-daily M2 tidal maximum ttide,mx appears usually not uniformly distributed [18]. For Hoek van Holland, we estimated a discrete distribution of the phase difference φ = tsurge,mx - ttide,mx based on surge and tide data prepared by Diakomopoulos et al. [19] (Table 2).
3.1.2. Inner Water Levels
For the analysis of MPS, the inner water level at Rotterdam is considered equal to the water level at Hoek van Holland when the MSSB is open hin(t) = hout(t). For the closed situation, the water level is modelled by means of a simple reservoir model, in a similar way as Zhong et al. [28].
For simplicity, it is assumed that the barrier closes instantaneously at t=0 and that the water level is equally distributed over the subbasins shortly after, i.e., the inner water level at the Maeslant barrier hin,MSSB equals the basin average inner water level hin,av. Like Mooyaart et al. [12], the initial (average) water level directly after closing hin,av(0) is estimated at MSL +100cm. This is more or less the average water level of the Haringvliet and the Nieuwe Maas/Scheur. After closing, the inner water level hin,av will linearly increase with the inflow from the three river branches Qrivers divided by the area of the basin Abasin.
Inflow under, through and over the barrier is not accounted for because this is usually dwarfed out by the river discharge and thus hardly affects the estimated MPS statistics. The effective area basin Abasin is estimated at 152km2 [28] and inflow from the rivers is estimated from the discharge at Lobith (Qrivers = QLobith) where the river Rhine enters the Netherlands. In reality only about 8/9 of QLobith arrives at the Rhine/Meuse Delta, but the missing 1/9 is more or less compensated by the discharge from the Meuse river. QLobith is described by a lognormal distribution with mean = 2502 m3/s and stdev = 1334 m3/s (i.e., μQ = 7.7 and σT = 0.5) [12] and is considered completely independent from the storm surge during the surge [6].
3.1.3. Monte Carlo Simulation
A Monte Carlo simulation is performed with 524,000 random parameter samples (which is more or less the expected number of storm surge events in 100,000 years) to explore the frequency and characteristics of the Multi-Peaked Storms (MPS). The random samples exist of the storm surge maximum hss,mx, the storm surge duration Tss, river discharge Qriver, the specific M2 tidal cycle (from 2017) that coincides with the storm surge maximum, and the phase difference φ = tsurge,mx - ttide,mx between the surge and tidal peaks (Table 2).
Figure 2 illustrates how these parameters are used to simulate the outer and inner water level and MSSB operation. In this example the surge (green line) has a maximum value of MSL + 284cm and a duration of 71 hours. The peak of the surge coincides with the M2 tidal cycle peaking at 2017 January 15th 04:00:00, but has a phase difference (φ = tsurge,mx - ttide,mx) of -4 hours (grey shading). The summation of the surge (green line) and tide (blue line) results in the sea water level (black line). In this example the sea water level exceeds the closure decision level (MSL +300cm) three times and the MSSB needs to close and open twice. Right after closing (at a level MSL +200cm), the inner water level (red) first equalizes with the average water level of the water basin (neglecting the inertia in the system). Subsequently, the basin is gradually filled by river inflow at a rate of 2,700 m3/s until the inner water level equals the sea water level. At that moment, the MSSB is opened again.
The outcomes of the 524,000 simulations are used to estimate the MPS statistics (frequency of single and double storm closure events and the distribution of the peak values during single and double closure storm events).
3.2. Storm Surge Clusters (SSC)
Storm Surge Clusters (SSC) are defined as a series of surges from individual, but related storms in a relatively short period of time. In this study, the interarrival time of two successive storm surge events (ta,surge) is defined as the time in between the two successive storm surge peaks. Likewise, the interarrival time of two successive closure events (ta,closure) is the time in between the peaks of two successive closure events.
The probability density function of interarrival times of closure events pdf(Ta,closure=t) is estimated from a long randomly sampled record of storm surges (see 3.2.4), where the event maxima follow a Generalized Pareto Distribution (see 3.2.3) and the interarrival times Ta,surges an empirical pdf (3.2.2) both estimated from a long observational data set of sea water levels at Hoek van Holland (3.2.1).
3.2.1. Data and Selection of Storms
The SSC statistics are analyzed on the basis of a long sea-water level record at Hoek van Holland (1953-2018) retrieved from the GESLA database version 3 [29] and homogenized by Diakomopolous et al. [19]. Like Diakomopolous et al. [19], we select all peaks above MSL +212.2cm. Yet, in contrast, no declustering is applied because we are interested in the storm surge clusters. In case of storm surges with multiple peaks exceeding this threshold only the highest peak is selected for further analysis. Two peaks that both exceed the threshold are considered to originate from two different storm surges if there was at least one tidal peak lower than MSL +162.2m in between (50cm lower than the threshold). If not, the peaks are assumed to belong to the same storm surge event and only the highest is selected for the analysis.
The selection of storm peaks is illustrated on the basis of the triplet storm Dudley, Eunice and Franklin that hit the Netherlands in February 2022 (Figure 3). The first storm, Dudley, did not generate water levels exceeding the selection threshold. The second storm, Eunice, was characterized by three peaks of which only the second exceeded the selection threshold. After the third peak, the subsequent peak did not exceed the lower threshold and the selection algorithm therefore considers storm Eunice ended. Shortly after, Franklin hit the coast with two peaks exceeding the threshold of which only the largest is selected for further analysis.
This selection procedure results in 143 sea water level peaks in 65 years, i.e., a frequency λ of 2.2 per year. The selected storm surge peaks are used to estimate the empirical distribution of interarrival times and to perform extreme value analysis of the storm surge clusters.
3.2.2. Tendency to Cluster
The tendency to cluster is investigate by means of the interarrival times between the identified storm surge events. When the surge events are randomly distributed in time, the interarrival times would follow an exponential distribution with failure frequency λ=2.2yr-1. Deviation of the exponential distribution indicates that there is some kind of temporal pattern in the occurrence of the events. Overrepresentation of the low interarrival times (days to weeks) may indicate a tendency to cluster, whereas an underrepresentation of longer interarrival times (several months) may indicate that there is some kind of seasonality.
3.2.3. Extreme Value Analysis and Bias Correction
The Generalized Pareto Distribution (GPD) is fitted to the selected peaks using the R package extRemes [30]. It appears that the extreme data prepared by Diakomopoulos et al. [19] tend to be slightly lower than the official extreme statistics prepared for the safety assessment of the national flood defenses [25]. Therefore, a bias correction is applied to make the results better comparable to the current practice. This is simply done by adding a small value (i.e., the bias) to the selected peaks and applied threshold, such that the exceedance frequency of MSL +300cm equals 1:10 per year. Note that this bias correction does not change the scale and shape parameter.
3.2.4. Interarrival Times of Closure Events
The probability density function of interarrival times of closure events pdf(Ta,closure=t) is estimated from a randomly sampled record of 100,000 storm surge events of which the mutual interarrival times ta,surge are sampled from the empirical pdf(Ta,surge=t) (see 3.2.2) and the peak values from the Generalized Pareto Distribution (see 3.2.3). The cumulative sum of the interarrival times represents the time of occurrence with respect to time t=0. From this record all events exceeding the closure decision level (MSL +300cm) are selected and used to estimate the interarrival times between every pair of two successive closures. This subset of closure events is used to empirically estimate pdf(Ta,closure=t).
3.3. Flood Risk/Storm Surge Barrier Performance
The main function of a storm surge barrier is to reduce the extreme water level statistics behind the barrier. The difference between the extreme statistics with and without the barrier is referred to as the storm surge barrier performance [12]. This study extends on the analytical probabilistic procedure developed by Mooyaart et al. [12]. The multi-peaked storms are accounted for by adding an additional event. Storm clustering is accounted for by explicitly relating the probability of a failed closure to the time passed since the previous storm closure.
For simplicity, structural failure and hydraulic overload are ignored since they appeared to have a minor influence on the exceedance probability of the critical water level of the interior flood defenses hcr = MSL +3.60m [12].
3.3.1. Failure Scenarios
In this assessment we consider two types of closure events (Figure 4), the single-peaked storm (black) and the double-peaked storm (blue). If all necessary closures succeed, it is assumed that the inner water level stays well below MSL +300cm. If the first closure fails, the maximum inner water level hin,mx will equal the maximum outer water level hout,mx during the entire storm event. If only the second closure of a double closure event fails, the maximum inner water level hin,mx will equal the maximum outer water level during the second peak hout,mx2.
This leads to three scenarios that may lead to the exceedance of the critical inner water level hcr = MSL +3.60m (Table 3).
The exceedance frequency of the critical inner water level F(hcr) is the sum of the exceedance frequency for every failure scenario
where refers to the exceedance frequency of hcr due to failure scenario i that can be approached by (when neglecting structural failure and hydraulic overload,
Here FSS and FDS refer to the occurrence frequencies of the single closure storm (SS) and double closure storm events (DS), and Pf,c1 and Pf,c2 to the failure probability of the first and second closure respectively.
3.3.2. Probabilities Failure Events
In accordance with Mooyaart et al. [12] we take the legally required failure probability per closure request as the base failure probability (Pfc,default=1:100 per closure request) regardless of the storm type and severity. Yet, the expected reliability of a closure critically hinges on the available repair time, i.e., the interarrival time tint between the specific and previous closure event.
We assume that there is a relatively high probability of 1:10 that the MSSB needs some repair after a closure before it can properly function again. Further, we assume that the required repair at least needs one day, that there is a 50% probability that it can be fixed in case of an interarrival time ta,closure of one or two days, 75% in case of an interarrival time ta,closure in between two days and one week, 90% in case of an interarrival time ta,closure in between one week and one month and close to 100% if there is more than one month repair time. This implies a failure probability of 0.11 for the second closure of a double closure event, 0.06 for a closure event just 1 or 2 days after the previous closure event, 0.035 in between 2 days and a week after previous event, 0.02 in between 1 week and 1 month after previous event, and 0.01 if more than one month passed since last closure event (see Table 4). The probability Pf,c1 that a certain first closure fails is estimated as follows,
where ta,closure,1, ta,closure,2, …, ta,closure,4 respectively refer to interarrival times of one or two days, in between two days and a week, in between a week and a month, and more than a month.
3.3.3. Estimated Exceedance Frequencies
For the exceedance frequencies we use the results from the analyses of the multi-peaked storms (MPS’s) and storm surge clusters (SSC’s). The exceedance frequencies of double peaked storms are obtained by multiplying the frequency of individual closure events (obtained by the SSC analysis) with the relative share of double closure events (obtained by the MPS analysis).
3.4. Sensitivity Analysis
The analysis is expected to be sensitive to sea level rise and initial inner water level. To explore this sensitivity, the analysis is also performed for 25cm and 50cm sea level rise and for initial inner water levels (directly after closing) of MSL +125cm, MSL +150cm and MSL +200cm. The sea level rise is accounted for by simply adding the sea level rise to the outer water levels and the initial inner water level is taken into account by simply adjusting this parameter.
4. Results
4.1. Multiple Peaked Storms
Based on 524,000 Monte Carlo experiments (representative for ~100,000 years) with the simplified statistical input, it is estimated that there are on average 0.29 closure events per year (Table 5, third column). This increases to 0.68 and 1.55 closure events per year with 25cm and 50cm sea level rise respectively.
These closure frequencies may be somewhat overestimated. According to the official statistics developed for safety assessments of the Dutch national flood defenses [25], the closure frequency is almost three times lower (~0.10 per year). This overestimation is largely explained by the fact that this study includes all relevant tidal modes rather than one average tidal cycle [25]. Yet, despite this bias in exceedance frequency, it is assumed that the estimated share of double peaked storms (last column) and the fitted distribution functions (Figure 5) are indicative.
The relative proportion of double closures is hardly affected by sea level rise, but substantially increases with increasing initial water level (Table 5, last column). This is caused by the fact that a double closure is mainly associated with high inner water levels. A double closure, i.e., the need to open and close again in between two tidal peaks, is only necessary if the inner water level exceeds the outer water level well before the end of the storm surge (see also Figure 2). This is mainly determined by the initial inner water level, river inflow and storm surge duration (Equation (2)). Sea level rise, storm surge height and tidal range have also some minor influence since they can slightly extend the duration of the closure. The dependence on storm surge height and tidal range make that double closure maxima tend to be somewhat higher than single closure maxima (Figure 5, blue line versus red line).
Further, it appears that in about 2/3 of the double closures, the first sea water level peak is higher than the second one (not shown). This results in substantially higher first closure maxima (green line) than second closure maxima (Figure 5, yellow line). As a result of the low initial inner water levels, opening is not always necessary during the first tidal low. Therefore, many first closures encompass two tidal peaks (see also example in Figure 2). The second closure usually encompasses only one tidal peak, since the inner water level at the start of the second closure is usually way higher. Logically, the difference between first and second closure maxima rapidly decreases with increasing initial inner water levels (compare dashed yellow and green lines).
4.2. Storm Surge Clusters (SSC)
4.2.1. Tendency to Cluster
The observed interarrival times between two successive storm surges show a clear tendency to cluster (Figure 6). Short observed interarrival times (red line) are overrepresented with respect to the theoretical case based on fully independent peaks (black line).
Large part of this clustering can be explained by the strong seasonality in the probability of occurrence of extreme storm surges. In winter (especially in the months nov-feb) the probability of occurrence is much higher than in summer. Since there are on average 2.2 peaks per year that mainly occur in four winter months, interarrival times in between 1 and 160 days are clearly overrepresented and interarrival times between 160 and 240 days clearly underrepresented (grey line).
Besides the seasonality, 13 of the 142 pairs of successive peaks follow each other within two days. This is five times more than would be expected if there would be no additional clustering on top of the seasonality (compare large difference between red and grey line for short interarrival times).
4.2.2. Flood Frequency Analysis
The observed extremes are well described by the GPD (scale parameter 21.4 and shape parameter 0.033) (Figure 7). Without bias correction, however, the homogenized GESLA data tend to be slightly lower than the official extreme statistics prepared for the safety assessment of the national flood defenses (grey dots). Therefore, a bias correction of 18.26cm is applied to the GESLA data (black dots) and threshold. In this way, the exceedance frequency of MSL +300cm according to the fitted GPD (red line) matches once in 10 years.
Sea level rise is accounted for in similar way as the bias correction by adding the sea level rise to the applied threshold (blue lines).
4.2.3. Probability of Time Passed Since Previous Closure
According to the analysis, the probability that a storm closure is followed by a second closure within a month is about 2.3% (Table 6, column 2). This means that the probability of two closures within a month is 1:435. Given the clear tendency of storm surges to cluster, this probability may seem relatively low. This is, however, caused by the fact that only a small percentage (about 4.5%) of the storm surges requires a closure. With sea level rise, the closure frequency, and thus the probability of a second closure within a short period of time, rapidly increases (Table 6, column 3 and 4).
4.3. Storm Surge Barrier Performance
For the current situation, taking into account multi-peaked storms and storm surge clusters substantially increases the frequency of failed closures and exceedances of extreme inner water levels (Figure 8, compare continuous, dark blue and orange lines). The probability of a failed closure, for instance, almost doubles from 1:1000 to 1:540 per year. This increased frequency is mainly caused by the contribution double-peaked storms. The large contribution can be explained by the large (assumed) failure probability of the second closure per request (0.11), even though double-peaked storms are relatively rare (return period of 125 years).
For larger inner water levels the relative importance gradually shifts from failed second closures to failed first closures (compare light blue and turquoise, dashed lines). This is due to the fact that the very highest peaks tend to occur during the first closure rather than during the second closure (see Section 4.1). With higher initial inner water levels, the highest peaks are more likely to occur during the second closure and as a consequence the failed second closures gain importance with increasing initial inner water level (Figure 9).
The tendency of storm surges to cluster contributes less to the exceedance frequencies. Without sea level rise, the probability of a failed closure increases only from 0.01 to 0.0104 per closure request (Table 7). This limited increase in failure probability is due to the fact that a closure shortly before is rare, simply because the closure frequency is such low (once in ten years on average). This means that the the probability per year of two closure events within two days is only 1:2500, within a week 1:1111 and within a month 1:435. With rising sea level, the probability of two closures shortly after each other will increase and as a consequence the probability of a failed closure too.
5. Discussion and Conclusions
This study investigated the statistics of multiple storm surge peaks in a relatively short period of time exceeding the closure decision level of the Maeslant Storm Surge Barrier at Rotterdam. Previous studies have shown that temporary compound events may substantially contribute to flood risk and that this is also the case for clusters of storm surges at the MSSB. This research extends on these previous studies by adding the multi-peaked storms and explicitly estimate the associated flood risk.
It was found that the necessity to close several times within a short time period substantially contributes to the flood risk behind the MSSB. For the current situation, explicitly taking into account multi-peaked storms and storm surge clusters almost doubles the probability of a failed closure from 1:1000 to 1:540 per year. This is especially due to the double closure events, that have a relatively high probability of occurrence of 1:125 per year and a relatively high failure probability of the second closure. The contribution of storm surge clusters is way less because the probability of two closure events within two days is only 1:2500 per year, within a week 1:1111 per year and within a month 1:435 per year.
The results are well in line with previous studies that suggested that compound events of moderate extremes may have a major impact on flood risk. It appears however, that the results are highly sensitive to assumptions, model choices and applied data, and therefore that the exact contribution to flood risk is highly uncertain. The projected probability of two closure events within a short time frame appears about three times lower than previously estimated by Van den Brink and De Goederen [10]. This is likely caused by a stronger temporal structure within the applied data generated by a surge model forced by long records of ECMWF seasonal forecasts. Likewise, the MPS analysis with standard storm patterns estimated three times too high closure frequencies by applying a more advanced representation of the astronomical tide, whereas the SSC analysis resulted three times too low closure frequencies by using a slightly different data set and homogenisation than commonly used.
There are also some other limiting factors that may obscure the resulting risk estimates. First of all, the sensitivity of the operational reliability to storm closures is only a first rough estimate, not supported by data or structured expert judgment. Furthermore, the analysis was limited to double-peaked storms not considering the possibility that storm events may also require three or even more closures. Besides, other phenomena, like seiches, that may contribute to the multi-peaked storm statistics were not considered. Finally, the study is limited to one type of compound events while others, for instance the likely event that extreme storm surges co-occur with extreme wind conditions that may lower the operational reliability.
Despite these limitations, the study clearly demonstrates the importance of considering series of successive storm surge peaks in flood risk management. There are however also options to mitigate the additional flood risk. For instance, the frequency of double-peaked storms could be lowered by lowering the water levels in the Haringvliet on beforehand and close the Maeslant barrier at low water slack. Alternatively, in case of two expected peaks of which the second is higher, it might be considered not to close at the first, i.e., accepting some flooding to reduce the probability of a big flood. The optimisation of the flood risk strategies requires a more elaborate risk analysis considering the earlier mentioned limitations.
Author Contributions
Conceptualization, A.B. and D.R.; methodology, A.B. and D.R.; software, A.B. and D.R.; validation, A.B. and D.R.; formal analysis, A.B.; investigation, A.B. and D.R.; A.B. and D.R.; data curation, A.B. and D.R.; writing—original draft preparation, A.B.; writing—review and editing, D.R.; visualization, A.B.; supervision, A.B.; project administration, A.B. All authors have read and agreed to the published version of the manuscript.
Funding
This research received no external funding
Institutional Review Board Statement
Not applicable
Informed Consent Statement
Not applicable
Data Availability Statement
to be done.
Acknowledgments
We gratefully acknowledge Leslie Mooyaart for his help with the overview map and reviewing the manuscript and Faidon Diakomopoulos for his help with providing the data for our research.
Conflicts of Interest
The authors declare no conflicts of interest.
References
- Green, J; Haigh, I.; Quinn, N; Neal, J; Wahl, T; Wood, M; Eilander, D; De Ruiter, M; Ward, P; Camus, P. Review Article: A Comprehensive Review of Compound Flooding Literature with a Focus on Coastal and Estuarine Regions. EGUsphere [preprint] 2024. [Google Scholar] [CrossRef]
- Eichentopf, S.; Karunarathna, H.; Alsina, J.M. Morphodynamics of sandy beaches under the influence of storm sequences: Current research status and future needs. Water Science and Engineering 2019, 12, 221–234. [Google Scholar] [CrossRef]
- Zscheischler, J.; Martius, O.; Westra, S.; et al. A typology of compound weather and climate events. Nat Rev Earth Environ 2020, 1, 333–347. [Google Scholar] [CrossRef]
- Van den Hurk, B.J.J.M.; White, C.J.; Ramos, A.M.; Ward, P.J.; Martius, O.; Olbert, I.; Roscoe, K.; Goulart, H.M.D.; Zscheischler, J. Consideration of compound drivers and impacts in the disaster risk reduction cycle. iScience 2023, 26, 106030. [Google Scholar] [CrossRef] [PubMed]
- Van den Hurk, B.J.J.M.; Van Meijgaard, E.; De Valk, P.; Van Heeringen, K-J. ; Gooijer, J. Analysis of a compounding surge and precipitation event in the Netherlands. Environ. Res. Lett. 2015, 10, 035001. [Google Scholar] [CrossRef]
- Klerk, W.J.; Winsemius, H.C.; Verseveld, W.J.; Bakker, A.M.R.; Diermanse, F.L.M. The co-incidence of storm surges and extreme discharges within the Rhine–Meuse Delta Environ. Res. Lett. 2015, 10, 035005. [Google Scholar] [CrossRef]
- Jane, R.; Cadavid, L. , Obeysekera, J.; Wahl, T. Multivariate statistical modelling of the drivers of compound flood events in south Florida. Nat. Hazards Earth Syst. Sci. 2020, 20, 2681–2699. [Google Scholar] [CrossRef]
- Ferreira, O. Storm Groups versus Extreme Single Storms: Predicted Erosion and Management Consequences. Journal of Coastal Research, 2005; SI, 221–227, https://www.jstor.org/stable/25736987. [Google Scholar]
- Nieuwhuis, T.J.H. ; Modelling the effect of twin storms on dune erosion. Master thesis, Delft University of Technology, Delft, November 2023. https://repository.tudelft.nl/record/uuid:3730f825-7934-4c97-a4c2-473ca99fc39c.
- Van den Brink, H.W.; De Goederen, S. Recurrence intervals for the closure of the Dutch Maeslant surge barrier. Ocean Sci 2017, 13, 691–701. [Google Scholar] [CrossRef]
- Mooyaart, L.F.; Jonkman, S.N. Overview and Design Considerations of Storm Surge Barriers. J. Waterway, Port, Coastal, Ocean Eng. 2017, 143, 06017001. [Google Scholar] [CrossRef]
- Mooyaart, L.F.; Bakker, A.M.R.; Van den Bogaard, J.A.; Jorissen, R.E.; Rijcken, T.; Jonkman, S.N. Storm surge barrier performance – the effect of barrier failures on extreme water level frequencies. J Flood Risk Management, in review.
- Rijkswaterstaat, Wettelijke beoordeling Europoortkering I Dijktraject 208, version 2.2 definitief, Netherlands; pp. 30-32. https://waterveiligheidsportaal.nl/nss/assessment-lbo1.
- Walraven, M.; Vrolijk, K.; Kothuis, B.B. Chapter 20 - Design, maintain and operate movable storm surge barriers for flood risk reduction. In Coastal Flood Risk Reduction - The Netherlands and the U.S. Upper Texas Coast, 1st ed.; Brody, S.; Lee, Y.; Kothuis. B.B.; Elsevier, 2022. [CrossRef]
- Jonkman, S.N.; Merrell, W.J. Discussion of “Coastal Defense Megaprojects in an Era of Sea-Level Rise: Politically Feasible Strategies or Army Corps Fantasies? ” Journal of Water Resources Planning and Management 2024, 150. [Google Scholar] [CrossRef]
- Trace-Kleeberg, S.; Haigh, I.D.; Walraven, M.; Gourvenec, S. How should storm surge barrier maintenance strategies be changed in light of sea-level rise? A case study. Coastal Engineering 2023, 184, 104336. [Google Scholar] [CrossRef]
- Serafin, K.A.; Rugglero, P.; Stockdon, H.F. The relative contribution of waves, tides, and nontidal residuals to extreme total water levels on U.S. Coast sandy beaches. Geophys. Res. Lett. 2017, 44, 1839–1847. [Google Scholar] [CrossRef]
- Geerse, C.; Rongen, G.; Strijker, B. Schematization of storm surges – Analysis based on simulated KNMI-data, Final report. HKV Consultants, The Netherlands, 2019. https://open.rijkswaterstaat.nl/open-overheid/onderzoeksrapporten/@222536/schematization-storm-surges-analysis/.
- Diakomopoulos, F.; Antonini, A.; Bakker, A.M.R.; Stancanelli, L.M.; Hrachowitz, M.; Ragno, E. Probabilistic characterizations of flood hazards in deltas: Application to Hoek van Holland (Netherlands). Coastal Engineering 2024, 194, 104603. [Google Scholar] [CrossRef]
- De Jong, M.P.C. Origin and prediction of seiches in Rotterdam Harbour basins. PhD thesis, Delft University of Technology, Delft, May 10th 2004. https://repository.tudelft.nl/record/uuid:d7ce7779-bf81-47b7-bc14-e01ce5e6856b.
- De Jong, M.P.C.; Reijmerink, S.P.; Beckers, J.V.L. Meteorologically generated long-period waves and their impact on the Dutch primary national flooding protection system. Natural Hazards 2021, 106, 1421–1443. [Google Scholar] [CrossRef]
- Bakker, A.M.R.; Van den Hurk, B.J.J.M. Estimation of persistence and trends in geostrophic wind speed for the assessment of wind energy yields in Northwest Europe. Clim. Dyn. 2012, 39, 767–782. [Google Scholar] [CrossRef]
- Pinto, J.G.; Bellenbaum, N.; Karremann, M.K.; Della-Marta, P.M. Seriel clustering of extratropical cyclones over the North Atlantic and Europe under recent and future climate conditions. JGR Atmospheres 2013, 118, 12476–12485. [Google Scholar] [CrossRef]
- Pinto, J.G.; Gómara, I.; Masato, G.; Dacre, H.F.; Woollings, T.; Caballero, R. Large-scale dynamics associated with clustering of extratropical cyclones affecting Western Europe. JGR Atmospheres 2014, 119, 13704–13709. [Google Scholar] [CrossRef]
- Chbab, H. Basisstochasten WTI-2017 – Statistiek en statistische onzekerheid, 1209433-012-HYE-0007. Deltares, Delft, The Netherlands, 2016. https://publications.deltares.nl/1209433_012.pdf.
- Saman, K. Prestatiepeilenmodel Oosterscheldekering 2017, version 3.0 definitief. RWS Zee en Delta District Noord Oosterscheldekering, The Netherlands, 2017. https://open.rijkswaterstaat.nl/open-overheid/@230297/prestatiepeilenmodel-oosterscheldekering/.
- Haigh, I.D.; Pickering, M.D.; Green, J.A.M.; Arbic, B.K.; Arns, A.; Dangendorf, S.; et al. The tides they are a-changin’: A comprehensive review of past and future nonastronomical changes in tides, their driving mechanisms and future implications. Reviews of Geophysics, 2020, 57, e2018RG000636. [Google Scholar] [CrossRef]
- Zhong, H.; Van Overloop, P-J. ; Van Gelder, P.; Rijcken, T. Influence of a Storm Surge Barrier’s Operation on the Flood Frequency in the Rhine Delta Area. Water, 2012, 4, 474–493. [Google Scholar] [CrossRef]
- Haigh, I.D.; Marcos, M.; Talke, S.A.; Woodworth, P.L.; Hunter, J.R.; Hague, B.S.; Arns, A.; Bradshaw, E.; Thompson, P. GESLA version 3: A major update to the global higher-frequency sea-level dataset. Geosci. Data J. 2023, 10, 293–314. [Google Scholar] [CrossRef]
- Gilleland, E.; Katz, R.W. extRemes 2.0: An Extreme Value Analysis Package in R. Journal of Statistical Software, 2016, 72, 1–39. [Google Scholar] [CrossRef]
1 Dormant failures are failures of non-operating parts that cannot be observed without additional testing |
Figure 1.
Overview of Rhine/Meuse Delta.
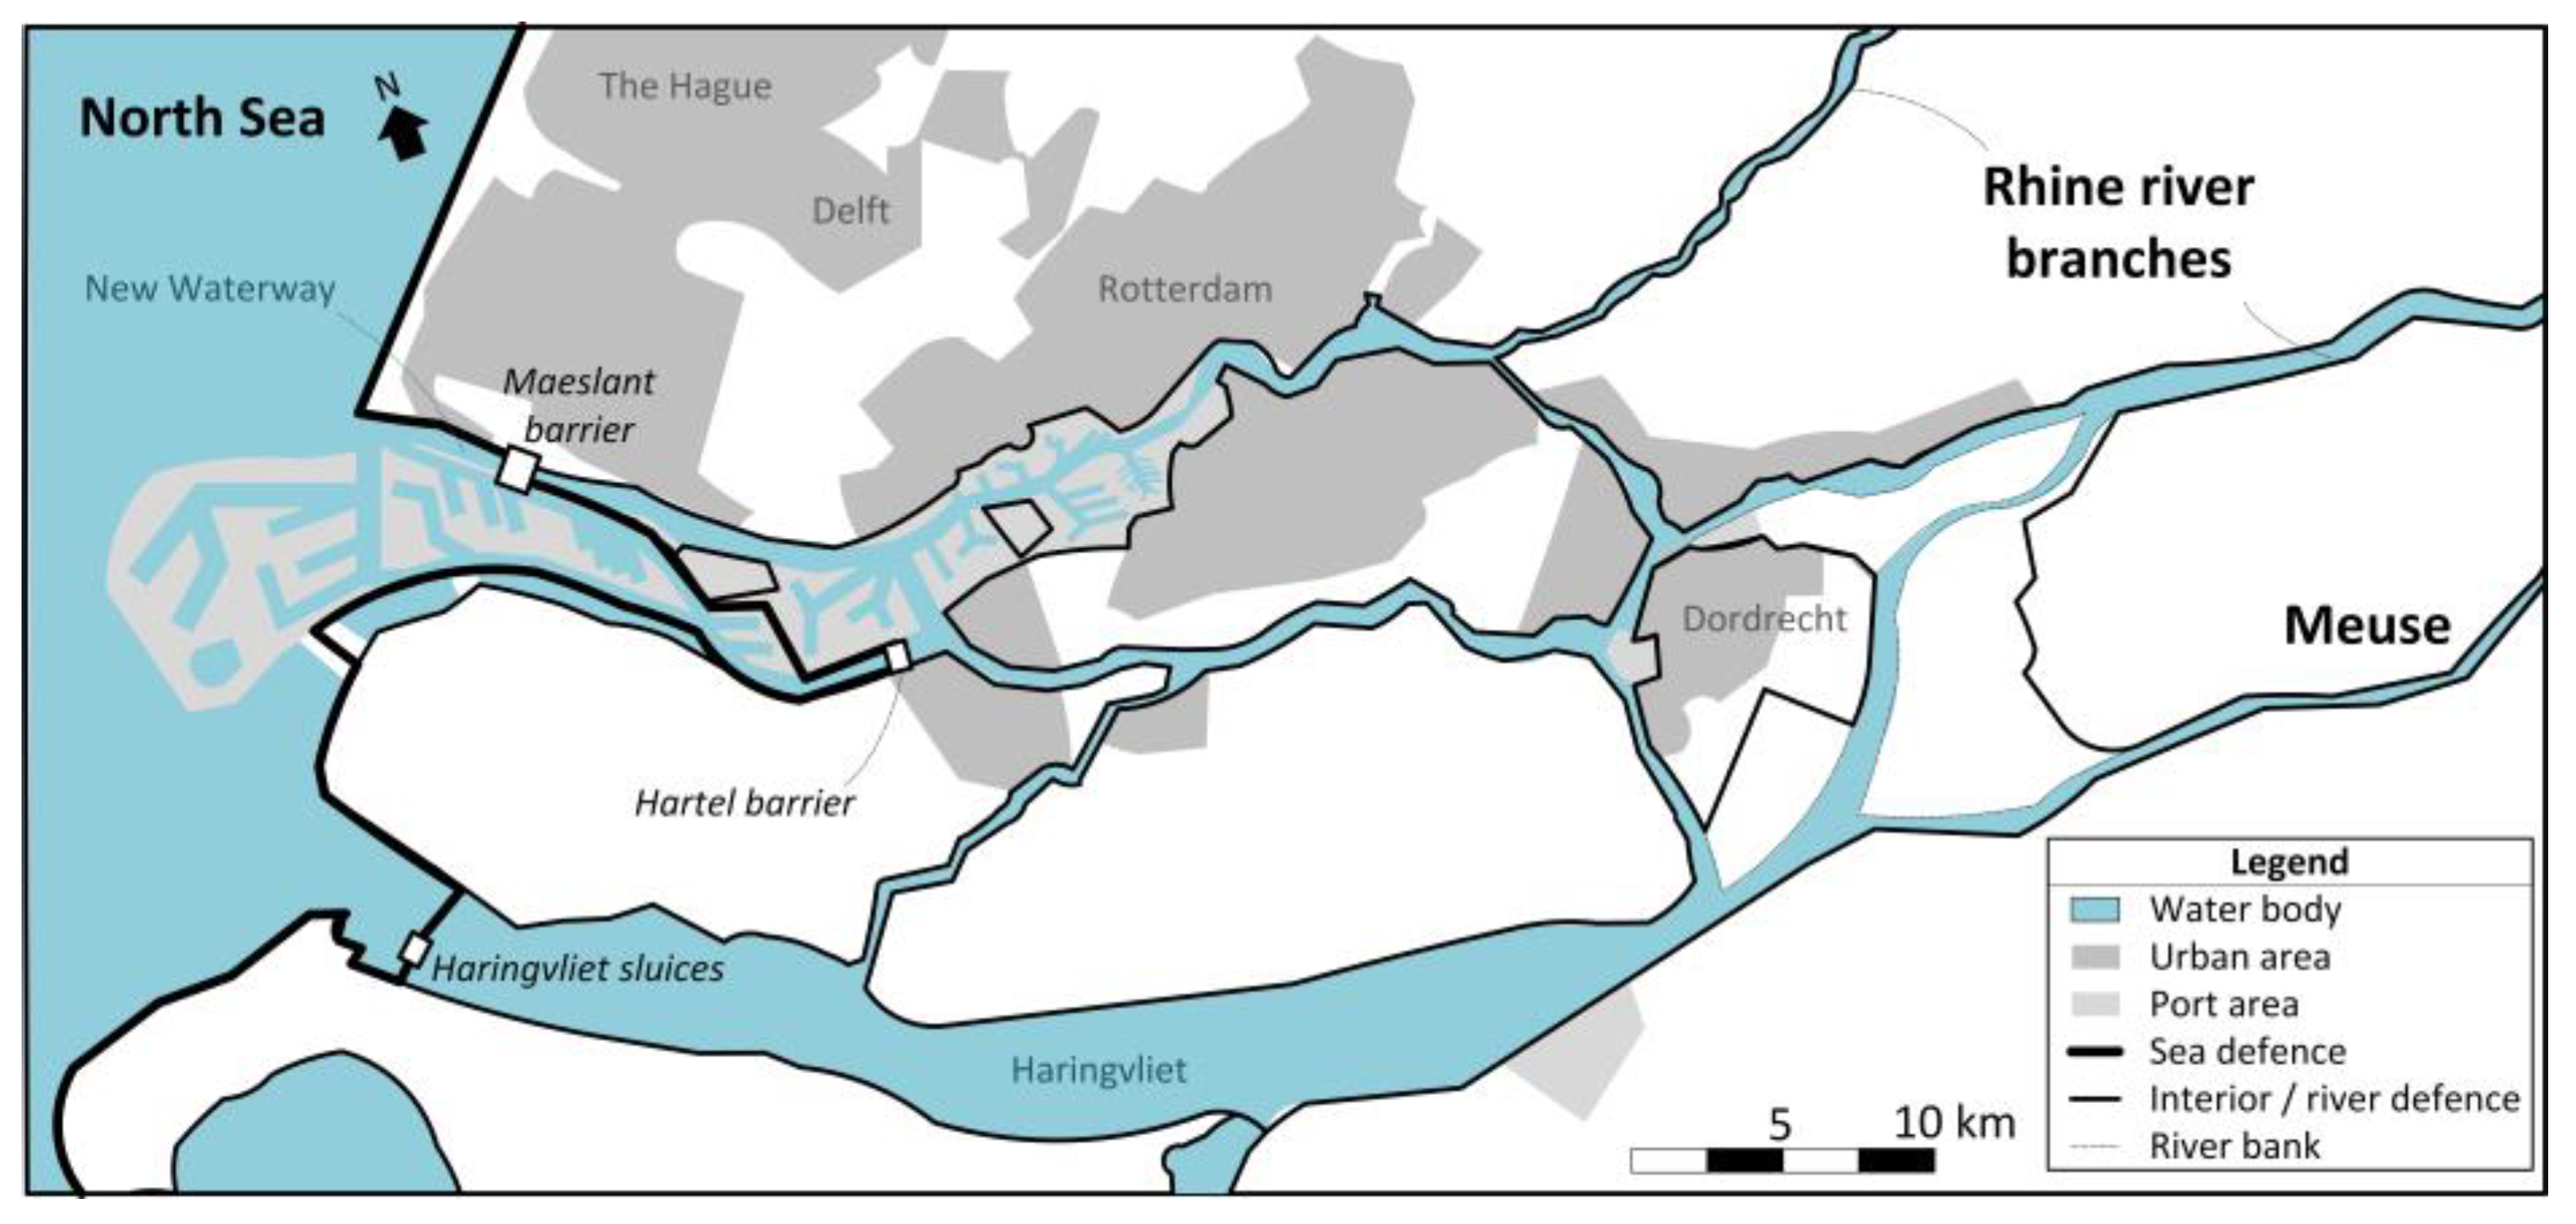
Figure 2.
Example of simulation of multi-peaked storm (MPS) with simplified storm pattern.
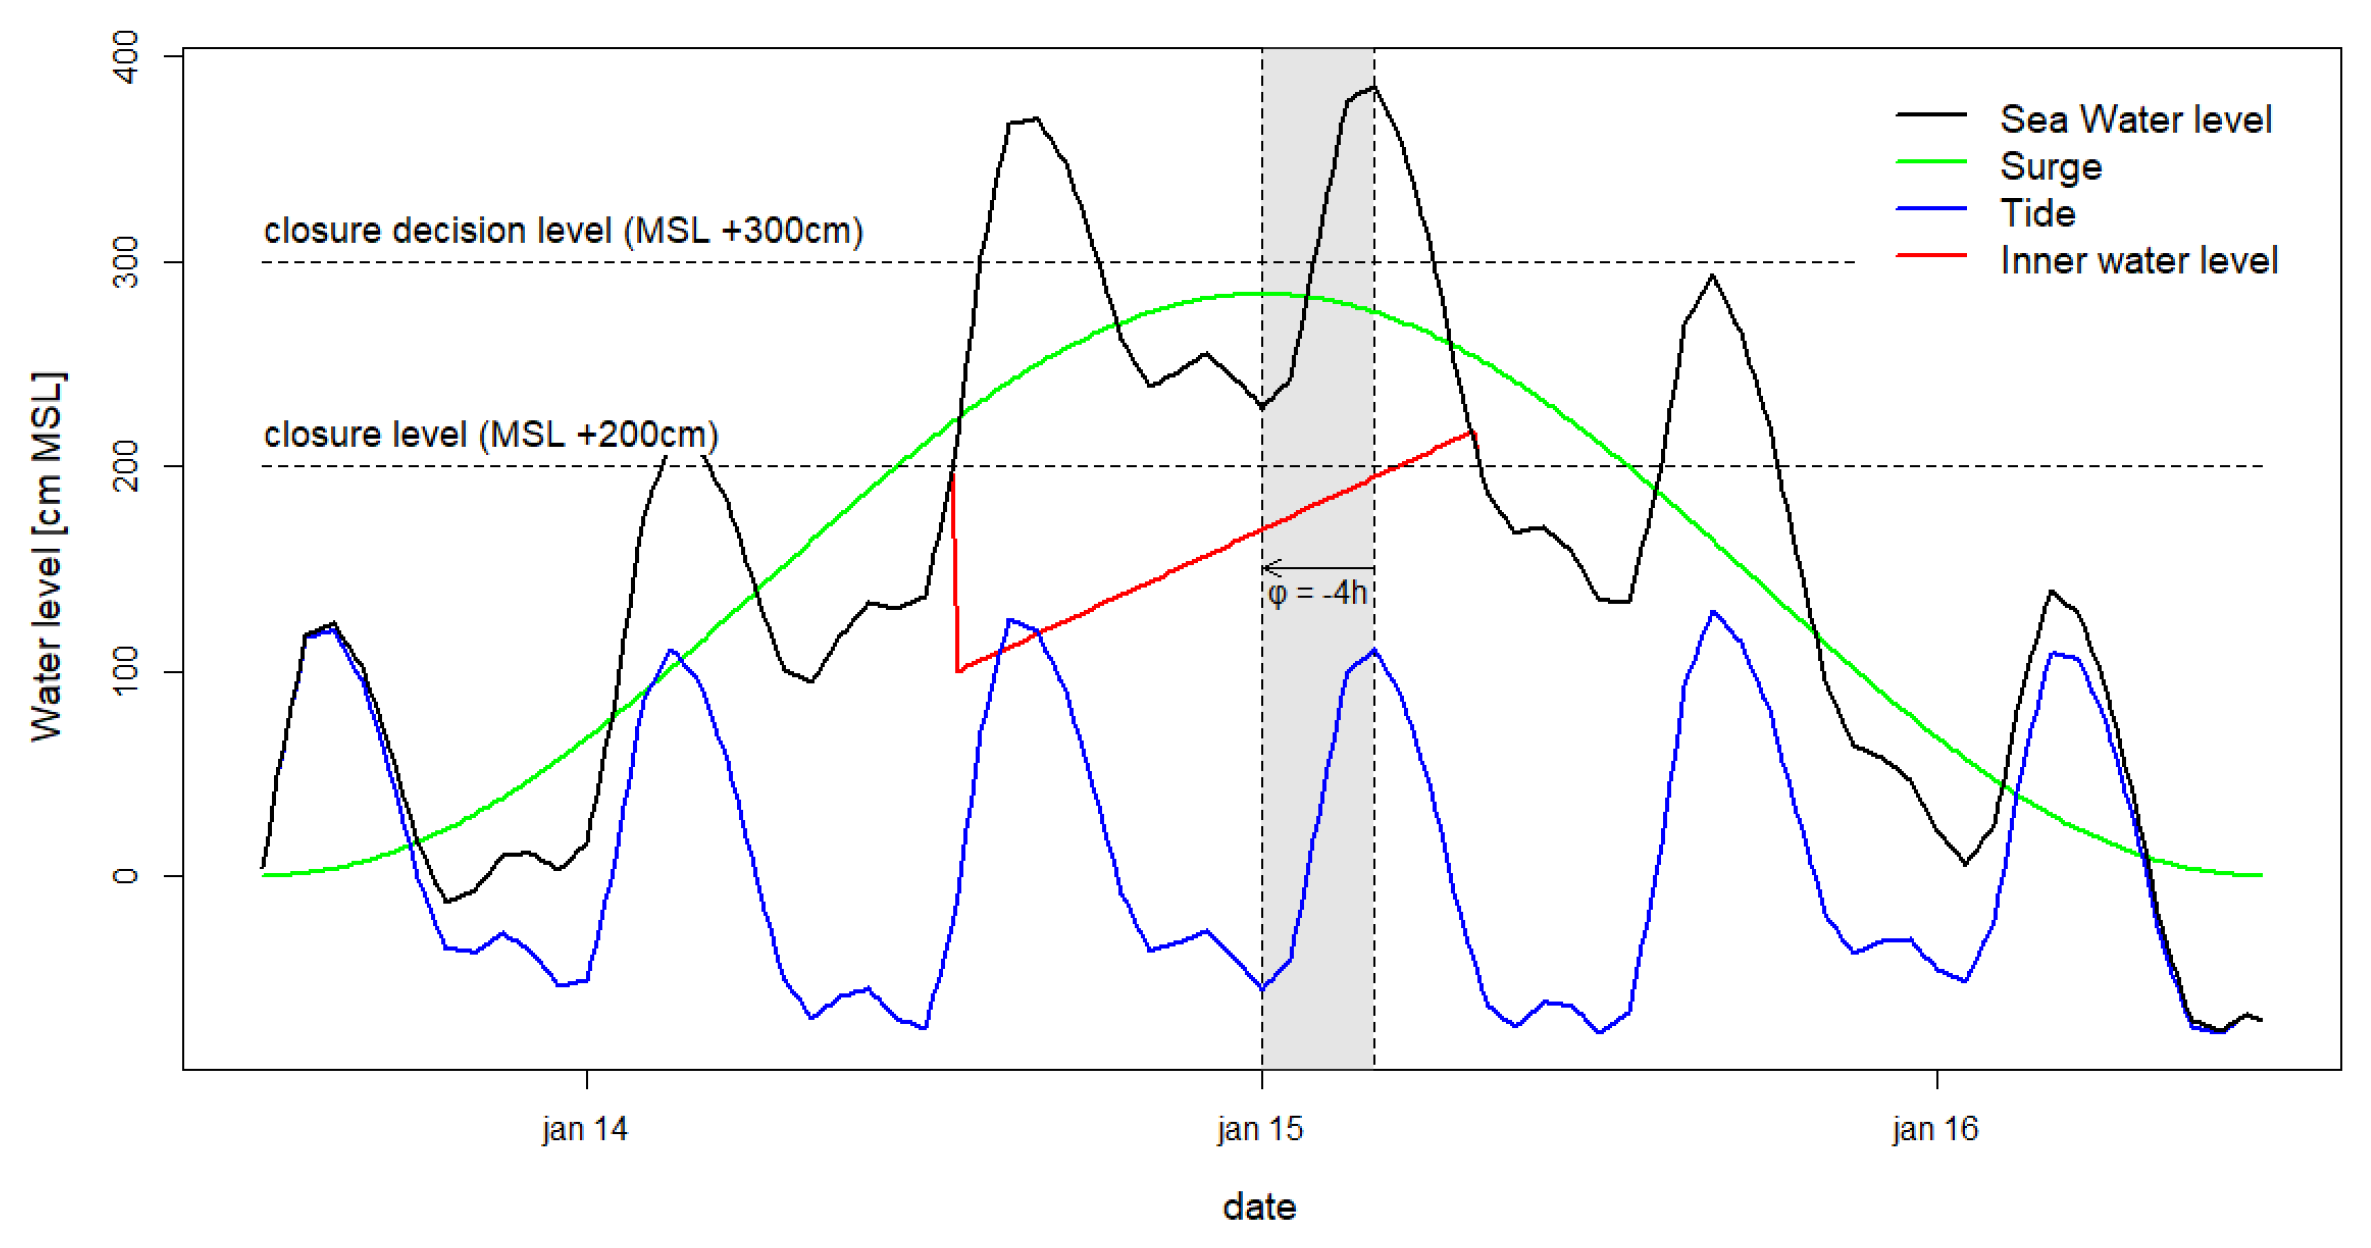
Figure 3.
Example of selection sea water level peaks for the analysis of storm surge clusters (based on triplet storm Dudley, Eunice and Franklin in February 2022).
Figure 3.
Example of selection sea water level peaks for the analysis of storm surge clusters (based on triplet storm Dudley, Eunice and Franklin in February 2022).
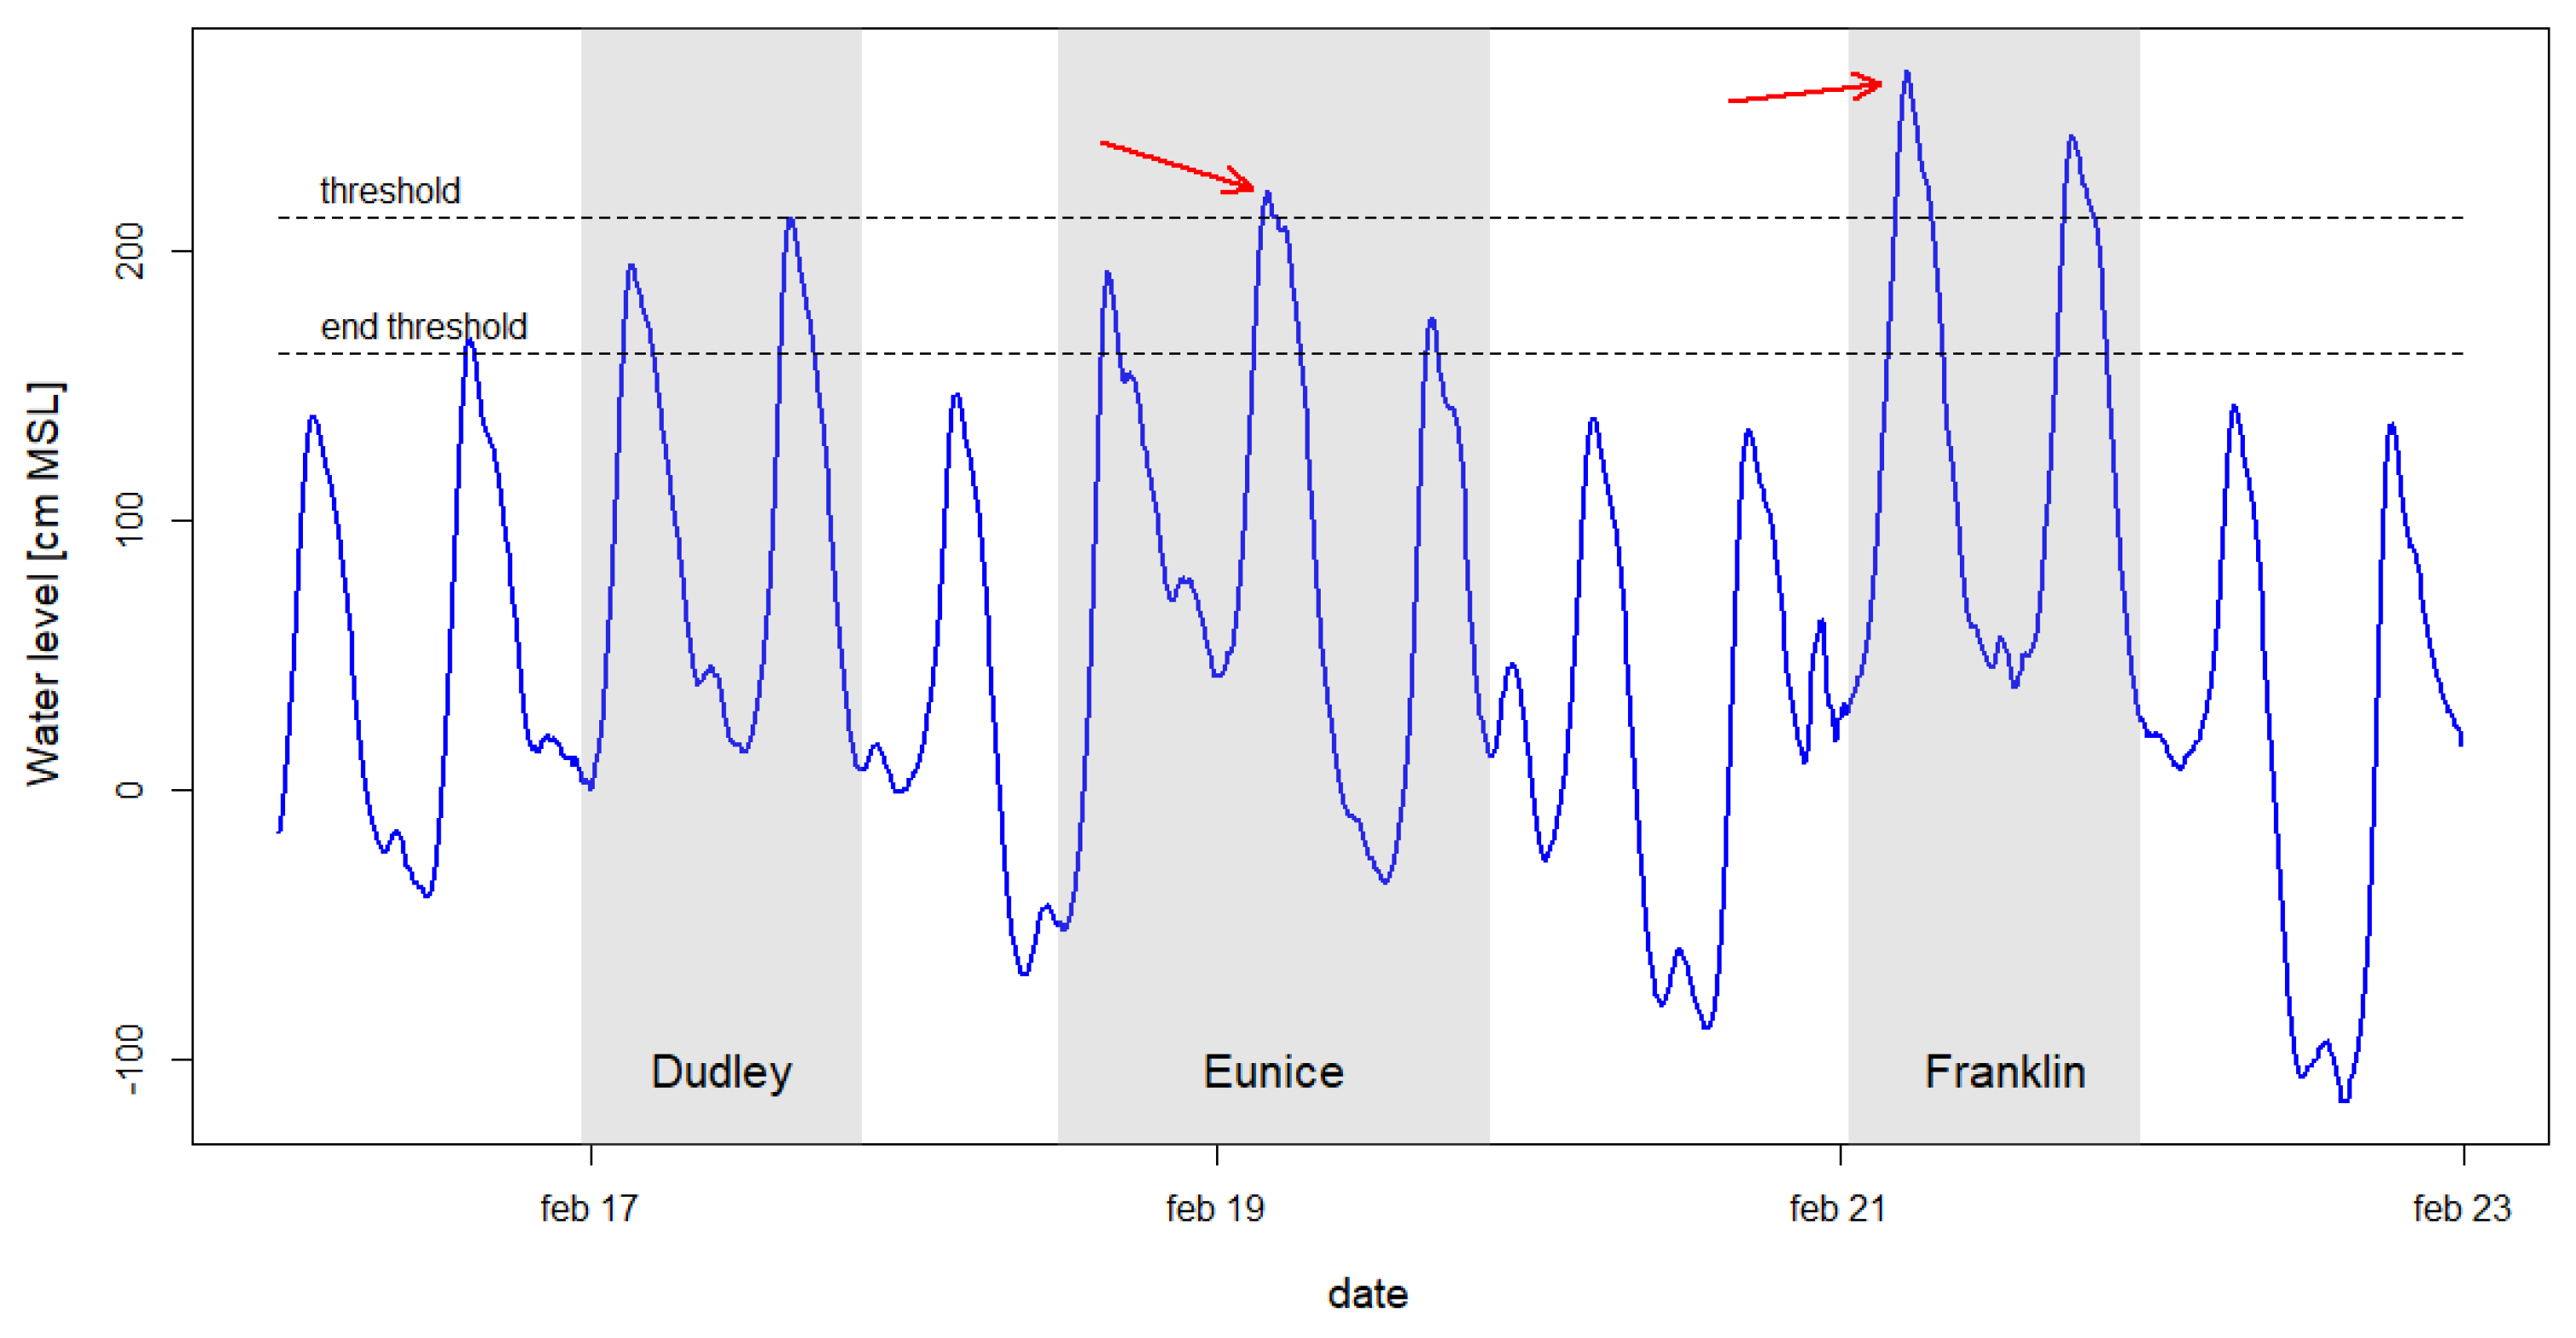
Figure 4.
Event tree of failure scenarios for the assessment of storm surge barrier performance.
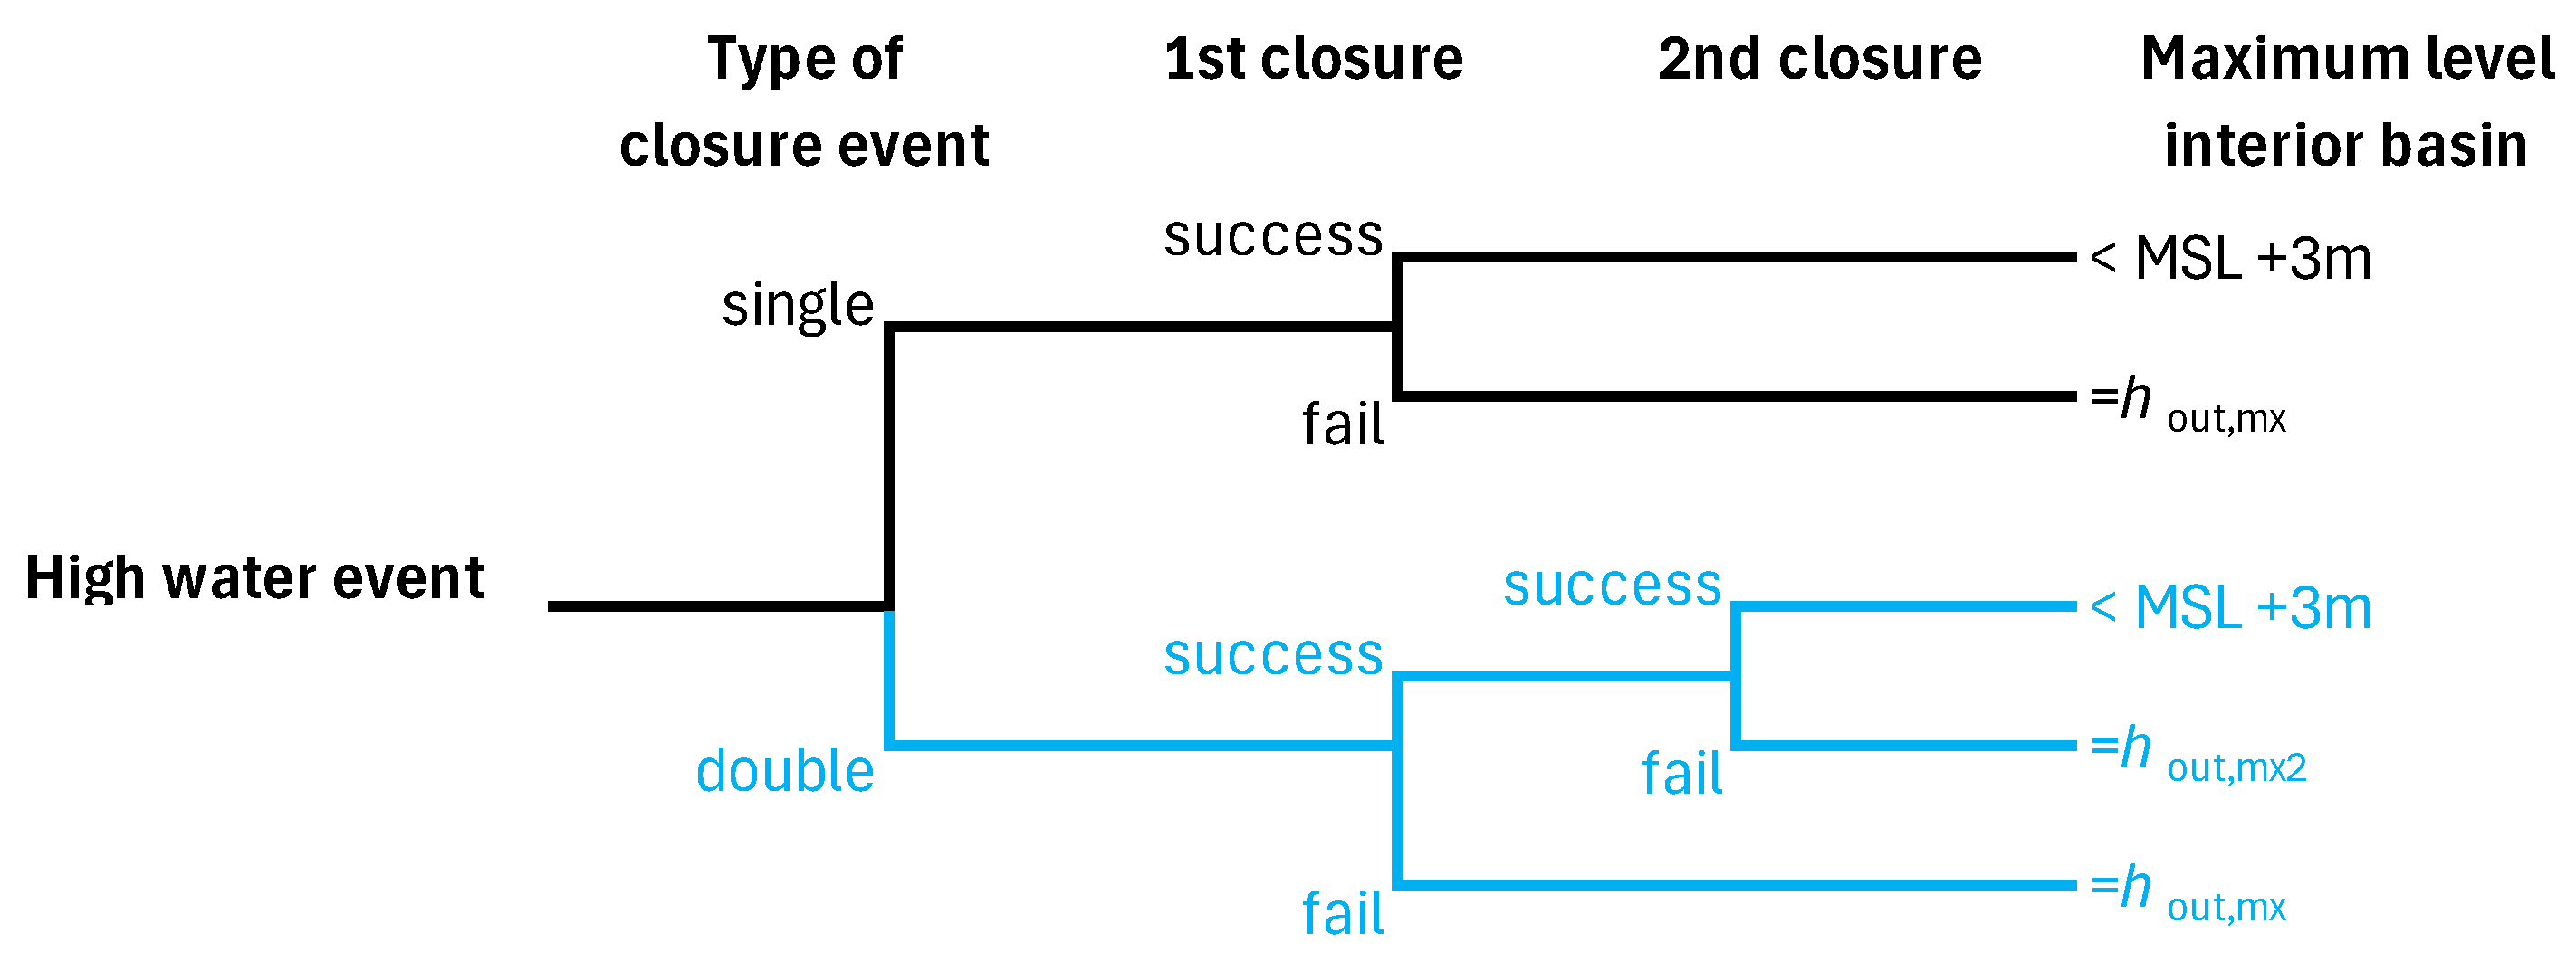
Figure 5.
Conditional exceedance probabilities of sea water level, given either a single or a double closure event.
Figure 5.
Conditional exceedance probabilities of sea water level, given either a single or a double closure event.
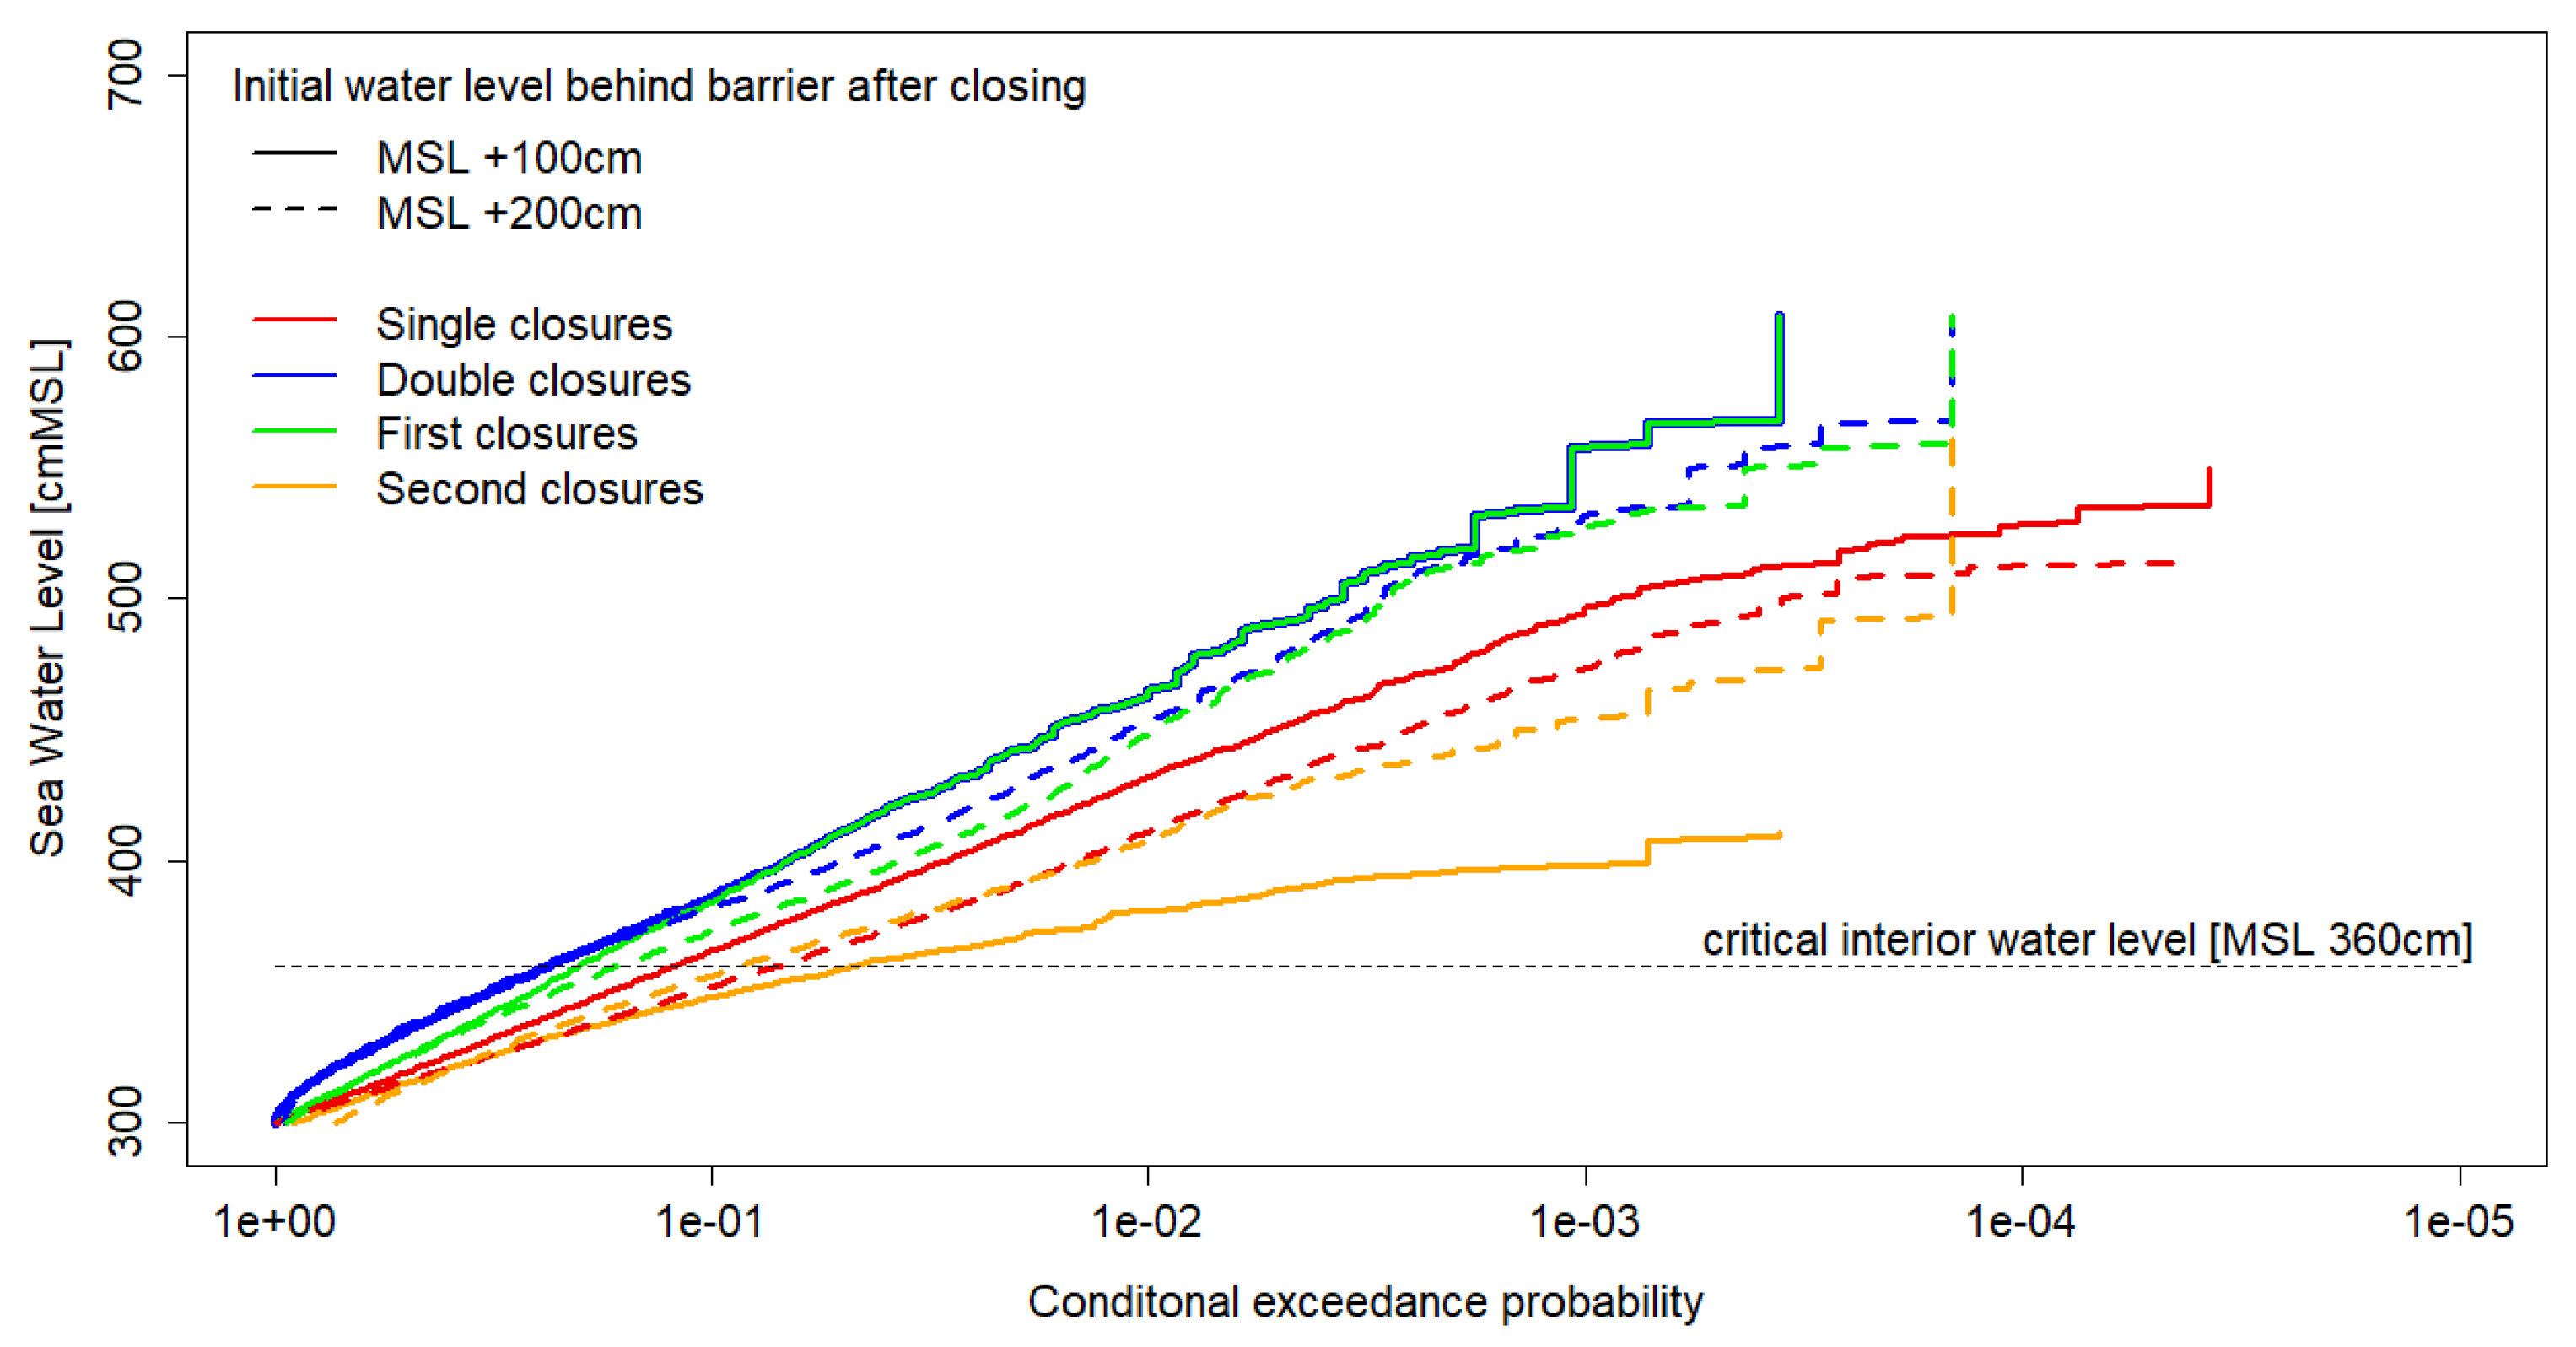
Figure 6.
CDF interarrival times of storm surge events with sea water levels exceeding MSL +212.2cm.
Figure 6.
CDF interarrival times of storm surge events with sea water levels exceeding MSL +212.2cm.
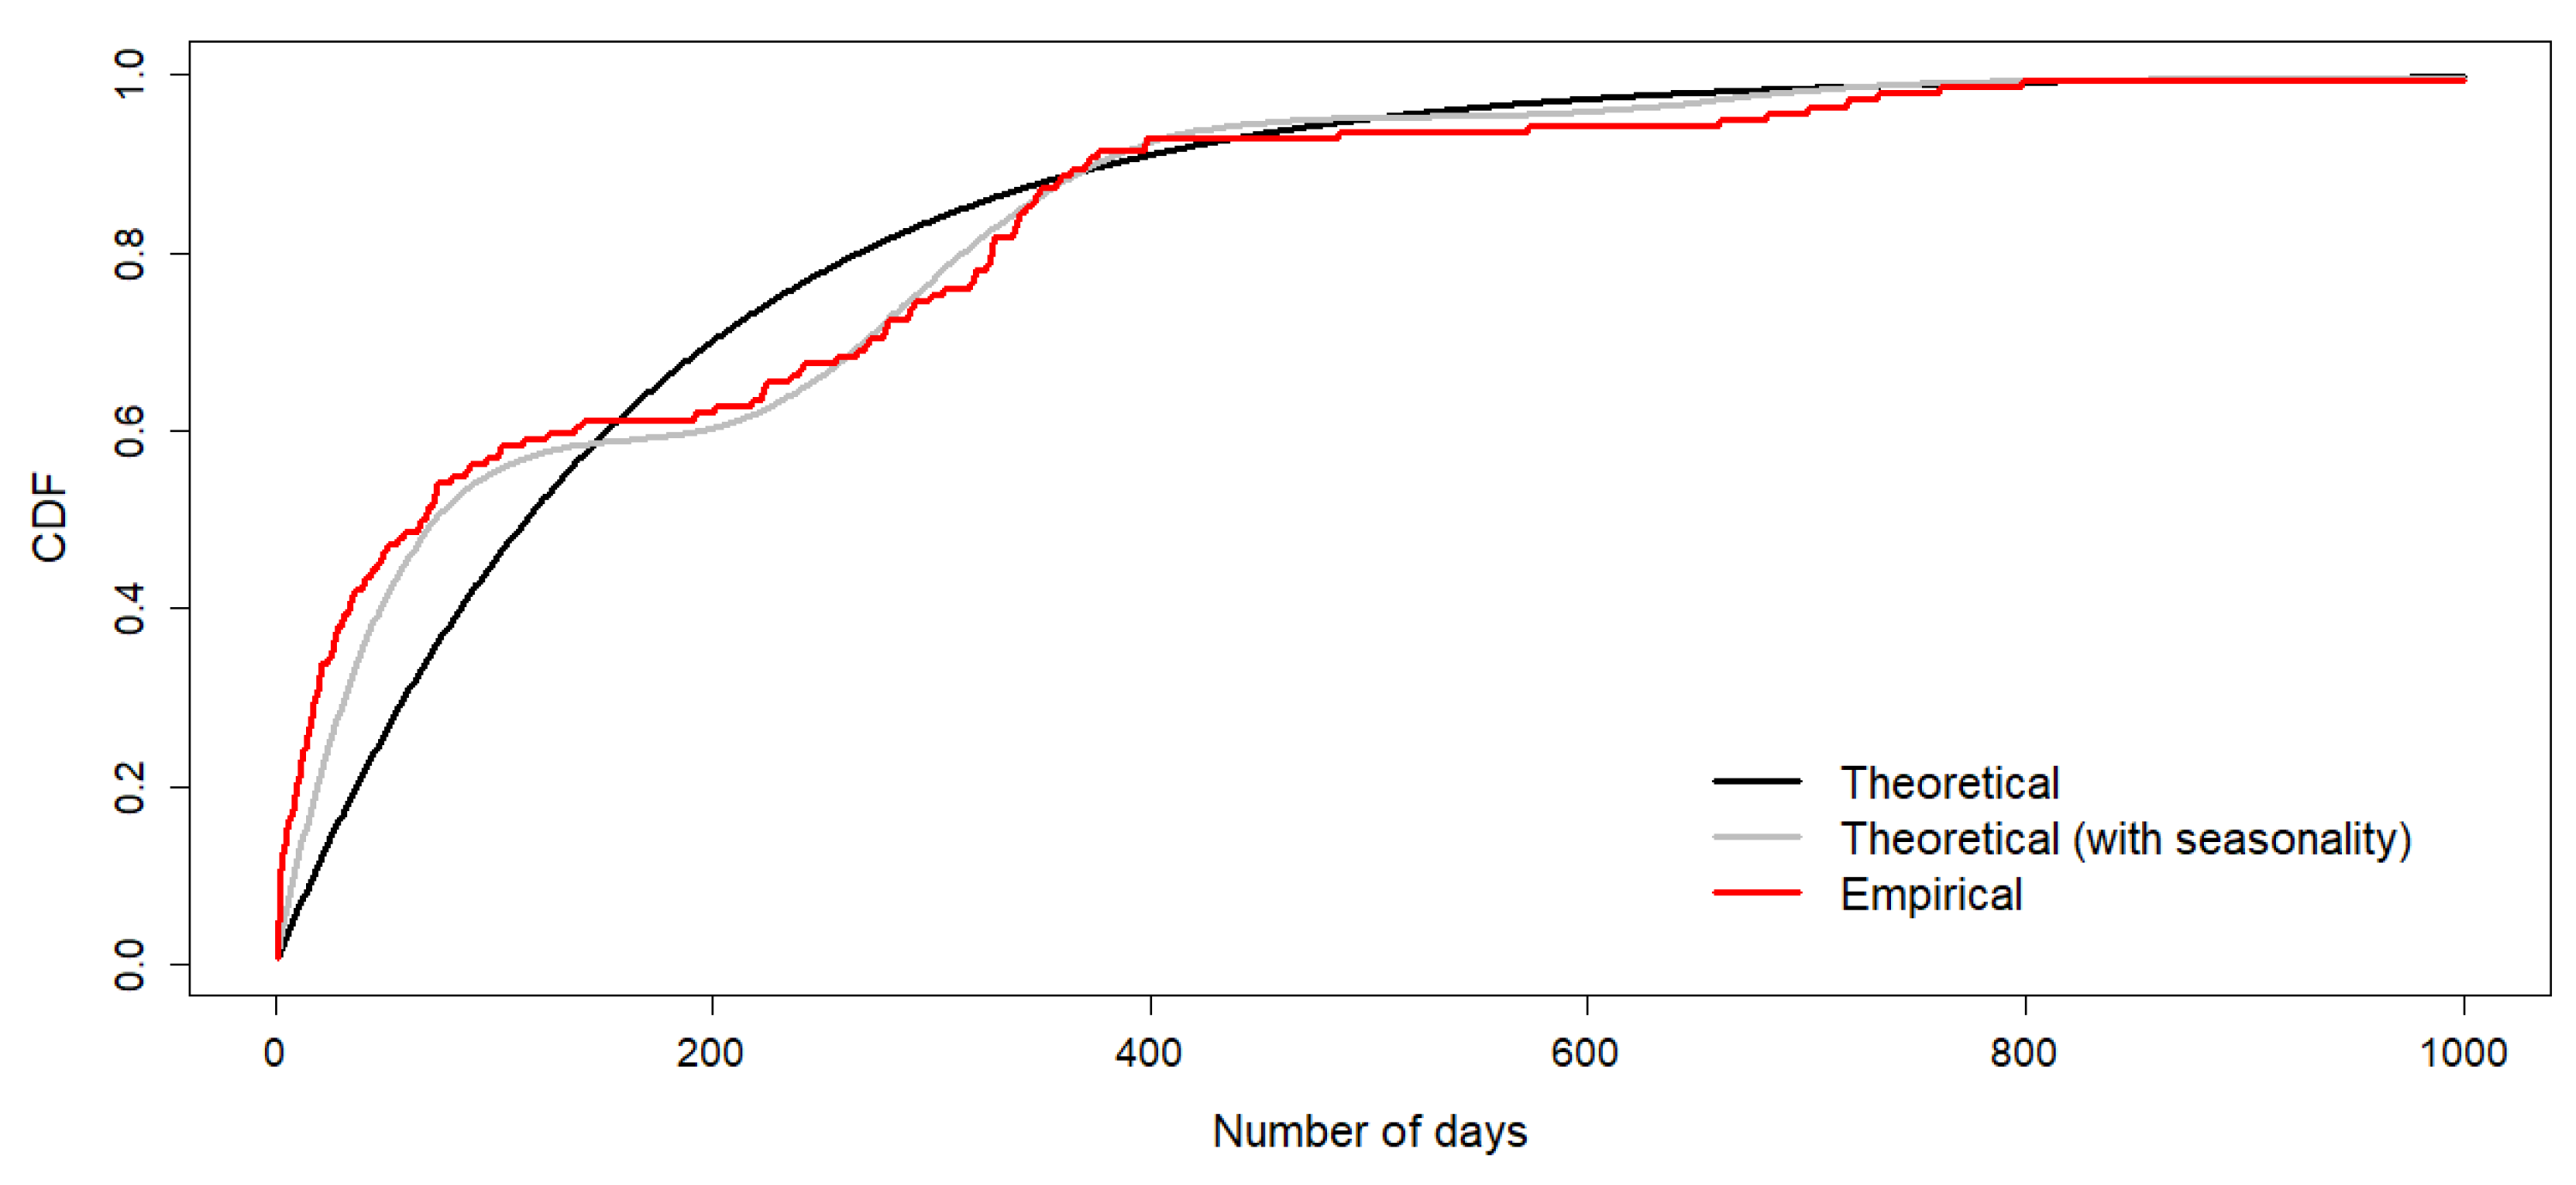
Figure 7.
Return periods of extreme water levels at Hoek van Holland.
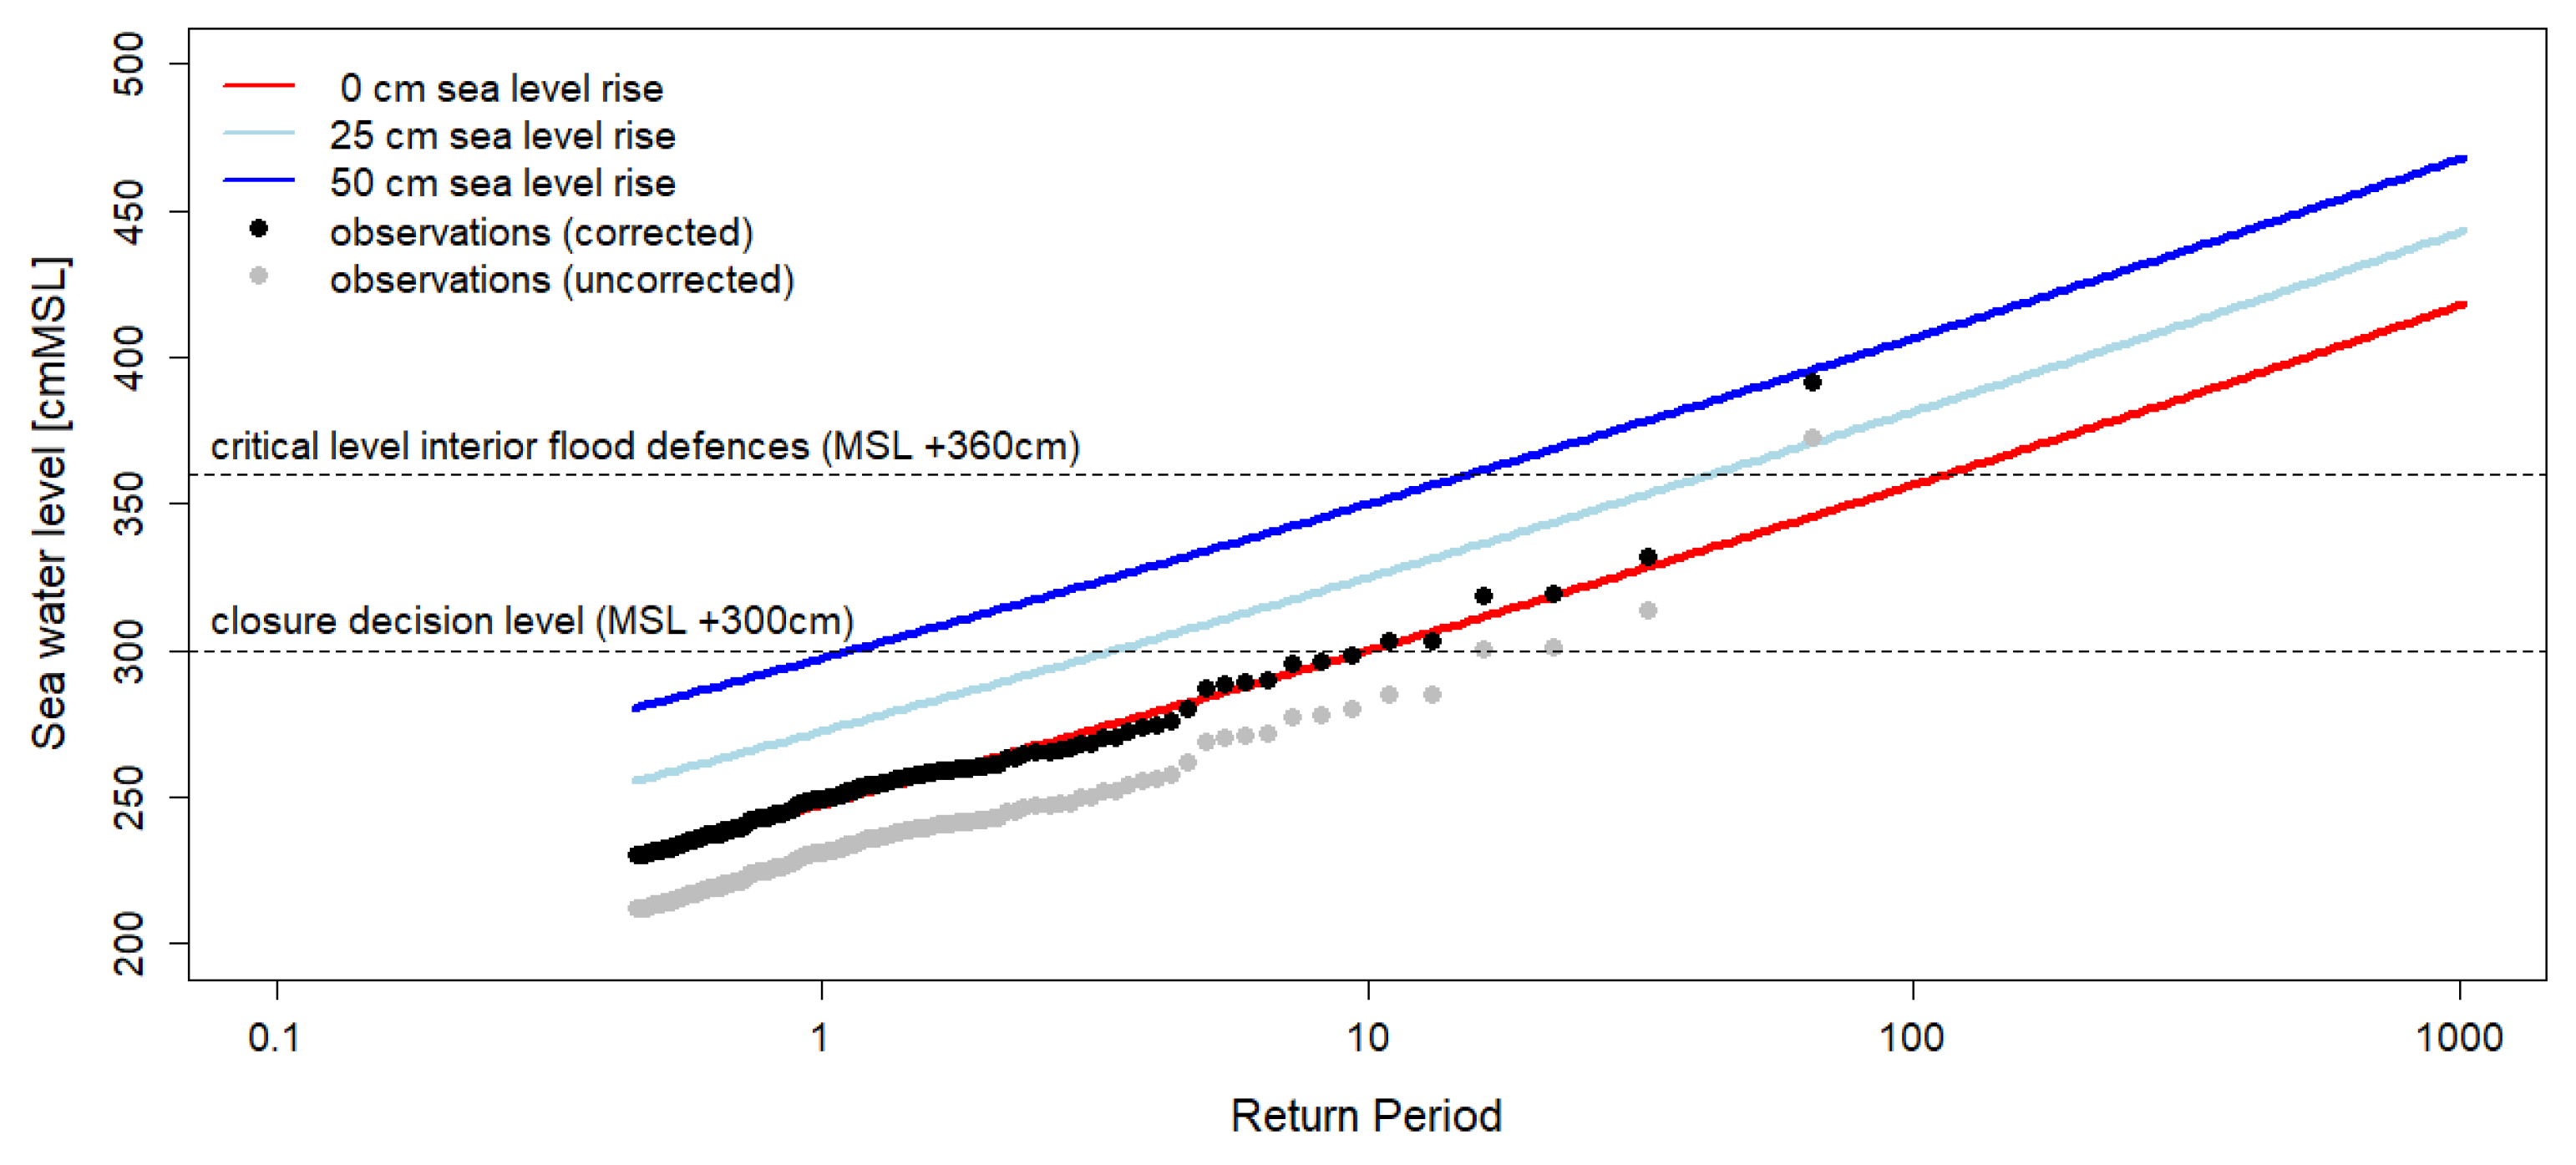
Figure 8.
Return periods of extreme water levels in inner basin behind storm surge barrier for current situation. The continuous lines represent the return periods of the system without storm surge barrier (black), with storm surge barrier with constant failure probability regardless the type of closure event (orange) and with storm surge barriers taking into account multi-peaked storms and storm surge clusters (dark blue). The dashed lines represent the return periods of exceedances of water levels specifically due to a failed closure during a single closure event (green), specifically due to a failed first closure during a double closure event (turquoise) and specifically due to a failed second closure during a double closure event (light blue).
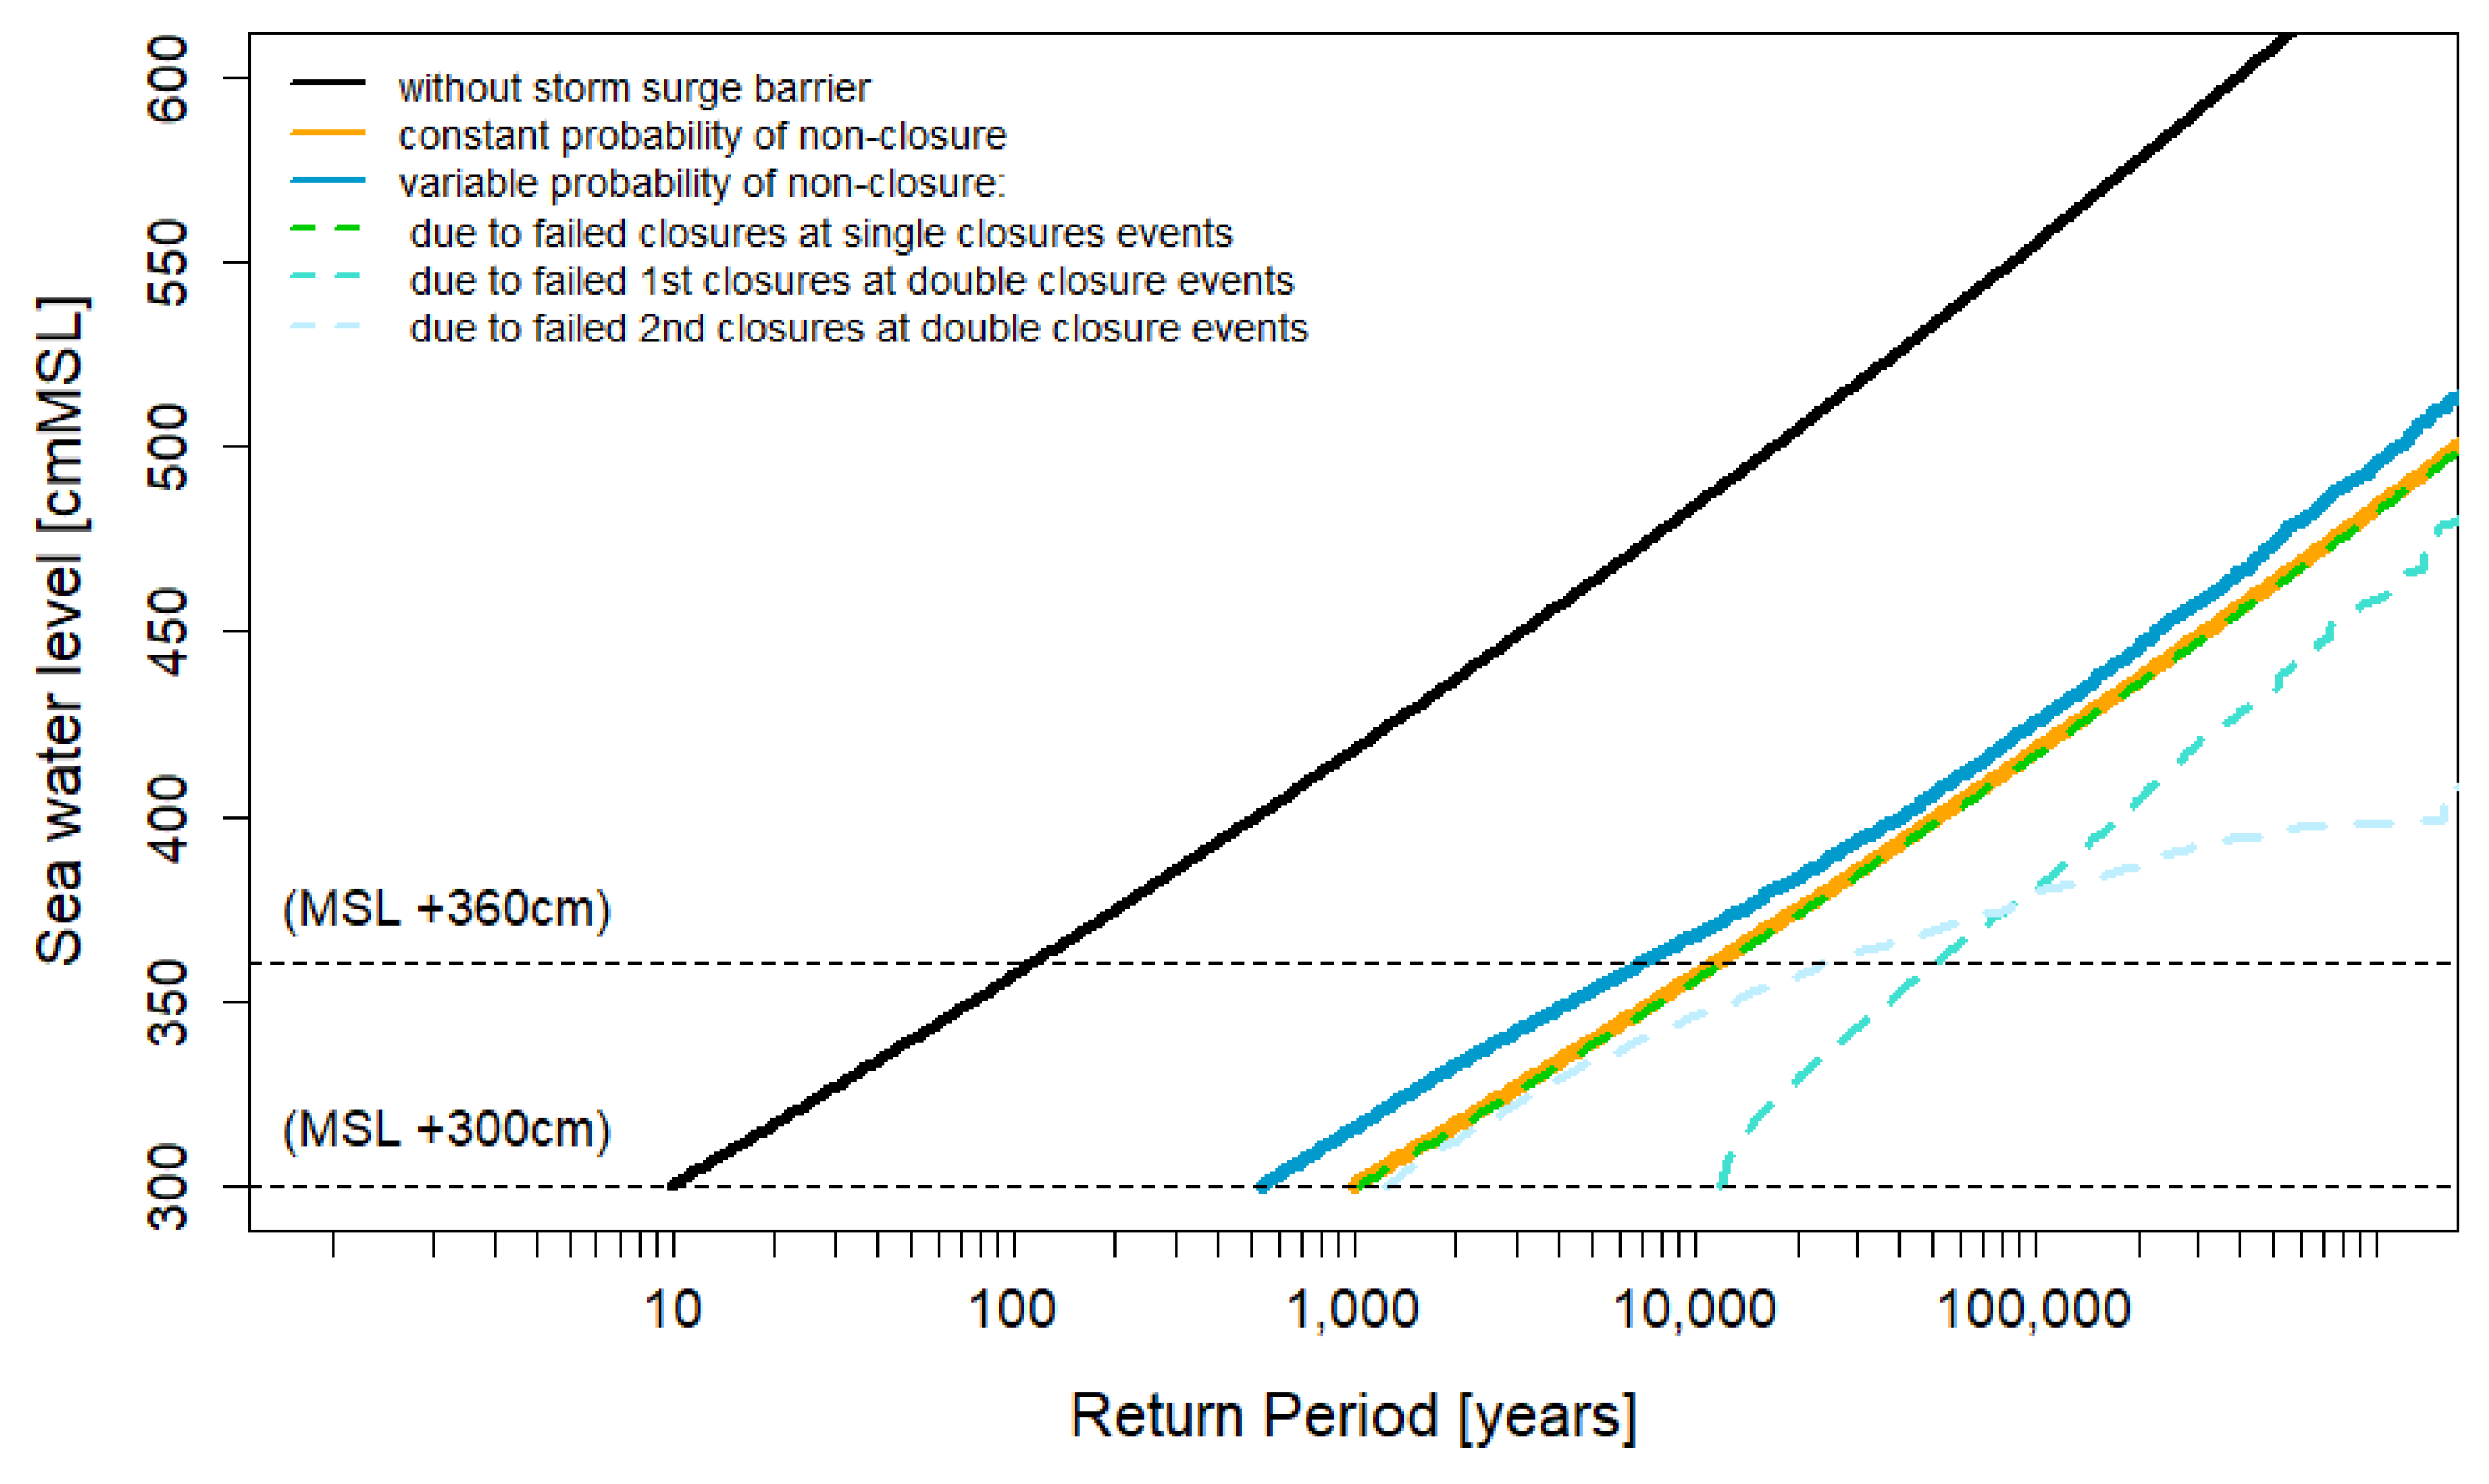
Figure 9.
Return periods of extreme water levels in inner basin behind storm surge barrier as Figure 8, but for different amounts of sea level rise (left column, no sea level rise; right column, 50cm sea level rise) and initial inner water level hin (top row, MSL +100cm; second row, MSL +150cm; lower row, MSL +200cm).
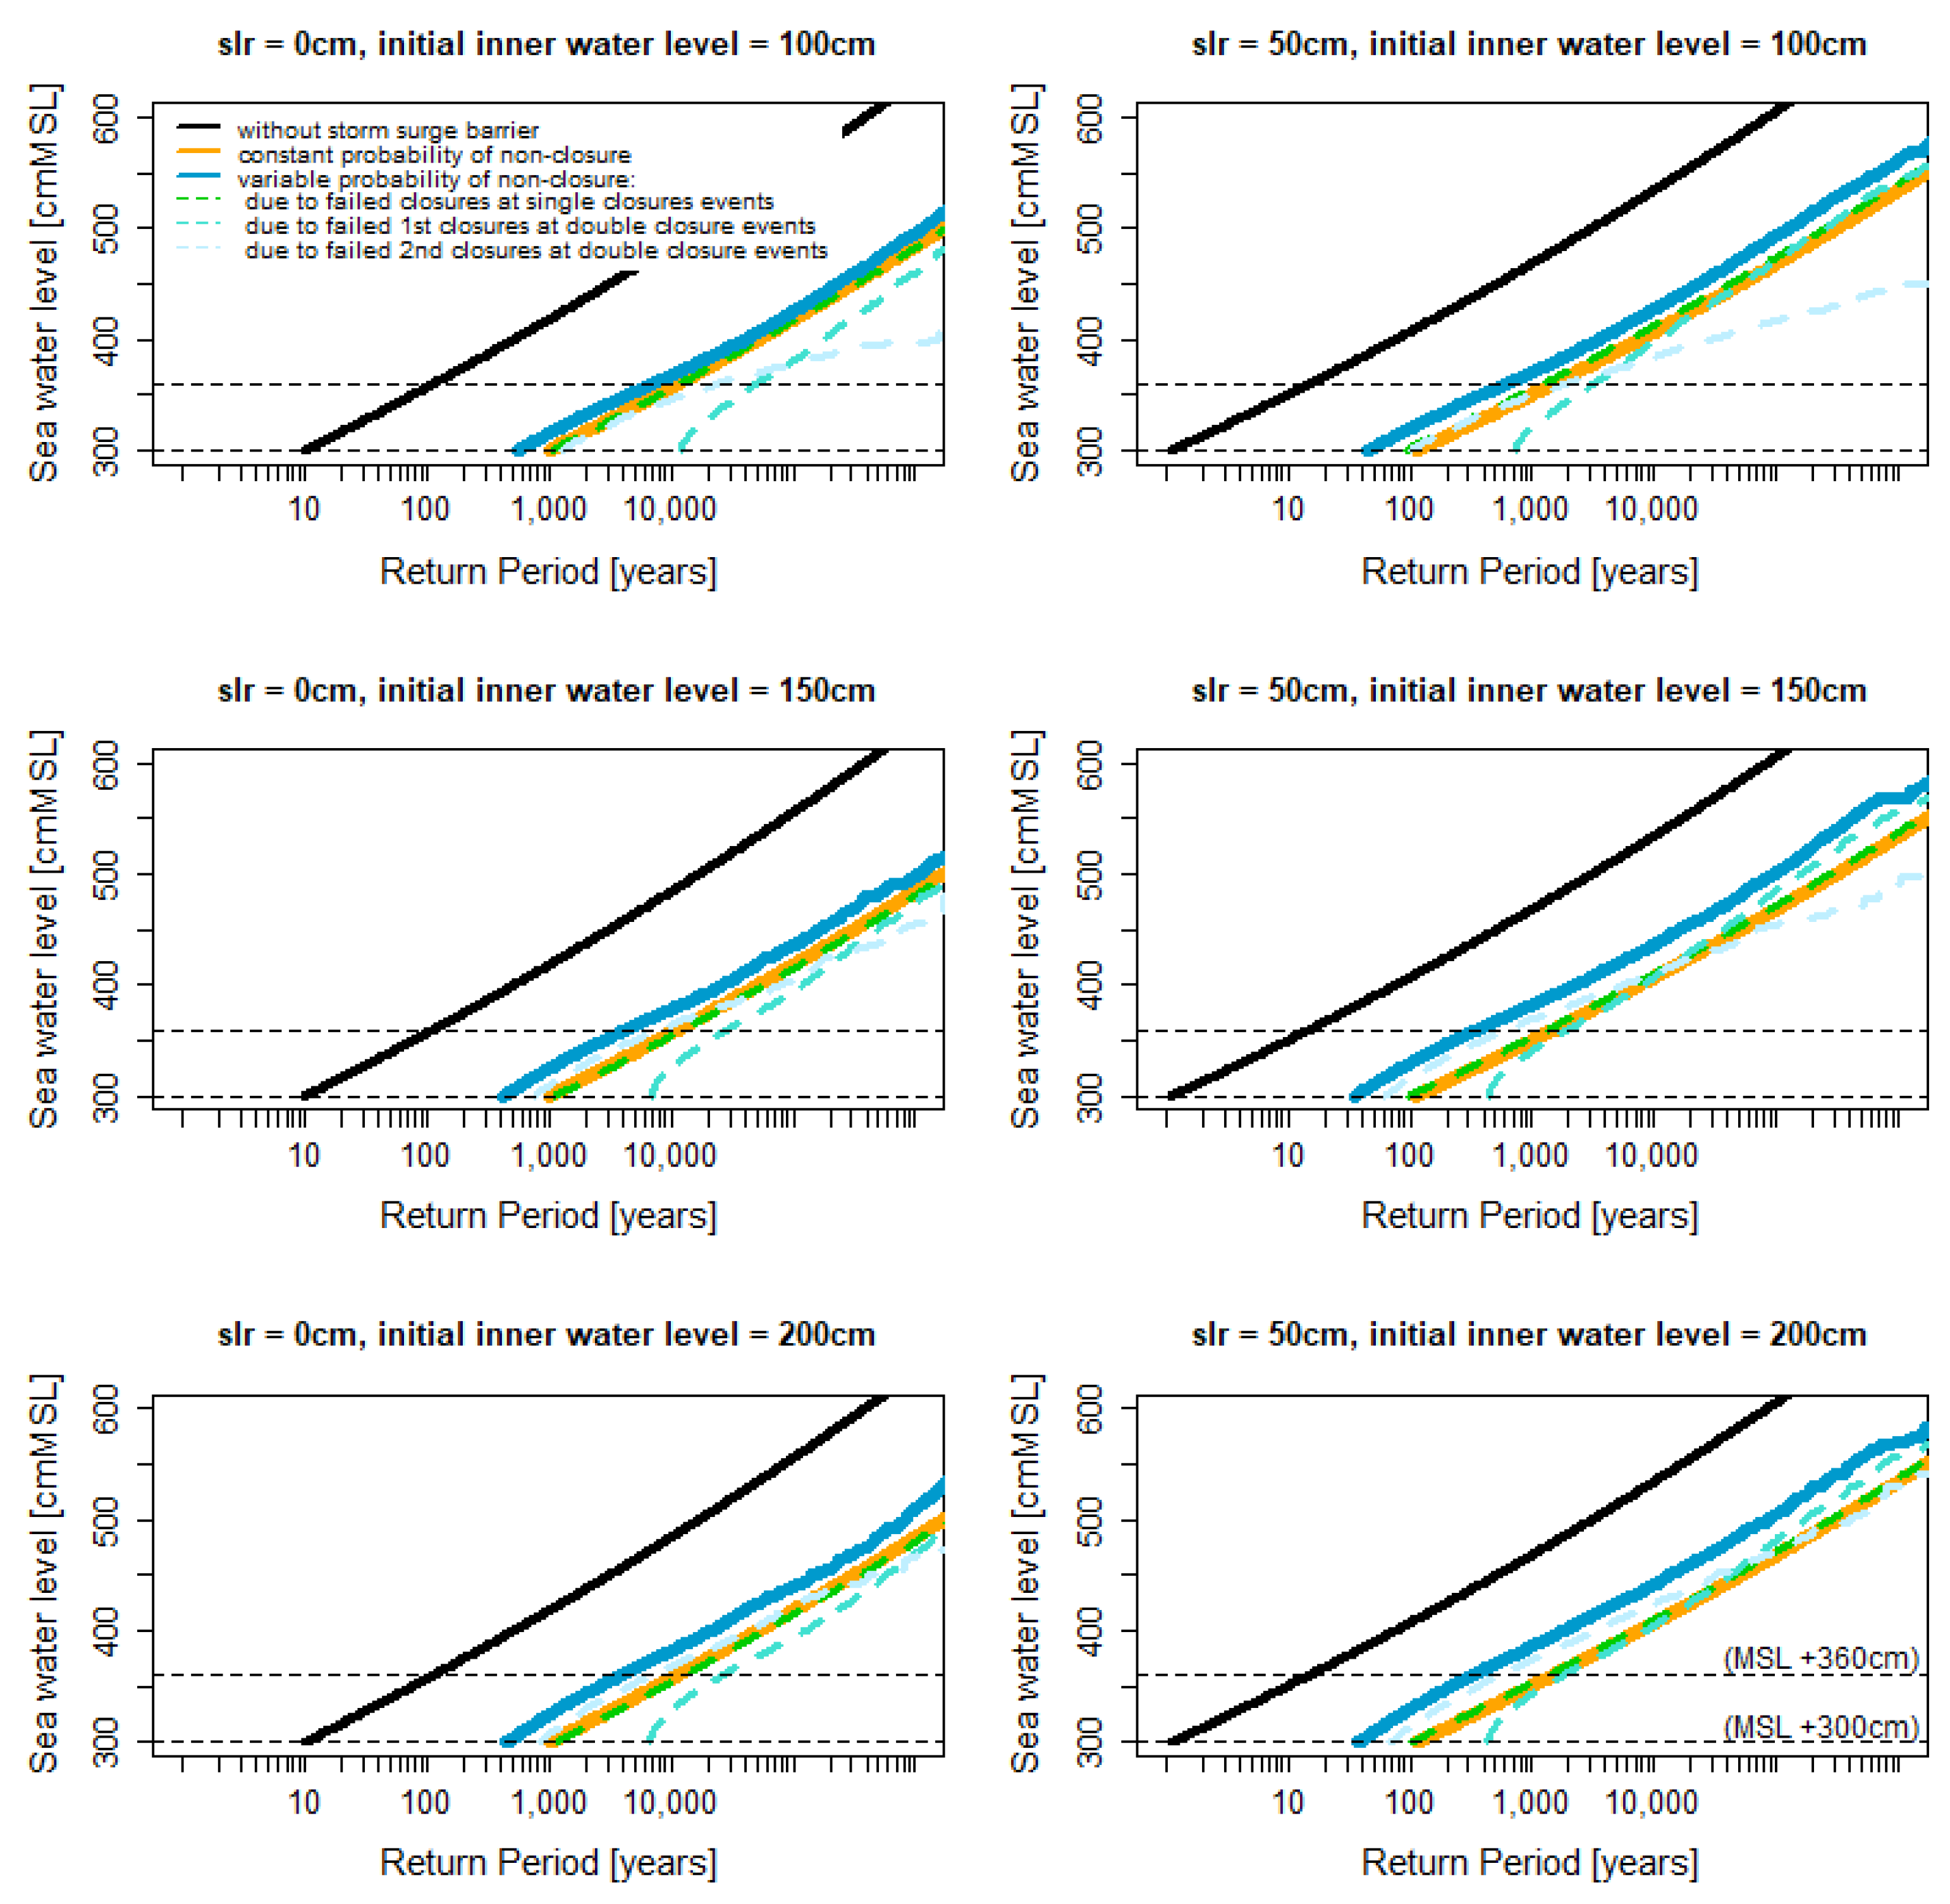

Table 1.
Relative share of total number of surges per month.
| Month | Jan | Feb | Mar | Apr | May | Jun | Jul | Aug | Sep | Oct | Nov | Dec |
|---|---|---|---|---|---|---|---|---|---|---|---|---|
| Share | 0.257 | 0.132 | 0.074 | 0.037 | 0.000 | 0.007 | 0.015 | 0.000 | 0.015 | 0.066 | 0.191 | 0.213 |
Table 2.
Discrete distribution of phase difference φ = tsurge,mx - ttide,mx [hours].
| φ | -6 | -5 | -4 | -3 | -2 | -1 | 0 | 1 | 2 | 3 | 4 | 5 | 6 |
| P | 0.007 | 0.027 | 0.055 | 0.096 | 0.103 | 0.171 | 0.034 | 0.041 | 0.034 | 0.055 | 0.123 | 0.164 | 0.089 |
Table 3.
Failure scenarios for assessment storm surge barrier performance derived from Figure 4.
Table 3.
Failure scenarios for assessment storm surge barrier performance derived from Figure 4.
| Scenario | Event | Failure | ||
|---|---|---|---|---|
| 1 | Single closure storm | (SS) | Failed closure | (fc1) |
| 2 | Double closure storm | (DS) | Failed 1st closure | (fc1) |
| 3 | Double closure storm | (DS) | Failed 2nd closure | (fc2) |
Table 4.
Probability of closed failure as function of available repair time.
| Closure | Event | Available repair time | Pfc,default | Pfc,repair | Pfc,total |
|---|---|---|---|---|---|
| Second | DS | < 1 day | 0.01 | 0.1 | 0.11 |
| First | SS/DS | 1 day – 2 days | 0.01 | 0.05 | 0.06 |
| First | SS/DS | 2 days – 1 week | 0.01 | 0.025 | 0.035 |
| First | SS/DS | 1 week – 1 month | 0.01 | 0.01 | 0.02 |
| First | SS/DS | > 1 month | 0.01 | - | 0.01 |
Table 5.
Number of closure events per year simulated in 524,000 Monte Carlo experiments for different initial average inner water levels directly after closing, for current sea water level and with 25cm and 50cm sea level rise (SLR) and without bias correction.
Table 5.
Number of closure events per year simulated in 524,000 Monte Carlo experiments for different initial average inner water levels directly after closing, for current sea water level and with 25cm and 50cm sea level rise (SLR) and without bias correction.
| SLR | hin | Number of closure events per year | Proportion | |||
|---|---|---|---|---|---|---|
| [cm] | [cmMSL] | Total | Single | Double | Triple | double closures |
| 0 | 100 | 0.29 | 0.27 | 0.02 | 0.004 | 8% |
| 0 | 125 | 0.29 | 0.25 | 0.03 | 0.007 | 12% |
| 0 | 150 | 0.29 | 0.24 | 0.04 | 0.01 | 14% |
| 0 | 200 | 0.29 | 0.22 | 0.04 | 0.02 | 15% |
| 25 | 100 | 0.68 | 0.60 | 0.06 | 0.002 | 9% |
| 25 | 125 | 0.68 | 0.56 | 0.09 | 0.01 | 13% |
| 25 | 150 | 0.68 | 0.53 | 0.11 | 0.02 | 16% |
| 25 | 200 | 0.68 | 0.50 | 0.12 | 0.06 | 17% |
| 50 | 100 | 1.55 | 1.34 | 0.17 | 0.04 | 11% |
| 50 | 125 | 1.55 | 1.25 | 0.24 | 0.06 | 16% |
| 50 | 150 | 1.55 | 1.17 | 0.29 | 0.09 | 19% |
| 50 | 200 | 1.55 | 1.09 | 0.30 | 0.16 | 19% |
Table 6.
Closure frequency and probability of second closure within certain time intervals.
| Sea level rise | 0cm | 25cm | 50cm |
|---|---|---|---|
| Closure frequency | 0.10 | 0.29 | 0.89 |
| Probability of next closure in time interval: | |||
| 0.004 | 0.012 | 0.038 | |
| 0.005 | 0.012 | 0.034 | |
| 0.014 | 0.041 | 0.113 | |
| 0.978 | 0.936 | 0.816 |
Table 7.
Probability of non-closure per request and exceedance frequency of inner water levels for different combinations of sea level rise and initial inner water level hin.
Table 7.
Probability of non-closure per request and exceedance frequency of inner water levels for different combinations of sea level rise and initial inner water level hin.
| SLR | hin | Probability of Failure | Return Periods [years] | |||
|---|---|---|---|---|---|---|
| [cm] | [cmMSL] | 1st closure | 2nd closure | 300cm | 360cm | 400cm |
| 0 | 100 | 0.0104 | 0.110 | 540 | 6,900 | 41,000 |
| 0 | 125 | 460 | 5,400 | 35,000 | ||
| 0 | 150 | 420 | 4,300 | 27,000 | ||
| 0 | 200 | 450 | 3,900 | 21,000 | ||
| 25 | 100 | 0.0114 | 160 | 2,100 | 12,000 | |
| 25 | 125 | 140 | 1,600 | 10,000 | ||
| 25 | 150 | 130 | 1,200 | 7,900 | ||
| 25 | 200 | 130 | 1,100 | 6,300 | ||
| 50 | 100 | 0.138 | 45 | 610 | 3,500 | |
| 50 | 125 | 38 | 450 | 2,900 | ||
| 50 | 150 | 35 | 350 | 2,200 | ||
| 50 | 200 | 37 | 320 | 1,800 | ||
Disclaimer/Publisher’s Note: The statements, opinions and data contained in all publications are solely those of the individual author(s) and contributor(s) and not of MDPI and/or the editor(s). MDPI and/or the editor(s) disclaim responsibility for any injury to people or property resulting from any ideas, methods, instructions or products referred to in the content. |
© 2024 by the authors. Licensee MDPI, Basel, Switzerland. This article is an open access article distributed under the terms and conditions of the Creative Commons Attribution (CC BY) license (https://creativecommons.org/licenses/by/4.0/).
Copyright: This open access article is published under a Creative Commons CC BY 4.0 license, which permit the free download, distribution, and reuse, provided that the author and preprint are cited in any reuse.


