1. Introduction
Most of the current approaches to cancer research and preclinical drug testing relies on 2D monolayer cell cultures, but there is a growing understanding that the other models are needed to more accurately replicate actual response of cells within the organism, including different markers’ expression and response to drugs [
1]. 3D cell models were developed to mimic the structural and functional complexity of in vivo tissues. Since the information acquired from 2D monolayer culture is still a cornerstone for the research, it is necessary to establish if there are differences in expression of crucial markers between 2D conditions and more advanced 3D models.
There are different types of 3D cell culture, ranging from floating spheroids that rely on the self-aggregation of cells in a scaffold-free conditions to different types of scaffold-based spheroids, including cells cultured in specific hydrogels on standard plates or specialized 3D culture platforms [
2,
3]. Bioprinted 3D models (especially multicellular) seem to be the closest approximation of the real tumor [
4]. It was reported that in 3D conditions the expression of stem cell markers is higher [
5,
6], including the research in MCF7 cell line [
7], however that effect might be caused not by the induction of their expression, but by the selection of stem-cell phenotypes during spheroid formation. Epithelial-mesenchymal transition (EMT) markers were also reported to change between 2D and 3D conditions [
5,
8,
9]. These differences can be crucial for cancer progression and metastasis, and need to be clarified. Results presented here have confirmed higher expression of stem-cell markers in 3D conditions, but the expression of epithelial marker E-cadherin displayed intriguing variability depending on the 3D model. Since there is an obvious difference in mechanical stress imposed on cells forming free-floating spheroids and cells in a culture on a scaffold, we addressed this difference by creating a mathematical model of the bioprinted culture. This model was used to compare stress fields generated in relation to ECM stiffness (different Young’s modulus, mimicking different 3D systems), to substantiate our interpretation that differences in mechanical stress on cell-cell junctions imposed by growth conditions translate into observed high plasticity of E-cadherin expression.
2. Materials and Methods
2.1. Cell Lines
MCF7 (ATCC), T47D (DSMZ) and MDA-MB-231 (ATCC) cell lines were cultured in DMEM supplemented with 10% fetal bovine serum (Thermo Fisher Scientific) or for 3D culture conditions in 3dGRO Basal Medium (Sigma Aldrich). All cell lines were authenticated by Eurofins Genomics (Germany).
2.2. Spheroid Culture
Cell suspensions were prepared by filtering trypsin-detached cells through 40 m Cell Strainer (Sigma Aldrich) and 8x10⁴ cells were seeded into ultra-low attachment (ULA) X-well round-bottomed plates (Corning, USA) in 2 ml of 3dGRO Basal Medium (Sigma Aldrich) and cultured for 7 or 14 days, with medium supplementation in every 2 days.
2.3. Matrigel Culture
Liquid Matrigel was defrosted on ice, pipetted into 6-well plate (616 l per well) and incubated 30 min. to solidify. Cells were filtered through Nylon, Blue Cell Strainer, pore size 40μm (Sigma Aldrich) to disperse clumps and seeded at a density of 48000 per well in 2 ml 3dGRO Basal Medium (Sigma Aldrich) containing 2% Matrigel. Cells were cultured 1 to 2 weeks, medium was replaced every 48-72h. Cells were collected by trypsinization (30 min), washed with cold PBS and analyzed.
2.4. Immunofluorescence
Cells from 3D spheroid culture were harvested in the 7th day of the culture for staining and 2D cultured cells were harvested at the same time-points at the confluency ~80%. The cells were fixed using 4% PFA for 15 minutes. The permeabilization was done with permeabilization buffer: 1xPBS, 1%BSA, 0,2% Triton-X for 20minutes. Cells were incubated with primary antibodies overnight, washed 5 times with 1xPBS and secondary antibodies were added. The staining incubation was done in the 4oC for 2 hours. Then, cells were washed 5 times with 1xPBS, suspended in the ddH2O and smeared on the microscopic glass and mounted. Imagining was done using Zeiss Axio observer Z1 LSM 800 confocal microscope. Primary antibodies: E-cadherin,Vimentin (CellSignaling), SOX2-DyLight550, OCT-4-AlexaFluor488 (ThermoFisher), secondary antibodies: Anti-Mouse IgG-AlexaFluor488, Anti-Mouse IgG-AlexaFluor488 (ThermoFisher), Anti-Mouse IgG-AlexaFluor488, Anti-Rabbit IgG-HRP (Abcam), dyes: DAPI (4',6-Diamidino-2-Phenylindole, Dihydrochloride) (ThermoFisher), calcein, Hoechst 33342 (Sigma-Aldrich).
2.5. qPCR
Quantitative PCR was performed as described [
10]. Briefly, MCF7 and T47D cells were harvested from the indicated conditions and used for total RNA preparation (PureLink RNA mini kit; ThermoFisher Scientific), followed by the treatment with recombinant DNase I (Roche). 1 g of the obtained RNA was used for cDNA synthesis using Superscript III (ThermoFisher Scientific). cDNA was quantified by quantitative PCR on an ABI Prism 7500 real-time PCR system using TaqMan Gene Expression Assays (ThermoFisher Scientific, SOX2, Hs04234836_s1, POU5F1, Hs00999632_g1, GAPDH, Hs02786624_g1). The CT method was used for calculating mRNA expression levels.
2.6. Western Blot
Cells were harvested and lysed with RIPA (150mM NaCl; 1% NP.-40; 50mM Tris pH 8,0; 0,1% SDS; 0,5% sodium deoxycholate) buffer with proteinase inhibitors. Protein concentration was measured using Bradford Assay Reagent (ThermoFisher). 20µg of protein extract was boiled with 5x loading buffer and the proteins were separated on 12% SDS-PAGE and transferred to the PVDF membrane (Merck), previously activated with methanol. The membrane was blocked with the blocking buffer (5%-milk in 1xPBS) for 1h. Primary antibodies were used as listed in table 1 and incubated overnight. The membrane was washed 5 times in TBS-T buffer, incubated with secondary antibodies for 2 hours and then washed again 5 times with TBS-T buffer. Final imaging was done with the use of Mini HD 4 UVITEC system.
2.7. Biofabrication of 3D Breast Cancer Models
The architecture of the bioprinted 3D breast cancer models was designed using SLICER 4.0 3D software. Each 3D model was created with dimensions of 5x5x1 mm. The models were printed using a BIOX bioprinter (Cellink, Sweden) and cultured in vitro. The 3D-MCF-7 model consisted of three layers of the MCF-7 cell line, while the 3D-MDA model also comprised three layers of the MDA cell line. Both cell lines were used at passage 7. Printing was conducted in 24-well plates (Thermofisher, Costar) at a temperature of 22–25°C, using a 22 G nozzle with a thickness of 0.40 mm and 60% rectilinear infill. The pressure ranged from 18-20 kPa. Cell suspensions were mixed with BIOINK hydrogel (Cellink) in a 1:1 ratio and extruded into the desired patterns. All 3D constructs were stabilized by crosslinking with a 50 mM CaCl2 solution for 5-10 minutes. After crosslinking, the DMEM medium was added, and the constructs were cultured under standard conditions. The next day, the medium was replaced with fresh DMEM, and the constructs were incubated under standard culture conditions. Bioprinted constructs were cultured for 8 weeks. 3D models were evaluated morphologically and 5 out of 34 were selected for imaging. Live cells were stained by incubation with calcein (Thermo Fisher Scientific, working solution: 10 μM 2h) and Hoechst 33342 (Thermo Fisher Scientific, 1:1000, 10 min). The imaging was performed using Zeiss LSM800 confocal microscope. Images of 54, 199, 241, 279 and 253 focal planes of the spheroid culture were generated and evaluated for modeling.
2.8. Mathematical Model
2.8.1. Methods
The cells and the extracellular matrix (ECM) were modeled using a finite element method [
11]. The modelling is done with Abaqus program
https://discover.3ds.com (last access 12.12.2024). The geometrical model is prepared using GiD program
https://www.gidsimulation.com (last access 12.12.2024). In the analysis, the nonlinear geometry is taken into account [
12,
13]. This is because of the presence of the prestressing forces in the cytoskeleton [
14,
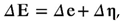
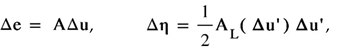
15]. Therefore, the nonlinear part of the strain tensor is included. Since the incremental solution is used in the Abaqus program, the strain increment reads:
where Δe and Δη are the linear and nonlinear parts of the strain increment, respectively. They are of the form:
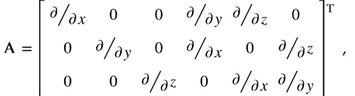
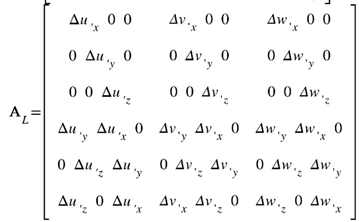
where Δu and ∆u’ are the displacements increment vector and vector of the increment of the displacement derivatives with respect to Cartesian coordinates, respectively. The displacement vector components are (u,v,w). The symbols A, AL stand for the linear and nonlinear operators, respectively, as follows:
The results of the analysis are the displacement and stress fields. In the results section, the displacement fields are shown. In the case of cytoskeleton, the uniaxial stress are presented. Then, the Huber-Mises-Hencky stress is given showing an effort of the material. The HMH stress reads:
where
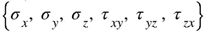
are the elements of the stress tensor describing 3D state of stress.
The solution was performed in the Abaqus program in two steps. The first step concerned the evaluation of the stress state after introducing the prestressing forces in the cytoskeleton. The second step was applied in order to impose the external pressure load.
2.8.2. Geometry
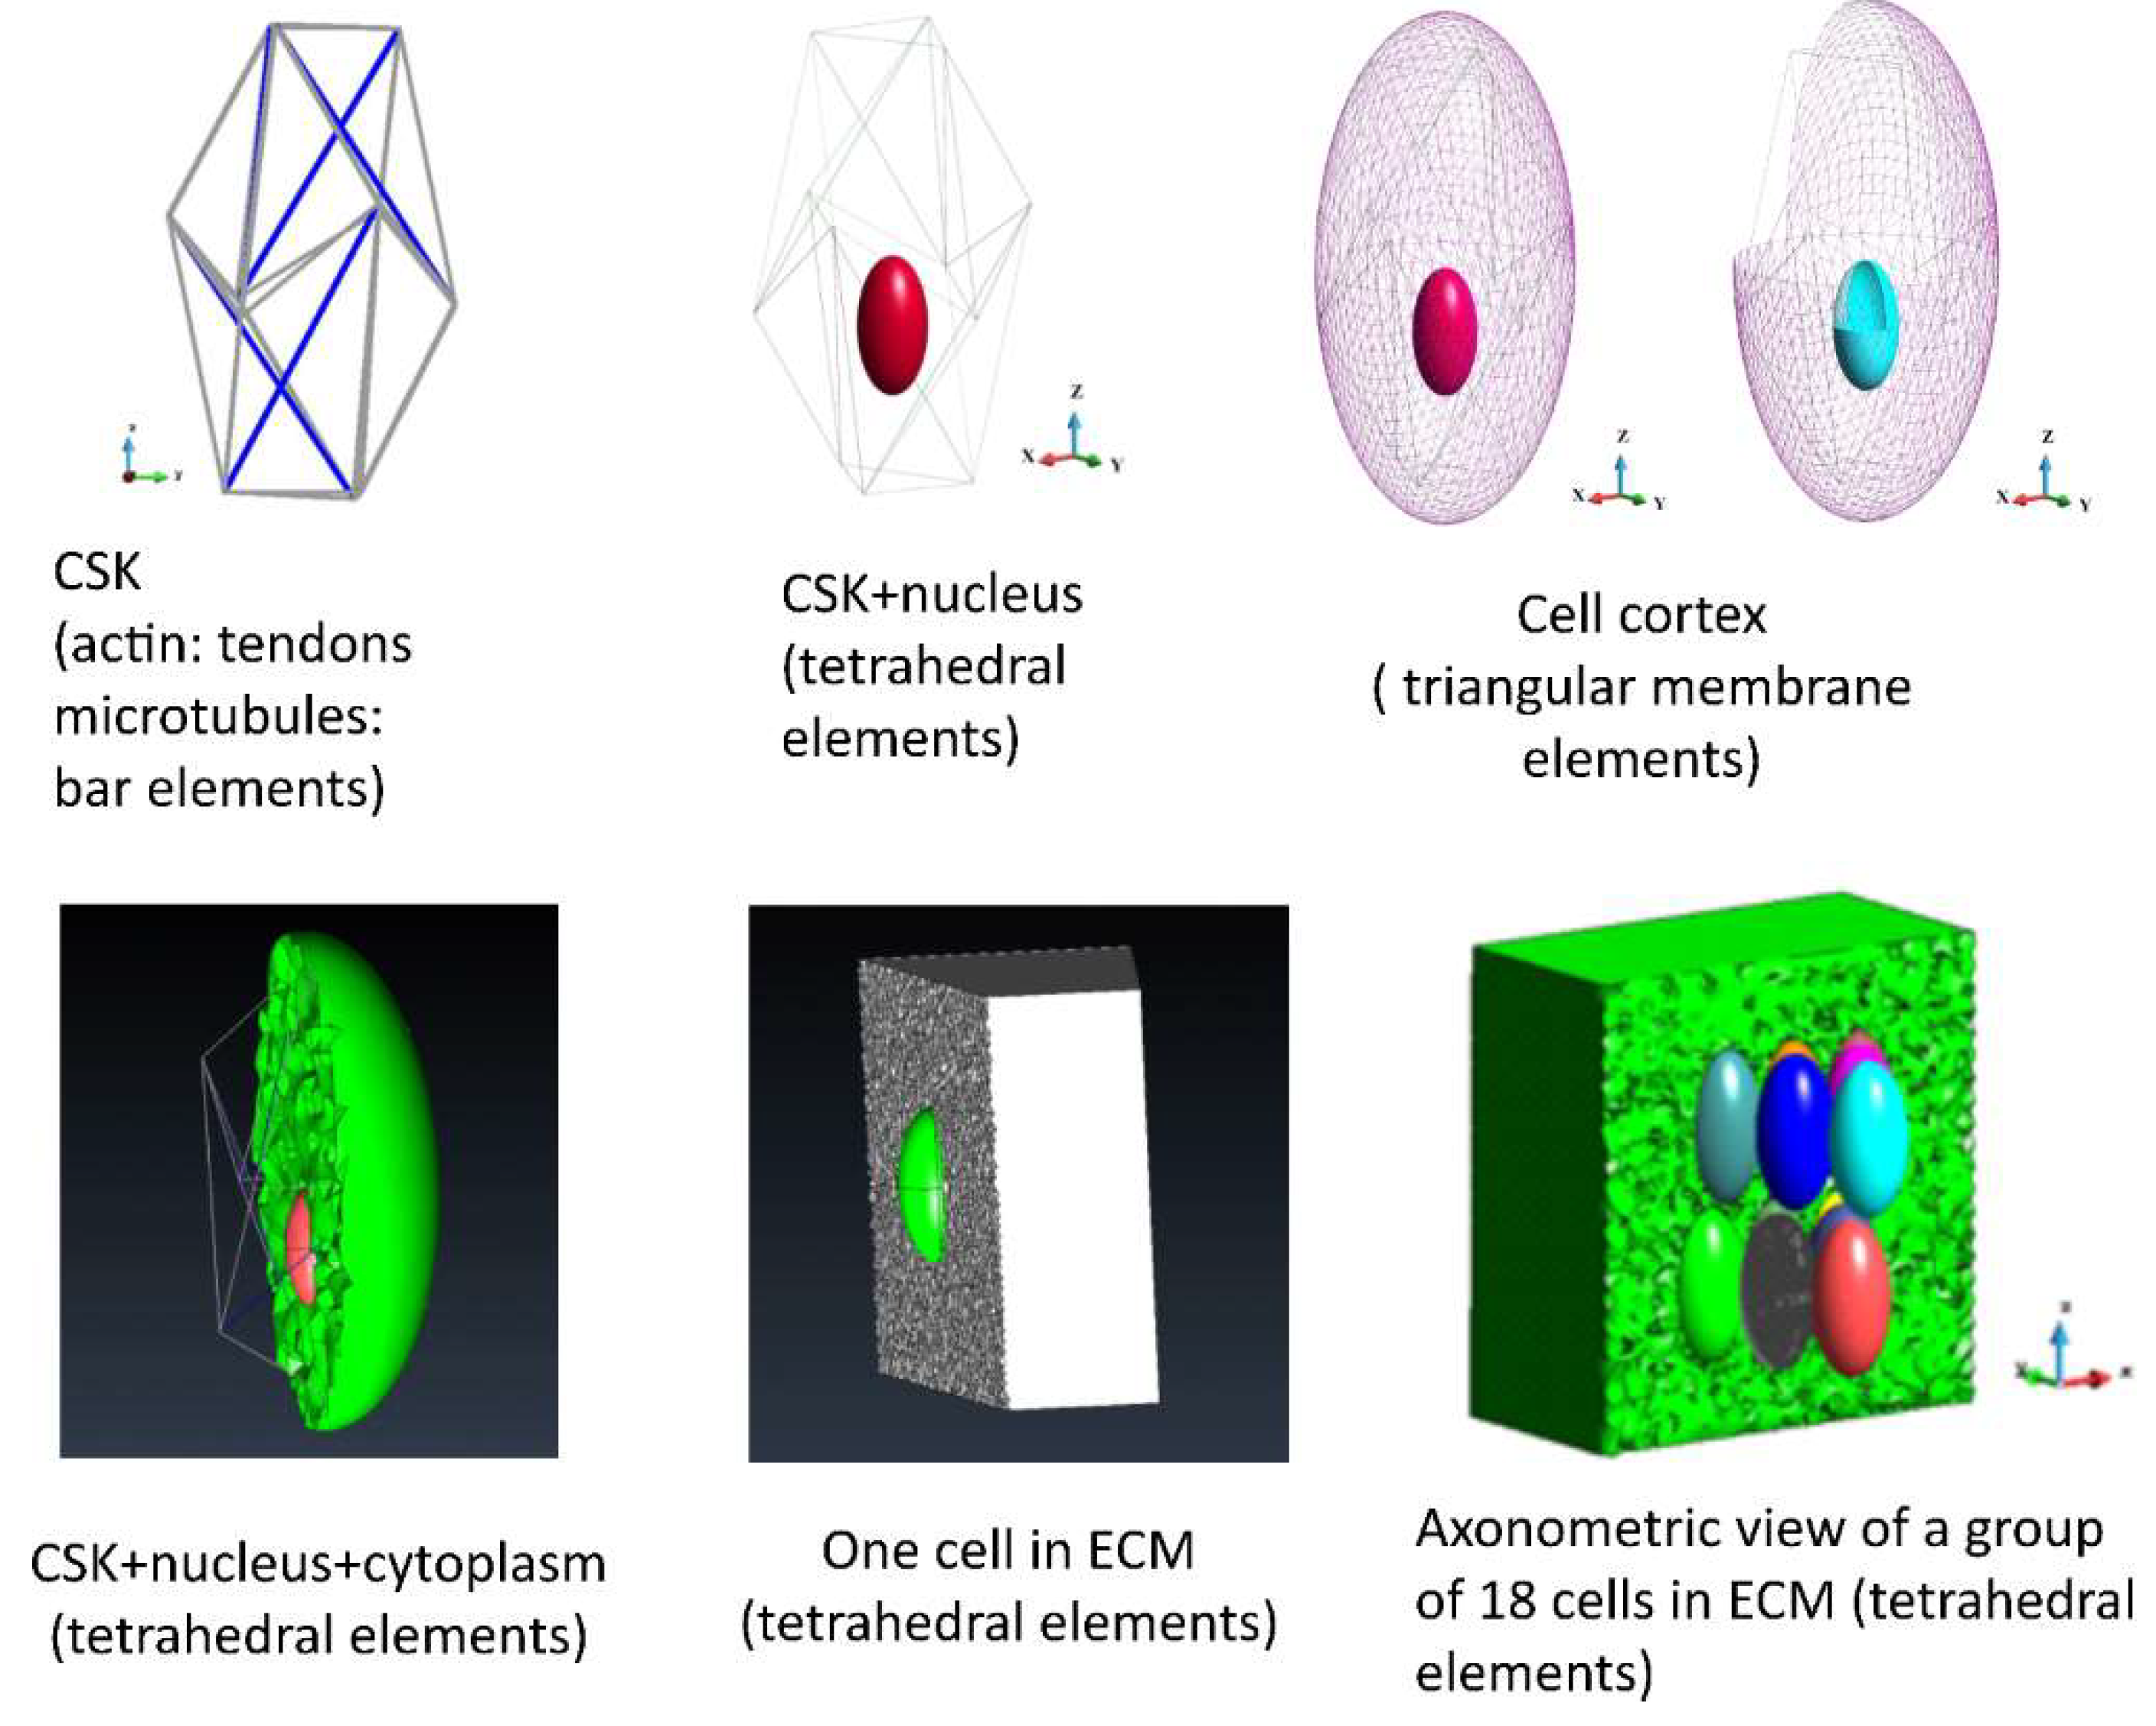
The geometry of the systems is shown in
Figure 1. The cells are embedded in ECM. A simplified model of the environment is adopted; ECM is modelled as an elastic, nearly incompressible medium. ECM for a single cell is discretized with 2,248,103 tetrahedral elements, while ECM for the group of 18 cells is discretized with 2,070,659 tetrahedral elements (
Figure 1, lower panel, right) The upper surface of the ECM box is loaded with an external pressure of 6.0 Pa. The model of the cell consists of nucleus, cytoplasm and cytoskeleton (based on Prendergast, McGarry, [
16]). The current model is extended by employing it into group of cells embedded in the ECM. The cytoplasm is surrounded by a membrane (cortex). The nucleus and the cytoplasm are discretized with tetrahedral finite elements (87,733 and 12,046 elements, respectively). The membranes are modelled using triangular membrane elements (cortex 3236 membranes and nucleus membrane 1792 membranes,
Figure 1, upper panel). The cytoskeleton is considered as a tensegrity structure based on icosahedron. The deformation of icosahedral shape is modelled on the observed actual shape of the cell. Prestressed tendons model the actin, while the bars model the microtubules. The model consists of 6 bars and 24 tendons (
Figure 1, upper panel).
The model of a group of cells embedded in ECM consists of 18 cells (
Figure 1, lower panel). The number of tetrahedra and triangles in each cell is similar to that of one cell. It slightly varies in each cell due to the meshing algorithm, which is sensitive to the shape of the entire structure.
4. Discussion
Different growth conditions affect cell genotypes and phenotypes. Variations in the gene and protein expression between 2D and 3D cultures have been repeatedly reported, along with differences in the response to drugs [17-20].
The increase in stem cell markers expression has been already observed in 3D conditions in MCF7 cells grown on collagen scaffolds [
5,
21]. The authors also reported upregulation of mesenchymal markers and downregulation of E-cadherin (
CDH1) in these conditions, which was confirmed by other reports [
8,
22]. Interestingly, for the cells grown in a different 3D model (ultra-low attachment plate) an increase in both,
SOX2 and
CDH1 expression was reported [
9].
Plasticity of E-cadherin expression observed in our study conforms to these previous reports, although the authors of these reports analyzed always only one 3D model and did provide a comparison of a different 3D models as we do in this report. Qi et al. [
23] compared scaffold-free and scaffold-based spheroids in their report, but they analyzed NSCLC cells and compared different markers. While we do not exclude the possibility that epithelial-mesenchymal transition is engaged in a scaffold-based culture, it is obviously not a case for a scaffold-free culture on a low-adherent plate. Accordingly, since we observe dramatic differences in E-cadherin levels between the two studied 3D models (scaffold-free versus scaffold-based), 3D conditions
per se cannot explain these differences, and we propose the solution based on mechanobiology.
The main difference between the analyzed 3D models consists in physical conditions of growth, mainly in the fact that on non-adherent plate cells grow in the medium, with a relative freedom of movement, while on the scaffold they rest in the stiff hydrogel and have restricted movement. We assumed that free-floating spheroids require stronger cell-cell contacts (hence: E-cadherin expression) to remain intact, since they are subjected to hydrodynamic forces of the moving fluid and do not have the support of the scaffold. To test this hypothesis, we simulated the mechanical stress within the single cell and between the group of cells, using a mathematical model, based on the confocal images of a bioprinted culture.
The model has been used to compare two different conditions: with a very stiff matrix mimicking alginate hydrogel and a very soft matrix, to approximate (although not completely) the conditions in the medium. The results for every cellular element (cortex, cytoplasm, nucleus, cytoskeleton) and for a single cell as well as for a group of cells, demonstrate that the stress, especially the maximal stress, is always higher in the conditions of the soft gel. Although there are interesting differences between stress field distribution for the stiff and the soft gel, the highest values for the soft gel, especially at the attachment sites, substantiate our hypothesis that higher stress requires stronger cell-cell junctions to preserve the integrity of the group of cells. If not for E-cadherin (or possibly other junction proteins) upregulation, these group of cells would disintegrate into single cells, which in 3D conditions would be detrimental for their survival. This may be the reason for reported upregulation of some junction proteins in circulating tumor cell clusters [
24,
25] and have profound significance for the metastatic process.
Figure 1.
The geometry of the elements of the model; cytoskeleton (CSK), nucleus, cell cortex, cytoplasm, ECM.
Figure 1.
The geometry of the elements of the model; cytoskeleton (CSK), nucleus, cell cortex, cytoplasm, ECM.
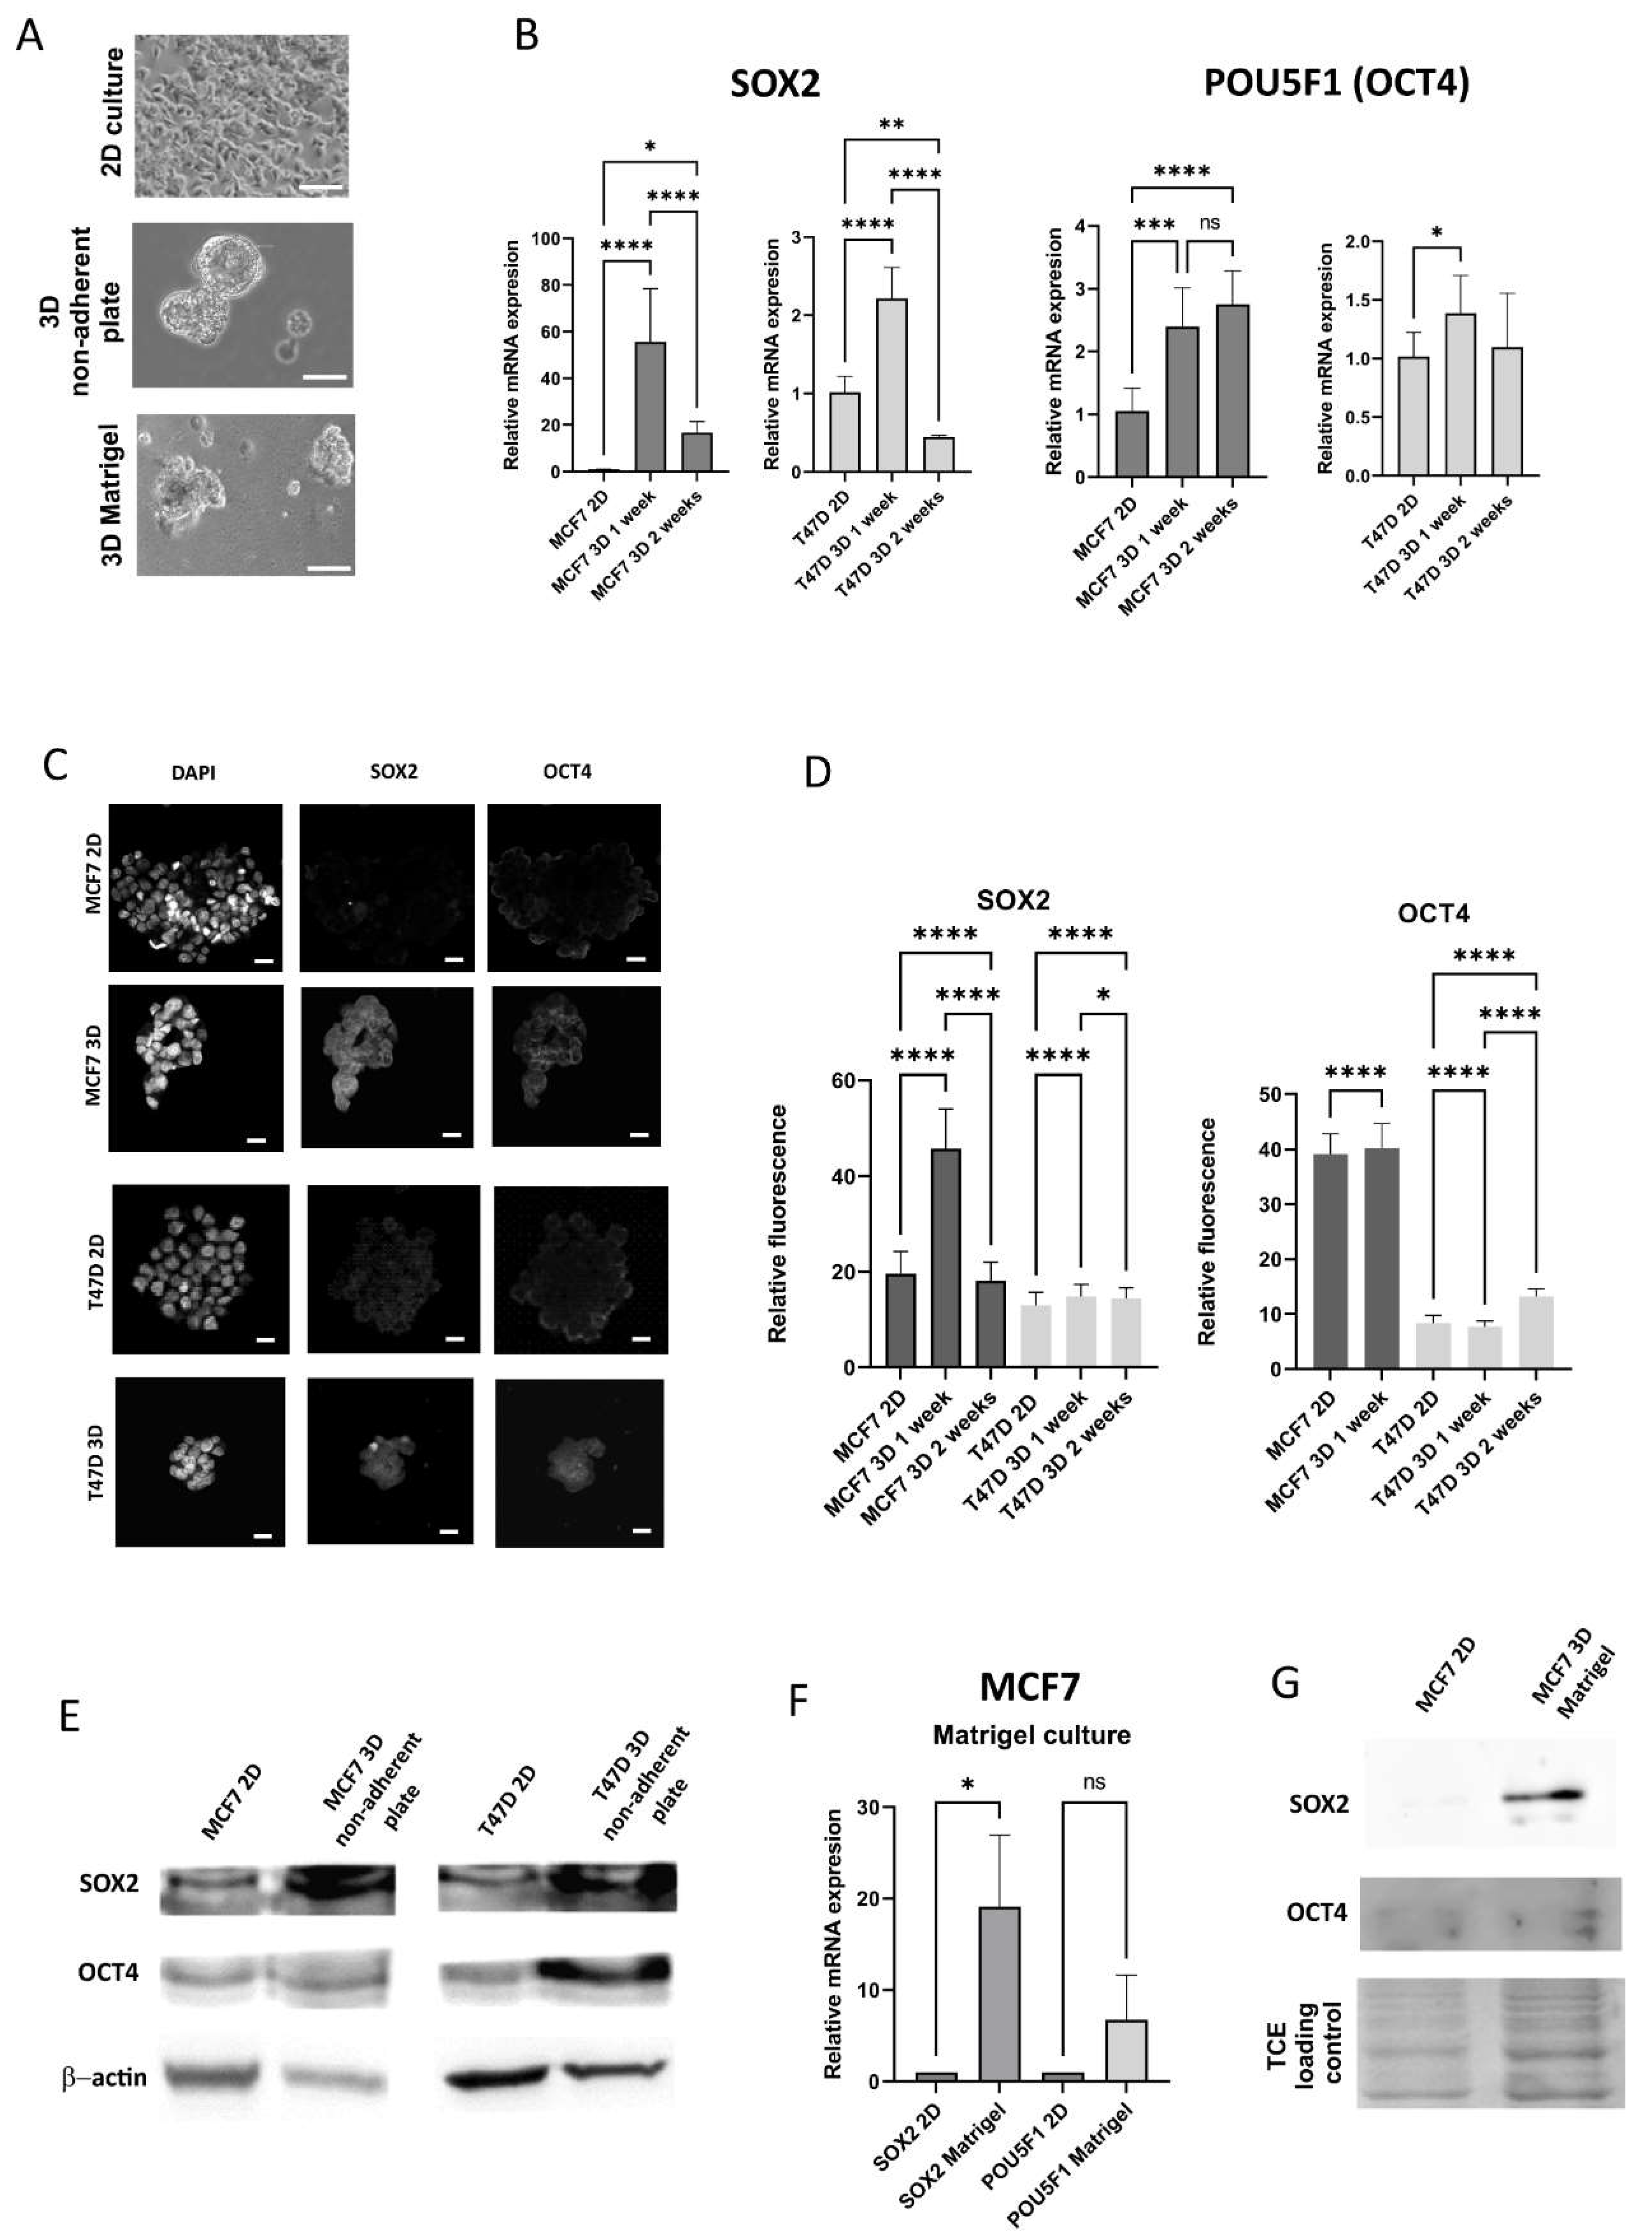
Figure 2.
Stem cell markers expression in 2D and 3D conditions. A. Representative images of 2D and 3D cultures, MCF7 cells, Olympus CKX53., scale bar 20 m B. qPCR results of SOX2 and POU5F1 expression in 2D and 3D (non-adherent plate) conditions, MCF7 and T47D cell lines C. Representative confocal images of the 2D culture and 1 week 3D culture on non-adherent plate D. Quantification of the fluorescence for SOX2 and OCT4, 2D and 3D on non-adherent plate E. Western blots for SOX2 and OCT4, 2D and non-adherent plate, F. qPCR results for the culture on Matrigel, G. Western blot results for the culture on Matrigel.
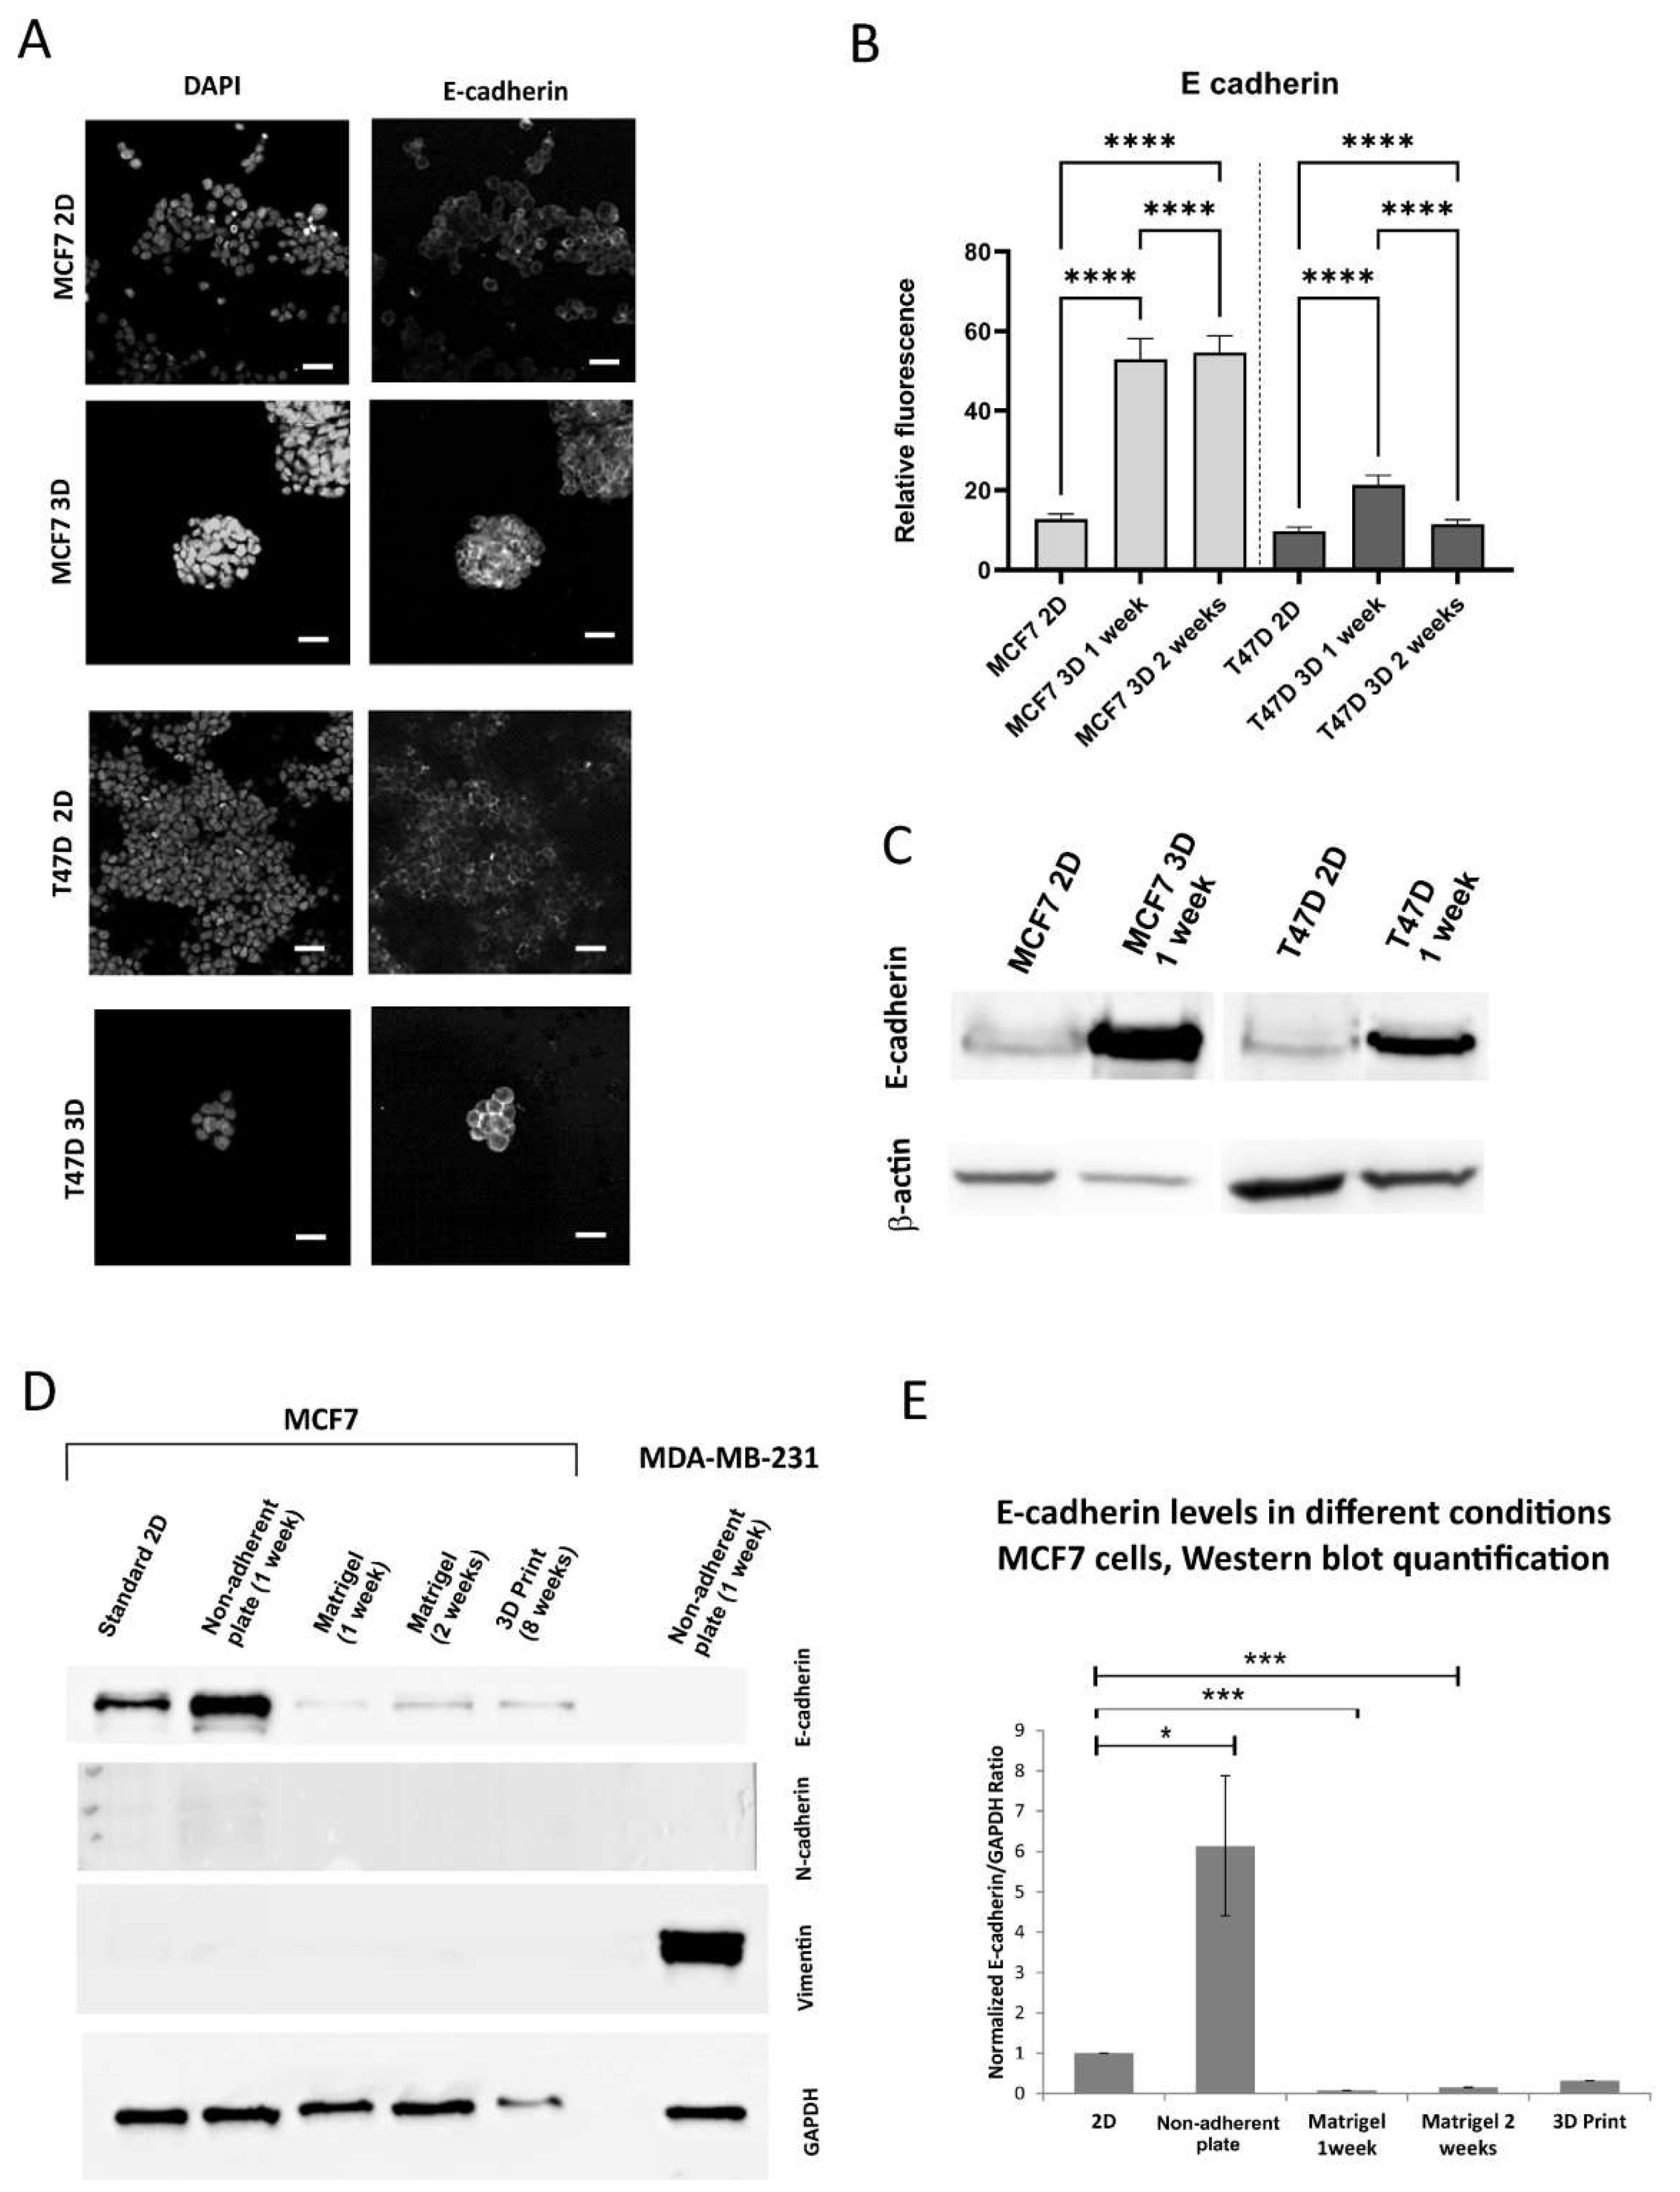
Figure 3.
E-cadherin expression in 2D and 3D conditions. A. Representative confocal images of the 2D culture and 1 week 3D culture on non-adherent plate, scale bar 20 m B. Quantification of the fluorescence of E-cadherin, 2D and 3D on non-adherent plate C. Western blots for E-cadherin, 2D and 3D on non-adherent plate, D. Representative Western blot for epithelial and mesenchymal markers, 2D, 3D on non-adherent plate, 3D in Matrigel, bioprinted 3D culture in alginate, E. Quantification of Western blot experiments, 3-5 repeats.
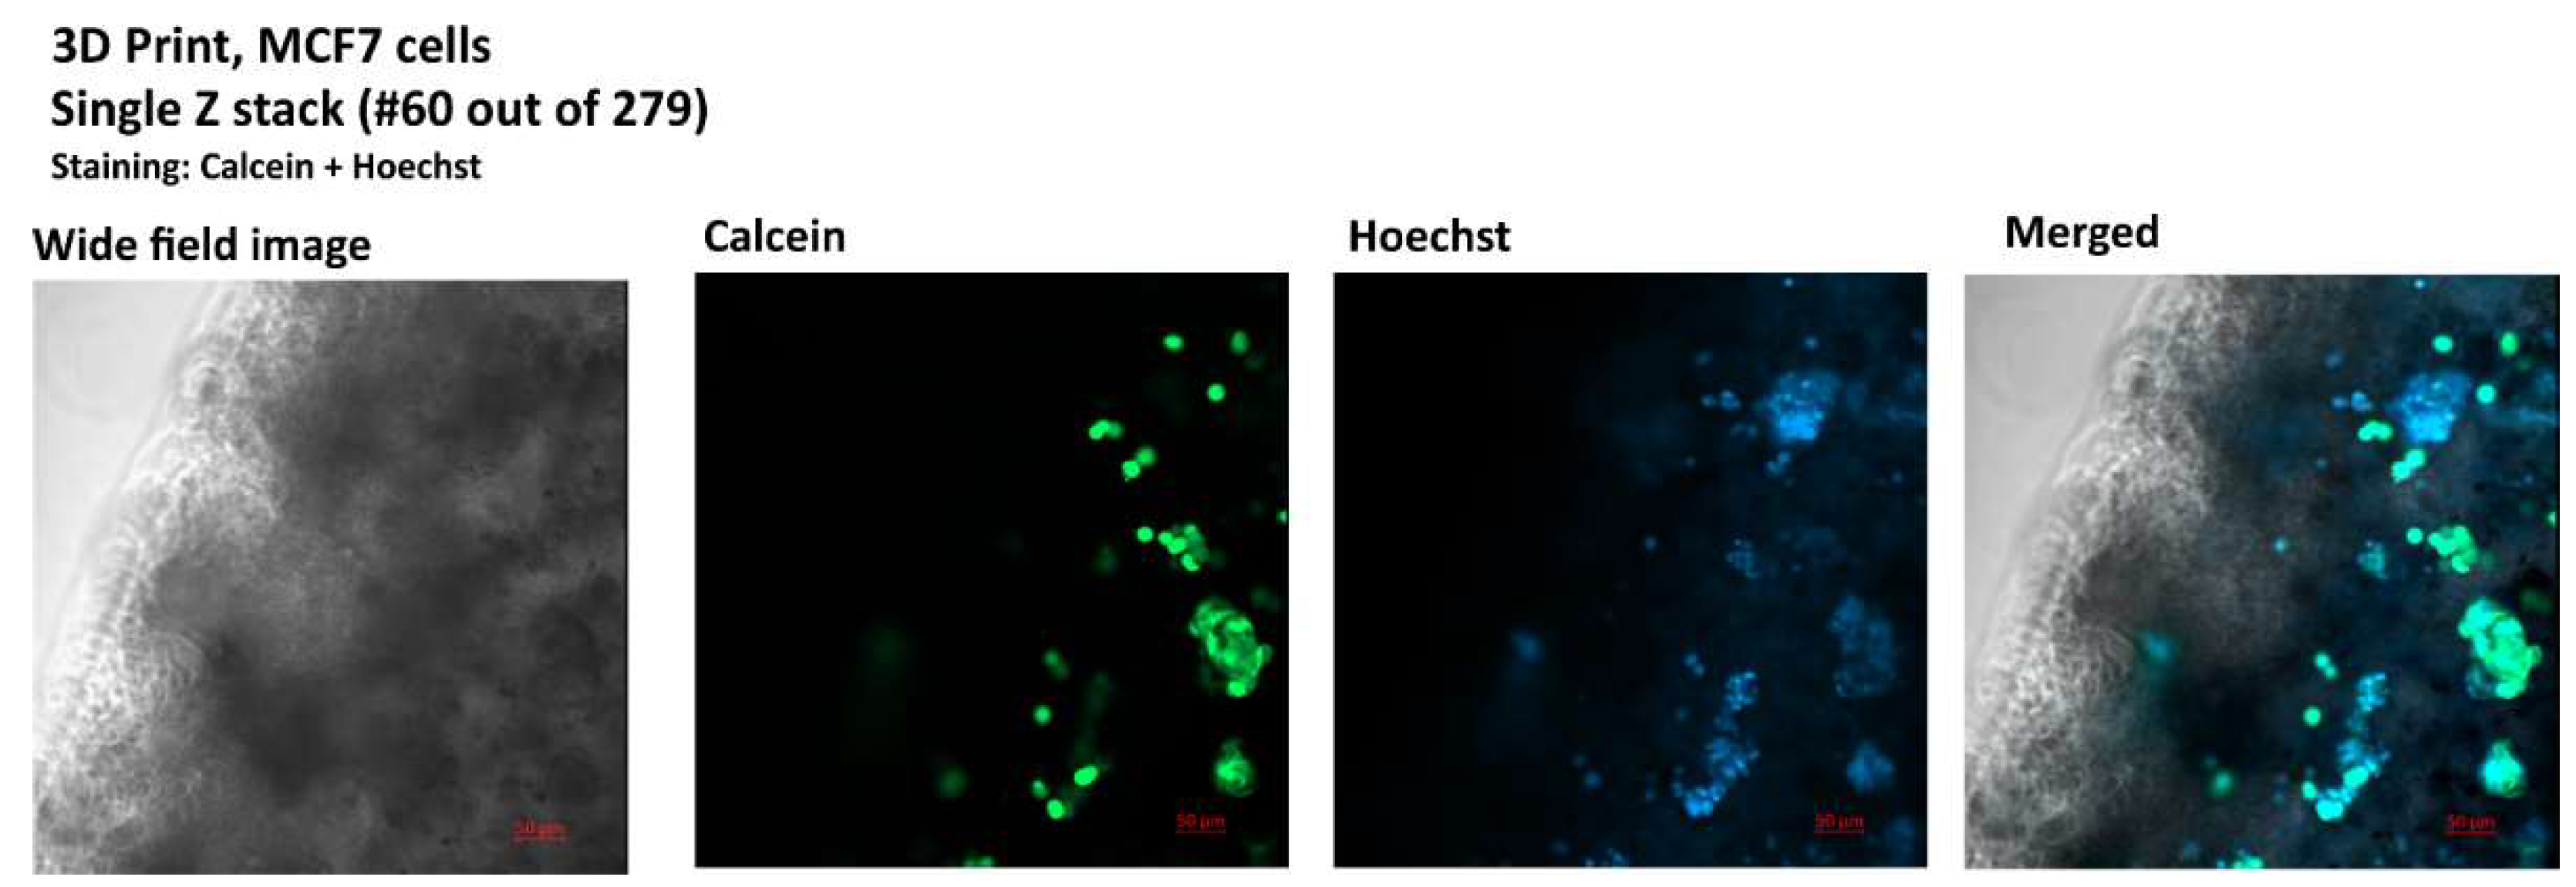
Figure 4.
Image of a single Z-stack from a 279, confocal image, bioprinted MCF7 culture, staining: calcein (live cells) Hoechst 33342 (nuclei), Zeiss LSM800 microscope.
Figure 4.
Image of a single Z-stack from a 279, confocal image, bioprinted MCF7 culture, staining: calcein (live cells) Hoechst 33342 (nuclei), Zeiss LSM800 microscope.
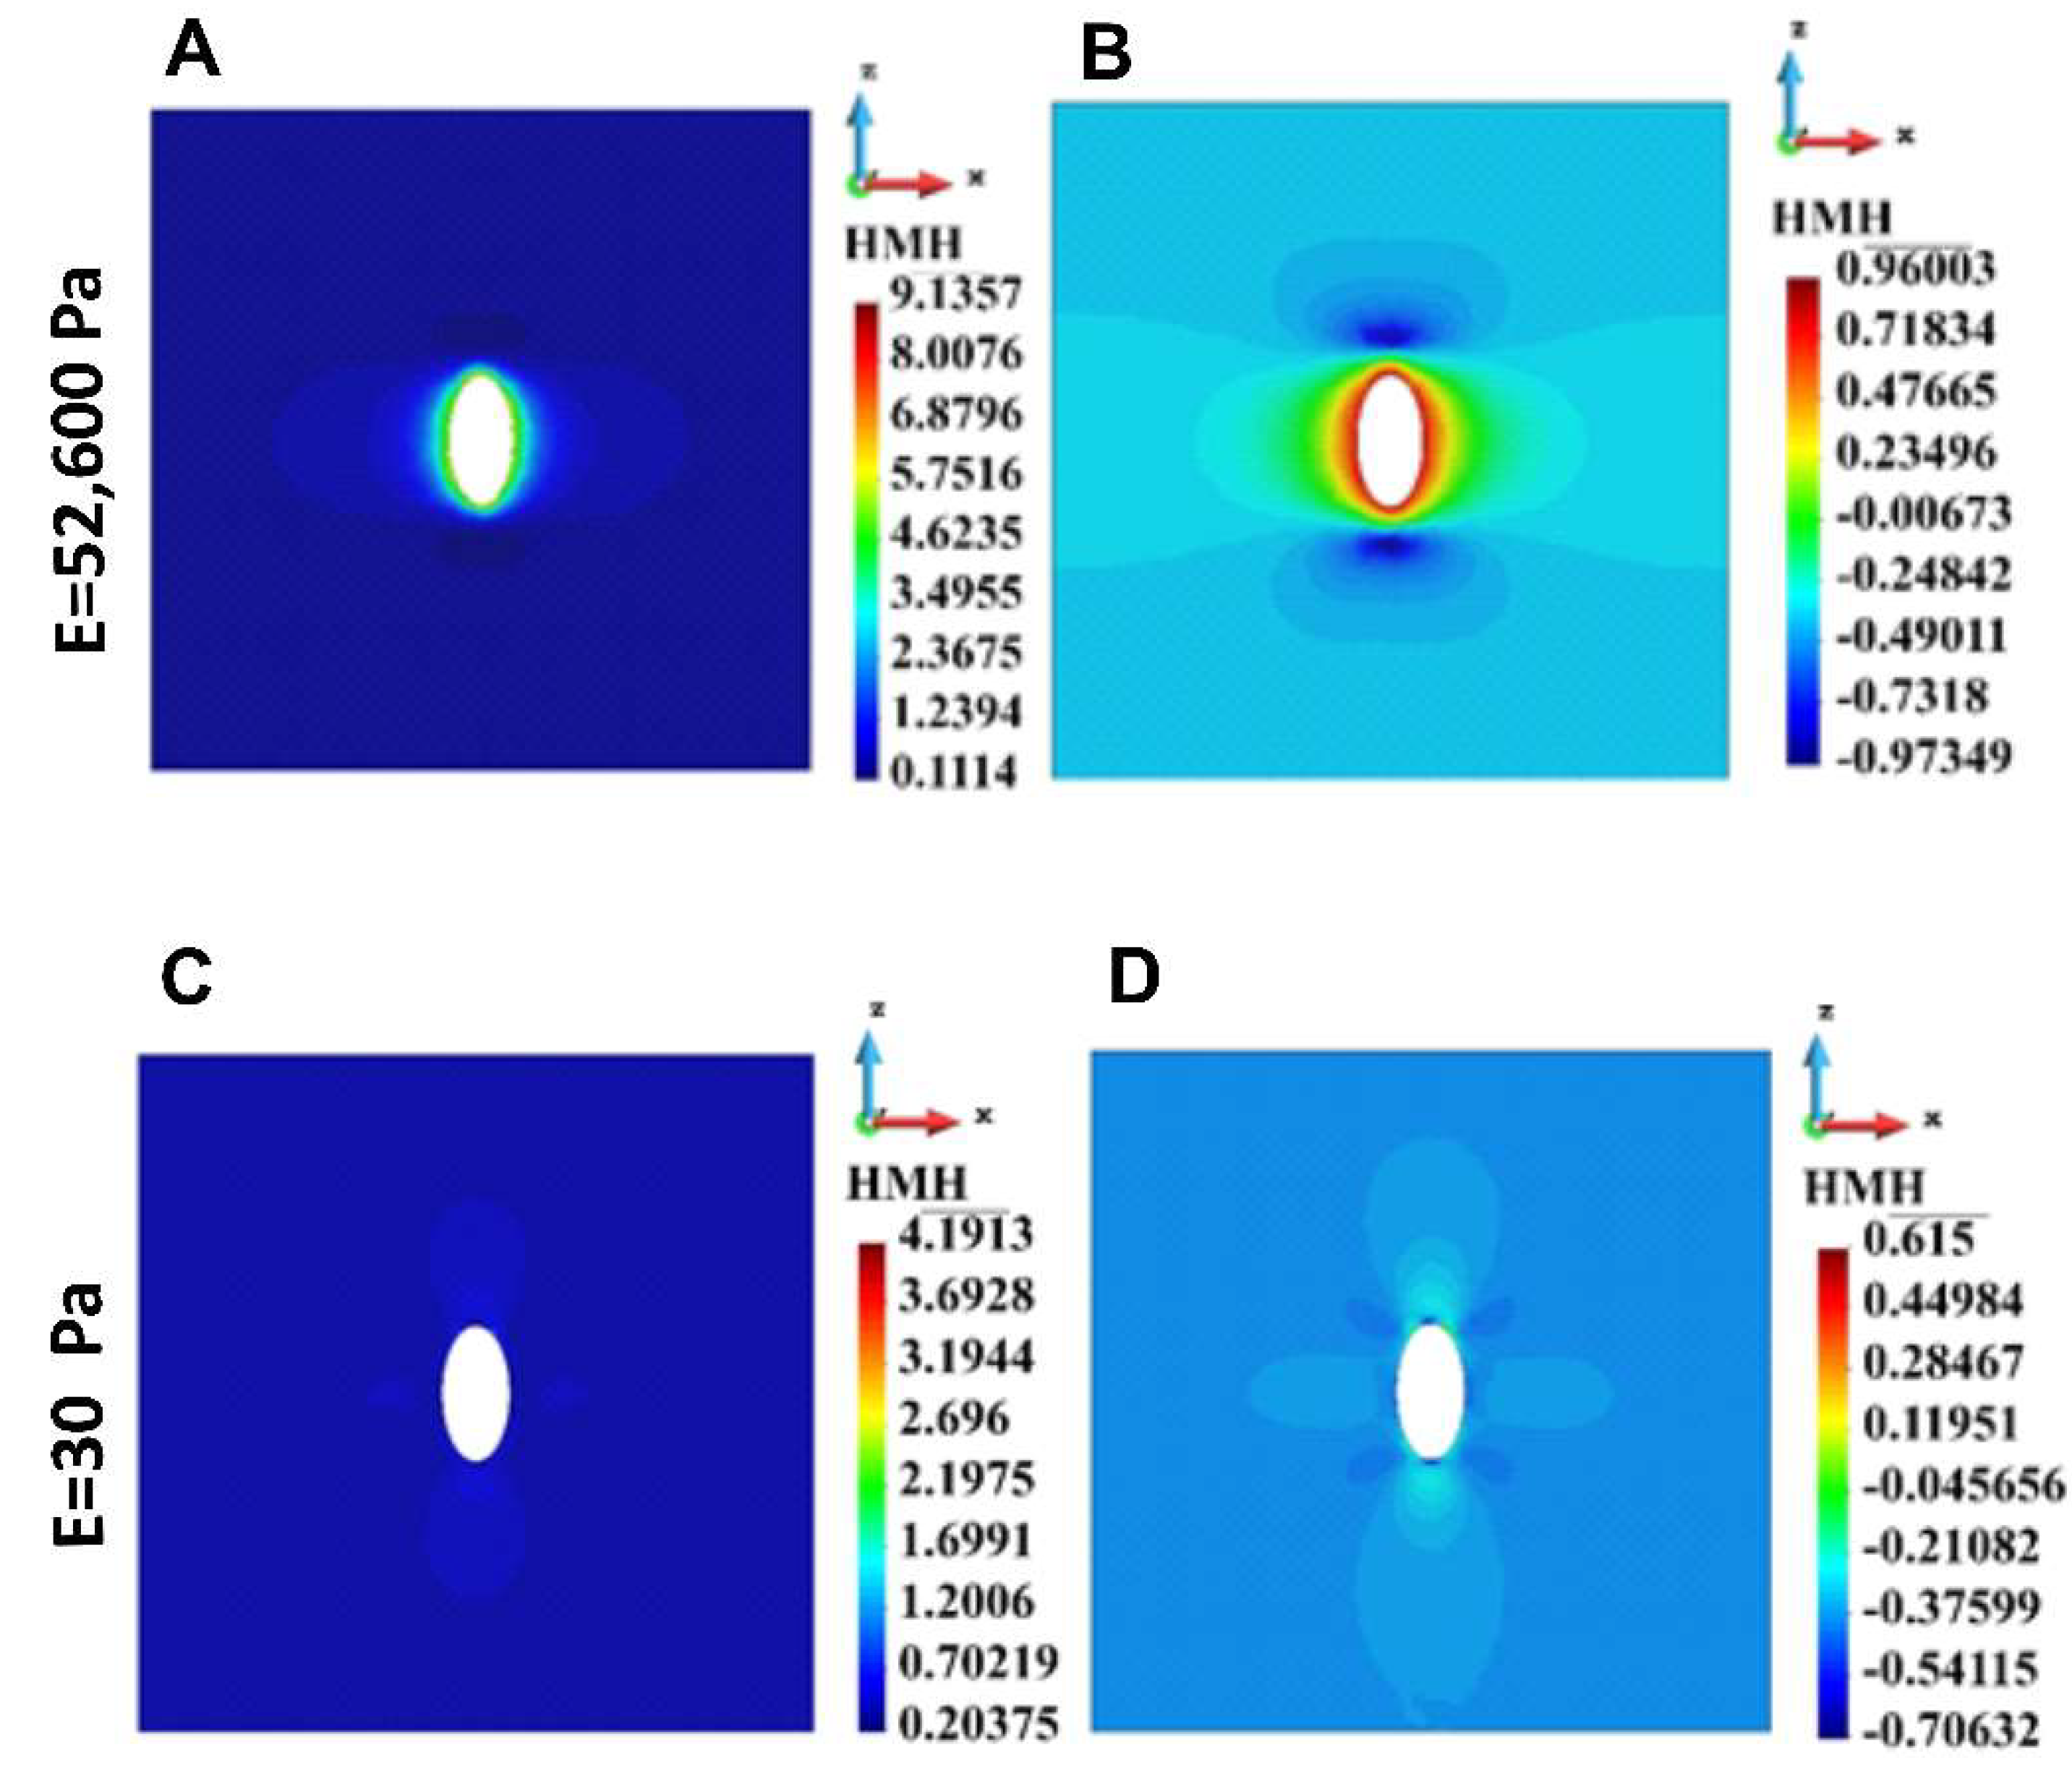
Figure 5.
HMH stress distribution in the cross-section across the ECM with single cell. A. Linear scale, stiff ECM, B. Logarithmic scale, stiff ECM, C. Linear Scale, soft ECM, D. Logarithmic scale, soft ECM.
Figure 5.
HMH stress distribution in the cross-section across the ECM with single cell. A. Linear scale, stiff ECM, B. Logarithmic scale, stiff ECM, C. Linear Scale, soft ECM, D. Logarithmic scale, soft ECM.
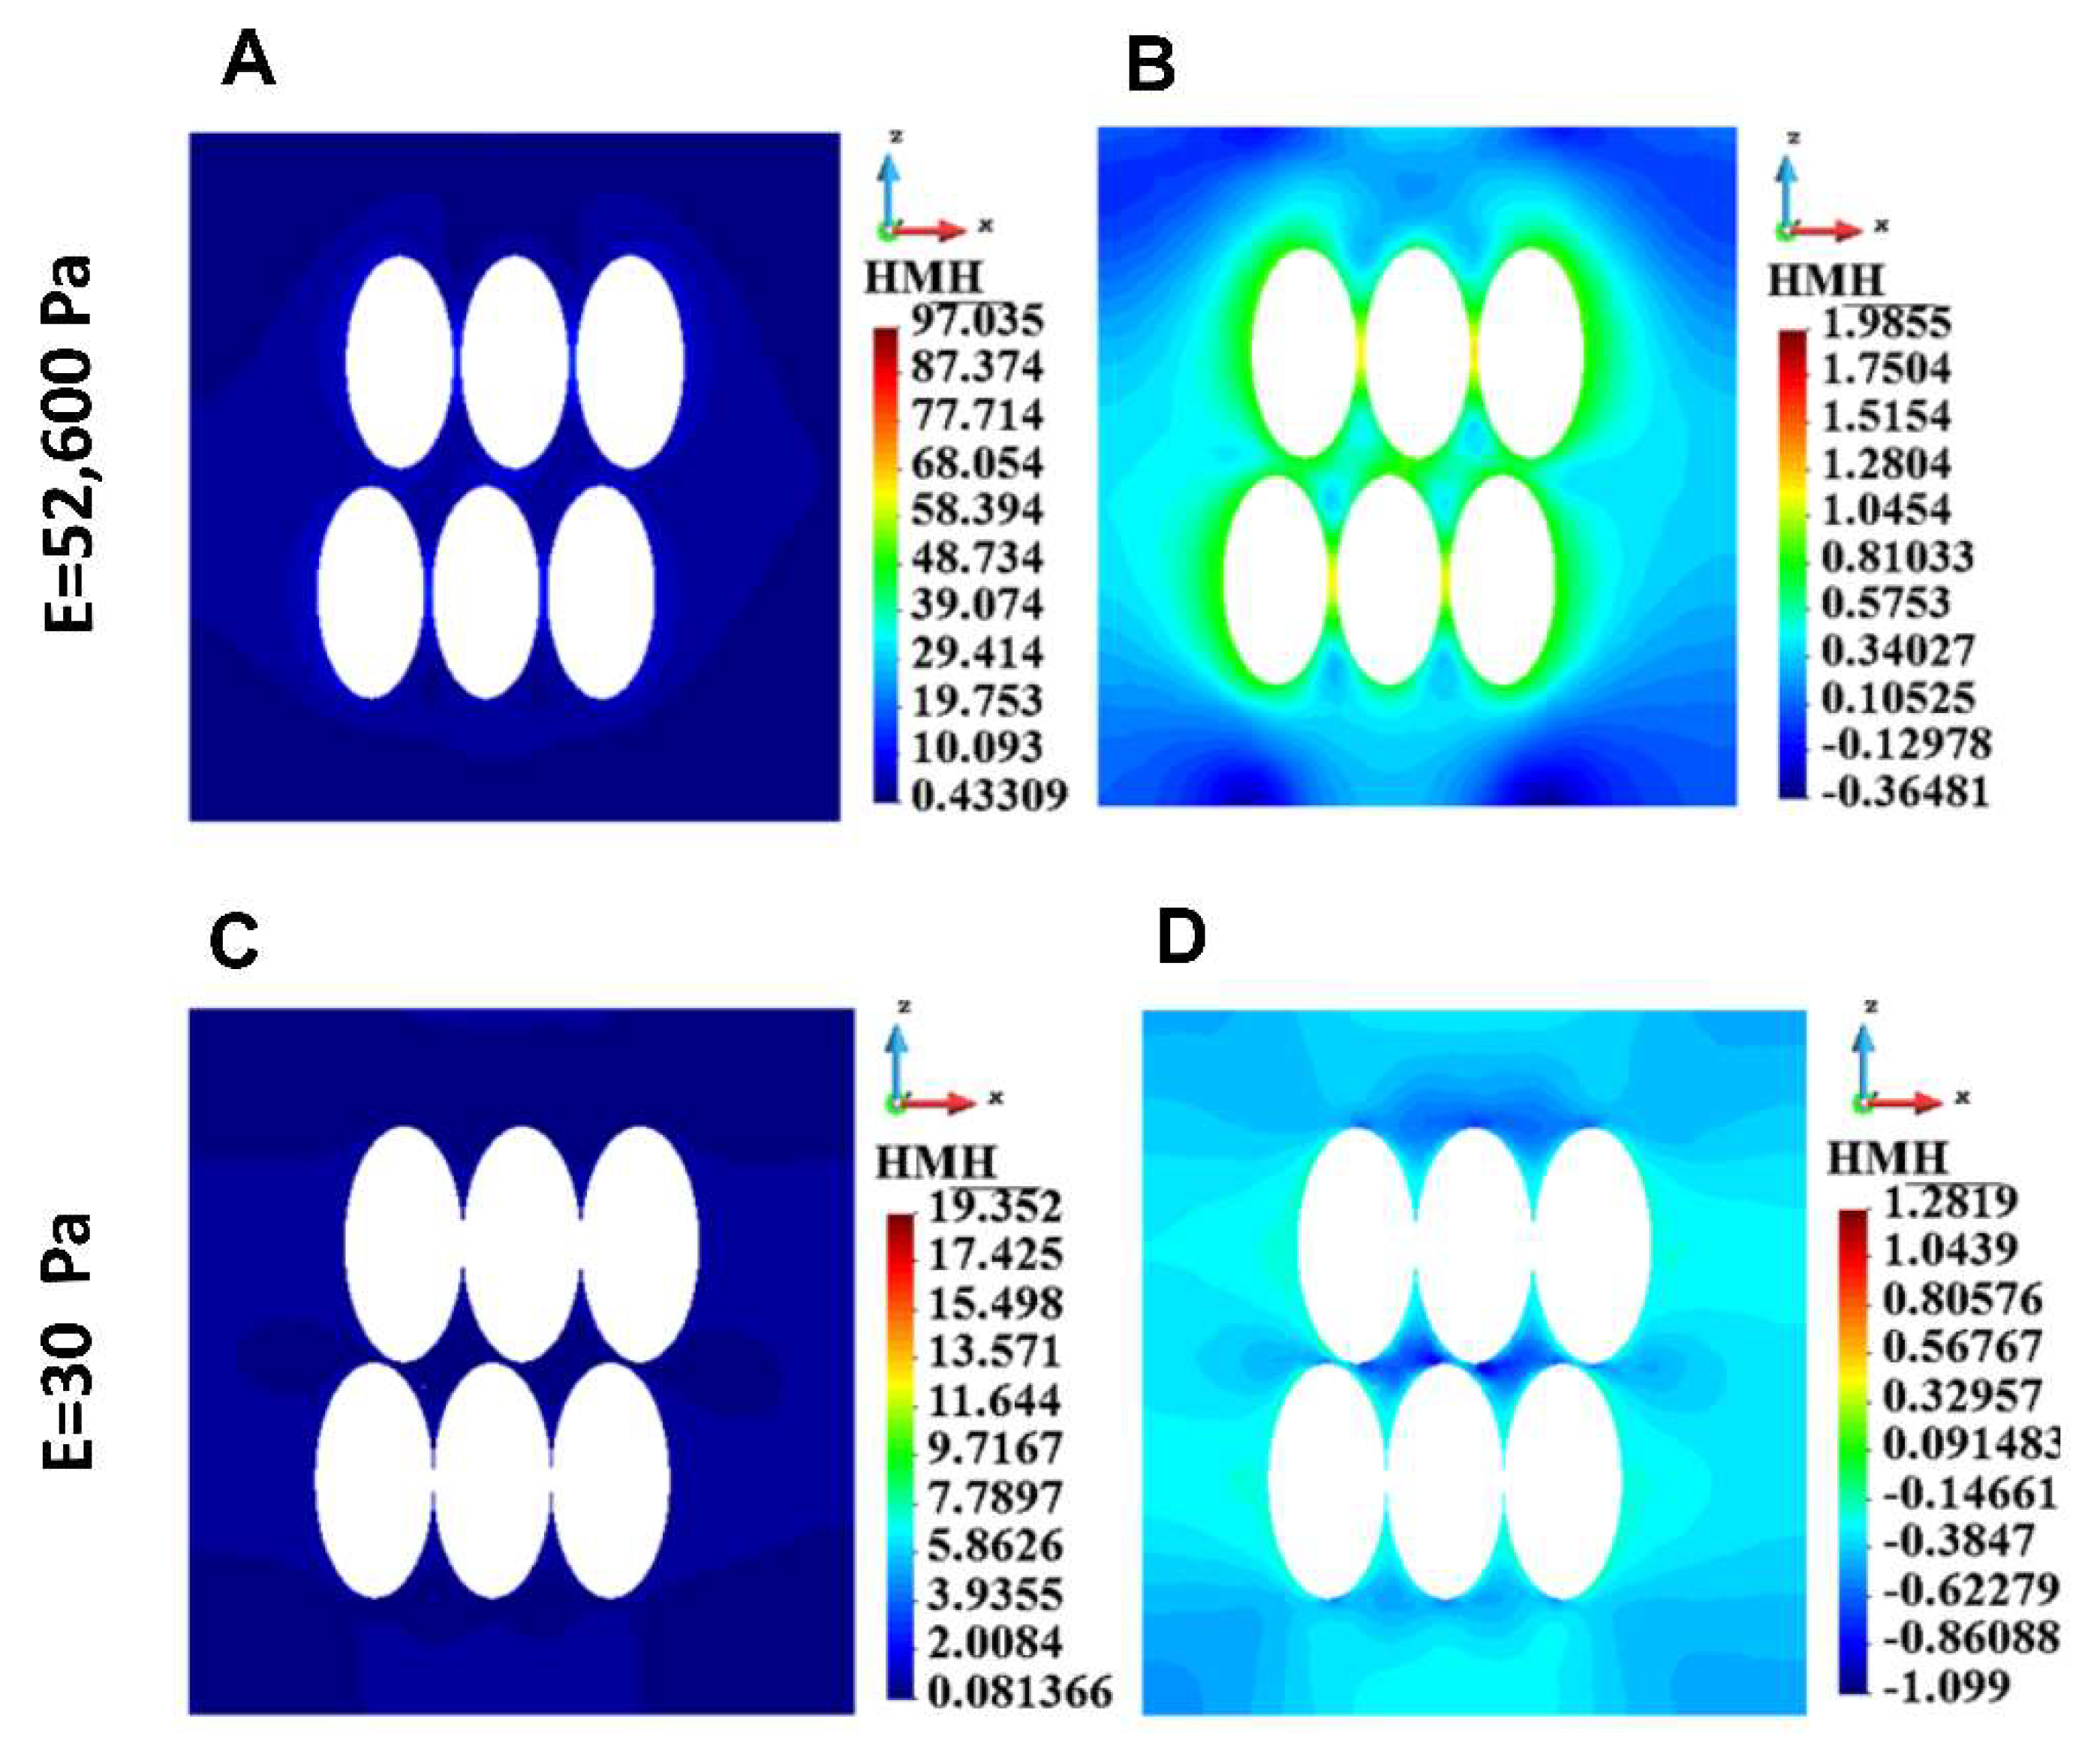
Figure 6.
HMH stress distribution in ECM for a group of cells, stiff ECM (upper panel) and soft ECM (lower panel). A. Linear scale, stiff ECM, B. Logarithmic scale, stiff ECM, C. Linear Scale, soft ECM, D. Logarithmic scale, soft ECM.
Figure 6.
HMH stress distribution in ECM for a group of cells, stiff ECM (upper panel) and soft ECM (lower panel). A. Linear scale, stiff ECM, B. Logarithmic scale, stiff ECM, C. Linear Scale, soft ECM, D. Logarithmic scale, soft ECM.
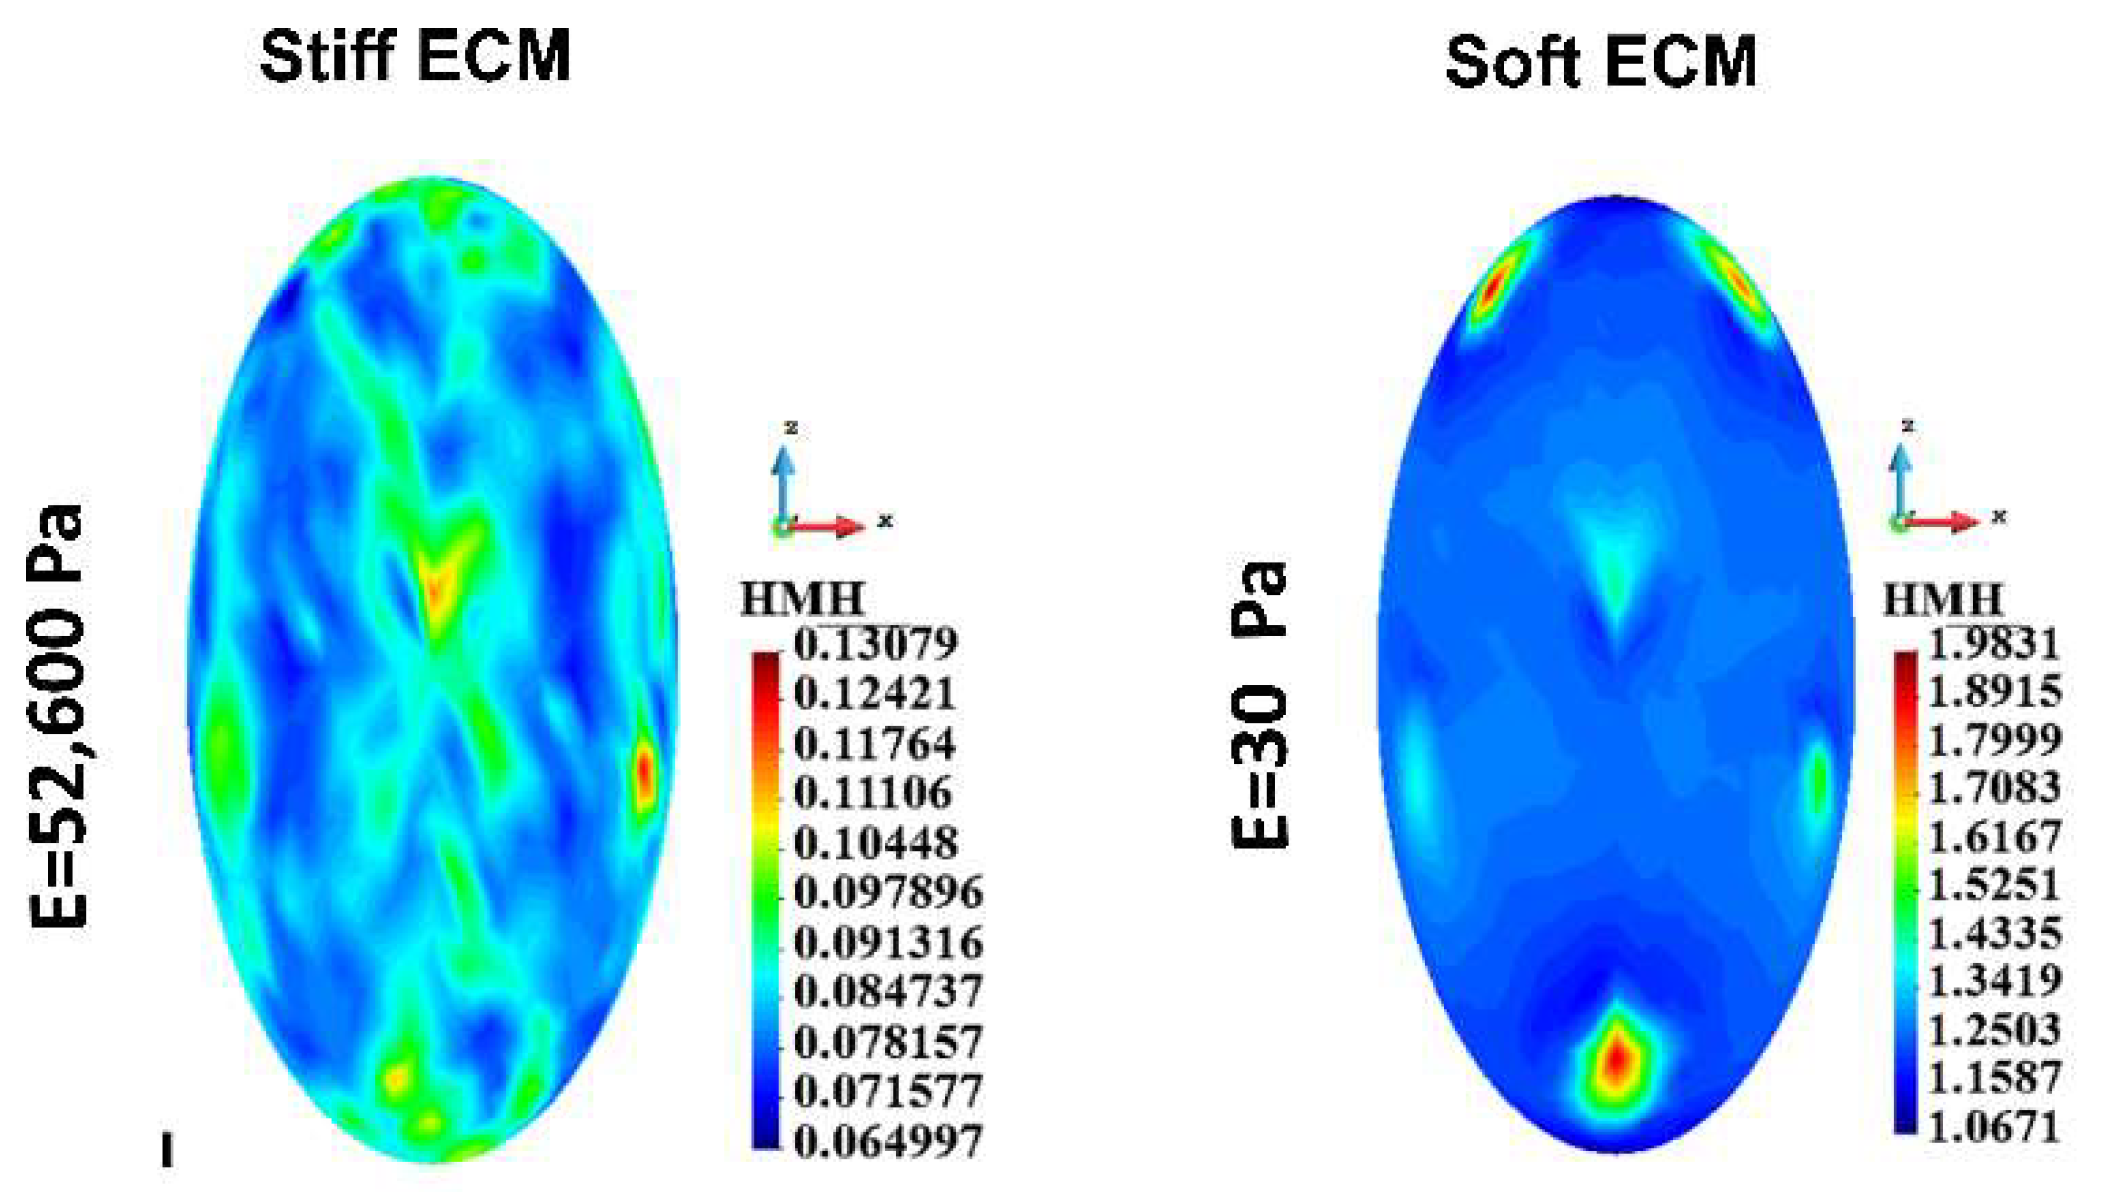
Figure 7.
Single cell, cortex, HMH stress; Stiff ECM, Soft ECM.
Figure 7.
Single cell, cortex, HMH stress; Stiff ECM, Soft ECM.
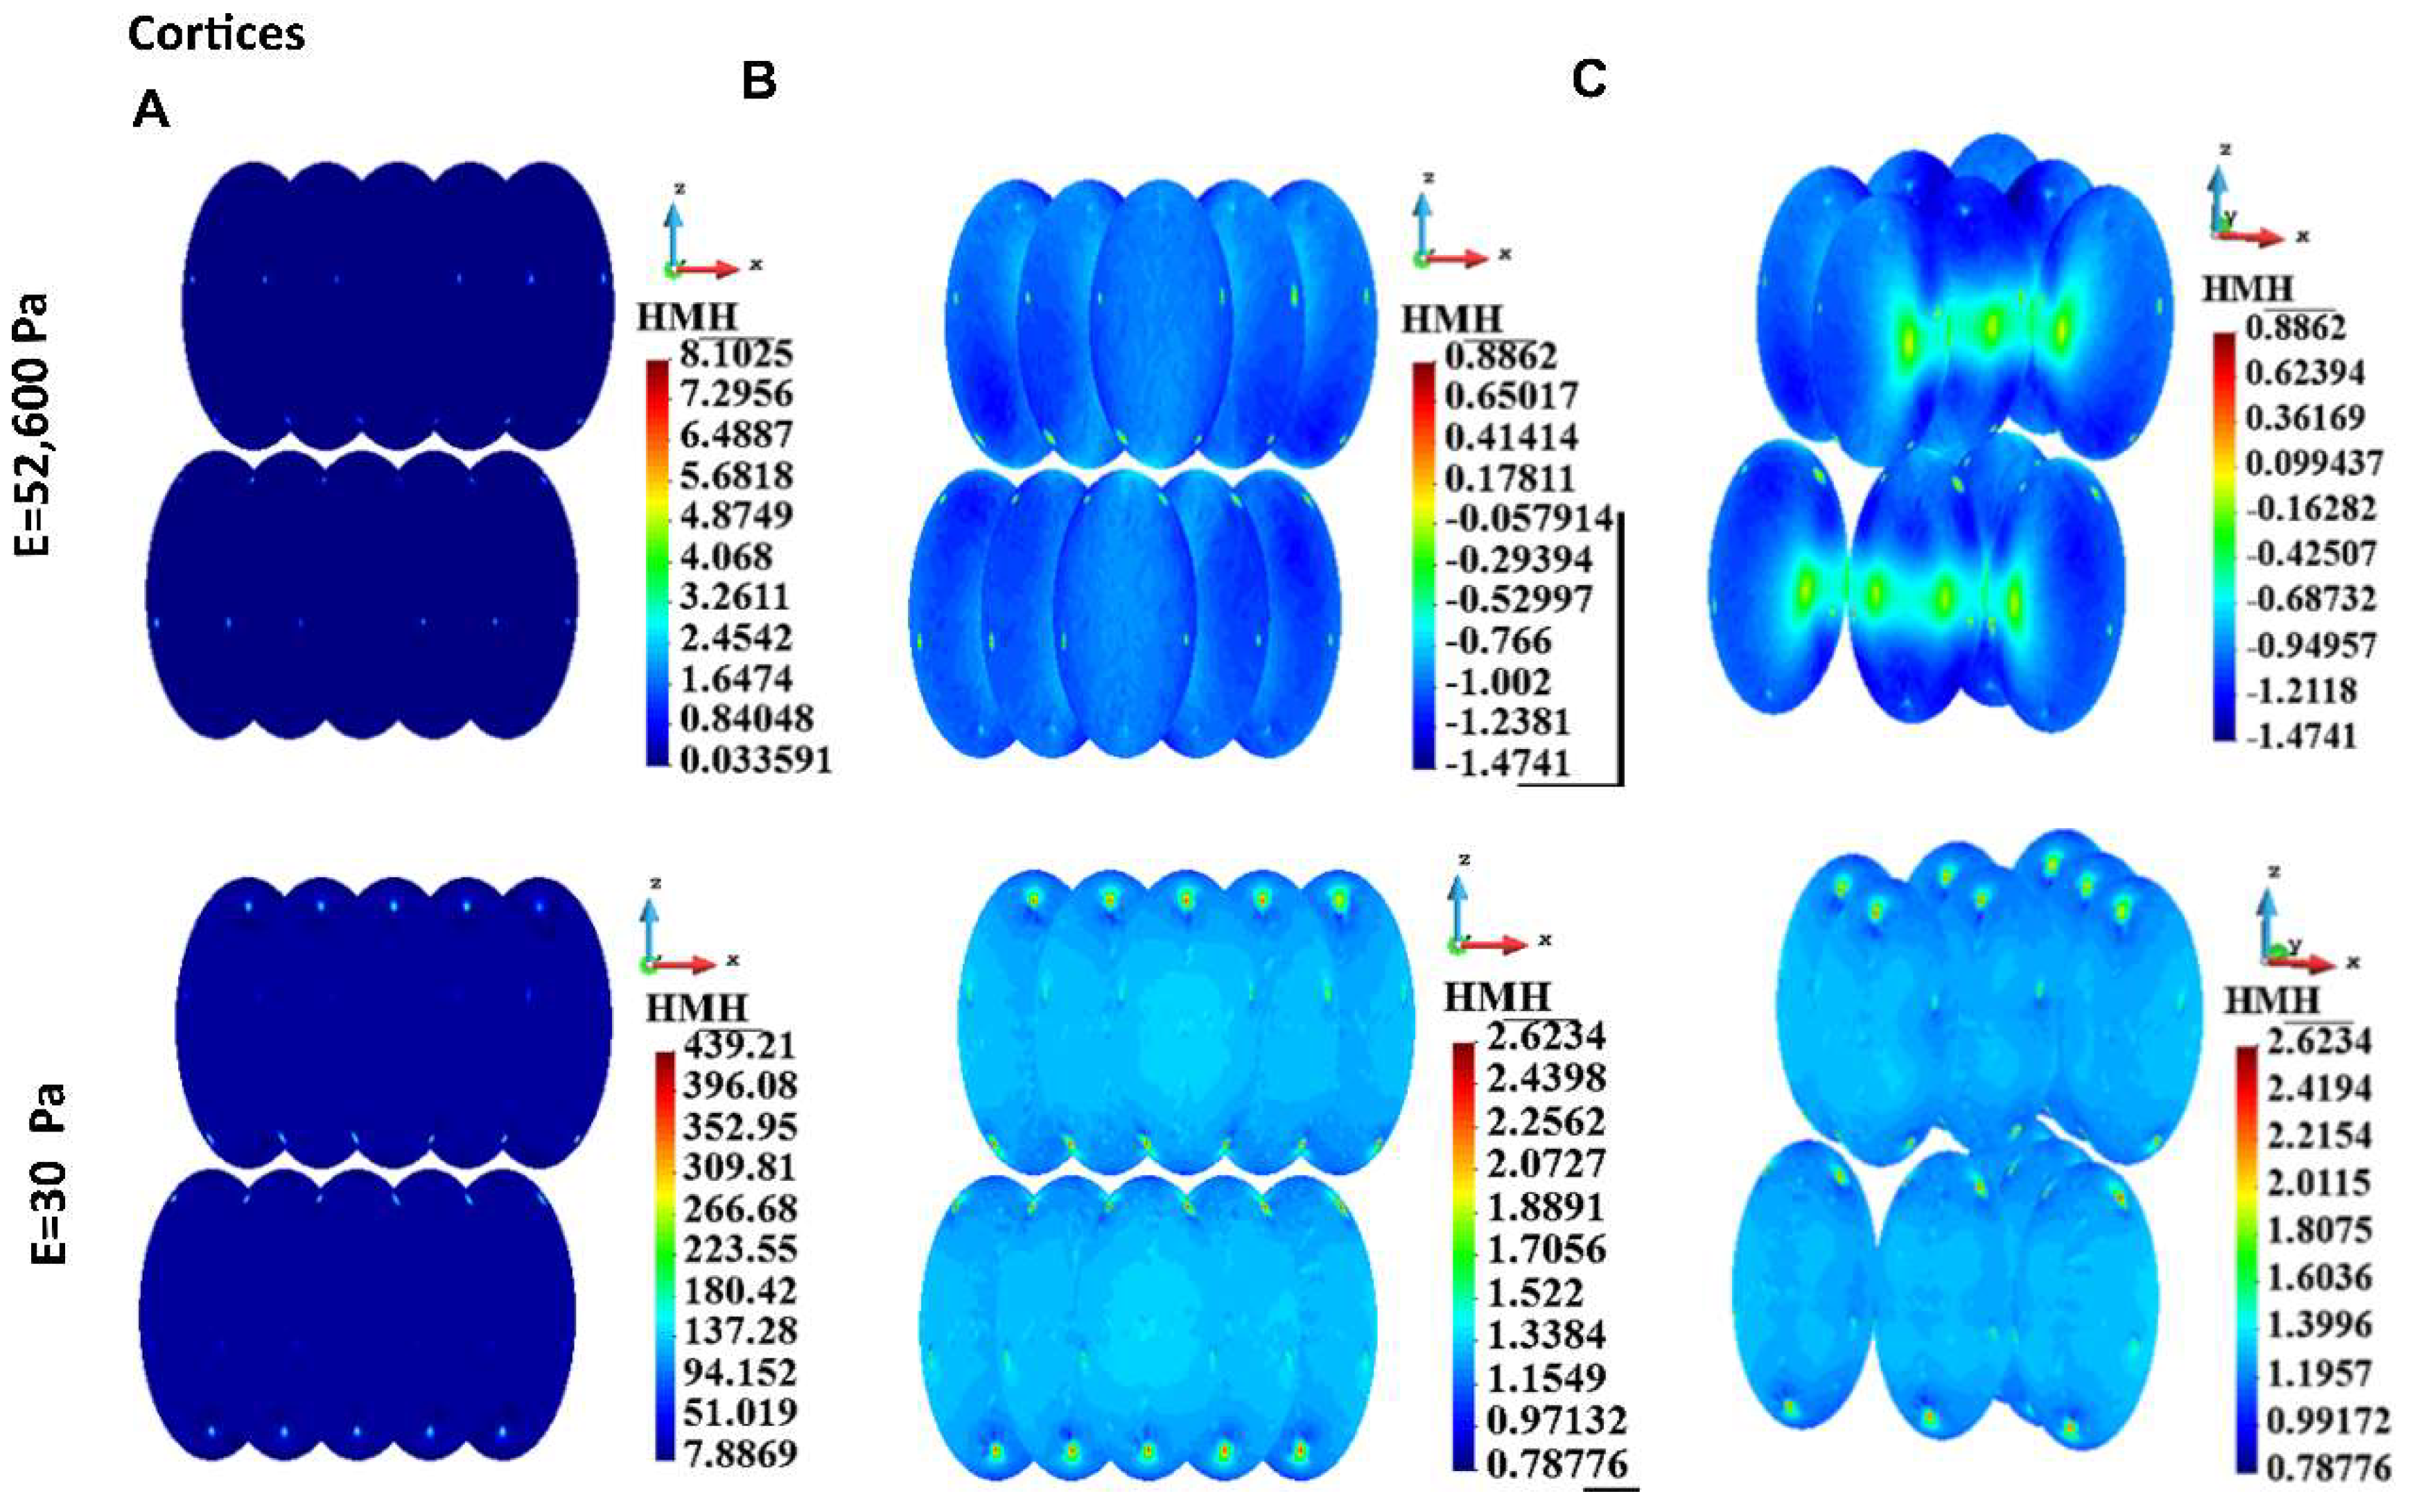
Figure 8.
HMH stress in a cortices for a group of cells, stiff ECM (upper panel) and soft ECM (lower panel). A. Linear scale, B. Logarithmic scale, C. Illustration of interactions between cells.
Figure 8.
HMH stress in a cortices for a group of cells, stiff ECM (upper panel) and soft ECM (lower panel). A. Linear scale, B. Logarithmic scale, C. Illustration of interactions between cells.
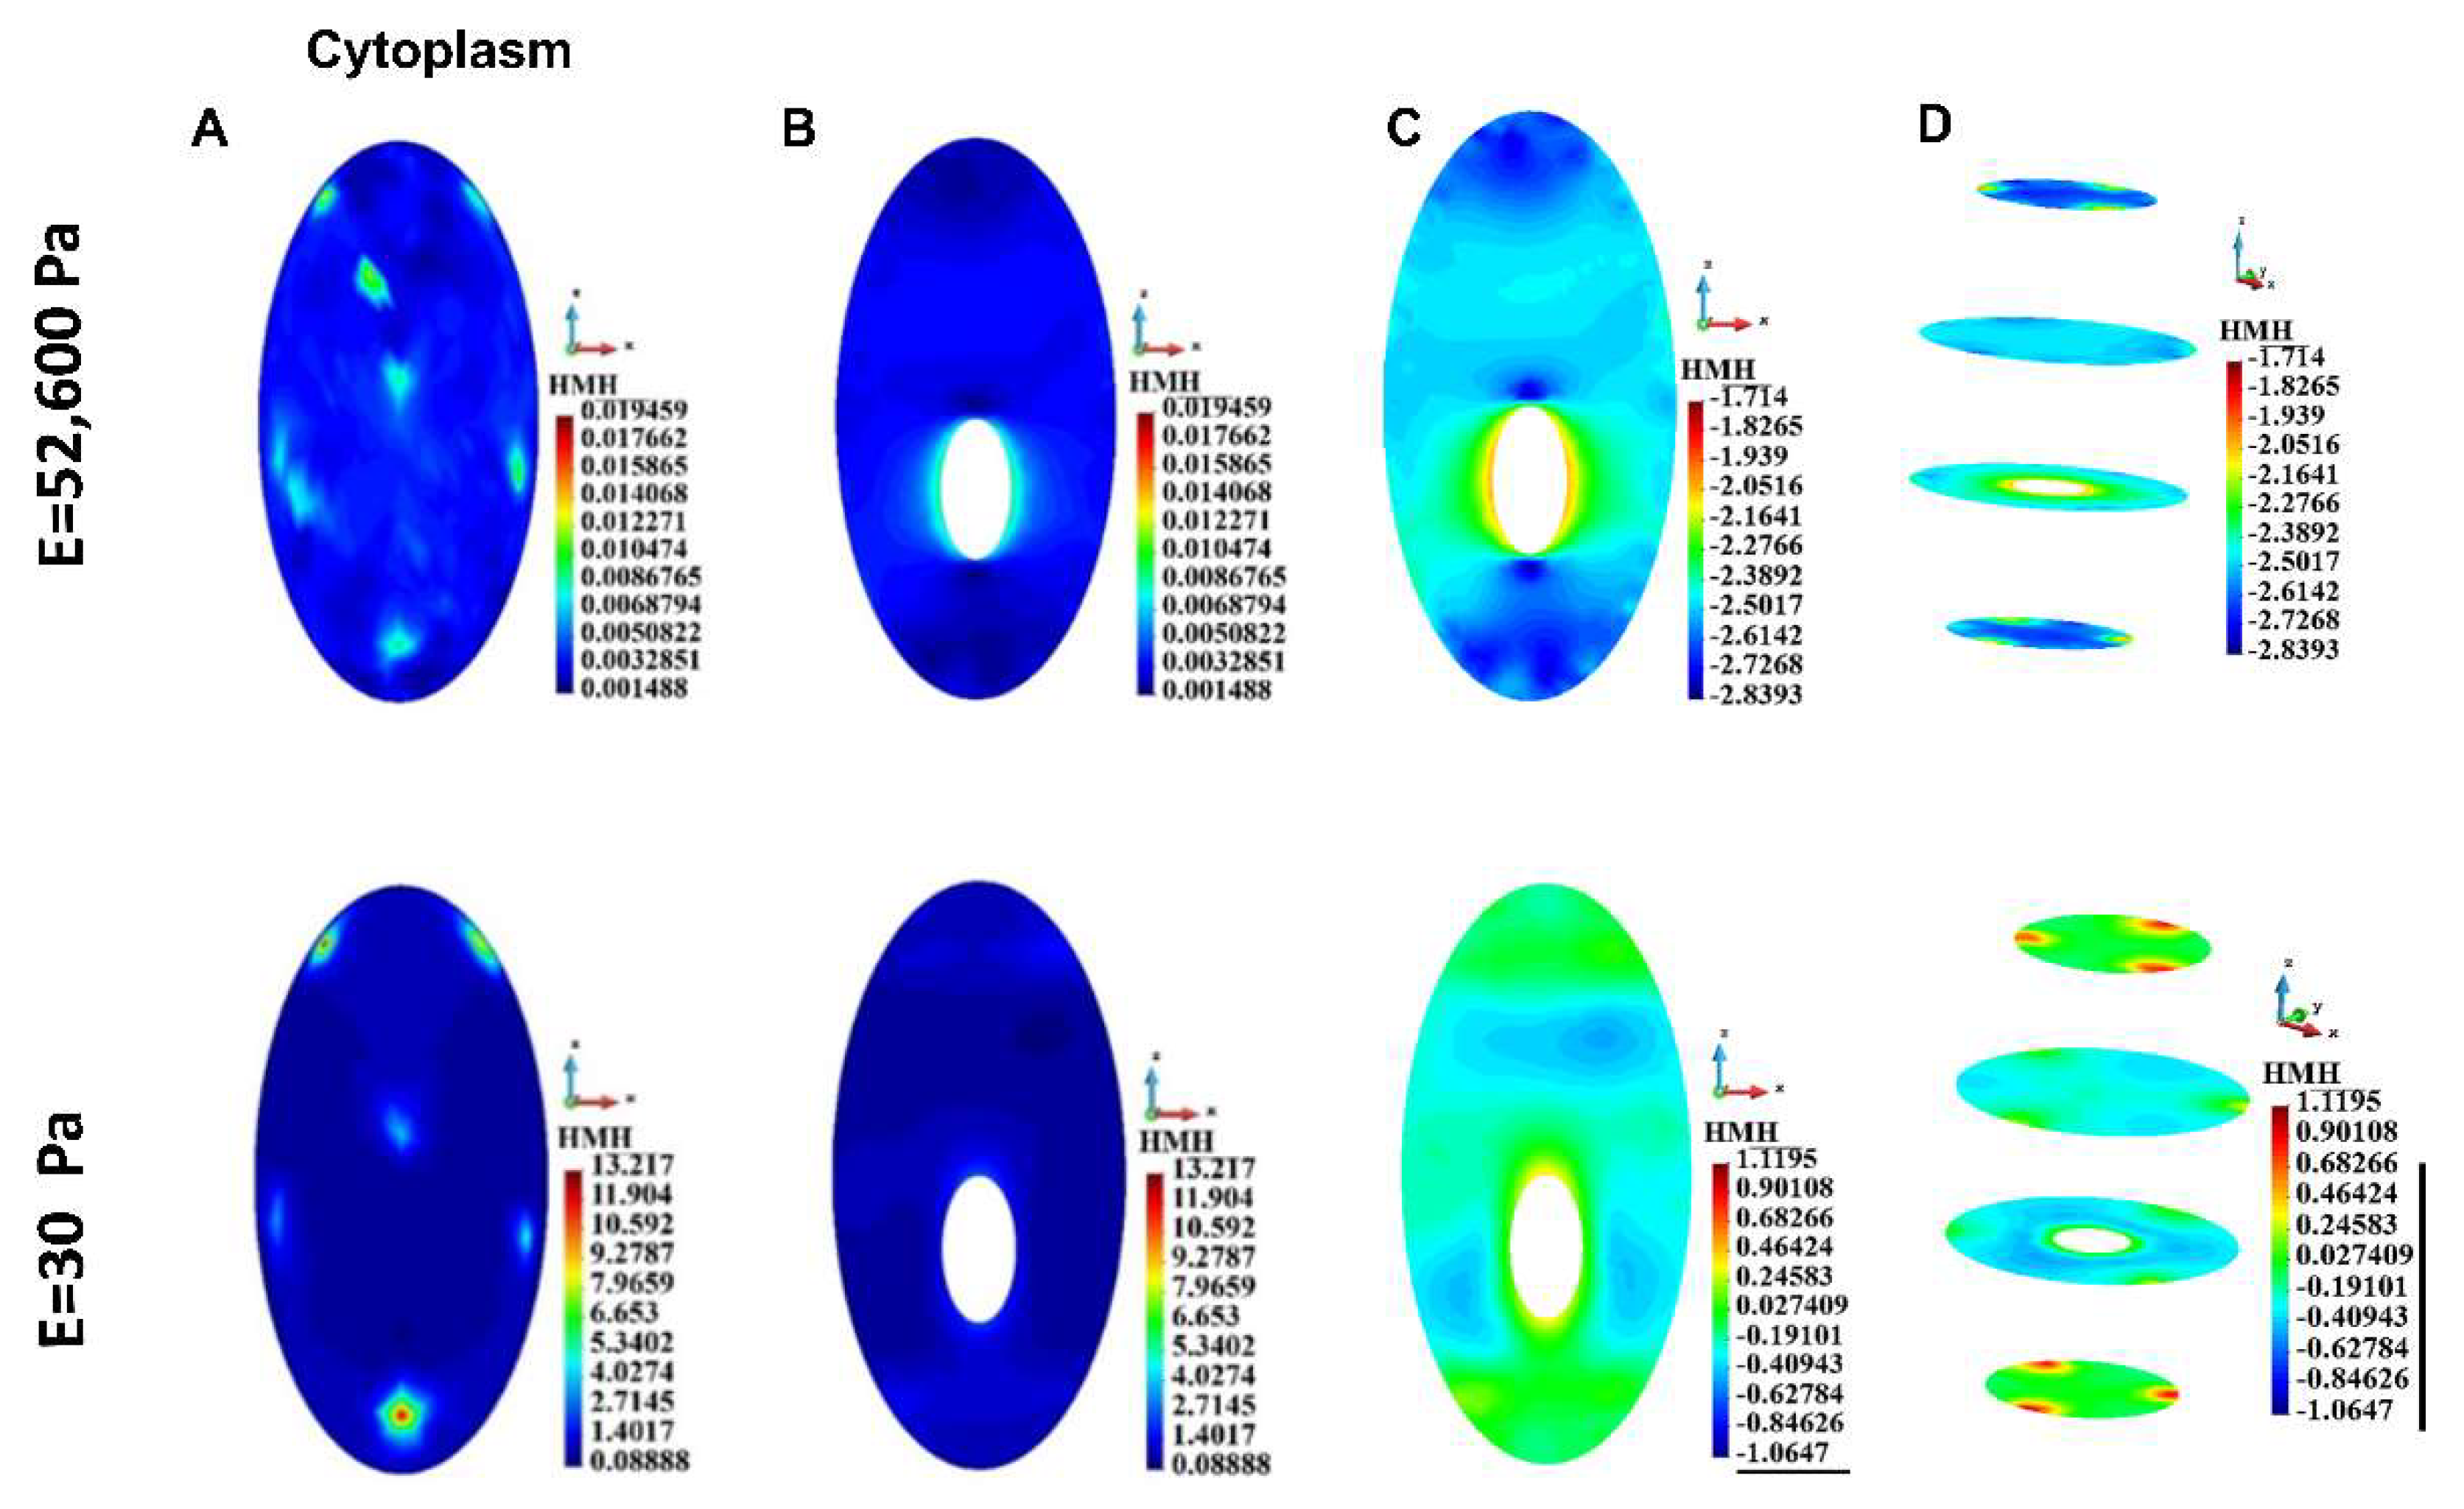
Figure 9.
HMH stress distribution, single cell, cytoplasm. A. Cell surface B. Vertical cross-section of the cytoplasm, linear scale C. Vertical cross-section of the cytoplasm, decimal logarithm scale D. Horizontal section of the cytoplasm, decimal logarithm scale.
Figure 9.
HMH stress distribution, single cell, cytoplasm. A. Cell surface B. Vertical cross-section of the cytoplasm, linear scale C. Vertical cross-section of the cytoplasm, decimal logarithm scale D. Horizontal section of the cytoplasm, decimal logarithm scale.
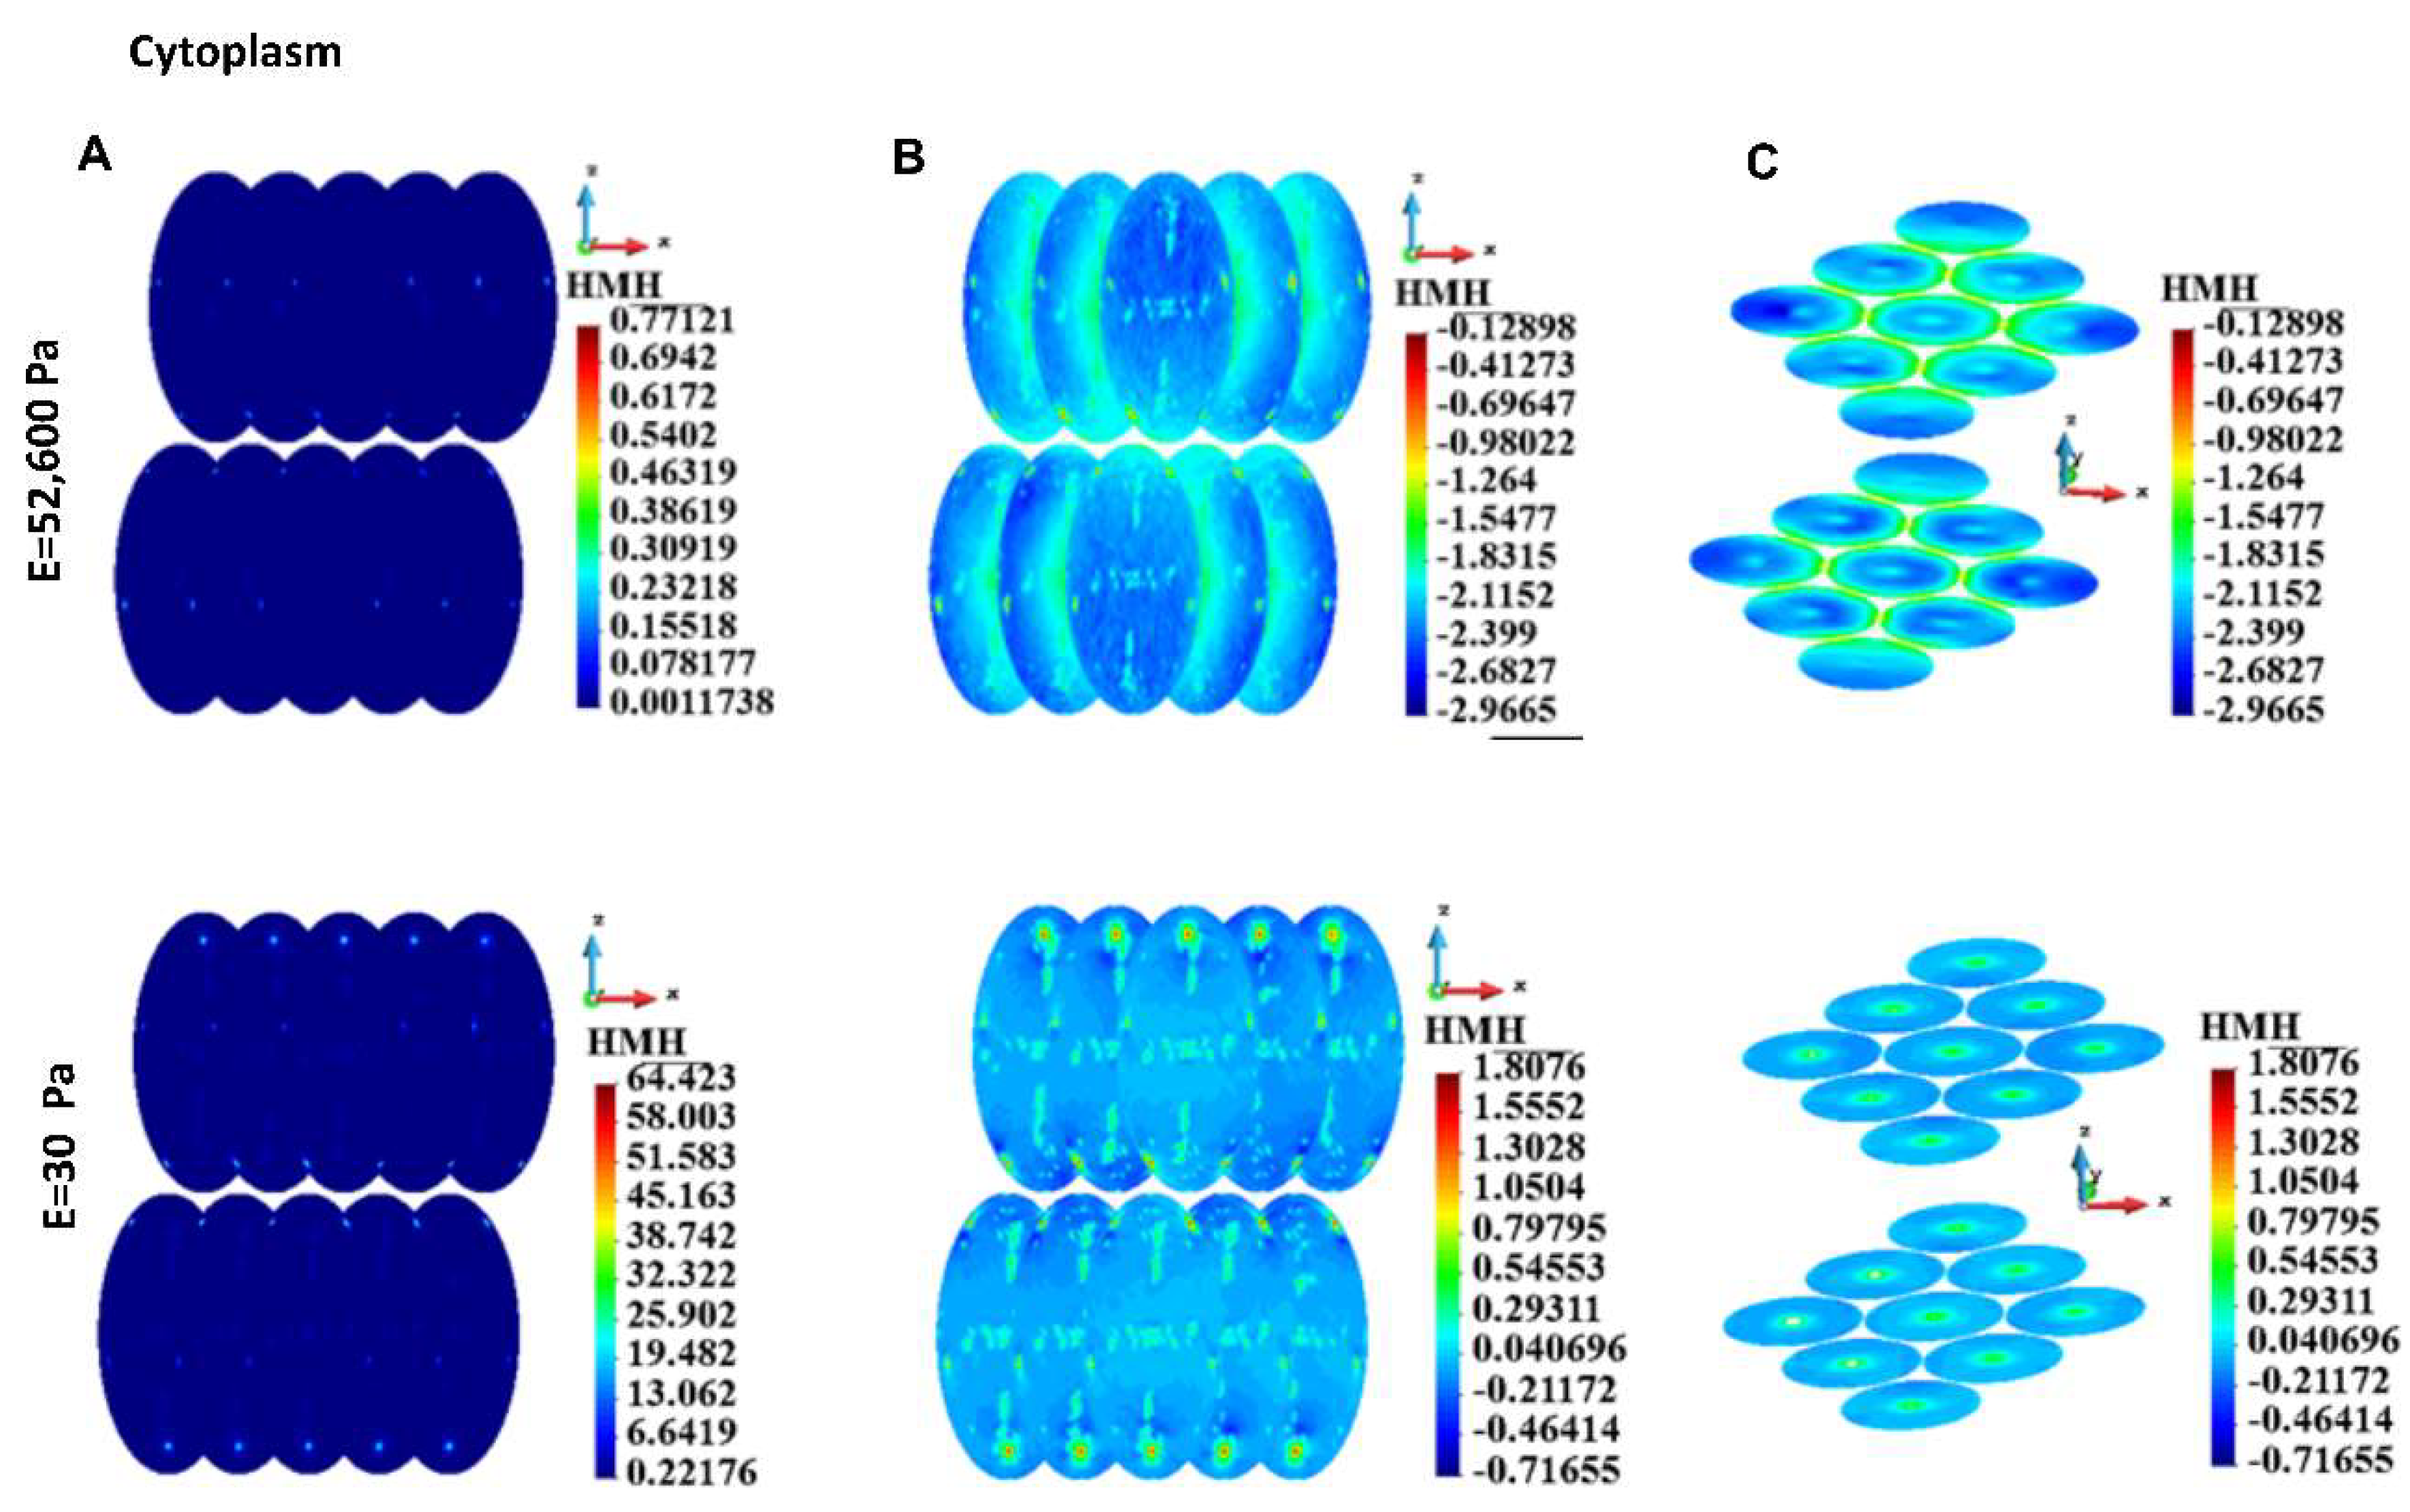
Figure 10.
HMH stress, group of cells, cytoplasm. A. Linear scale, B. Side view, decimal logarithm scale, C. Horizontal cross-section, axonometric view, decimal logarithm scale.
Figure 10.
HMH stress, group of cells, cytoplasm. A. Linear scale, B. Side view, decimal logarithm scale, C. Horizontal cross-section, axonometric view, decimal logarithm scale.
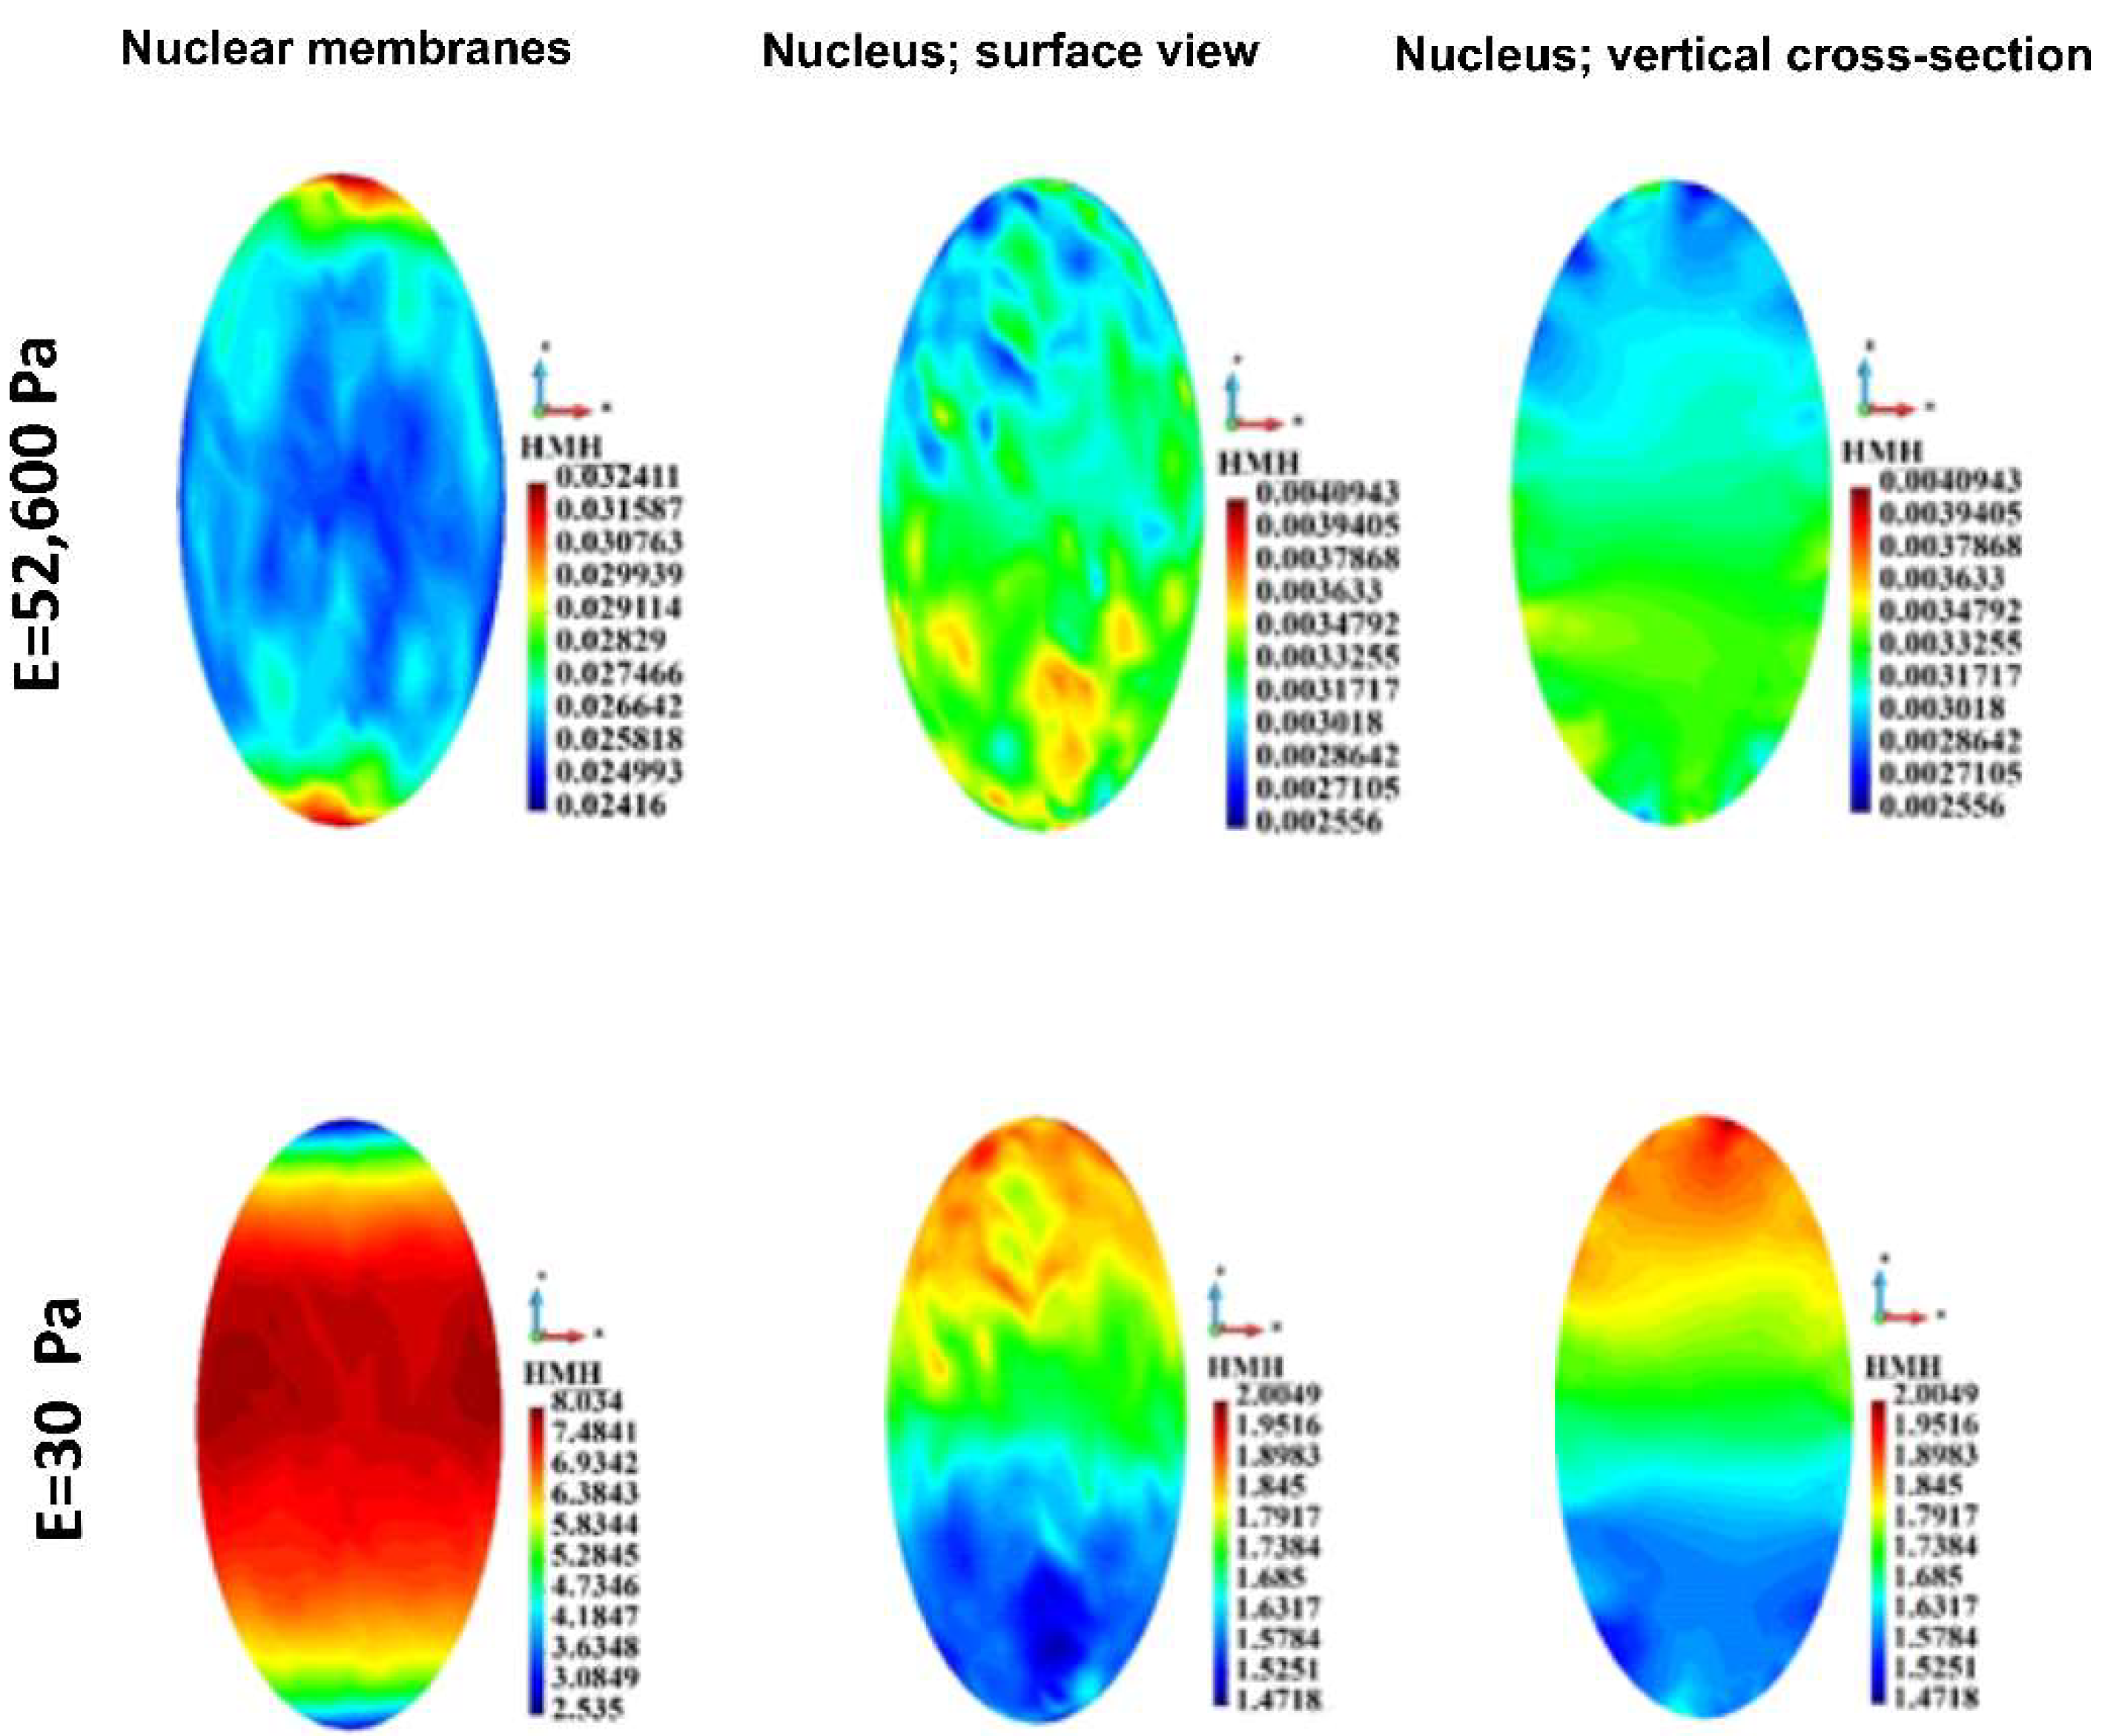
Figure 11.
HMH stress distribution in a single nuclear membrane and the nucleus. Stiff (upper panel) and soft (lower panel) ECM.
Figure 11.
HMH stress distribution in a single nuclear membrane and the nucleus. Stiff (upper panel) and soft (lower panel) ECM.
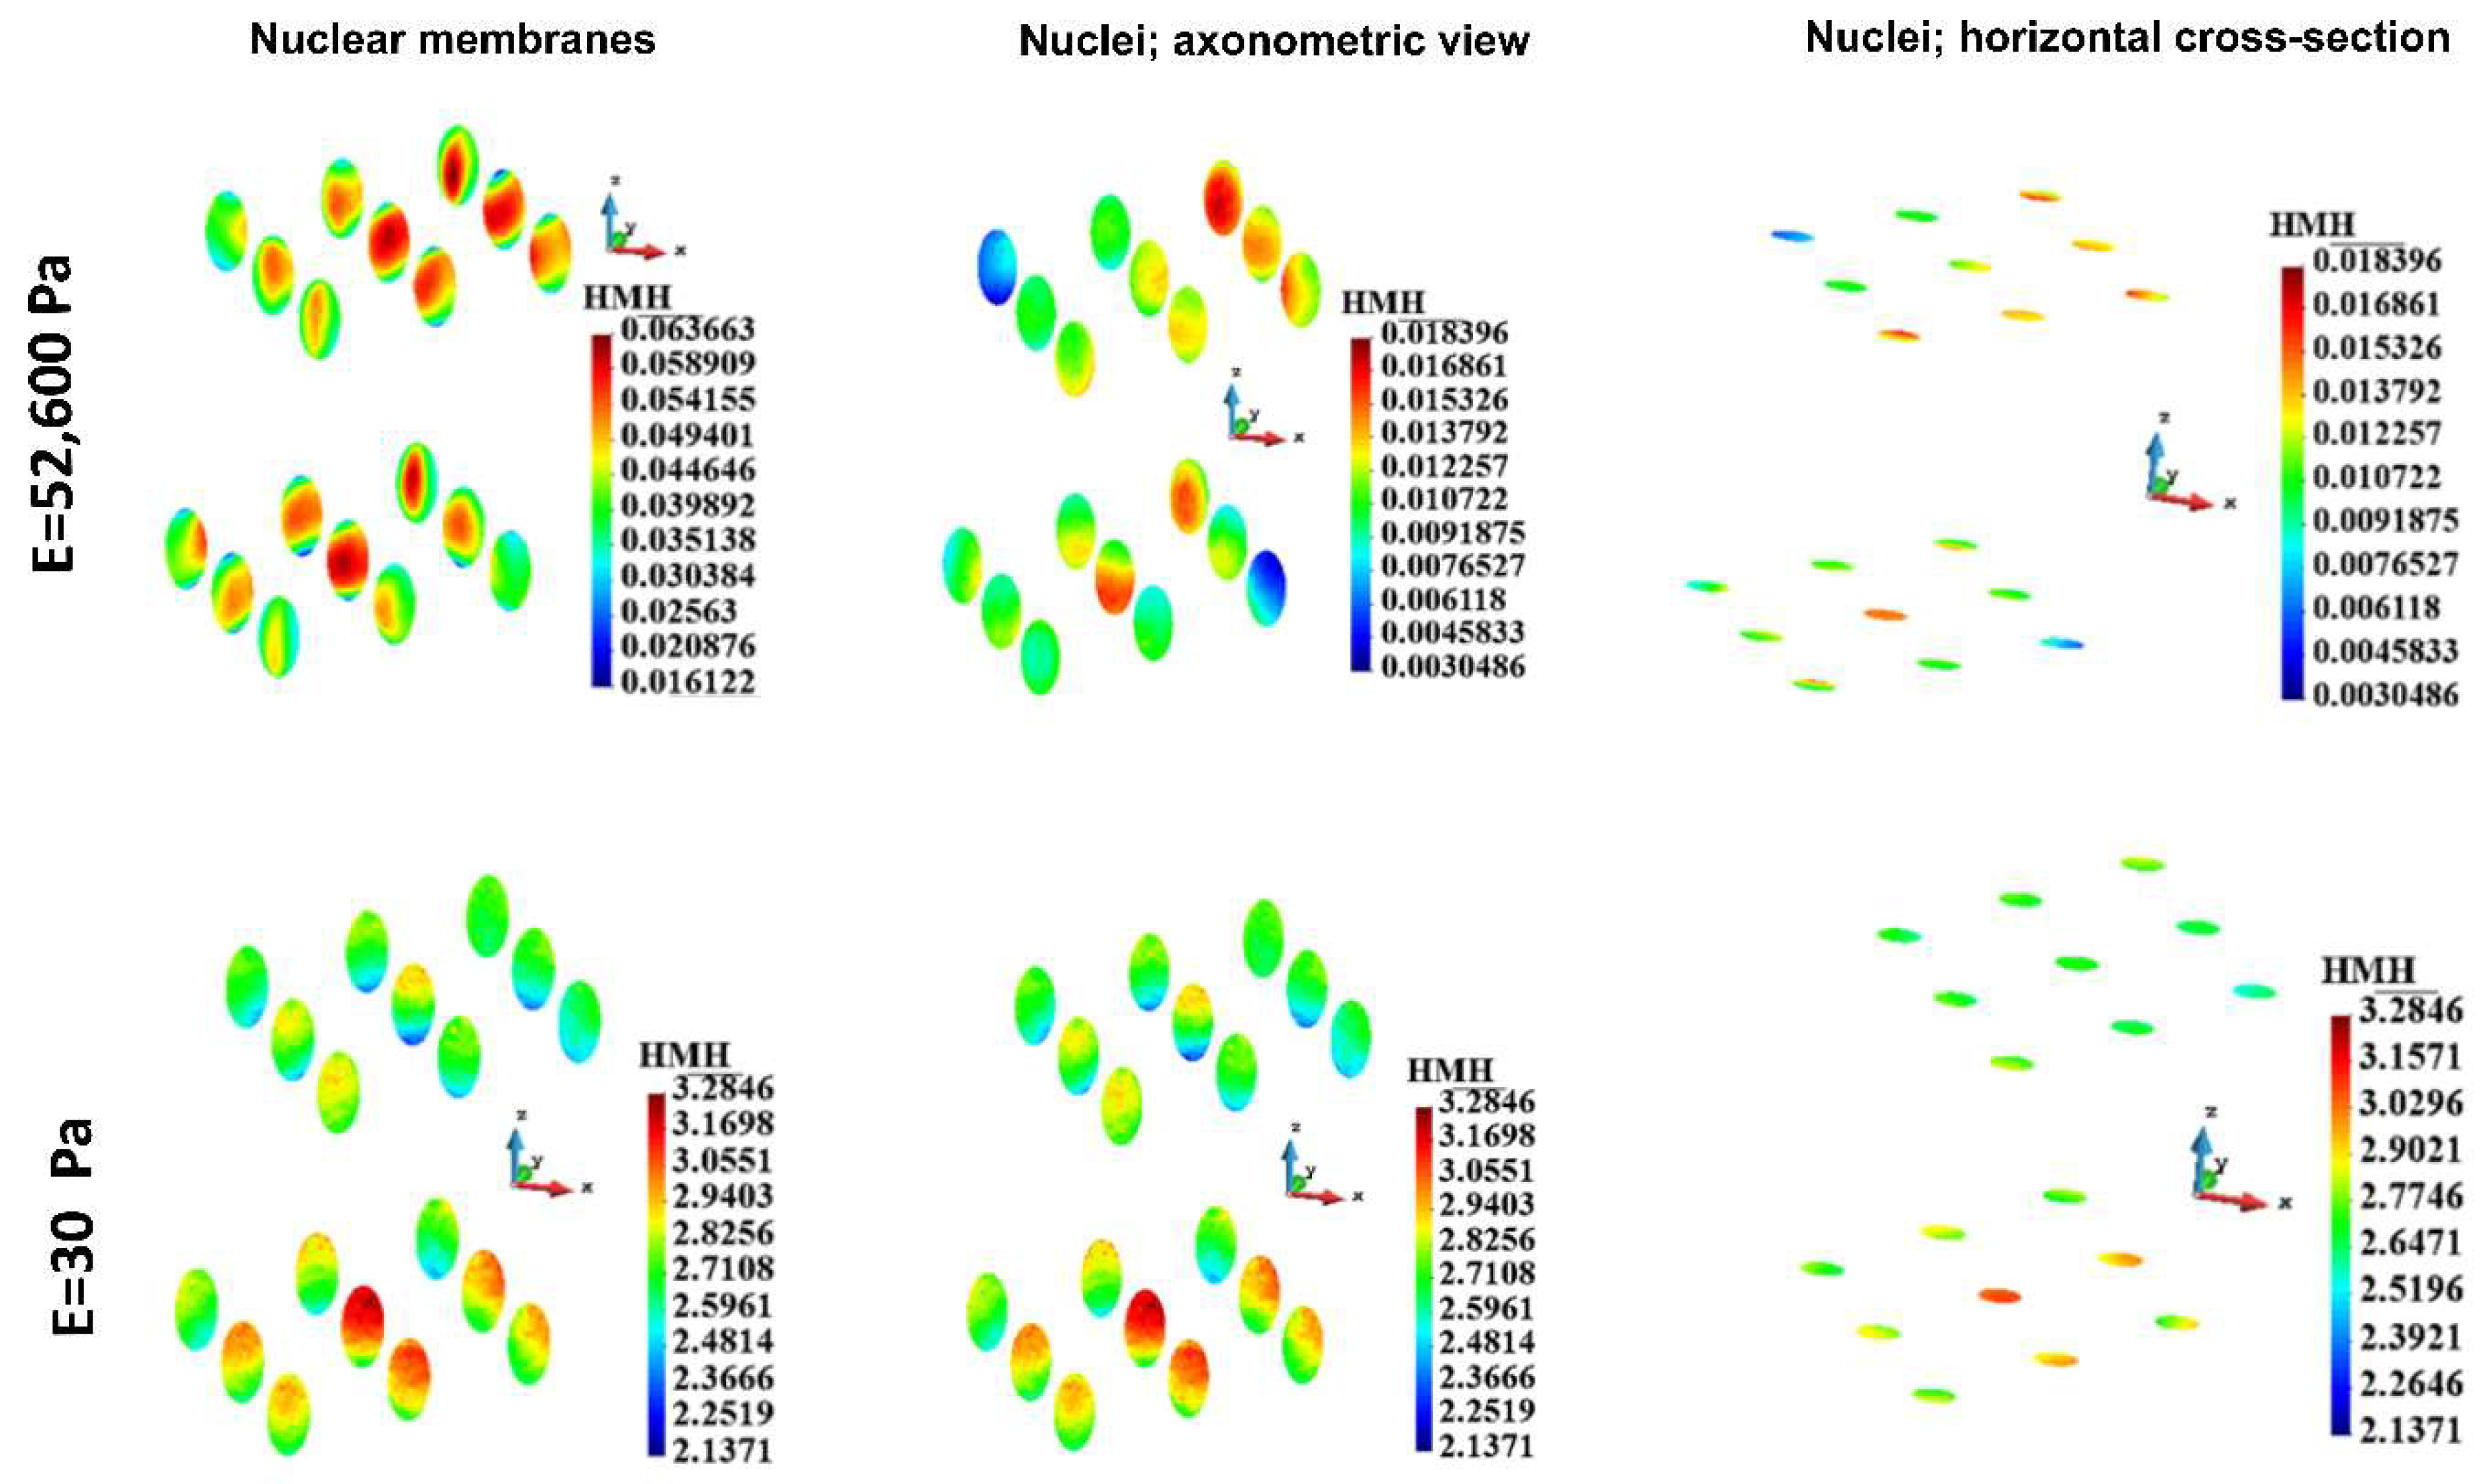
Figure 12.
HMH stress distribution in a nuclear membranes and nuclei for group. Stiff (upper panel) and soft (lower panel) ECM.
Figure 12.
HMH stress distribution in a nuclear membranes and nuclei for group. Stiff (upper panel) and soft (lower panel) ECM.
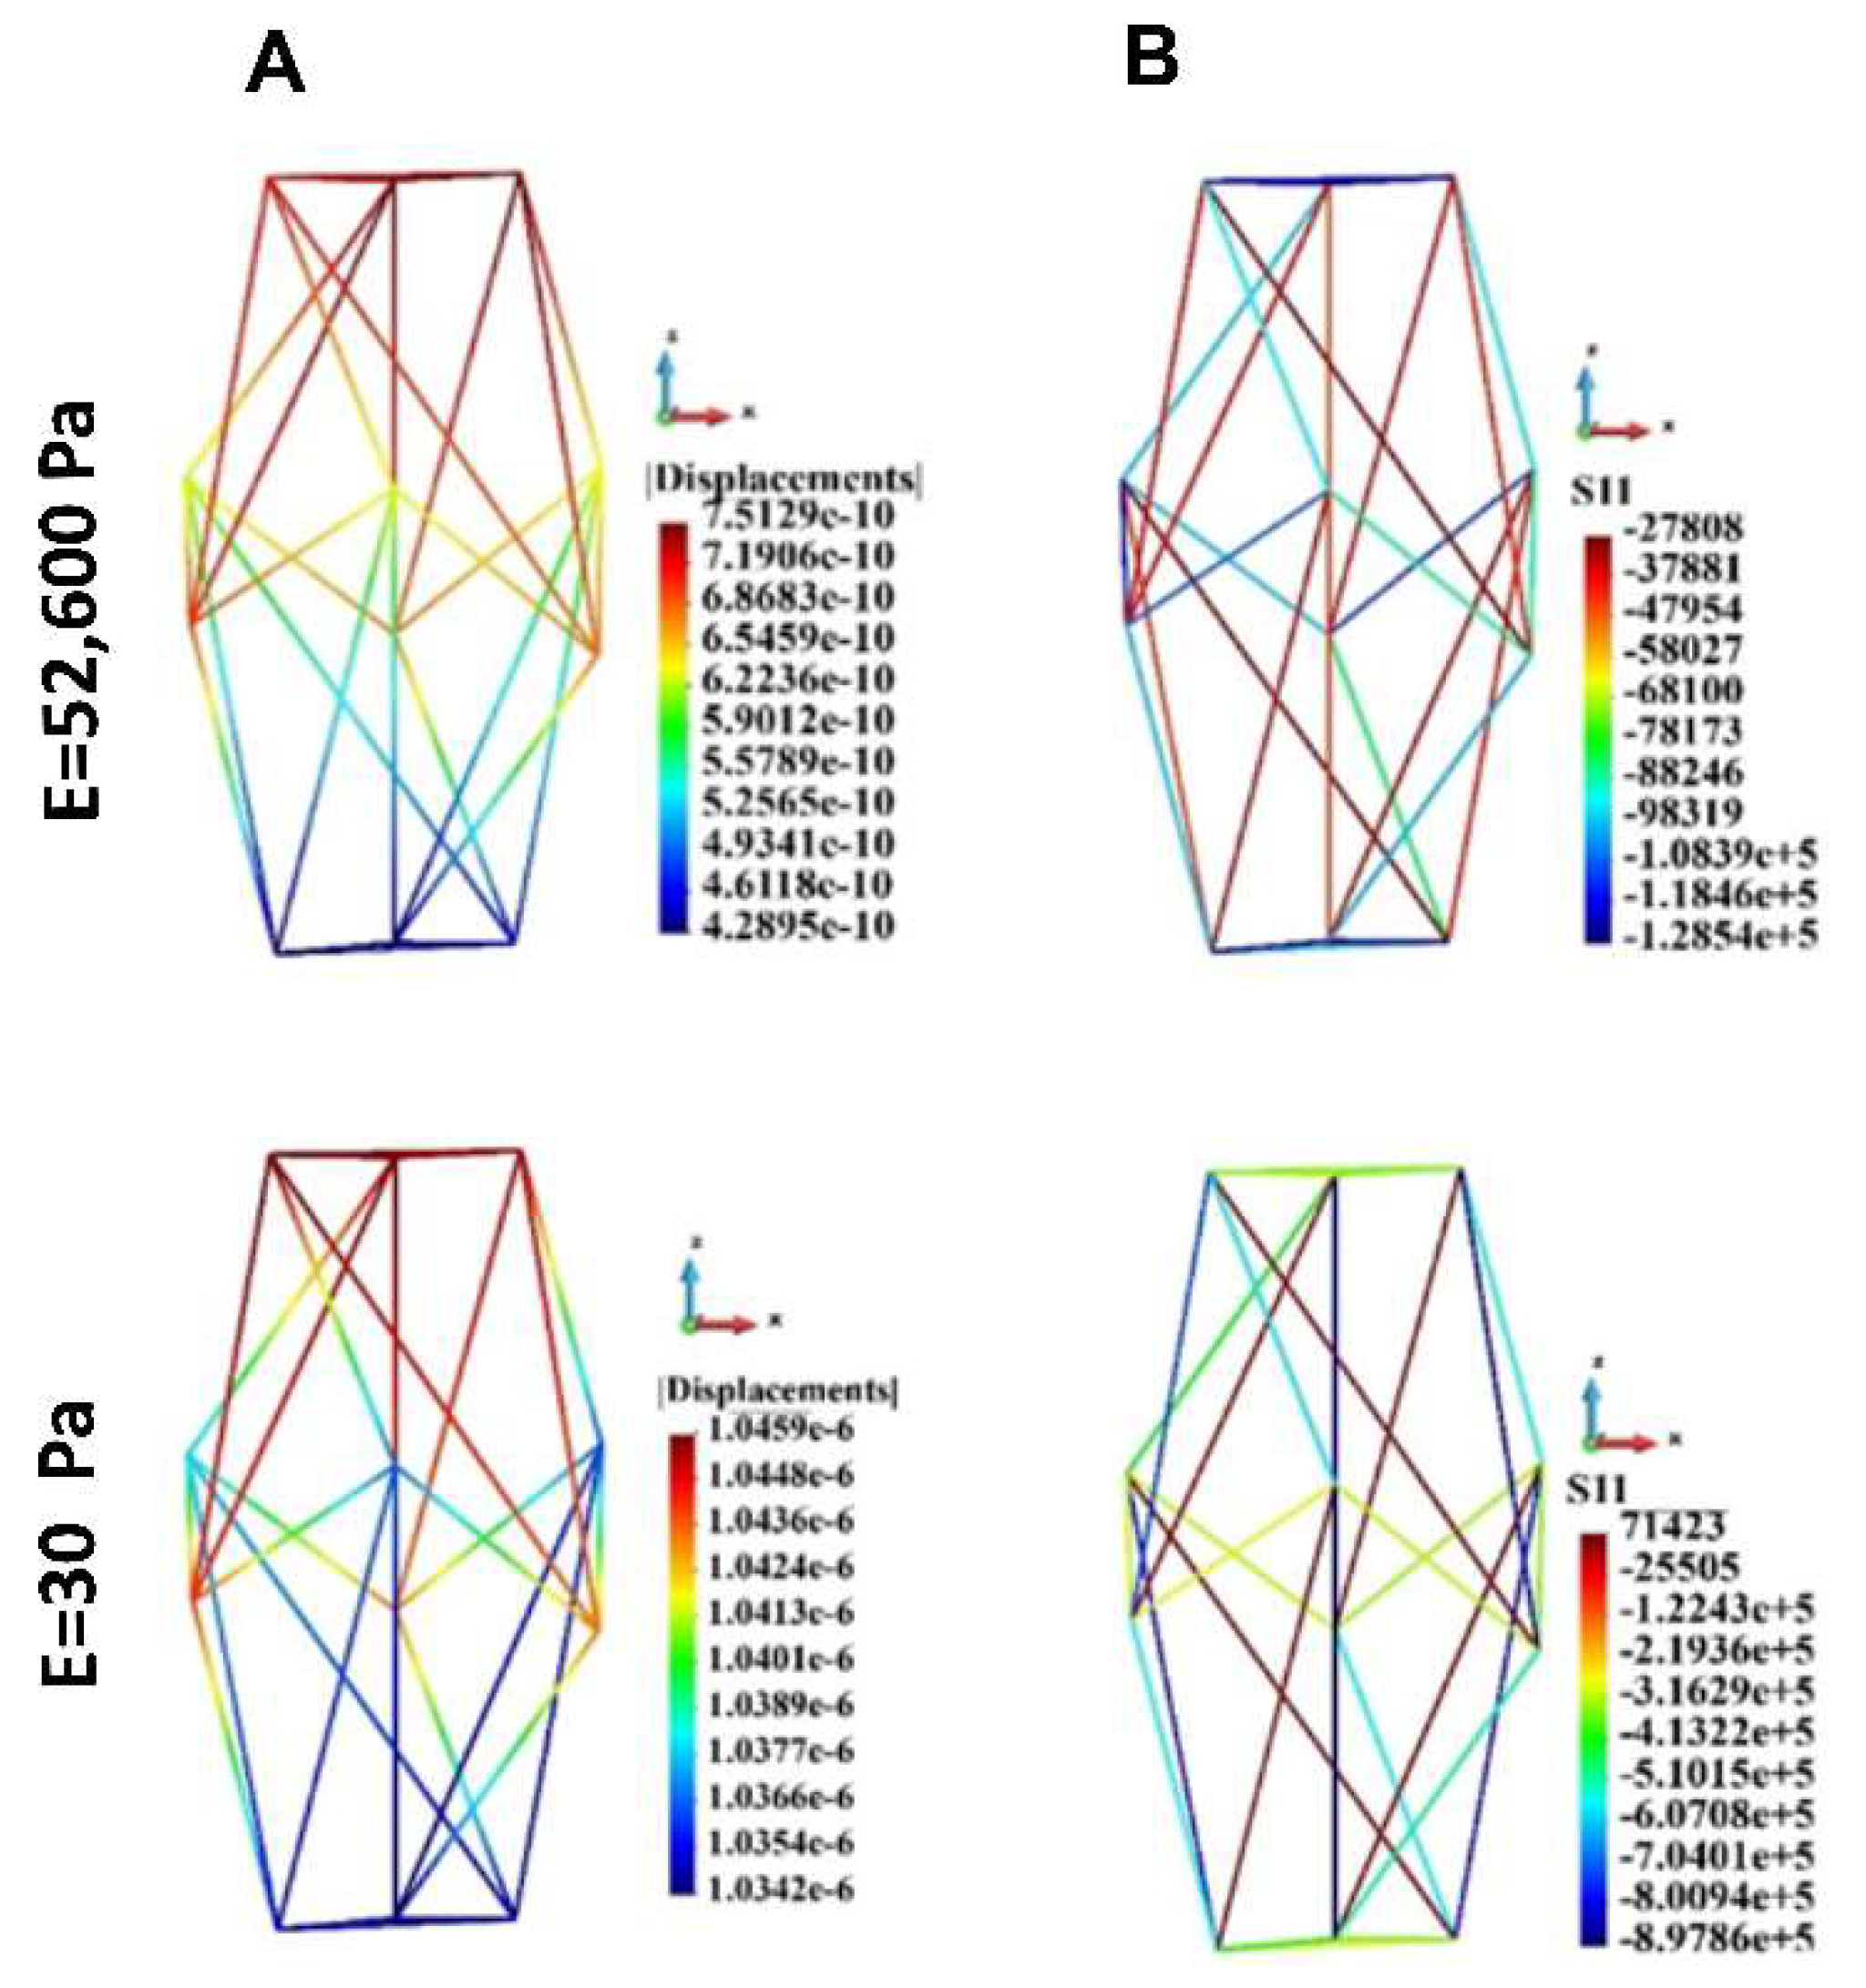
Figure 13.
Cytoskeleton, single cell; displacements and uniaxial stress; A. Displacements, B. uniaxial stress. Stiff (upper panel) and soft (lower panel) ECM.
Figure 13.
Cytoskeleton, single cell; displacements and uniaxial stress; A. Displacements, B. uniaxial stress. Stiff (upper panel) and soft (lower panel) ECM.
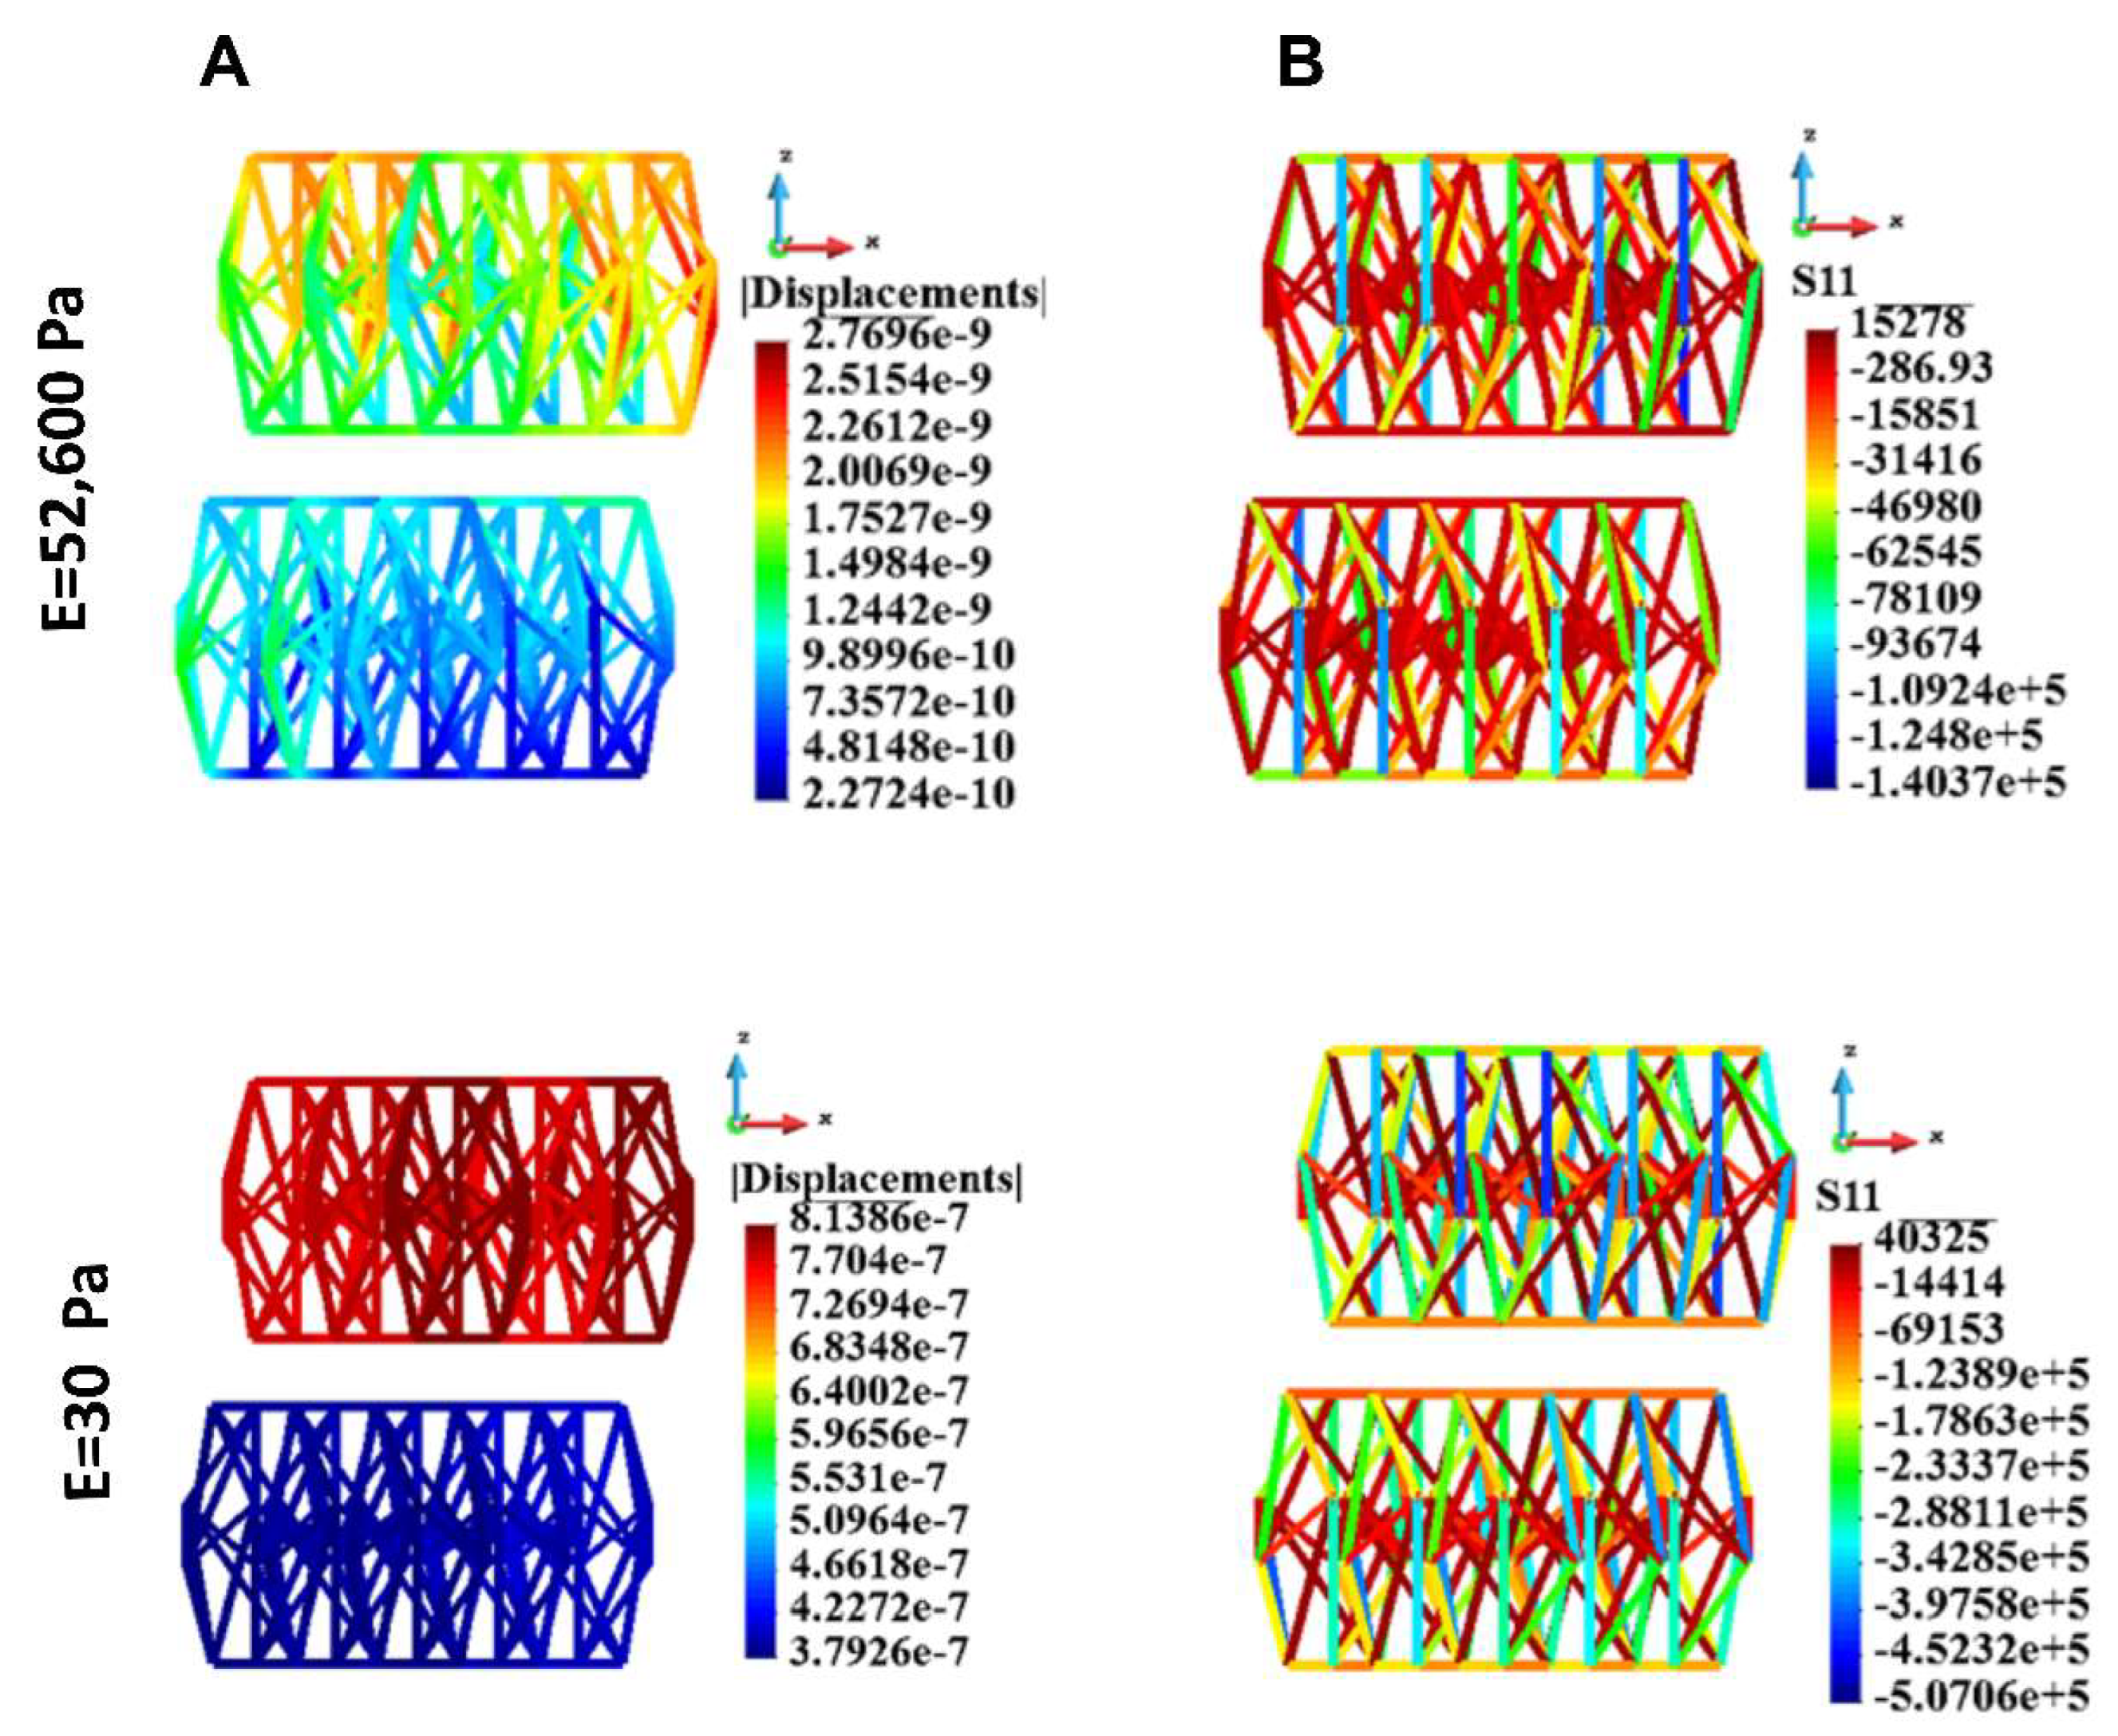
Figure 14.
Cytoskeleton, group of cells; displacements and uniaxial stress; upper panel: stiff ECM, lower panel: soft ECM. A. Displacements, B. uniaxial stress. Stiff (upper panel) and soft (lower panel) ECM.
Figure 14.
Cytoskeleton, group of cells; displacements and uniaxial stress; upper panel: stiff ECM, lower panel: soft ECM. A. Displacements, B. uniaxial stress. Stiff (upper panel) and soft (lower panel) ECM.
Table 1.
Model parameters assigned to the specific elements.
Table 1.
Model parameters assigned to the specific elements.
| Cell element |
Young modulus (E) (Pa) |
Poisson ratio (v) |
Area
(m2) |
Thickness
(m) |
| Actin |
2.6e+09 |
|
18.0e-18 |
|
| Microtubules |
1.2e+09 |
|
190.0e-18 |
|
| Cytoplasm |
100.0 |
0.37 |
|
|
| Nucleus |
400.0 |
0.37 |
|
|
| Cortex |
1000.0 |
0.3 |
|
6.0e-09 |
| Nucleus membrane |
1000.0 |
0.3 |
|
6.0e-09 |
| ECM |
56,200 (stiff)
30.0 Pa (soft) |
0.4777 |
|
|
Table 2.
Maximum HMH stress in ECM.
Table 2.
Maximum HMH stress in ECM.
| Case |
Stiff ECM (Pa) |
Soft ECM (Pa) |
| 1 cell |
9,14 |
4,19 |
| 18 cells |
97,03 |
19,35 |
Table 3.
Maximum HMH stress in cortices.
Table 3.
Maximum HMH stress in cortices.
| Case |
Stiff ECM (Pa) |
Soft ECM (Pa) |
| 1 cell |
0.13 |
96.60 |
| 18 cells |
8.13 |
439.21 |
Table 4.
Maximum HMH stress in cytoplasm.
Table 4.
Maximum HMH stress in cytoplasm.
| Case |
Stiff ECM (Pa) |
Soft ECM (Pa) |
| 1 cell |
0.02 |
13.22 |
| 18 cells |
0.77 |
64,24 |
Table 5.
Maximum HMH stress in nuclei membranes.
Table 5.
Maximum HMH stress in nuclei membranes.
| Case |
Stiff ECM (Pa) |
Soft ECM (Pa) |
| 1 cell |
0.032 |
8.034 |
| 18 cells |
0.063 |
3.28 |
Table 6.
Maximum HMH stress in nuclei.
Table 6.
Maximum HMH stress in nuclei.
| Case |
Stiff ECM (Pa) |
Soft ECM (Pa) |
| 1 cell |
0.04 |
2.00 |
| 18 cells |
0.018 |
3.28 |
Table 7.
Maximal and minimal uniaxial stress.
Table 7.
Maximal and minimal uniaxial stress.
| Case |
Stiff ECM |
Soft ECM |
| |
S11 max |
S11 min |
S11 max |
S11 min |
| 1 cell |
27808.0 |
-1.28E+5 |
71423.0 |
-8.98E+5 |
| 18 cells |
15278.0 |
-1.40E+5 |
40325.0 |
-5.07E+5 |