

Submitted:
16 December 2024
Posted:
17 December 2024
You are already at the latest version
Abstract
There is growing concern regarding the environmental and operational safety aspects of fuel. The result of a physicochemical measurement is the outcome of a series of steps that begin with the sampling process. The information obtained from this step and the contribution from the ana-lytical process define the measurement uncertainty, although most laboratories consider only the analytical contribution as a quality parameter. On the other hand, this variability can be used as vital information to evaluate conformity to the specification. This study aimed to use the uncer-tainty information considering only the analytical uncertainty and, next, the analytical and sam-pling uncertainties in compliance assessment, taking physicochemical measurements of fuel as case studies. The first scenario, which is traditional and focused solely on analytical uncertainty, showed to be less rigorous than the second scenario, which combined sampling uncertainty with analytical uncertainty. The results indicated that for the flash point in jet fuel, the sulfur mass fraction in gasoline-ethanol blends, and the kinematic viscosity in diesel, the risks to consum-ers—first considering only analytical uncertainty and then combining analytical uncertainty with sampling uncertainty—were as follows: 2.6 % and 5.6 %; 4.4 % and 7.1 %; and 1.6 % and 18.9 %, respectively. Since the initial result of each pair is below 5 %, compliance with the specification is suggested. However, when accounting for sampling uncertainty, there is an indication of poten-tial non-compliance with the specification. Therefore, it is concluded that the contribution of uncertainty arising from sampling must be considered in the conformity assessment.
Keywords:
two-way ANOVA with interaction
; ASTM D93
; ASTM D7039
; ASTM D445
; fuel oils
; guard bands
1. Introduction
When burned, fuels are chemical substances that release energy in the form of heat, which can be used to generate mechanical work or heat environments and processes. They are widely used in a variety of applications, including automobiles, industries, building heating, and electricity generation. A fuel's efficiency and effectiveness depend heavily on its physicochemical properties, which determine how it behaves during combustion and its interaction with the systems that use it [1].
Such physicochemical properties are essential to understanding (i) performance: The way a fuel burns, the amount of energy it releases, and its efficiency can vary widely based on its physical and chemical characteristics; (ii) emissions and environmental impact [2]: The chemical properties of a fuel influence the types and amounts of pollutants generated during combustion. For example, fuels with a high sulfur content can release sulfur dioxide, a pollutant that contributes to acid rain; (iii) safety [3]: Knowing a fuel's flash point and flammability characteristics is essential to ensuring its safe handling and storage. More volatile fuels can pose greater risks of fire and explosion; (iv) energy efficiency [4]: The calorific value of a fuel is a direct measure of its ability to generate energy. Fuels with higher calorific value are preferred in applications where efficiency is a priority; (v) system compatibility: Different engines and combustion systems have specific requirements for the fuels they use. For example, diesel engines require fuels with high cetane ratings to ensure efficient combustion; (vi) Regulation and Standards: The physicochemical properties of fuels are often regulated by regulations aimed at reducing emissions and improving air quality. Understanding these properties is therefore crucial to complying with environmental legislation; and (vii) innovation and development of new fuels: As the world seeks more sustainable alternatives, physicochemical properties are becoming fundamental in the research and development of biofuels, synthetic fuels, and other renewable energy sources [5].
In summary, fuels' physicochemical properties define their performance and efficiency and have significant implications for safety, the environment, and technological innovation. An in-depth understanding of these properties is essential for energy industry professionals, engineers, and researchers working on energy-efficient and sustainable solutions.
The flash point temperature indicates how likely a test sample is to create a flammable mixture with air in a controlled lab environment. While it is essential, it is just one of several characteristics to evaluate when determining a material's overall flammability risk. Additionally, flash point values are utilized in shipping and safety guidelines to categorize materials as flammable or combustible. For exact definitions of these categories, one should refer to the specific applicable regulations [6,7].
Certain catalysts utilized in petroleum and chemical refining processes can become ineffective if even small quantities of sulfur-containing substances are present in the feedstocks. The test method for determining total sulfur in fuel is applicable for measuring sulfur levels in both process feeds and finished products, and it can also serve regulatory compliance purposes [8,9,10,11,12,13].
Numerous petroleum products serve as lubricants, and the efficient functioning of machinery relies on using liquids with the right viscosity. Furthermore, the viscosity of various petroleum fuels plays a crucial role in assessing ideal storage, handling, and operational conditions. Therefore, precisely measuring viscosity is vital for meeting several product specifications [14,15,16].
Recent studies have been conducted regarding the importance of controlling these physicochemical properties, such as the implementation of multivariate acceptance thresholds to minimize the overall risk of incorrect conformity decisions in the analysis of automotive fuels [17] to utilize data reconciliation techniques to address the inconsistencies between measurements taken by producers and consumers, facilitating informed decisions about conformity or non-conformity assessments [18]; and applying experimental design for assessing the impact of modifications in the testing procedure for kinematic viscosity of opaque oils [19].
To optimize this production chain, producing fuels close to the specification limit refers to the process of manufacturing fuels that meet exactly or are very close to the standards and norms established for their physical and chemical properties. This is essential to ensure that fuels are safe, efficient and compatible with the engines and systems for which they are intended.
Measurement uncertainty is a crucial tool in monitoring the physicochemical properties of fuels, especially when measurement results are close to specification limits. However, measurement uncertainty is currently considered only analytical uncertainty without considering the contribution from the sampling process.
It is worth highlighting the influence of the sampling procedure on measurement uncertainty related to physicochemical properties in diesel [20]; the findings of three empirical statistical methods, utilizing data obtained from a balanced experimental design that features duplicate samples analyzed twice from 104 petroleum retail stations [21]; the role of the sampling process in the overall uncertainty assessment for high-resolution gamma-ray spectrometry of environmental soil, tap water, and aerosol filter samples [22]; and a robust metrological assessment of trends and relationships among physicochemical parameters across extensive oceanic regions [23].
In recent times, the incorporation of uncertainty data in conformity assessment has become prevalent across various fields of knowledge, including environmental aspects in the concentrations of multiple pollutants [17,24], logistic transactions regarding fuels [18,25], denatured alcohols [26], service to the Brazilian regulatory agency [27], drug and medicine products [28], pharmaceutical products [29], microbiology [30], and radiopharmaceutical activities [31].
Therefore, this study aimed to evaluate two different scenarios. The first scenario, which is traditional, considers only analytical uncertainty, and the second one considers measurement uncertainty, such as sampling uncertainty, in addition to analytical uncertainty. The study evaluated the importance of uncertainty information arising from the sampling process in conformity assessment applied to the physicochemical properties of fuels.
2. Methodology
In this section, we presented the metrological approaches used in this study: uncertainty in measurements due to sampling processes and the application of uncertainty data in compliance evaluations.
2.1. Evaluation of the Uncertainty Arising from the Sampling Process
The approach employed for estimating uncertainty in this study is the duplicate method [32]. To determine the measurement uncertainty, it is essential to stratify both sampling and analytical sources. The variance among targets is set at 10 % for the entire survey, with a sample size range of 8 to 12, with two samples collected from each site that expresses the between-sample variance. Finally, for each of the samples (S1 and S2), two separate measurements (A1 and A2) are to be conducted, between-analysis variance.
In cases where the data follow a normal distribution and are free from outliers, a traditional two-way analysis of variance (ANOVA) employing a two-stage nested design is the statistical method applied [33]. From this ANOVA, estimates of standard deviation for analytical and sampling uncertainty are determined using Eqs. 1 and 2, respectively:
is the estimate of the sampling variance and is the estimate of the analytical variance.
2.2. Measurement Uncertainty as a Parameter in Conformity Assessment
Considering measurement uncertainty allows for reducing risks faced by producers (such as rejecting a conforming item) and risks encountered by consumers (like accepting a nonconforming item).
The acceptance zone is created by narrowing the tolerance interval on both ends using guard bands, denoted as g. This zone is bounded by the upper and lower specification limits (USL and LSL, respectively) and their corresponding acceptance limits. At a significance level of 5 %, each guard band is determined by multiplying the standard uncertainty, by 1.64. The acceptance range can be defined as USL minus and LSL plus emphasizing the risk of false acceptance (consumer risk). Conversely, the acceptance range can also be described as USL plus and LSL minus , highlighting the risk of false rejection (producer risk) [34].
Histograms displayed the most probable value, associated uncertainties (both analytical uncertainty alone and the combination of analytical and sampling uncertainties), guard bands, and lower and upper acceptance limits. In this research, Monte Carlo simulations incorporating 100,000 pseudorandom values for the physicochemical properties of fuels were employed to evaluate the risk to consumers.
3. Material and Methods
This section describes the experimental part, and the test methods utilized.
3.1. Experimental
Analytical and sampling uncertainties were calculated for flash point in jet fuel [6], sulfur mass fraction in gasoline-ethanol blend [8], and kinematic viscosity in diesel [14], Table 1, Table 2 and Table 3, respectively. These physicochemical parameters were gathered and assessed in laboratories within the Brazilian oil industry in 2024.
3.2. Test Methods
A brass test cup, designed to specific measurements, is filled to the marked level with the test sample and sealed with a cover that meets the required dimensions. The cup is then heated, and the specimen is agitated at predetermined speeds according to one of three established methods (A, B, or C). At set intervals, an ignition source is introduced into the cup while stirring is paused, continuing until a flash is observed [6].
A monochromatic X-ray beam, possessing a wavelength that effectively stimulates the K-shell electrons of sulfur, is directed onto a test sample housed within a sample cell. The Kα fluorescence emitted by sulfur at a wavelength of 0.5373 nm is captured by a stationary monochromator (analyzer). The sulfur X-ray intensity, quantified in counts per second, is recorded using an appropriate detector and then translated into sulfur concentration (mg kg-1) in the test sample through an analytical calibration curve [8].
The duration for a specific volume of liquid to pass through the capillary of a calibrated viscometer by the force of gravity is recorded, maintaining a consistent driving head and a carefully regulated temperature. The kinematic viscosity is calculated by multiplying the recorded flow time by the viscometer's calibration constant. Two separate measurements are required to arrive at a reliable kinematic viscosity result, and the final value is the average of these two acceptable results [14].
4. Results and Discussion
This section calculates and discusses analytical and sampling uncertainties and the use of this information in compliance assessment.
4.1. Evaluation of the Analytical and Sampling Uncertainties
The analytical and sampling uncertainties were calculated using two-way ANOVA with interaction and Eqs. (1) and (2), Table 4:
The measurement uncertainty is calculated by the square root of the quadratic sum of the analytical and sampling uncertainties. All of them are expressed as standard deviations, that is, standard uncertainties.
Regarding the flash point in jet fuel, the analytical and sampling uncertainties are of the same order of magnitude. Concerning the sulfur mass fraction in the gasoline-ethanol blend, the contribution of the analytical uncertainty is greater than the contribution of the sampling uncertainty. On the other hand, the contribution of the sampling uncertainty is greater than the contribution of the analytical uncertainty for the kinematic viscosity in diesel.
4.2. Use of Analytical and Sampling Uncertainties Information in Compliance Assessment
The guard bands were calculated based on two scenarios: (i) considering only the analytical uncertainty and (ii) considering the analytical uncertainty plus the uncertainty arising from sampling.
Table 5 provides the mean measurement values, guard bands for a significance level of 5 %) and specification limits.
The acceptance range for jet fuel's flash point was calculated by LSL plus ; however, for the sulfur mass fraction of gasoline-ethanol blend and the kinematic viscosity of diesel, it was calculated by USL minus . Since the sampling uncertainties were not negligible, different acceptance limits were reached, and consequently, distinct decisions regarding the compliance assessments were taken.
Figure 1, Figure 2, Figure 3, Figure 4, Figure 5 and Figure 6 provide the histograms for measurement values, the specification, and guard band limits, considering p(AL)—probability density at the lower acceptance limit; p(AU)—probability density at the upper acceptance limit; AL—lower acceptance limit; AU—upper acceptance limit; TL—lower tolerance limit; TU—upper tolerance limit.
The measured flash point value of the jet fuel was above the lower tolerance limit, suggesting compliance with the specification. Consequently, this presents an estimated consumer risk of 2.6 % associated with this measurement value.
The measured flash point value of the jet fuel was below the lower tolerance limit, indicating non-compliance with the specification. Consequently, this presents an estimated consumer risk of 5.6 % associated with this measurement value.
The measured sulfur mass fraction value of the gasoline-ethanol blend was below the upper tolerance limit, suggesting compliance with the specification. Consequently, this presents an estimated consumer risk of 4.4 % associated with this measurement value.
The measured sulfur mass fraction in the gasoline-ethanol blend was above the upper tolerance limit, indicating non-compliance with the specification. Consequently, this measurement value associated with it presents an estimated consumer risk of 7.1 %.
The measured kinematic viscosity in diesel was below the upper tolerance limit, suggesting compliance with the specification. Consequently, this presents an estimated consumer risk of 1.6 % associated with this measurement value.
The measured kinematic viscosity in diesel was above the upper tolerance limit, indicating non-compliance with the specification. Consequently, this presents an estimated consumer risk of 18.9 % associated with this measurement value.
It was observed that the guard band values were significantly lower without the contribution of uncertainty arising from the sampling process. On the other hand, when the two uncertainty contributions were correctly considered, the guard bands assumed more realistic values, which caused the physicochemical properties of the fuels to be out of specification.
5. Conclusions
This study successfully evaluated two distinct scenarios regarding the information use of uncertainty information in compliance assessment. The first scenario, which is traditional and focused solely on analytical uncertainty, showed to be less rigorous than the second scenario, which incorporated measurement uncertainty, including sampling uncertainty alongside analytical uncertainty. In the three case studies highlighted, the evaluation of physicochemical properties of fuels that were out in the specification was enhanced by including sampling uncertainty, in contrast to the traditional method that only considers analytical uncertainty. This modification revealed that, although the properties appeared to be within specification when assessed solely on analytical uncertainty, they were, in fact, non-compliant.
Future work can develop multivariate acceptance limits to minimize the risk of incorrect conformity decisions in analyzing automotive fuels.
Funding
The author thanks for the financial support provided by the scholarship from the Brazilian agency CNPq (305479/2021-0). This study was financed in part by the Coordenação de Aperfeiçoamento de Pessoal de Nível Superior—Brasil (CAPES)—Finance Code 001.
Institutional Review Board Statement
Not applicable.
Informed Consent Statement
Not applicable.
Data Availability Statement
Data are contained within the article.
Conflicts of Interest
The authors declare no conflict of interest.
References
- Kottakalam, S.; Alkezbari, A.A.; Rottenkolber, G.; Trapp, C. Optical Investigation of Sparks to Improve Ignition Simulation Models in Spark-Ignition Engines. Energies 2024, 17, 4640. [Google Scholar] [CrossRef]
- Chiavola O, Palmieri F, Cavallo DM. On the Increase in the Renewable Fraction in Diesel Blends using Aviation Fuel in a Common Rail Engine. Energies. 2023; 16(12):4624. [CrossRef]
- Paricaud, P.; Ndjaka, A.; Catoire, L. Prediction of the Flash Points of Multicomponent Systems: Applications to Solvent Blends, Gasoline, Diesel, Biodiesels and Jet Fuels. Fuel 2020, 263, 116534. [Google Scholar] [CrossRef]
- Algunaibet, I.M.; Matar, W. The responsiveness of fuel demand to gasoline price change in passenger transport: A case study of Saudi Arabia. Energy Effic. 2018, 11, 1341–1358. [Google Scholar] [CrossRef]
- Denson, M.D.; Manrique, R.; Olarte, M.; Garcia-Perez, M. Energy & Fuels 2024, 38(8), 6982-6991. [CrossRef]
- ASTM International. ASTM D93-20: Standard Test Methods for Flash Point by Pensky-Martens Closed Cup Tester; ASTM International: West Conshohocken, PA, USA, 2020. [Google Scholar]
- ASTM International. ASTM D56-21a: Standard Test Method for Flash Point by Tag Closed Cup Tester; ASTM International: West Conshohocken, PA, USA, 2021. [Google Scholar]
- ASTM D7039-15a. Standard Guide for Determination of Measurement Uncertainty in Chemical Analysis; ASTM International: West Conshohocken, PA, USA, 2020. [Google Scholar]
- ASTM International. ASTM D5453-19a: Standard Test Method for Determination of Total Sulfur in Light Petroleum Products and in Gaseous Fuels by Ultraviolet Fluorescence; ASTM International: West Conshohocken, PA, USA, 2019. [Google Scholar]
- ASTM International. ASTM D2622-21: Standard Test Method for Sulfur in Petroleum Products by Wavelength Dispersive X-Ray Fluorescence Spectrometry; ASTM International: West Conshohocken, PA, USA, 2021. [Google Scholar]
- ASTM International. ASTM D7220-12(2017): Standard Test Method for Sulfur in Automotive, Heating, and Jet Fuels by Monochromatic Energy Dispersive X-ray Fluorescence Spectrometry; ASTM International: West Conshohocken, PA, USA, 2017. [Google Scholar]
- ASTM International. ASTM D4294-21: Standard Test Method for Sulfur in Petroleum and Petroleum Products by Energy Dispersive X-Ray Fluorescence Spectrometry; ASTM International: West Conshohocken, PA, USA, 2021. [Google Scholar]
- ASTM International. ASTM D1266-18: Standard Test Method for Sulfur in Petroleum Products (Lamp Method); ASTM International: West Conshohocken, PA, USA, 2018. [Google Scholar]
- ASTM International. ASTM D445-24: Standard Test Method for Kinematic Viscosity of Transparent and Opaque Liquids (and Calculation of Dynamic Viscosity); ASTM International: West Conshohocken, PA, USA, 2024. [Google Scholar]
- ASTM International. ASTM D7945-21: Standard Test Method for Kinematic Viscosity of Transparent and Opaque Liquids (and Calculation of Dynamic Viscosity); ASTM International: West Conshohocken, PA, USA, 2021. [Google Scholar]
- ASTM International. ASTM D7279-16: Standard Test Method for the Determination of Kinematic Viscosity of Transparent and Opaque Liquids; ASTM International: West Conshohocken, PA, USA, 2016. [Google Scholar]
- De Oliveira, E.C.; Lourenço, F.R. Risk of false conformity assessment applied to automotive fuel analysis: A multiparameter approach. Chemosphere 2021, 263, 128265. [Google Scholar] [CrossRef] [PubMed]
- De Oliveira, E.C.; Lourenço, F.R. Data reconciliation applied to the conformity assessment of fuel products. Fuel 2021, 300, 120936. [Google Scholar] [CrossRef]
- de Camargo, M.A.C.; Manea, G.K.B.; de Oliveira, E.C. Design of Experiments for Evaluating the Relevance of Change in Test Method for Kinematic Viscosity of Opaque Oils. Metrology 2024, 4, 15–23. [Google Scholar] [CrossRef]
- de Jesus Leite, V.; de Oliveira, E.C.; Aucélio, R.Q. Impact of the Sampling Process on the Measurement Uncertainty, a Case Study: Physicochemical Parameters in Diesel. Accred. Qual. Assur. 2021, 26, 1–9. [Google Scholar] [CrossRef]
- Theodorou, D.; Liapis, N.; Zannikos, F. Estimation of Measurement Uncertainty Arising from Manual Sampling of Fuels. Talanta 2013, 105, 360–365. [Google Scholar] [CrossRef] [PubMed]
- Glavič-Cindro, D.; Hazou, E.; Korun, M. Measurement Uncertainty Arising from Sampling of Environmental Samples. Appl. Radiat. Isot. 2020. [Google Scholar] [CrossRef] [PubMed]
- Borges, C.; Palma, C.; Bettencourt da Silva, R.J.N. Evaluation of Temporal Trends and Correlations of Physical-Chemical Parameters in Vast Oceanic Areas Robust to Information Uncertainty. Chemosphere 2023, 314, 137597. [Google Scholar] [CrossRef] [PubMed]
- Pennecchi, F.R.; Kuselman, I.; da Silva, R.J.N.B.; Hibbert, D.B. Risk of a false decision on conformity of an environmental compartment due to measurement uncertainty of concentrations of two or more pollutants. Chemosphere 2018, 202, 165–176. [Google Scholar] [CrossRef] [PubMed]
- Reis Medeiros, K. A.; da Costa, L. G.; Bifano Manea, G. K., de Moraes Maciel, R., Caliman, E., da Silva, M. T., … de Oliveira, E. C. (2023). Determination of Total Sulfur Content in Fuels: A Comprehensive and Metrological Review Focusing on Compliance Assessment. Critical Reviews in Analytical Chemistry, 1–11. [CrossRef]
- Kuselman, I.; Pennecchi, F.; Bettencourt da Silva, R.J.N.; Brynn Hibbert, D. Conformity assessment of multicomponent materials or objects: Risk of false decisions due to measurement uncertainty—A case study of denatured alcohols. Talanta 2017, 164, 189–195. [Google Scholar] [CrossRef] [PubMed]
- De Oliveira, E.C. Use of Measurement Uncertainty in Compliance Assessment with Regulatory Limits. Braz. J. Anal. Chem. 2020, 7, 1–2. [Google Scholar] [CrossRef]
- Separovic, L.; Simabukuro, R.S.; Couto, A.R.; Bertanha, M.L.G.; Dias, F.R.S.; Sano, A.Y.; Caffaro, A.M.; Lourenço, F.R. Measurement Uncertainty and Conformity Assessment Applied to Drug and Medicine Analyses—A Review. Crit. Rev. Anal. Chem. 2023, 53, 123–138. [Google Scholar] [CrossRef] [PubMed]
- Simabukuro, R.; Jeong, N.A.; Lourenço, F.R. Application of Measurement Uncertainty on Conformity Assessment in Pharmaceutical Drug Products. J. AOAC Int. 2021, 104, 585–591. [Google Scholar] [CrossRef] [PubMed]
- Dias, F.R.S.; Lourenço, F.R. Measurement uncertainty evaluation and risk of false conformity assessment for microbial enumeration tests. J. Microbiol. Methods 2021, 189, 106312. [Google Scholar] [CrossRef] [PubMed]
- Carvalheira, L.; Lopes, J.M.; Fernandes de Aguiar, P.; Oliveira, E. C. Compliance assessment when radioactive discharges are close to exemption levels in nuclear medicine facilities. Radiat. Phys. Chem. 2023 203.
- Ramsey, M.H.; Ellison, S.L.R. Measurement Uncertainty Arising from Sampling: A Guide to Methods and Approaches, 2nd ed.; Eurachem/CITAC Guide; Eurachem: 2019.
- Miller, J.N.; Miller, J.C. Statistics and Chemometrics for Analytical Chemistry, 6th ed.; Pearson Education Limited: Harlow, UK, 2018. [Google Scholar]
- Ellison, S.L.R.; Williams, A. (Eds.) EURACHEM/CITAC Guide: Use of Uncertainty Information in Compliance Assessment; EURACHEM: 2021. Accessed 20 November 2024. Available online: https://www.eurachem.org/index.php/publications/guides.
Figure 1.
Histogram for 5 % significance level, flash point in jet fuel, considering only the analytical uncertainty.
Figure 1.
Histogram for 5 % significance level, flash point in jet fuel, considering only the analytical uncertainty.
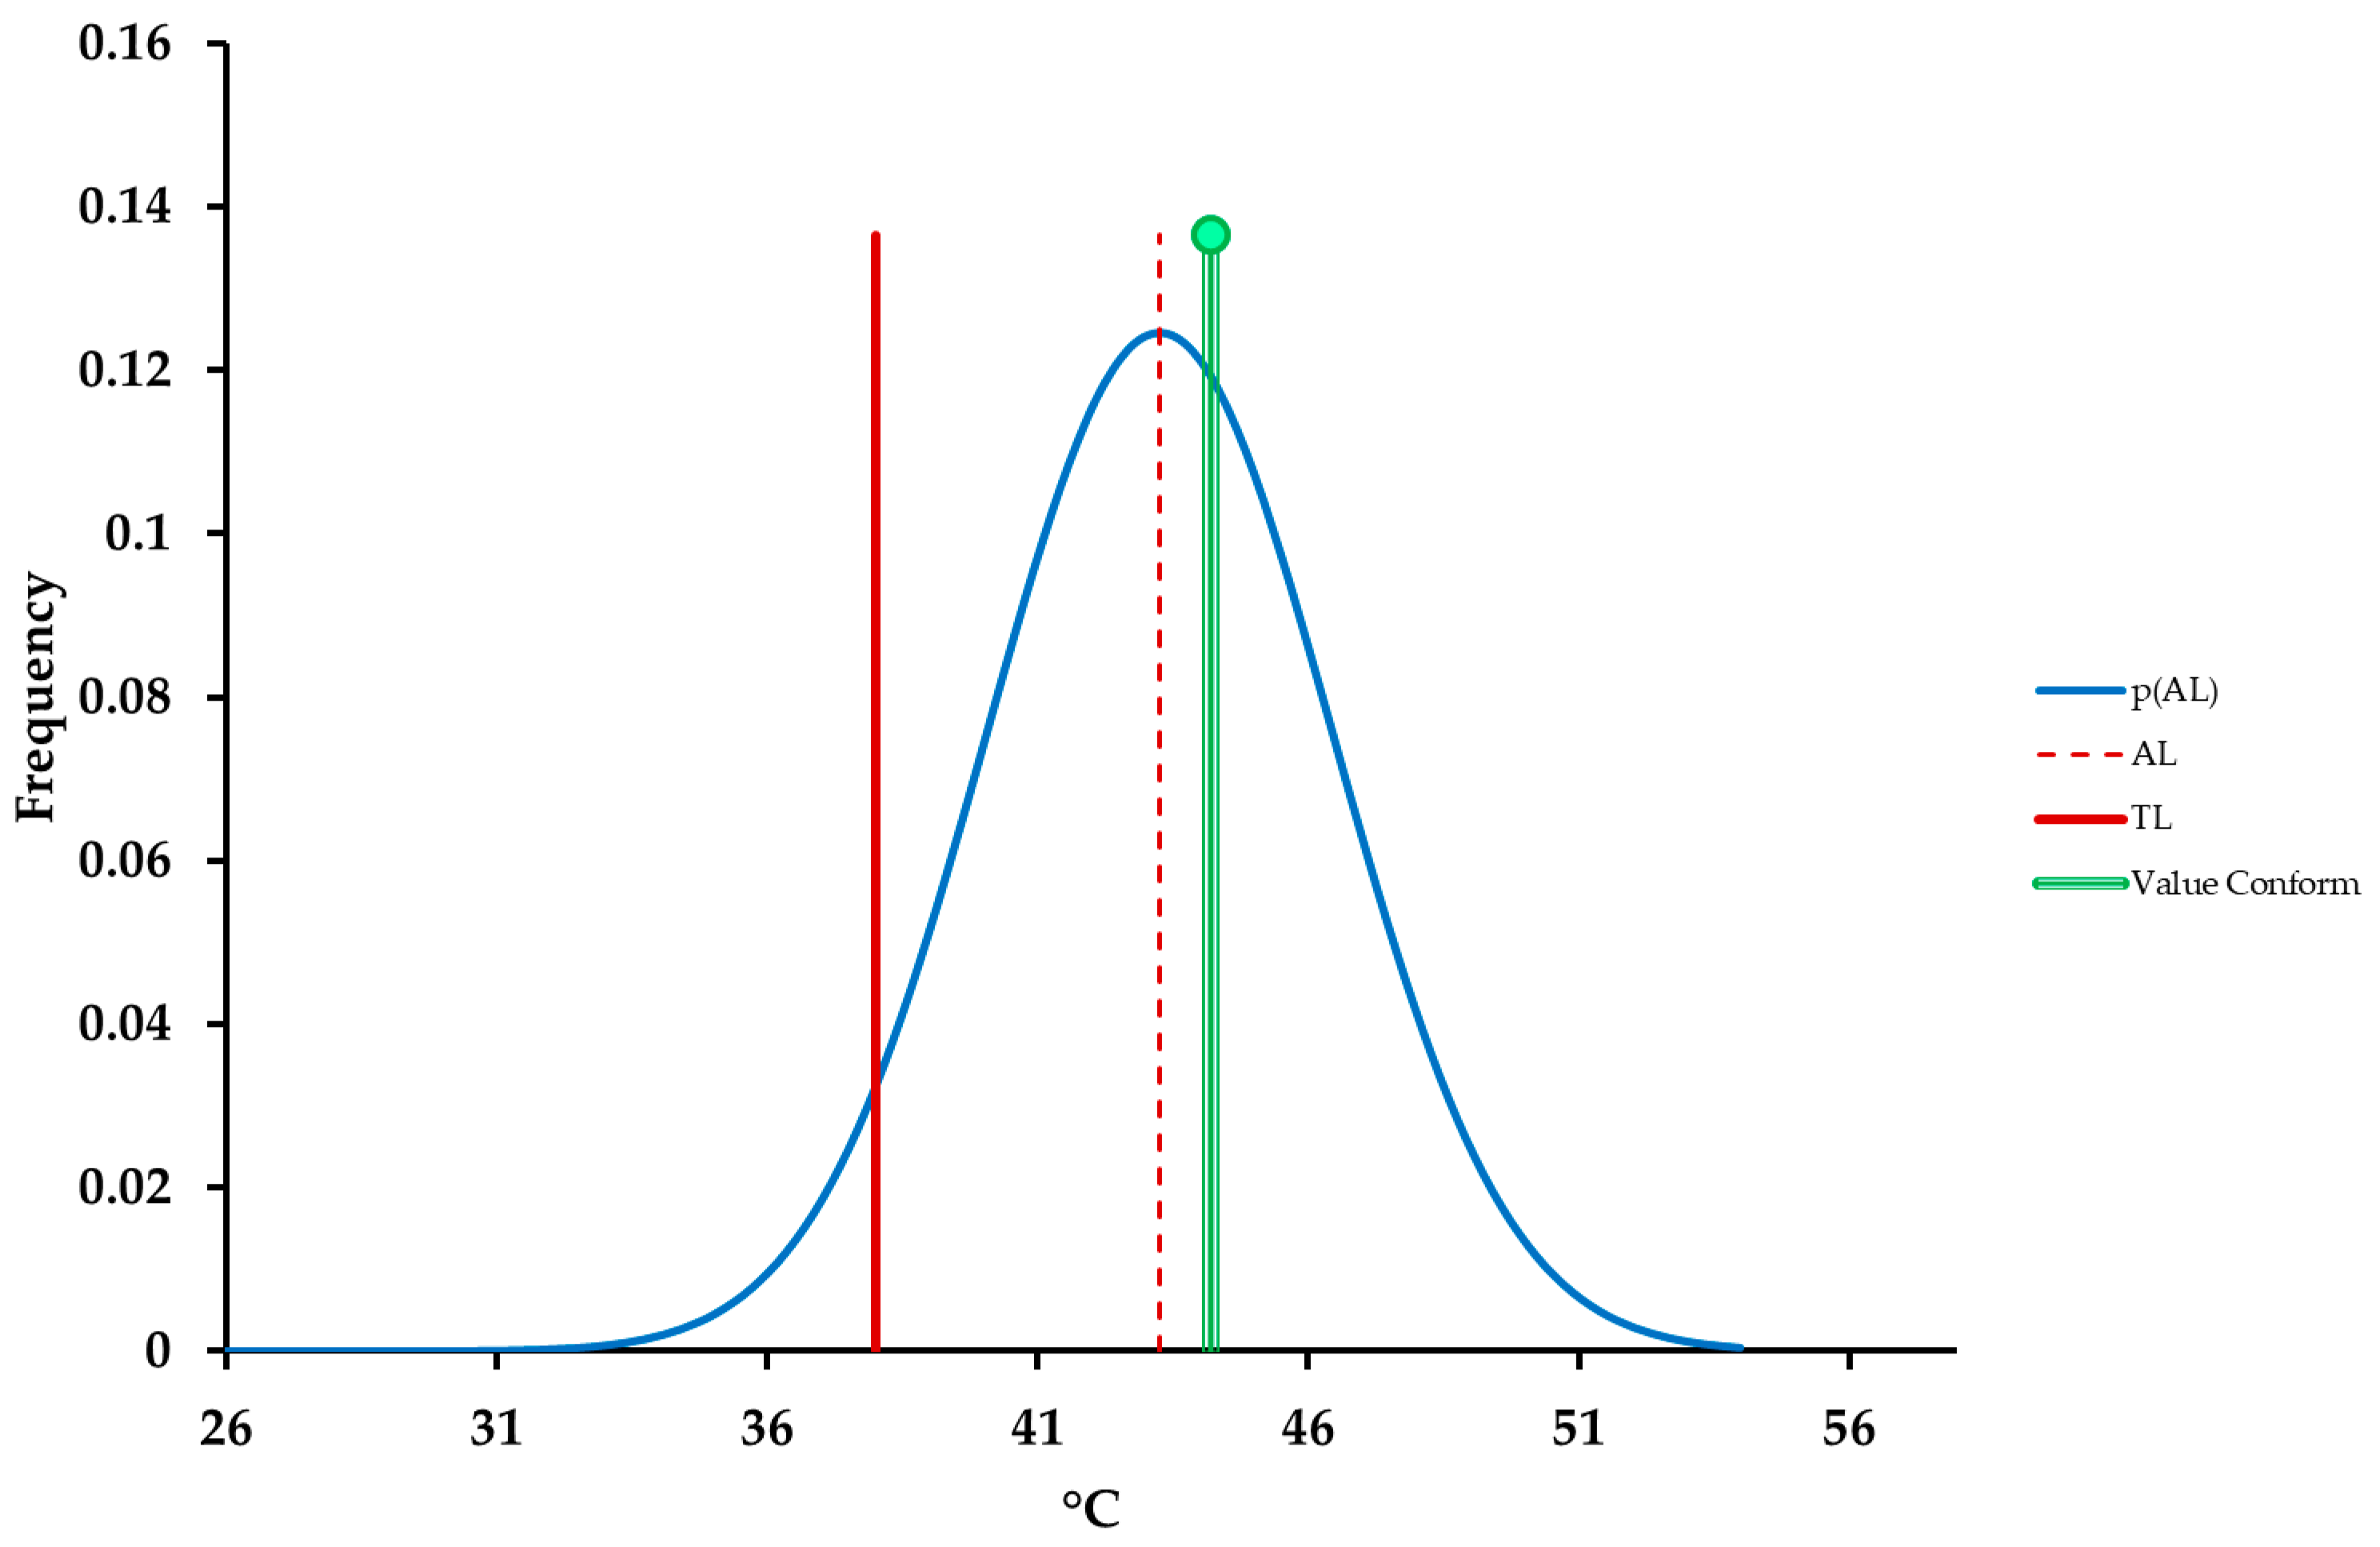
Figure 2.
Histogram for 5 % significance level, flash point in jet fuel, considering the analytical uncertainty plus the uncertainty arising from sampling.
Figure 2.
Histogram for 5 % significance level, flash point in jet fuel, considering the analytical uncertainty plus the uncertainty arising from sampling.
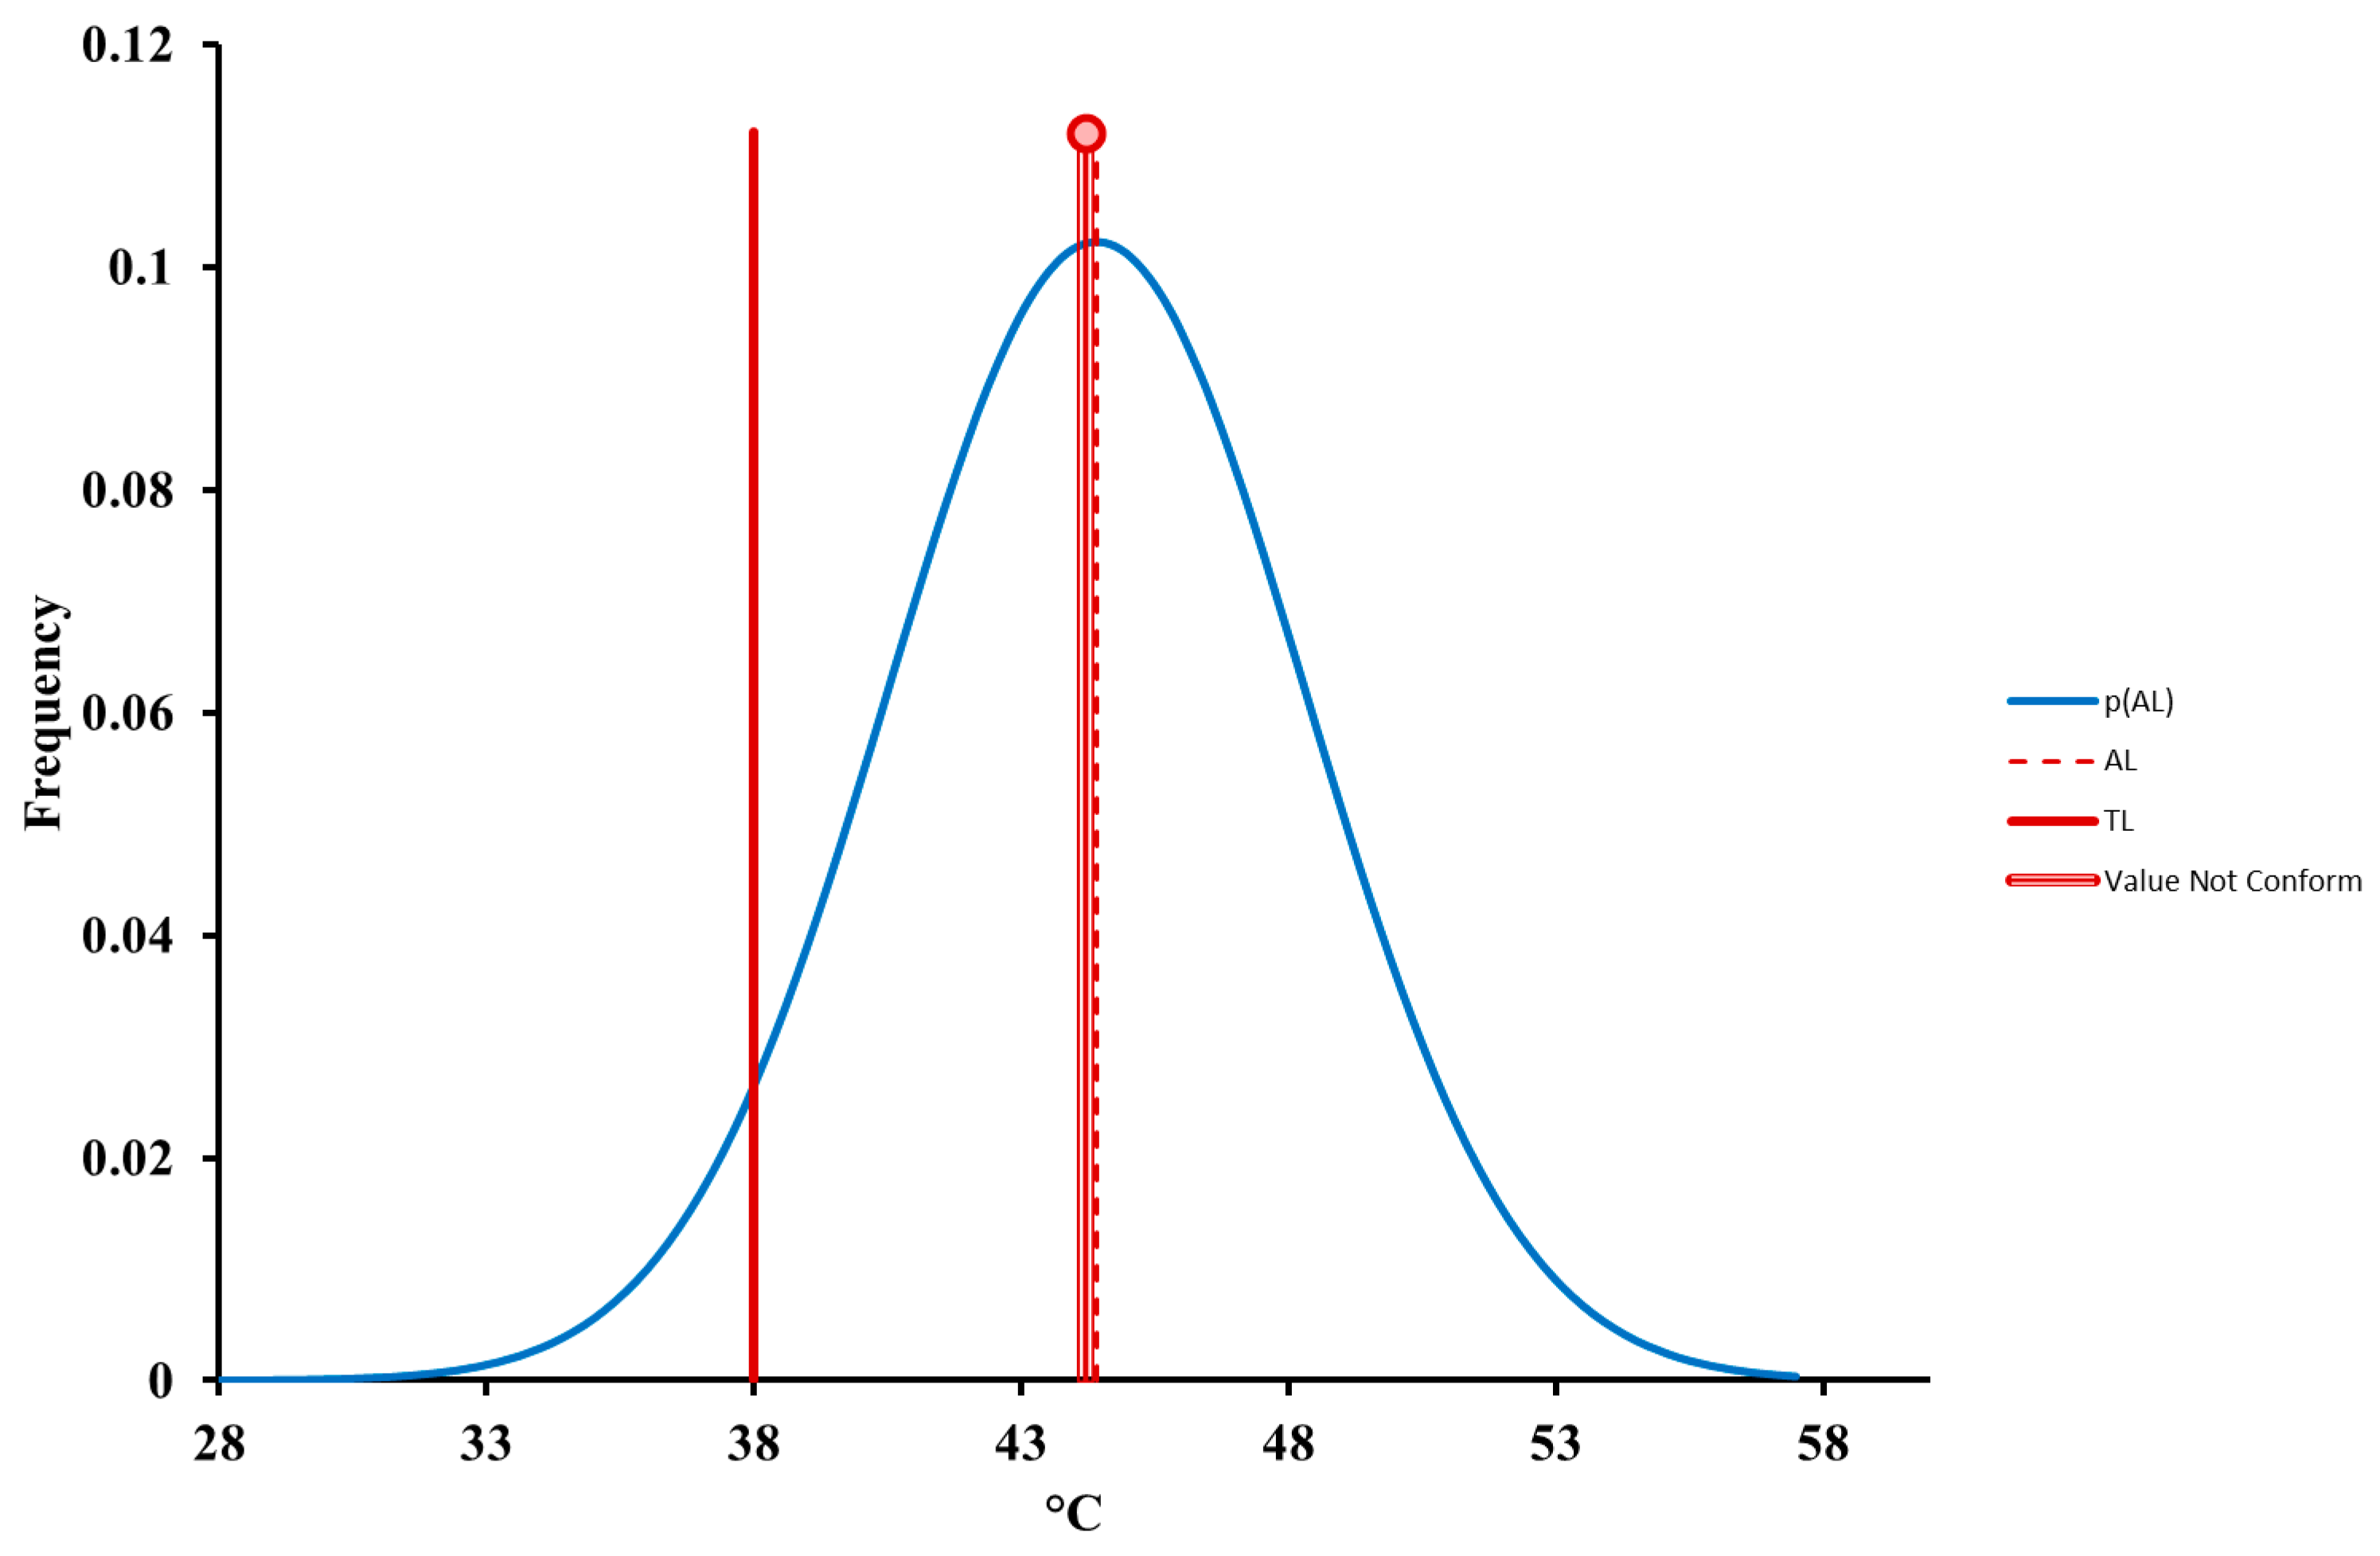
Figure 3.
Histogram for 5 % significance level, sulfur mass fraction in gasoline-ethanol blend, considering only the analytical uncertainty.
Figure 3.
Histogram for 5 % significance level, sulfur mass fraction in gasoline-ethanol blend, considering only the analytical uncertainty.
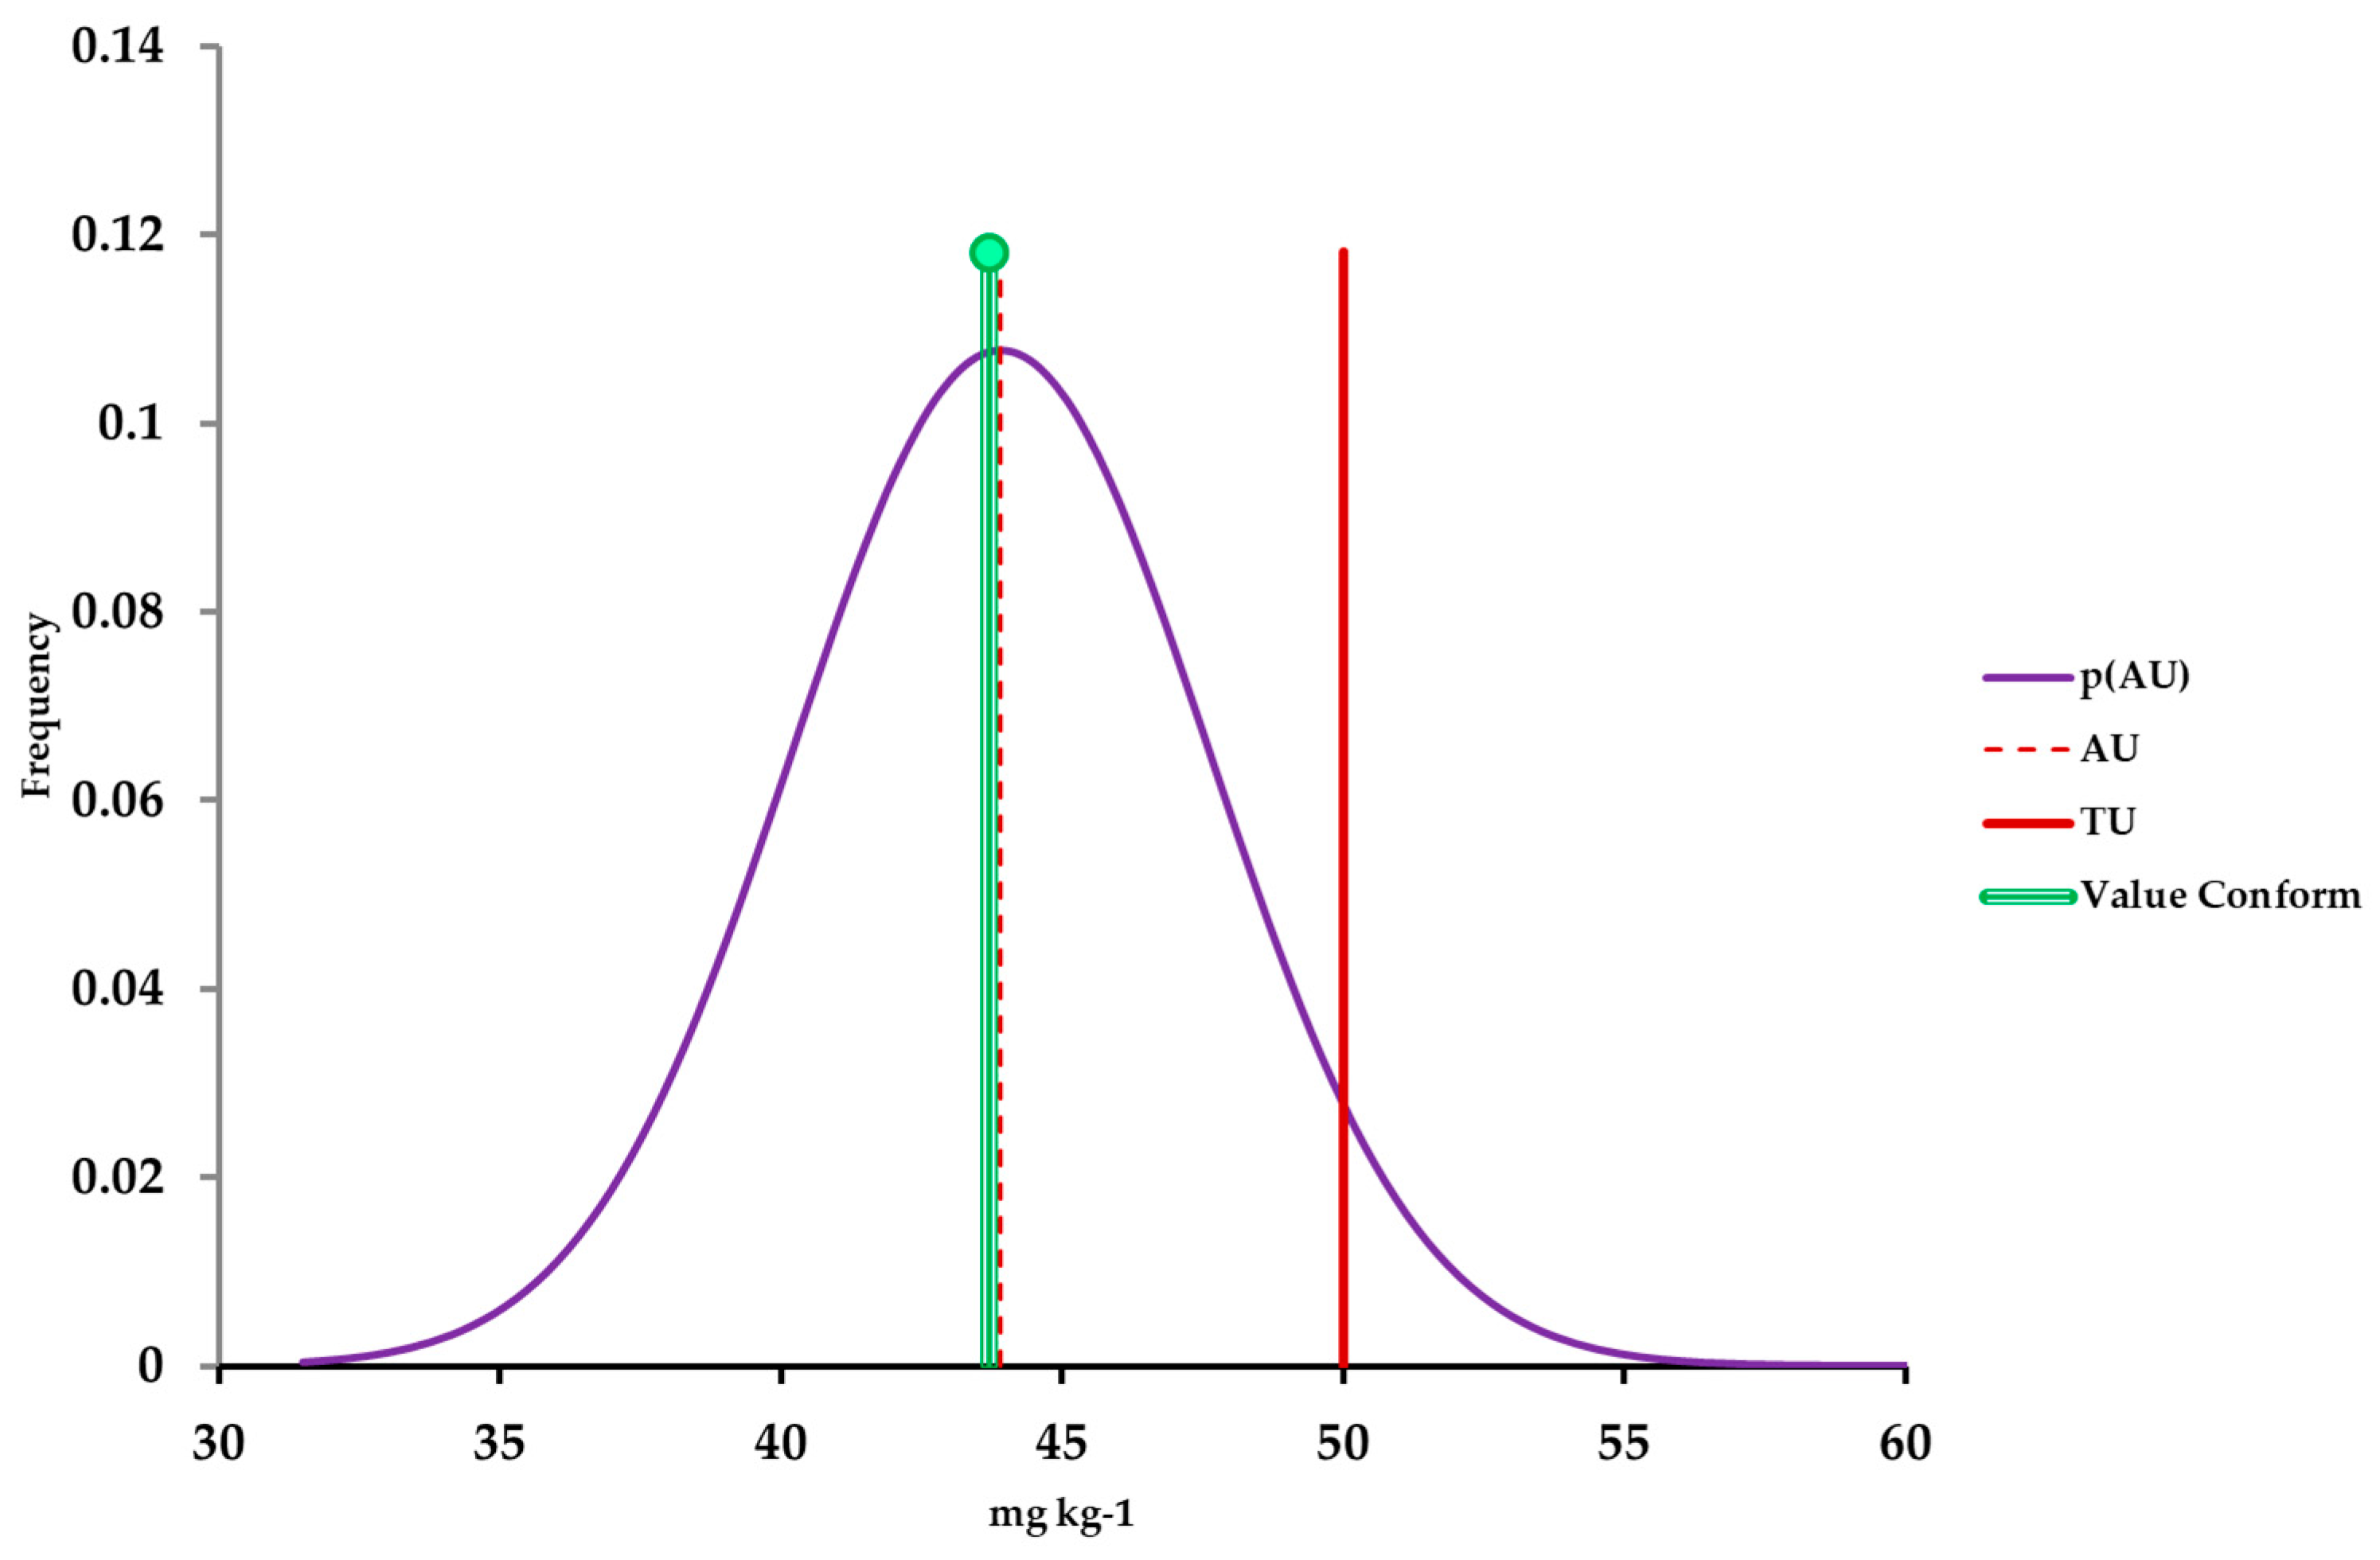
Figure 4.
Histogram for 5 % significance level, sulfur mass fraction in gasoline-ethanol blend, considering the analytical uncertainty plus the uncertainty arising from sampling.
Figure 4.
Histogram for 5 % significance level, sulfur mass fraction in gasoline-ethanol blend, considering the analytical uncertainty plus the uncertainty arising from sampling.
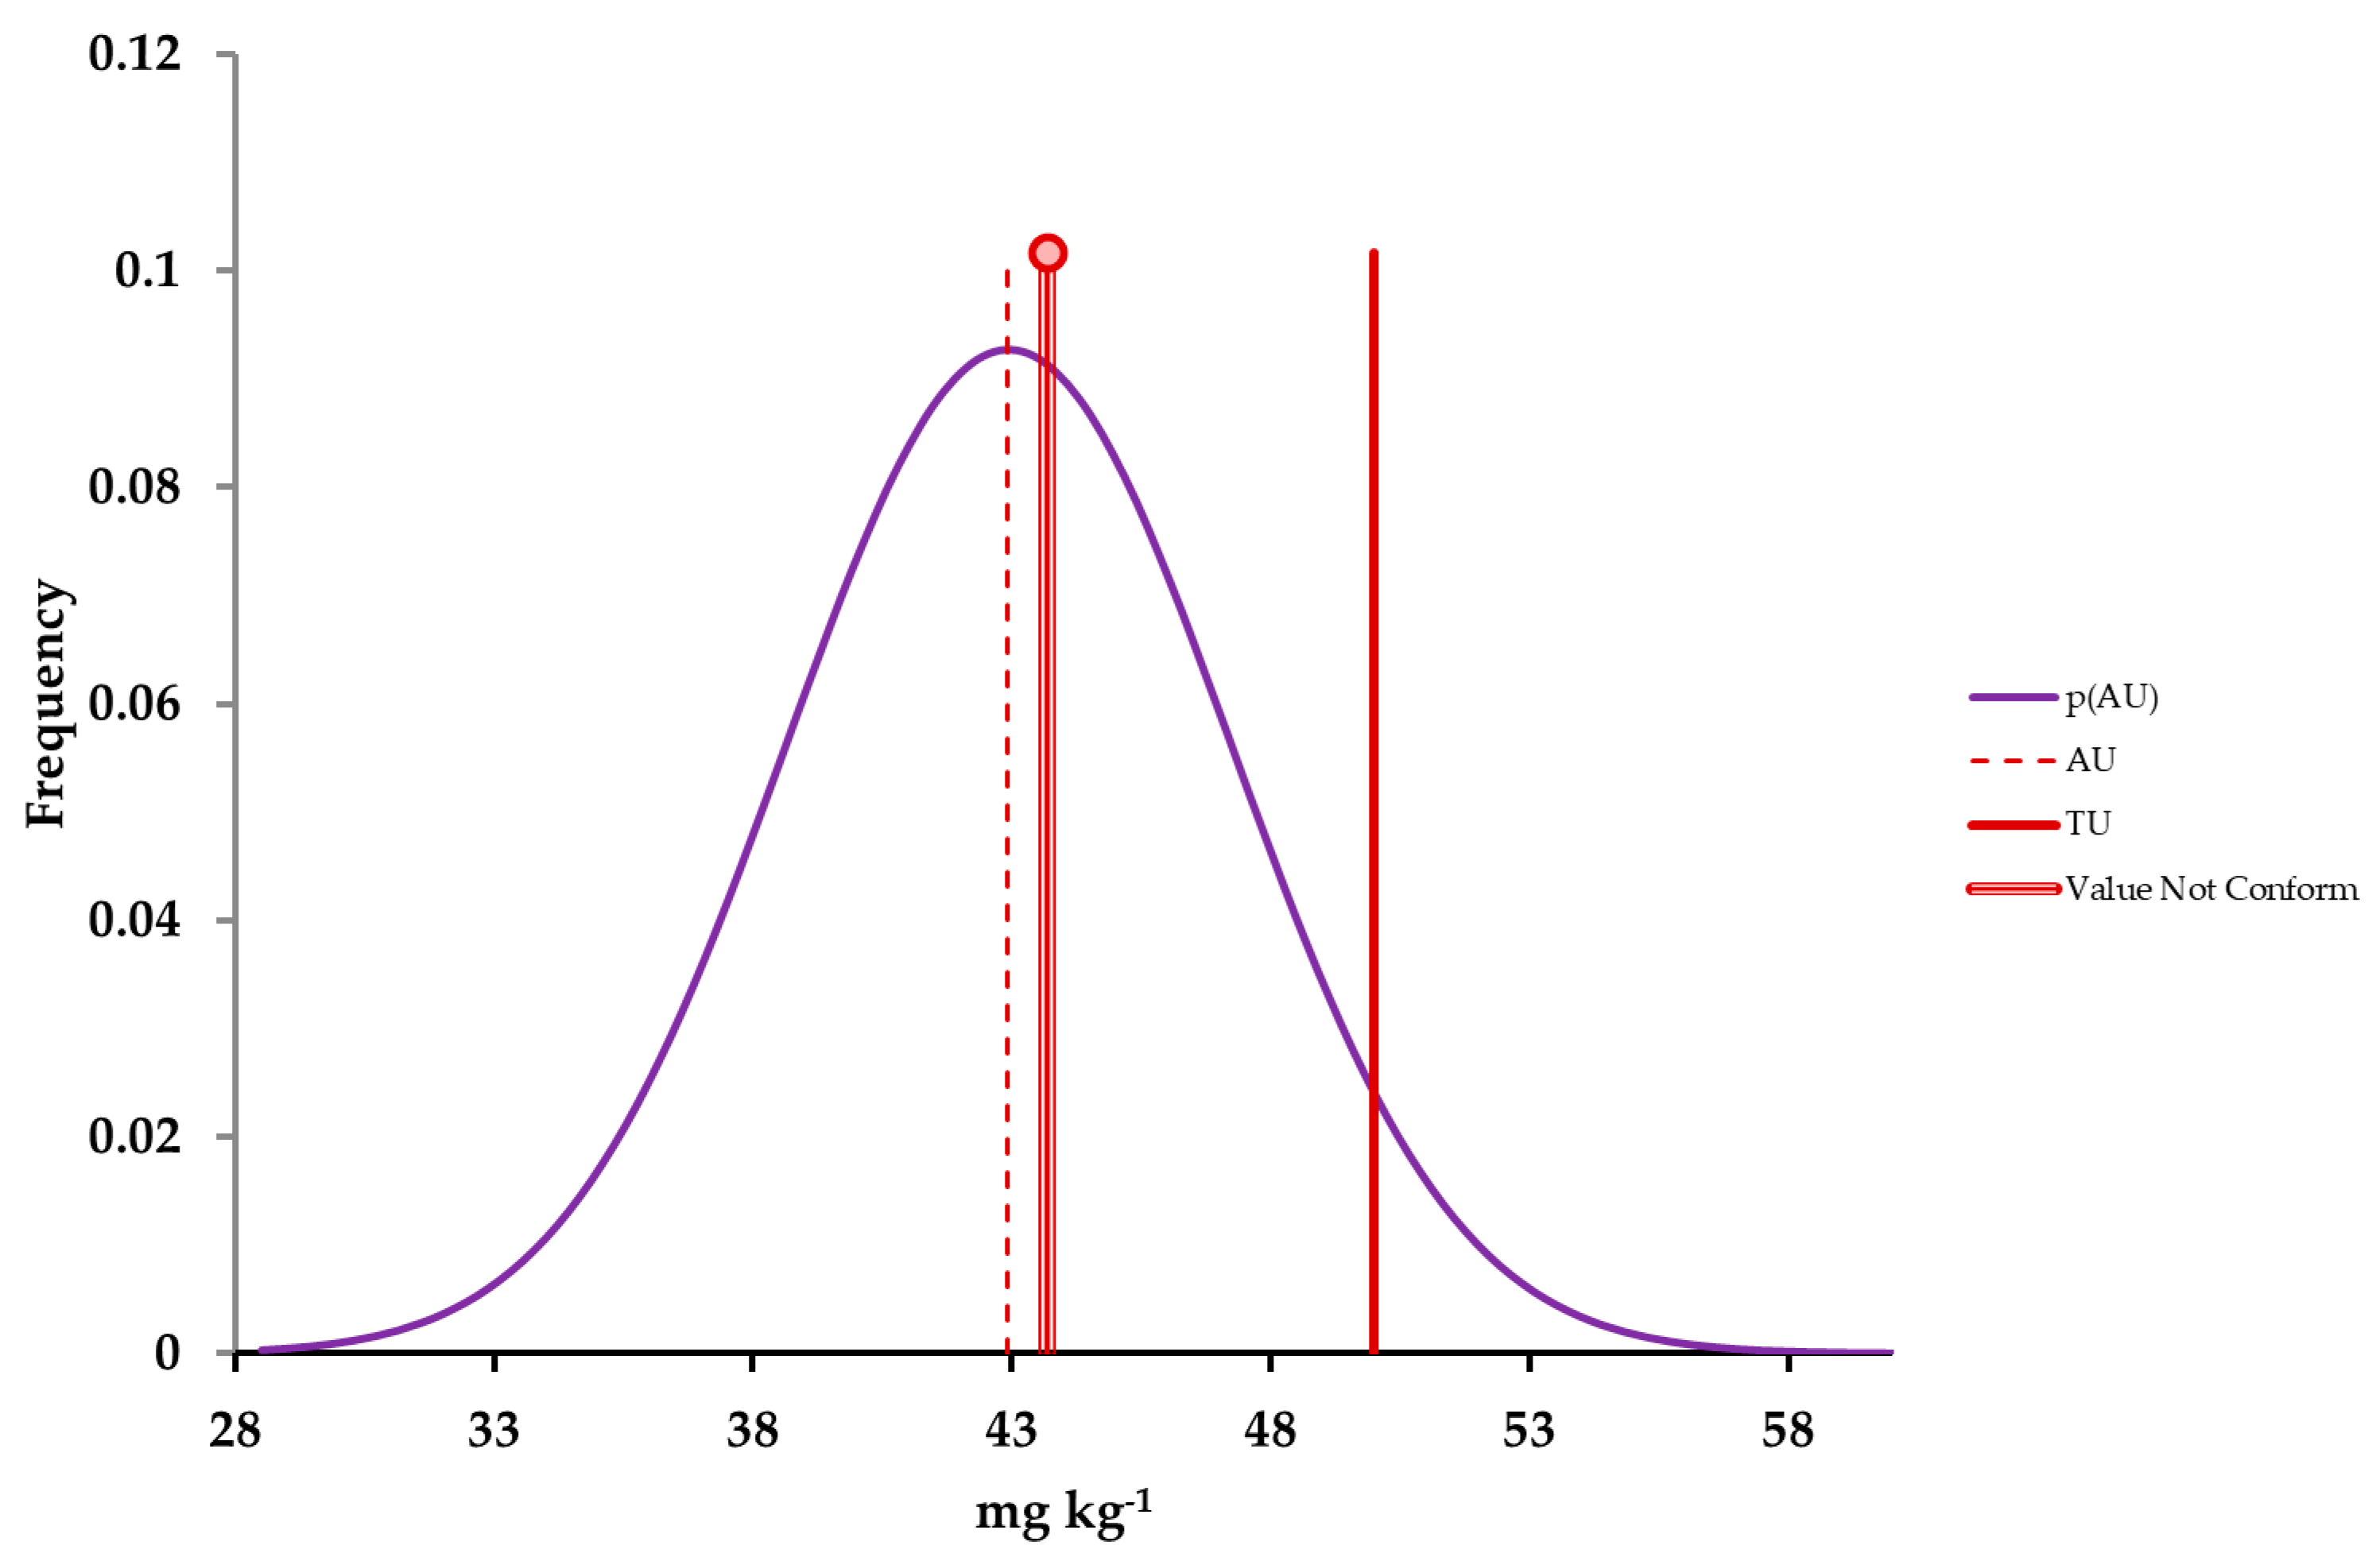
Figure 5.
Histogram for 5 % significance level, kinematic viscosity in diesel, considering only the analytical uncertainty.
Figure 5.
Histogram for 5 % significance level, kinematic viscosity in diesel, considering only the analytical uncertainty.
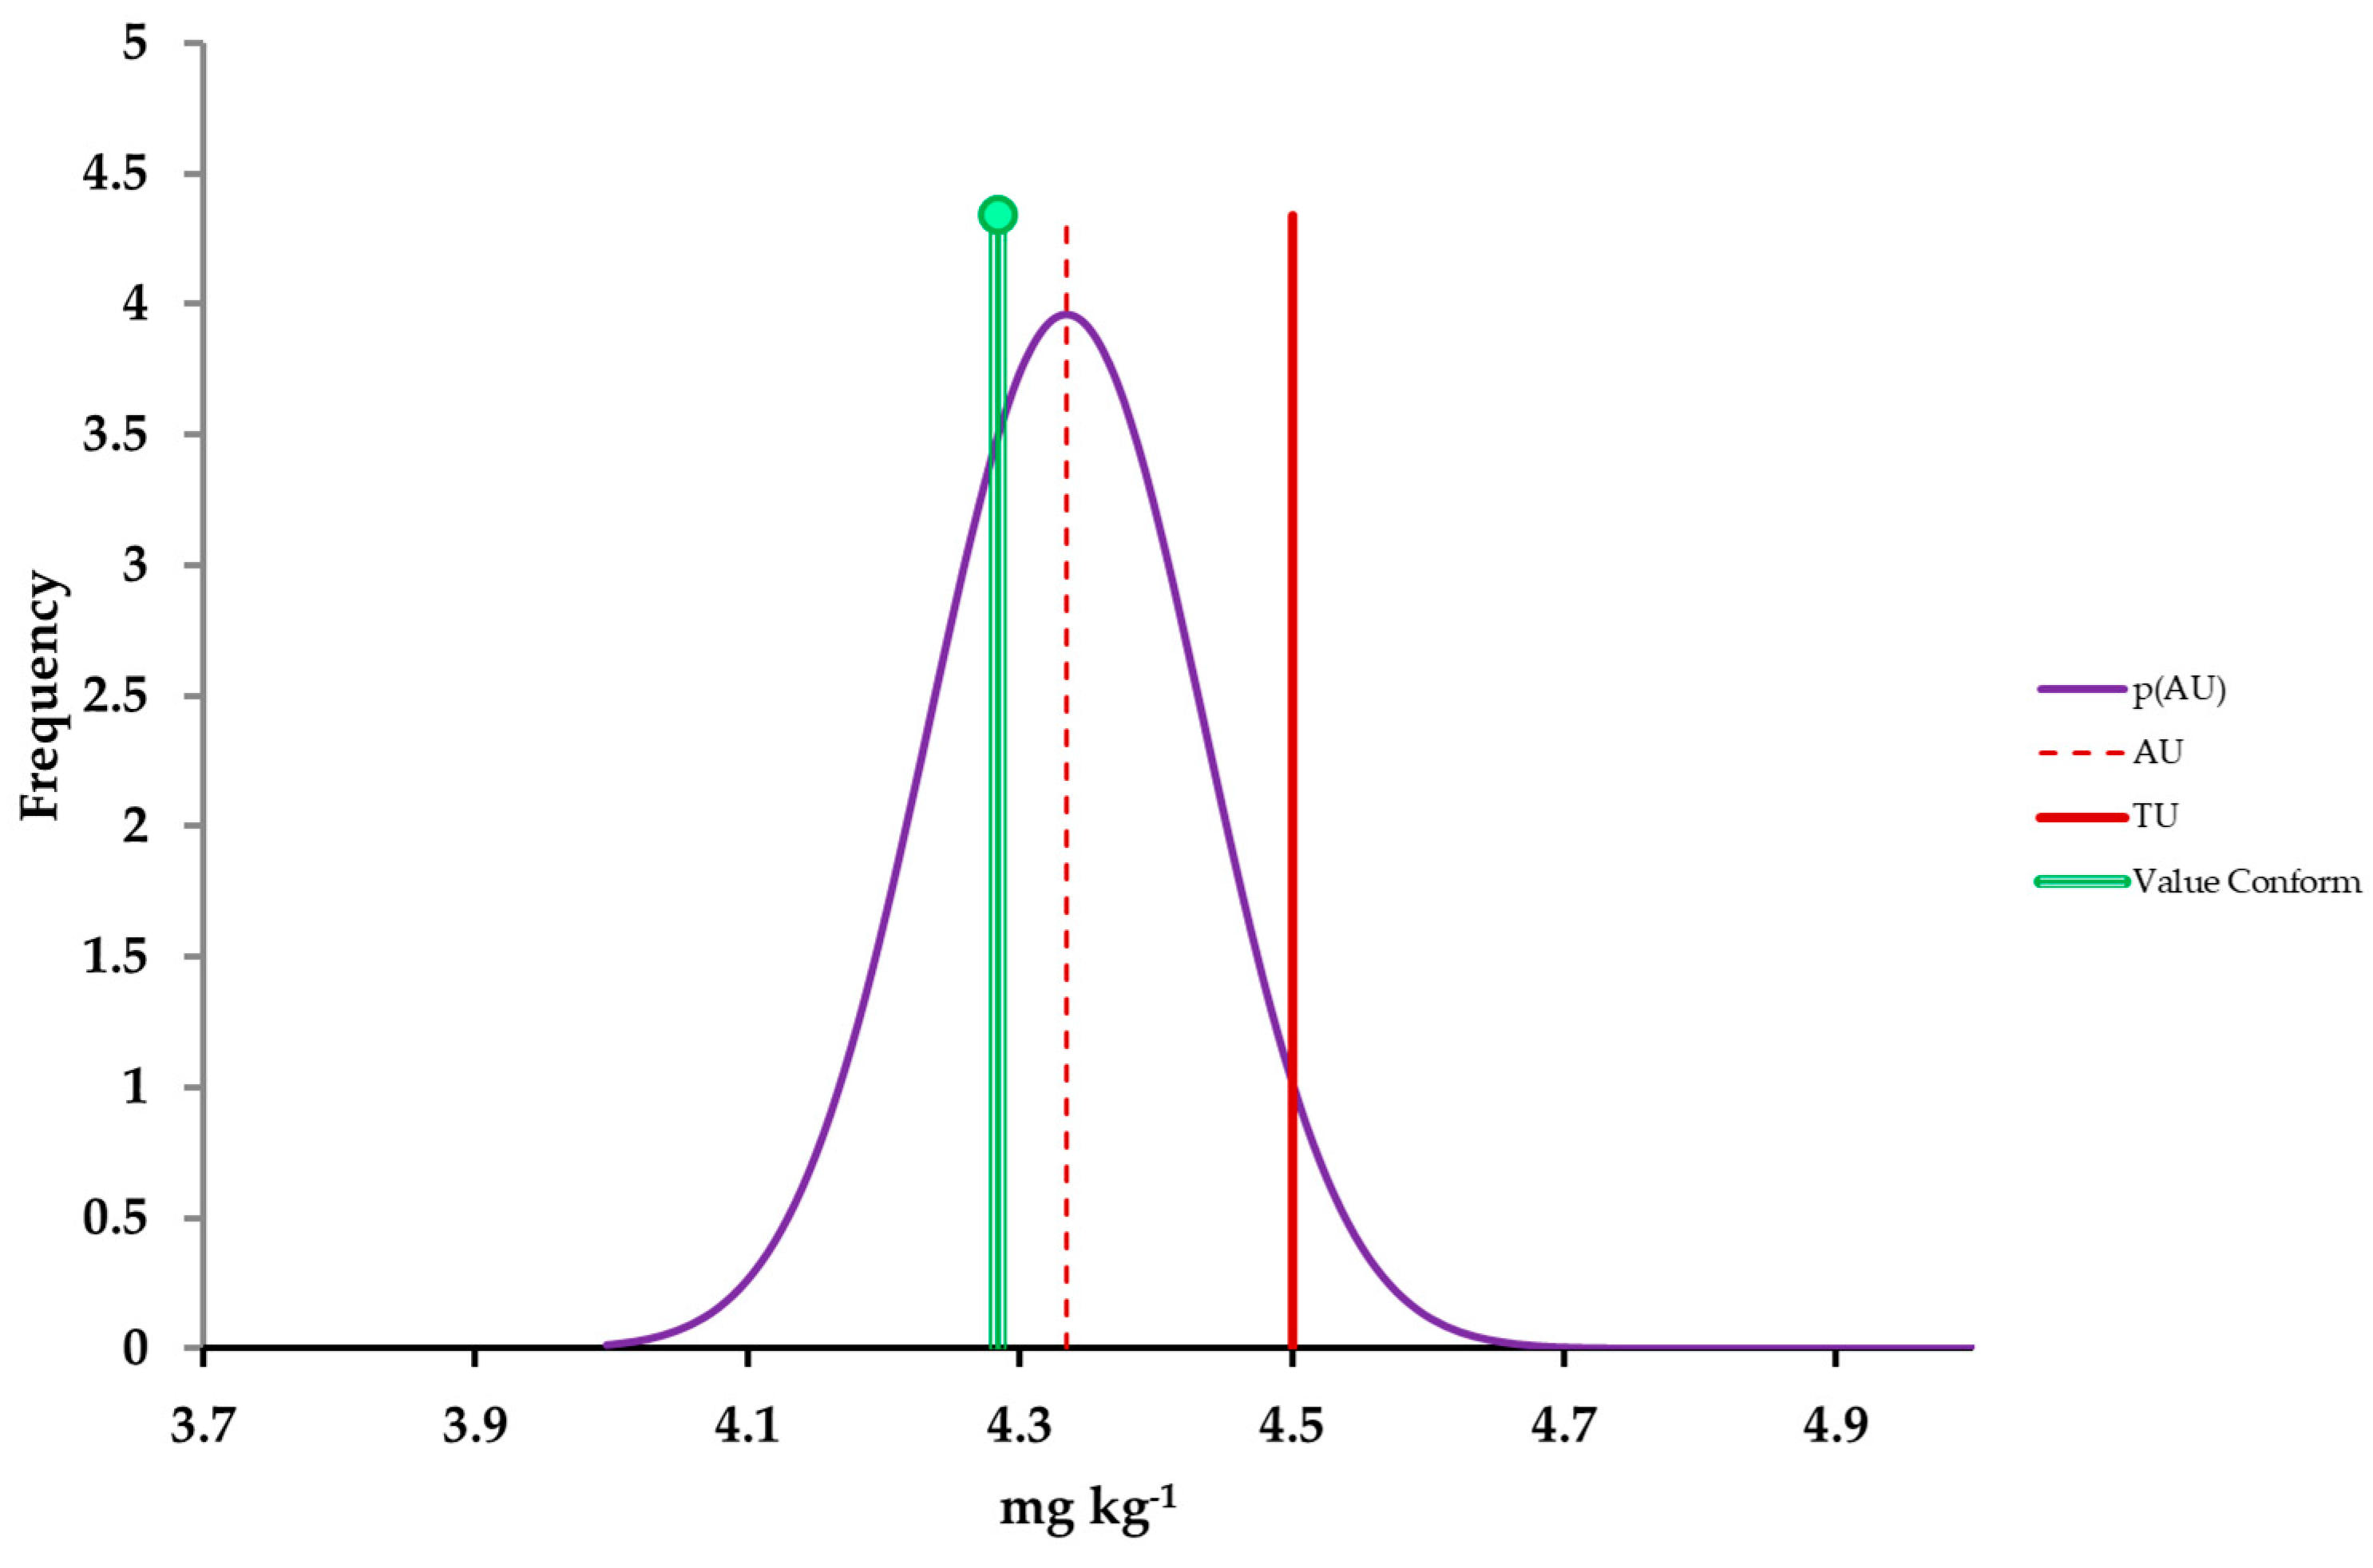
Figure 6.
Histogram for 5 % significance level, kinematic viscosity in diesel, considering the analytical uncertainty plus the uncertainty arising from sampling.
Figure 6.
Histogram for 5 % significance level, kinematic viscosity in diesel, considering the analytical uncertainty plus the uncertainty arising from sampling.
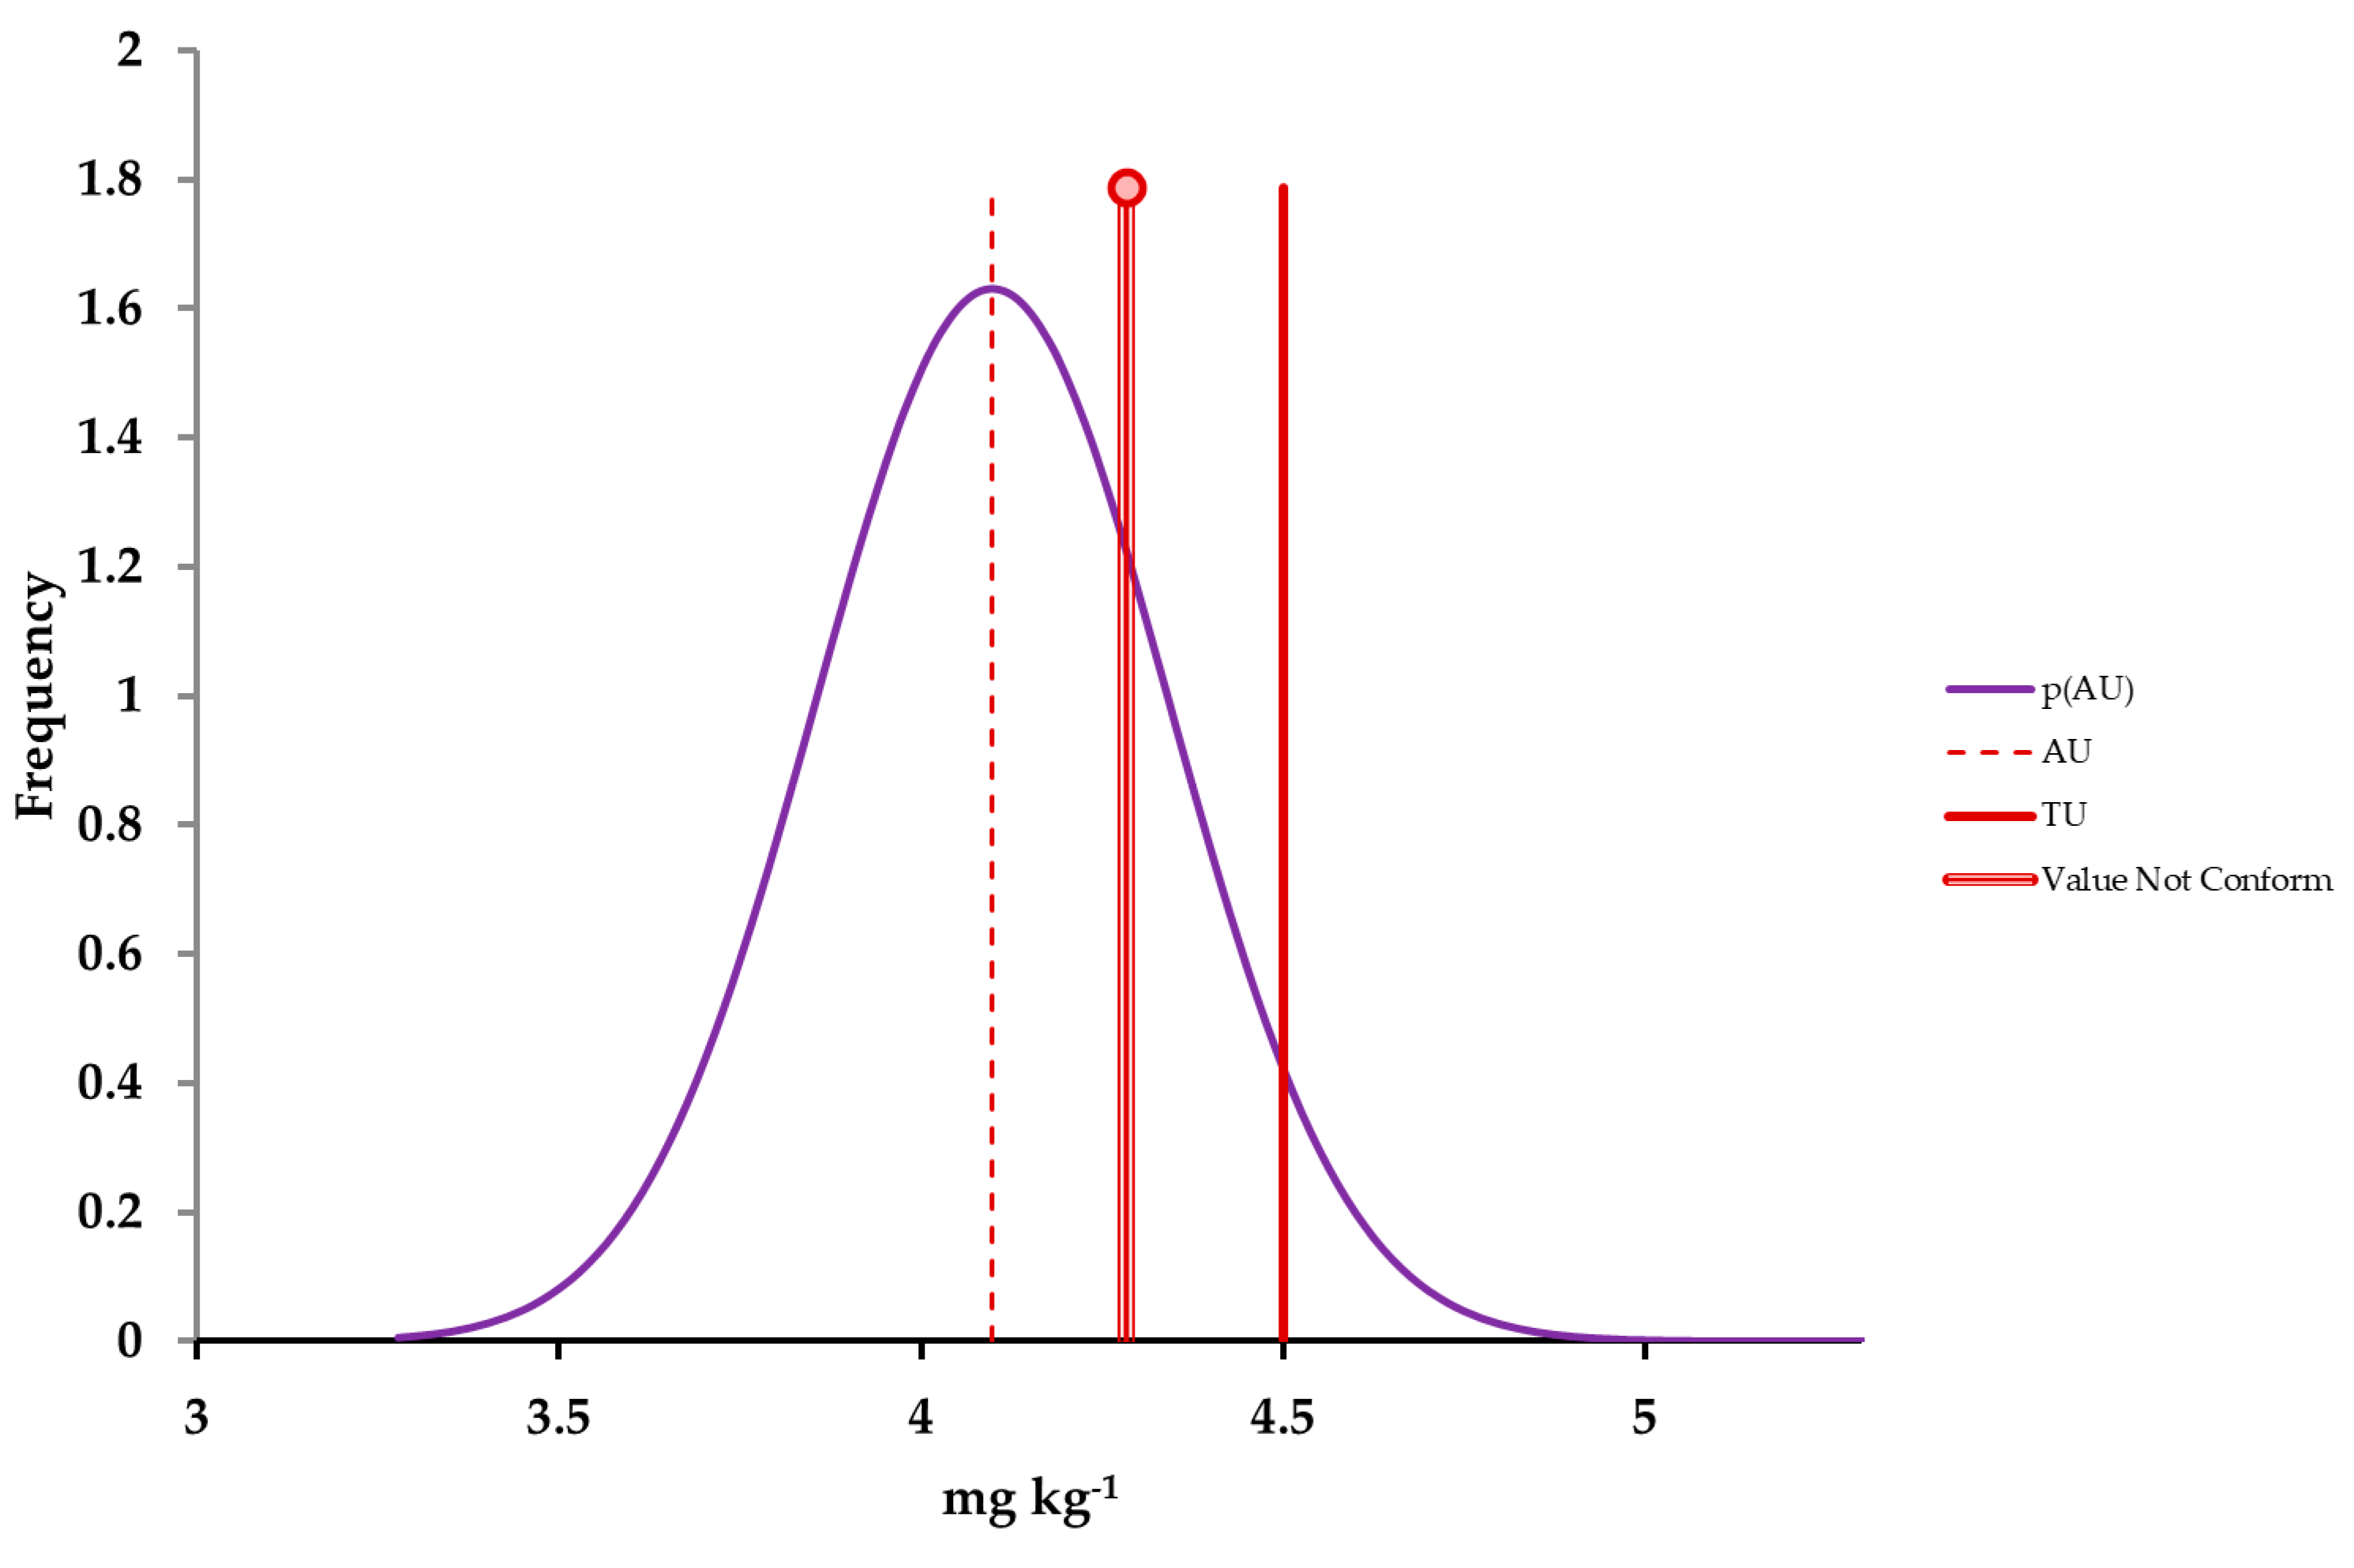

Table 1.
Flash point in jet fuel, °C.
| Sample | Target 1 | Target 2 | Target 3 | Target 4 | Target 5 | Target 6 | Target 7 | Target 8 |
| S1A1 | 46.0 | 50.0 | 47.0 | 52.0 | 44.0 | 46.5 | 50.5 | 45.0 |
| S1A2 | 41.0 | 41.0 | 44.0 | 42.5 | 46.0 | 51.5 | 46.5 | 42.0 |
| S2A1 | 42.0 | 46.5 | 40.5 | 43.5 | 40.0 | 42.5 | 40.5 | 45.0 |
| S2A2 | 42.0 | 40.0 | 44.0 | 41.5 | 42.5 | 41.5 | 41.0 | 44.5 |
Table 2.
Sulfur mass fraction in gasoline-ethanol blend, mg kg-1.
| Sample | Target 1 | Target 2 | Target 3 | Target 4 | Target 5 | Target 6 | Target 7 | Target 8 |
| S1A1 | 38.0 | 37.7 | 43.4 | 41.0 | 41.4 | 46.6 | 37.1 | 43.3 |
| S1A2 | 43.3 | 42.8 | 39.9 | 41.8 | 40.0 | 40.8 | 43.2 | 43.8 |
| S2A1 | 46.1 | 50.0 | 47.8 | 51.3 | 43.1 | 44.8 | 48.8 | 51.6 |
| S2A2 | 46.6 | 43.2 | 38.7 | 45.6 | 45.1 | 47.9 | 39.7 | 45.1 |
Table 3.
Kinematic viscosity at 40 °C in diesel, mm2 s-1.
| Sample | Target 1 | Target 2 | Target 3 | Target 4 | Target 5 | Target 6 | Target 7 | Target 8 |
| S1A1 | 4.483 | 4.373 | 4.605 | 4.297 | 4.430 | 4.572 | 4.412 | 4.528 |
| S1A2 | 4.425 | 4.377 | 4.604 | 4.460 | 4.508 | 4.294 | 4.279 | 4.301 |
| S2A1 | 4.016 | 3.866 | 4.089 | 4.368 | 4.079 | 4.267 | 4.273 | 4.157 |
| S2A2 | 4.139 | 4.036 | 4.148 | 4.194 | 4.110 | 4.020 | 4.252 | 4.117 |
Table 4.
Analytical and sampling uncertainties.
| Analytical uncertainty | Sampling uncertainty | Measurement uncertainty | |
| Flash point (°C) | 3.2 | 2.3 | 3.9 |
| Sulfur mass fraction (mg kg-1) | 3.7 | 2.1 | 4.3 |
| Kinematic viscosity (mm2 s-1) | 0.1007 | 0.2234 | 0.2445 |
Table 5.
Parameters to assess the compliance.
| Mean value | Acceptance limit based on analytical uncertainty |
Acceptance limit based on analytical uncertainty plus sampling uncertainty |
Specification limit |
|
| Flash point (°C) | 44.2 | 43.2 | 44.4 | 38‡ |
| Sulfur mass fraction (mg kg-1) |
43.7 | 43.9 | 42.9 | 50† |
| Kinematic viscosity (mm2 s-1) |
4.284 | 4.335 | 4.099 | 4.5† |
‡ Lower specification limit; and † Upper specification limit.
Disclaimer/Publisher’s Note: The statements, opinions and data contained in all publications are solely those of the individual author(s) and contributor(s) and not of MDPI and/or the editor(s). MDPI and/or the editor(s) disclaim responsibility for any injury to people or property resulting from any ideas, methods, instructions or products referred to in the content. |
© 2024 by the authors. Licensee MDPI, Basel, Switzerland. This article is an open access article distributed under the terms and conditions of the Creative Commons Attribution (CC BY) license (http://creativecommons.org/licenses/by/4.0/).
Copyright: This open access article is published under a Creative Commons CC BY 4.0 license, which permit the free download, distribution, and reuse, provided that the author and preprint are cited in any reuse.


