1. Background
Multiple sclerosis (MS) is a neurodegenerative, demyelinating, inflammatory, autoimmune disease of the central nervous system, whose incidence is increasing worldwide as a result of earlier diagnosis and improved patient management [
1]. Thus far, it has been theorized that the incidence of the condition is directly correlated with specific geographic locations, as the prevalence of the disease seems to increase with the distance of a given region from the equator [
2]. Other studies investigating population genetics have shown that the increased prevalence rates of the disease are not satisfactorily explained by mere genetics, suggesting that environmental risk factors play the most notable role in the development of multiple sclerosis [
3]. Therefore, the causes of the disease appear to include both genetic and environmental factors [
1]. Vitamin D deficiency, reduced sun exposure, stress, obesity, diet and infections are among the main environmental risk factors of MS [
4].
There is considerable ambiguity with regards to dietary advice for people with multiple sclerosis, whereas the impact of dietary habits and lifestyle on the course of the disease remains obscure. Nutrition education is essential to provide knowledge and information about nutrition and healthy eating habits that are relevant to all people, whether they suffer from the disease or not. The aim of nutrition education is to enable people make informed choices regarding their diet, understand the importance of different nutrients, and adopt healthier eating patterns to promote their overall well-being [
5].
Nowadays, there is a considerable body of research that has investigated nutrition in relation to various diseases, such as heart conditions, diabetes, cancer, gastrointestinal disorders, obesity, and the nutrition of young people. Although these topics have been extensively analyzed, the effect of diet on multiple sclerosis, especially in Greece, has been studied to a lesser extent.
The Mediterranean Diet is a balanced diet that is usually accompanied by a healthier lifestyle. It is an important and historical dietary pattern that has evolved in the Mediterranean basin, influenced by various cultures such as the Egyptians, the Greeks, the Romans, and others. Its basic component include olive oil, olives, whole grains, wine, vegetables, fruits, fish and seafood, which have contributed to the amalgamation of a rich and healthy cuisine. Hippocrates recognized the importance of the diet for physical and mental health. The Mediterranean diet was enriched with new foods with the passage of time, as well as the interaction with various cultures. Today, it is considered a worldwide renowned diet associated with the culture, history, society and lifestyle of the Mediterranean peoples. The consumption of olive oil is of central importance, due to its beneficial properties, such as its neuroprotective action. Cereals, vegetables, legumes and fruits are elements of the diet, as they are consumed on a daily basis, while meat consumption is moderate [
6].
The present study aims to investigate and highlight the possible connection between the Mediterranean diet and multiple sclerosis, with the aid of a nutritional intervention. The research undertaken aims to improve our understanding of the interactions between diet and the condition, in order to identify possible associations and effects.
2. Materials and Methods
A study was conducted, through enrolling participants in control and intervention group, at three points in time. The research questions developed in the context of the study concerned the dietary habits of patients with multiple sclerosis, whether they were associated with the degree of their disability, whether they affected their quality of life and potential disability and to what extent, as well as whether nutritional education and adherence to the Mediterranean diet improved their quality of life and their disability status. The participants were patients of the Neurological Outpatient Clinic and the Neurological Clinic of the General State Hospital of Nikaia, Piraeus. The sample consisted of 130 individuals selected with random sampling. Data collection was carried out from June 2021 to May 2022, with a random selection of patients based on the odd numbers on their appointment and admission cards. The intervention group (65 people) was given an educational sheet (pg:25-27) on the Mediterranean diet and healthy practices for dealing with the disease. The diet regime included fish, fruits, vegetables, whole grains, and a restriction of red meat, dairy and processed foods. After three and six months, the clinical status and quality of life of the participants were assessed. The study examined whether the condition of patients, who adhered to the Mediterranean diet, improved or remained stable compared to three and six months before, and when compared to the control group. During the study, the intervention group remained unchanged, comprised of 65 patients, while the control group decreased from 72 to 65 people due to the withdrawal of six women and the random selection of one participant to equalize the groups. Inclusion criteria for the study were age ≥18 years, a good understanding of the Greek language, and signed informed consent. Patients receiving cortisone or patients, who were recently diagnosed with multiple sclerosis, had participated in a pharmaceutical clinical trial, had recently changed their medication, or suffered from psychiatric diseases or intellectual disability, and comorbidities were excluded.
2.1. Questionnaires
For the purposes of the study, patients were fully informed and gave their written consent. They completed structured questionnaires through personal interviews lasting approximately half an hour in a quiet area of the hospital. Information was collected on social, demographic and medical data, dietary habits, disability status and quality of life. Data on gender, age, weight, height, marital status, education, employment status, financial status and place of residence were collected. In addition, data regarding years of illness, medication, cortisone administration, other health issues, exercise, smoking, and use of vitamins or nutritional supplements were obtained. Disability was assessed using the scales Multiple Sclerosis Rating Scale-Revised (MSRS-R) [
7] and Multiple Sclerosis Impact Scale-29 (MSIS-29) [
8]. Nutrition was assessed with the questionnaires Mediterranean Diet Score (MedDiet score) [
9] and Mini Nutritional Assessment (MNA) [
10]. For the assessment of quality of life, the Multiple Sclerosis Quality of Life - 54 (MSQOL-54) was used [
11]. The MSRS-R scale is a useful, brief tool assessing the impact of multiple sclerosis on patients, and providing a comprehensive understanding of the course of the disease and treatments. The MSIS-29 scale assesses the impact of the disease on daily life. The Mediterranean Diet Score questionnaire evaluates adherence to the Mediterranean Diet and is a useful tool for assessing nutritional status. The Mini Nutritional Assessment (MNA) is a valid 18-question tool that assesses nutritional risk and nutritional status, suitable for use in geriatric assessment. The MSQOL-54 scale is utilized for the evaluation of quality of life of patients with multiple sclerosis, combining questions from the 36-Item health survey Short Form with 18 additional questions that are specific to multiple sclerosis.
2.2. Statistical Analysis
Using the Kolmogorov-Smirnov test, the distributions of the quantitative variables were tested for normality. Mean values and standard deviations (SD) were used for the description of quantitative variables. Absolute (n) and relative (%) frequencies were used to describe qualitative variables. To compare qualitative variables between the two groups, Pearson's chi-square test or Fisher's exact test was used. To compare quantitative variables between two groups, Student's t-test for independent samples was utilized. To test the association between two quantitative variables, Spearman correlation coefficient (rho) was used. Repeated-measures analysis of variance (ANOVA) was employed to test for differences in the under-study scales between control and intervention group and over time. Also, with the aforementioned method, it was assessed whether the degree of change over time of the under-study scales was different between the two groups. Repeated-measures analysis of variance (ANOVA) for the MNA and MSRS-R scales was performed using logarithmic transformations due to lack of normality. To check for type I error, due to multiple comparisons, the Bonferroni correction was used whereby the significance level is 0.05/κ (κ= number of comparisons). Repeated-measures analysis of variance (ANOVA) also was utilized to evaluate the association between patients’ characteristics in the intervention group and the changes in all under-study scales. Significance levels are two-sided and statistical significance was set at 0.05. The statistical program SPSS 26.0 was used for the analysis.
3. Results
The sample consisted of 130 patients with multiple sclerosis, divided into two equally sized (65 patients each) groups, i.e. control and intervention group. The demographical and clinical characteristics for each group separately are presented in
Table 1. The majority of patients in both groups were females, 81.5% for the control group and 67.7% for the intervention group. Additionally, 36.9% of patients in the control group were 41-50 years old and 32.3% of patients in the intervention group were 31-40 years old. Most patients in both groups had a normal BMI (56.3% of the control groups and 46.9% for the intervention group). Furthermore, 60% of the participants in the control group married were and 50.8% of the intervention group. Sixty percent of the control group and 49.2% of the intervention group had children. Forty percent of the control and 58.5% of the intervention group held a university degree. Moderate financial status was reported by the 56.9% of the control group and 53.8% of the intervention group. Mean time since diagnosis was 11.7 years (SD=7.7 years) for the control group and 9.7 years (SD=6.6 years) for the intervention group. Under treatment were 90.8% of the control group and 96.9% of the intervention group. The characteristics of both groups were found to be similar (p>0.05).
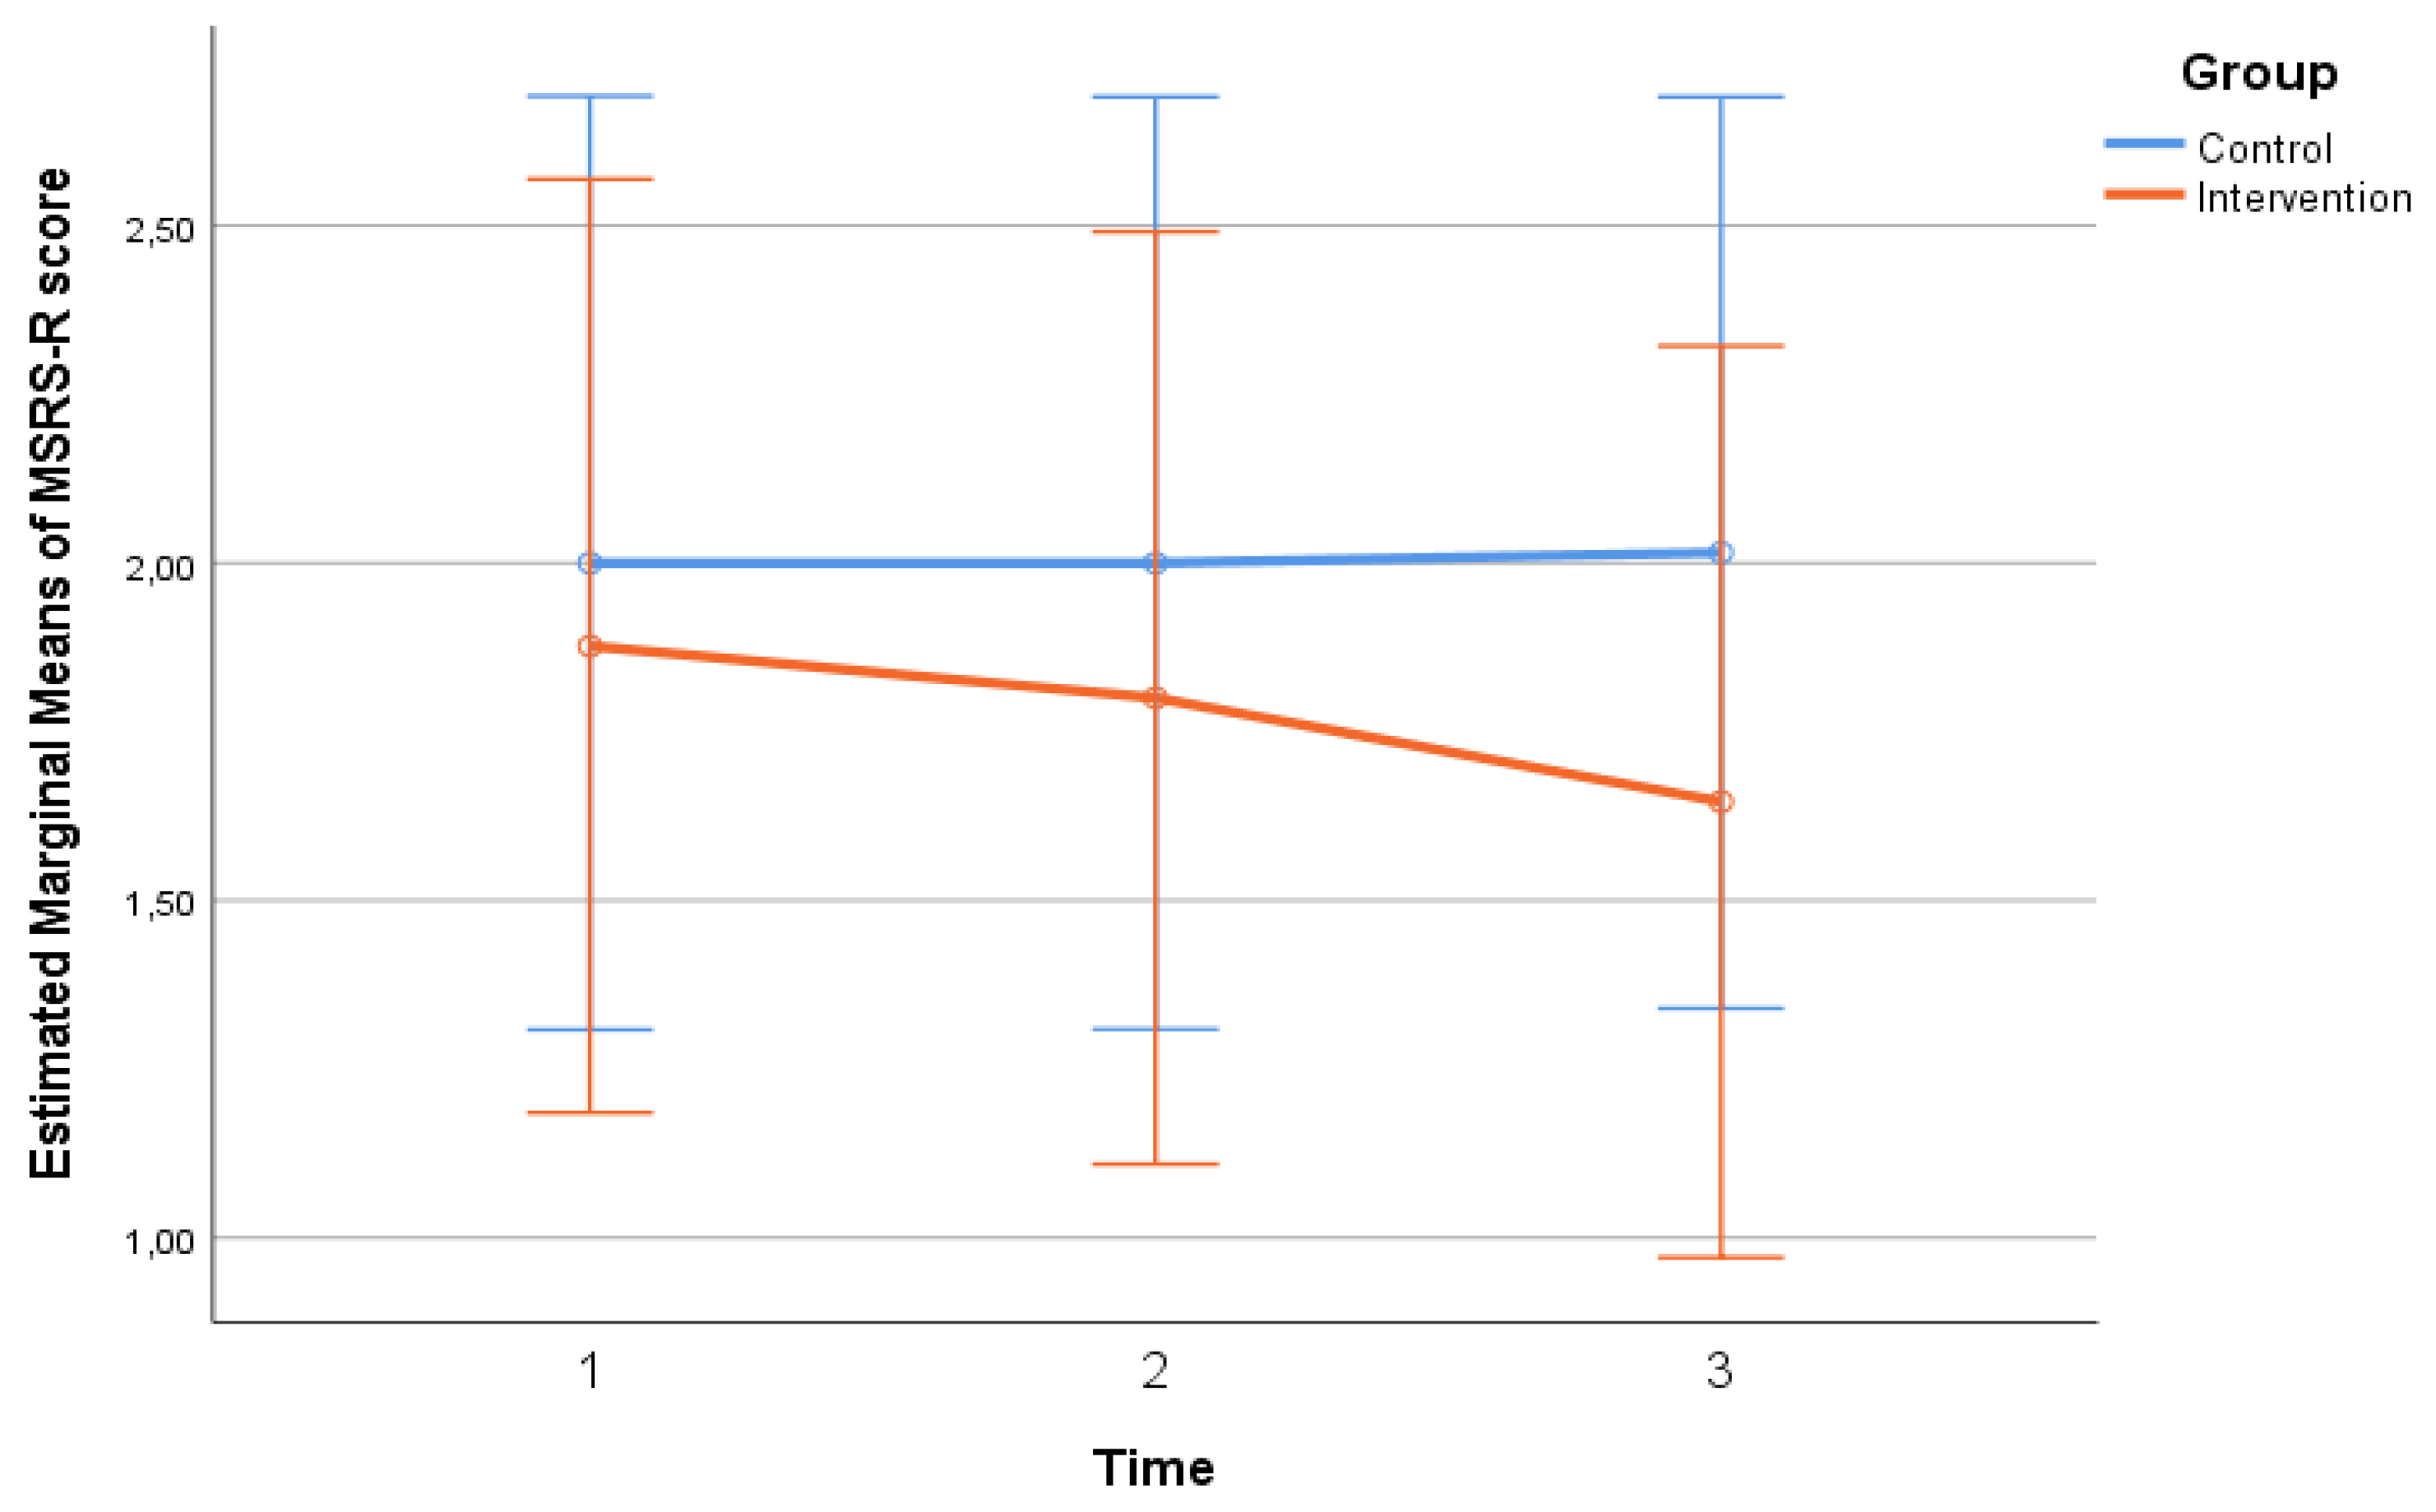
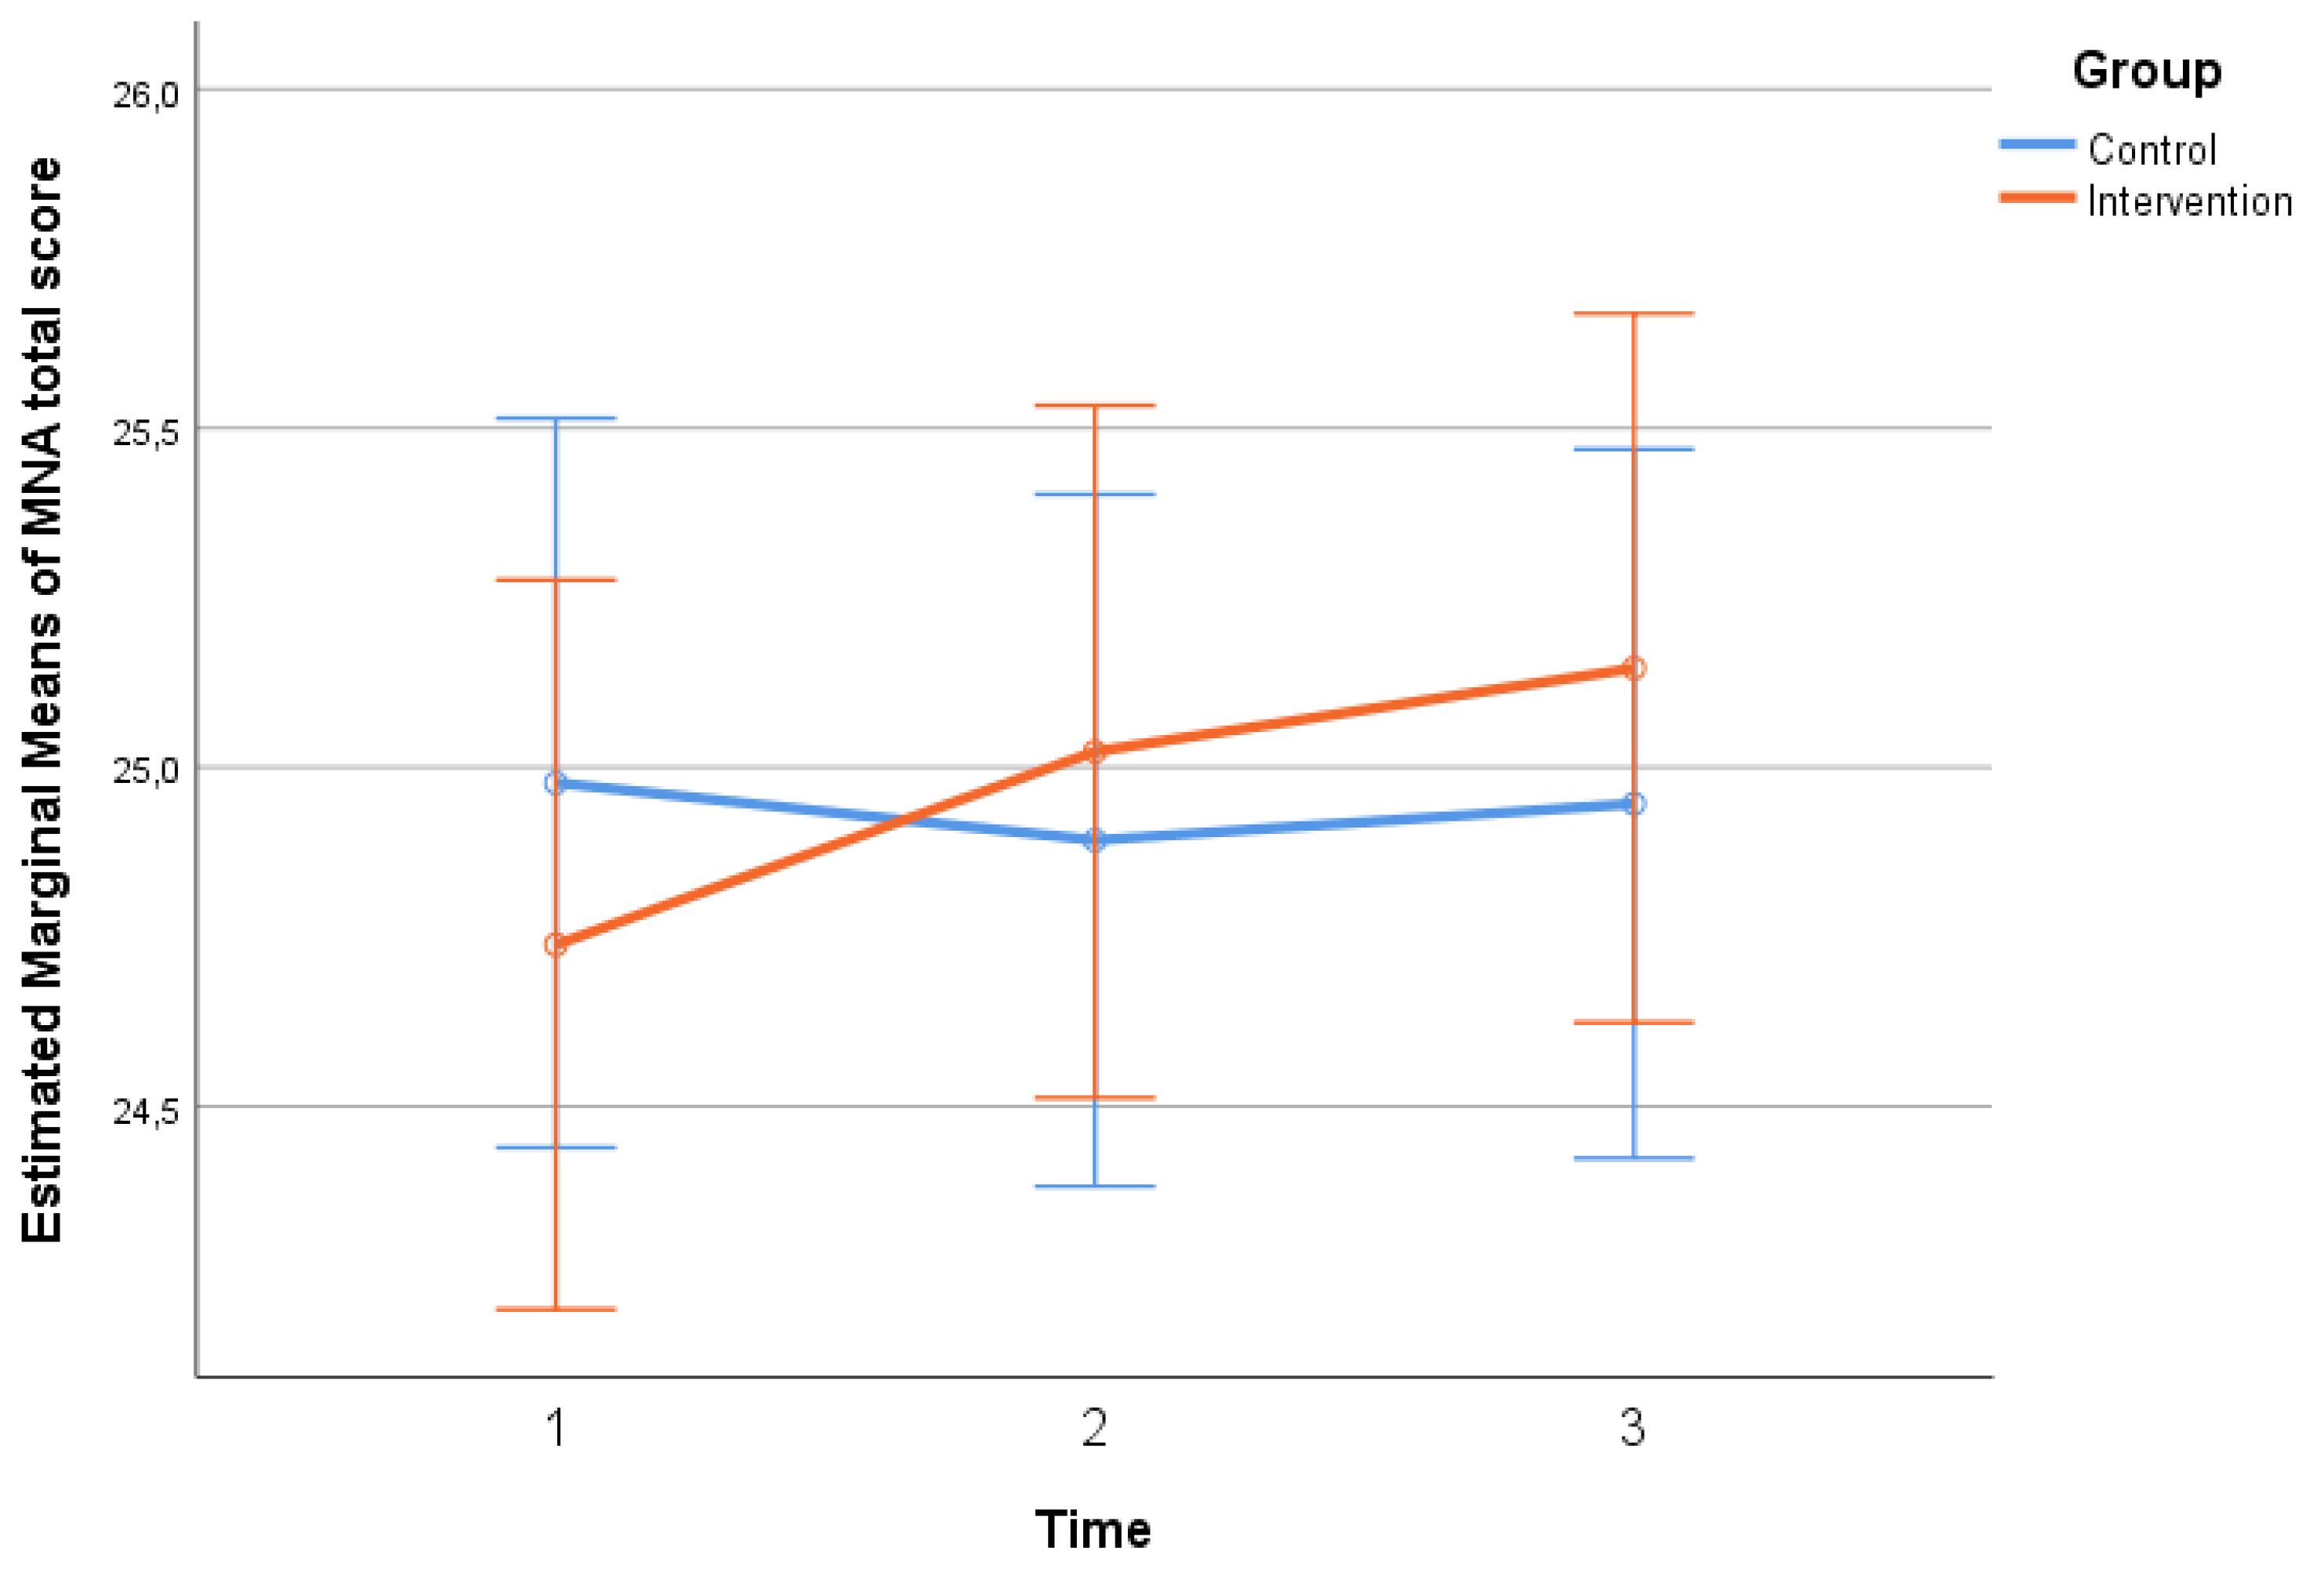
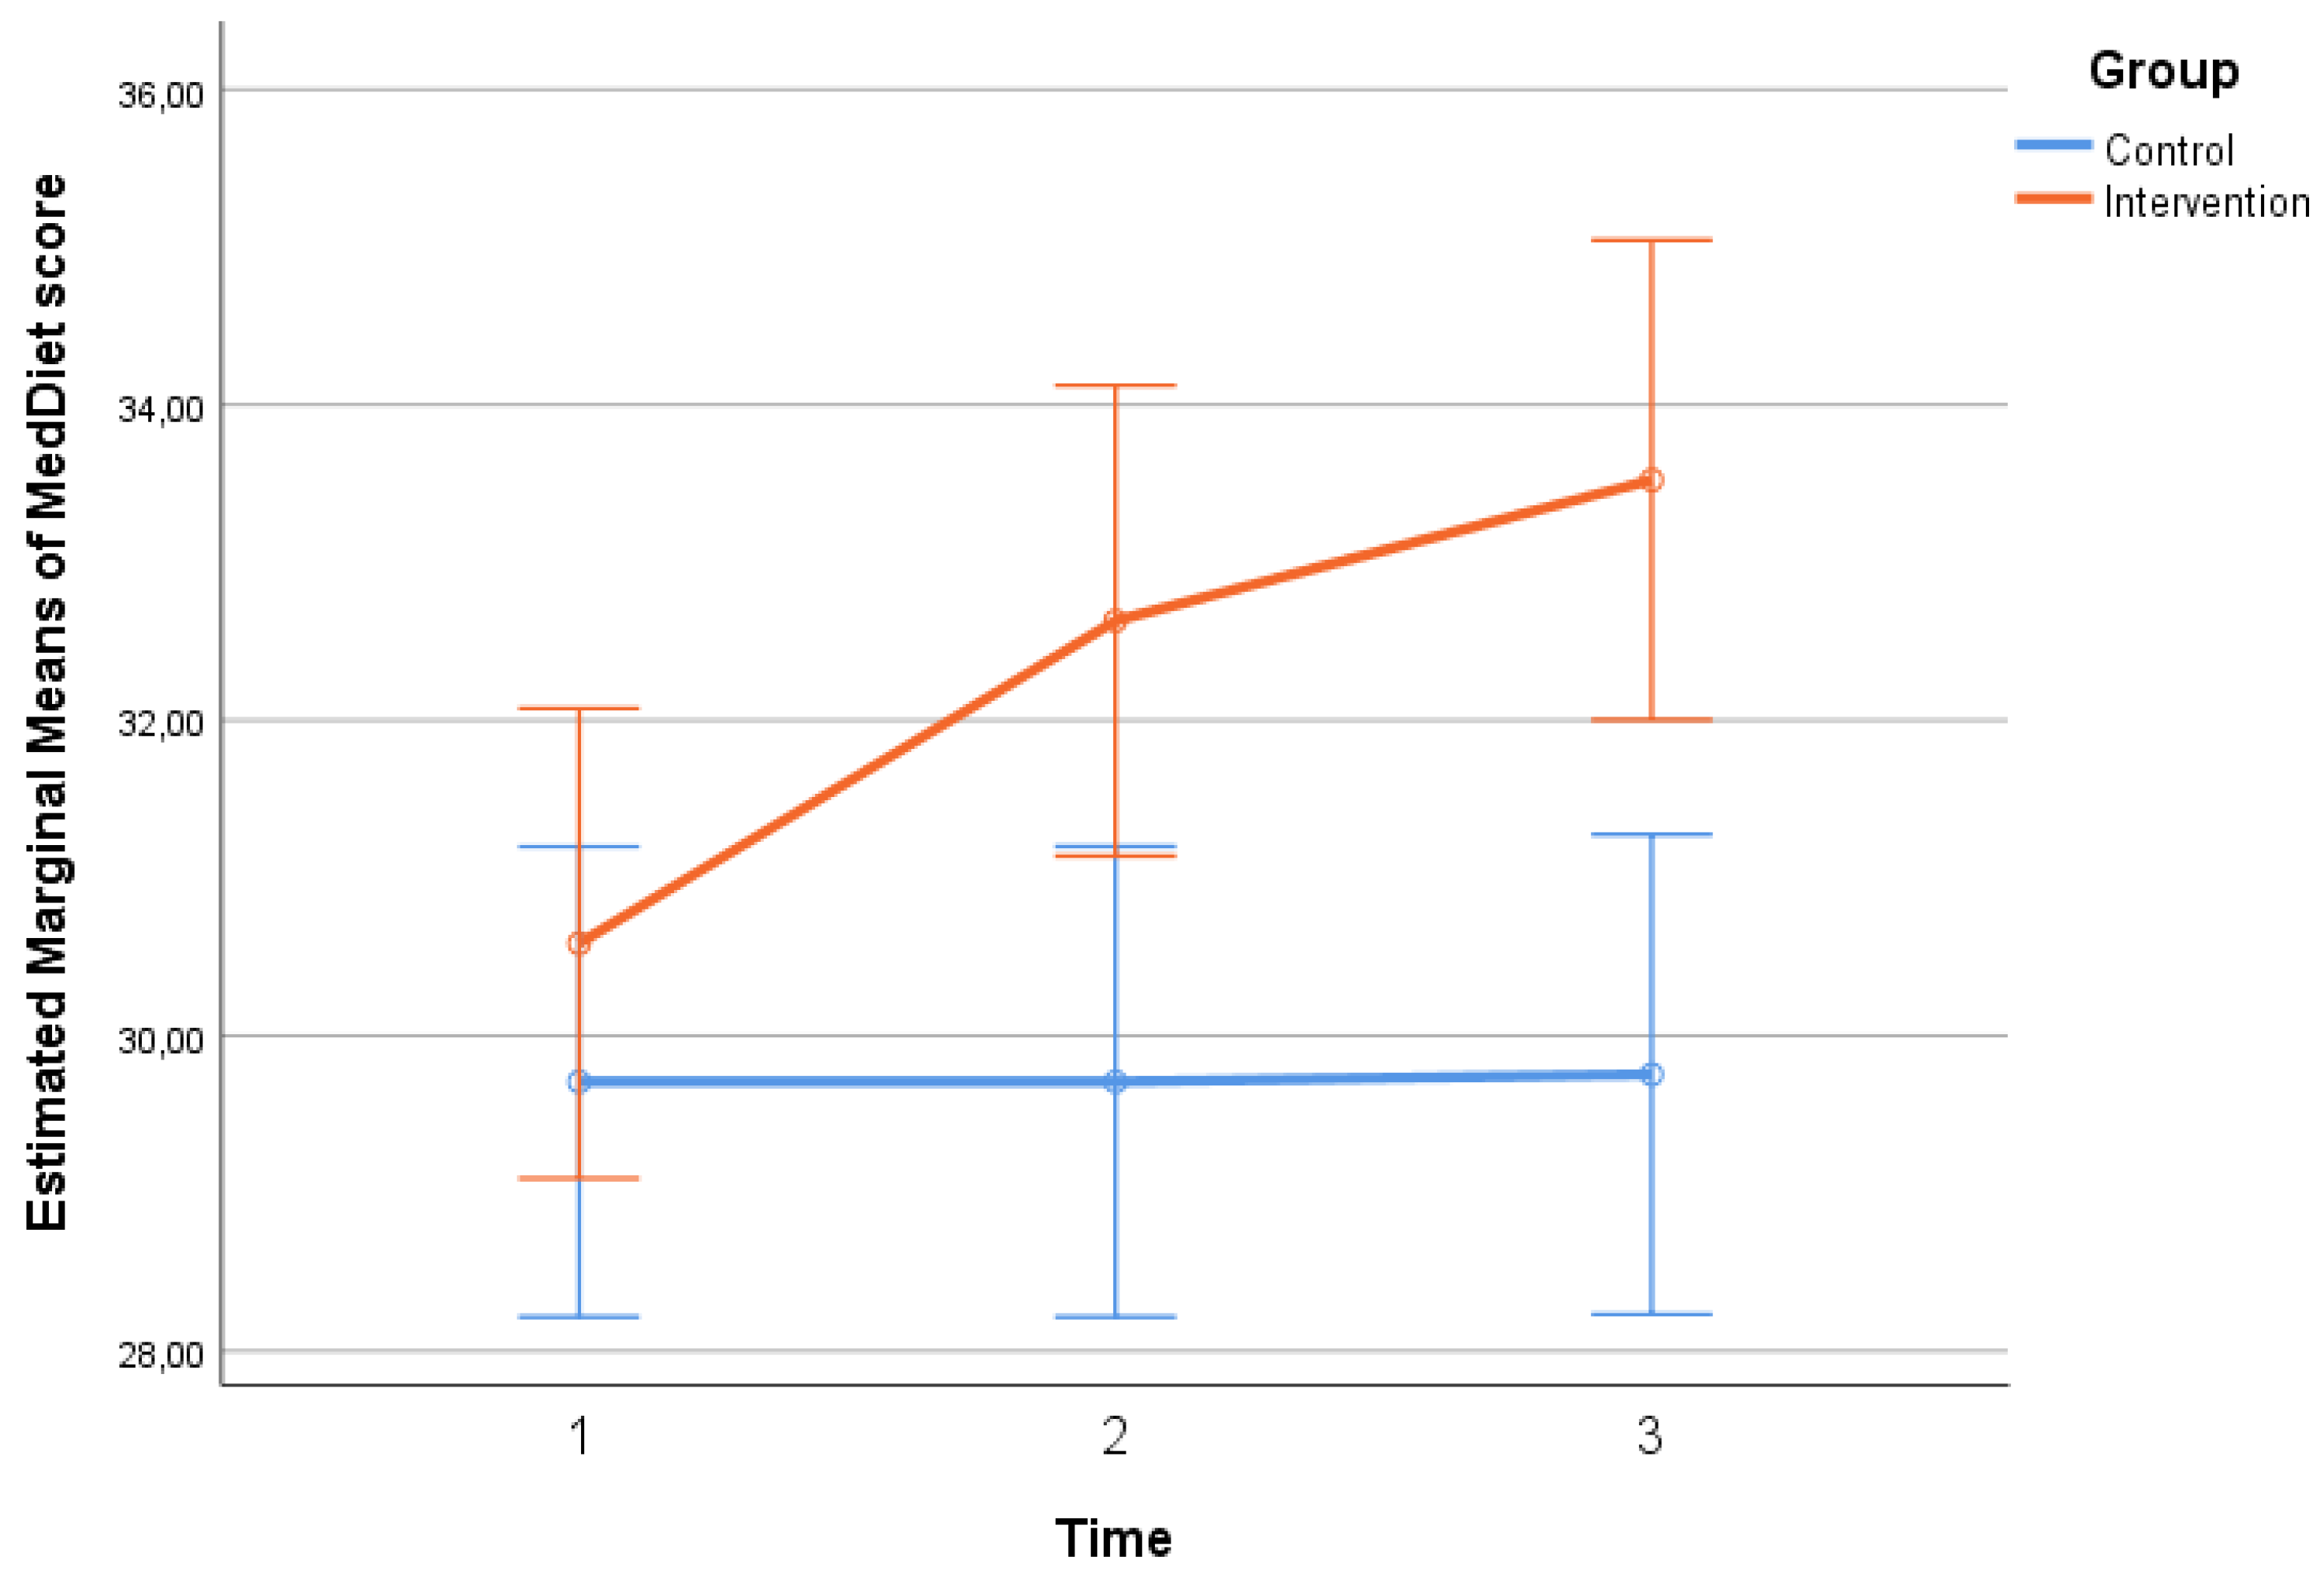
Participants’ scores in MSRS-R, MNA and MedDiet scales throughout the follow-up period, by group, are presented in
Table 2. No significant differences regarding MSRS-R, MNA scores were found between the two groups at any time point (p>0.05). No significant differences were found in MedDiet score between the two groups at baseline. However, at the 2nd (p=0.007) and 3rd (p=0.001) follow-ups, the intervention group had a significantly higher score, indicating that they were significantly more adherent to the Mediterranean diet pattern, compared to the control group. Timewise, in the control group no significant changes were found in MSRS-R, MNA and MedDiet scales (p>0.05). On the contrary, in the intervention group, there was a significant overall decrease (from time 1 to time 3) in MSRS-R score (p<0.001), indicating a significant reduction in the functional difficulty experienced by the patients, as well as a significant overall increase in MNA total score (p=0.023), indicating a significant improvement in patient nutrition, in the same time interval. MedDiet score, in the intervention group, increased significantly from one time point to the next as well from time 1 to time 3 (p<0.001), indicating a significant improvement in the dietary habits of the patients based on the Mediterranean pattern. The extent of change in MSRS-R (p=0.006 –
Figure 1, pg:11), MNA (p=0.044 –
Figure 2, pg:11) and MedDiet (p<0.001 –
Figure 3, pg:12) scales differed significantly between the two groups. More specifically, no significant improvement was found in the control group, while in the intervention group, their functionality, feeding and diet were improved significantly.
Participants’ scores in MSQOL-54 subscales throughout the follow-up period, by group, are presented in
Table 3. Physical Health, Role limitations due to emotional problems, Health perceptions, Social function, Sexual function, Change in health and Satisfaction with sexual function presented no significant differences between the two groups at each timepoint (p>0.05), had no significant time changes (p>0.05) and no significant differences regarding the extent of change between the two groups (p>0.05). Role limitations due to physical problems and Health distress scores differed significantly between the two groups at time 1. Specifically, the intervention group had a significantly higher score in the Role limitations due to physical problems subscale (p=0.039) and a significantly lower score in the Health distress subscale (p=0.024). In the 2nd and 3rd measurements the scores were similar for the two groups (p>0.05). Timewise, no significant changes were found in Role limitations due to physical problems and Health distress scores in neither group and the degree of change was similar in both groups(p>0.05). Pain score at time 1 was similar for the two groups. Then, at time 2 and time 3, pain score of patients in the intervention group was significantly higher compared to the control group (p=0.035 and p=0.022, respectively). Timewise, no significant changes were found in pain score and the degree of change was similar in both groups. The Emotional well-being score was similar between the two groups at each timepoint (p>0.05). In the intervention group the score remained at similar levels throughout the follow-up period, while in the control group there was a significant decrease at time 3, indicating a deteriorating of the patients' quality of life in this domain, compared to time 1 (p=0.010) and time 2 (p=0.013). Consequently, the degree of change of Emotional well-being score differed significantly between the two groups (p=0.009). Energy score was similar between the two groups at each time point (p>0.05). In the intervention group energy score remained at similar levels throughout the follow-up, while in the control group there was a significant decrease at time 3, indicating a worsening of the patients' quality of life in this sector, compared to time 2 (p=0.035). However, the extent of change in energy score was similar in both groups (p>0.05). Cognitive function and Overall quality of life scores were similar between the two groups at each time point (p>0.05). In the control group Cognitive function and Overall quality of life scores remained at similar levels throughout the follow-up period, while in the intervention group there were significant increases at times 2 (p=0.044 and p<0.001 respectively) and 3 (p=0.005 and p<0.001, respectively), indicating an improvement in the patients' quality of life in the specific domains, compared to time 1. As a consequence, the extent of change in Cognitive function and Overall quality of life scores differed significantly between the two groups (p=0.049 and p=0.006 respectively).
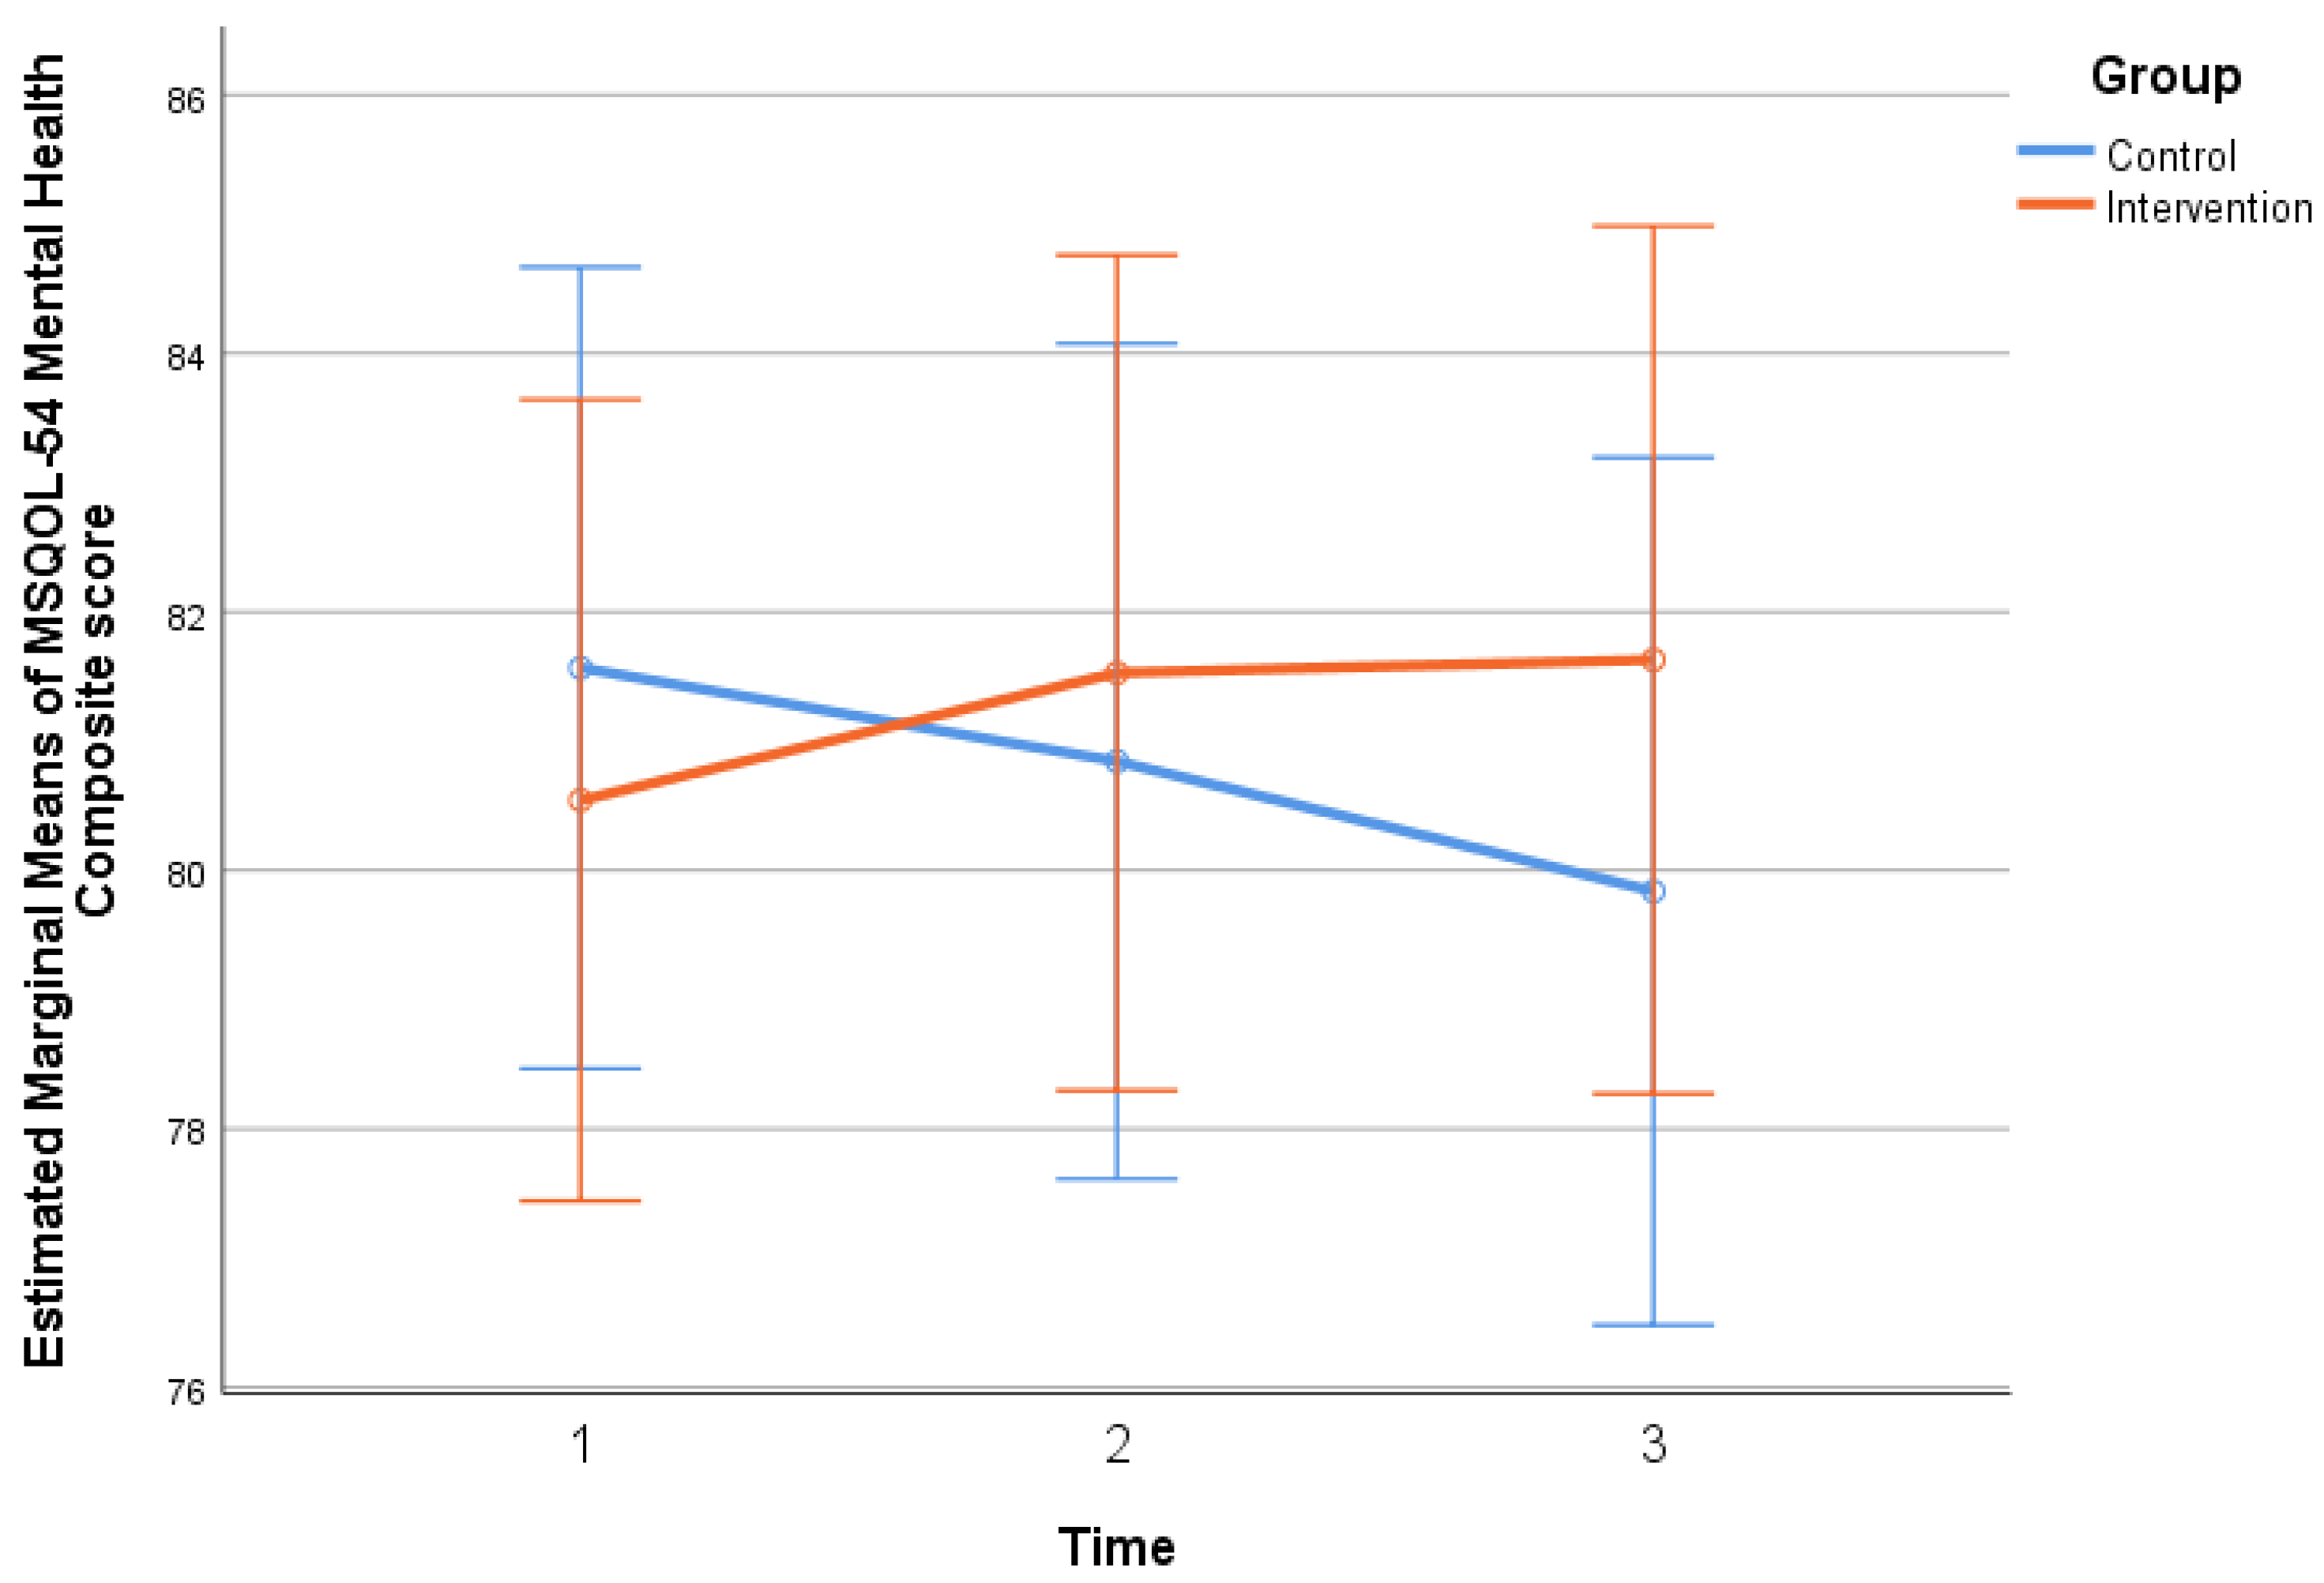
Participants’ composite scores of MSQOL-54 and MSIS-29 scales throughout the follow-up period, by group, are presented in
Table 4. No significant differences were found between the two groups at each time point (p>0.05). Participants’ scores in MSIS-29 scales did not change significantly throughout the follow-up period, however in mental health composite the extent of change was found to be statistically significant (p=0.050), since in the control group there was an increase and, in the intervention group a decrease, yet not significant ones. MSQOL-54 physical health composite score remained at similar levels throughout the follow-up, while in the control group there was a significant decrease at time 3, indicating a deterioration in the patients' physical health, compared to time 2 (p=0.012). The extent of change in the MSQOL-54 physical health composite score was similar in both groups (p>0.05). MSQOL-54 mental health composite score remained at similar levels throughout the follow-up, while in the control group there was a significant decrease in time 3, indicating a worsening of the patients' mental health, compared to time 1 (p=0.050). The extent of change in the MSQOL-54 mental health composite score differed significantly between the two groups (p=0.007), as presented in
Figure 4 (pg:15).
3.1. Correlations Among the Changes in All Under-Study Scales in the Intervention Group
There was a significant positive correlation of the change in the MNA scale with changes in Physical Health (rho=0.35; p=0.004) and Role limitations due to physical problems (rho=0.33; p=0.007). Thus, the more the patients' nutrition improved, the more their quality of life improved in these domains. Moreover, the more the patients' physical health improved (based on the MSIS-29 scale), the more their functional difficulty decreased (rho=0.27; p=0.030) and the more their nutrition improved (rho=-0.25; p=0.045).
3.2. Association of the Changes in All Under-Study Scales in the Intervention Group with Their Characteristics
It was found that the change in MedDiet score presented a statistically significant difference between the two genders (p=0.047), as men (Mean =1.6; SD=4.3) had a significantly smaller increase when compared to women (Mean =3.6; SD=3.6). What is more, it was found that the change in Overall quality of life subscale of MSQOL-54 differed significantly between patients with children and patients without (p=0.042), as the former (Mean =1.1; SD=3.5) reported a significantly smaller increase compared to the latter (Mean =3.6; SD=5.0). No other significant associations were found between the changes in under-study scales and patients’ characteristics in the intervention group.
4. Discussion
4.1. Participation and Groups Characteristics
Participation in all three follow-ups was excellent in both intervention and control groups, with the characteristics of the two groups being similar (p>0.05). Multiple sclerosis, a chronic inflammatory disease of the central nervous system, appears to affect disproportionately women and Caucasian people [
12]. In the present study, women comprised 81.5% of the control group and 67.7% of the intervention group (Table:1, pg:8). Voskuhl et al. conducted a study with mice with an aim to examine the effect of gender on neurodegeneration and autoimmunity. Their findings suggested concluded that T lymphocytes may play a role. Women, due to hormonal modifications, are considered susceptible to multiple sclerosis, but men may be at risk for a faster and more severe progression of the disease [
13]. In the postmenopausal period, the inflammatory activity of the disease appears to decrease, while it is argued that the female peripheral immune system responds more effectively, limiting the activity of the disease [
14,
15].
4.2. Education
In the present study, university graduates constituted 40.0% of the control group and 58.5% of the intervention group (Table:1, pg:8). Higher educational level is associated with positive disease progression and improved quality of life indicators. Patients with higher academic achievements seem to have better memory and information processing abilities, as well as well-being, something that potentially facilitates patients with multiple sclerosis in seeking better job opportunities [
16].
4.3. Income
In the present study, 56.9% of the control group and 53.8% of the intervention group had a moderate income (Table:1, pg:8). A study by Vozikis and Sotiropoulou in Greece showed that patients face financial uncertainty due to high healthcare costs, with costs ranging from 3,629 to 22,800 euros per year [
17]. The overall financial burden of multiple sclerosis is high, affecting the quality of life of patients. Ellenberger et al. presented a study in which differences were found among the countries investigated (Germany, Poland, Sweden and the United Kingdom). This finding underlines the lack of equality at the European level, which in turn seems to affect the progression of patients' disability [
18].
4.4. Pain
The total scores of pain, which is one of the most common symptoms of the disease, did not present significant changes, with the two groups experiencing similar levels of pain. According to a study by Junqueira et al., pain negatively affected the quality of life of patients, presenting a negative relation to their physical activity and mood [
19]. Exercise and a healthy diet seem to reduce pain levels among MS patients. As reported by Strober et al., a balanced diet that provides adequate nutrients, can positively affect the patients’ well-being [
20].
4.5. Emotional Well-Being
The emotional well-being score in the third measurement presented statistically significant decrease, showing a deterioration in the patients’ quality of life. The rate of change in the emotional well-being score was different between the two groups (p=0.009, Table:2, pg:9). A six-month study that evaluated the effectiveness of a wellness intervention, which also included a dietetic intervention (paleolithic, vegetarian, Mediterranean), found that the intervention group showed a statistically significant improvement in quality of life and a reduction in fatigue [
21].
4.6. Cognitive Function and Overall Quality of Life
In the domains of cognitive function and overall quality of life, scores in the intervention group increased (2nd measurement p=0.044 for cognitive function and p<0.001 for overall quality of life and 3rd measurement p= 0.005 for cognitive function and p<0.001 for overall quality of life, Table:2, pg:9). Cognitive difficulties and depression seem to concern a significant number of patients and are a common feature that affects the quality of life of patients with a study reporting that the prevalence of cognitive impairment ranges from 20% to 88% depending on the type of multiple sclerosis [
22]. Research related to the cognitive decline of patients showed that cognitive function is affected by a high body mass index (BMI), which negatively affects patients’ quality of life [
23].
4.7. Mental Health
The patients in the control group showed a deterioration in the mental health. The extent of change in the total mental health score on the MSQOL-54 Table: 3 (pg:12), differed between the two groups (p=0.007). A study with 6,989 participants, linked diet to disability and severity of symptoms in patients with multiple sclerosis. Patients with improved diet quality showed lower levels of disability as well as depression, while a healthy lifestyle reduced fatigue and depression [
24].
4.8. Significance of Nutrition in Multiple Sclerosis
The MedDiet scale score in the intervention group (p=0.007 and p=0.001, Table: 4, pg:14), revealed higher rates of adherence to the Mediterranean. Additionally, in the intervention group, the MSRS-R score (p<0.001, Table: 4, pg:14) showed a decrease in functional impairment, the MNA score (p=0.023, Table: 4, pg:14) showed an improvement in nutrition and the MedDiet score (p<0.001, Table: 4, pg:14) showed an improvement in the patients' dietary habits based on the Mediterranean pattern. Furthermore, in the intervention group, as the patients' nutrition improved, their quality of life improved and conversely as the patients' physical health improved (MSIS-29 scale), their functional impairment decreased (rho=0.27; p=0.030). The control group, showed a decrease in the physical health score (MSQOL-54) at the 3rd measurement, indicating a deterioration of the patients’ physical health compared to the 2nd measurement (p=0.012). A study by Yadav et al. highlighted the importance of nutrition in the development and improvement of multiple sclerosis [
25]. A healthy and balanced diet was associated with milder symptoms and disease progression as reported by Simpson-Yap et al. [
26]. Individuals, who did not follow a specialized diet program seemed to be more likely to be obese and more prone to develop progressive multiple sclerosis [
27]. Cantoni et al. reported that, in the context of multiple sclerosis, dietary restriction may contribute positively to the disease due to its neuroprotective effect, where specific dietary interventions for the prevention and treatment of the disease are mentioned [
28]. Dietary factors have been shown to influence the incidence, severity of symptoms and progression of multiple sclerosis. The role of specific dietary factors such as higher intake of processed meat was associated with an increased risk of multiple sclerosis as presented in a study by Ghazavi et al., in Iran [
29]. For patients with multiple sclerosis, it is particularly important to follow a balanced diet, avoiding a high BMI that may cause problems in the progression of the disease [
30]. Incorporating the Mediterranean diet into patients’ daily life can be a particularly effective strategy in terms of improving the quality of life and overall health of people suffering from multiple sclerosis. Besides, as demonstrated by the images-diagrams on pages 10,11 and 14, patients who follow this dietary pattern show significant improvements in their well-being and physical condition.
As far as the finding concerning the intervention group and its compliance with the Mediterranean diet is concerned, it appears that men showed a smaller increase in MedDiet score compared to women, something that it is not supported by the evidence in the extant literature. This may be explained by the different dietary preferences, and more specifically by the fact that men may have a greater preference for meat or high-protein foods, which are not included among the staples of the Mediterranean diet. Another explanation could be the decreased flexibility of men’s dietary habits when compared to women, and therefore their difficulty in adapting to new dietary practices such as those associated with the Mediterranean diet. A further explanation may be the level of interest and discipline, with women possibly being more disciplined in adopting healthy eating habits compared to men. Finally, another explanation could be the influence of social factors, such as peer pressure or social expectations, which may influence the eating behaviors of men and women differently.
Furthermore, it was found that the change in the overall quality of life subscale of the MSQOL-54 differed significantly between patients with and without children. Nevertheless, this finding, which was not supported by evidence in the relevant literature, could be interpreted. One reason could be the time availability of patients without children, who have more free time to focus on monitoring their diet and implementing the proposed changes. Another possible explanation is that these patients may have more resources to buy healthy foods or follow nutritional advice. Undoubtedly, when there is a supportive environment, the provided encouragement and support ensure improved compliance with healthy eating habits.
5. Conclusions
The Mediterranean diet appears to have a positive effect on the quality of life, cognitive function and functional capacity of patients with multiple sclerosis. The Mediterranean diet intervention was associated with an improvement in patients’, while the control group showed a decrease in their quality of life. The MNA score was positively associated with physical and mental health. Furthermore, it was found that the change in the MedDiet nutritional score differs significantly between men and women, with women presenting a greater improvement. Finally, the perceived quality of life in patients without children was higher compared to those having children. The adoption of the Mediterranean diet may be an effective approach to improve the quality of life and general health of patients with multiple sclerosis.
6. Research Limitations
The present study faced several methodological limitations including the small sample size, as well as the fact that it was conducted in a single healthcare institution. The specific public hospital was chosen due to the existence of an organized Neurology Clinic and Outpatient Clinics, where a significant number of patients with multiple sclerosis are monitored. For practical reasons, this allowed the researchers to focus more adequately on their research objectives. The coronavirus pandemic was a factor that prevented the collection of a larger sample, as several patients turned to intangible prescription and avoided hospital visits. However, respondents were very positive about the response and participation in the study. The small sample size does not allow the generalization of the results and findings of the study to the entire population of patients with multiple sclerosis in Greece. Therefore, the findings of the study are only indicative. Furthermore, the self-assessment of individuals with multiple sclerosis, on all scales, was subjective and therefore may have introduced systematic bias. Furthermore, the association between diet and functional disability could have been demonstrated in a more straightforward manner if the patients' anti-inflammatory or antioxidant parameters were measured, an analysis that was practically impossible in the context of this study. Also, no biochemical parameters were taken into consideration that might have seemed useful for portraying the general condition of the participants.
Authors Contributions
All authors contributed to the study’s conception, design and approved the final manuscript. Specifically, K.M.: Conceptualization, Methodology, Formal analysis, Investigation, Resources, Data Curation, Writing - Original Draft, Visualization C.T.: Methodology, Conceptualization, Writing - Review & Editing E.D.: Resources, Investigation, Writing - Review & Editing N.M.: Conceptualization, Methodology, Investigation, Resources, Writing - Review & Editing, Supervision, Project administration.
Funding
This research did not receive any specific grant from funding agencies in the public, commercial, or not-for-profit sectors.
Institutional Review Board Statement
The study was carried out in accordance with the principles of the Declaration of Helsinki. Approval was obtained by a) by the Ethics and Deontology Committee (E.H.D.E) of the University of Western Attica (P.D.A.) (19th/ 07-06-2021) and b) by the Scientific Committee of the General Hospital of Nicaea Piraeus (issue ID.16th, decision of the 21st /02-09-2020). The aforementioned measures ensure that the study was conducted in accordance with ethical standards as defined in the 1964 Declaration of Helsinki and its subsequent amendments or comparable ethical standards.
Informed Consent Statement
All participants provided written informed consent.
Data Availability Statement
We cannot share this research data publicly, because individual privacy could be compromised.
Acknowledgments
For the preparation of this study, we would like to warmly thank the patients with Multiple Sclerosis, who voluntarily accepted to participate in the research, for the trust and kindness they showed us. We owe special thanks to the director and scientific manager of the Neurological Clinic, Mr. Markakis, and the clinic's medical team for their valuable cooperation. We should also express our gratitude to the heads of the neurological clinic and regular outpatient clinics, Ms. Siganou and Ms. Karadagi, respectively, as well as to the nurses Ms. Tiniakou (Nurse TE Neurology), Ms. Stasinou (Nurse TE Regular Outpatient Neurology Clinics), whose help was valuable and essential, in hosting, informing and motivating the patients to participate in research. We would like to thank Wicks P, Hobart J, Panagiotakos D, Vellas B, Vickrey B, for permission to use their questionnaires.
Conflicts of Interest
The authors declare no conflict of interest.
Abbreviations
MS = Multiple Sclerosis
MSRS-R = Multiple Sclerosis Rating Scale-Revised
MSIS-29 = Multiple Sclerosis Impact Scale-29
MedDiet score = The Mediterranean Diet Score
MNA = Mini Nutritional Assessment
ΒΜΙ = Body Mass Index
MSQOL-54 = Multiple Sclerosis Quality of Life-54
QoL= Quality of life
Mediterranean Diet Information Sheet
Diet is a way of life and should be combined with water consumption, exercise and good sleep hygiene. Enjoyment and variety in diet are essential. But what is deemed more essential is the maintenance of a healthy body weight.
Olive oil is the cornerstone of the Mediterranean diet, which is why it is advised to be used in cooking.
Additionally, you should:
Always have breakfast.
Avoid eating out frequently.
Avoid processed meals and snacks.
Avoid increased salt addition.
Avoid excessive alcohol (a glass of wine is considered good) and soft drinks.
Consume lots of fresh, seasonal fruits and vegetables.
Consume fewer legumes and more oily fish.
Consume unsalted nuts.Consume wholegrain cereals/ pasta, potatoes, brown rice, multigrain bread.
Consume fish (Moderate to High consumption).
Consume dairy products in moderation.
Low consumption of red meat.
Low consumption of sweets and sugar. |
Advices for patients with multiple sclerosis
BESIDES HEALTHY DIET YOU SHOULD ALSO PAY ATTENTION TO:
Stress is not advisable.
Exercise is essential.
Relaxation is essential.
A good night's sleep is essential.
Avoid smoking, alcohol.
Avoid extreme temperatures.
Sun exposure is prohibited during the summer months.
Adherence to medication.Go through medical appointments-examinations.
It is essential to keep a diary, where you will record anything related to the medical record - medical visits and hospitalizations……….
Adopt an optimistic way of thinking. |
References
- Esposito, S.; Bonavita, S.; Sparaco, M.; Gallo, A.; Tedeschi, G.; Esposito, S.; Bonavita, S.; Sparaco, M.; Gallo, A.; Tedeschi, G.; et al. The role of diet in multiple sclerosis: A review. Nutr. Neurosci. 2018, 21, 377–390. [Google Scholar] [CrossRef]
- Lane, J.; Ng, H.S.; Poyser, C.; Lucas, R.M.; Tremlett, H. Multiple sclerosis incidence: A systematic review of change over time by geographical region. Mult. Scler. Relat. Disord. 2022, 63, 103932. [Google Scholar] [CrossRef] [PubMed]
- Puthenparampil, M.; Perini, P.; Bergamaschi, R.; Capobianco, M.; Filippi, M.; Gallo, P. Multiple sclerosis epidemiological trends in Italy highlight the environmental risk factors. J. Neurol. 2022, 269, 1817–1824. [Google Scholar] [CrossRef]
- Amato, M.P.; Derfuss, T.; Hemmer, B.; Liblau, R.; Montalban, X.; Sørensen, P.S.; Miller, D.H. ; For the 2016 ECTRIMS Focused Workshop Group Environmental modifiable risk factors for multiple sclerosis: Report from the 2016 ECTRIMS focused workshop. Mult. Scler. J. 2018, 24, 590–603. [Google Scholar] [CrossRef] [PubMed]
- Russell, R.D.; Black, L.J.; Begley, A. Nutrition Education Programs for Adults with Neurological Diseases Are Lacking: A Scoping Review. Nutrients 2022, 14, 1577. [Google Scholar] [CrossRef]
- Matala A, & Grivetti L.: Diet and Culture. Nutrition in Greece. Matala A (ed): Kallipos, Open Academic Publications; 2015, Chap. 5,115-125. Access: 19 September 2024: https://hdl.handle.net/11419/3806.
- Wicks, P.; E Vaughan, T.; Massagli, M.P. The multiple sclerosis rating scale, revised (MSRS-R): Development, refinement, and psychometric validation using an online community. Heal. Qual. Life Outcomes 2012, 10, 70–70. [Google Scholar] [CrossRef] [PubMed]
- Ware JEJr, & Sherbourne CD.: The MOS 36-item short-form health survey (SF-36). I. Conceptual framework and item selection. Med Care. 1992, 30(6):473-83. https://pubmed.ncbi.nlm.nih.gov/1593914/.
- Panagiotakos, D.B.; Pitsavos, C.; Stefanadis, C. Dietary patterns: A Mediterranean diet score and its relation to clinical and biological markers of cardiovascular disease risk. Nutr. Metab. Cardiovasc. Dis. 2006, 16, 559–568. [Google Scholar] [CrossRef]
- Vellas, B.; Guigoz, Y.; Garry, P.J.; Nourhashemi, F.; Bennahum, D.; Lauque, S.; Albarede, J.-L. The mini nutritional assessment (MNA) and its use in grading the nutritional state of elderly patients. Nutrients 1996, 15, 116–122. [Google Scholar] [CrossRef] [PubMed]
- Vickrey, B.G.; Hays, R.D.; Harooni, R.; Myers, L.W.; Ellison, G.W. A health-related quality of life measure for multiple sclerosis. Qual. Life Res. 1995, 4, 187–206. [Google Scholar] [CrossRef]
- Barnett, M.H.; McLeod, J.G.; Hammond, S.R.; Kurtzke, J.F. Migration and multiple sclerosis in immigrants from United Kingdom and Ireland to Australia: a reassessment. III: risk of multiple sclerosis in UKI immigrants and Australian-born in Hobart, Tasmania. J. Neurol. 2016, 263, 792–798. [Google Scholar] [CrossRef] [PubMed]
- Voskuhl, R.R.; Sawalha, A.H.; Itoh, Y. Sex chromosome contributions to sex differences in multiple sclerosis susceptibility and progression. Mult. Scler. J. 2018, 24, 22–31. [Google Scholar] [CrossRef] [PubMed]
- Gilli, F.; DiSano, K.D.; Pachner, A.R. SeXX Matters in Multiple Sclerosis. Front. Neurol. 2020, 11, 616. [Google Scholar] [CrossRef] [PubMed]
- Angeloni, B.; Bigi, R.; Bellucci, G.; Mechelli, R.; Ballerini, C.; Romano, C.; Morena, E.; Pellicciari, G.; Reniè, R.; Rinaldi, V.; et al. A Case of Double Standard: Sex Differences in Multiple Sclerosis Risk Factors. Int. J. Mol. Sci. 2021, 22, 3696. [Google Scholar] [CrossRef]
- Yalachkov, Y.; Soydaş, D.; Bergmann, J.; Frisch, S.; Behrens, M.; Foerch, C.; Gehrig, J. Determinants of quality of life in relapsing-remitting and progressive multiple sclerosis. Mult. Scler. Relat. Disord. 2019, 30, 33–37. [Google Scholar] [CrossRef]
- Vozikis A, & Sotiropoulou E.: Multiple sclerosis in Greece: an analysis of out-of-pocket payments. Archives of Greek Medicine. 2011, 29(4): 448-453. Access: 19 September 2024: https://www.mednet.gr/archives/2012-4/448abs.html.
- Ellenberger, D.; Parciak, T.; Brola, W.; Hillert, J.; Middleton, R.; Stahmann, A.; Thalheim, C.; Flachenecker, P. Comparison of employment among people with Multiple Sclerosis across Europe. Mult. Scler. J. - Exp. Transl. Clin. 2022, 8. [Google Scholar] [CrossRef] [PubMed]
- Junqueira, A.F.; Farraposo, S.; Cruz, A.R.; Mamede, M.P.; Silva, L.; Mesquita, G. Pain Prevalence in Multiple Sclerosis in a Lisbon Tertiary Hospital: A Cross-Sectional Study. Cureus 2022, 14, e22213. [Google Scholar] [CrossRef] [PubMed]
- Strober, L.B.; Becker, A.; Randolph, J.J. Role of positive lifestyle activities on mood, cognition, well-being, and disease characteristics in multiple sclerosis. Appl. Neuropsychol. Adult 2018, 25, 304–311. [Google Scholar] [CrossRef]
- Titcomb, T.J.; Sherwood, M.; Ehlinger, M.; Saxby, S.M.; Shemirani, F.; Eyck, P.T.; Wahls, T.L.; Snetselaar, L.G. Evaluation of a web-based program for the adoption of wellness behaviors to self-manage fatigue and improve quality of life among people with multiple sclerosis: A randomized waitlist-control trial. Mult. Scler. Relat. Disord. 2023, 77, 104858–104858. [Google Scholar] [CrossRef]
- Jellinger, K.A. Cognitive impairment in multiple sclerosis: from phenomenology to neurobiological mechanisms. J. Neural Transm. 2024, 131, 871–899. [Google Scholar] [CrossRef] [PubMed]
- Owji, M.; Ashraf-Ganjouei, A.; Sahraian, M.A.; Bidadian, M.; Ghadiri, F.; Moghadasi, A.N. The relationship between cognitive function and body mass index in multiple sclerosis patients. Mult. Scler. Relat. Disord. 2019, 32, 37–40. [Google Scholar] [CrossRef] [PubMed]
- Fitzgerald, K.C.; Tyry, T.; Salter, A.; Cofield, S.S.; Cutter, G.; Fox, R.; Marrie, R.A. Diet quality is associated with disability and symptom severity in multiple sclerosis. Neurology 2018, 90, e1–e11. [Google Scholar] [CrossRef]
- Yadav, V.; Marracci, G.; Kim, E.; Spain, R.; Cameron, M.; Overs, S.; Riddehough, A.; Li, D.K.; McDougall, J.; Lovera, J.; et al. Low-fat, plant-based diet in multiple sclerosis: A randomized controlled trial. Mult. Scler. Relat. Disord. 2016, 9, 80–90. [Google Scholar] [CrossRef] [PubMed]
- Simpson-Yap, S.; Nag, N.; Probst, Y.; Jelinek, G.; Neate, S. Higher-quality diet and non-consumption of meat are associated with less self-determined disability progression in people with multiple sclerosis: A longitudinal cohort study. Eur. J. Neurol. 2022, 29, 225–236. [Google Scholar] [CrossRef]
- Fitzgerald, K.C.; Tyry, T.; Salter, A.; Cofield, S.S.; Cutter, G.; Fox, R.J.; Marrie, R.A. A survey of dietary characteristics in a large population of people with multiple sclerosis. Mult. Scler. Relat. Disord. 2018, 22, 12–18. [Google Scholar] [CrossRef] [PubMed]
- Cantoni, C.; Dorsett, Y.; Fontana, L.; Zhou, Y.; Piccio, L. Effects of dietary restriction on gut microbiota and CNS autoimmunity. Clin. Immunol. 2022, 235, 108575. [Google Scholar] [CrossRef] [PubMed]
- Ghazavi, Y.; Bahadoran, Z.; Nikfarjam, M.; Moghaddam, N.B.; Mirmiran, P.; Heydari, M.R. Comparison of Food Intake in Multiple Sclerosis Patients and Healthy Individuals: A Hospital-Based Case-Controlled Study. 2019, 13, 143–154.
- Saka M, Saka M, Koseler E, et al.: Nutritional status and anthropometric measurements of patients with multiple sclerosis. Saudi Med J. 2012, 33(2):160-6. https://pubmed.ncbi.nlm.nih.gov/22327756/.
|
Disclaimer/Publisher’s Note: The statements, opinions and data contained in all publications are solely those of the individual author(s) and contributor(s) and not of MDPI and/or the editor(s). MDPI and/or the editor(s) disclaim responsibility for any injury to people or property resulting from any ideas, methods, instructions or products referred to in the content. |
© 2024 by the authors. Licensee MDPI, Basel, Switzerland. This article is an open access article distributed under the terms and conditions of the Creative Commons Attribution (CC BY) license (http://creativecommons.org/licenses/by/4.0/).