
Submitted:
16 December 2024
Posted:
17 December 2024
You are already at the latest version
Abstract
Climate constraints impose greenhouse gas emissions mitigation and the passenger cars have considerable contributions to give it. To improve engine efficiency of vehicles equipped with conventional powertrains, many technologies are available but with limited individual contribution. The experimental assessment of some technology regarding fuel economy measurement results is sometimes lower than test uncertainties. This study proposes a methodology to compensate the fuel economy for two test uncertainties: vehicle speed variations and battery recharging. The proposed method can be applied when investigating the effects of different vehicle design changes, including engine powercell design, in this work, the proposed method is demonstrated on the test of oils with two different viscosities, which allows a more detailed analysis. Applying the proposed methodology to experimental results changed from a raw 1.3% reduction in fuel consumption measured in the combined cycle to 2.9% compensated by these two uncertainties considering a vehicle numerical simulation model, a more plausible and reliable result.
Keywords:
fuel consumption measurement and simulation
; fuel economy experimental uncertainties
; low viscosity lubricant
; speed profile compensation
; vehicle energy balance effect
1. Introduction
The climate emergency demands multiple actions to stop global warming by reducing greenhouse gas emissions. Passenger cars have a lot to contribute to this purpose, for example in the vehicle driving phase, with the adoption of technologies that improves energy efficiency. The effectiveness of these technologies varies according to their complexity and the contribution of each technology applied to internal combustion engines is individually small, sometimes smaller than the uncertainties in available measuring method, which makes their experimental validation difficult and less reliable.
A significant percent of fuel in cars is consumed by friction. Hypothetically, by reducing the powertrain friction to zero, one could improve fuel economy and reduce GHG emissions by as much as 25% [1,2]. Lubrication regimes can be divided in boundary, mixed and hydrodynamic, depending on the ratio between oil film thickness and surface combined roughness. Lubricant Friction modifiers acting on the moving surfaces will influence only the boundary and somehow the mixed regimes, while oil viscosity and viscous modifiers will mostly influence the hydrodynamic regime [2,3,4,5,6]. As an example, Figure 1 shows friction losses on a 4-cylinder, 2.0-liter Daimler M111 gasoline engine motored test; with oil main gallery temperature of 93 °C. Notice the different effects of lowering oil viscosity in the different engine sub-systems. Notice also that even with a significant viscosity reduction, the FMEP reduction is relatively modest. At 2000 rpm FMEP reduction was 0.07 bar, which assuming an IMEP of 2 bar would produce around 4%, probably a little more due to not considered savings in the oil pump [3].
Friction reduction contribution becomes more evident in low speeds and engine loads, frequent operating conditions in homologation cycles or real usage. Also, the influence of lubricant viscosity as a function of temperature is especially important during vehicle cold start and warm-up, as quantified by Rovai and Mady [7]. Zhmud et al. [5] investigated the quantitative impact of low-viscosity lubricants on vehicle standard test cycles and found that the lower the engine load the higher the fuel economy improvement. In general, the study predicted about 3% fuel consumption reduction by the replacement of a conventional lubricant viscosity by a low-viscosity alternative. Tormos et al. [6] calculated 1% fuel consumption reduction using low viscosity lubricant for a SUV in WLTC test cycle.
The relatively small impact of low-viscosity lubricant on vehicle fuel economy, compared to experimental uncertainties, which makes its experimental validation difficult even in laboratory in-cycle tests. The main experimental uncertainties must be analyzed and considered in the results.
The uncertainty impact on emissions and fuel economy for chassis dynamometer testing was performed by Di Russo, Stutenberg and Hall [8] in a passenger car equipped with a turbocharged 2.0-liter engine and 6-speed automatic transmission. In this study, the test uncertainties were categorized into two macro groups: the vehicle experimental setup uncertainties, which encompass the effects of vehicle, driver and environmental conditions, and the laboratory experimental equipment uncertainties. The total uncertainty on fuel economy determination observed by the carbon balance method was within ± 2% through urban, first and second phases of FTP75, and highway test cycles. Addition care was dedicated to minimizing test variability, e.g., using a robot driver and recharging 12 V battery during soak periods.
The fuel economy uncertainty in FTP75 test cycle of a passenger car equipped with a 2.0-liter engine and a 4-speed automatic transmission was analyzed with numerical simulations, correlated with experimental tests, by Wi and Park [9] in terms of vehicle speed profile maximum and minimum limits, higher and lower vehicle possible acceleration inside the speed tolerance and driver behavior in terms of vehicle speed stability. The allowable speed tolerances considered are the same of a Brazilian standard NBR6601 [10], resulted in 3.0% increase in fuel consumption driving through lower speed limit and 2.7% fuel consumption reduction when driving over the higher speed limit. Driving with lowest vehicle acceleration resulted in 5.0% reduction in fuel consumption with 6.8% fuel consumption increase if driving with higher vehicle acceleration. The vehicle speed stability according to driver skillful and behavior could increase fuel consumption from 0.4 to 8.7%.
Vehicle fuel consumption uncertainty analysis, an important tool for experimental validation, was developed by Lourenço et al. [11] resulting in about 3% uncertainty caused by driver’s behavior during the first two phases of FTP75 and 3.14% gap between the simulated and the experimental accumulated fuel consumption throughout the cycle, which confirms numerical simulation as a reliable prediction tool especially regarding comparative results.
The impact of battery state of charge (SOC) on fuel economy predictions is an important cause of test uncertainty, especially pronounced in electrified powertrains as observed by Kwon, Rousseau and Sharer [12] for the development of a vehicular fuel economy simulation tool.
Reliable comparative results regarding powertrain technologies’ impact on vehicle fuel economy, given its individual reduced contribution with magnitude close to test uncertainties and consequently challenging on experimental validation, can be obtained by dynamic numerical simulation tools. De Oliveira [13] developed a numerical simulation model of an existing car and compared simulation and experimental fuel economy results, in this case about 3% more optimistic for the mathematical model in FTP75 cycle. The impact of drive cycle, vehicle load and gear shifting were studied based on 1-D numerical simulation of a manual transmission passenger car by Rovai [14]. The influence of transmission concept of a passenger car, involving since the simplest 5-speed manual transmission through conventional automatic transmission up to continuously variable transmission, regarding gear shift strategy, torque converter or dual clutch characteristic curves and lock up strategies were simulated and compared by Rovai [15]. Rovai et al. [16] applied numerical simulation to predict the impact of engine compression ratio efficiency improvement experimentally observed in an engine test bench on a passenger car in-cycle simulation. Internal combustion engine cold-phase influence of lubricant temperature, catalytic converter light-off strategy and engine hardware warm-up were studied by Rovai and Mady [7] considering numerical simulation and experimental measurements, achieving 2% deviation between simulated hot conditions and measurements.
2. Materials and Methods
This study experimentally compares the influence of a lower viscosity engine oil on fuel economy results for a conventional combustion engine passenger car. As the comparative experimental results of just the engine friction reduction from the replacement of 5W40 by 5W20 engine oil should be within experimental uncertainties, which could lead to non-conclusive results, the compensation of the effective driven vehicle speed profile and the 12 V battery recharging strategy are applied based on vehicle measurements and numerical simulations. The importance of test compensation is quantified and discussed.
2.1. Tested Oils
Two fully formulated oils were tested. Table 1 shows the main characteristics. The two oils are OEM certified and do not contain Friction Modifiers.
2.2. Vehicle Emission Tests
The experimental emissions tests were performed with a large sport utility vehicle in a certified emissions laboratory following a combined cycle over a chassis dyno, according to NBR7024 [17], which is composed of 55% in an urban cycle (FTP75) and 45% in a highway cycle. To better investigate the influence of the GNP additive, the urban, FTP75, cycle was divided into three phases: Ph1, Ph2 and Ph3. See Figure 2. Ph3 has an identical vehicle speed profile but as the engine, and oil, are already hot, fuel consumption is significantly lower than on Ph1. The vehicle is equipped with a 4-cylinder, spark ignition, direct injection, turbocharged engine running on E22 (Brazilian reference gasoline with 22% v/v of anhydrous ethanol, [18]) coupled to a 6-gear automatic transmission by a torque converter.
Experimental variations were minimized keeping the same: vehicle, test cell and expert driver. Two test replications were performed with each lubricant version and the vehicle fuel consumption was determined by the carbon balance method. Despite the vehicle being equipped with Start-Stop system, this functionality was turned-off through vehicle control to avoid test variability eventually caused by engine stop differences between tests. Even though, the 12 V battery smart recharging strategy based on battery voltage, current and temperature from vehicle sensor remained working.
The 5W40 lubricant replacement by 5W20 was done in two steps to avoid any lubricant contamination. First, the 5W40 engine lubricant was replaced by a 5W20 and a new lubricant filter was installed to run the engine by about 10 minutes. After this first filled 5W20, used only to wash the engine, was drained again and a fresh 5W20 lubricant and filter were installed to be tested. Identical lubricant volumes were used on both lubricant variants, double-checked by the same oil level on dipstick.
The vehicle has start-stop system with battery monitoring system (BMS) on a negative pole to monitor battery voltage, current and temperature which allows optimized battery recharging strategy. The vehicle is equipped with a lead acid-enhanced flooded battery (EFB) 12 V battery. The vehicle was instrumented with a development ECU and the vehicle speed and battery voltage were recorded by ETAS Inca with 100 ms sample rate, measurements required for the proposed test uncertainty compensations.
2.3. Vehicle Mathematical Model
The test compensation factors for measured vehicle speed profile and battery voltage of each test were determined by 1-D dynamic numerical simulation with a vehicle mathematical model built in a GT-SUITE v.2024 from Gamma technologies, shown in Figure 3 with alternator efficiency map and vehicle speed profile detailed.
To achieve adequate correlation with experimental measurements, the mathematical model considers vehicle specific characteristics, following Rovai and Mady [7]:
- Engine-specific fuel consumption mapped in the dynamometer.
- Full-load engine curve.
- Engine idle speed.
- Fuel cut-off strategy.
- Torque demand as a function of gas pedal position.
- Transmission efficiency maps.
- Dynamic torque converter curves.
- Torque converter lock-up according to TCU maps.
- Gear shifting strategy according to TCU maps.
- Alternator efficiency map based on engine speed and electrical power.
3. Results
The raw experimental results, non-compensated, were presented in subsection 3.1 and subsections 3.2 and 3.3 present the test compensation proposed method.
3.1. Non-Compensated Experimental Results
The experimental fuel consumption variation based on the average of the two tests performed with each lubricant is shown in Table 2. Its expected fuel consumption reduction with the replacement of 5W40 by a 5W20.
The lower viscosity of 5W20 should reduce engine friction, improved in the cold phase of the test (Ph1) but not confirmed by experimental results. The warm phases, Ph2 and Ph3 of FTP75 presented better improvement than Ph1 but lower than expected, with only 0.62% lower fuel consumed through FTP75 which is composed by Ph1, Ph2 and Ph3. On the other hand, somehow surprisingly, the 5W20 presented 2.49% lower fuel consumed in the highway cycle. Compared to the urban cycle, the highway cycle runs on higher engine speeds and loads, conditions in which engine friction losses are less significant and consequently, the impact of a lower viscosity oil should be lower.
Although the tests were conducted under controlled conditions to minimize the uncertainty of fuel economy results, these experimental results were additionally compensated in terms of vehicle speed and electrical load impacts, variables outside the standard controlled conditions.
3.2. Vehicle Speed Compensation
3.2.1. Numerical Simulation of Vehicle Speed Profile Limits
As usual, even on well-controlled emissions tests, some vehicle speed variations are verified along the tests, inside the speed profile limits.
To investigate the actual car speed influence on fuel economy, the maximum and minimum test cycle speed profiles defined by NBR6601 [10] were generated to be used as input in a numerical simulation model, similar as the one described on Wi and Park [9]. Figure 4 shows the extreme speed profiles for Ph1 and Ph3 of FTP75, as an example. The grey line refers to the nominal cycle speed and the lower and higher speed limits are shown respectively in light and dark blue. The total cycle duration is the same for lower and higher profiles, consequently, the higher speed profile has a lower time on idle and a higher travelled distance. The opposite for the lower profile.
Figure 5, Figure 6 and Figure 7 compare the simulated parameter variations: average vehicle speed, average engine speed, average engine efficiency and vehicle fuel consumption in MJ/km (ratio between energy from fuel and travelled distance) of driving over higher or lower speed profiles related to nominal speed profile resulted from simulation for Ph1 or Ph3 (Figure 5) that has the same profile, Ph2 (Figure 6) and highway (Hwy, Figure 7) cycles. Simulations were performed with start-stop system turned off, the same condition as experimental measurements. Negative fuel consumption variations mean fuel consumption is lower than in the nominal speed profile, and positive is the opposite. Average vehicle speed variation is directly related to the total distance travelled for the same test time. Average engine speed variation compared to average vehicle speed helps to understand automatic transmission gear shifting, especially downshifts in lower profile. Average engine efficiency is based on global engine efficiency defined by the relation between mechanical output power over energy flow from fuel.
Ph1 and Ph3 results in Figure 5 have the same profiles and values because cold phase phenomena in Ph1 were not considered in these simulations. The vehicle drag force was simulated by vehicle coast down factors in function of vehicle speed, then the higher speed profile reduced fuel consumption even under higher drag forces and dissipated energy. This antagonistic result can be explained by the higher engine efficiency despite the higher travelled distance. The engine speed variations were lower than the vehicle speed variations due to the automatic transmission gearshift map based on vehicle speed and pedal position.
Results for Ph2 in Figure 6 presented the highest fuel consumption sensitivity to the speed profile with a considerable penalty for the lower profile. Lower vehicle speeds on Ph2 demanded transmission downshifts and consequently lower engine efficiency. Additionally, engine efficiency presented the highest sensitivity in this cycle which operates at lower speeds.
The simulations in highway cycle resulted on higher fuel consumption for the higher speed profile, and the opposite for the lower. See Figure 7. Variations in engine average speed are close to vehicle average speed indicating similar transmission ratio, without significant downshifts. Higher engine efficiency on higher loads reduced the higher distance travelled impact on fuel consumption.
Non-linearities between vehicle fuel consumption and speed profile were already observed by Wi and Park [9] and confirm the importance of test measurement compensation based on a representative mathematical model of the vehicle and the measurements of vehicle speed driven.
3.2.2. Vehicle Speed Compensation
The four comparative tests in vehicle tests 1 and 2 with 5W40 and tests 3 and 4 with 5W20 lubricant, were performed by an experienced driver which minimizes results variation regarding vehicle speed. The vehicle speed along the tests was recorded and data was used as an input in the numerical simulation to determine the vehicle speed compensation factors for test uncertainties.
Figure 8 illustrates, as example, the vehicle speeds in Ph3 measured along the four tests performed, detailed in the excerpt of the second cycle.
The simulation results of first test were considered as reference and the experimental results of the three subsequent tests were adjusted by the percentual factors in Table 3, positive values mean that the experimental fuel consumption result should be increased to neutralize the deviations of vehicle speed during the test in comparison with the reference test.
3.3. Electrical Load Compensation
According to the emission standards [19] the battery cannot be recharged along the test procedure. Conventional 12 V battery recharge impact on fuel economy is an important variable already observed by Di Russo, Stutenberg and Hall [8] that used to recharge vehicle battery during soak periods between tests to minimize experimental uncertainty regarding fuel economy analysis. The proposed vehicle electrical load compensation aims to account for the additional fuel consumed to recharge the vehicle battery according to the battery management system (BMS) strategy.
The battery can be effectively recharged when the vehicle’s electrical system commands the alternator voltage above 12 V. In these conditions, engine crankshaft runs alternator pulley that generates electrical power to vehicle electrical system. This energy conversion from fuel to electricity available to the battery should consider engine global efficiency, alternator efficiency and other residual losses, e.g., belt and tensioner.
In addition to the electrical system voltage, battery recharging still depends on the following variables. Battery state of charge (SOC) which varies from 0 to 100% depending on how much energy is accumulated compared to battery maximum storage capacity and is one of the parameters to determine the system voltage, and consequently the battery recharging power. Battery state of health (SOH) is an estimation of battery ageing and its actual compared to nominal storage capacity. Battery internal resistance that varies with battery temperature, important parameter to define recharging power to keep battery inside operating conditions avoiding its premature damage. Based on these information BMS defines the instant alternator electrical power demand.
3.3.1. Experimental Assessment of Battery Recharging Strategy
The BMS strategy was experimentally assessed in a similar vehicle in emissions laboratory by the measurement of battery voltage and current for different SOC conditions. These measurements resulted in the cloud of operating points in Figure 9, with the dispersion of the alternator’s electrical power as a function of the battery voltage. The alternator electrical load represents the electrical power required for battery recharging, plotted in negative values indicating that the energy is being consumed from the internal combustion engine crankshaft.
The points in Figure 9 confirm the alternator electrical power demand occurs only between 12.0 V and 14.8 V. The average of the alternator’s operating points as a function of voltage is represented by the “AVG recharging” line (green dashed line) applicable to repetitive tests with SOC close to the target, a most representative condition for repetitive emissions tests. The minimum recharging limit represented by the “MIN recharging” line (light blue dashed line), demands electrical power from the alternator only above 13.5 V, applicable when the battery SOC is above the target, aiming only to compensate for the vehicle’s electrical demand or in case of high battery temperature and internal resistance with limited battery recharging. The maximum battery recharging limit is represented by the “MAX recharging” line (dark blue dashed line) applicable if the battery SOC is below the target, limited by alternator power.
3.3.2. Battery Recharging Compensation
The vehicle used for lubricant viscosity comparison started the experimental tests with fully charged battery before test 1 without any external recharge till finishing the last test, number 4. The vehicle was parked in the laboratory soak area, sometimes more than one day between tests. After test 2 the vehicle was sent to the workshop for changing the oil to the lower viscosity one. Despite following vehicle conditioning standard procedure according to NBR6601 [10] it is observed battery SOC variations, were considered normal, along with fuel economy measurements.
Figure 10 shows average of recorded battery voltage, for each test phase, along with the four comparative tests, tests 1 and 2 with 5W40 and tests 3 and 4 with 5W20 lubricant.
Considering that vehicle BMS strategy determines electrical system voltage according to battery SOC deviation from target value, it can be noticed from Figure 10 that the first two phases of test 1 demanded lower battery recharging power with voltage below 12.5 V, raising to about 13 V on third phase and highway. System voltage was around 13.5 V during the second test, slightly lower on the highway. Between the second and third tests, the oil was changed to the lower viscosity oil, and the third test demanded more power for battery recharging above 14 V, the most demanding of the four performed tests. Finally, the fourth test presented voltage average values similar to the observed through the second test. For the highway cycle, the average voltage value was considered during the measurement phase, remembering that highway cycle performs a test conditioning with the same speed profile before the measurement phase, so the measurement is performed with the vehicle, and the battery, in stabilized conditions, which explains the lower average voltage observed in highway compared to Ph3.
An immediate conclusion from Figure 10 is if we compare these four tests without battery recharging compensation fuel economy values of test 3 would be prejudiced compared to test 1.
Improving the comparative analysis of tests 1 (in brown) and 3 (in light blue), Figure 11 shows measured battery voltage signal along these tests. Although average voltage is around 12.5 V during the first two phases of test 1 it can be observed voltage peaks, close to 14.6 V, during vehicle decelerations. Similar behavior was verified in phase 3 and highway of test 1, despite higher average voltage. The voltage peaks improve battery recharging during vehicle deceleration in fuel cut-off, without impacting fuel consumption. Test 3 presented stable battery voltage during most of the test time and, it’s interesting to observe that by the end of highway the voltage signal was below 13 V with the voltage peak during final deceleration, pointing battery reached SOC target assuming the same recharging strategy during highway of test 1. This dynamical battery voltage during recharging emphasizes the need for voltage signal measurement, instead of average value, for more accurate simulation to determine the compensation factors of battery recharging impact on fuel economy.
The battery electric current, temperature and SOC measurements were not available in the vehicle that ran the four comparative tests, tests 1 and 2 with 5W40 and tests 3 and 4 with 5W20 lubricant, so the test uncertainty compensations regarding electrical load were performed based on battery voltage.
The battery voltage along the tests was recorded and data was used as an input in the numerical simulation to compensate for the fuel consumption measurements uncertainties from the electrical load required for battery recharging. It is important to notice that the simple use of a compensation factor based on battery voltage may not adequately compensate for this uncertainty, because some variation of torque demanded from engine by the alternator could imply in gear shift depending on pedal position and vehicle speed, which is considered by the numerical simulation.
The electrical load compensation factors are shown in Table 4, Table 5 and Table 6 for the minimum, average and maximum battery recharging strategies, respectively. The simulation results of first test are considered as reference and the experimental results of the three subsequent tests should be adjusted by the percentual factors, positive factor means experimental fuel consumption result should be increased to neutralize battery recharging test deviations.
The minimum compensation factors in Table 4 are more applicable when vehicle starts the emissions tests with fully charged battery, above the SOC target, with electrical load aiming just to compensate for the vehicle’s electrical demand or in case of high battery temperature and internal resistance which limits battery recharging. The average compensation factors of Table 5 are applicable to repetitive tests with SOC close to its target which is a most representative condition for the repetitive emissions tests performed in this study. The maximum compensation factors of Table 6 are applicable for the tests in which the battery SOC is below the target, demanding higher battery recharging power. Although the minimum and maximum compensation factors have a low probability of representing the repetitive tests performed these values were calculated to quantify the potential of these impacts.
4. Discussion
The fuel consumption variation results in Figure 12 are the percentual variation of the average values of tests 3 and 4 performed with 5W20 lubricant (proposal) compared to the average values of tests 1 and 2 performed with 5W40 lubricant (series).
Although lower engine friction and consequently reduced fuel consumption is expected with lower viscosity lubricant, the uncompensated experimental values of “Test” data in Figure 12 did not confirm this tendency. The measurements in FTP75 resulted in 0.6% fuel consumption reduction without the observed advantage of low viscosity lubricant in the cold phase (Ph1), a condition in which the impact on engine friction in lower temperatures by lubricant viscosity increase is expected to be lower for low-viscosity lubricants, not observed. Additionally, the measured advantage was similar for Ph2 and Ph3, do not demonstrating the higher advantages of low-viscosity lubricants in lower engine speeds and loads required in Ph2 compared to Ph3. Another unexpected result from uncompensated measurements was the higher advantage of low-viscosity lubricant in the highway cycle than in the urban cycle (FTP75), achieving just 1.3% fuel economy in the combined cycle.
The vehicle speed percentual compensation, in Table 3, added to the compensation factors from Table 4, Table 5 and Table 6 show the compensation factor for, respectively, minimum, average and maximum battery recharging strategy. Measured values corrected by vehicle speed and battery charge uncertainties are plotted in Figure 12 as “MIN”, “AVG” and “MAX” values. The fuel economy on FTP75 turns reasonably higher than in Hwy for any of the three compensations. The higher expected improvements in Ph2, compared to Ph1 and Ph3, are verified for the compensated results too. Some low-viscosity lubricant advantage in Ph1 compared to Ph3 is noticeable above average battery recharging.
The compensated values help to explain the unexpected results from non-compensated experimental data. Even though the minimum battery strategy compensation achieved result in combined cycle close to non-compensated. The maximum of 5.0% reduction in fuel consumption could be hypothetically achieved for low SOC battery, not the case. The average compensation, more applicable to repetitive tests without external battery recharging as performed, resulted in 2.9% reduction in fuel consumption, 2.2 times higher than the uncompensated measurements, more plausible result.
5. Conclusions
The proposed methodology of vehicle fuel consumption measurement compensation by vehicle speed and battery recharging uncertainties resulted in more reliable and plausible results to compare and validate the relatively small benefits, even lower than test uncertainties, of vehicle technologies available to improve fuel economy.
In this study the experimental investigation of fuel economy improvement from just the replacement of the 5W40 engine lubricant by a 5W20, lower viscosity only proposal, in a large sport utility vehicle driving in a combined cycle resulted in just 1.3% fuel consumption reduction without experimental uncertainties compensation. Applying the compensation method proposed in this study the fuel economy reduction reached 2.9%, with plausible advantages in urban and highway.
Author Contributions
Conceptualization, F.R. and E.T.; methodology, F.R and E.T.; simulations, F.R.; experimental validation, F.R.; formal analysis, F.R. and E.T.; investigation, F.R. and E.T.; writing—original draft preparation, F.R. writing—review and editing, F.R. and E.T. All authors have read and agreed to the published version of the manuscript.
Funding
This research received no external funding.
Data Availability Statement
The original contributions presented in the study are included in the article, further inquiries can be sent to authors.
Conflicts of Interest
The authors declare no conflicts of interest.
References
- Schommers, J.; Scheib, H.; Hartweg, M. et al. “Minimizing friction in combustion engines”, MTZ World 74 (2013) 28.
- Tomanik, E.; Profito, F.; Sheets, B.; Souza, R. Combined lubricant–surface system approach for potential passenger car CO2 reduction on piston-ring-cylinder bore assembly, Tribology International, Volume 149, 2020, 105514, ISSN 0301-679X. [CrossRef]
- Taylor, R.; Morgan, N.; Mainwaring, R.; Davenport, T. How much mixed/boundary friction is there in an engine — and where is it? Proceedings of the Institution of Mechanical Engineers, Part J: Journal of Engineering Tribology. 2020;234(10):1563-1579. [CrossRef]
- Tomanik, E. et al. Powertrain Friction Reduction by Synergistic Optimization of the Cylinder Bore Surface and Lubricant Part 1: Basic Modelling. SAE Technical Paper, 2021.
- Zhmud, B. et al. Powertrain Friction Reduction by Synergistic Optimization of Cylinder Bore Surface and Lubricant-Part 2: Engine Tribology Simulations and Tests. SAE Technical Paper, 2021.
- Tormos, B. et al. Numerical Assessment of Tribological Performance of Different Low Viscosity Engine Oils in a 4-Stroke CI Light-Duty ICE. SAE International Journal of Advances and Current Practices in Mobility, v. 4, n. 2022-01-0321, p. 1524-1536, 2022. [CrossRef]
- ROVAI, F. F.; MADY, C. E. K. Thermodynamic Model for Cold-Phase Influence on Light Vehicles’ Fuel Consumption. Energies (19961073), v. 17, n. 16, 2024. [CrossRef]
- Di Russo, M.; Stutenberg, K.; Hall, C. M. Analysis of uncertainty impacts on emissions and fuel economy evaluation for chassis dynamometer testing. IEEE Transactions on Vehicular Technology, v. 72, n. 4, p. 4236-4251, 2022. [CrossRef]
- Wi, H.; Park, J. Analyzing uncertainty in evaluation of vehicle fuel economy using FTP-75. International Journal of Automotive Technology, v. 14, p. 471-477, 2013. [CrossRef]
- Brazilian National Standards Organization (ABNT)-NBR6601-Light Motor Vehicles: Determination of Hydrocarbons, Carbon Monoxide, Nitrogen Oxides, Carbon Dioxide and Particulate Matter in Exhaust Gas; ABNT: Rio de Janeiro, Brazil, 2021.
- Lourenço, M. A. de M. et al. Uncertainty analysis of vehicle fuel consumption in twin-roller chassis dynamometer experiments and simulation models. Mechanism and Machine Theory, v. 180, p. 105126, 2023.
- Kwon, J.; Rousseau, A.; Sharer, P. Analyzing the uncertainty in the fuel economy prediction for the EPA MOVES binning methodology. SAE Technical Paper, 2007.
- De Oliveira, M. F. et al. COB-2019-0026 Numerical one dimensional simulation and validation of a vehicle using NBR6601 US FTP 75.
- Rovai, F. F. Right Shifting for Fuel Economy. SAE Technical Paper, 2020.
- Rovai, F. F.; “Impacto do powertrain e das condições de dirigibilidade em economia de combustível”, p. 251-262. In: Anais do XXVIII SIMPÓSIO INTERNACIONAL DE ENGENHARIA AUTOMOTIVA. São Paulo: Blucher, 2021. ISSN 2357-7592. [CrossRef]
- Rovai, F. F.; Pedrozo, V. B.; Chaves, H. S.; Ferreira, M. dos S.; Miyamoto, M.; Uehara, S.; Guilherme, R. T. G.; Silva, E. L. D.; “Aumento na taxa de compressão para alavancar eficiência de motores flex fuel com biocombustíveis”, p. 361-370 . In: Anais do XXXI Simpósio Internacional de Engenharia Automotiva. São Paulo: Blucher, 2024. ISSN 2357-7592. [CrossRef]
- Brazilian National Standards Organization (ABNT)-NBR7024-Light Motor Vehicles: Measurement of the fuel consumption–Test method; ABNT: Rio de Janeiro, Brazil, 2010.
- Brazilian National Institute of Metrology, Quality and Technology (INMETRO)-Ordinance nº 15; Brazil, 2016.
- Brazilian National Institute of Metrology, Quality and Technology (INMETRO)-Ordinance nº 169; Brazil, 2023.
Figure 1.
Motored FMEP of different engine sub-systems (a) with SAE 15W40 oil (b) with equivalent of SAE 0W12 oil. (c) Delta due to the oil viscosity. Adapted from [3]. P+R is the Piston plus Rings.
Figure 1.
Motored FMEP of different engine sub-systems (a) with SAE 15W40 oil (b) with equivalent of SAE 0W12 oil. (c) Delta due to the oil viscosity. Adapted from [3]. P+R is the Piston plus Rings.
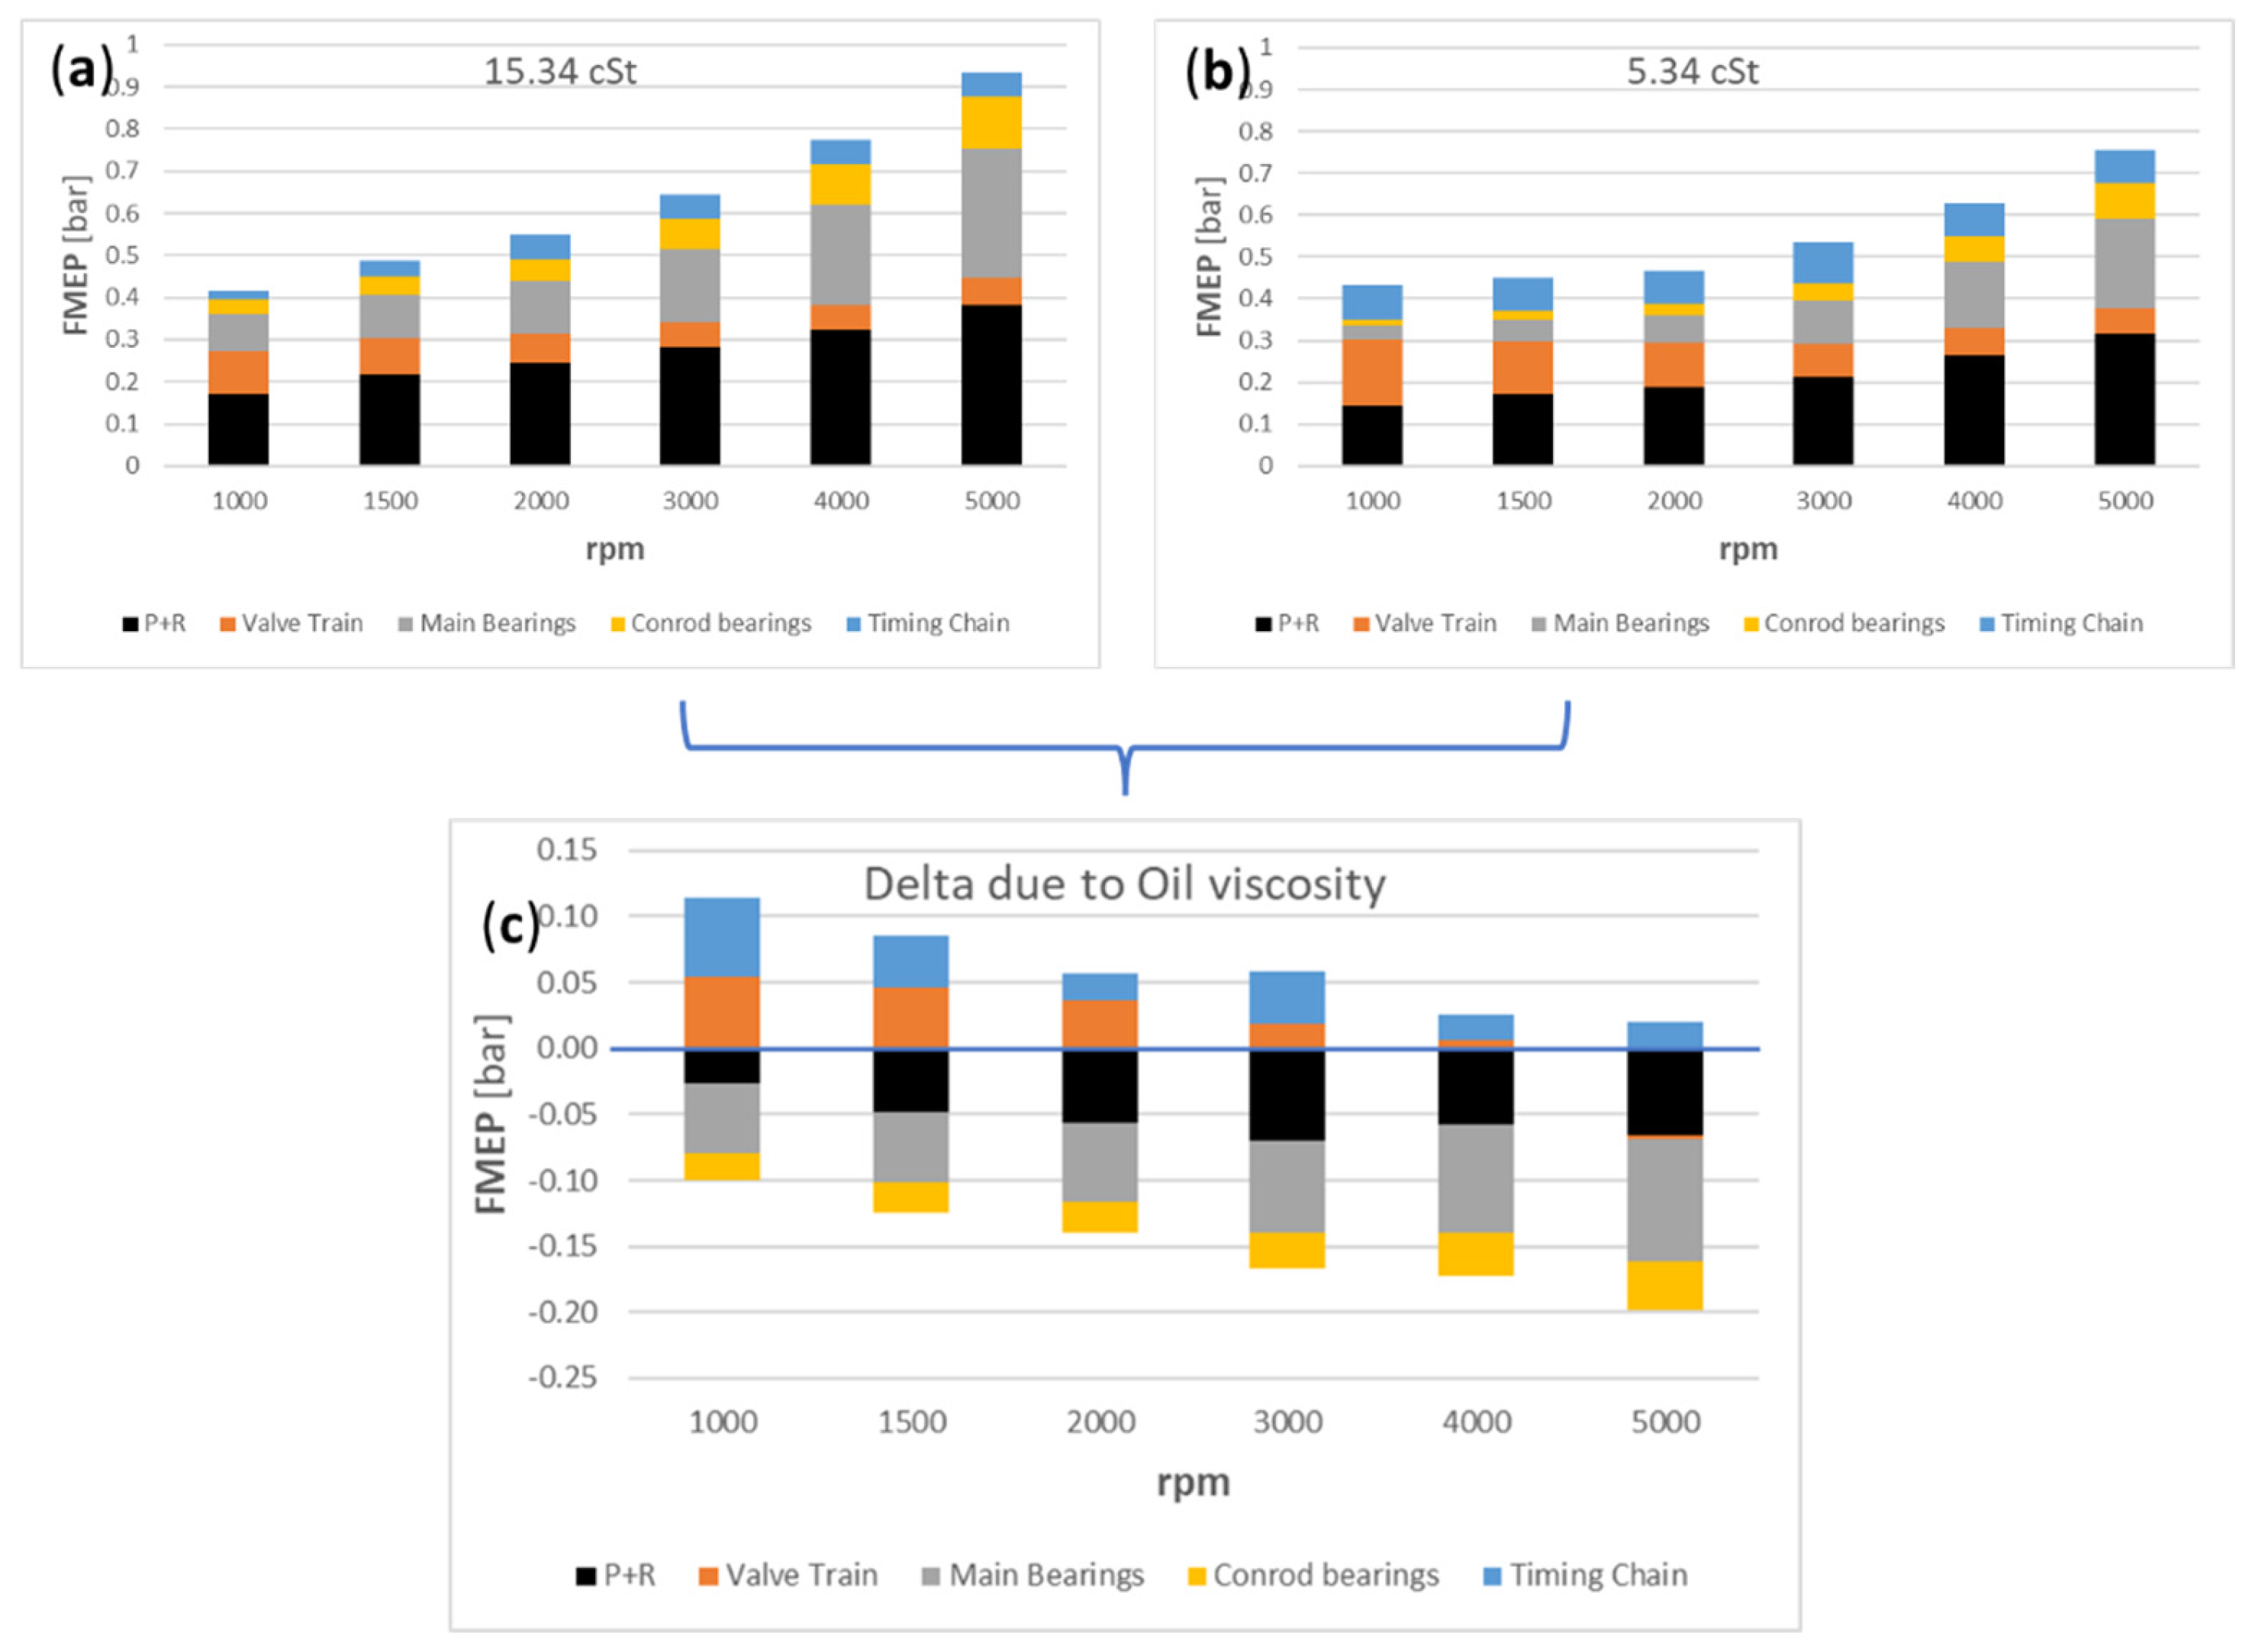
Figure 2.
Ph1 and Ph3 speed profiles are identical in the FTP75 emission test.
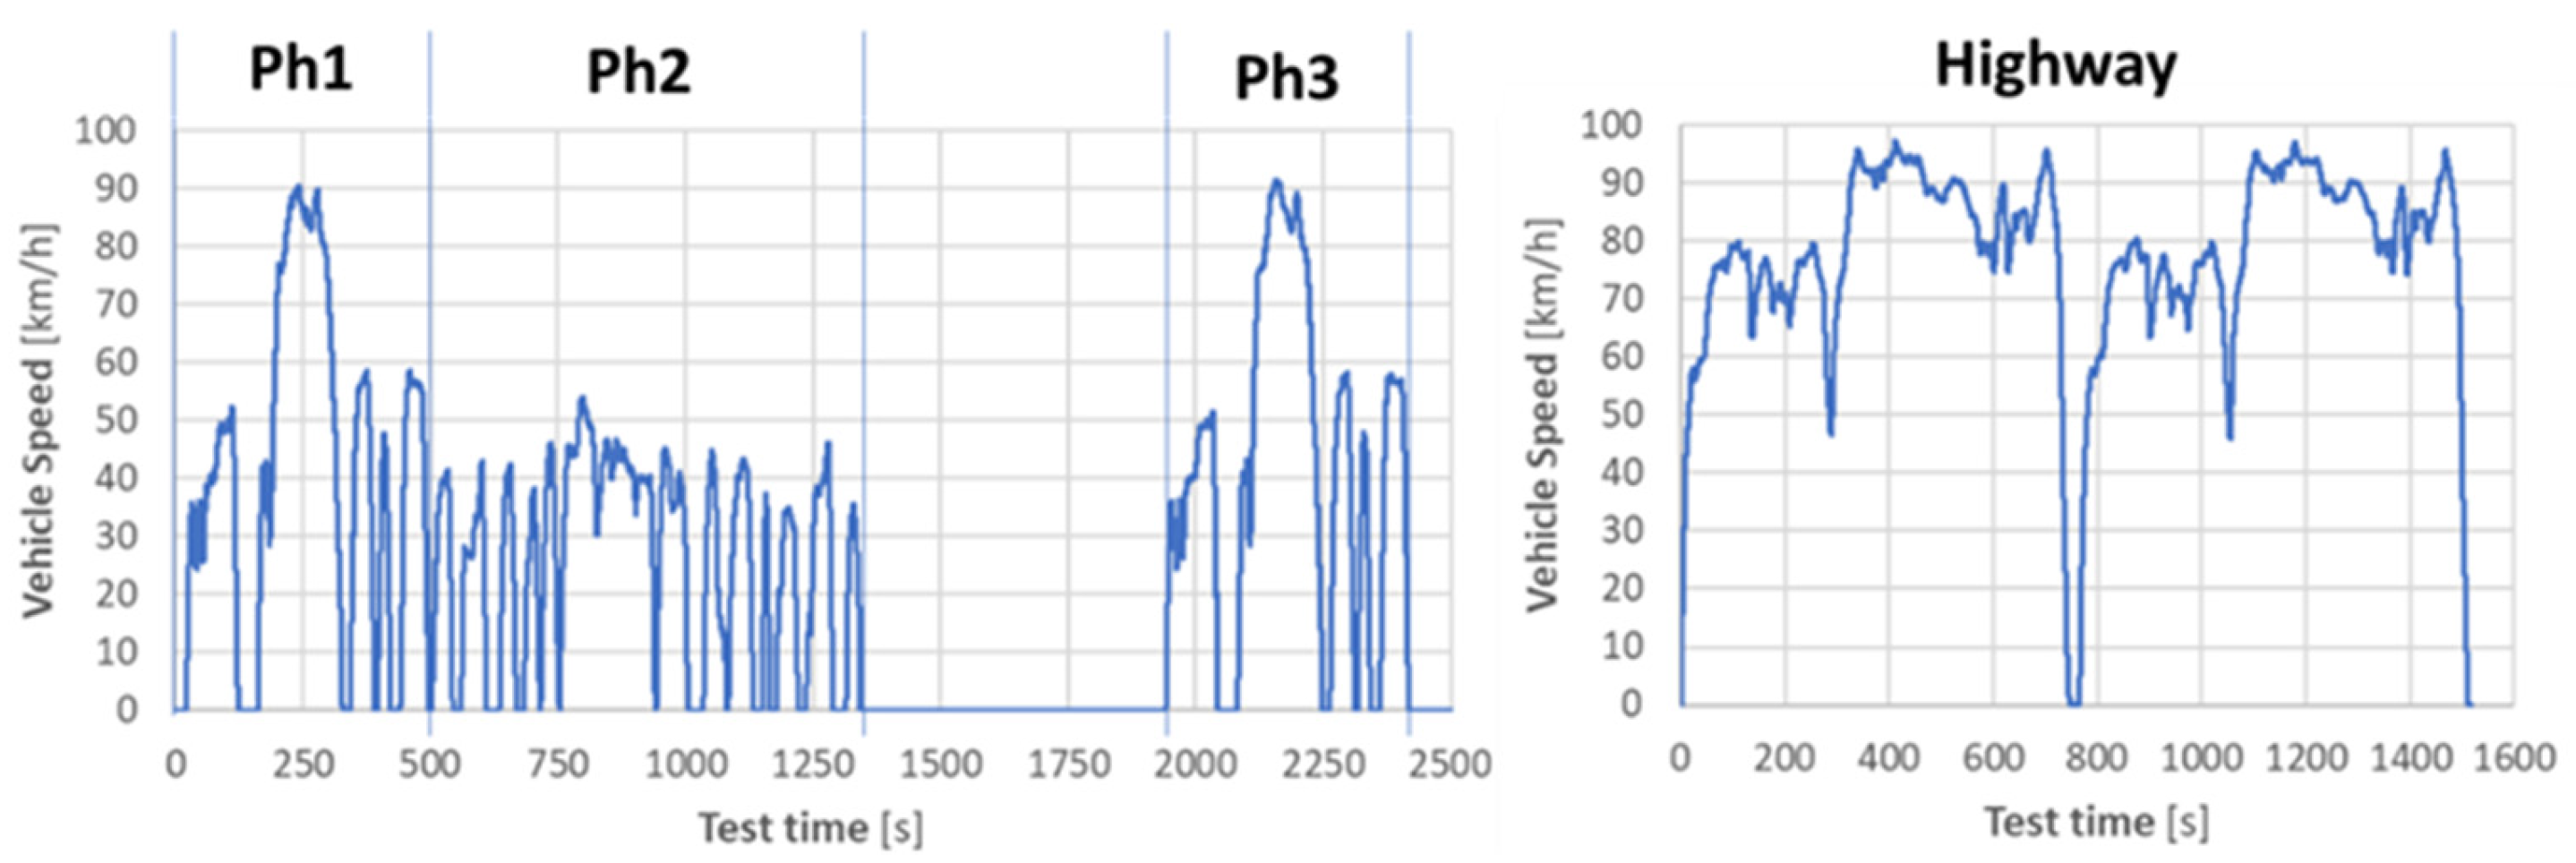
Figure 3.
Vehicle 1-D mathematical model (GT-SUITE v.2024).
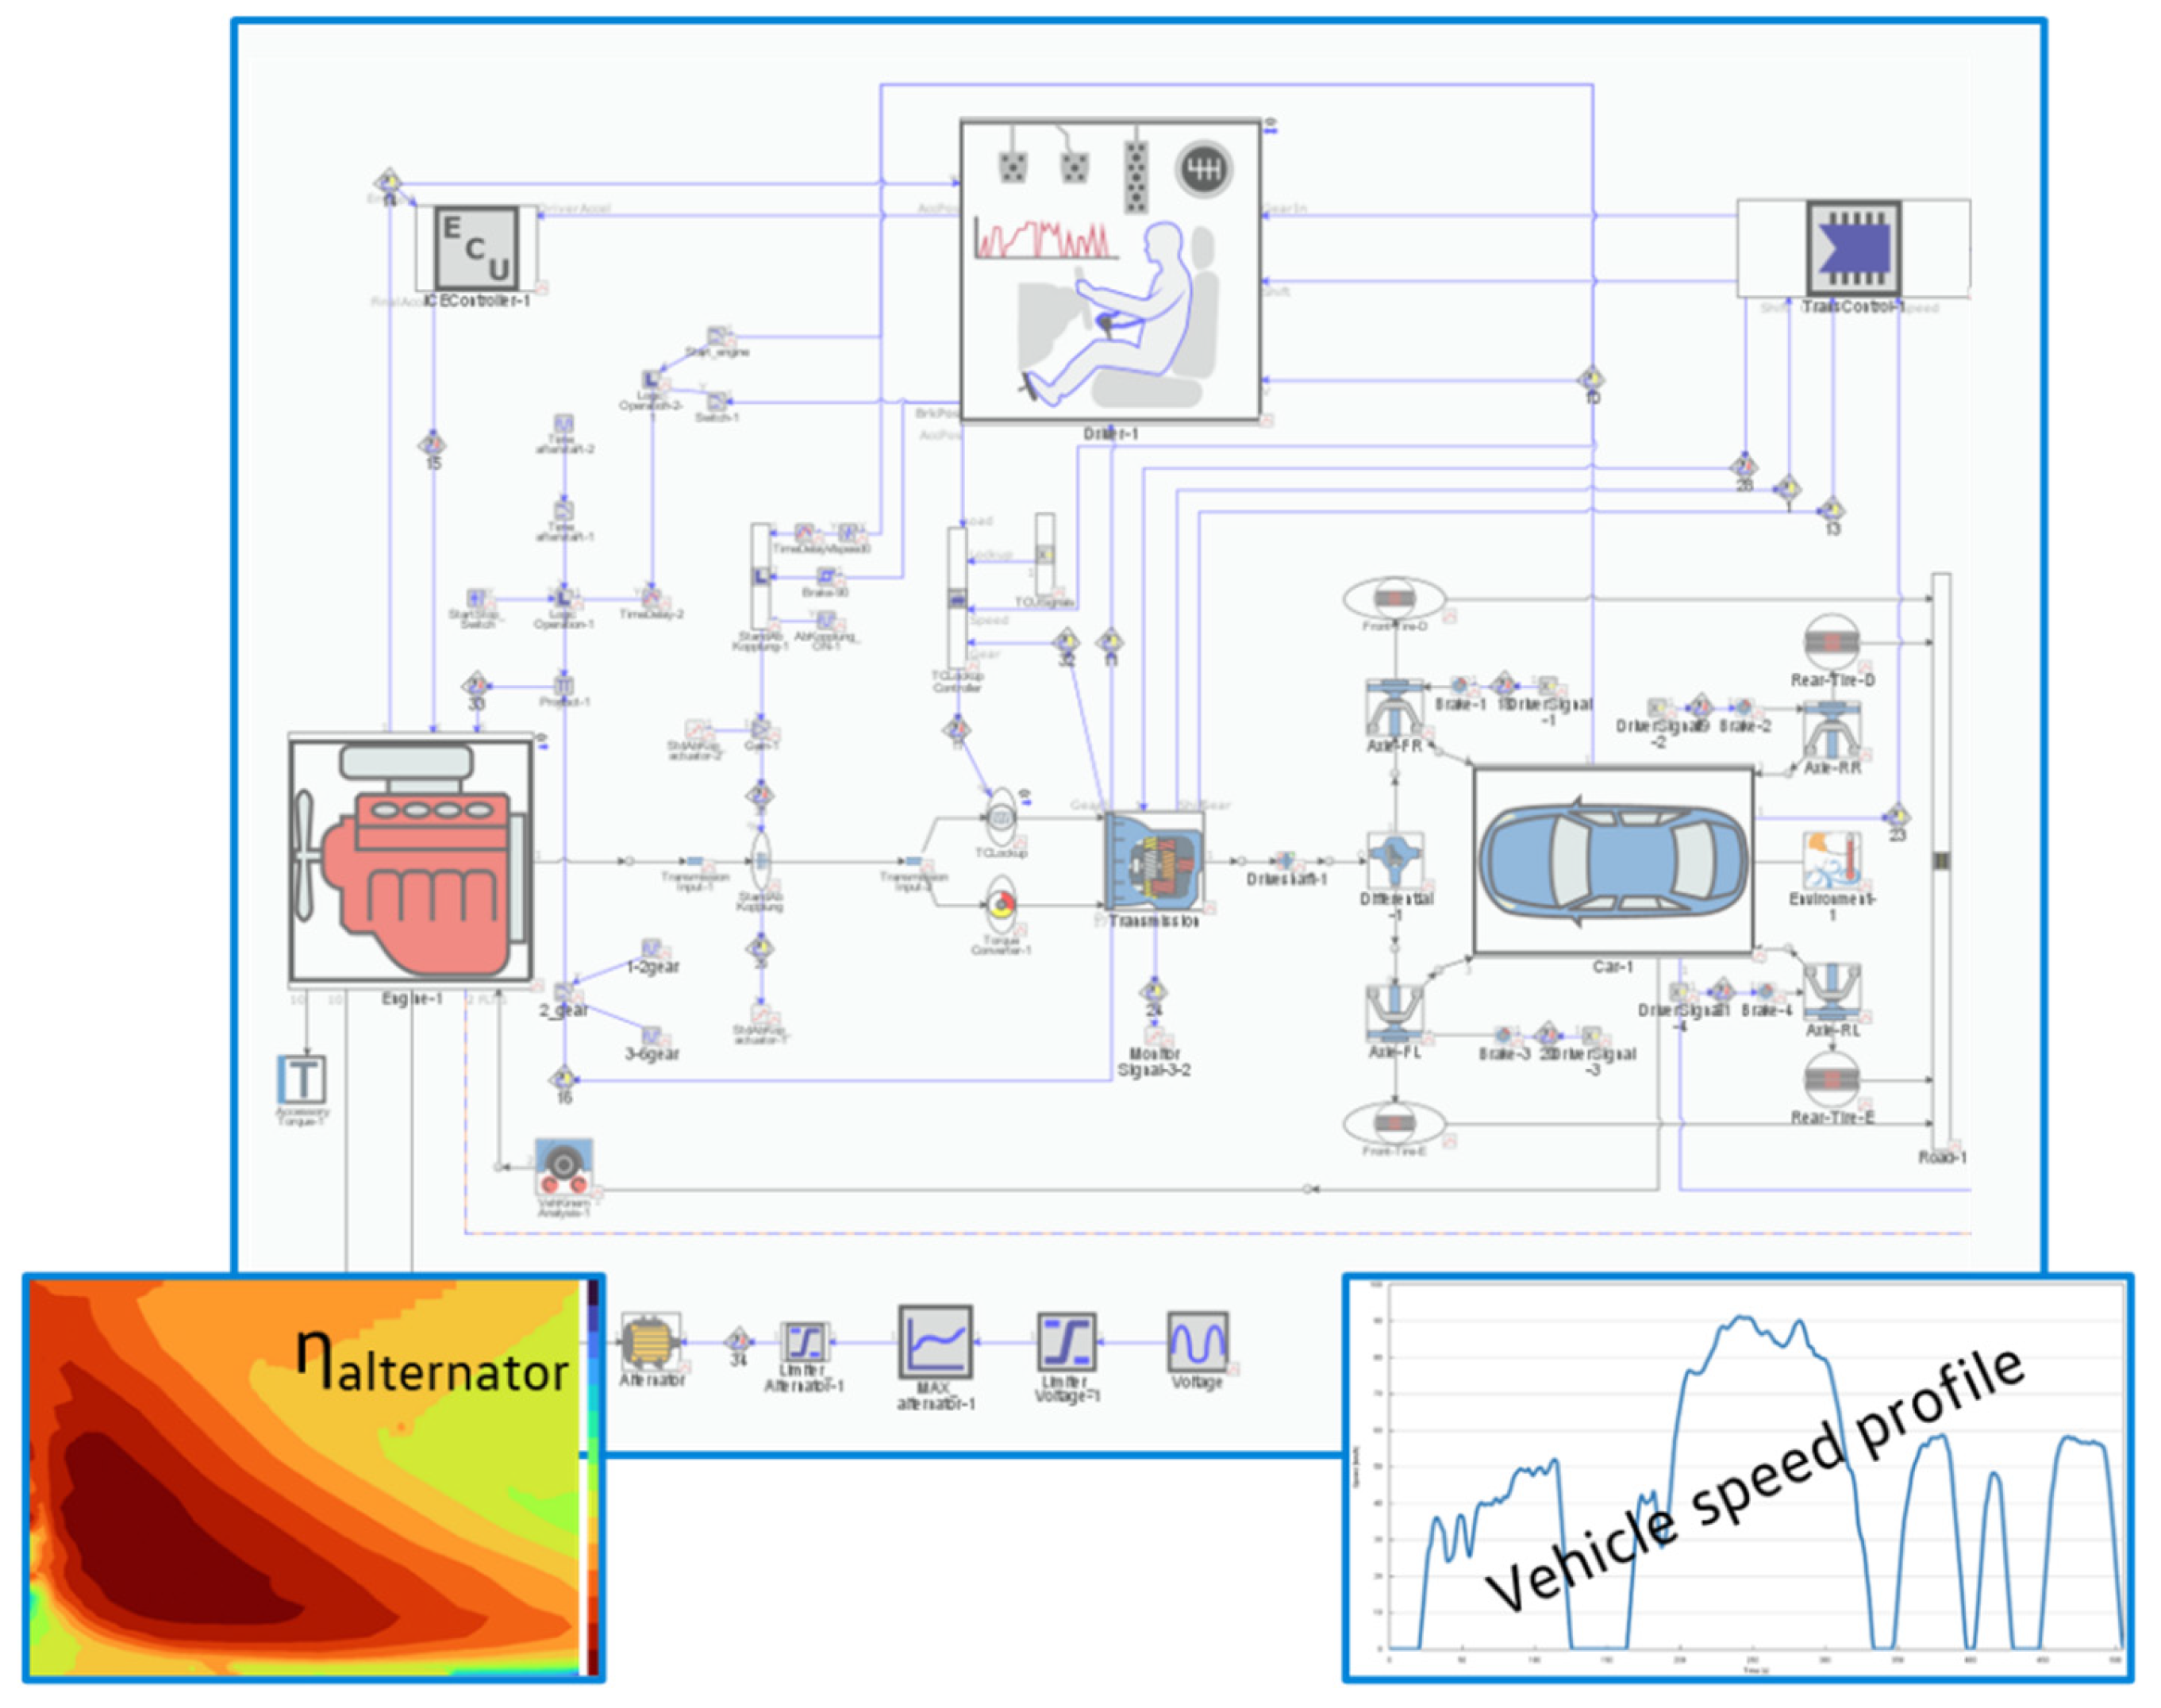
Figure 4.
Vehicle speed profile limits for Ph1 and Ph3. The gray line is the cycle nominal speed. The lower and higher limits, respectively in light and dark blue.
Figure 4.
Vehicle speed profile limits for Ph1 and Ph3. The gray line is the cycle nominal speed. The lower and higher limits, respectively in light and dark blue.
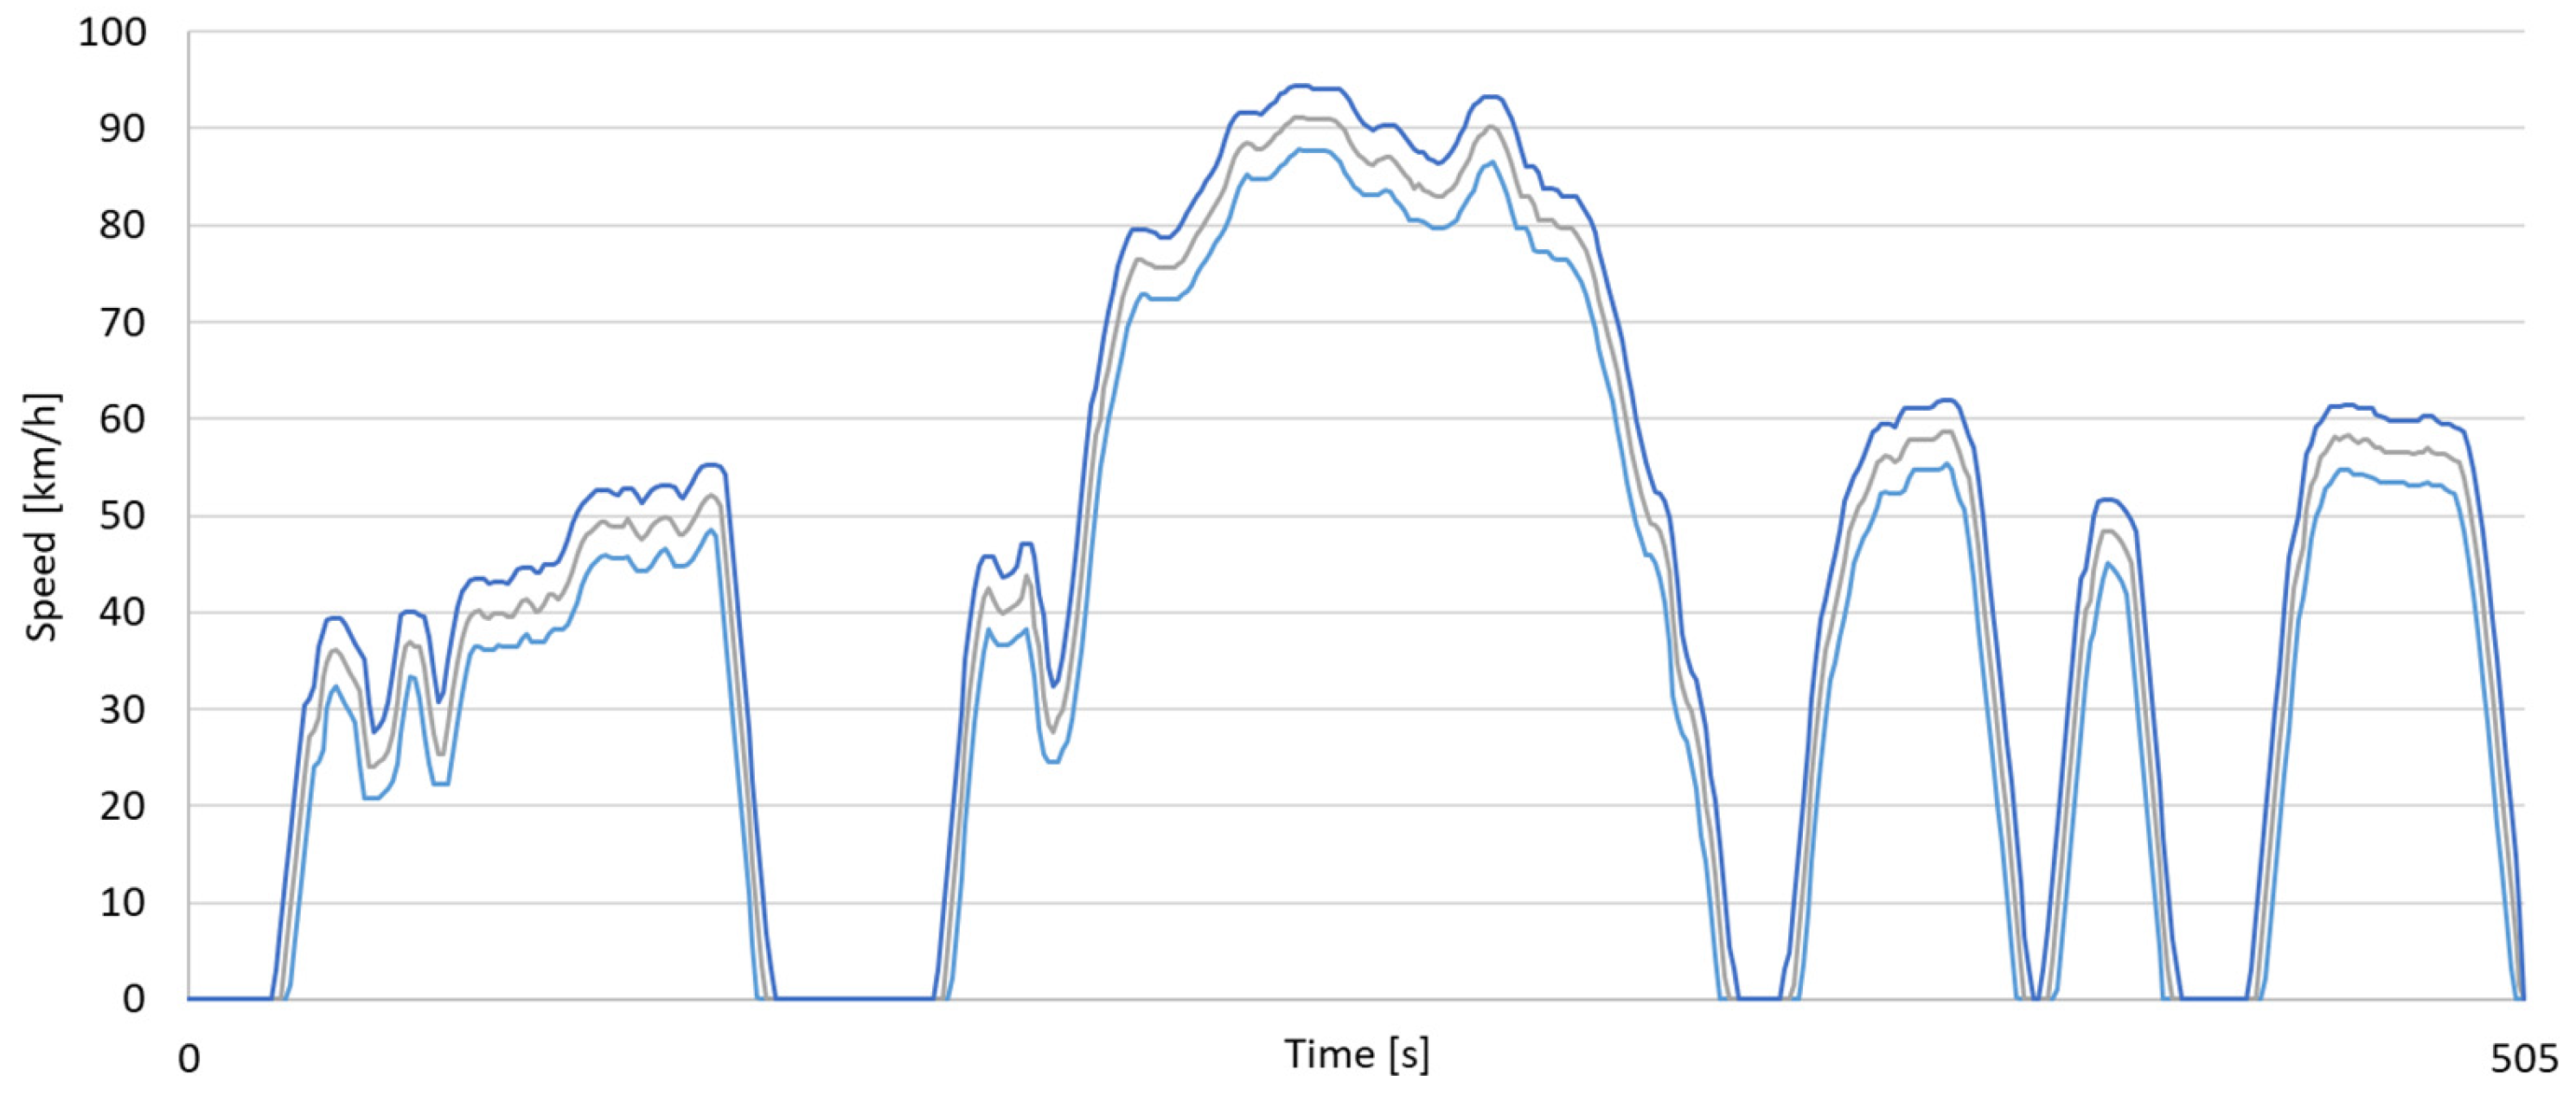
Figure 5.
Ph1 and Ph3 delta % compared to nominal speed profile.
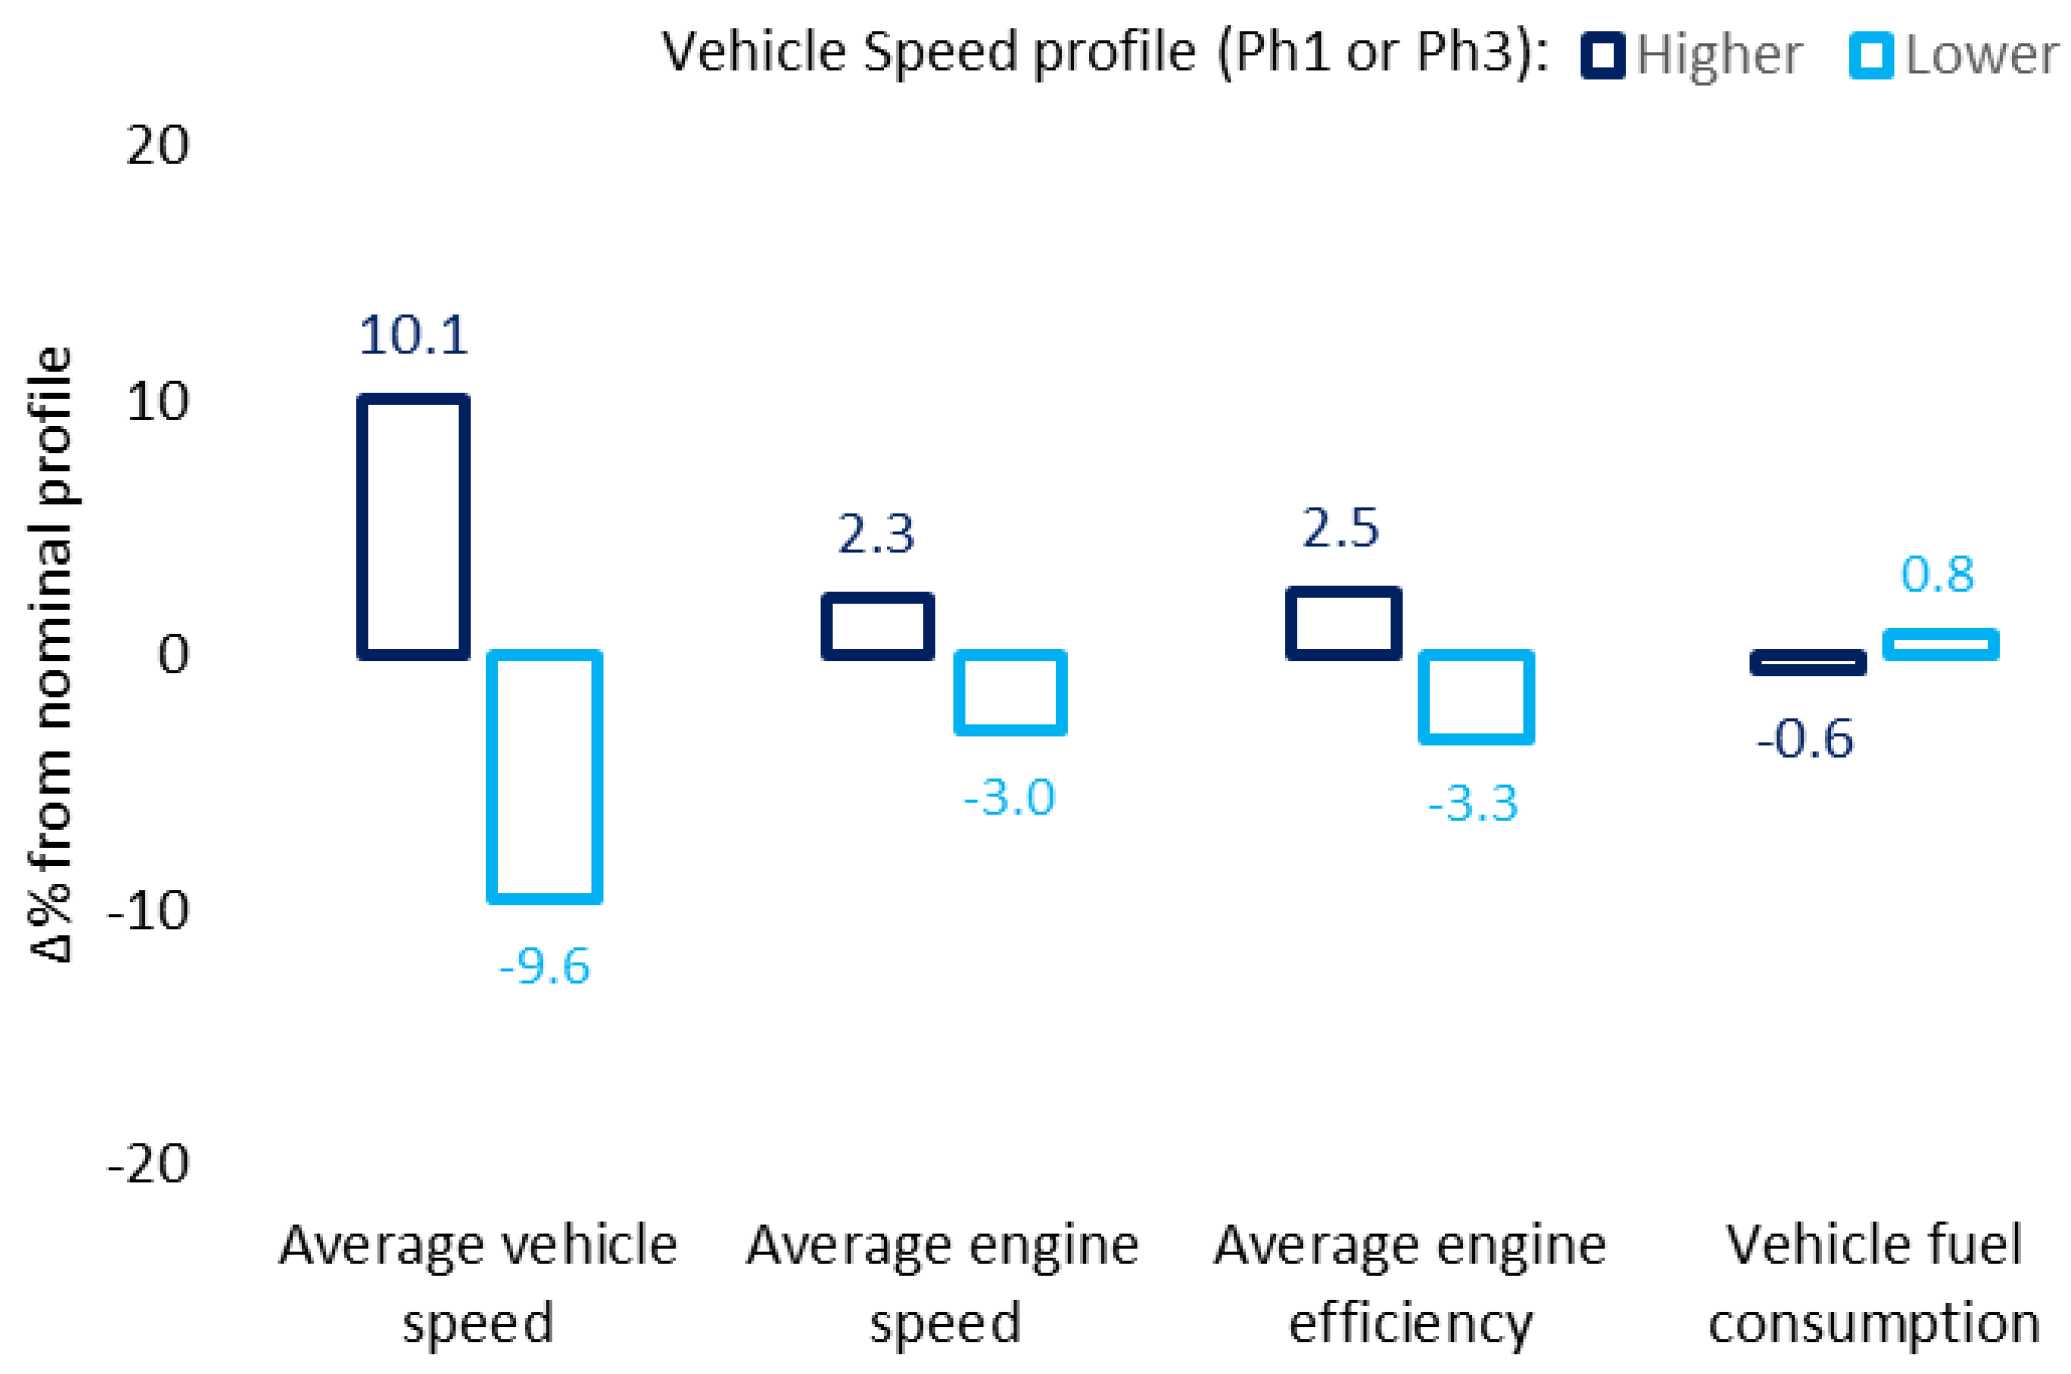
Figure 6.
Ph2 delta % compared to nominal speed profile.
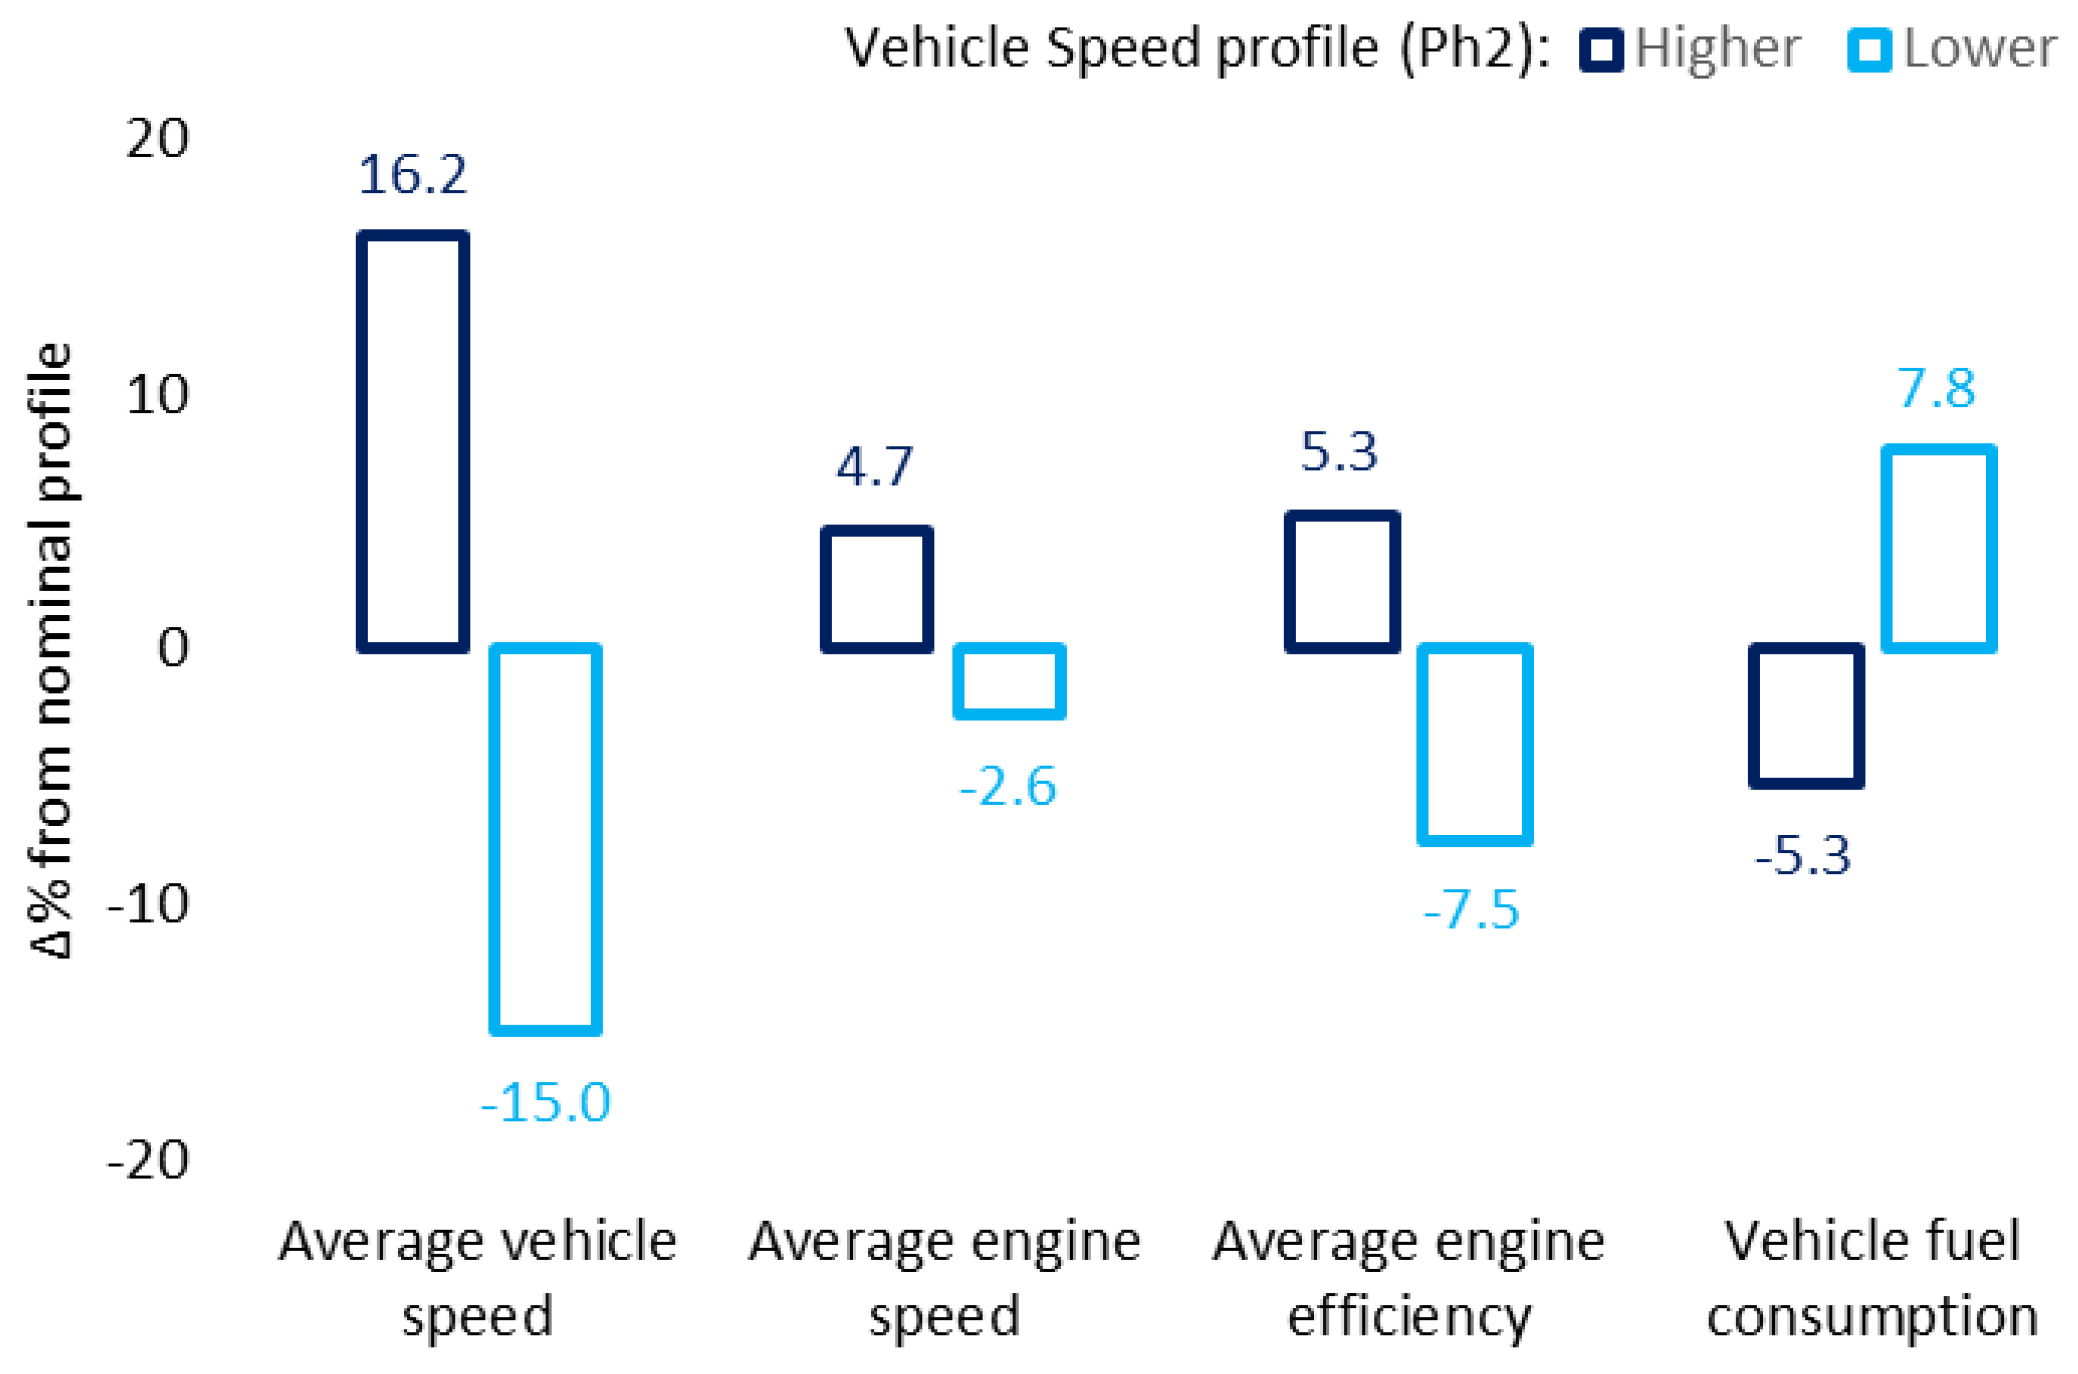
Figure 7.
Hwy delta % compared to nominal speed profile.
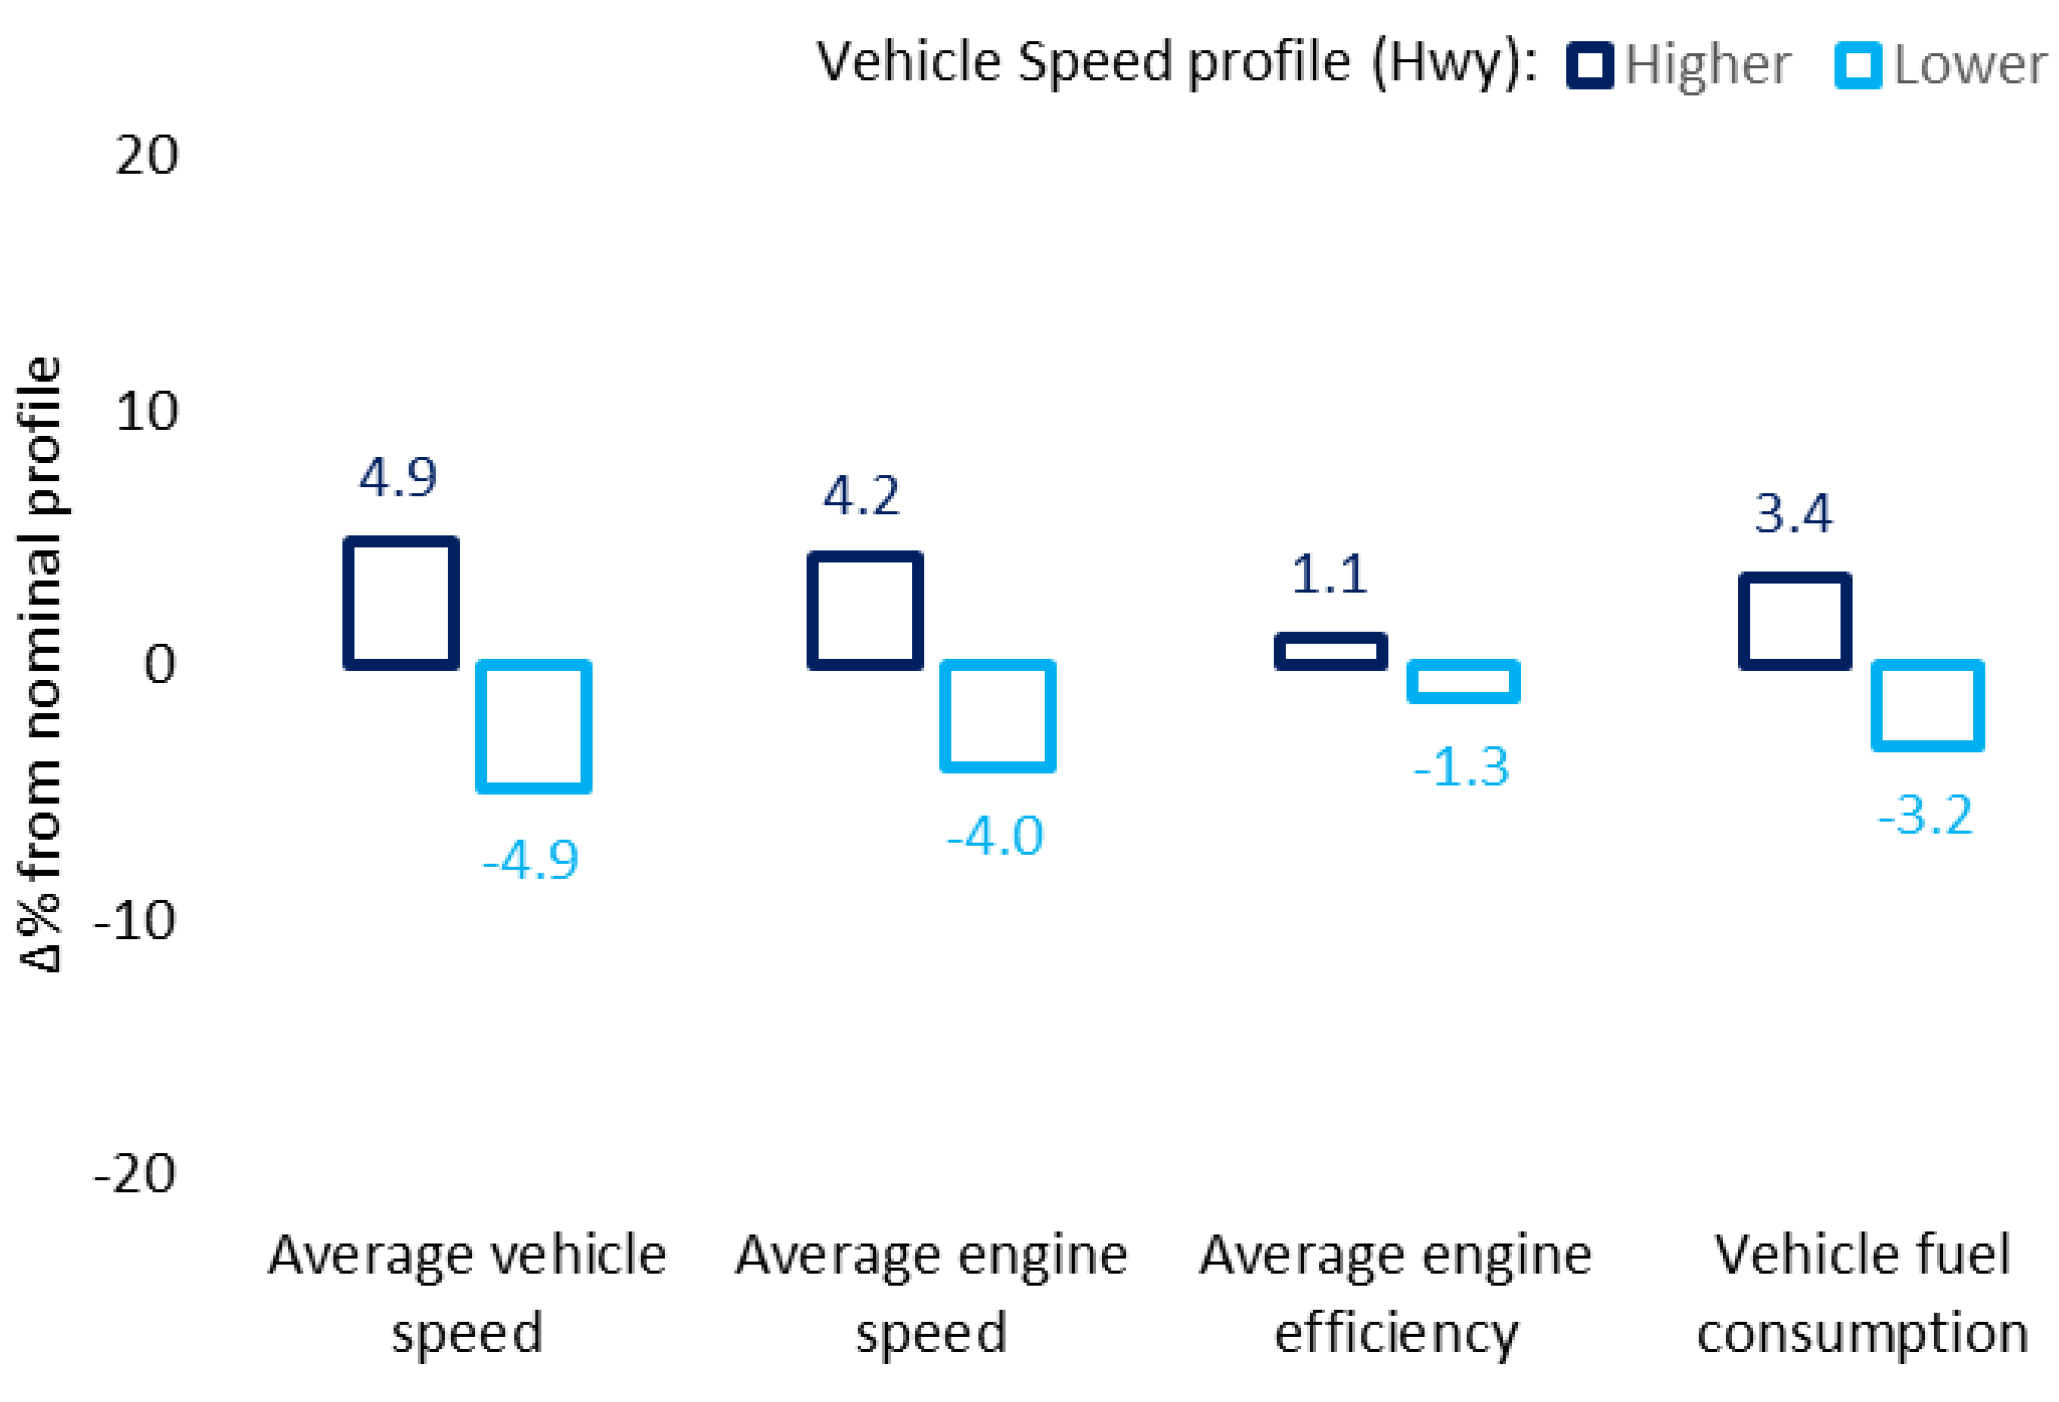
Figure 8.
Example of experimental variation of vehicle speed profile.
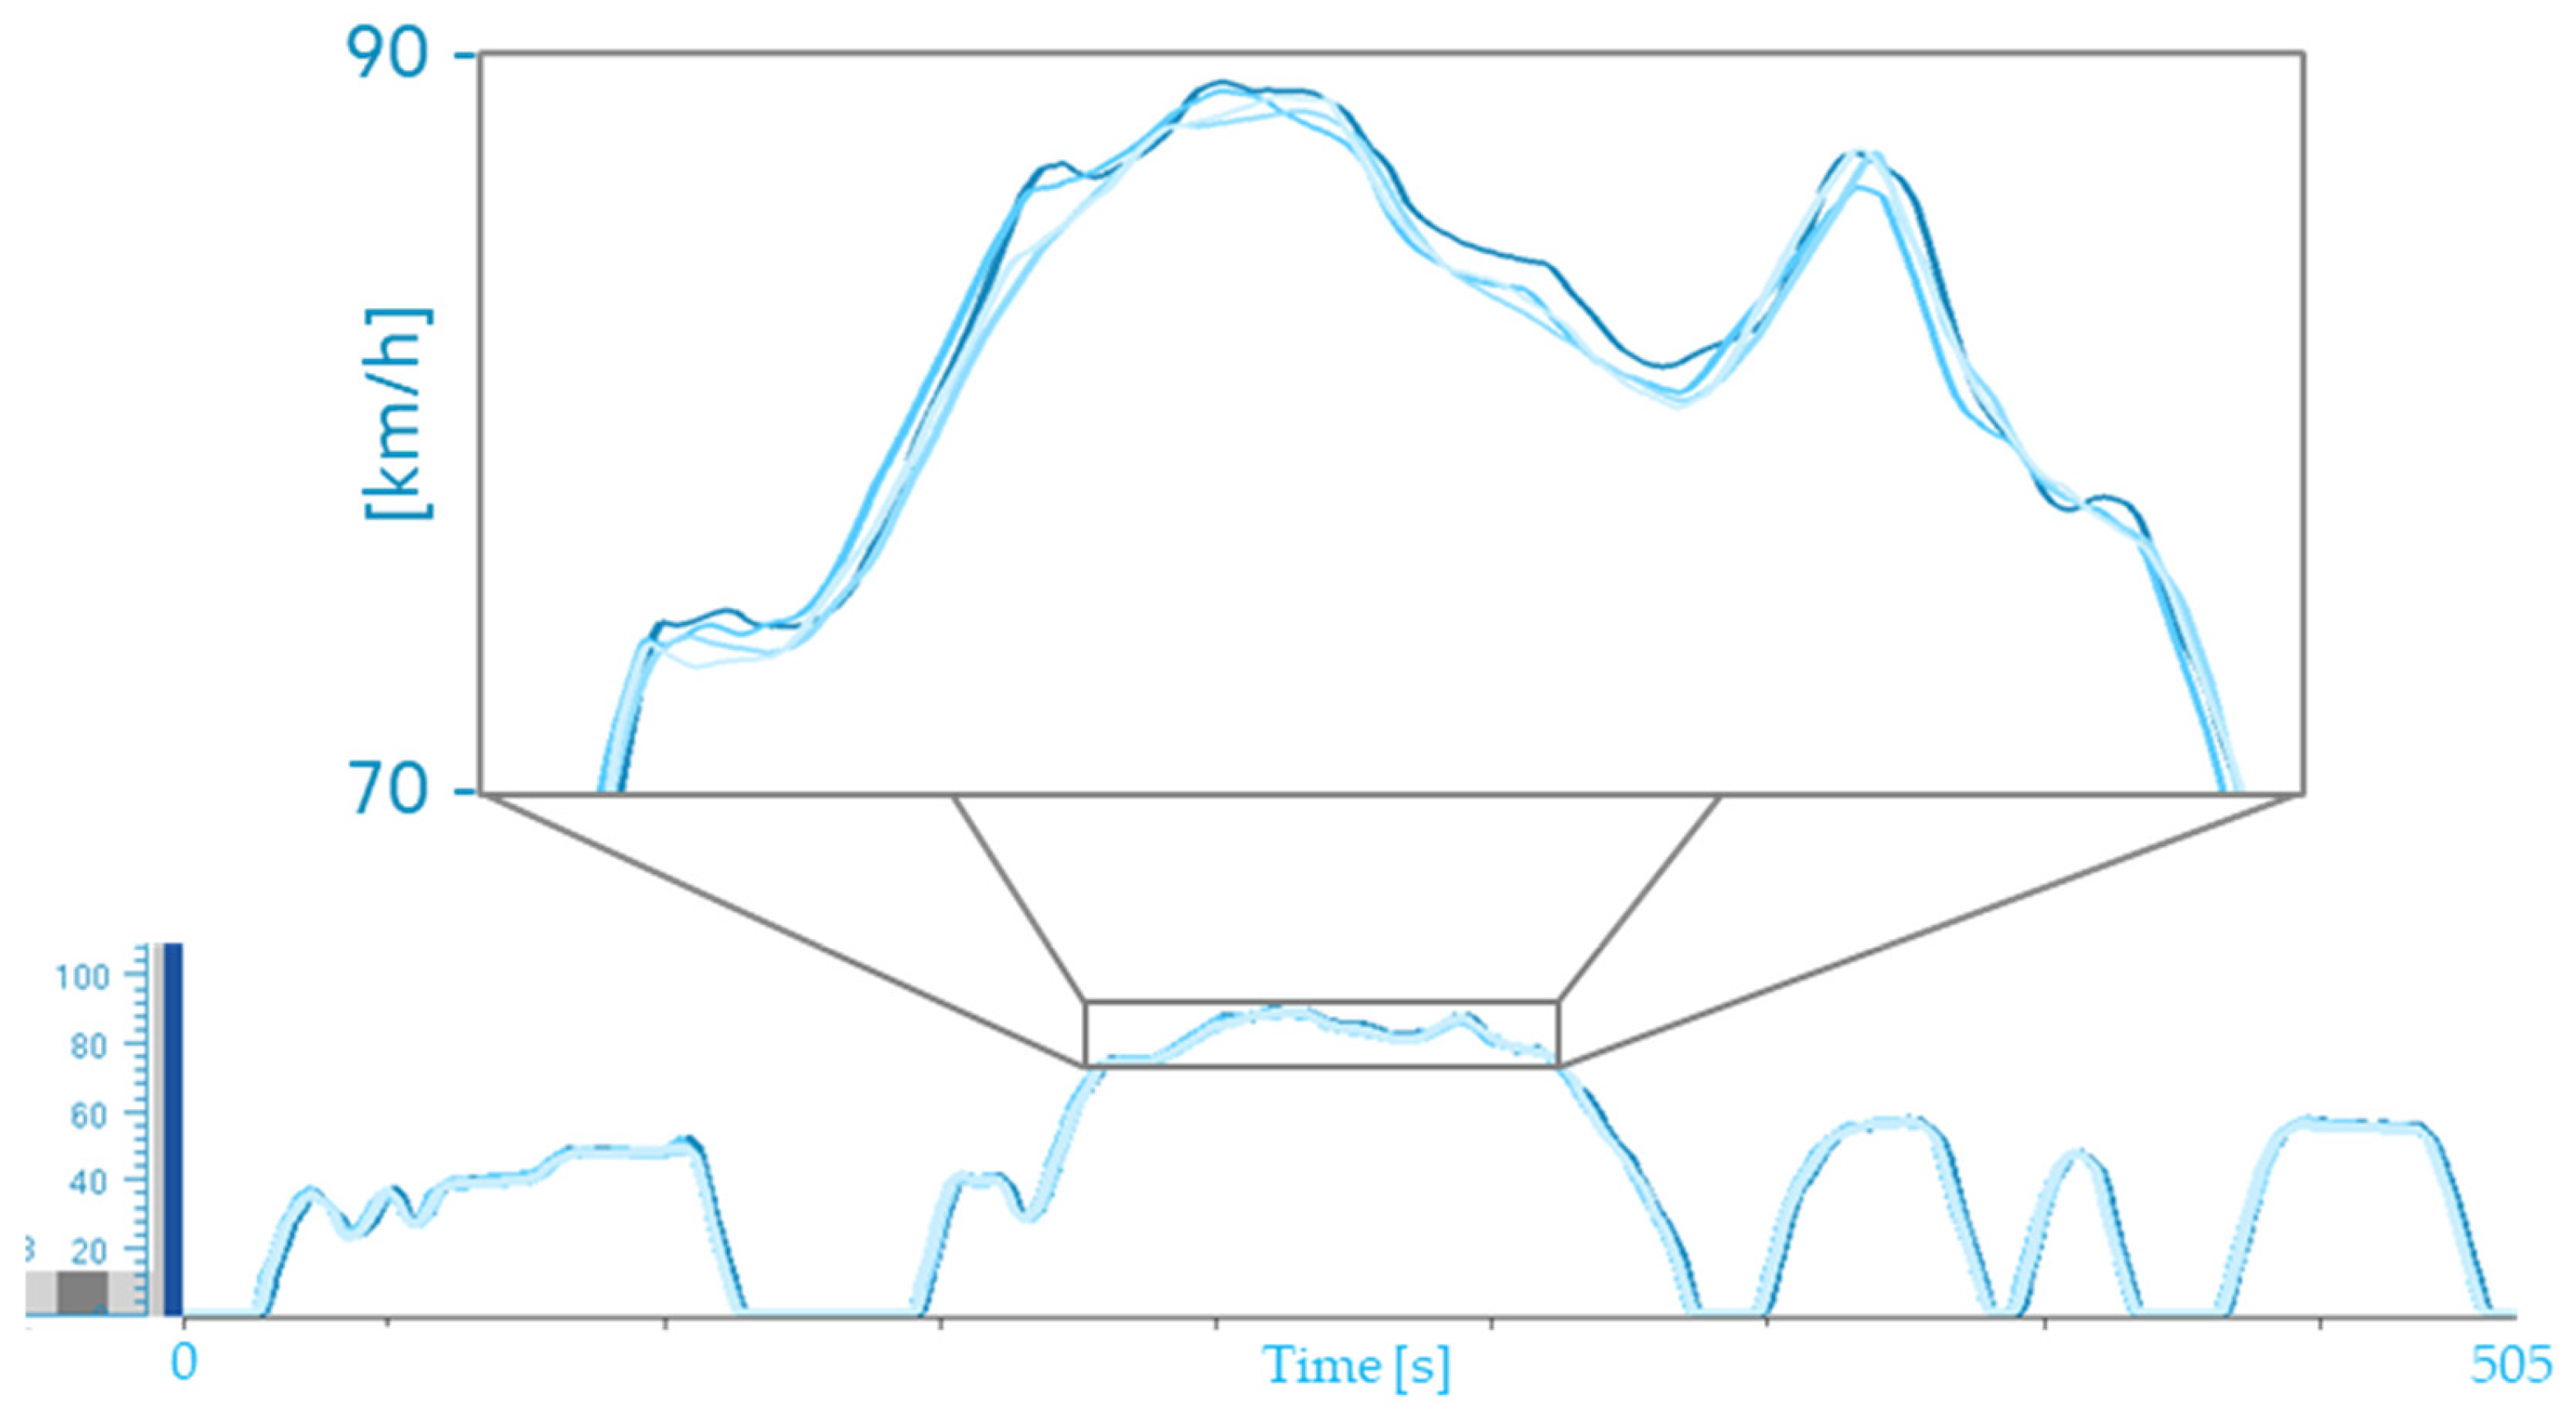
Figure 9.
Alternator electrical load in function of battery voltage and recharging strategy.
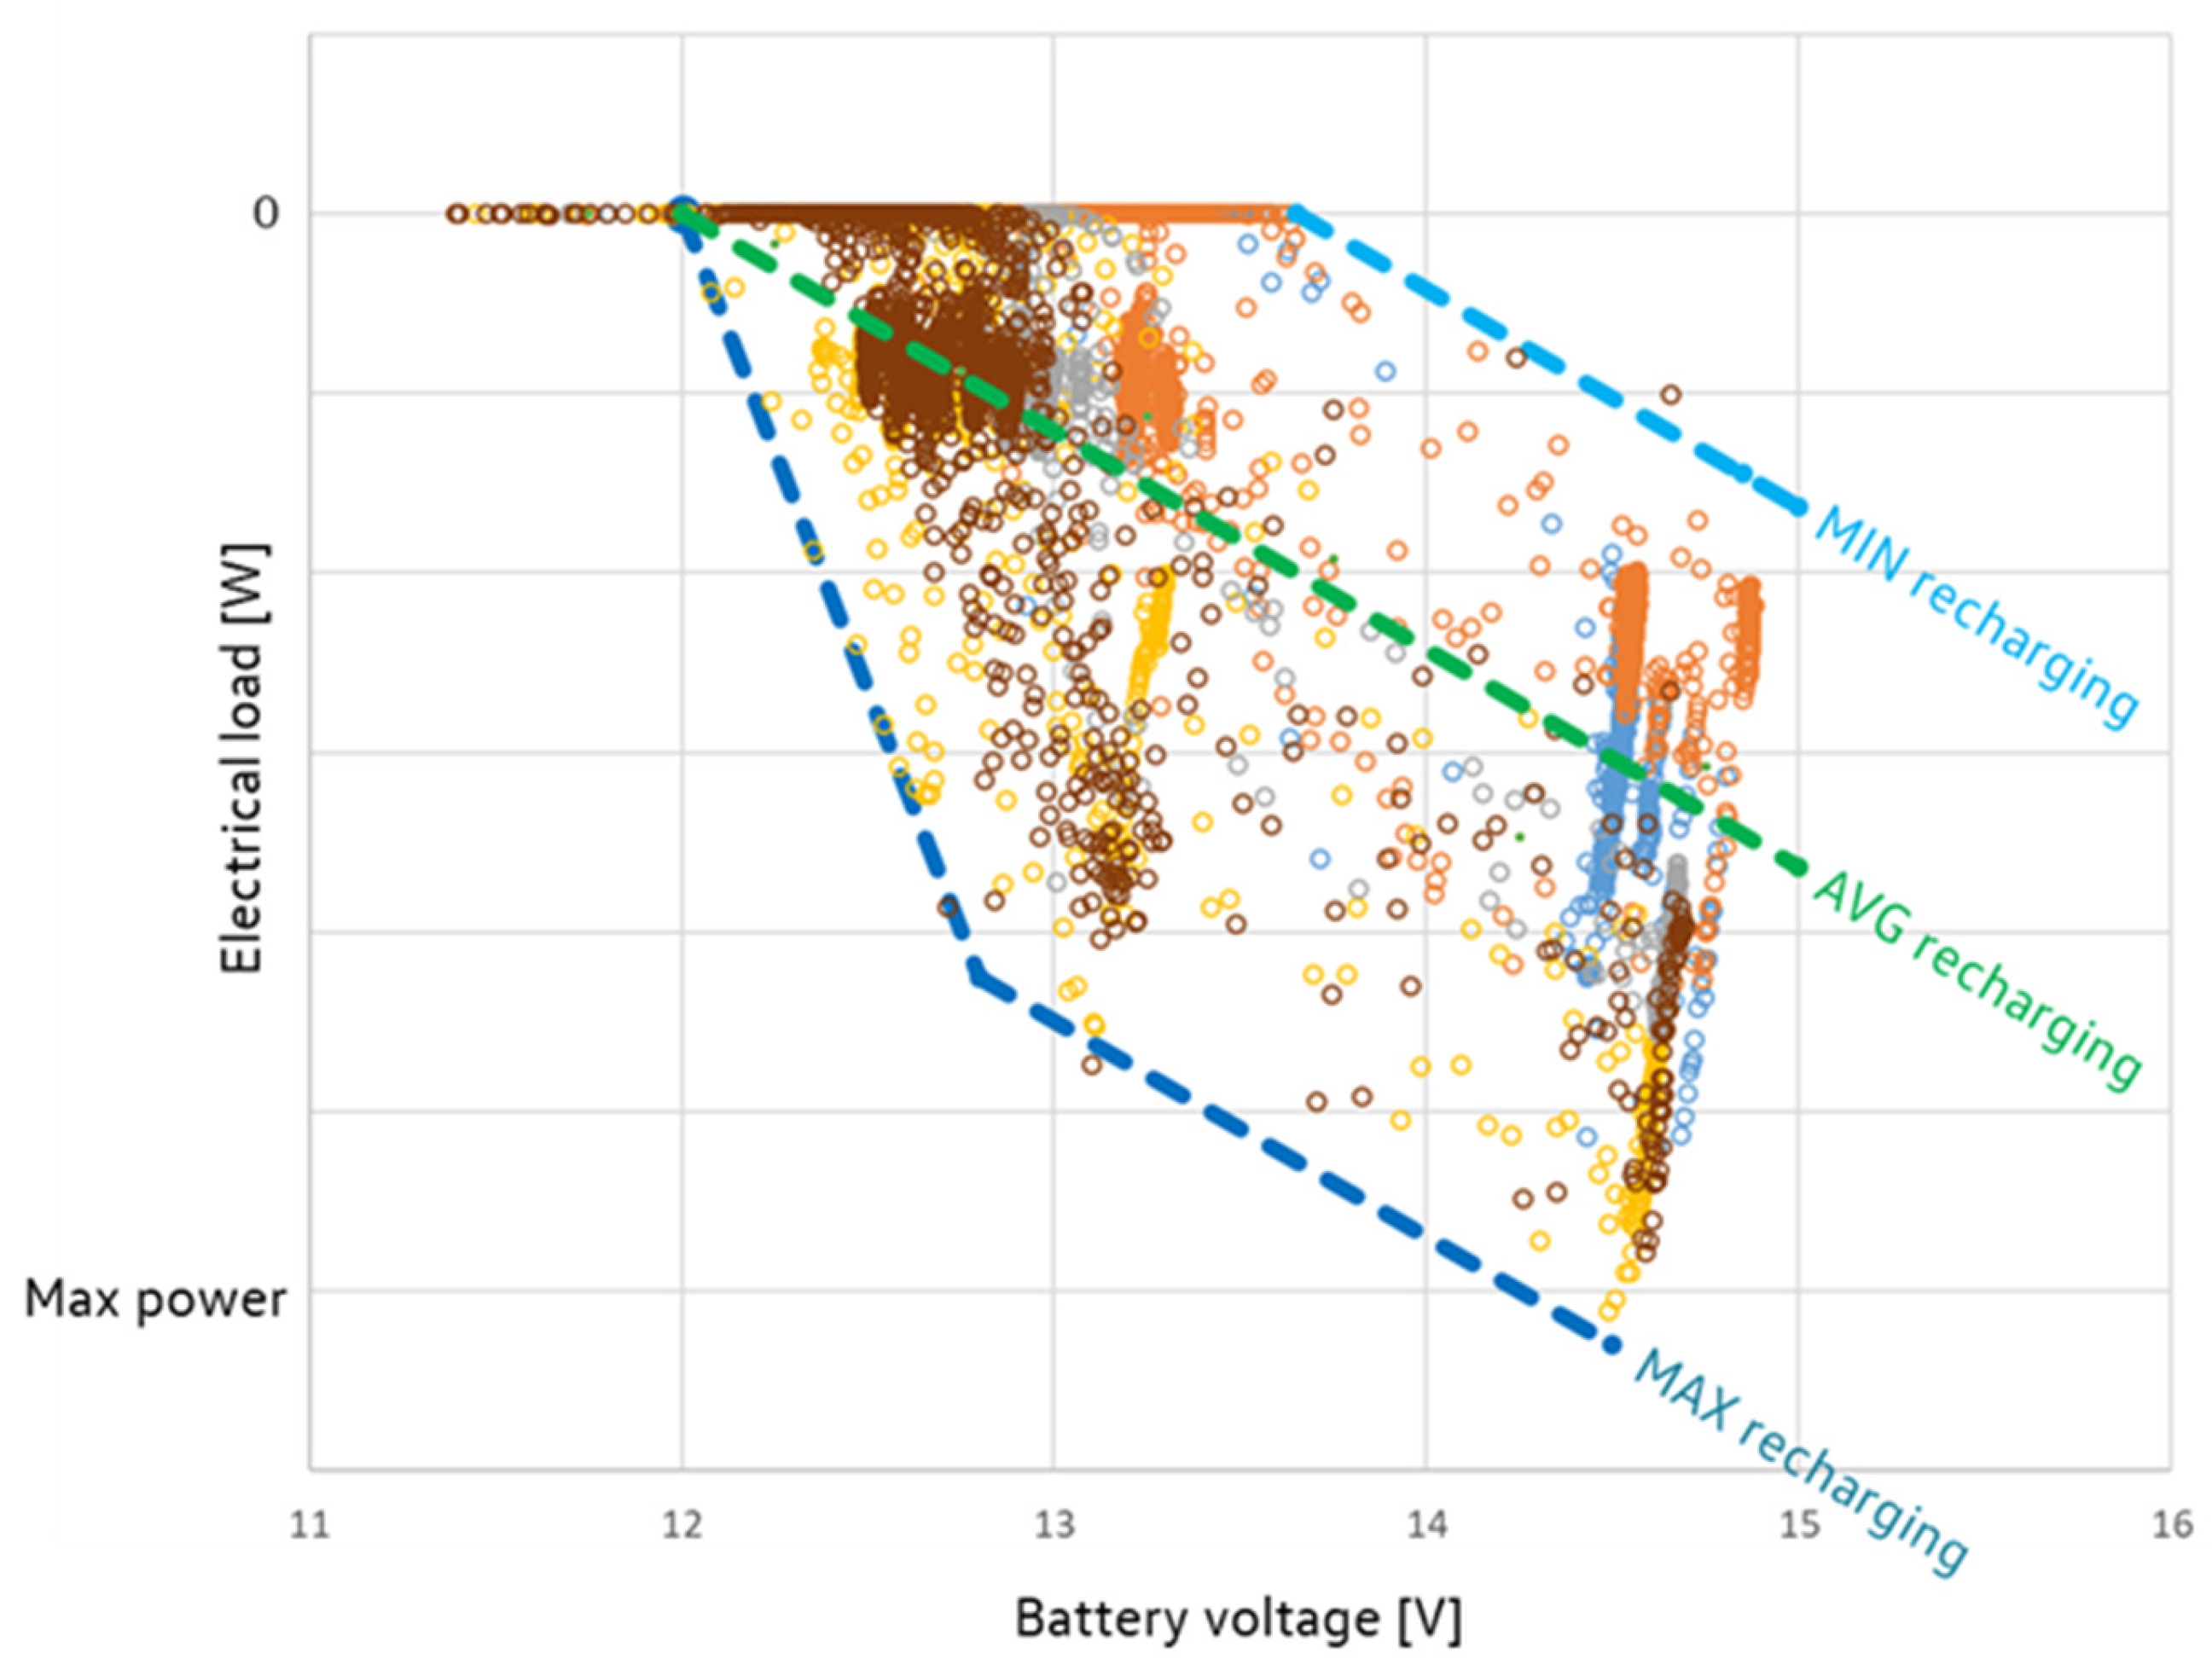
Figure 10.
Measured average battery voltage.
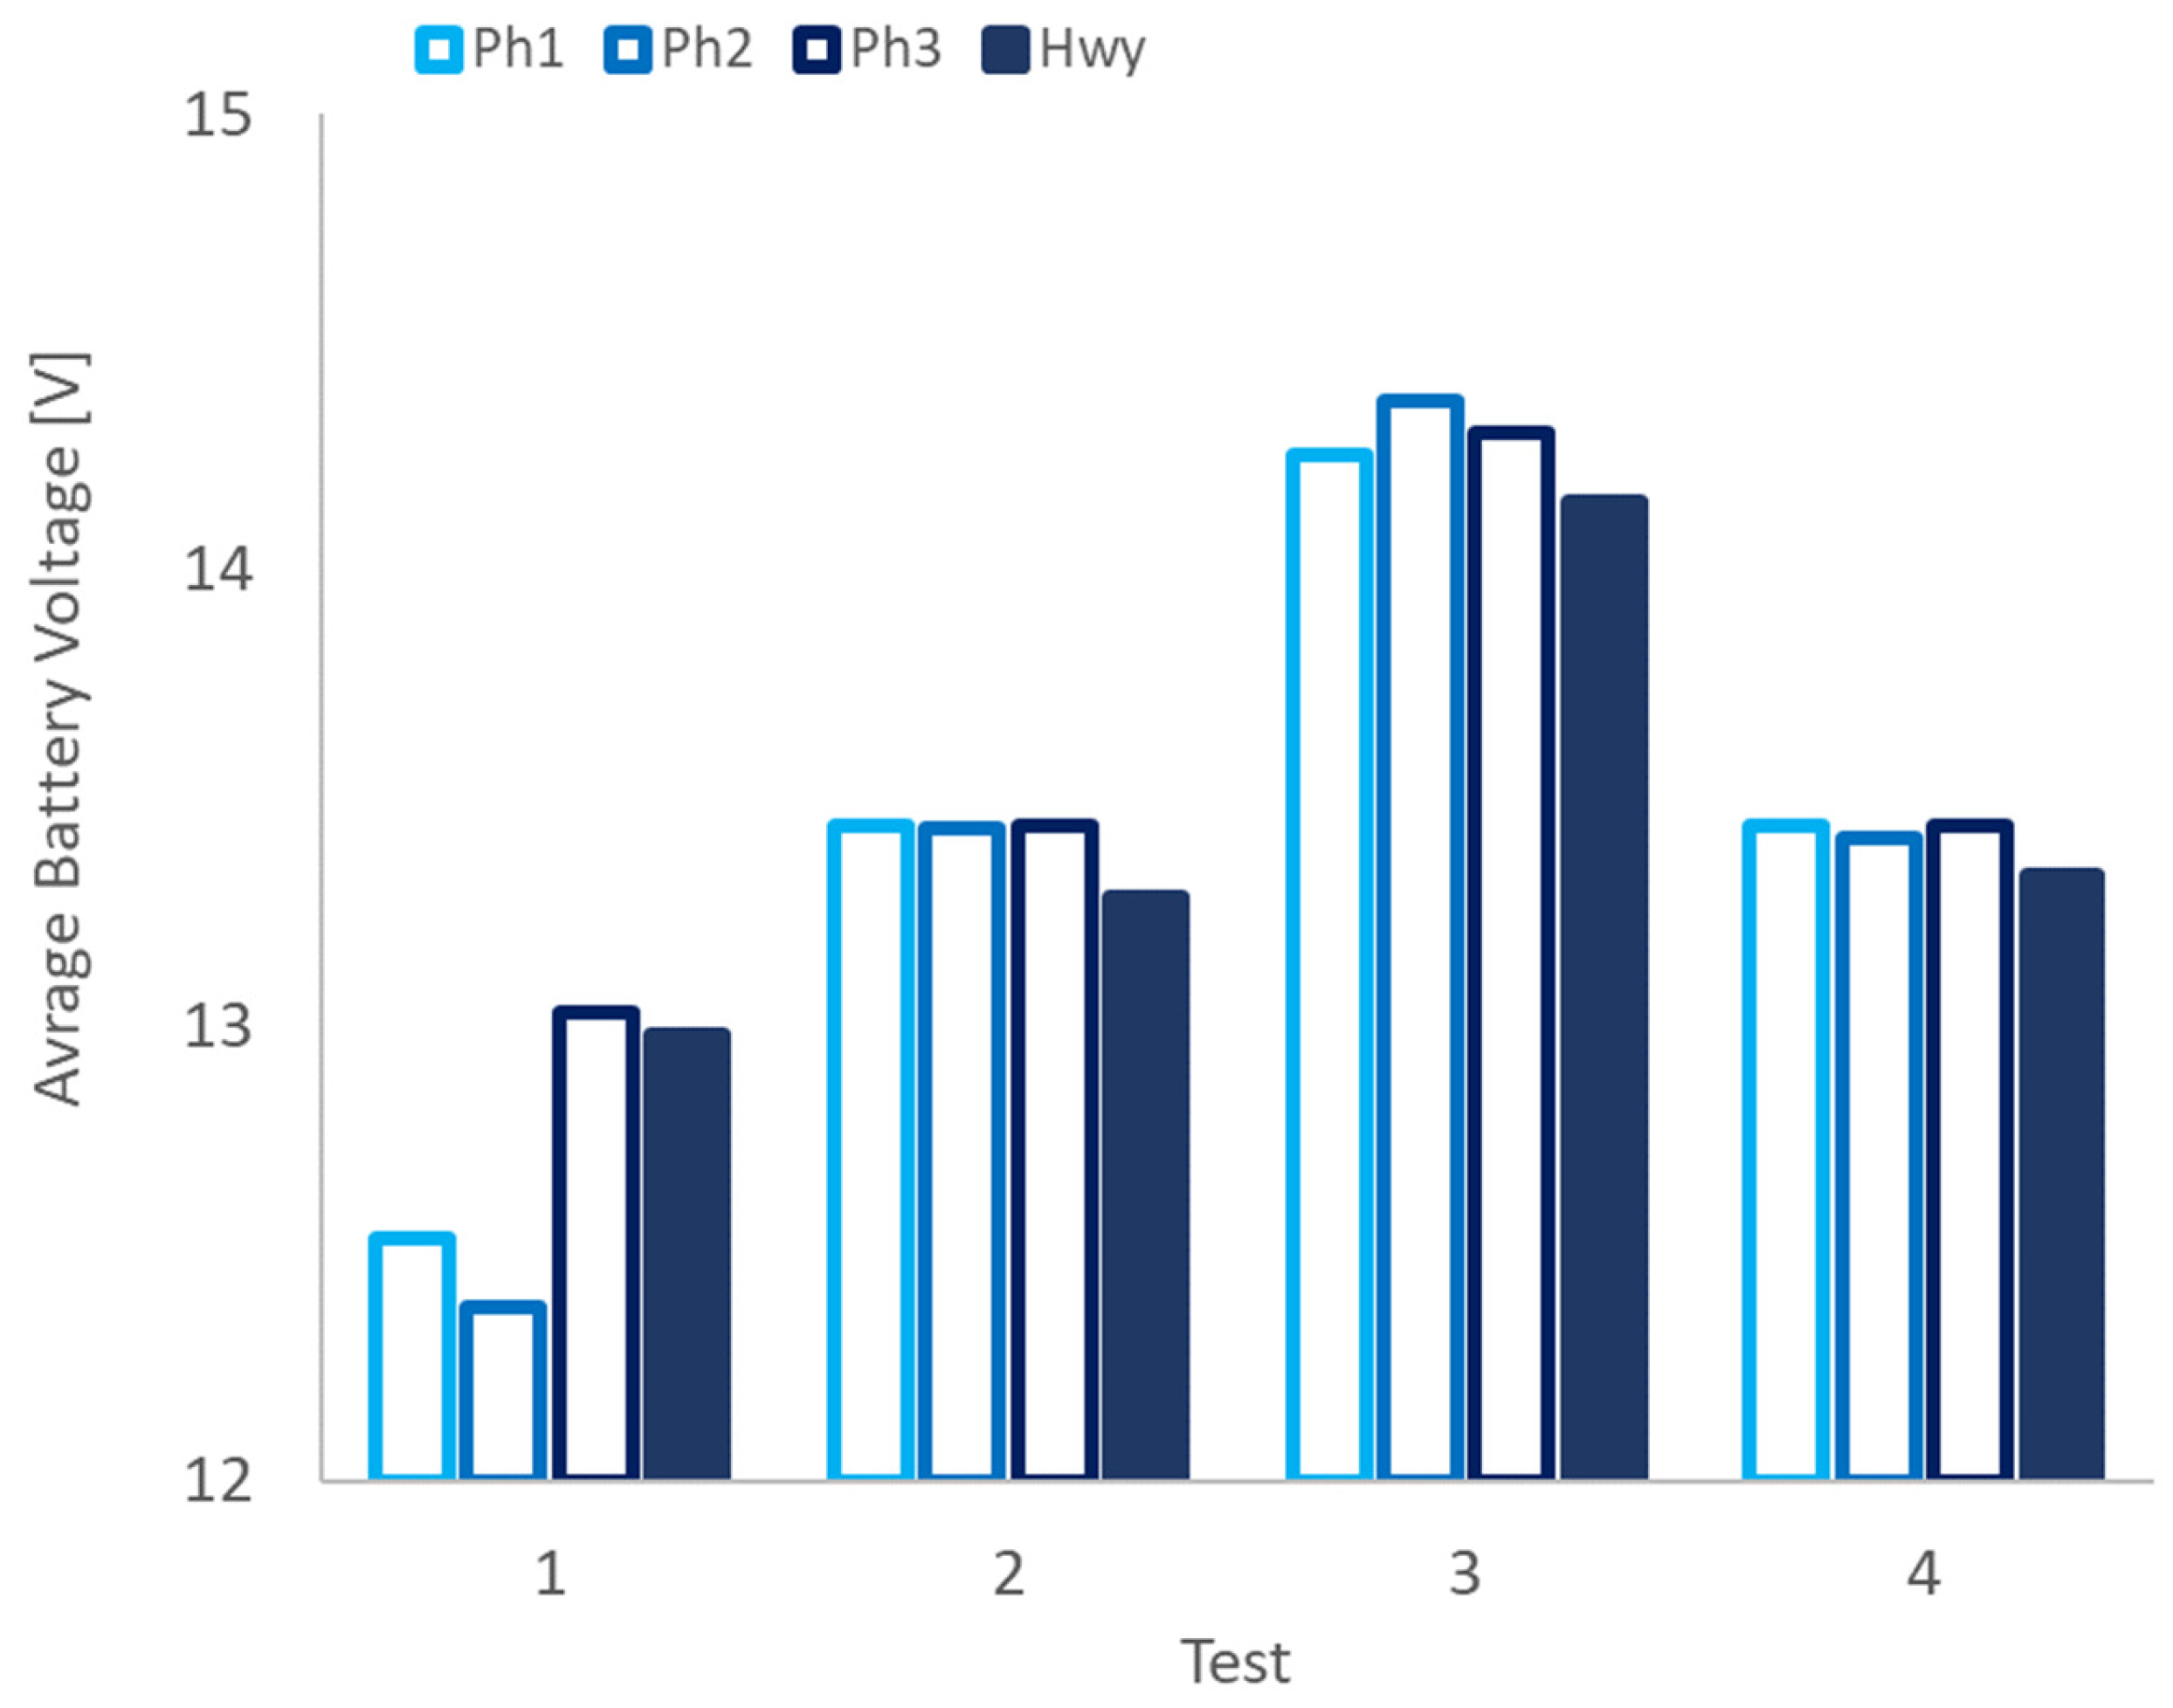
Figure 11.
Measured battery voltage [V] for tests 1 (brown line) and 3 (light blue line).
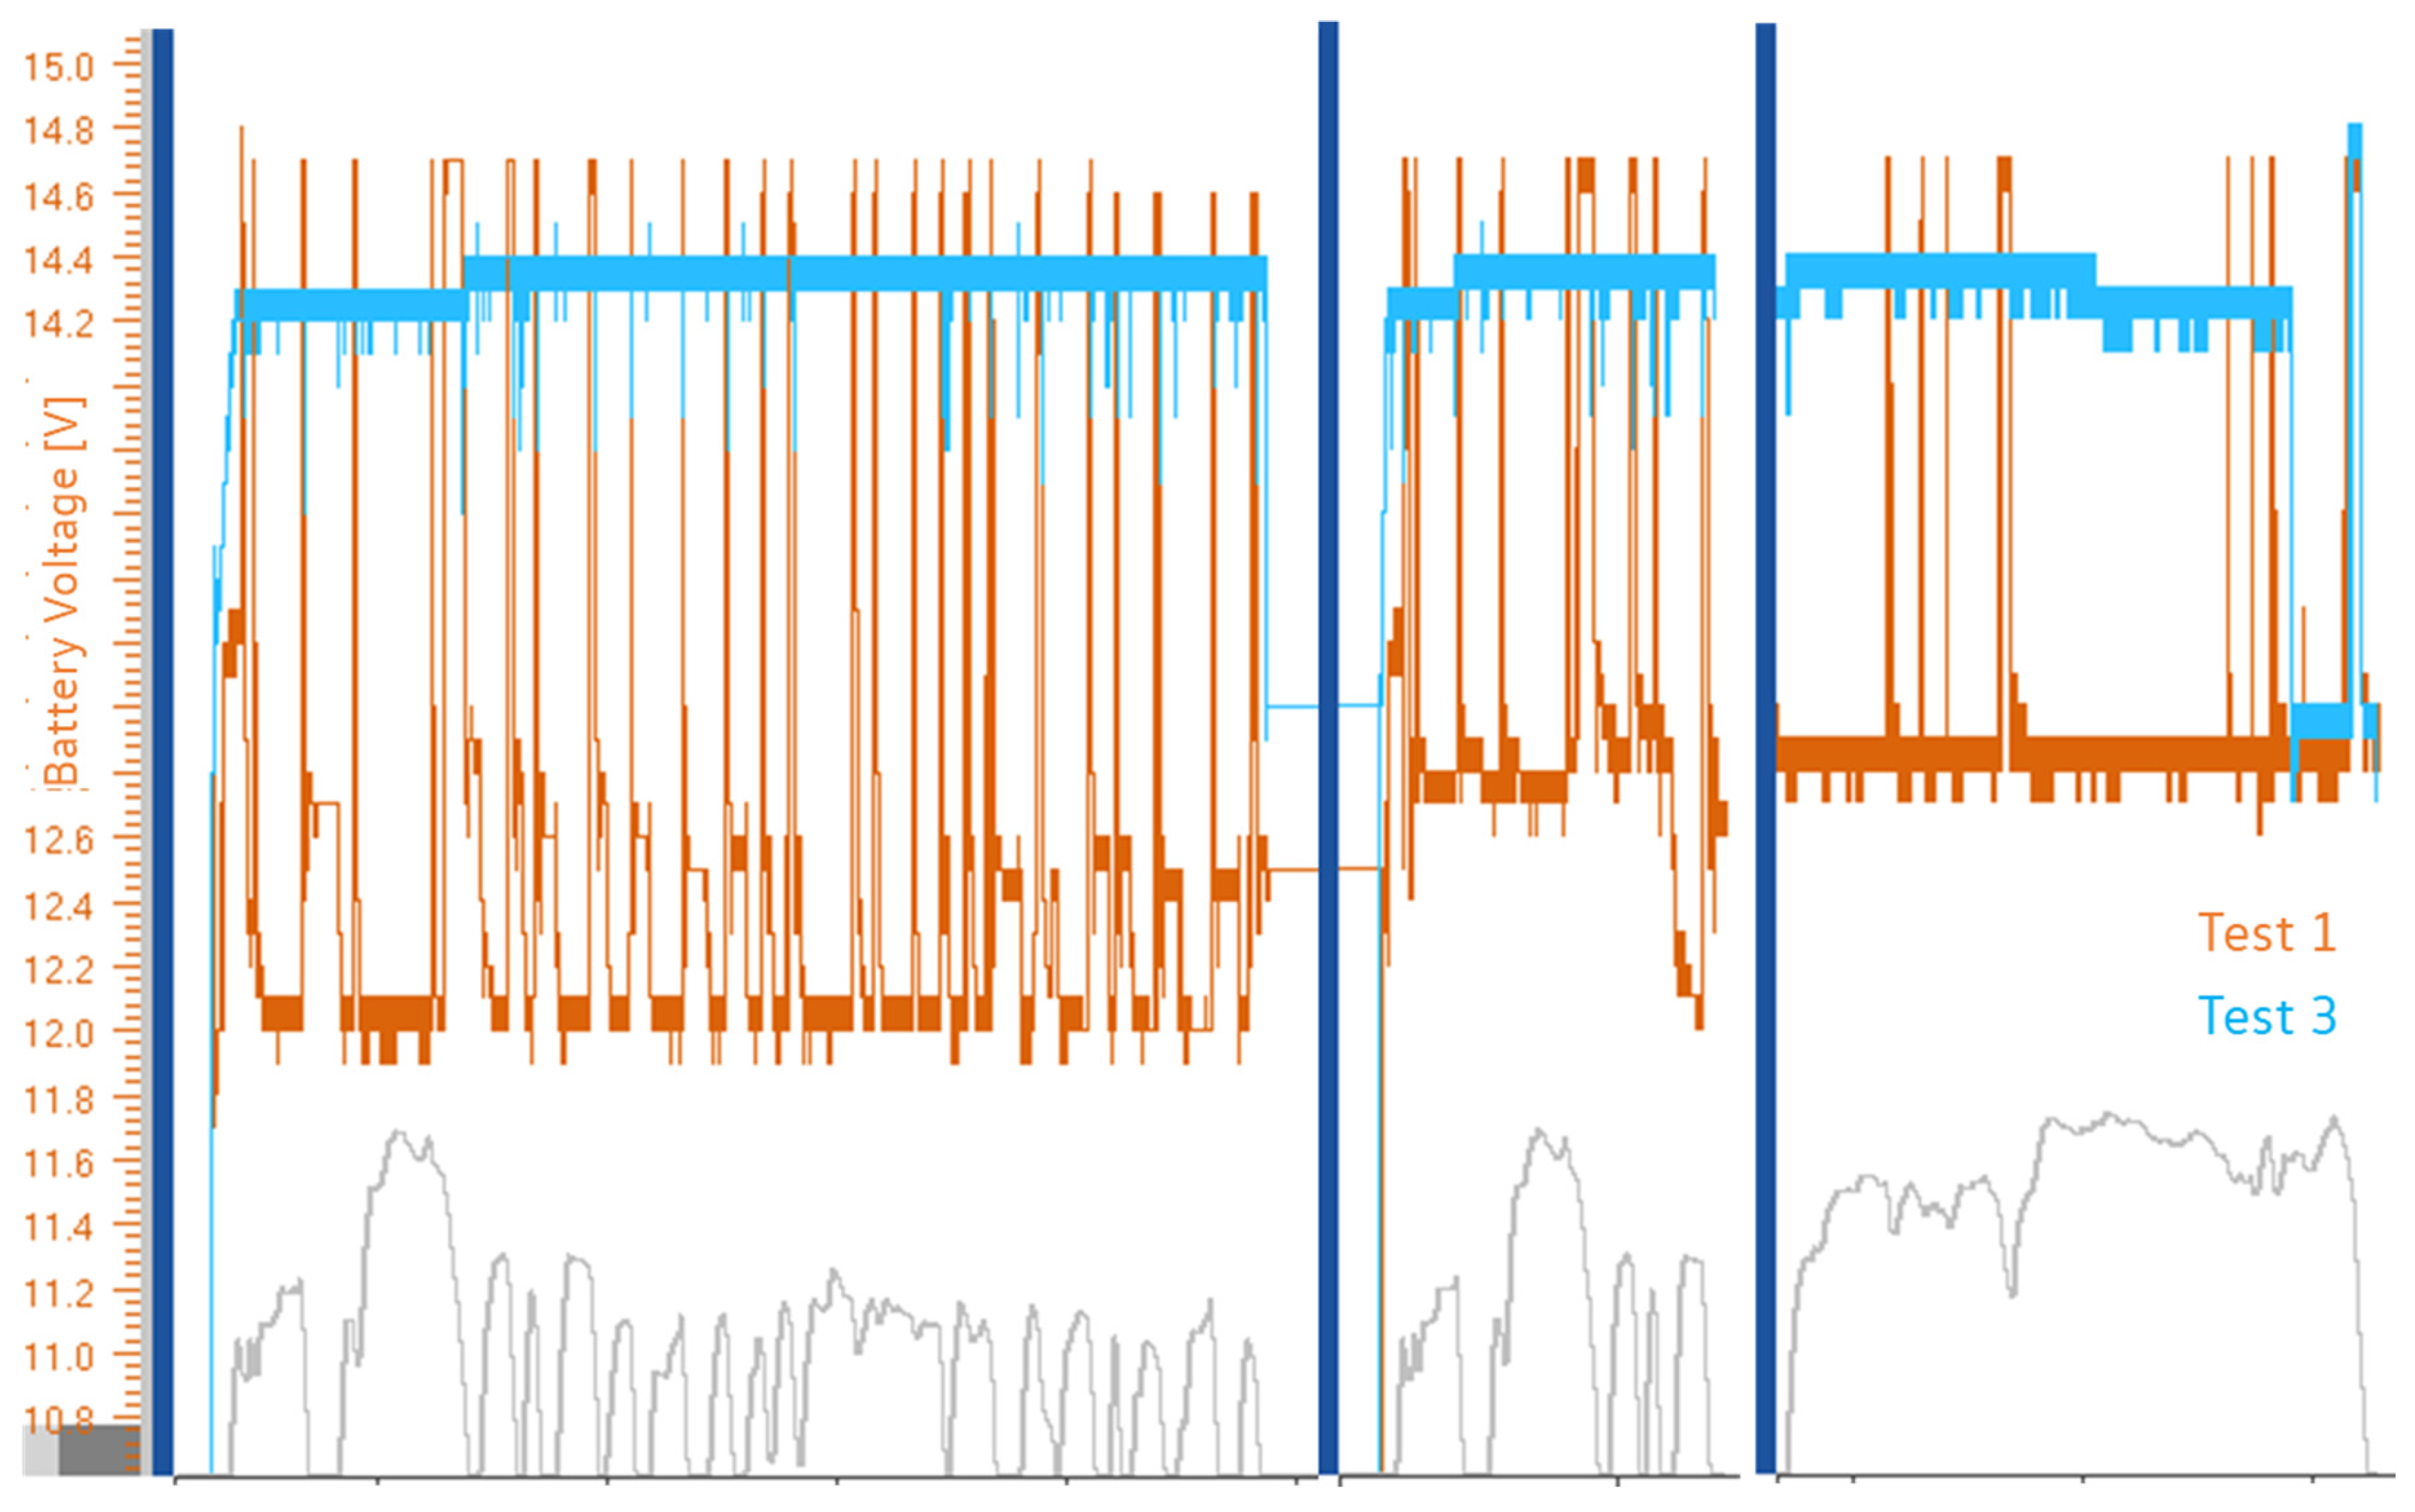
Figure 12.
Compared fuel consumption variation results.
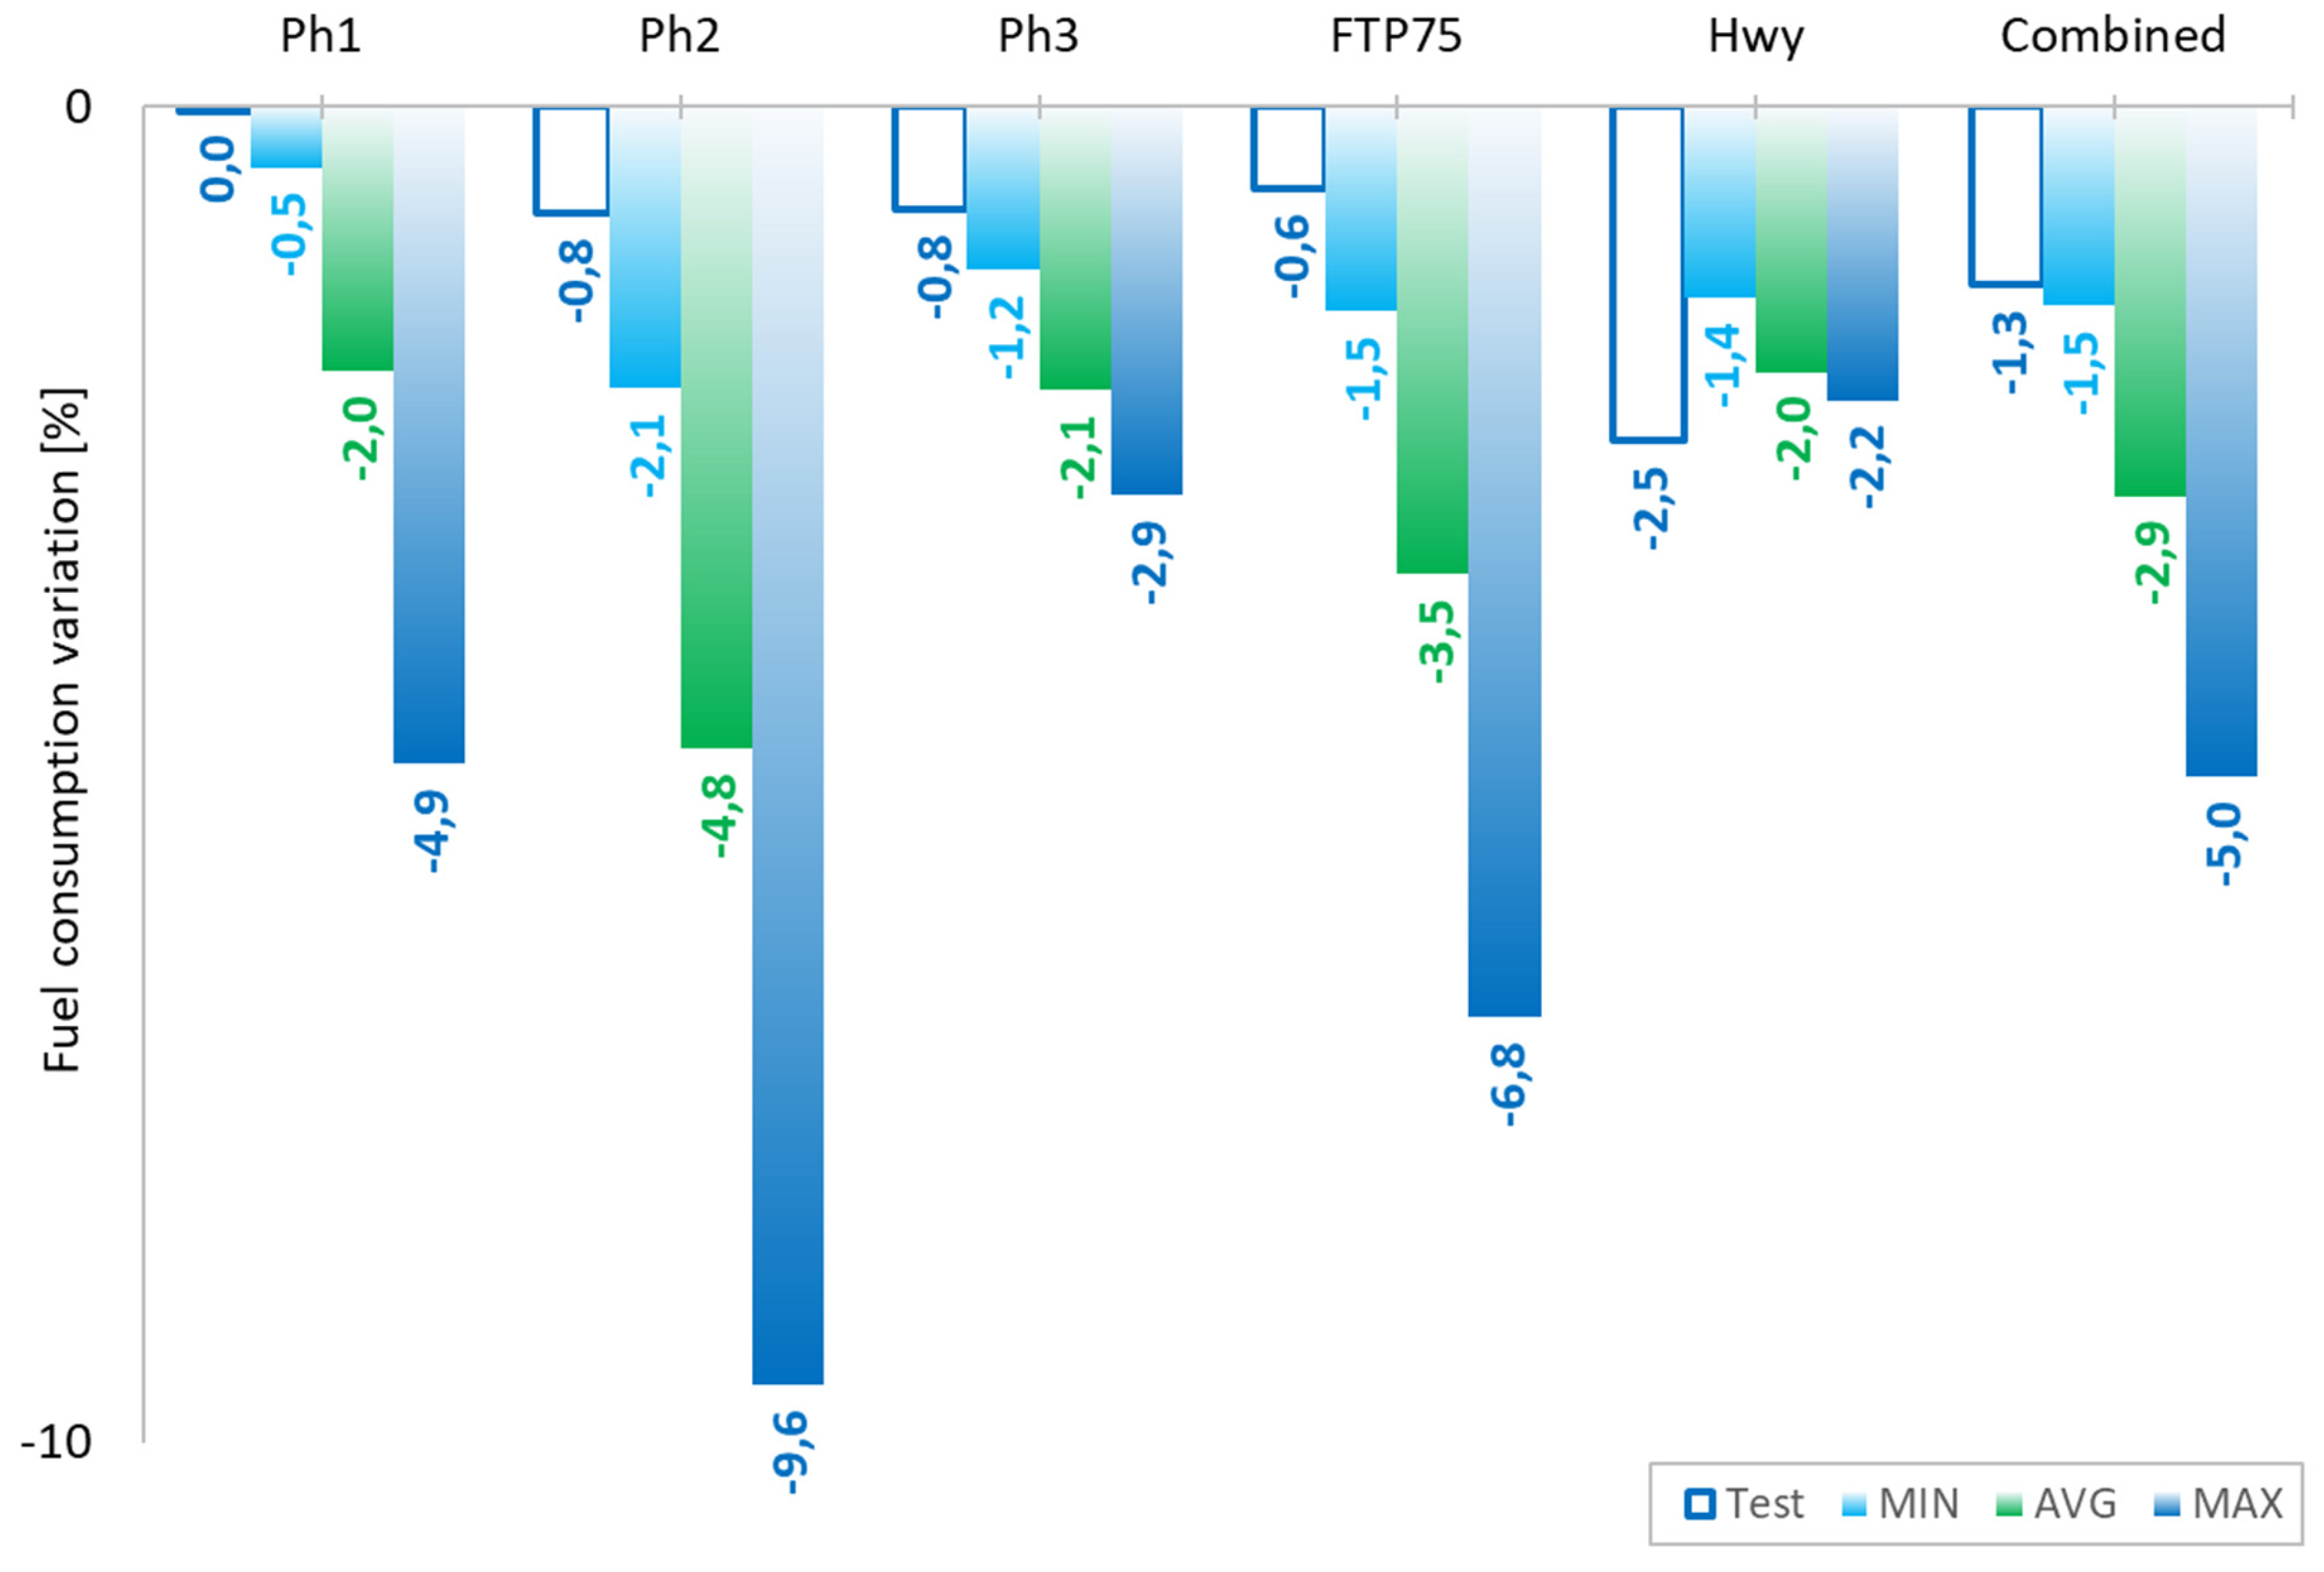

Table 1.
Tested lubricant oil characteristics.
| Unit | 5W40 | 5W20 | |
|---|---|---|---|
| Kv 40 | mm2/s | 81.75 | 45.04 |
| kv 100 | mm2/s | 13.52 | 8.15 |
| HTHS | mPa.s | 3.5 min. | 2.6 min |
| Low Temp. Cranking Visc. @-30°C | mPa.s | 6600 max. | 6600 max. |
| Evaporative Loss (NOACK) | mass % | 13 max. | 13 max. |
| Total Base Number (TBN) | mgKOH/g | 11 min. | 11 min. |
| Phosphorous | mass % | 0.8–1.5 | 0.07–0.09 |
| Sulfated ash | mass % | 1.0–1.5 | 1.2 max. |
| Chlorine | mg/kg | report | 50 max. |
Table 2.
Experimental fuel consumption variation with low viscosity lubricant.
| Ph1 | Ph2 | Ph3 | FTP75 | Hwy | Combined |
|---|---|---|---|---|---|
| [%] | [%] | [%] | [%] | [%] | [%] |
| - 0.04 | - 0.79 | - 0.77 | - 0.62 | - 2.49 | - 1.33 |
Table 3.
Vehicle speed percentual compensations to be applied.
| Lubricant | Test | Ph1 | Ph2 | Ph3 | Hwy |
|---|---|---|---|---|---|
| 5W40 | 1 | ref | ref | ref | ref |
| 5W40 | 2 | + 0.81 | + 1.00 | + 0.78 | + 0.43 |
| 5W20 | 3 | + 1.25 | + 1.37 | + 1.27 | + 2.00 |
| 5W20 | 4 | + 0.69 | + 0.76 | + 0.62 | + 2.00 |
Table 4.
Minimum battery recharging compensation.
| Lubricant | Test | Ph1 | Ph2 | Ph3 | Hwy |
|---|---|---|---|---|---|
| 5W40 | 1 | ref | ref | ref | ref |
| 5W40 | 2 | - 0,01 | - 0,04 | - 0,01 | 0,00 |
| 5W20 | 3 | - 1,94 | - 3,79 | - 2,02 | - 1,37 |
| 5W20 | 4 | - 0,02 | 0,00 | + 0,01 | 0,00 |
Table 5.
Average battery recharging compensation.
| Lubricant | Test | Ph1 | Ph2 | Ph3 | Hwy |
|---|---|---|---|---|---|
| 5W40 | 1 | ref | ref | ref | ref |
| 5W40 | 2 | - 2,52 | - 5,05 | - 0,87 | - 0,57 |
| 5W20 | 3 | - 5,11 | - 9,27 | - 3,79 | - 2,40 |
| 5W20 | 4 | - 2,40 | - 4,81 | - 0,89 | - 0,68 |
Table 6.
Maximum battery recharging compensation.
| Lubricant | Test | Ph1 | Ph2 | Ph3 | Hwy |
|---|---|---|---|---|---|
| 5W40 | 1 | ref | ref | ref | ref |
| 5W40 | 2 | - 7,59 | - 13,48 | - 2,22 | - 0,68 |
| 5W20 | 3 | - 10,64 | - 17,92 | - 5,48 | - 2,81 |
| 5W20 | 4 | - 7,55 | - 13,29 | - 2,09 | - 0,81 |
Disclaimer/Publisher’s Note: The statements, opinions and data contained in all publications are solely those of the individual author(s) and contributor(s) and not of MDPI and/or the editor(s). MDPI and/or the editor(s) disclaim responsibility for any injury to people or property resulting from any ideas, methods, instructions or products referred to in the content. |
© 2024 by the authors. Licensee MDPI, Basel, Switzerland. This article is an open access article distributed under the terms and conditions of the Creative Commons Attribution (CC BY) license (http://creativecommons.org/licenses/by/4.0/).
Copyright: This open access article is published under a Creative Commons CC BY 4.0 license, which permit the free download, distribution, and reuse, provided that the author and preprint are cited in any reuse.


