
Submitted:
16 December 2024
Posted:
17 December 2024
You are already at the latest version
Abstract
Ultra-trail races (UT) pose significant challenges to maintaining hydration and electrolyte balance, with risks of dehydration (DH), overhydration (OH), exercise-associated hyponatremia (EAH), and exertional rhabdomyolysis (ER). This study examined the effects of ad libitum (ADL) hydration on hydration status and muscle damage during a nine-stage UT (635 km, 40,586 m elevation gain). Four highly trained male athletes participated. Hydration was assessed via body weight loss (BWL), urine specific gravity (Usg), and serum sodium ([Na+]), while muscle damage markers included creatine kinase (CK), lactate dehydrogenase (LDH), and calcium (Ca). Results showed no cases of EAH or hypernatremia ([Na+] >145 mmol·L−1), with serum [Na+] maintained above 135 mmol·L−1. BWL exceeded the 2% DH threshold in the early stages (p=0.029), and Usg remained elevated (>1.020 g·mL−1). LDH and CK significantly increased at all stages (p<0.05), persisting 48 hours post-event. Correlations showed BWL aggravated muscle damage (r=0.47 with CK) and hypocalcemia (r=−0.68 with Ca). Elevation gain/loss amplified fluid loss and muscle injury. While ADL hydration mitigated EAH, it did not fully address DH or muscle damage. Personalized hydration and recovery protocols are crucial to optimizing performance and health in UT races.
Keywords:
hyponatremia
; fluid imbalance
; ultra-endurance
; body weight loss
; hydration strategies
; exertional rhabdomyolysis
1. Introduction
Ultra-trail races (UT) present unique and significant challenges to maintaining hydration and electrolyte balance because of their extreme duration (>42.195 km or at least 6 hours) [1,2]. UT athletes are exposed to environmental extremes [3], including heat, humidity, and altitude, which increase sweat rates and the potential apparition for dehydration (DH), electrolyte imbalances, and even medical conditions such as heat stroke or death [4]. The risk of DH is ever-present due to the prolonged nature of these events, where fluid losses can accumulate over time [5] and has been a matter of concern for prestigious institutions such as The American College of Sports Medicine (ACSM) [6] or The International Society of Sports Nutrition (ISSN) [7]. However, the risk of overhydration (OH) is equally concerning, especially when athletes consume large amounts of fluids or start the race overhydrated [8]. The complexity of these events demands a specific understanding of how to balance fluid and electrolyte intake to prevent runners from suffering both DH or OH. OH, may provoke a medical condition called exercise-associated hyponatremia (EAH) that occurs when an athlete's sodium [Na+] levels drop to dangerously low levels during or after prolonged exercise. EAH is defined by serum [Na+] below 135 mmol·L−1, with severe cases occurring when levels drop below 120 mmol·L−1, and normal levels ranging within 135-145 mmol·L−1. [9].
EAH cases have been reported in UT races ranging from 0.0% [10] to 20% [11]. The most common diagnostic tool to measure fluid balance is the body weight lost (BWL) percentage during exercise. Mild DH is defined by a 1-2% BWL, moderate DH by a 3-5% loss, and severe DH by losses exceeding 5% [12]. The consequences of DH are particularly pronounced in endurance sports, where athletes engage in prolonged physical activity. Studies have shown that even mild DH can impair performance by reducing maximal oxygen consumption (VO2max), increasing perceived exertion, and impairing thermoregulation. In extreme cases, DH can lead to a dangerous health condition known as heat stroke, which requires immediate medical intervention [13].
Another diagnostic tool to assess DH is urine-specific gravity (Usg). Usg is a widely used marker to evaluate hydration status, with a threshold value of 1.020 g·mL−1 often employed to distinguish between euhydration and DH [14]. Values above this threshold indicate DH, as they reflect higher concentrations of solutes in suggesting insufficient fluid intake relative to losses. Studies have demonstrated the utility of Usg in various athletic contexts, including endurance sports, where it provides a reliable, non-invasive measure of hydration status both before and after exercise [15]. The primary cause of EAH is excessive consumption of hypotonic fluids, such as water or sports drinks with low [Na+] content, in amounts that exceed renal excretion capacity. This excessive fluid intake dilutes blood’s [Na+], leading to EAH. Conversely, athletes experiencing BWL greater than 2% may develop hypernatremia, a condition characterized by serum [Na+] exceeding 145 mmol·L−1 [16].
Electrolyte disorder affects performance and may affect the muscle structure debilitating the sarcolemma and producing the leakage of muscle cell contents, myoglobin, sarcoplasmic proteins— such as creatine kinase (CK), lactate dehydrogenase (LDH), aldolase, alanine, and aspartate aminotransferase—and electrolytes—such as calcium (Ca)— which during the acute phase shifts into damaged muscle cells and precipitates with phosphates in necrotic tissues [17]. During the acute phase of ER, hypocalcemia often develops as Ca shifts into damaged muscle cells. It precipitates with phosphates in necrotic tissues, contributing to the disruption of normal cellular function. This medical condition is called exertional rhabdomyolysis (ER) and has been linked to acute kidney damage in sports [18,19]. The diagnosis of ER is varied, without consensus on whether the diagnosis is based on clinical presentation, laboratory findings, or a combination. Laboratory diagnosis of ER shows elevations in serum CK, and there is no specific established serum level cut-off [20]. Many physicians use three to five times the upper limit of normal values of 100 to 400 U/L (approximately 1000 U/L) for diagnosis. EAH + ER cases have been reported in different sports [21,22]. It has been suggested that low blood [Na+] concentration may contribute to muscle-cell swelling; which, combined with repetitive mechanical stress from running, may accelerate skeletal muscle damage [23].
Trail running, particularly in ultra-endurance formats, presents unique and significant challenges to maintaining hydration and electrolyte balance. Traditionally, athletes have been advised to follow regimented hydration schedules, often based on predetermined fluid intake rates. However, recent research suggests that this approach may not be ideal for all athletes, as it does not account for individual variability in sweat rates, fluid needs, and risk factors for EAH [24]. Some studies have advocated for an ad libitum (ADL) hydration strategy [25] approach to hydration, where athletes drink according to thirst. This strategy is believed to balance fluid intake with the body’s actual needs more naturally, potentially reducing the risk of DH and EAH. On the other hand, other studies [26] have recommended using planned hydration (PH), where fluid intake is based on pre-race calculations.
Given the dual risks of DH and EAH in UT, this study investigates whether an ADL can effectively mitigate these risks in highly trained athletes during a multi-stage UT event. The study will assess whether ADL drinking can maintain adequate hydration without leading to the excessive fluid intake associated with EAH measured by BWL, Usg and serum [Na+] and the simultaneous presence of ER analyzed by serum CK, LDH and Ca. Additionally, this study explores the factors influencing UT performance and their relationships with ER, EAH and DH, providing valuable insights into these dynamics. The underlying hypothesis posits that an individualized hydration strategy tailored to these factors will help prevent DH, EAH, and ER, thereby enhancing race performance and mitigating the risk of adverse health outcome
2. Materials and Methods
2.1. Experimental Design
This race, carried out in the north of Spain, consisted of completing a total of 635 km with 40,586 m elevation gain and 39,811 m elevation loss in 9 days (daily mean: 70.6 ± 4.96 km; 4,509.56 ± 1,010.43 m elevation gain; 4,423.44 ± 984.86 m elevation loss. The research was carried out according to the Declaration of Helsinki and the project’s approval was obtained from the Ethics Committee of the Department of Health and Consumption of the Government of Aragon (Spain) (protocol code 18/2015).
2.2. Participants
A total of four highly trained male athletes (age 38 ± 4.11 years; VO2max 61.17 ± 8.96 mL·kg-1·min-1; UT experience 5 ± 1.26 years) voluntarily participated in this study. They were free of any pharmacologic, medical or dietary treatment. Participants were adequately informed about the study objective, procedures and risks. Personal written informed consent was previously provided to participate, and they could withdraw from the study at their own will at any time. Inclusion criteria were: (1) older than 18 years old; (2) previous experience in, at least, two ultramarathons (longer than 42 km); and (3) not being under any chronic medical treatment or condition. Participants’ characteristics can be found in Table 1.
2.3. Anthropometry and BWL
Anthropometric measurements were carried out by a skilled and experienced technician according to the standards for anthropometric assessment [15] 2 hours before the start of the race. These measurements included height, weight and skin folds. Height was measured using a wall-mounted stadiometer (Seca 220, Seca, Hamburg, Germany) to the nearest 0.1 cm. Weight was measured to the nearest 0.01 kg on a calibrated electronic digital scale (Seca 769, Hamburg, Germany) nude and barefoot. BWL was calculated by the difference between pre-and post-stage weight to the nearest 0.01 kg. These measurements were carried out 30 minutes before the beginning and immediately after each stage to the nearest 0.01 kg using a calibrated digital scale (Seca 769, Hamburg, Germany).
2.4. Urine Analysis
The first urine sample in the morning (baseline) and the first urine sample after stages 1, 3, 5, 7 and 9 were taken from all the participants. Samples were collected in polyethylene tubes, measured, codified and frozen at −80 °C until analyzed. Tubes were previously washed with diluted nitric acid. Before analyses, samples were thawed and homogenized by shaking. For Usg analysis, a 10 mL urine sample was used to obtain each participant’s values. To this aim, a pre-calibrated refractometer (URC-Ne, Atago, Japan) was employed in situ as previously described [18].
2.5. Blood Samples
Baseline samples were taken 90 minutes before stage 1 and consequent samples were collected immediately after stages 1, 3, 5, 7, 9 (approximately 10 minutes post-exercise). An extra sample was extracted 48h after the ninth stage to monitor recovery.
Two 5 mL venous blood samples were drawn from the antecubital vein of each participant to assess serum [Na+], CK, LDH and Ca concentrations. The samples were collected in Vacutainer tubes containing ethylenediaminetetraacetic acid (EDTA) as an anticoagulant. Following collection, blood samples were transferred into metal-free polypropylene tubes (pre-washed with diluted nitric acid) and centrifuged at 2500 RPM for 10 minutes at room temperature to isolate the serum. Samples were left to coagulate for 25–30 minutes, then allotted into Eppendorf tubes (also pre-washed with diluted nitric acid) and stored at −80°C for later biochemical analysis.
2.6. Statistical Analysis
Data was processed using Python language (Python Software Foundation, version 3.X) at the cloud-based platform Databricks (Databricks, San Francisco, USA). The normality of variable distribution was assessed using the Shapiro–Wilk test. Due to the small sample size, p-values were calculated using either a Permutation test or Monte Carlo simulations, depending on the distribution of the variables. Effect sizes were calculated using Cohen’s D, where values of 0.2, 0.5, and 0.8 were interpreted as small, medium, and large effects, respectively. Visualizations were created using the matplotlib and seaborn packages. Pearson correlation coefficients were computed to generate the correlation matrix using the .corr method in Python. Statistical significance was set at p < 0.05.
3. Results
3.1. BWL
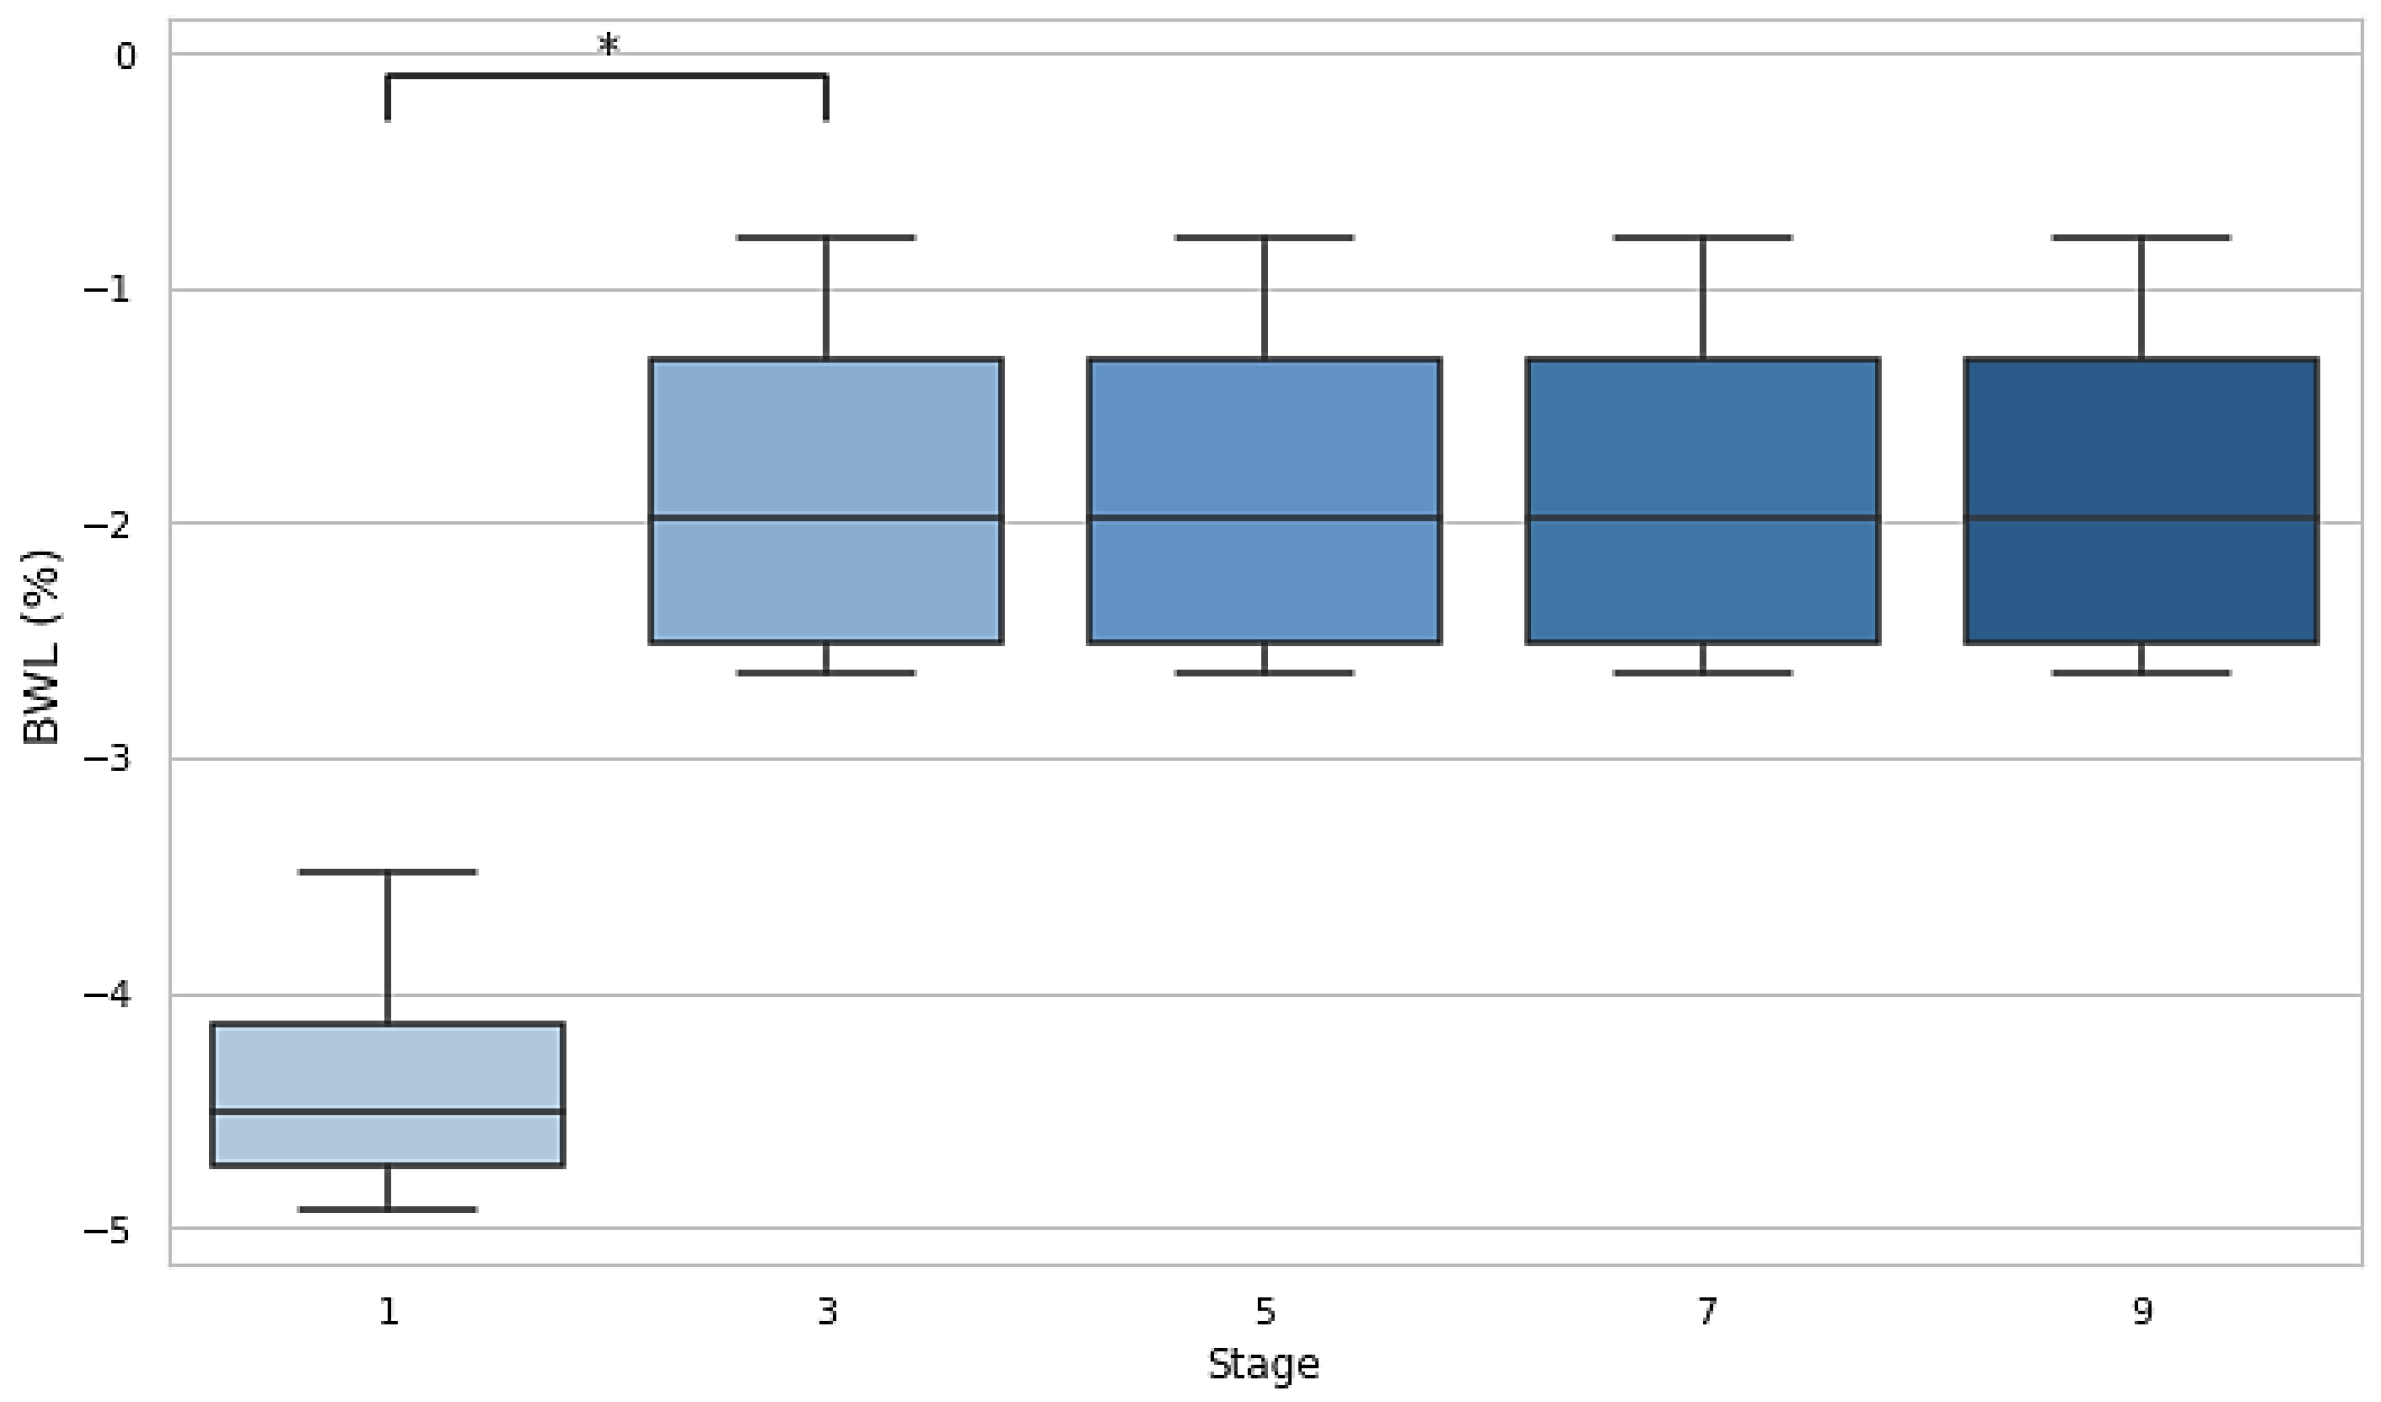
A significant difference in BWL was observed between stage 1 and stage 3 (p=0.029, d=−3.32), indicating a substantial reduction in body weight early in the race. No significant differences were found between subsequent stages (3 vs. 5, 5 vs. 7, and 7 vs. 9), suggesting that BWL stabilized as the race progressed but remained at the −2% DH threshold.
Figure 1.
Body weight losses after stages 1, 3, 5, 7 and 9. Dehydration threshold settled at <-2%. BWL: body weight loss.
Figure 1.
Body weight losses after stages 1, 3, 5, 7 and 9. Dehydration threshold settled at <-2%. BWL: body weight loss.
3.2. Usg
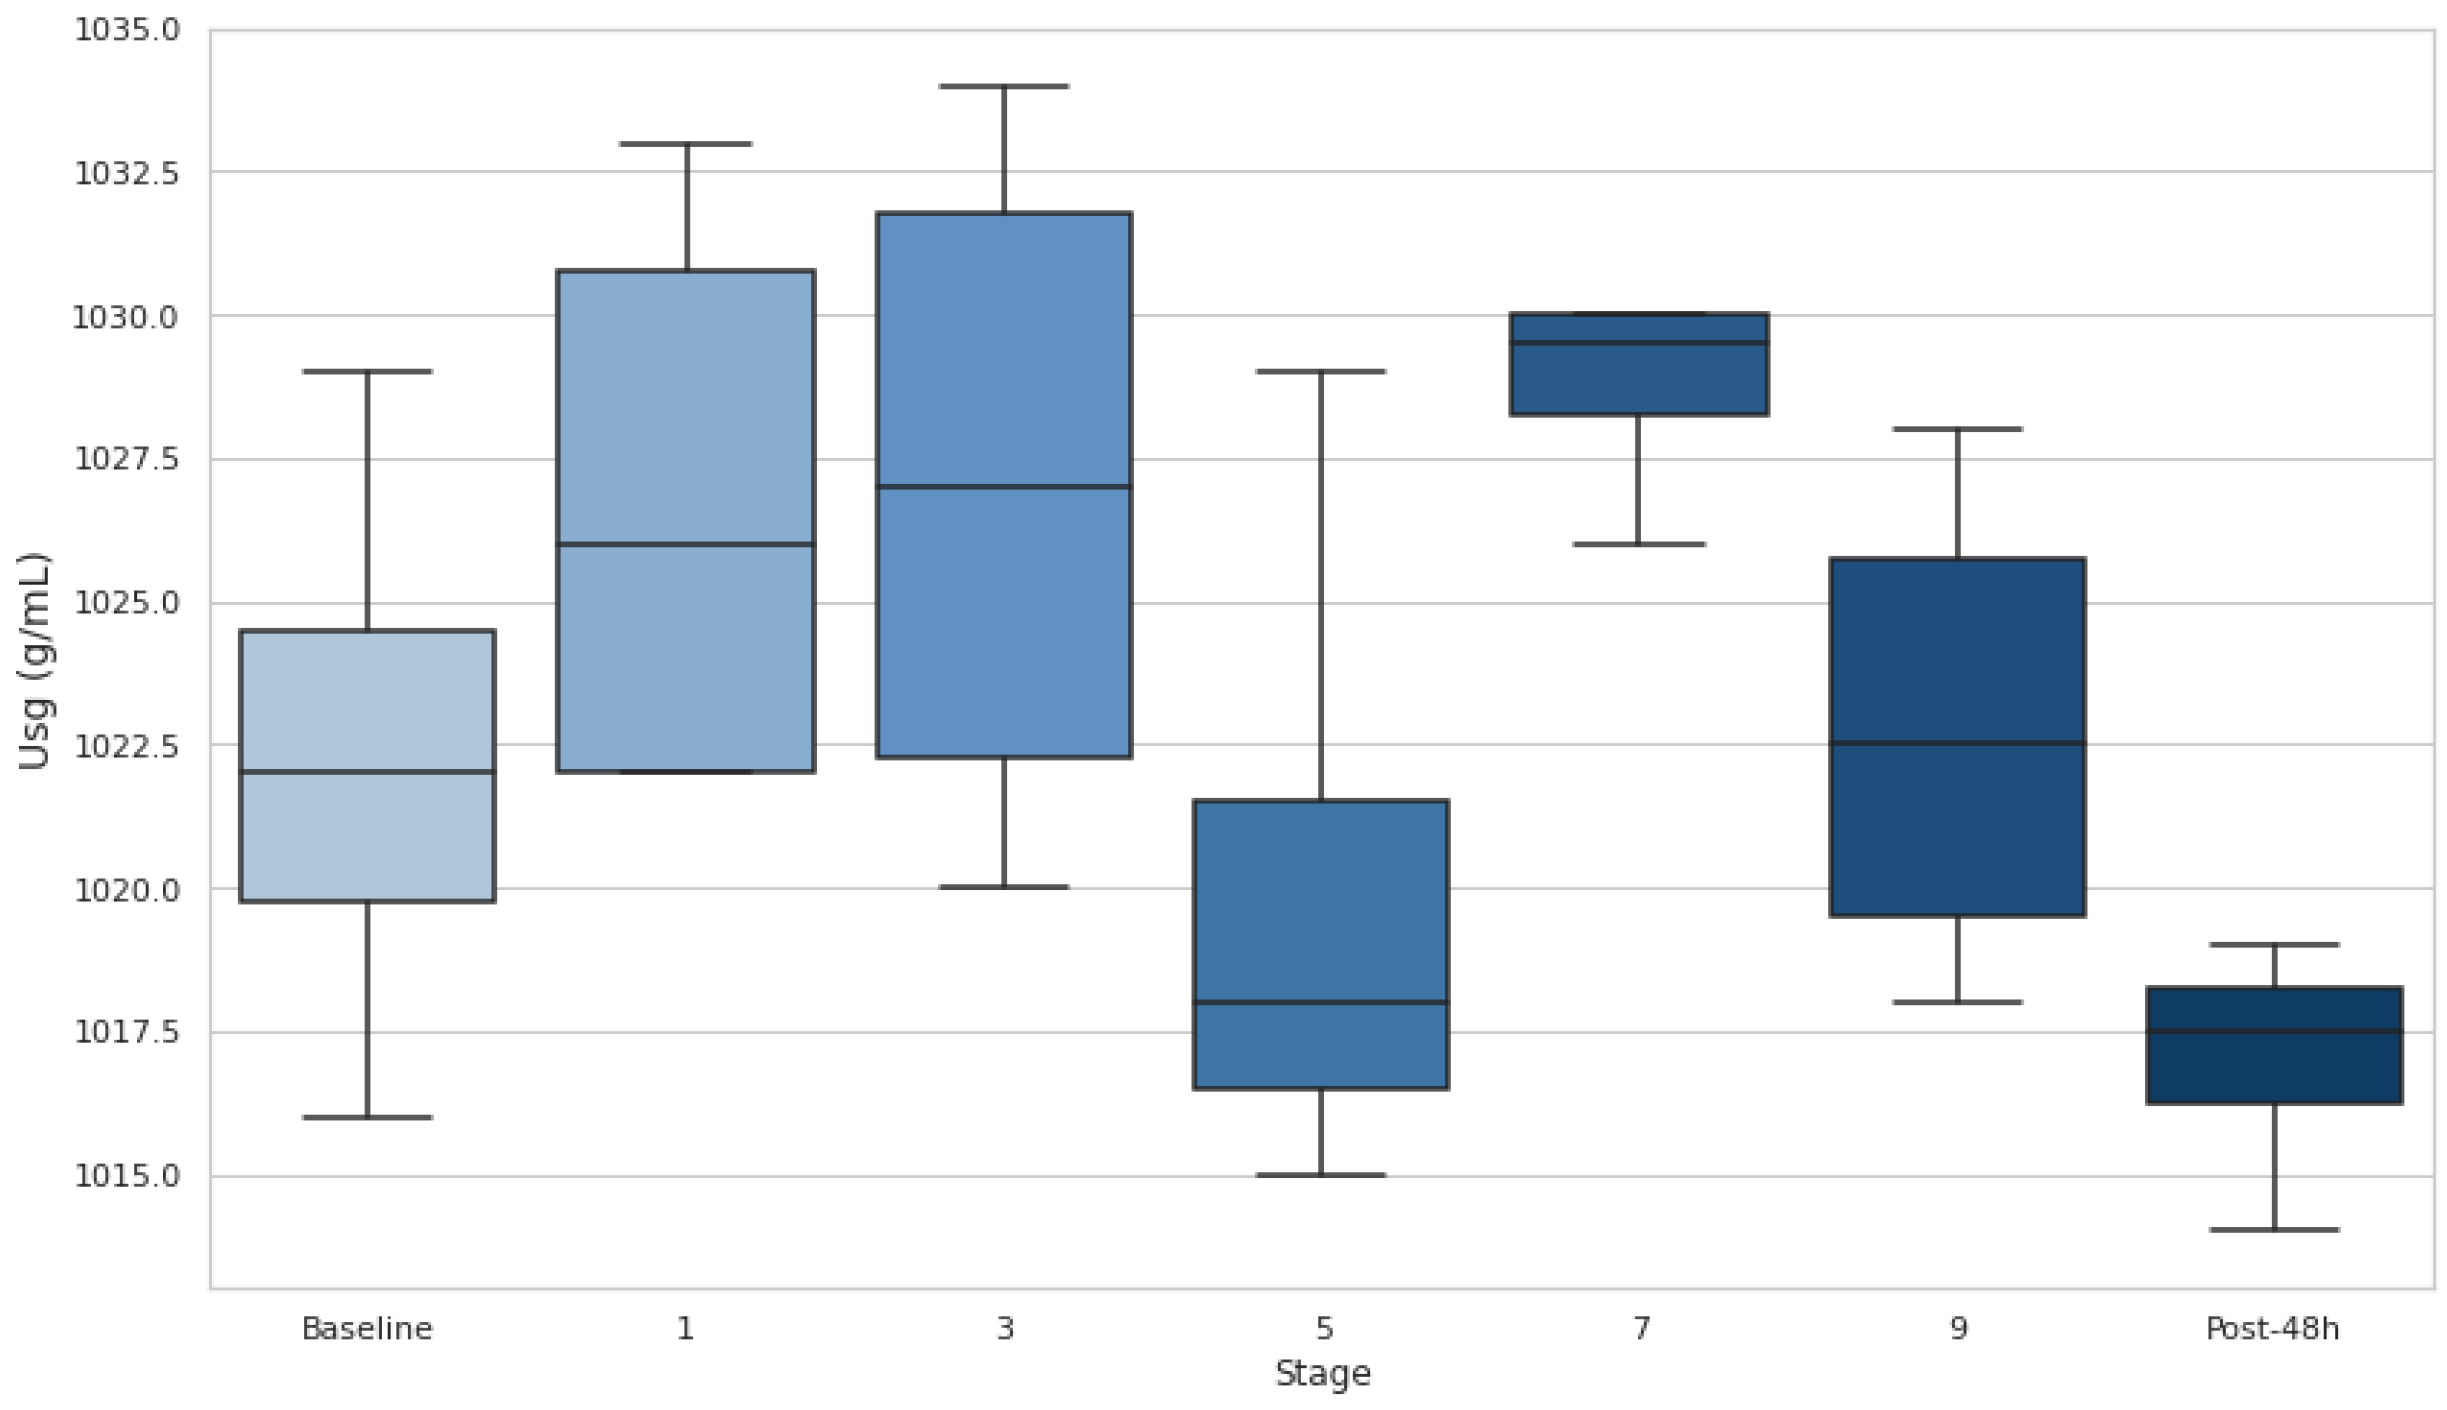
At baseline, most participants had Usg values above this threshold, indicating a DH state. Additionally, Usg increased in the early stages (1 and 3), with medians exceeding 1.020 g·mL-1, highlighting dehydration onset during the initial phases of the race. Usg decreased at stage 5, suggesting partial rehydration, but remained elevated near or above the DH threshold through stages 7 and 9, indicating persistent hydration challenges. After 48h, Usg values dropped below 1.020 g·mL-1 for most participants, reflecting a recovery to a hydrated state. Despite fluctuations, no stage comparisons with baseline reached statistical significance (p>0.05), though the effect size between S0 and S7 (d=−1.61) suggests a notable increase in hydration stress during the race.
Figure 2.
Urine specific gravity at baseline and after stages 1, 3, 5, 7 and 9. Dehydration threshold settled at Usg >1.020 g·mL-1. Usg: urine specific gravity; *p<0.05.
Figure 2.
Urine specific gravity at baseline and after stages 1, 3, 5, 7 and 9. Dehydration threshold settled at Usg >1.020 g·mL-1. Usg: urine specific gravity; *p<0.05.
3.3. [Na+]
[Na+] analysis reported a 0% incidence of EAH (concentration <135 mmol·L−1), with values remaining within ~136-144 mmol/L at baseline and during the whole race (Figure 3). Statistical analysis shows a trend toward significance between stages 1 and 3 (p=0.06, d=−2.31) and a moderate effect size between stages 7 and 9 (p=0.018, d=1.34). These patterns suggest a first progression towards hypernatremia and a subsequent recovery phase.
3.4. Serum CK and LDH
Both CK and LDH showed significant increases throughout the entire event, as evidenced by consistently elevated levels at all stages compared to baseline (p<0.05) (Figure 4 and Figure 5). CK demonstrated particularly large effect sizes, with the most pronounced changes observed at stage 3 (d=−9.20) and substantial elevations persisting even after 48 hours (d=−2.84). Similarly, LDH levels rose significantly at every stage, with the greatest effect at stage 1 (d=−7.22) and remained elevated at 48 hours post-event (d=−2.80).
3.5. Serum Ca
Serum Ca levels significantly increased at the end of stage 1 compared to baseline (p<0.05, d=−2.29) but remained below baseline during the intermediate stages, with no significant changes observed in stages 3, 5, or 7 (Figure 6). At the end of stage 9, Ca exhibited a significant decrease compared to baseline (p<0.05, d=3.72).
3.6. Relationship Between Biomarkers and Extrinsic Race Characteristics
According to Pearson’s correlation analysis (Figure 7), Distance was negatively correlated with BWL (r=−0.62) and LDH (r=−0.59), while it showed a positive correlation with Ca (r=0.60). This indicates that as the distance increased, BWL and LDH decreased, while Ca increased. Similarly, elevation gain was positively correlated with BWL (r=0.52) and [Na+] (r=0.67). Elevation loss exhibited similar trends, being positively correlated with both BWL (r=0.52) and [Na+] (r=0.53).
Furthermore, accumulated elevation gain showed a positive correlation with BWL (r=0.57) and LDH (r=0.64) but was negatively correlated with Ca (r=−0.62). Accumulated elevation loss also demonstrated positive correlations with BWL (r=0.55) and LDH (r=0.65), and a negative correlation with Ca (r=−0.62). Temperature was negatively correlated with BWL (r=−0.40) and LDH (r=−0.61), but positively correlated with Ca (r=0.41).
BWL was negatively correlated with Ca (r=−0.68) and positively correlated with CK (r=0.47). Na was positively correlated with CK (r=0.43), while Ca exhibited negative correlations with both CK (r=−0.53) and LDH (r=−0.40). Finally, CK were positively correlated with serum LDH (r=0.50).
4. Discussion
4.1. EAH
Despite fluctuations in [Na+] during the race—characterized by a progressive increase up to stage 7 followed by a significant decrease from stage 7 to 9 (p<0.05)—no athlete experienced EAH, as [Na+] remained above 135 mmol·L⁻¹. Similarly, no cases of hypernatremia ([Na+] >145 mmol·L⁻¹) were observed, with all values staying within the normal range according to standard criteria [27].
The incidence of EAH in ultra-endurance sports has been extensively studied, with reported rates varying between 0% and 51% [20]. Arnaoutis et al. [28] examined EAH incidence on a 44-km mountain marathon where 8% of runners (5 out of 62) developed asymptomatic EAH, with a significant drop in serum [Na+]. Lecina et al. [23] conducted a systematic review focusing on UT races and identified a correlation between race distance and EAH incidence, with rates of 2.69% in medium-distance UTs versus 12.19% in long-distance UTs. On the other hand, Hoffman et al. [24] observed an EAH of 15.1% (range 4.6%–51.0%) in 161-km ultramarathons, being more common in dehydrated runners and in hotter temperatures. Authors advised against excessive [Na+] supplementation and OH beyond thirst-driven intake.
4.2. Hydration Status
BWL is an important marker of fluid loss during physical exertion. The results revealed that BWL initially dropped below 4% in the first stage, indicating significant fluid loss. Although it improved and stabilized (p<0.05) after the third stage, it remained over the 2% threshold during the whole event, suggesting that athletes were still in a dehydrated state. Usg measurements revealed no statistical differences from baseline values, but the athletes’ Usg remained above 1.020 (the DH threshold) in stages 1, 3, 7, and 9. This suggests that DH persisted at various stages of the event, particularly in the early and late phases. This comprehensive assessment underscores the difficulty of maintaining hydration in ultra-endurance events and supports findings by Rojas-Valverde et al. [19] who also identified significant DH (66.7% incidence) in trail runners, completing a distance of 35.3 km and 1,815 m of elevation gain when utilizing multiple hydration markers.
Our results are consistent with similar studies in UT running, such as the reported by Martínez-Navarro et al. [29]. They observed that 38.2% and 47.8% of participants finished dehydrated in a 118 km (5,439 m elevation gain) UT race when assessing this issue with BWL and Usg respectively. In addition, they found BWL was inversely correlated with finishing time (r=−0.34, p ≤ 0.05). Interestingly, BWL has been reported to be a key performance factor in some UT distances (50-km) but not in other distances (80-km) [26]. The authors reported that while 80-km racers also experienced BWL, their hematocrit levels decreased, suggesting plasma volume expansion or hemolysis. Non-finishers showed a trend toward higher hematocrit levels, possibly indicating severe DH, though this was not confirmed by other DH markers. Despite these findings, a moderate (2–3) BWL appears to possibly benefit performance.
4.3. Elevation Gain/Loss and Muscle Damage: Key Factors in Ultra-Endurance Events
Elevation gain and loss are critical factors in UT races, where significant vertical displacement imposes unique stress on the body. Elevation gain and loss were positively correlated with BWL (r=0.52) and [Na+] (r=0.67 and r=0.53, respectively), indicating that they increase fluid loss and worsens electrolyte imbalance. Additionally, both accumulated elevation gain and loss were positively correlated to LDH (r=0.64 and r=0.65, respectively), reflecting the strain placed on muscles during both ascent and descent [30,31,32].
Furthermore, serum LDH and LDH levels increased significantly over the course of the event and remained elevated 48 hours post-event (p<0.05), indicating that muscle damage persisted long after the event's conclusion. These findings support the idea that ultra-endurance events, particularly those with significant elevation changes, contribute to substantial muscle damage [33]. The sustained elevation of LDH throughout the event is consistent with previous studies showing that LDH is a key marker of muscle injury during prolonged physical activity. Likewise, CK is another well-established marker of muscle damage, and its increase throughout the event further emphasizes the severity of muscle injury experienced during ultra-endurance races [34,35]. The moderate positive correlation between CK and LDH elevations (r=0.50) further highlights their interconnected roles as markers of muscle damage, as both enzymes are released into circulation following sarcolemma disruption during intense physical exertion [36,37,38].
Moreover, Ca levels negatively correlated with accumulated elevation gain and loss (r=−0.62), suggesting that significant elevation changes may reduce serum Ca. Also, its levels significantly rose at the end of stage 1 (p<0.05) but subsequently remained below baseline values in the mid-stages and dropped significantly by stage 9 (p<0.05). This aligns with ER findings, where acute hypocalcemia occurs due to Ca influx into damaged muscles and phosphate precipitation. Given Ca’s role in muscle function, its depletion during prolonged exertion may exacerbate fatigue and injury risk, highlighting its importance in assessing recovery in UT events [39].
4.4. Linking Hydration Status and Muscle Damage: The Interplay Between EAH and ER
The results of this study suggest a complex interplay between hydration status and muscle damage during ultra-endurance events, highlighting the importance of both hydration management and muscle recovery strategies. As fluid loss (reflected in BWL and Usg) increased throughout the event, the risk of EAH, assessed by serum [Na+], remained in the ‘safe zone’.
Simultaneously, muscle damage markers such as CK and LDH, which remained elevated throughout the event, underscore the contribution of sustained mechanical muscle stress, including significant elevation changes, to ER [31]. The correlations between these muscle damage markers and elevation gain/loss suggest that vertical displacement exacerbates muscle injury, thus increasing the risk of ER. Furthermore, the negative correlation between BWL and Ca (r=−0.68) further highlights the interplay between DH and muscle damage [40,41]. Significant fluid loss likely exacerbates Ca imbalances by reducing plasma volume and altering ion transport, contributing to the observed hypocalcemia. This relationship suggests that DH not only impairs overall physiological performance but may also heighten the risk of muscle damage by disrupting Ca homeostasis, emphasizing the critical role of hydration strategies in mitigating muscle fatigue and injury during ultra-endurance events [31,42].
These findings reinforce the bidirectional relationship between EAH and ER in ultra-endurance events, where disruptions in hydration can contribute to muscle damage, and severe muscle injury can, in turn, worsen fluid balance. Both conditions appear to be aggravated by factors such as elevation gain/loss and prolonged physical exertion, emphasizing the need for comprehensive strategies to manage both hydration and muscle recovery in these extreme events.
5. Conclusions
This study highlights the intricate relationship between hydration status, muscle damage, and performance in UT races. ADL hydration effectively prevented EAH, as [Na+] remained within safe limits throughout the event. However, DH, as indicated by BWL >2% and elevated Usg >1.020 g·mL−1, persisted during several stages, particularly early in the race. Muscle damage markers, including CK, LDH and Ca, showed significant changes across all stages. CK and LDH increased substantially, while Ca levels fluctuated, dropping below baseline during later stages, indicating sustained tissue and electrolyte stress.
Correlations revealed that BWL exacerbated muscle damage and hypocalcemia, while elevation changes intensified fluid loss and muscle injury. These findings underscore the importance of combining ADL hydration with tailored recovery strategies to mitigate DH and muscle damage, which are critical for maintaining performance and reducing health risks in ultra-endurance events. Comprehensive approaches addressing individual fluid balance and recovery needs are essential to optimize outcomes in this demanding sport. Future research should explore the effects of various beverages, including electrolyte solutions and different osmolarity concentrations, on EAH and DH concerning the specific characteristics of UT races. Additionally, new wearable devices may help prevent runners from experiencing these medical conditions, so future studies should incorporate the assessment of fluid imbalance and electrolyte disorders.
Author Contributions
data curation, formal analysis, software, visualization and writing – original draft, A.G.G. and M.L.; funding acquisition and resources, C.C.O. and F.P.; investigation and methodology, M.L., C.C.O. and F.P.; project administration, C.C.O. and N.O.; supervision, validation and writing - review & editing; C.C.O., F.P. and N.O.; writing. All authors have read and agreed to the published version of the manuscript.
Funding
This study was funded by public resources from the Directorate General for Research and Innovation of the Government of Aragón and the Institute of Altoaragoneses’ Studies, in support of the ENFYRED research group.
Institutional Review Board Statement
The study was conducted in accordance with the Declaration of Helsinki and approved by Ethics Committee of the Department of Health and Consumption of the Government of Aragon (Spain) (protocol code 18/2015).
Informed Consent Statement
Informed consent was obtained from all subjects involved in the study.
Data Availability Statement
The datasets generated during and/or analyzed during the current study are available from the corresponding author on reasonable request.
Acknowledgments
The authors sincerely thank all participants for their time and dedication, which were crucial to the success of the study. Additionally, we recognize the essential contributions and support of the ENFYRED research group, whose involvement was fundamental.
Conflicts of Interest
The authors declare no conflicts of interest.
References
- Scheer V, Basset P, Giovanelli N, Vernillo G, Millet GP, Costa RJS. Defining Off-road Running: A Position Statement from the Ultra Sports Science Foundation. Int J Sports Med. 2020;41(5):275–84. [CrossRef]
- Spenceley K, Humphrey R, Lingam C, Indroduction W. Defining Ultra-Endurance: A survey of athletes and coaches to achieve a consensus definition. Vol. 1, Health & Wellbeing). 2017.
- De Castro RRT, Filho RBC, Da Nóbrega ACL. Fulminant liver failure in a street runner: Effects of heat stroke. Rev Assoc Med Bras. 2018;64(3):208–11.
- Bouscaren N, Faricier R, Millet GY, Racinais S. Heat acclimatization, cooling strategies, and hydration during an ultra-trail in warm and humid conditions. Nutrients. 2021 Apr 1;13(4). [CrossRef]
- Cleary MA. Creatine kinase, exertional rhabdomyolysis, and exercise-associated hyponatremia in ultra-endurance athletes: A critically appraised paper. International Journal of Athletic Therapy and Training. 2016;21(6):13–5. [CrossRef]
- Hew-Butler T, Rosner MH, Fowkes-Godek S, Dugas JP, Hoffman MD, Lewis DP, et al. Statement of the 3rd international exercise-associated hyponatremia consensus development conference, Carlsbad, California, 2015. Br J Sports Med. 2015;49(22):1432–46. [CrossRef]
- Kerksick CM, Wilborn CD, Roberts MD, Smith-Ryan A, Kleiner SM, Jäger R, et al. ISSN exercise & sports nutrition review update: Research & recommendations. Vol. 15, Journal of the International Society of Sports Nutrition. BioMed Central Ltd.; 2018. [CrossRef]
- Krabak BJ, Lipman GS, Waite BL, Rundell SD. Exercise-Associated Hyponatremia, Hypernatremia, and Hydration Status in Multistage Ultramarathons. Wilderness Environ Med [Internet]. 2017;28(4):291–8. Available from: http://dx.doi.org/10.1016/j.wem.2017.05.008. [CrossRef]
- Rosner MH, Kirven J. Exercise-associated hyponatremia. Clinical Journal of the American Society of Nephrology. 2007;2(1):151–61.
- Schenk K, Rauch S, Procter E, Grasegger K, Mrakic-Sposta S, Gatterer H. Changes in Factors Regulating Serum Sodium Homeostasis During Two Ultra-Endurance Mountain Races of Different Distances: 69km vs. 121km. Front Physiol. 2021;12(November). [CrossRef]
- Khodaee M, Saeedi A, Harris-Spinks C, Hew-Butler T. Incidence of exercise-associated hyponatremia during a high-altitude 161-km ultramarathon. Phys Act Nutr. 2021;25(3):16–22. [CrossRef]
- Sahay M, Sahay R. Hyponatremia: A practical approach. Indian J Endocrinol Metab. 2014;18(6):760–71. [CrossRef]
- Hoffman MD, Pasternak A, Rogers IR, Khodaee M, Hill JC, Townes DA, et al. Medical services at ultra-endurance foot races in remote environments: Medical issues and consensus guidelines. Sports Medicine. 2014;44(8):1055–69. [CrossRef]
- Safari S, Yousefifard M, Hashemi B, Baratloo A, Forouzanfar MM, Rahmati F, et al. The role of scoring systems and urine dipstick in prediction of rhabdomyolysis-induced acute kidney injury: A systematic review. Iran J Kidney Dis. 2016;10(3):101–6.
- Wilson PB. Associations of Urine Specific Gravity With Body Mass Index and Lean Body Mass at the Population Level: Implications for Hydration Monitoring. Int J Sport Nutr Exerc Metab. 2021 Nov 1;31(6):475–81. [CrossRef]
- Klingert M, Nikolaidis PT, Weiss K, Thuany M, Chlíbková D, Knechtle B. Exercise-Associated Hyponatremia in Marathon Runners. J Clin Med. 2022 Nov 16;11(22):6775. [CrossRef]
- Knapik JJ, O’Connor FG. Exertional Rhabdomyolysis: Epidemiology, Diagnosis, Treatment, and Prevention. J Spec Oper Med. 2016;16(3):65–71. [CrossRef]
- Adams D, de Jonge R, van der Cammen T, Zietse R, Hoorn EJ. Acute kidney injury in patients presenting with hyponatremia. J Nephrol. 2011;24(6):749–55. [CrossRef]
- Rojas-Valverde D, Sánchez-Ureña B, Crowe J, Timón R, Olcina GJ. Exertional rhabdomyolysis and acute kidney injury in endurance sports: A systematic review. Eur J Sport Sci [Internet]. 2020;0(0):1–28. Available from: https://doi.org/10.1080/17461391.2020.1746837. [CrossRef]
- Cervellin G, Comelli I, Benatti M, Sanchis-Gomar F, Bassi A, Lippi G. Non-traumatic rhabdomyolysis: Background, laboratory features, and acute clinical management. Vol. 50, Clinical Biochemistry. Elsevier Inc.; 2017. p. 656–62. [CrossRef]
- Kashiura M, Sugiyama K, Hamabe Y. Association between rapid serum sodium correction and rhabdomyolysis in water intoxication: A retrospective cohort study. J Intensive Care. 2017 Jun 19;5(1). [CrossRef]
- Morogiello J, Roessler R. Exertional rhabdomyolysis following noncontact collegiate recreational activity: A case report. International Journal of Athletic Therapy and Training. 2021 May 1;26(3):145–7. [CrossRef]
- Lecina M, Castellar-Otín C, López-Laval I, Carrasco Páez L, Pradas F. Acute Kidney Injury and Hyponatremia in Ultra-Trail Racing: A Systematic Review. Medicina (Kaunas) [Internet]. 2022 Apr 21;58(5). Available from: http://www.ncbi.nlm.nih.gov/pubmed/35629986. [CrossRef]
- Hoffman MD, Stuempfle KJ. Hydration strategies, weight change and performance in a 161 km ultramarathon. Research in Sports Medicine. 2014;22(3):213–25. [CrossRef]
- Armstrong LE, Johnson EC, Kunces LJ, Ganio MS, Judelson DA, Kupchak BR, et al. Drinking to thirst versus drinking ad libitum during road cycling. J Athl Train. 2014;49(5):624–31. [CrossRef]
- Goulet E, Hoffman M. Impact of Ad Libitum Versus Programmed Drinking on Endurance Performance: A Systematic Review with Meta-Analysis. Sports Medicine. 2019 Feb 1;49. [CrossRef]
- Lee SW, Baek SH, Ahn SY, Na KY, Chae DW, Chin HJ, et al. The effects of pre-existing hyponatremia and subsequent-developing acute kidney injury on in-hospital mortality: A retrospective cohort study. PLoS One. 2016;11(9):1–15.
- Arnaoutis G, Anastasiou CA, Suh H, Maraki M, Tsekouras Y, Dimitroulis E, et al. Exercise-associated hyponatremia during the olympus marathon ultra-endurance trail run. Nutrients. 2020 Apr 1;12(4). [CrossRef]
- Martínez-Navarro I, Chiva-Bartoll O, Hernando B, Collado E, Porcar V, Hernando C. Hydration status, executive function, and response to orthostatism after a 118-km mountain race: Are they interrelated? Vol. 32, Journal of Strength and Conditioning Research. 2018. 441–449 p.
- Lecina M, Castellar C, Pradas F, López-Laval I. 768-km Multi-Stage Ultra-Trail Case Study-Muscle Damage, Biochemical Alterations and Strength Loss on Lower Limbs. Int J Environ Res Public Health. 2022;19(2):1–13. [CrossRef]
- Pradas F, Falcón D, Peñarrubia-Lozano C, Toro-Román V, Carrasco L, Castellar C. Effects of ultratrail running on neuromuscular function, muscle damage and hydration status. Differences according to training level. Int J Environ Res Public Health. 2021 May 2;18(10). [CrossRef]
- Belli T, Macedo DV, De Araújo GG, Masselli dos Reis IG, Menezes Scariot PP, Lazarim FL, et al. Mountain ultramarathon induces early increases of muscle damage, inflammation, and risk for acute renal injury. Front Physiol. 2018 Oct 8;9(OCT). [CrossRef]
- Carmona G, Roca E, Guerrero M, Cusso R, Cadefau JA. Fibre-Type-Specific and Mitochondrial Biomarkers of Muscle Damage after Mountain Races Authors. 2018;1–10.
- Baird MF, Graham SM, Baker JS, Bickerstaff GF. Creatine-kinase- and exercise-related muscle damage implications for muscle performance and recovery. Vol. 2012, Journal of Nutrition and Metabolism. 2012. [CrossRef]
- Magrini D, Khodaee M, San-Millán I, Hew-Butler T, Provance AJ. Serum creatine kinase elevations in ultramarathon runners at high altitude. Physician and Sportsmedicine. 2017 Apr 3;45(2):129–33. [CrossRef]
- Rubio-Arias J, Andreu L, Martínez-Aranda LM, Martínez-Rodríguez A, Manonelles P, Ramos-Campo DJ. Effects of medium- and long-distance running on cardiac damage markers in amateur runners: a systematic review, meta-analysis, and metaregression. J Sport Health Sci. 2021;10(2):192–200. [CrossRef]
- Rubio-Arias J, Ávila-Gandía V, López-Román FJ, Soto-Méndez F, Alcaraz PE, Ramos-Campo DJ. Muscle damage and inflammation biomarkers after two ultra-endurance mountain races of different distances: 54 km vs 111 km. Physiol Behav. 2019 Jun 1;205:51–7. [CrossRef]
- Shin KA, Park KD, Ahn J, Park Y, Kim YJ. Comparison of Changes in Biochemical Markers for Skeletal Muscles, Hepatic Metabolism, and Renal Function after Three Types of Long-distance Running. Medicine (United States). 2016 May 1;95(20). [CrossRef]
- Cabral BMI, Edding SN, Portocarrero JP, Lerma E V. Rhabdomyolysis. Disease-a-Month. 2020 Aug 1;66(8):101015.
- Hody S, Rogister B, Leprince P, Wang F, Croisier JL. Muscle fatigue experienced during maximal eccentric exercise is predictive of the plasma creatine kinase (CK) response. Scand J Med Sci Sports. 2013;23(4):501–7. [CrossRef]
- Royer N, Nosaka K, Doguet V, Jubeau M. Neuromuscular responses to isometric, concentric and eccentric contractions of the knee extensors at the same torque-time integral. Eur J Appl Physiol. 2022 Jan 1;122(1):127–39. [CrossRef]
- Chlíbková D, Nikolaidis PT, Rosemann T, Knechtle B, Bednář J. Maintained hydration status after a 24-h winter mountain running race under extremely cold conditions. Front Physiol. 2019;10(JAN):1–10. [CrossRef]
Figure 3.
Serum sodium at baseline and after stages 1, 3, 5, 7 and 9. Hyponatremia threshold settled at <135 mmol·L-1. [Na+]: serum sodium; *p<0.05.
Figure 3.
Serum sodium at baseline and after stages 1, 3, 5, 7 and 9. Hyponatremia threshold settled at <135 mmol·L-1. [Na+]: serum sodium; *p<0.05.
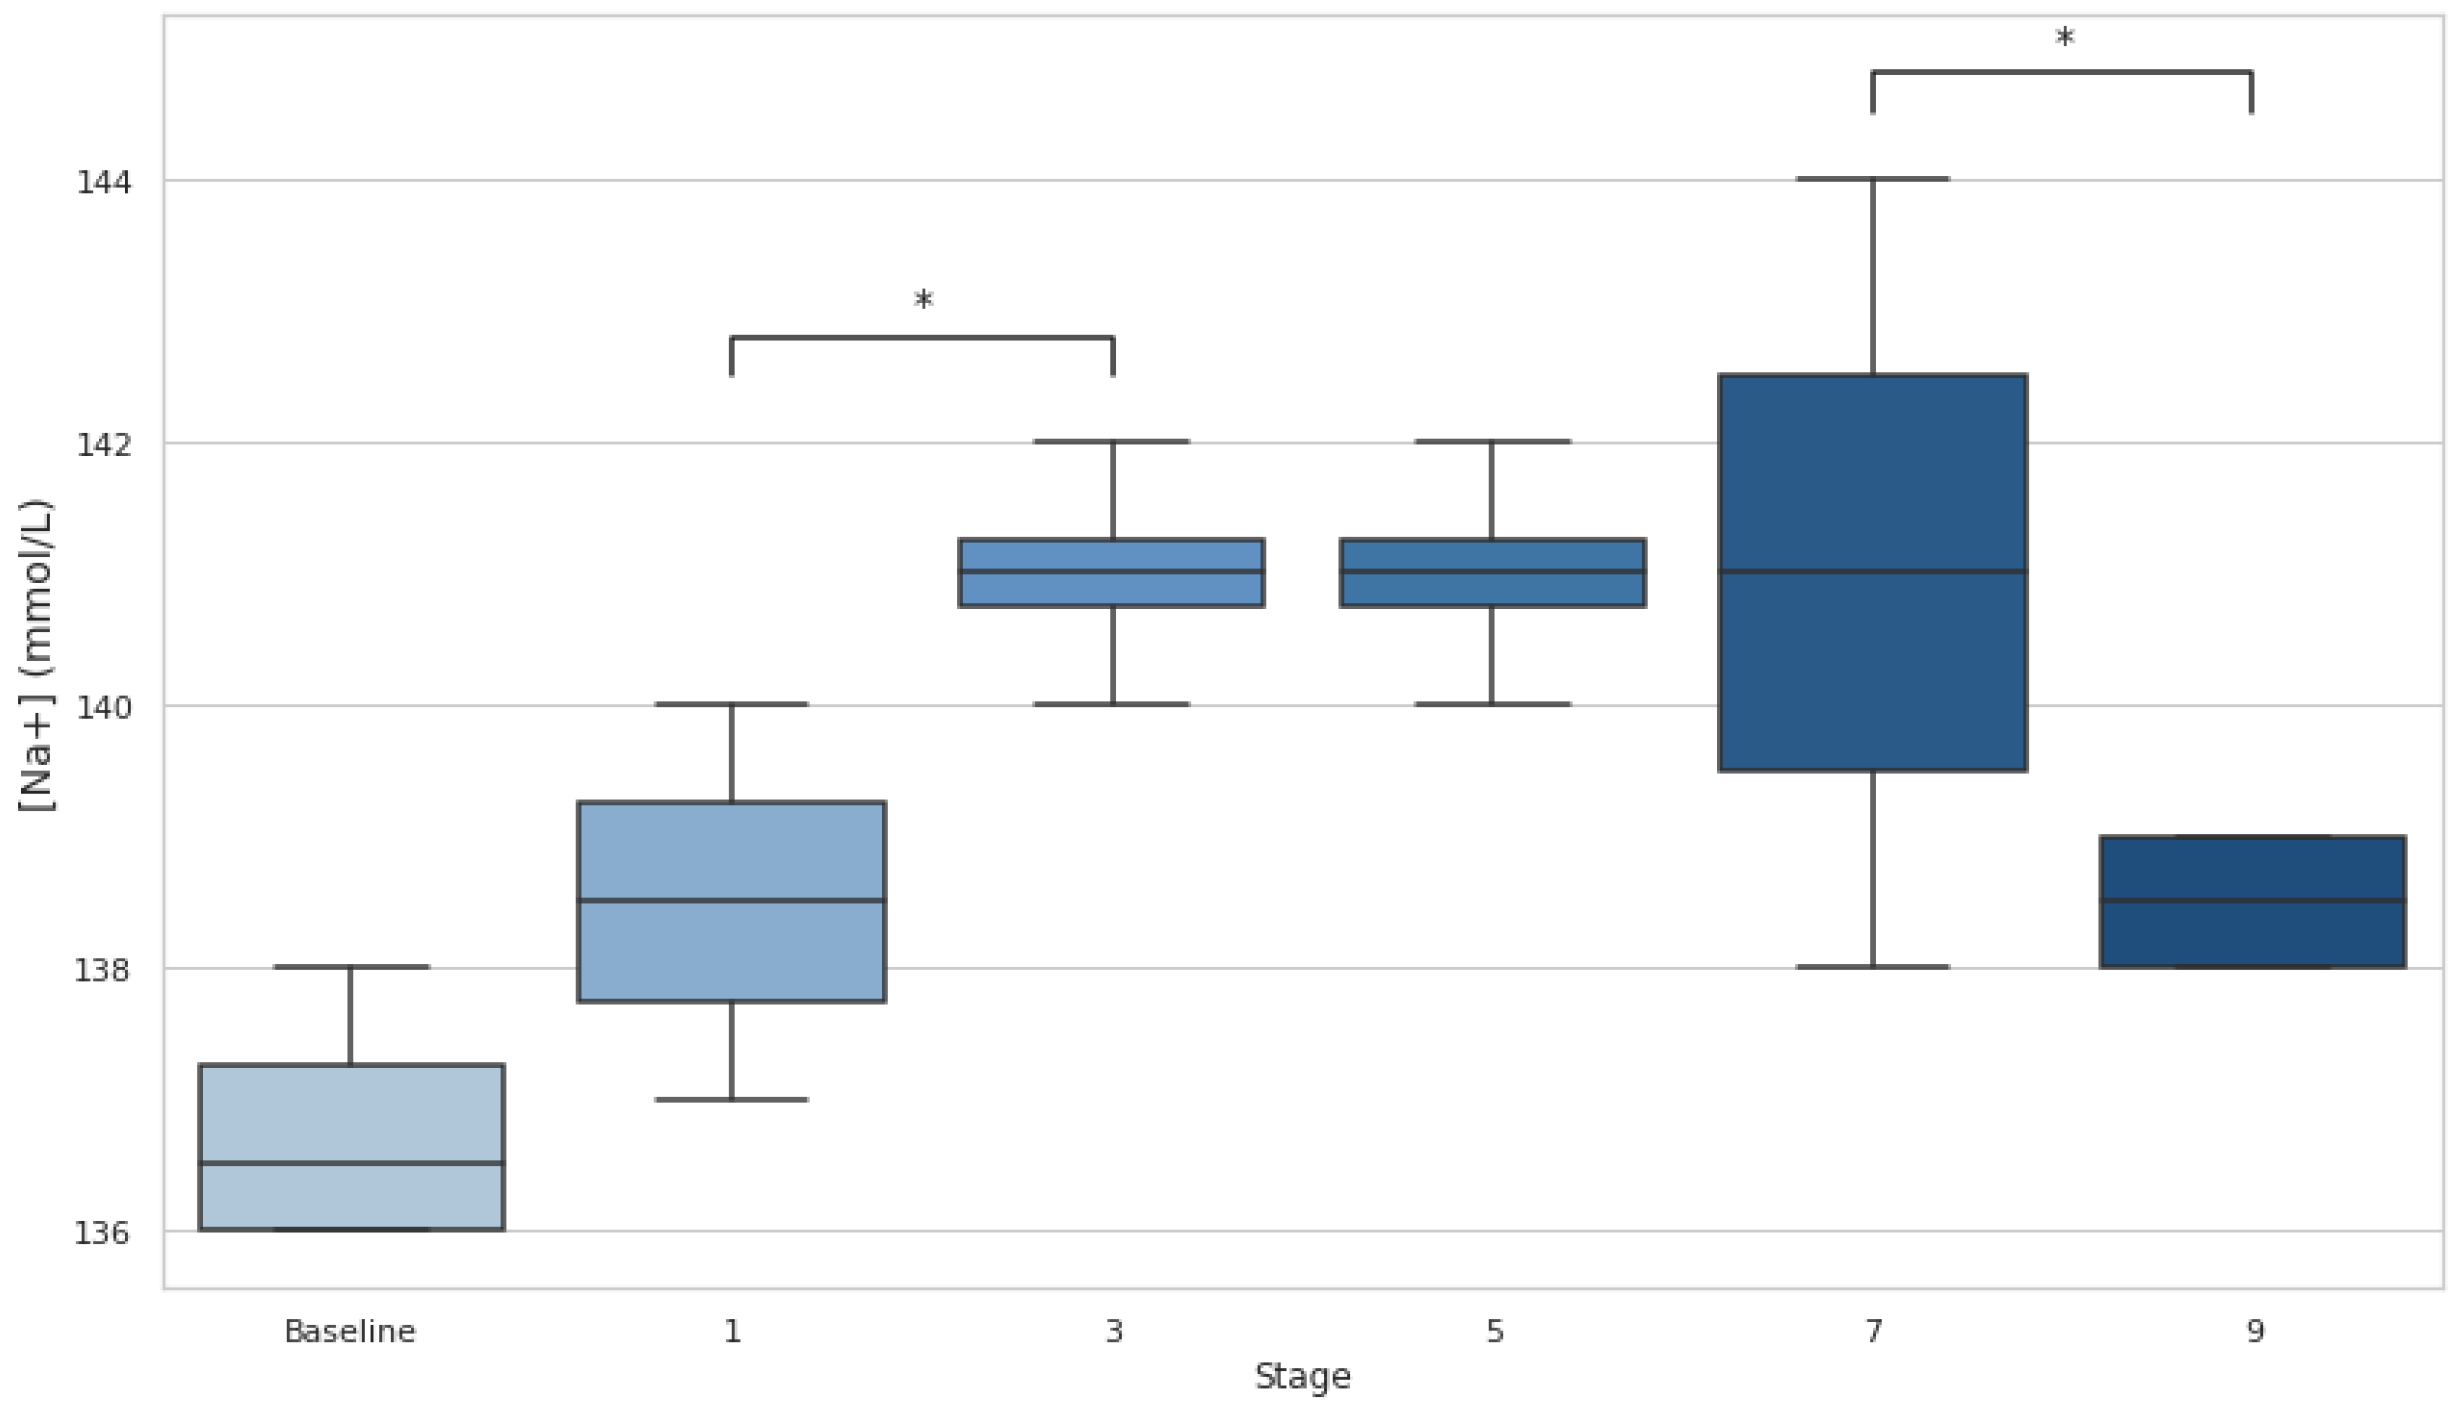
Figure 4.
Serum creatine kinase within stages compared to baseline. CK: creatine kinase; Post-48h: 48h post-race; *p<0.05.
Figure 4.
Serum creatine kinase within stages compared to baseline. CK: creatine kinase; Post-48h: 48h post-race; *p<0.05.
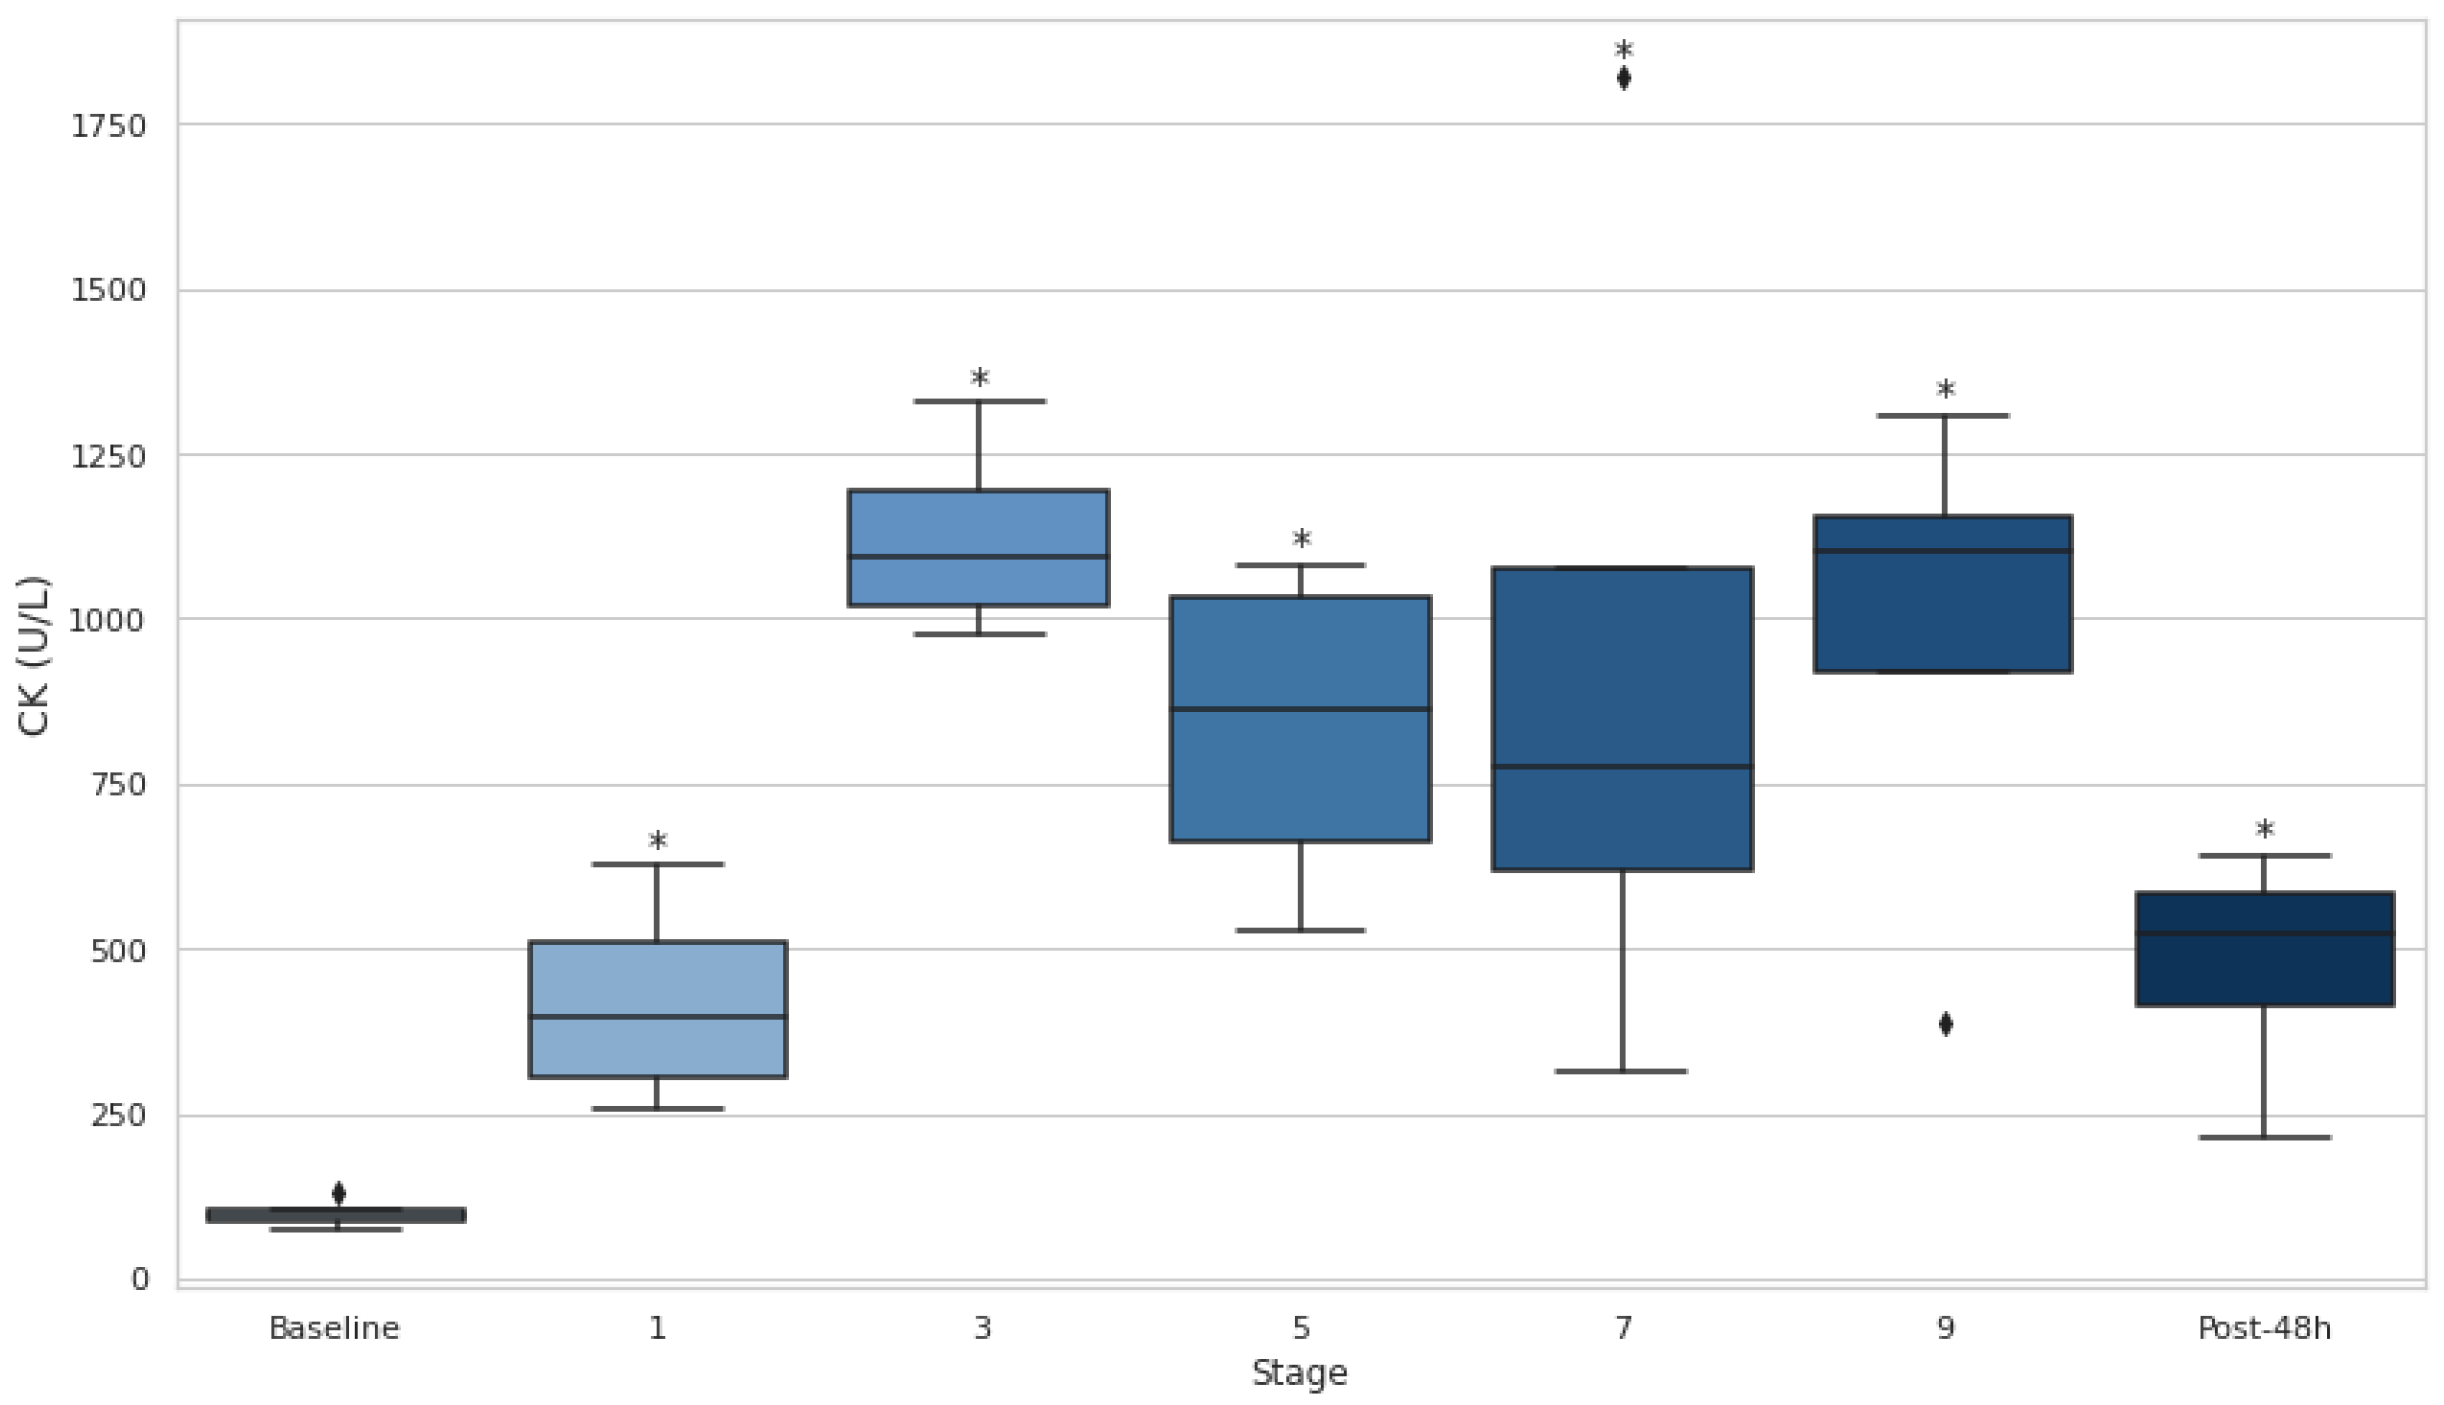
Figure 5.
Serum lactate dehydrogenase within stages compared to baseline. LDH: lactate dehydrogenase; Post-48h: 48h post-race; *p<0.05.
Figure 5.
Serum lactate dehydrogenase within stages compared to baseline. LDH: lactate dehydrogenase; Post-48h: 48h post-race; *p<0.05.
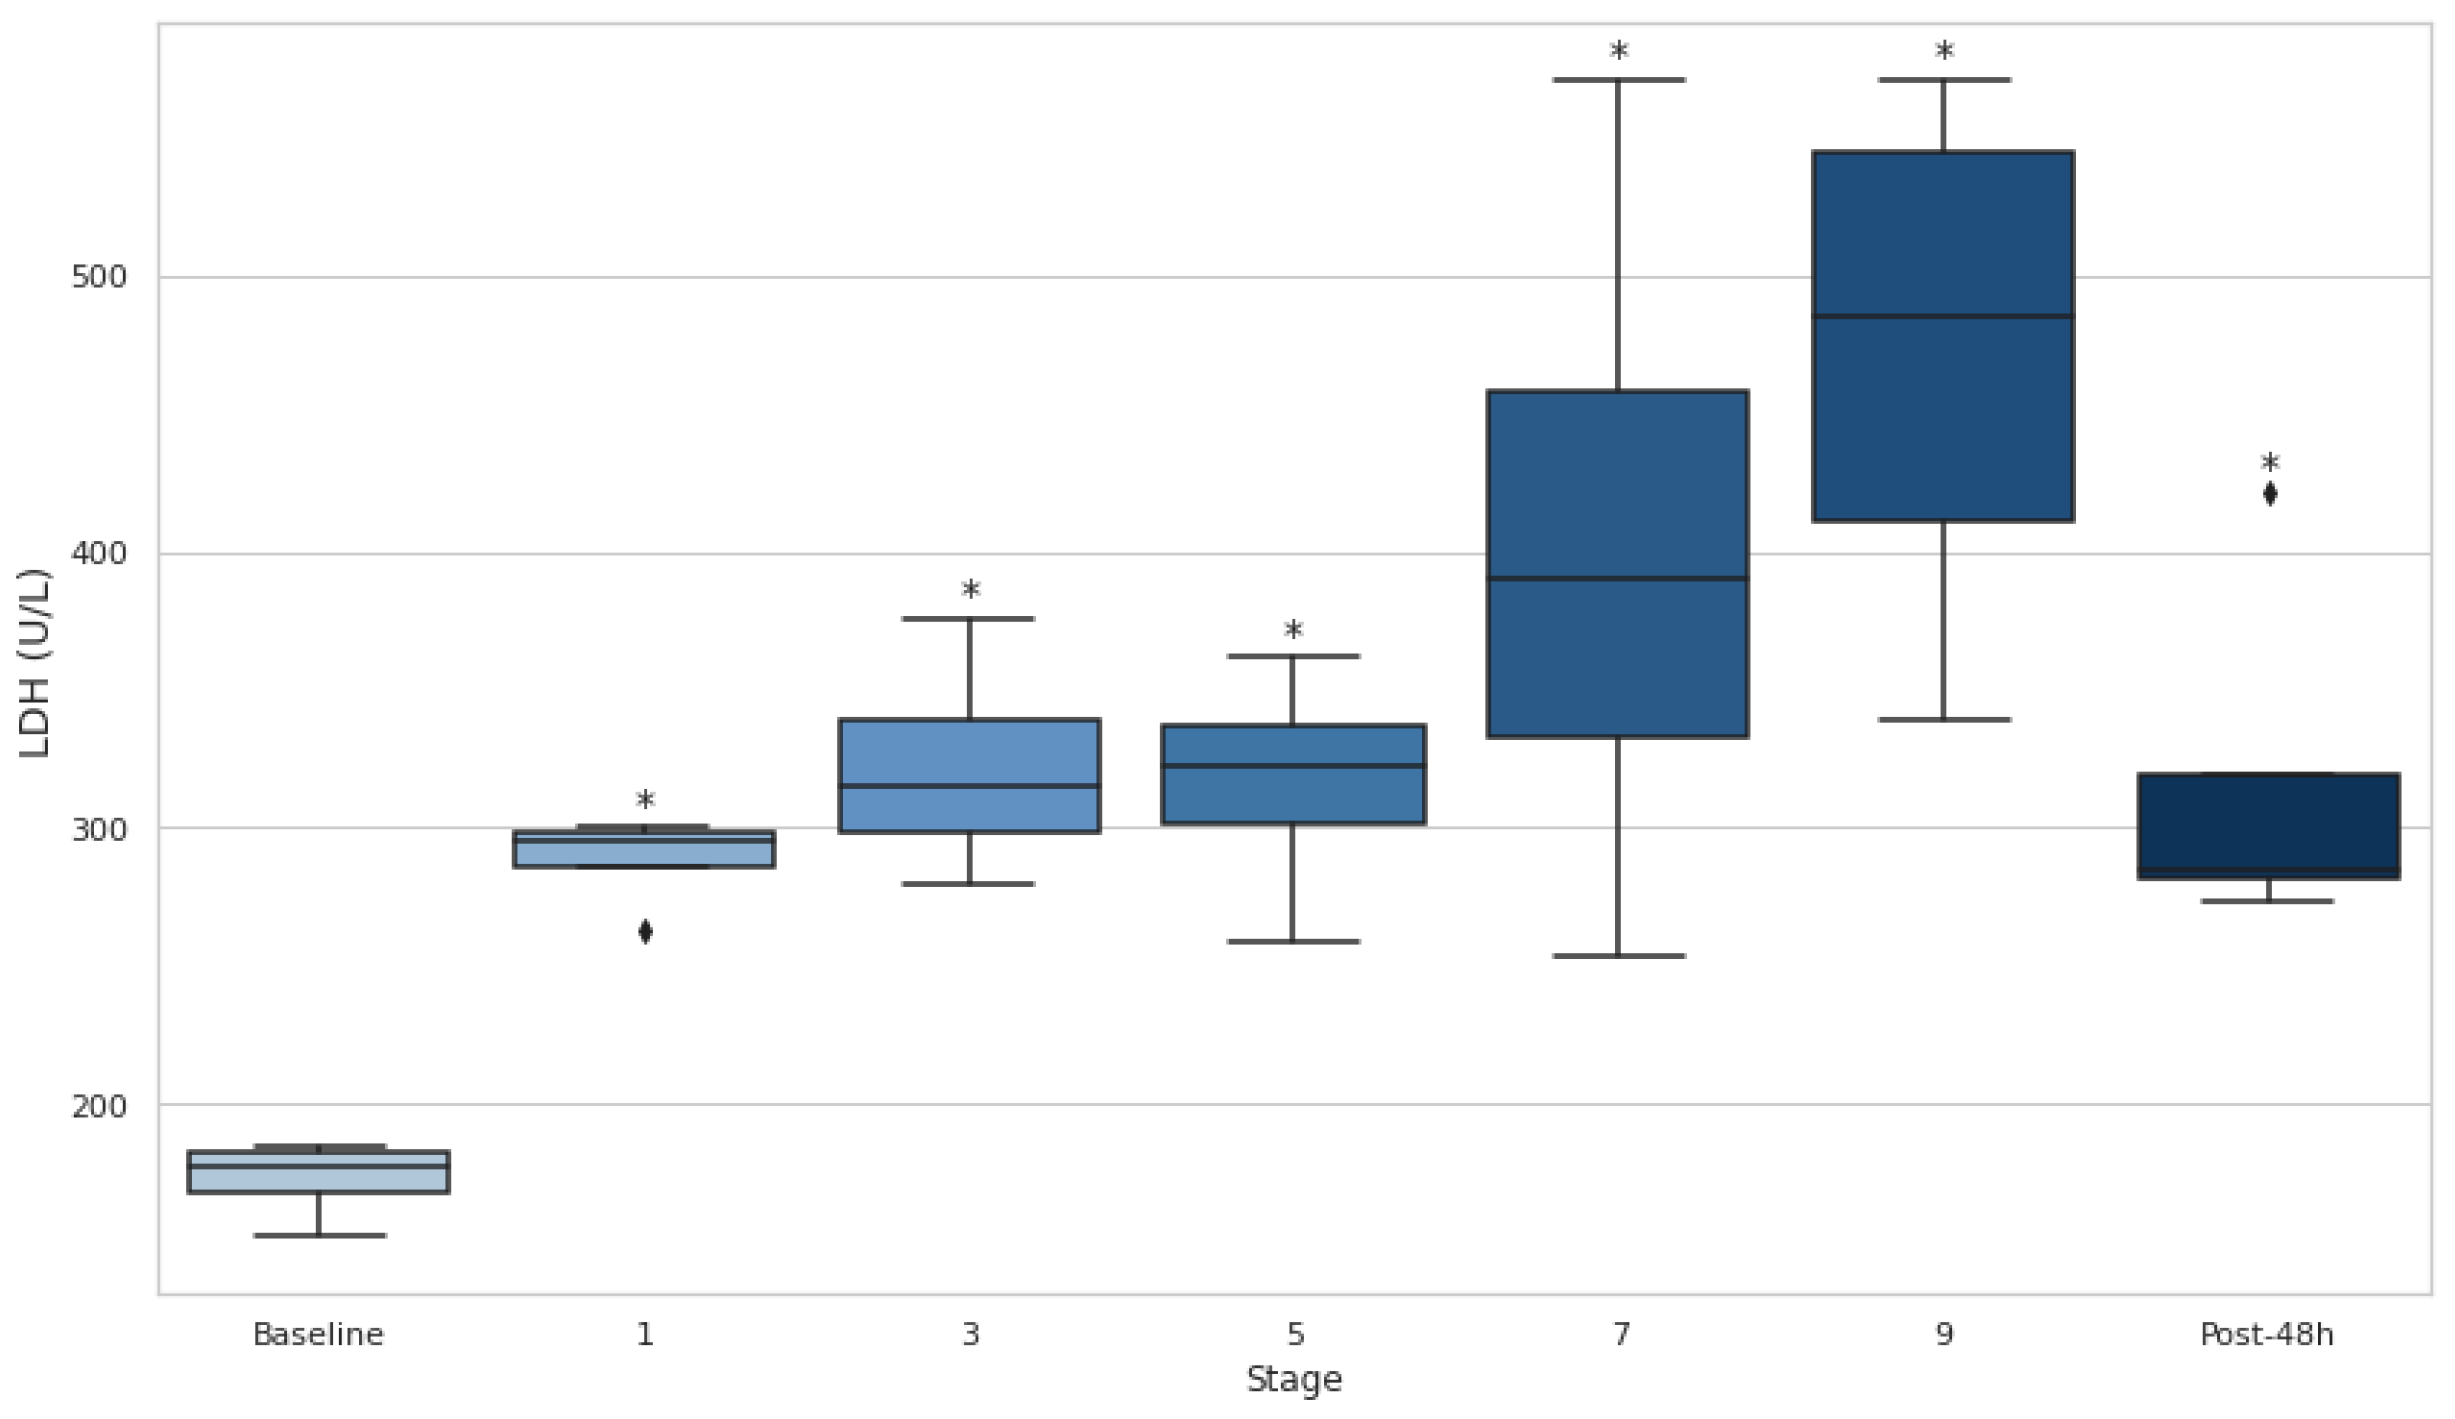
Figure 6.
Serum calcium within stages compared to baseline. Ca: calcium; Post-48h: 48h post-race; *p<0.05.
Figure 6.
Serum calcium within stages compared to baseline. Ca: calcium; Post-48h: 48h post-race; *p<0.05.
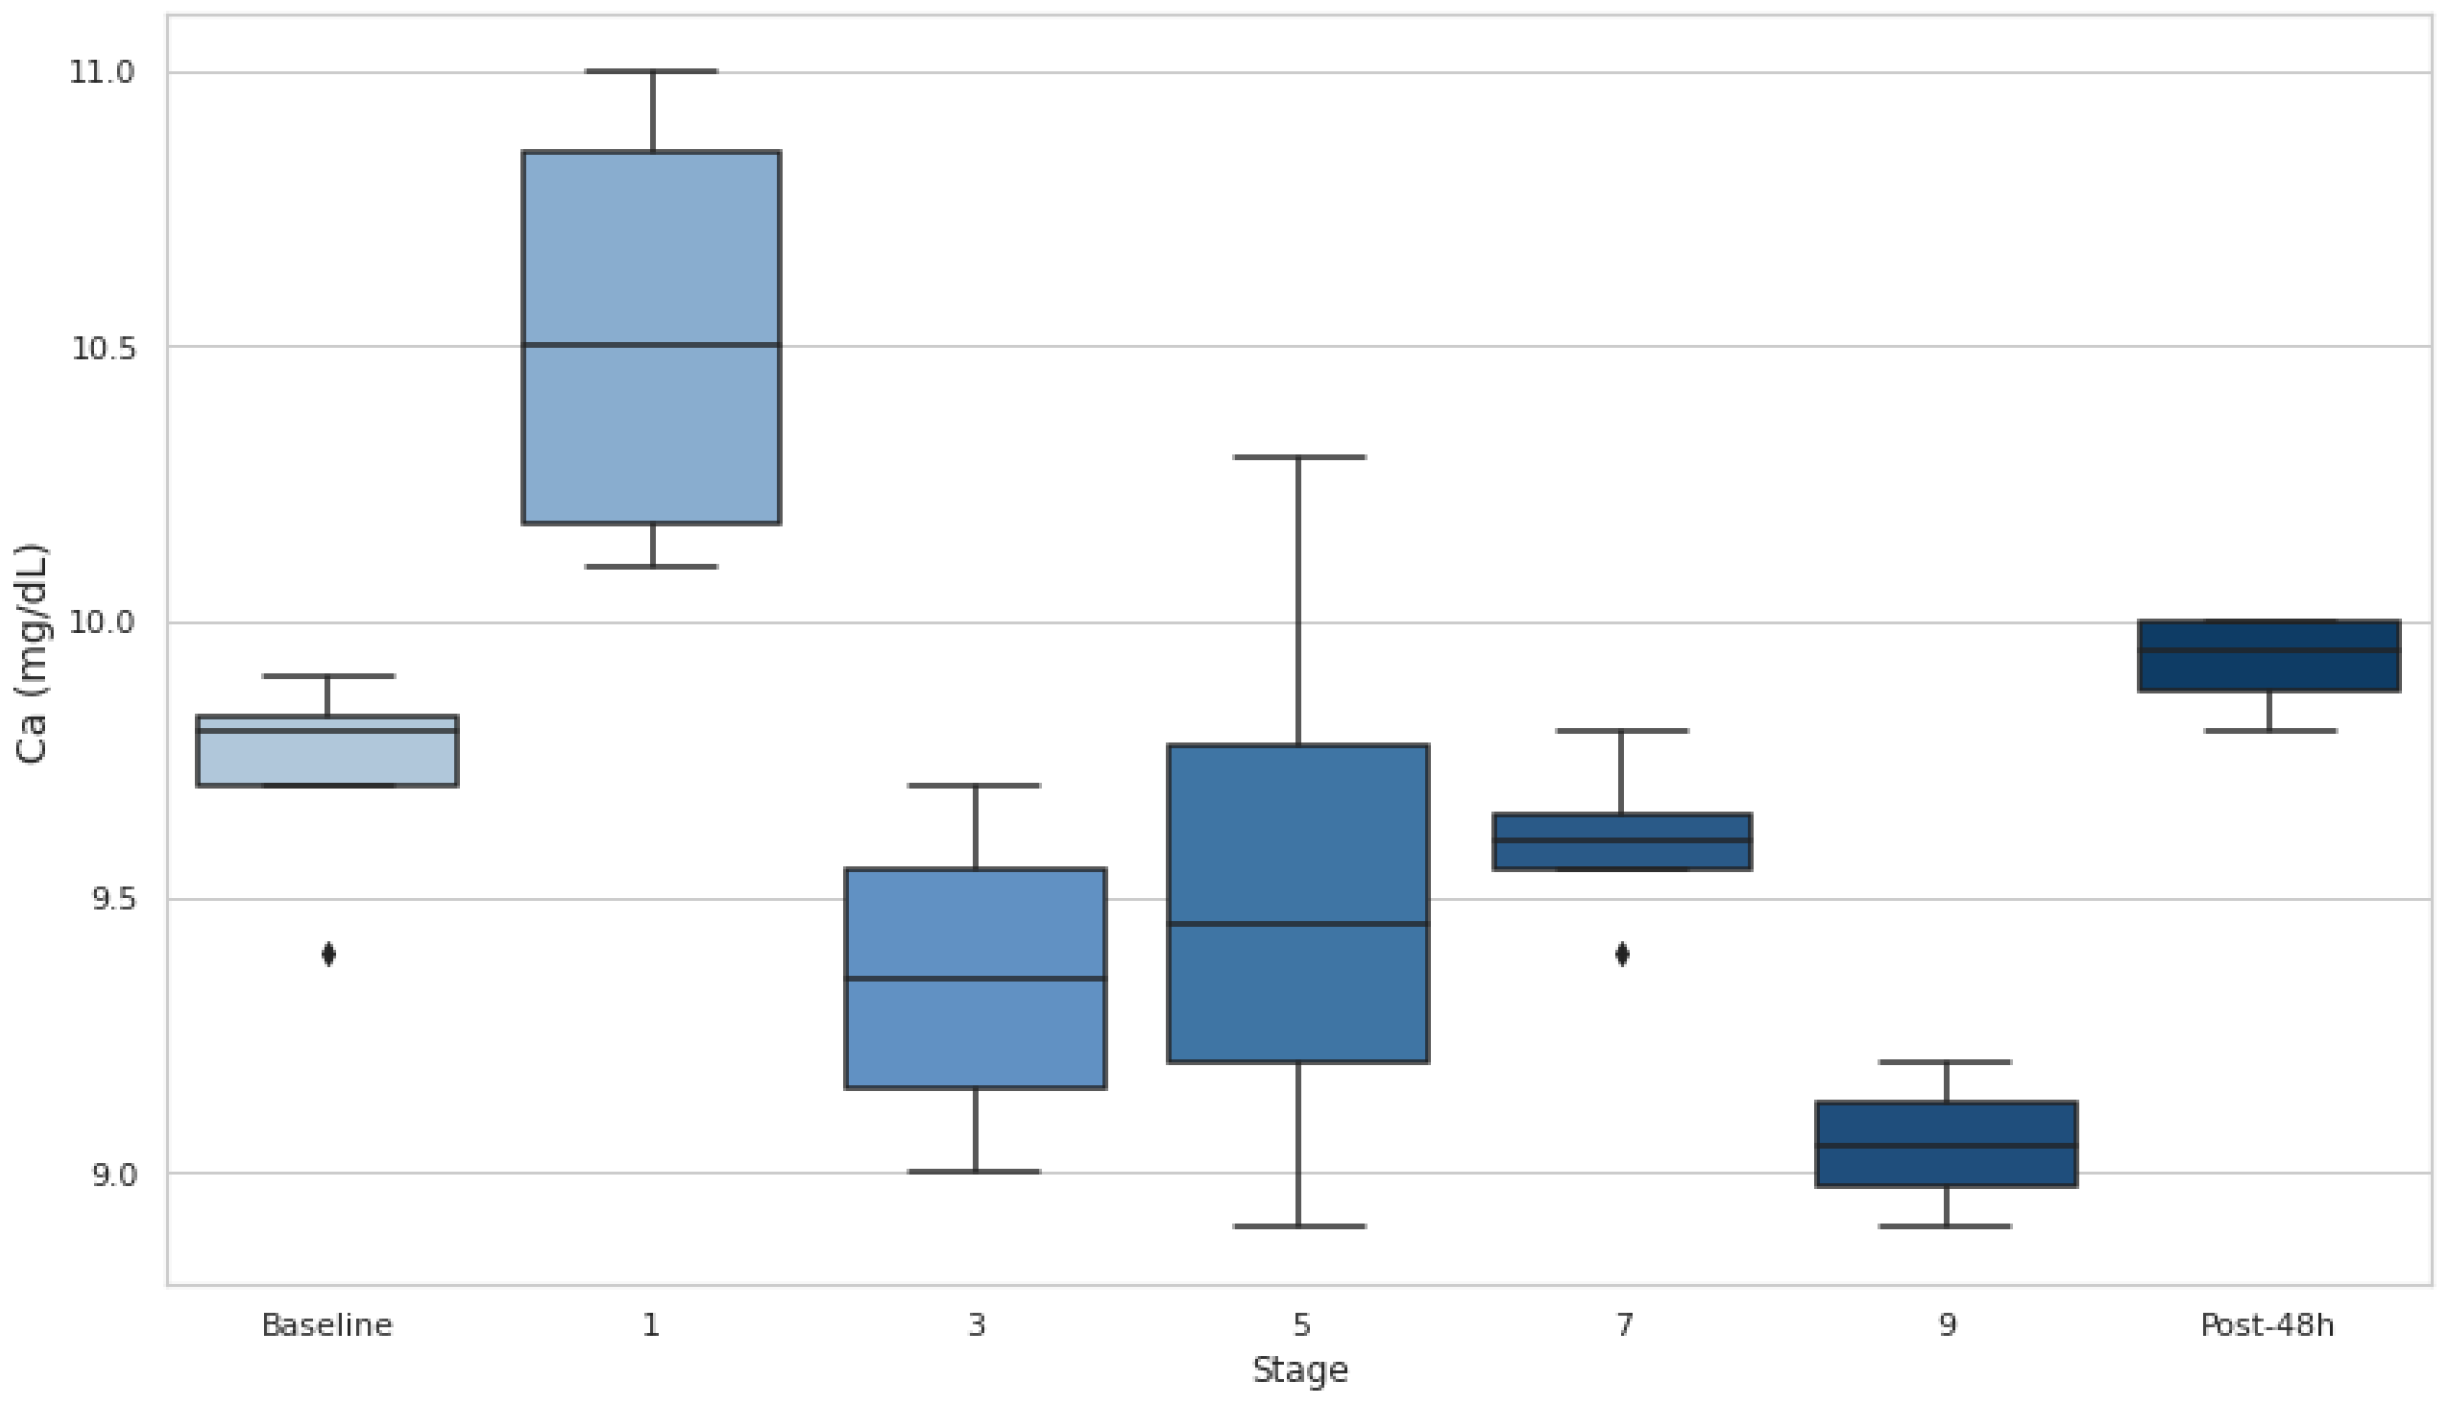
Figure 7.
Heatmap of correlations between biomarkers and extrinsic race characteristics. BWL: body weight loss; Na: sodium; Usg: urine specific gravity; Ca: calcium; CK: creatine kinase; LDH: lactate dehydrogenase.
Figure 7.
Heatmap of correlations between biomarkers and extrinsic race characteristics. BWL: body weight loss; Na: sodium; Usg: urine specific gravity; Ca: calcium; CK: creatine kinase; LDH: lactate dehydrogenase.
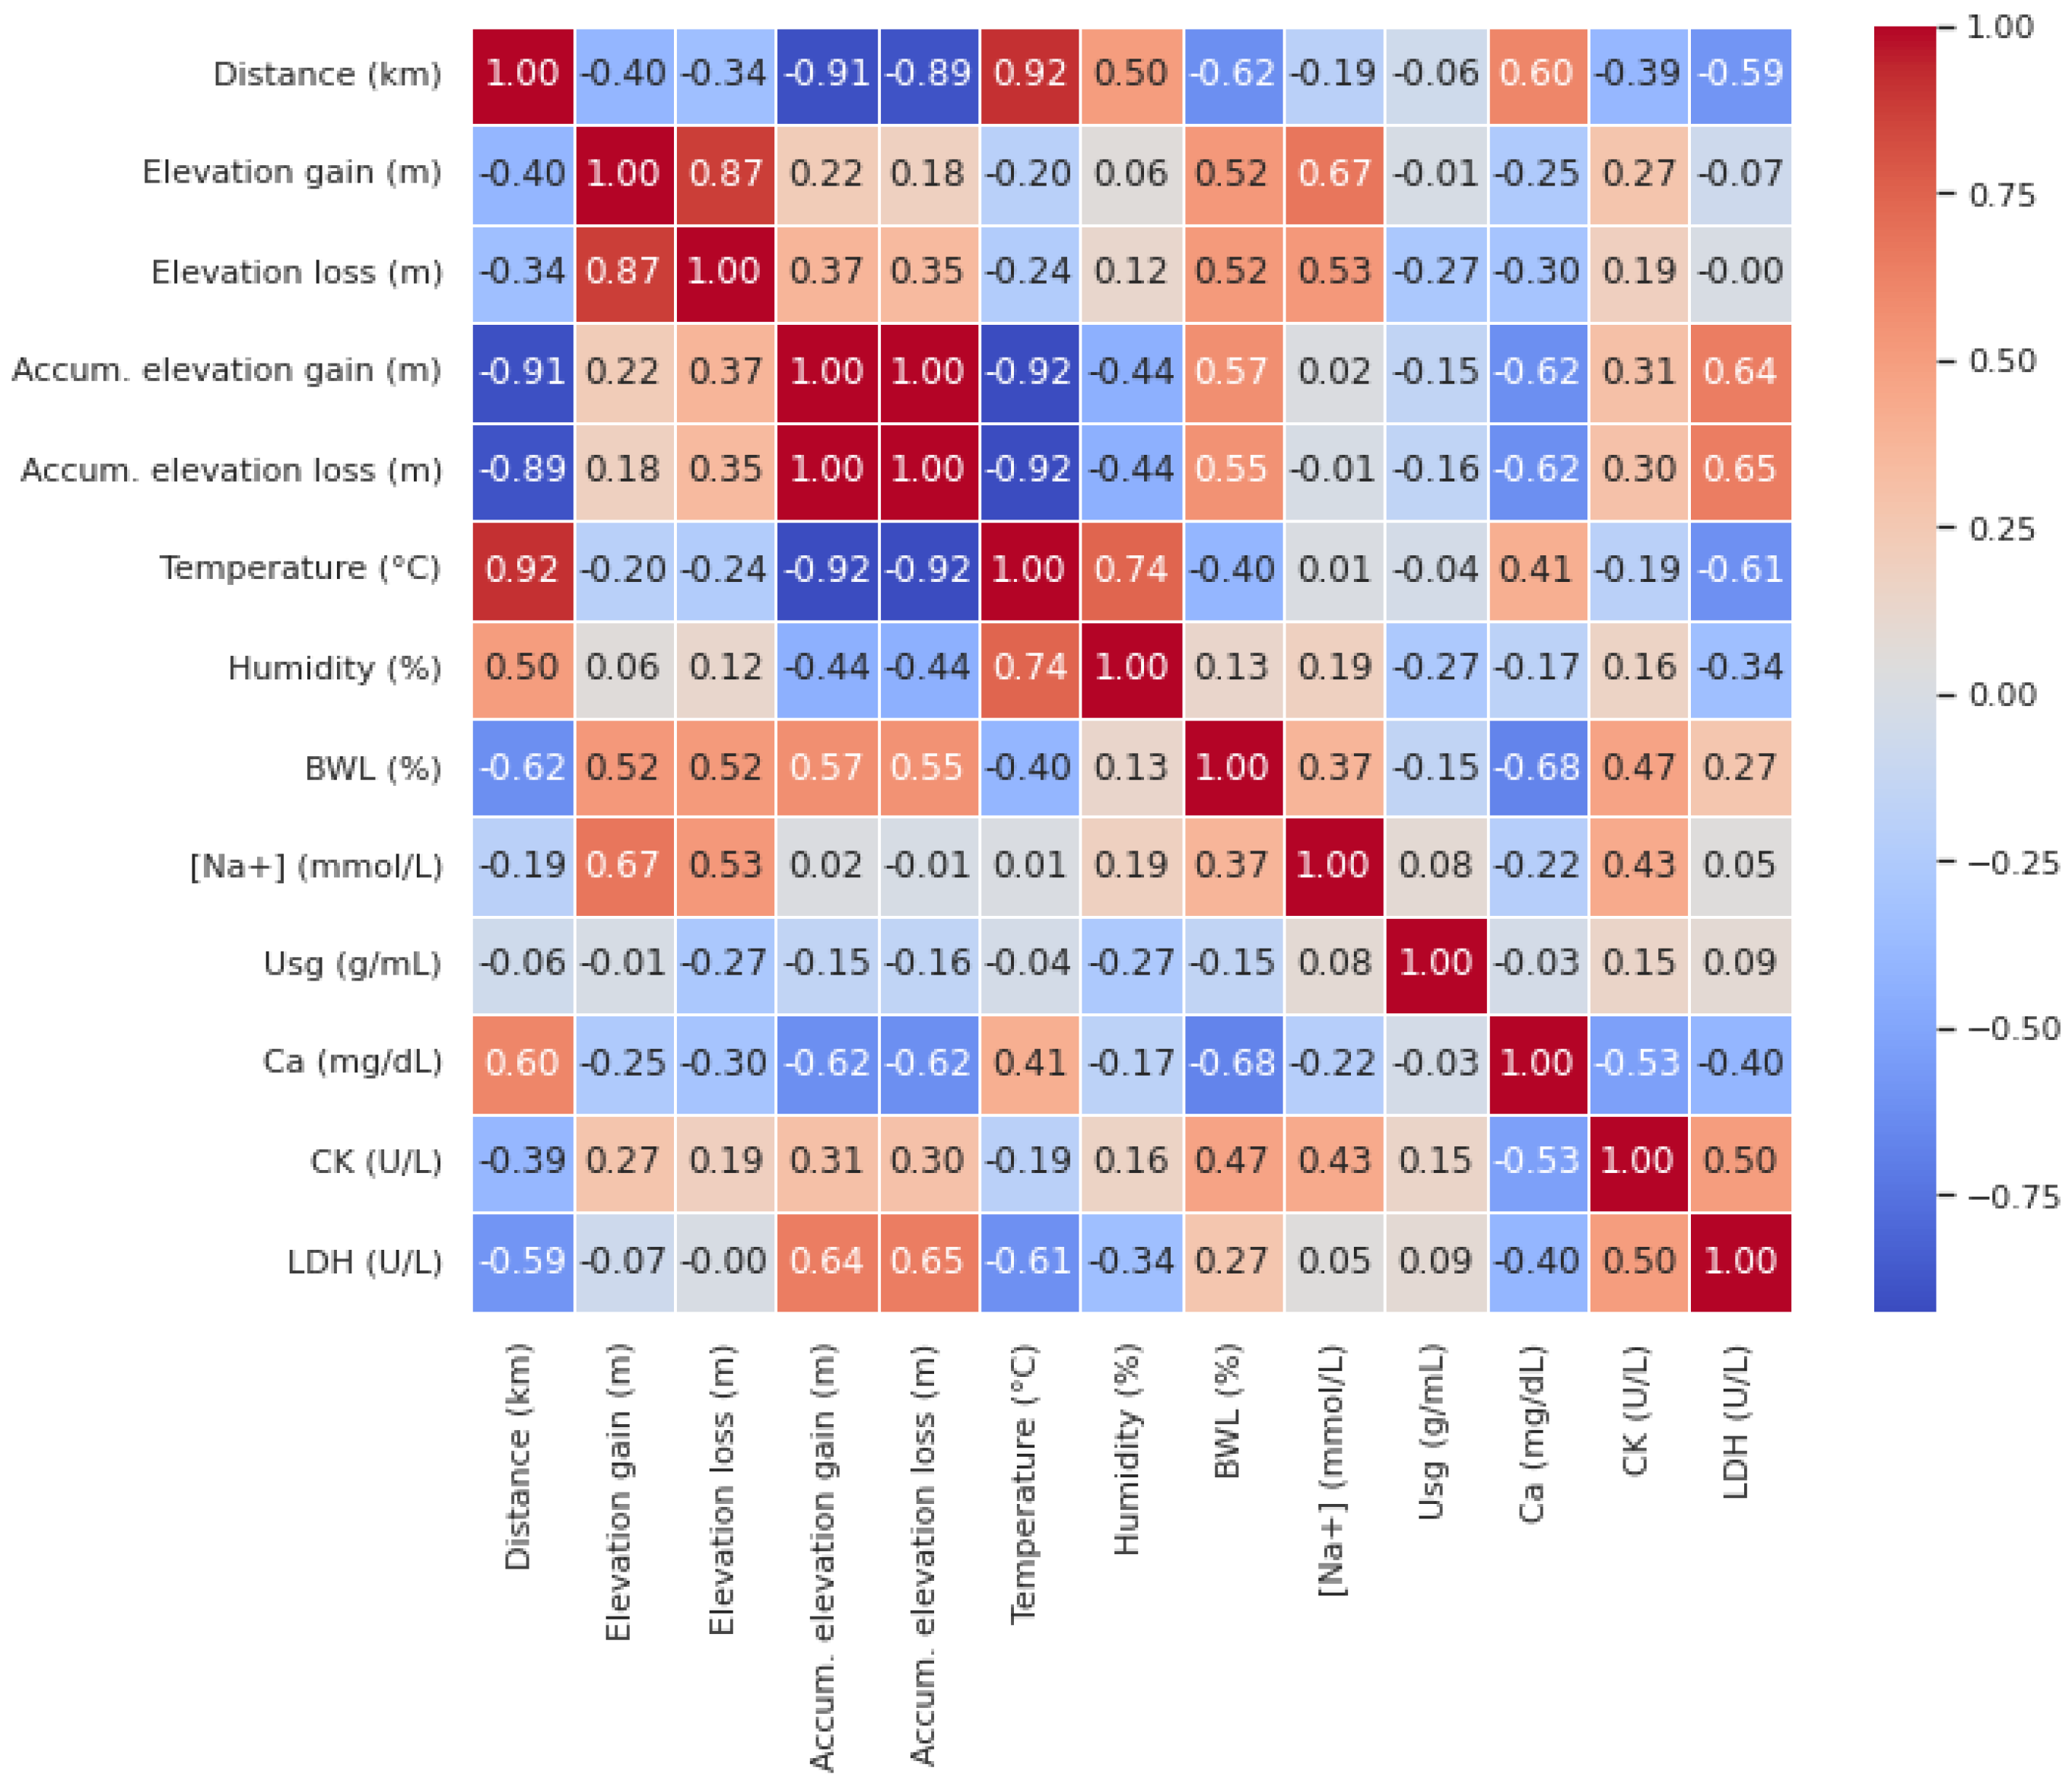

Table 1.
Participants’ demographic, anthropometric and training characteristics.
| Parameters | Mean ± SD |
|---|---|
| Age (years) | 38 ± 4.11 |
| Height (cm) | 175.72 ± 3.65 |
| Weight (kg) | 70.09 ± 9.05 |
| BMI | 22.70 ± 2.05 |
| Fat mass (%) | 8.13 ± 0.68 |
| Muscle mass (%) | 46.75 ± 6.27 |
| VO2max (mL·kg-1·min-1) | 61.17 ± 8.96 |
| MAS (km·h−1) | 16.91 ± 0.83 |
| HRmax (beats·min-1) | 187 ± 8.54 |
| UT experience (years) | 5 ± 1.26 |
| Weekly volume (hours) | 11.61 ± 2.22 |
| Annual accumulated elevation gain (m) | 116,615 ± 37,462 |
BMI: body mass index; VO2max: maximum oxygen consumption; MAS: maximal aerobic speed; HRmax: maximum heart rate; UT: ultra-trail.
Disclaimer/Publisher’s Note: The statements, opinions and data contained in all publications are solely those of the individual author(s) and contributor(s) and not of MDPI and/or the editor(s). MDPI and/or the editor(s) disclaim responsibility for any injury to people or property resulting from any ideas, methods, instructions or products referred to in the content. |
© 2024 by the authors. Licensee MDPI, Basel, Switzerland. This article is an open access article distributed under the terms and conditions of the Creative Commons Attribution (CC BY) license (http://creativecommons.org/licenses/by/4.0/).
Copyright: This open access article is published under a Creative Commons CC BY 4.0 license, which permit the free download, distribution, and reuse, provided that the author and preprint are cited in any reuse.


