
Submitted:
13 December 2024
Posted:
13 December 2024
You are already at the latest version
Abstract
This study aimed to explore factors that influence food hygiene behaviours among child caregivers in Chikwawa district, Malawi. It was done so by exploring factors relating to three hygiene behaviours among child caregivers: keeping utensils on an elevated surface, using soap to clean kitchen utensils, and washing hands with soap at critical times. Research has shown that these behaviours contribute to the reduction of diarrheal disease. Through this research, it was as well aimed to explore variations at household and village levels by the use of multilevel binary logic models. The results have revealed that education background, age group, occupation, self-confidence, intervention, self-will, and perception were the most significant behavioural factors relating to food hygiene behaviours. There were variations at village level (p0.1). It has also revealed that Caregivers from the area of intervention had a positive response to the interventions.
Keywords:
hild caregivers
; multilevel binary logistic models
; hygiene behaviours
1. Introduction
As a way of reducing diarrhoea cases among children, the World Health Organisation (WHO) has recommended important parameters that need to be followed at household level (WHO, 2017). The parameters include; access to safe water, improved sanitation facilities, exclusive breast feeding, vaccination, access to Vitamin A, hygienic weaning practices, and improved personal and household hygiene. There are high chances that when food is prepared under unhygienic conditions it can become microbiologically contaminated (Motarjemi et al., 2012). Studies have shown that utensils, such as spoons, cups, pots, baby bottles, plates etc., are a potential vector of pathogens such as Escherichia coli, Salmonella, and Vibrio cholerae (Gil et al., 2013) (Chidziwisano et al., 2020). The contamination of utensils is usually associated with the method of cleaning, resulting from repeated use of water and dirty clothes that are used after washing (Ehiri et al., 2001)’. To avoid contamination, utensils have to be properly cleaned and stored (Chidziwisano et al., 2019). Other studies conducted by various researchers have showed that handwashing with soap alone can reduce diarrhoea incidence by 30–47% (Ejemot-Nwadiaro et al., 2015)(Curtis & Cairncross, 2003). Since the use of soap in washing hands and kitchen utensils, have proven to effectively contribute to enteric pathogen reduction, it is important to understand the characteristics that affects an individual psychological and social factors that drive handwashing practices and the context in which they occur. Changing an individual’s behaviour is a process that requires change in contextual and psychosocial factors that predict human behaviour in a given setting, such as attitudes, norms, and self-regulation attributes (Huber & Mosler, 2013). The said contextual factors, refer to be the environment in which the behaviour occurs, and they include the personal (e.g., age and literacy), social (e.g., economic conditions), and physical parameters (e.g., presence of sanitation facilities such as handwashing facility), whereas psychosocial factors have been defined as the influence of social factors on an individual’s mind or behaviour, as well as the interrelation of behavioural and social factors (Slekiene & Mosler, 2018).
Multilevel logistic models are regression models that allow the analysis to take into account the hierarchical nature of the data, to investigate sources of variations within and between hierarchies, in a way to investigate which parameters predict variations and to describe which parameters predict hierarchical differences. This implies that by using a single level ordinary regression for such hierarchical data it may result in biased standard errors for the parameter estimates which might result in incorrect inference (Tutz, 2021).There have been studies in Malawi which have shown that both individual and community-level characteristics are important considerations for policy makers in designing interventions (Afolabi & Palamuleni, 2021) (Masangwi et al., 2010).
This study uses mid-term evaluation data for Sanitation and Hygiene Applied Research for Equity (SHARE) project which was implemented by Centre for Water, Sanitation, Hygiene and Appropriate Technology Development (WASHTED) of the Malawi University of Business and Applied Sciences, to explore household and village effects using multilevel binary logistic models. The study mainly focused on variations between area of intervention as a treatment and area where intervention was not carried out as a control. The project delivered various interventions which were in categories of treatments in respective villages. However, this study focussed on the overall impact of all the interventions as they were all delivered for the same purpose of trying to change caregivers’ hygiene behaviours. The distinction was done by forming a binary variable which scores 1 for treatment and a 0 for the control. And by looking at that variable in the regression model, it was able to tell whether there were differences between the control and the treatment. It was done so by assessing variation amongst child caregivers in relation to three hygiene behaviours; washing hands with soap at critical times, storing kitchen utensils on a raised surface and using soap to clean kitchen utensils. If not handled properly, these behaviours are said to be highly associated with the spread of diarrhoea, especially in developing countries (WHO, 2017).
The assumption of this study was that behaviors within villages and households are related, and that there is no relationship on what happens between villages and households even in cases where they are adjacent to each other. So, by using a single level ordinary regression for such hierarchical data, it may result in biased standard errors for the parameter estimates (Tutz, 2021).
The objectives of this study were, therefore, to use multilevel binary logic regression models to explore if:
- there are variations of hygiene behaviours among child caregivers between households in relation to area of intervention and non-intervention area; and
- there are variations of hygiene behaviours among child caregivers between villages in relation to area of intervention and non-intervention area.
2. Methods
2.1. Study Population and Setting: Sampling and Data Collection Methods
A survey was conducted in Chikwawa district in Malawi, Southern Africa and comprised of a sample of households within villages from Traditional Authorities (TAs). According to the data collected in the 2018 population census, the number of people living in the district was estimated at around 564,684 (Government of Malawi, 2018). The survey was conducted in four rural administrative TAs: Masache, Ngowe, Ngabu as area of intervention and Maseya as a control. 850 households nested within 46 randomly sampled villages were selected. Each village had at least 20 respondents. Detailed sampling process, data collection methods and the selection criteria of the TAs is detailed in previous publications (Chidziwisano et al., 2019, 2020).
2.2. Variables
2.2.1. Outcome variables
The outcome variables in this study were the following;
- keeping utensils on an elevated surface
- using soap to clean kitchen utensils
- washing of hands with soap at critical times
Responses to the questions were recorded on a 5-point Likert scale (ranging from “not at all” to “very much” scale). The household survey questionnaire was mainly composed of closed questions that captured information about demographics, awareness, and contextual factors related to outcome variables. The variable “washing hands with soap at critical times” was a product a transformation of the variables on washing hands with soap before and after eating, washing of hands with soap after vising the toilet, washing of hands with soap before food preparation and washing hands with soap after removing baby nappy.
Behavioural outcome was modelled to allow examination of independent variables as determinants for doers and non-doers. Since frequencies were measured on a 5- point scale, all factors falling at or below the mid 3-point value on a scale of 1–5 were considered non-doers of the targeted behaviours, whereas those factors at or above 4 were doers of the behaviour. The variable derived for outcome was reported a doer or a non-doer in the last two weeks (1 reported doer, 0 for non-doer). Only those indicator variables which were statistically significant at p 0:05 were included in the model.
2.2.2. Explanatory Variables
Descriptions of explanatory variables included in the model are shown in the Error! Reference source not found..The variables were obtained by first checking the simple relation between each variable factor and the outcome variable of interest while ignoring all other variables. In this regard, only variables that were significant at p ≤ 0.05 with a Deviance Information Criterion (DIC) reduction of at least 5 were selected for the final model. Fifteen variables satisfied this requirement, and these are: education background, gender, the presence of faeces outside the house, age group, marital status, occupation, intervention, relative wealth, health knowledge, risk, effort, norm, confidence, willingness, and perception on price.
Wealth index was derived using the method of ‘variations’ that assigns weights to indicator variables and uses the inverse of the proportion of number of households with an asset or service as the weight for the indicator (Chakraborty et al., 2016). A categorical variable was then derived by cutting the wealth index distribution into three distinct segments to give: low, middle, and high wealth categories.
Health knowledge, risk, effort, norm, confidence, willingness, perception on price were derived by computing the weighted average of all relevant variables. For example, health knowledge variable, which had two responses (Yes=1, and No=0) was derived by adding all responses for variables relating to health knowledge on the spread of diarrheal disease. The sum was then divided by the total number of related variables (4). If the result was less than or equal to two, score of 0 was assigned, and score of 1 was assigned if the result was greater than two.
2.2.3. Analysis and Estimation
The binary regression model (Souza et al., 2004), was used to explain the probability of the outcome as a function of independent variables. If the respondent representing household i reported to be a non-doer in her household on the day of the survey, then
Such that
2.3.4. Ethical Consideration
The University of Malawi’s College of Medicine Research Ethics Committee (P.04/16/1935) approved the study protocol. Permission was obtained from Chikwawa district council, Chikwawa district health office, and the traditional chiefs. The study was registered with the Pan African Clinical Trials Registry (sPACTR201703002084166)
Where is the probability that the ith household has reported as a non-doer. β is a K vector of fixed regression coefficients corresponding to a set of household level covariates in vector . A logistic link function was used, and model estimation was achieved using a Bayesian approach and MLwiN 3.05 was used for analysis. This model is able to detect if there are significant differences between non-doers and doers with their corresponding determining factors.
3. Results
3.1. Demographic Characteristics of the Study Participants
In terms of education, 21% of the participants never attended school, whereas 70% went to school to primary level and 10% reached secondary level and above. On the presence of faeces, it was found that 97% of respondent’s house surroundings had no faeces observed and 4% had faeces. Most of the respondents were in the age category of 18-28 years (59.4%), whereas 29% were in 29-38 years’ category, 10% were in 39-48 years’ category, 1% were in 49-58 years’ category and 1% of participants were over 58 years. In terms of occupation, 72.9% of the study population were farmers whereas 14.9% were business women and 12.1% were employed. On marital status, 9% were single and 91% were married. In terms of occupation, 72% of the participants were farmers, whereas 15% were in business and 2% were employed. The study included approximately 22% of the participants as a control group and 78% were from intervention areas. On social-economic status, 87% of participants were from low wealth category, 11% from middle wealth category and 2.7% of participants were from high wealth category (Chakraborty et al., 2016).
3.2. Descriptive Estimates of Non-Doers of Washing Hands with Soap at Critical Times, Using Soap to Clean Kitchen Utensils and Keeping Utensils on a Raised Surface in the Area of Intervention and Non-Intervention Area at Household Level
Error! Reference source not found. presents descriptive estimates of non-doers for washing hands with soap at critical times, using soap to clean kitchen utensils and keeping utensils on raised surface between area of intervention and non-intervention area at household level. Results show that there was higher percentage of caregivers who were not washing hands with soap at critical times, were not using soap to clean kitchen utensils and were not keeping utensils on a raised surface as compared to the percentage of caregivers in the intervention area who were not doing the three behaviours. For instance, 68% of caregivers in non-intervention area were not keeping utensils on a raised surface whilst 4% of caregivers in intervention area were not keeping utensils on a raised surface. There were 30% of caregivers who were not washing hands with soap at critical times from intervention area while in non-intervention area, 3% of caregivers were not washing hands with soap at critical times. Twenty two percent (22%) of caregivers from intervention area were not using soap to clean kitchen utensils while 3% of caregivers from non-intervention area were not using soap to clean kitchen utensils.

Table 1.
descriptive estimates of non-doers for washing hands with soap at critical times, using soap to clean kitchen utensils and keeping utensils on raised surface between area of intervention and non-intervention area at household level.
Table 1.
descriptive estimates of non-doers for washing hands with soap at critical times, using soap to clean kitchen utensils and keeping utensils on raised surface between area of intervention and non-intervention area at household level.
| Behaviour | Category | Caregivers in Non-Interevention (%) | Caregivers in Intervention Area (%) |
|---|---|---|---|
| Keeping utensils on a raised surface | Keep utensils on a raised surface | 32 | 96 |
| Do not keep utensils on a raised surface | 68 | 4 | |
| Washing hands with soap at critical times | Wash hands with soap | 70 | 97 |
| Do not wash hands with soap | 30 | 3 | |
| Using saop to clean kitchen utensils | Use soap to clean kitchen utensils | 78 | 97 |
| Do not use soap to clean kitchen utensils | 22 | 3 |
Variation of non-doers in the area of intervention and non-intervention area in relation to controlled risk factors
Table 2.
Hierarchical binary logistic regression to identify food hygiene behavioural factors of household and village.
Table 2.
Hierarchical binary logistic regression to identify food hygiene behavioural factors of household and village.
|
Keeping Utensils on a raised place |
Use soap for cleaning Utensils |
Washing hands with soap at critical times |
|||||||
| PREDICTOR | Β | t-value | p-value | Β | t-value | p-value | β | t-value | p-value |
| Education Background | |||||||||
| Never | Reference group | ||||||||
| Primary | 0.013 | 0.5 | 0.62 | -0 | -0.09 | 0.93 | 0.043 | 1.87 | 0.62 |
| Secondary and above | 0.004 | 0.103 | 0.92 | -0.03 | -0.94 | 0.35 | 0.076 | 2.11 | 0.04** |
| Presence of Faeces outside the house | |||||||||
| No | |||||||||
| Yes | 0.019 | 0.358 | 0.72 | -0.03 | -0.56 | 0.58 | 0.062 | 1.29 | 0.2 |
| Age group | |||||||||
| 18-28 | Reference group | ||||||||
| 29-38 | -0.05 | -2.22 | 0.03** | -0.02 | -0.79 | 0.43 | 0.031 | 1.48 | 0.14 |
| 39-48 | -0.01 | -0.29 | 0.77 | 0.011 | 0.367 | 0.71 | -0.009 | -0.28 | 0.78 |
| 49-58 | -0.12 | -1.23 | 0.22 | 0.036 | 0.439 | 0.66 | 0.142 | 1.65 | 0.99 |
| Over 58 | -0.07 | -0.47 | 0.64 | -0.05 | -0.43 | 0.67 | 0.079 | 0.61 | 0.54 |
| Marital status | |||||||||
| Unmarried | Reference group | ||||||||
| Married | -0.01 | -0.19 | 0.85 | 0.018 | 0.6 | 0.55 | 0.035 | 1.09 | 0.27 |
| Occupation | |||||||||
| Farming | Reference group | ||||||||
| Business | -0.03 | -1.07 | 0.28 | 0.008 | 0.333 | 0.74 | -0.031 | -1.19 | 0.23 |
| Employed | 0.036 | 1.161 | 0.25 | 0.073 | 2.808 | 0.005** | -0.075 | -2.68 | 0.008** |
| Intervention | |||||||||
| No | Reference group | ||||||||
| Yes | -0.63 | -24 | <0.00001** | -0.17 | -7.91 | <0000.1** | 0.256 | 11.1 | <0.00001** |
| Relative Wealth | |||||||||
| Low | Reference group | ||||||||
| Middle | 0.077 | 1.75 | 0.08* | -0.01 | -310 | 0.76 | -0.034 | -1.06 | 0.28 |
| High | -0.04 | -0.5 | 0.62 | -0.07 | -1.33 | 0.1* | 0.086 | 1.43 | 0.1* |
| Health knowledge | |||||||||
| Not knowledgeable | Reference group | ||||||||
| Knowledgeable | 0.004 | 0.2 | 0.84 | -0.01 | -0.29 | 0.77 | -0.012 | -0.67 | 0.5 |
| Risk | |||||||||
| Not at risk | Reference group | ||||||||
| At risk | 0.098 | 1.4 | 0.16 | 0.068 | 1.133 | 0.26 | 0.012 | 0.19 | 0.85 |
| Effort | |||||||||
| Difficult | Reference group | ||||||||
| Easy | 0.008 | 0.195 | 0.85 | 0.047 | 1.343 | 0.18 | -0.018 | -0.49 | 0.63 |
| Norm | |||||||||
| No | Reference group | ||||||||
| Yes | -0 | -0.07 | 0.95 | -0.01 | -0.03 | 0.97 | -0.008 | -0.2 | 0.85 |
| Confidence | |||||||||
| Not confident | Reference group | ||||||||
| Confident | -0.3 | -3.43 | 0.0006** | -0.09 | -1.24 | 0.22 | 0.224 | 2.84 | 0.005** |
| Willingness | |||||||||
| Not willing | Reference group | ||||||||
| Willing | 0.001 | 0.008 | 0.994 | 0.072 | 0.692 | 0.49 | -0.201 | -1.83 | 0.07* |
| Perception on price | |||||||||
| Not expensive | Reference group | ||||||||
| Expensive | 0.013 | 0.5 | 0.62 | 0.102 | 4.636 | <0.00001** | -0.098 | -0.43 | 0.67 |
| Household effects | 0.003 | 1.5 | <0.00001** | 0.001 | 1 | <0.00001** | 0.001 | 1 | <0.00001** |
| Village effects | 0.076 | 19 | <0.00001** | 0.056 | 18.67 | <0.00001** | 0.063 | 21 | <0.00001** |
| DIC | 216.59 | -34.13 | 66.71 | ||||||
*=marginally significant and **=highly significant .
Table 2 presents data on a series of binary logistic regression results relating to keeping utensils on an elevated surface, using soap to clean kitchen utensils, and washing hands with soap at critical times. Education background, age group of caregivers, occupation, interventions, relative wealth, self-confidence, willingness to do proper hygiene practices, and perception on price were all factors that were associated with keeping utensils on an elevated surface, using soap to clean kitchen utensils, and washing hands with soap at critical times.
Those who never attended school were less likely to wash hands with soap than those who attended school to secondary and above (p=0.03). Caregivers in the age group of 18-28 years were less likely to keep utensils on an elevated surface than those in age category of 29-38 years (p=0.02). Those who were doing farming were less likely to use soap to clean kitchen utensils and less likely to wash hands with soap at critical times than those who were employed (p=0.005, 0.007). Those who did not receive interventions on proper hygiene practices were less likely to keep utensils on an elevated surface, use soap to clean kitchen utensils and wash hands with soap at critical times than caregivers who received intervention (p<0.00001).
Relative wealth was also a key factor, as it was found that caregivers in the low wealth category were less likely to use soap to clean kitchen utensils and were likely to wash hands with soap at critical times than those in the high wealth category (p=0.01). Those in the low wealth category were less likely to keep utensils on an elevated surface than those in the average wealth category (p=0.08).
Caregivers who had no self-confidence were less likely to keep utensils on an elevated surface and were less likely to wash hands with soap at critical times than those who were confident (p= 0.0006, 0.005). Caregivers who were not willing to do proper hygiene practices were less likely to wash hands with soap at critical times than those who were willing (p=0.06). Those who regard proper hygiene as expensive were less likely to keep utensils on an elevated surface and were less likely to wash hands with soap at critical times than those who thought otherwise (p=<0.00001).
As shown in There were 30% of caregivers who were not washing hands with soap at critical times from intervention area while in non-intervention area, 3% of caregivers were not washing hands with soap at critical times. Twenty two percent (22%) of caregivers from intervention area were not using soap to clean kitchen utensils while 3% of caregivers from non-intervention area were not using soap to clean kitchen utensils.
Table 1.
descriptive estimates of non-doers for washing hands with soap at critical times, using soap to clean kitchen utensils and keeping utensils on raised surface between area of intervention and non-intervention area at household level.
Table 1.
descriptive estimates of non-doers for washing hands with soap at critical times, using soap to clean kitchen utensils and keeping utensils on raised surface between area of intervention and non-intervention area at household level.
| Behaviour | Category | Caregivers in Non-Interevention (%) | Caregivers in Intervention Area (%) |
|---|---|---|---|
| Keeping utensils on a raised surface | Keep utensils on a raised surface | 32 | 96 |
| Do not keep utensils on a raised surface | 68 | 4 | |
| Washing hands with soap at critical times | Wash hands with soap | 70 | 97 |
| Do not wash hands with soap | 30 | 3 | |
| Using saop to clean kitchen utensils | Use soap to clean kitchen utensils | 78 | 97 |
| Do not use soap to clean kitchen utensils | 22 | 3 |
Variation of non-doers in the area of intervention and non-intervention area in relation to controlled risk factors
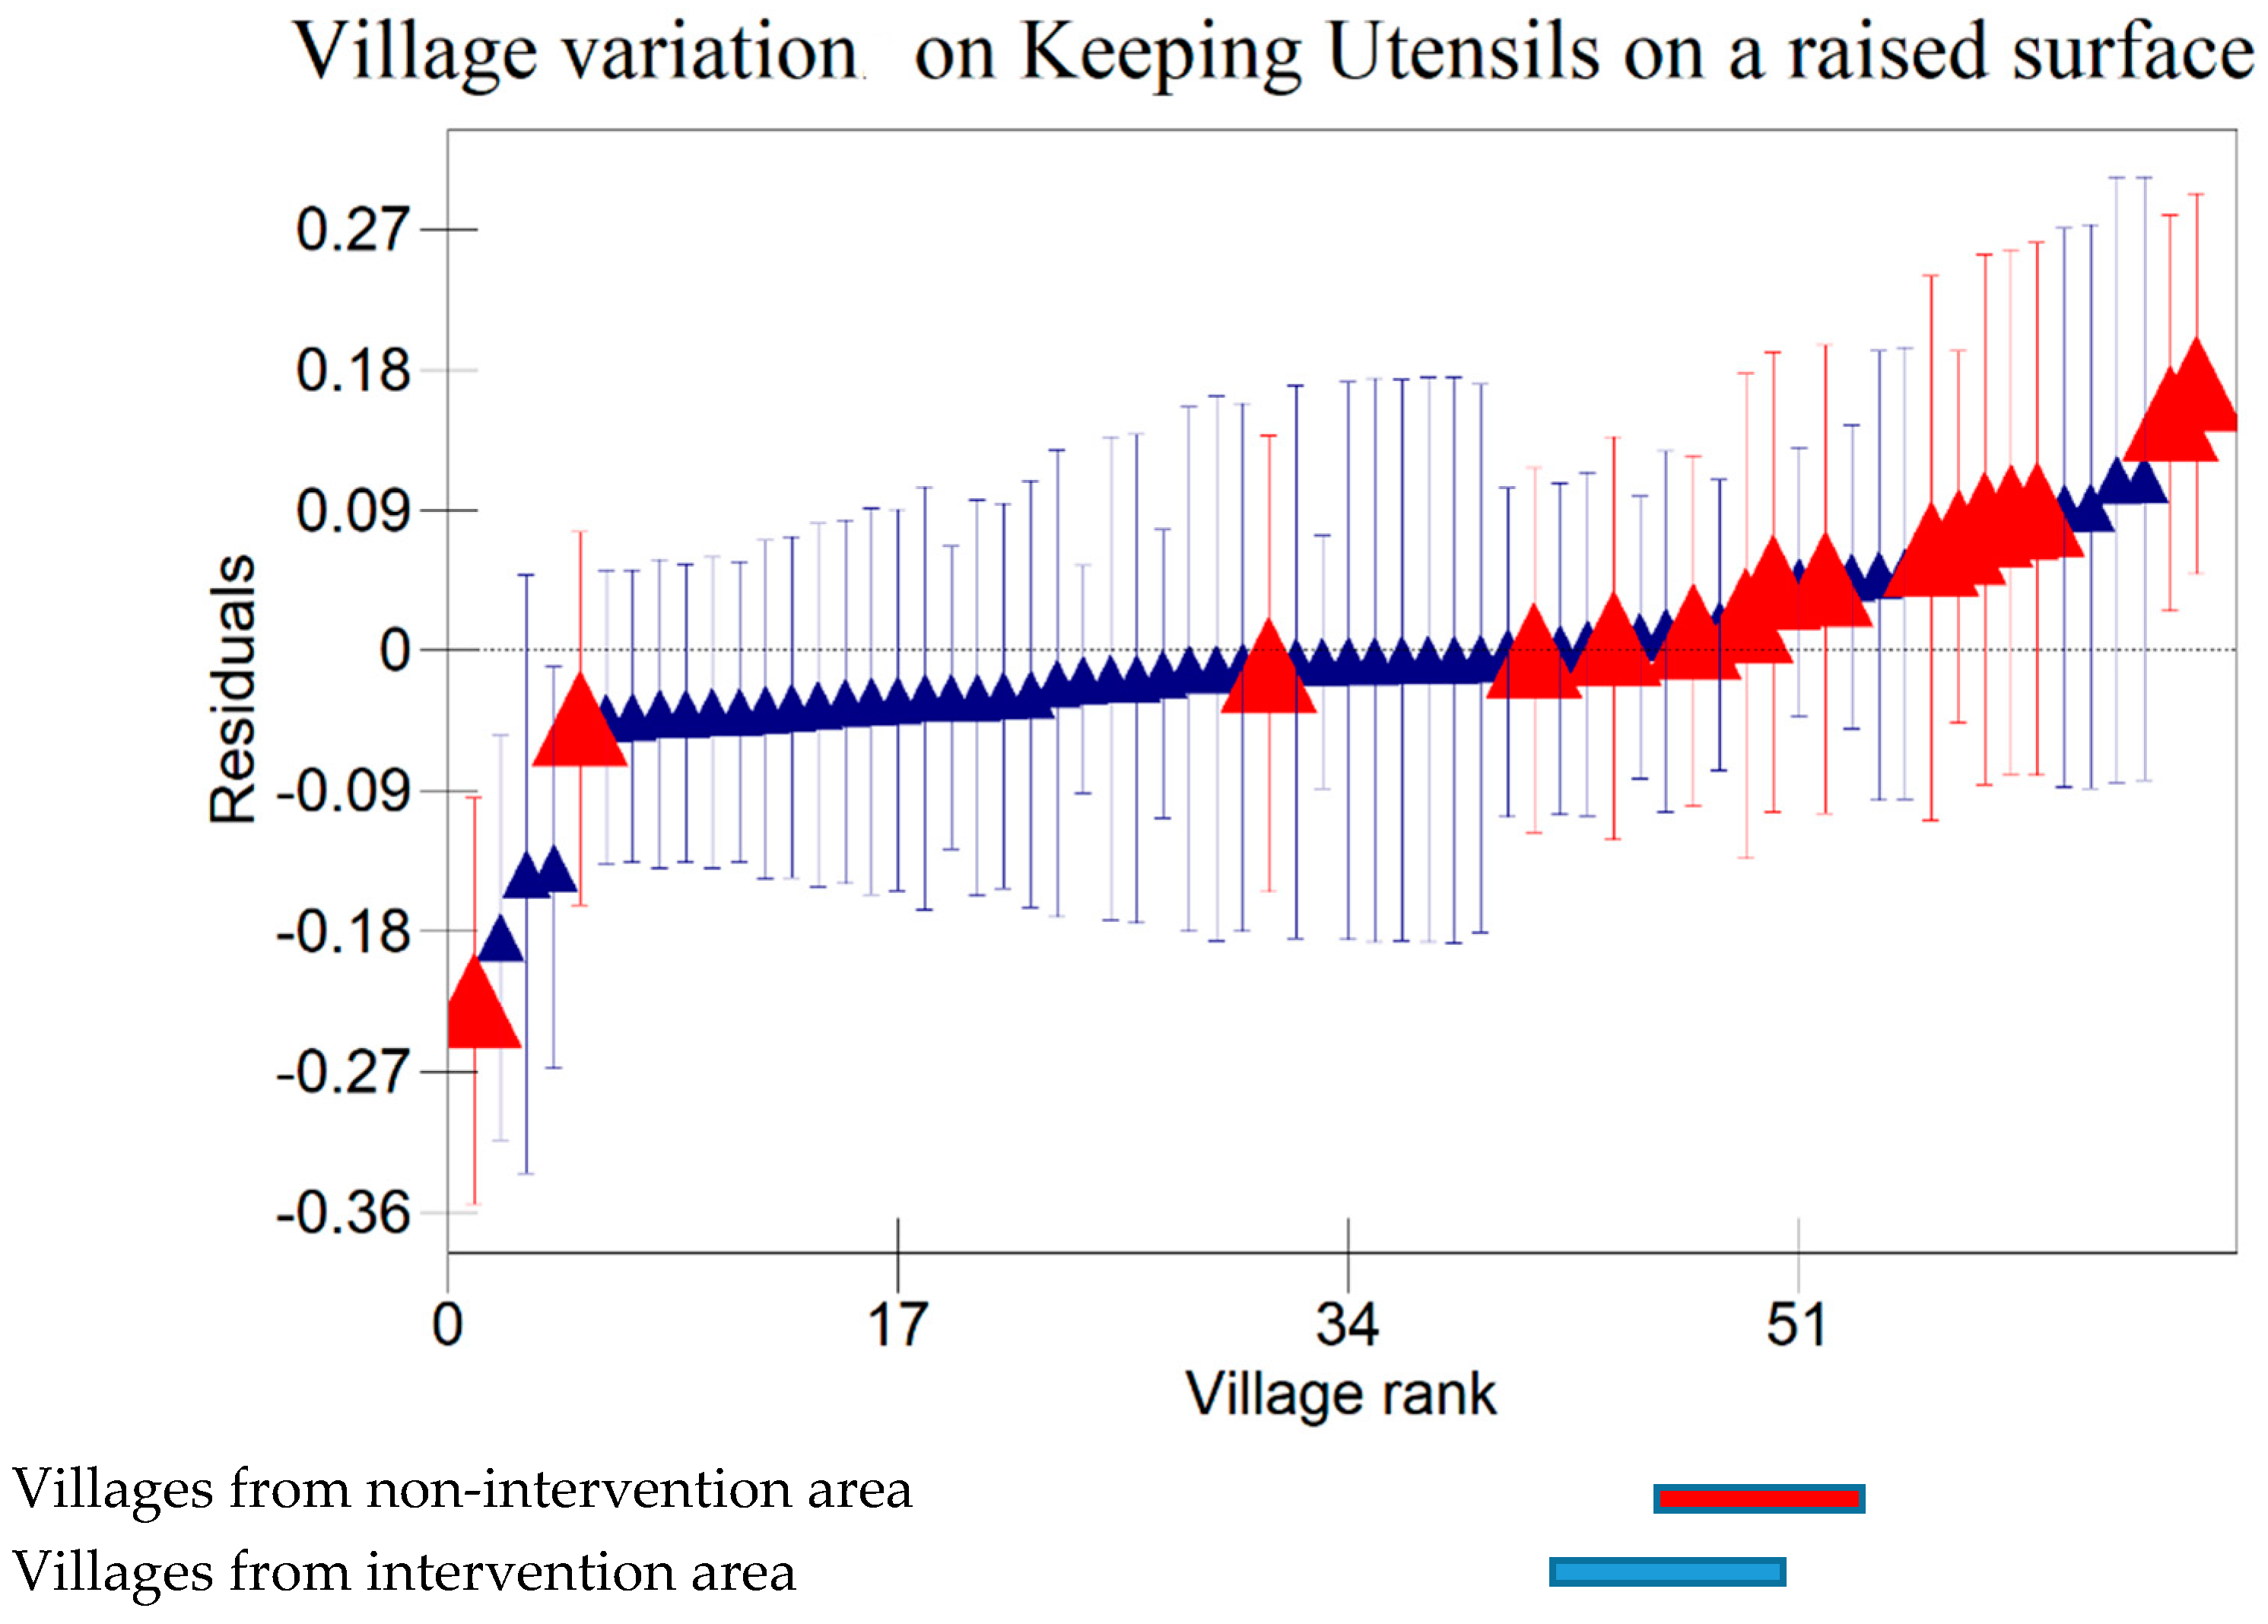
, the results indicate that there were variations at household level on keeping utensils on an elevated surface, using soap to clean kitchen utensils, and washing hands with soap at critical times. There were variations between villages on keeping utensils on an elevated surface, using soap to clean kitchen utensils, and washing hands with soap at critical times (p<0000.1). This agrees with results displayed in caterpillar plots in Error! Reference source not found. , Error! Reference source not found. , Error! Reference source not found. , Error! Reference source not found. , Error! Reference source not found. and Error! Reference source not found. where some villages and households are above 0 on the positive side of the graph and other households and villages are below zero on the negative side of the graph. Those that are above zero are no-does while those on the negative side are doers. As indicated on the legends for individual graphs, villages and households from intervention area are in blue colour while villages and households from the control are in red. It has however been noted that some villages and households from non-intervention areas fall on the negative side of the caterpillar plot implying that such villages and households were doers though they did not receive the intervention. Similarly, some villages and households from intervention area fall above the caterpillar plot implying that they were non-doers although they received intervention. For example, Error! Reference source not found. indicates households from non-intervention which is on the far negative side of the caterpillar plot. The software shows that those households are under Kaphiri village which is from control but is on doers side as indicated in Error! Reference source not found.. Factors that could lead to such outperformance could include proximity to some villages that were in the intervention area, village leadership influence, or influence form other related interventions.
3.3. Keeping Kitchen Utensils on a Raised Surface
Figure 2.
A 95% credible interval caterpillar plot, showing residuals of keeping utensils on a raised surface ranked by their respective households.
Figure 2.
A 95% credible interval caterpillar plot, showing residuals of keeping utensils on a raised surface ranked by their respective households.
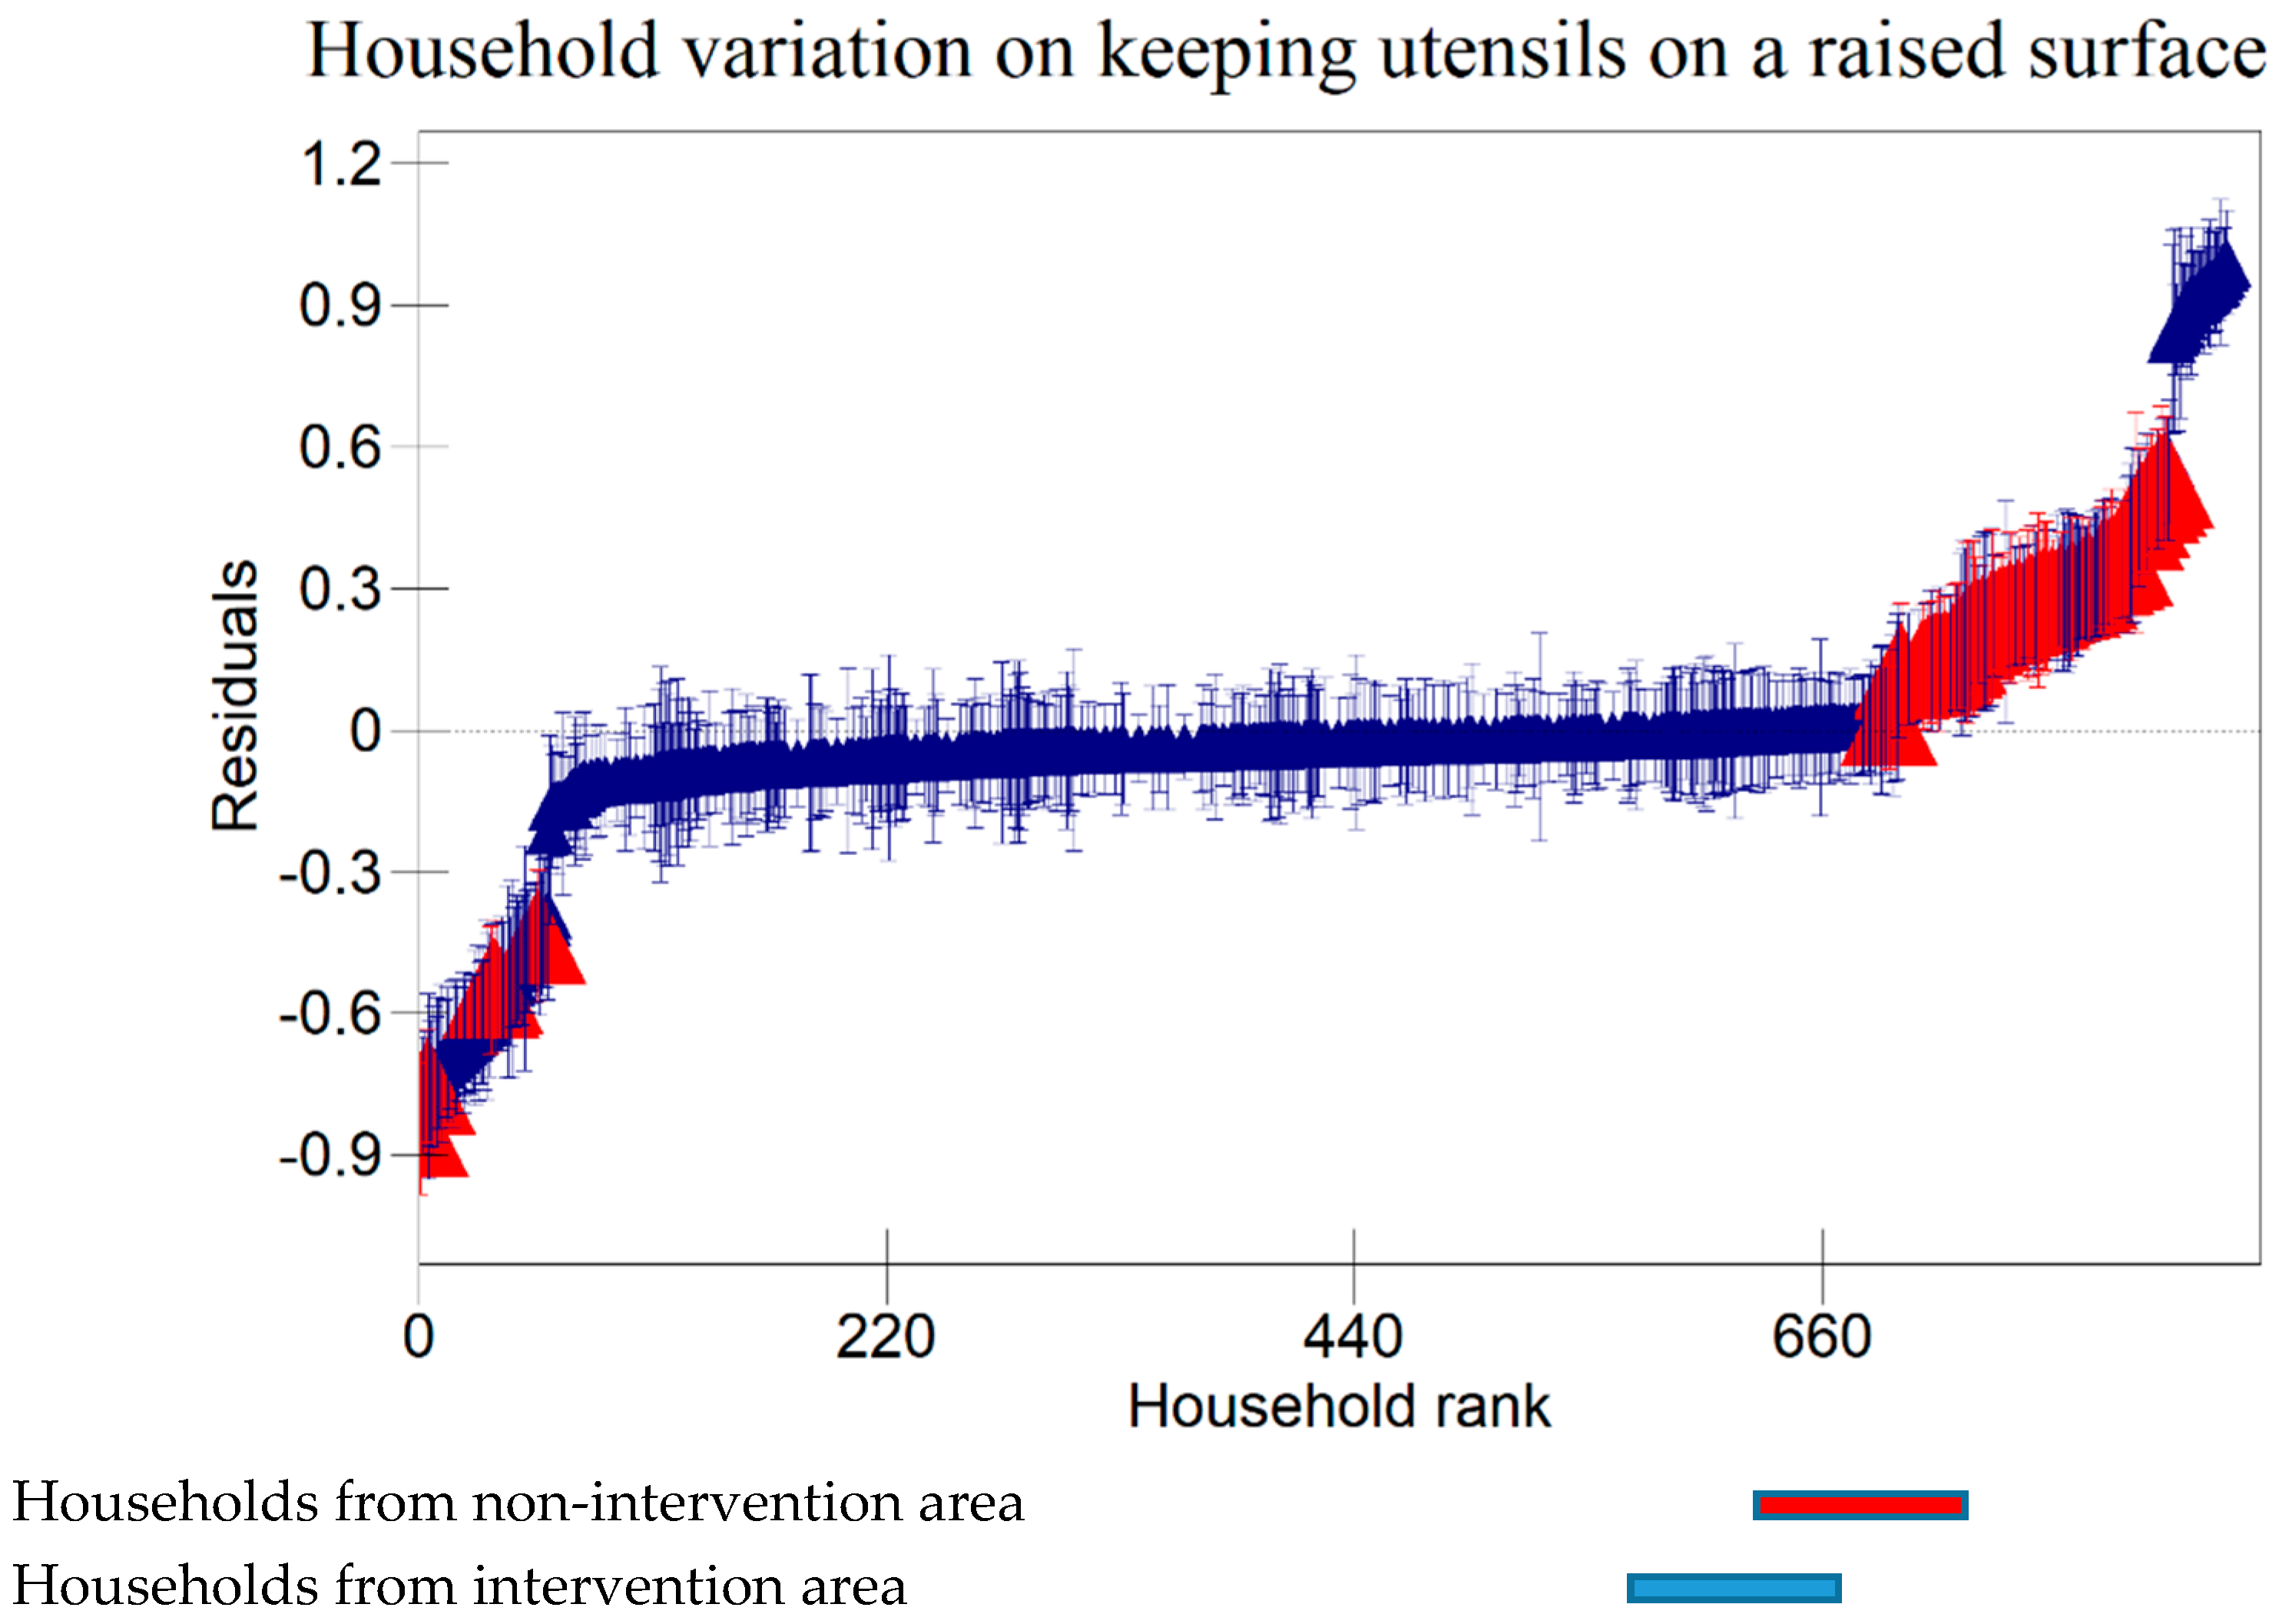
Figure 3.
A 95% credible interval caterpillar plot, showing residuals of keeping utensils a raised surface ranked by thier respective villages.
Figure 3.
A 95% credible interval caterpillar plot, showing residuals of keeping utensils a raised surface ranked by thier respective villages.
3.4. Use of soap to Clean Kitchen Utensils
Figure 4.
A 95% credible interval caterpillar plot, showing residuals of using soap to clean kitchen utensils ranked by thier respective households.
Figure 4.
A 95% credible interval caterpillar plot, showing residuals of using soap to clean kitchen utensils ranked by thier respective households.
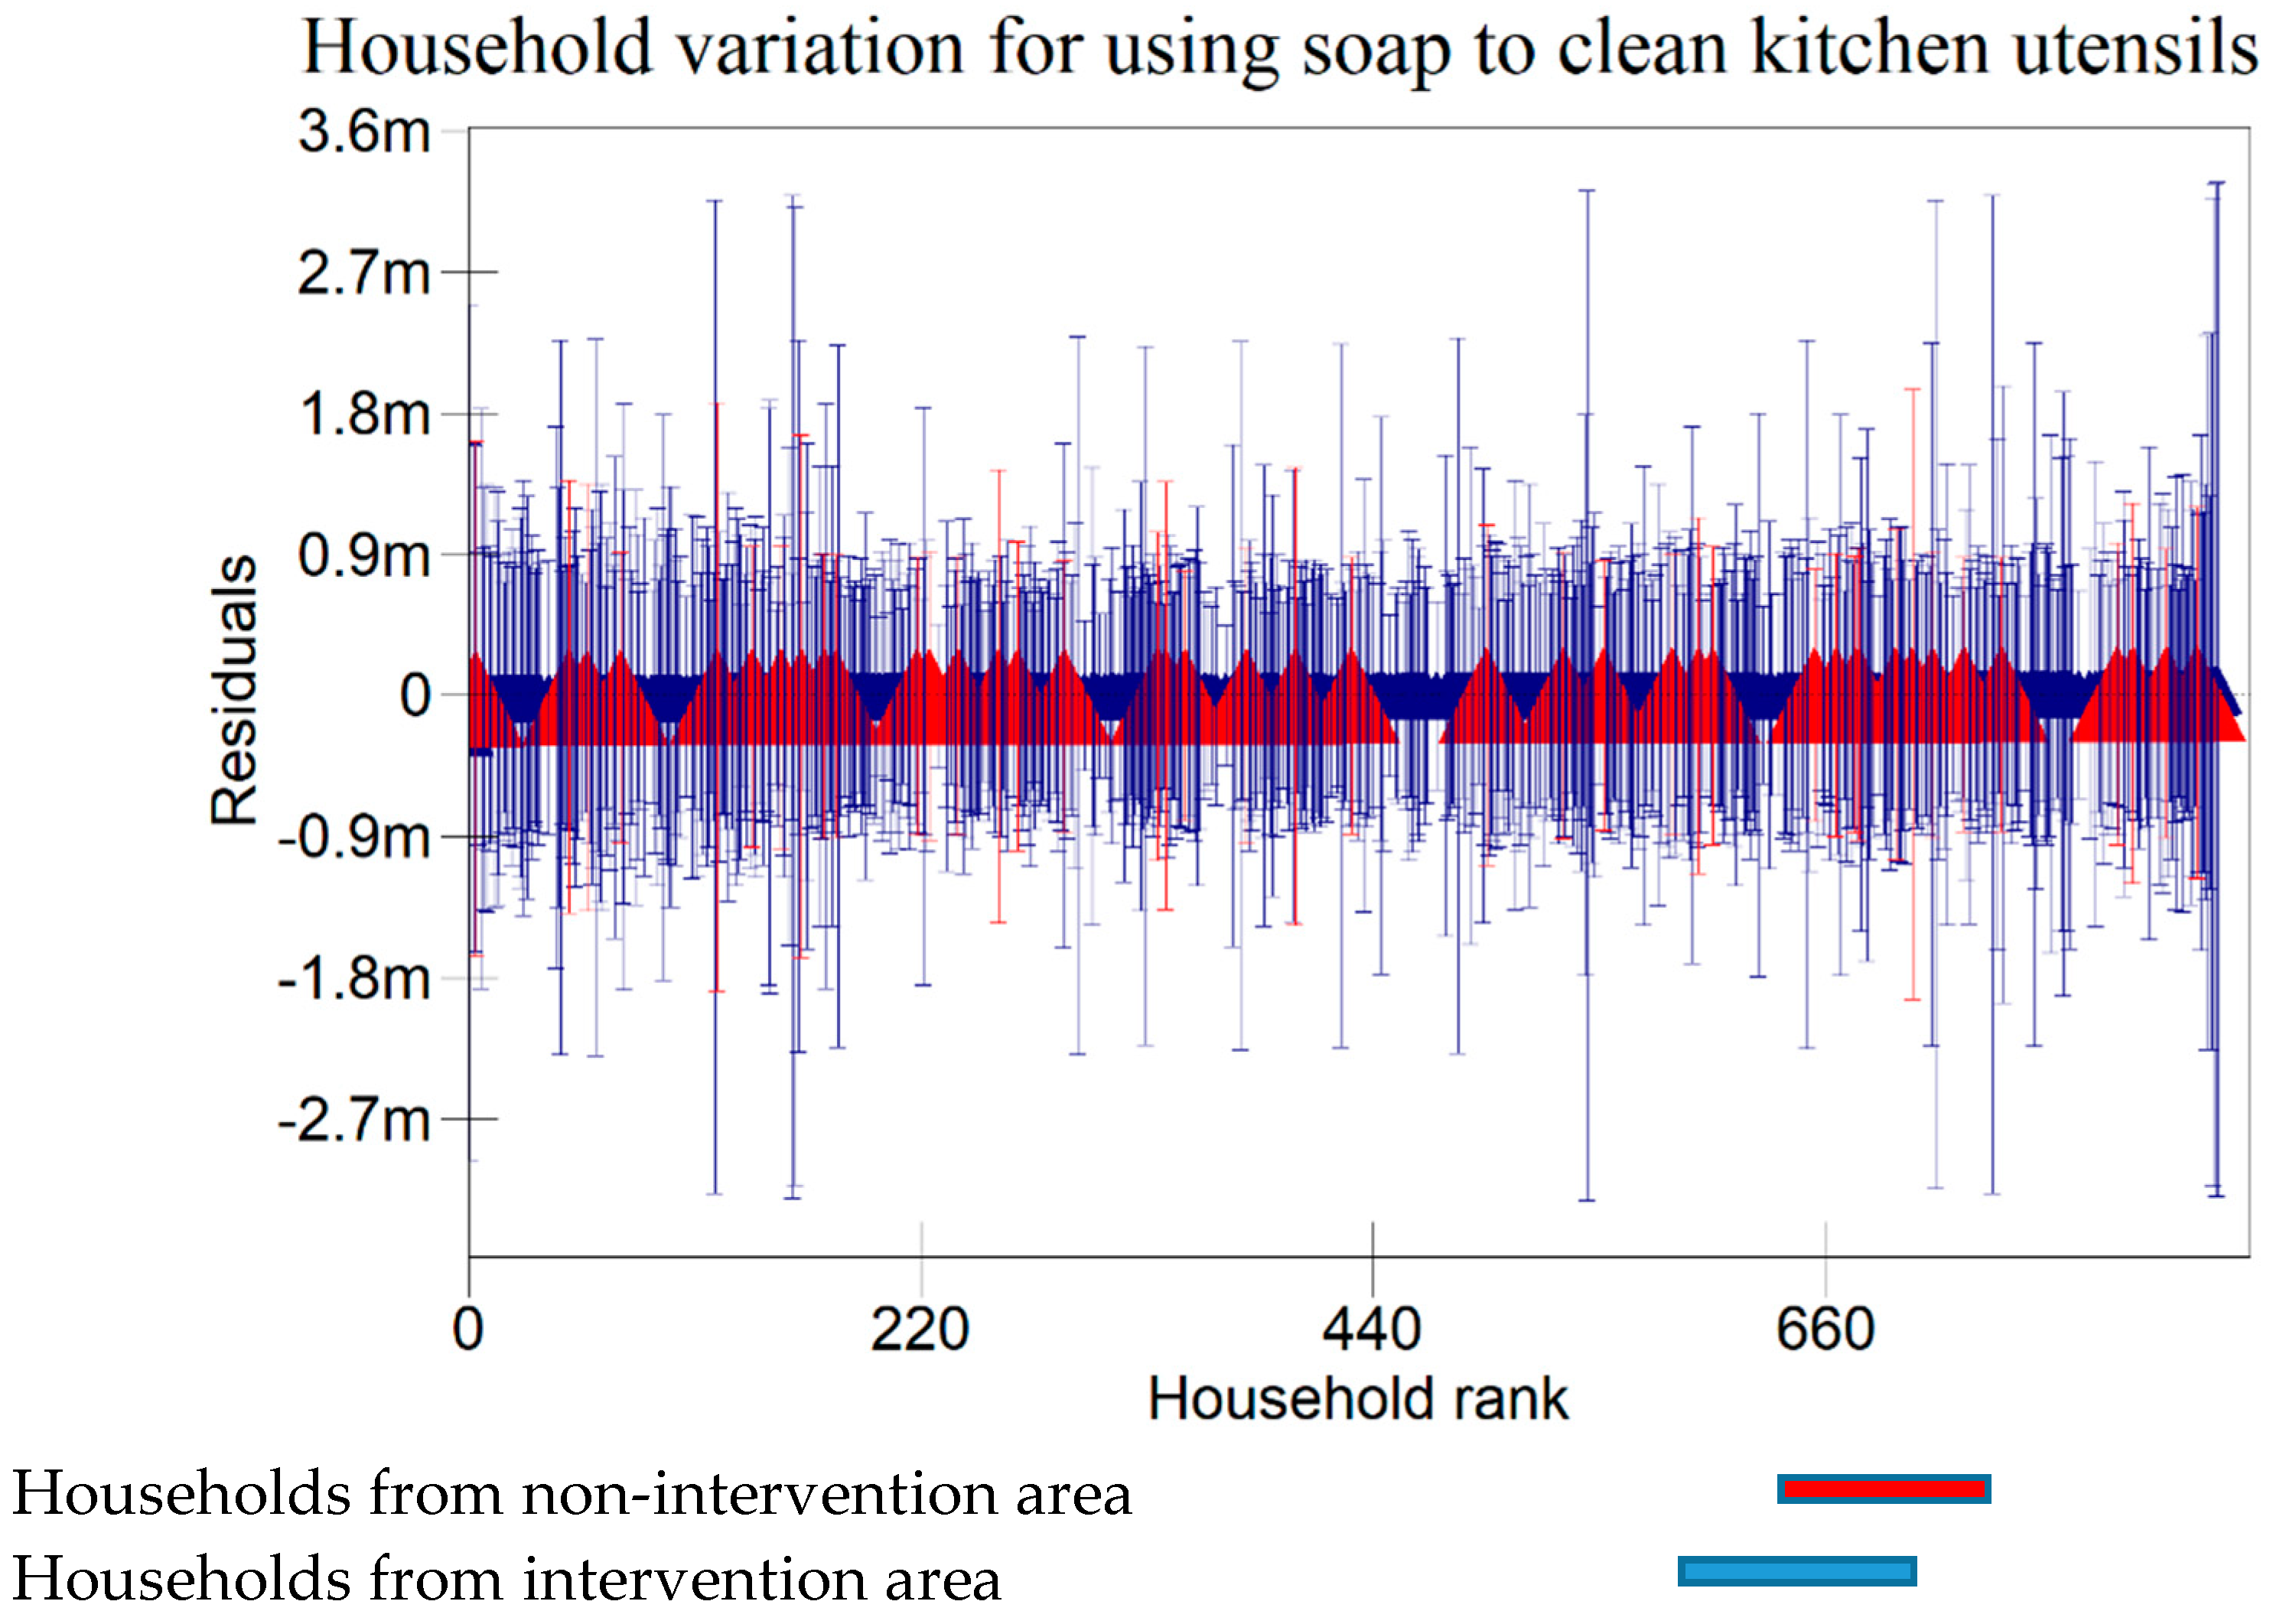
Figure 5.
A 95% credible interval caterpillar plot, showing residuals of using soap to clean kitchen utensils ranked by thier respective villages.
Figure 5.
A 95% credible interval caterpillar plot, showing residuals of using soap to clean kitchen utensils ranked by thier respective villages.

3.5. Washing Hands with Soap at Critical Times
Figure 6.
A 95% credible interval caterpillar plot, showing residuals of washing hands with soap at critical times ranked by their respective households.
Figure 6.
A 95% credible interval caterpillar plot, showing residuals of washing hands with soap at critical times ranked by their respective households.
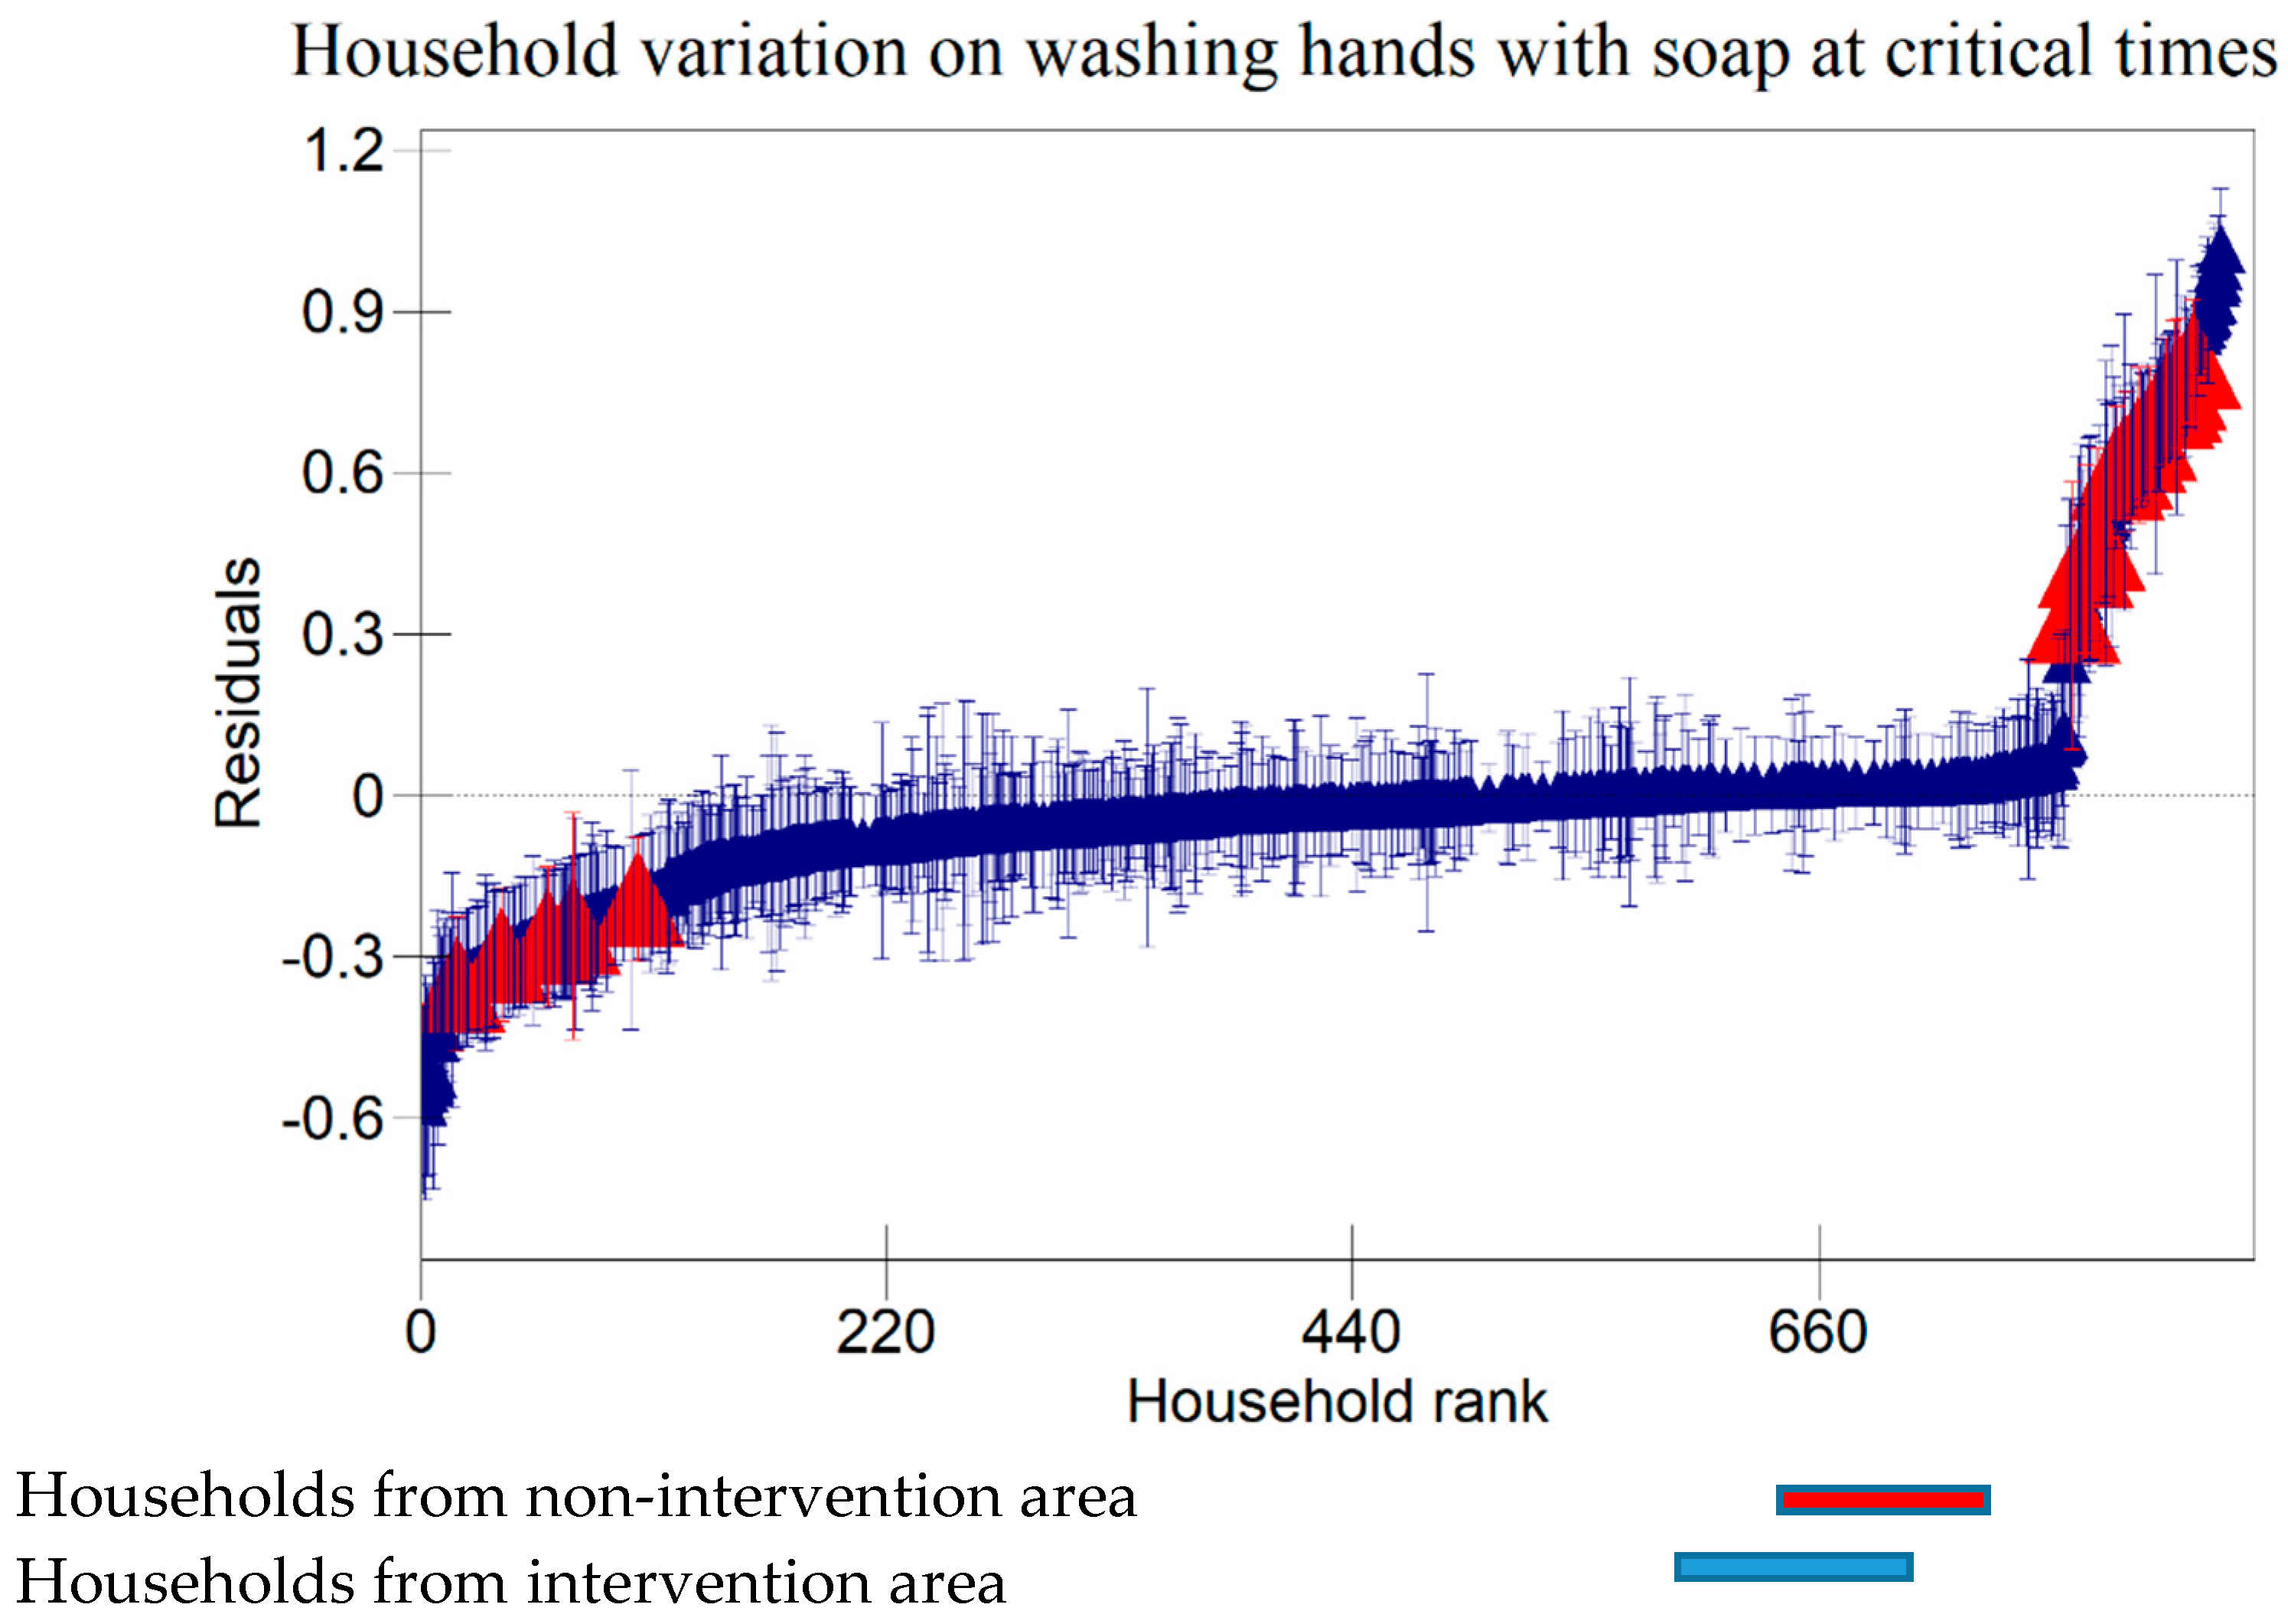
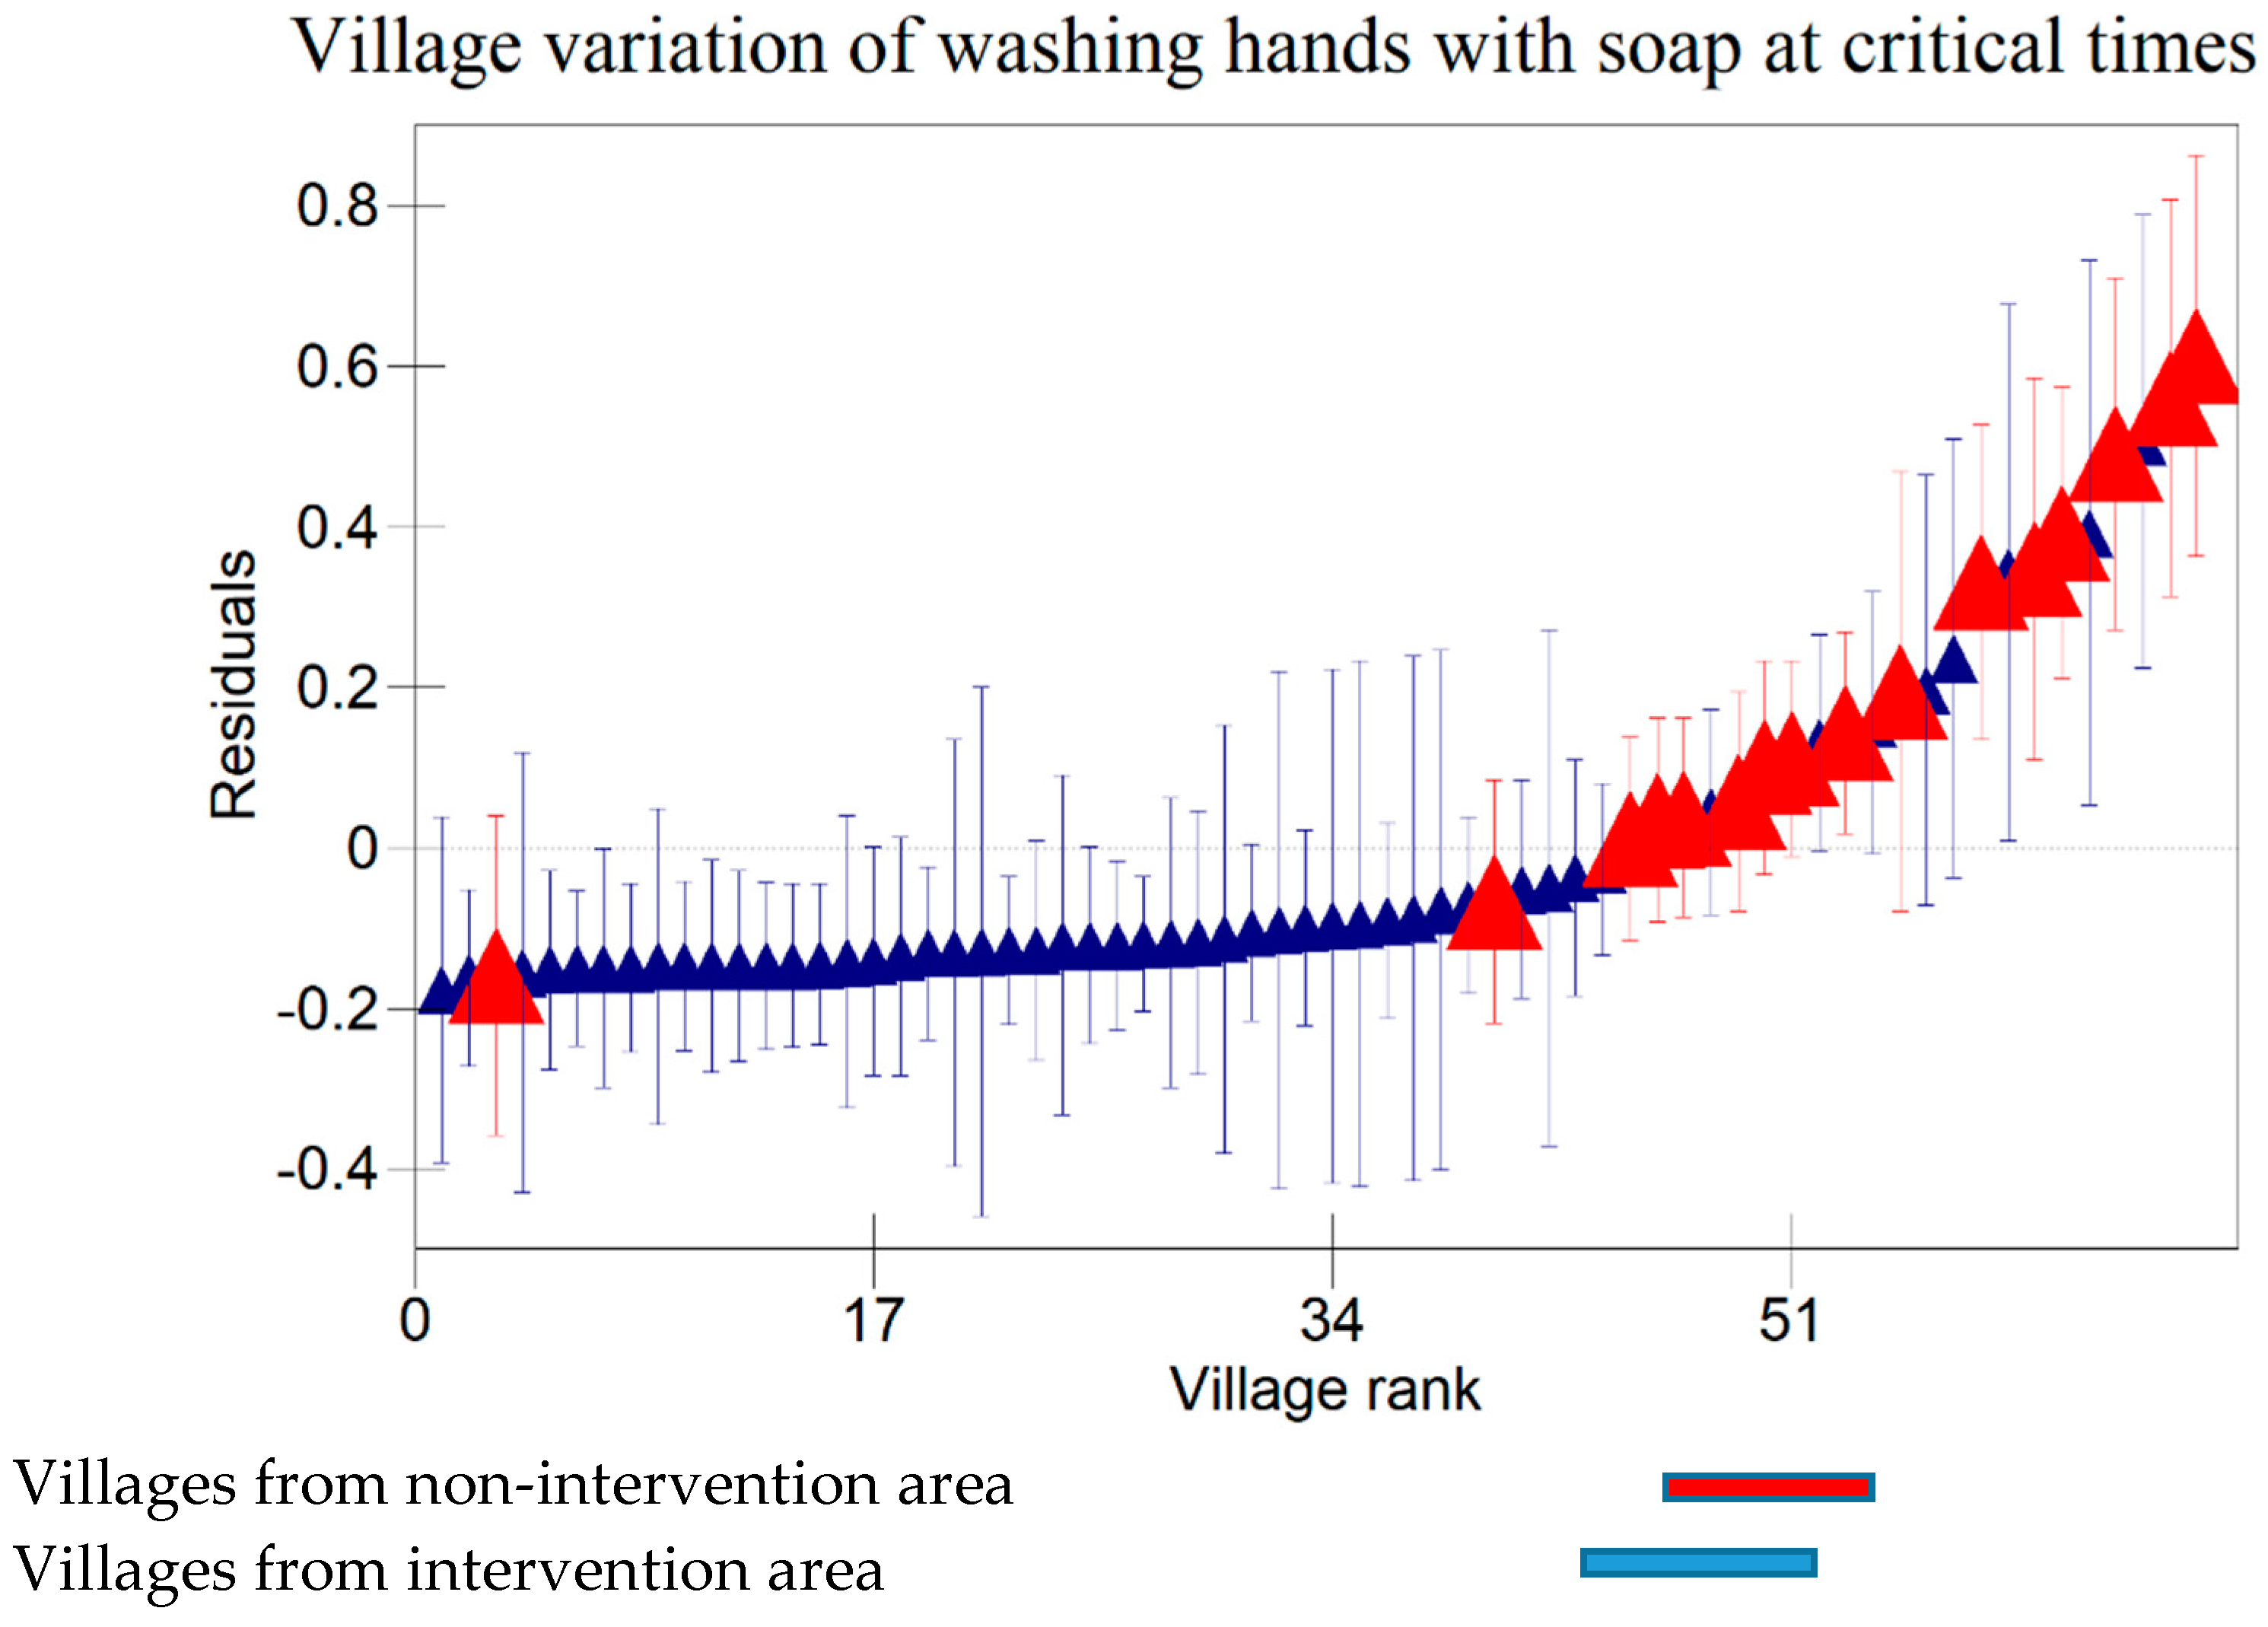
Figure 7.
A 95% credible interval caterpillar plot, showing residuals of washing hands with soap at critical times ranked by their respective villages.
Figure 7.
A 95% credible interval caterpillar plot, showing residuals of washing hands with soap at critical times ranked by their respective villages.
4. Discussion and Conclusions
The study results have shown that most of the participants did not finish school to at least secondary level. This could be attributed to some cultural believes where parents prioritize educating boys and encourage girls to get married instead. The results have also indicated that most of the study participants were from poor households. This could be connected to the fact that most of these participants were less educated and that could mean that they were less likely to get employed in better jobs. Results have also revealed that most of caregivers from intervention area were doers of all the three targeted behaviours as compared to caregivers from non-intervention area. This could imply that interventions delivered had a positive influence of hygiene behaviours amongst caregivers in the intervention area.
Variation due to hierarchical effects may result because of unobserved factors that affect hygiene behaviours at household and village levels. These variations may have occurred due to various contextual factors like religious affiliation of caregivers (Nkoka et al., 2019). A number of studies on the analysis of food hygiene behaviours among child caregivers have been carried out in Malawi (Chidziwisano et al., 2020) (Chidziwisano et al., 2019). However, the uniqueness of this study is that it employed multi-level approach to account for village effects, in addition to household factors.
The data accrued has shown significant variation at household level for all targeted behaviours. However, the study has revealed a significant variation at village level for only two behaviours: keeping utensils on a raised surface and using soap to clean kitchen utensils. The variations at village level may have occurred due to the differences in leadership management between village heads, where some village heads may have strict self-enforced rules and morals, while others may not care much about how their people live (i.e. some village heads may be highly civilized to enforce proper hygiene practices while others may not care) (Badu & Djafri, 2019). The effect of education background has been shown where there's a significant difference between caregivers who attended school to secondary level and above, and those who never attended school with regard to washing hands with soap at critical times. This is expected in any society where most highly educated people are more likely to do right behaviours than those who never attended school. Age group has shown to affect the behaviours of caregivers whereby 29-48 years’ category were more likely to keep utensils on an elevated surface than other age categories. This might be due to the agility and maturity associated with that youth age group (Thieschäfer & Büsch, 2022). The study has shown a significant impact of occupation on using soap to clean kitchen utensils and washing hands with soap at critical times: those who were doing farming were less likely to use soap to clean kitchen utensils and less likely to wash hands with soap at critical times than those who were employed. This might be due to exposure one has at work, where can be expected that such workplaces have a variety of people with different backgrounds, and this increases the chance of learning from each other.
The other result from the study is on the effect of intervention. The difference could be attributed to the knowledge gap on the importance of keeping utensils on an elevated surface, using soap to wash kitchen utensils, and washing hands with soap at critical times to those who did not receive intervention. These results are not dissimilar from the study of (Chidziwisano et al., 2020) on the impact of interventions at household level where they found that interventions had a positive impact on behavioural change amongst households. Relative wealth had a positive impact on keeping utensils on an elevated surface and washing hands with soap at critical times maybe because low wealth households tend to have poor access to important hygiene resources like soap and clean water. The other reason could be attributed to poor access to information due to the unavailability of media accessories like radio and television in the household. Confidence in performance had impact on child caregivers most likely because had self-confidence were more likely to have enough information on the importance of being hygienic. Similarly, caregivers who were willing to wash hands with soap had more chances of washing hands with soap at critical times. Confidence and willingness are a good measure of one's own effort to do the right thing due to one’s own belief. This is why those who were confident and willing to do proper hygiene practices were more likely to keep utensils on an elevated surface, wash kitchen utensils with soap and wash hands with soap at critical times. Perception on price for practicing proper hygiene practices had impact on washing kitchen utensils on an elevated area most likely because those who felt that using soap is expensive can easily sacrifice at least using it to wash kitchen utensils. Also, it is more likely they would consider constructing a dish rack is costly.
Results shown in the caterpillar plots indicate that there were variations between participants from control and intervention areas. For example, Error! Reference source not found. shows villages above zero indicating that caregivers in those villages were less likely to wash hands with soap at critical times and those below zero, a sign that caregivers from those villages were likely to wash hands with soap at critical times. It is noted that most villages that are concentrated on the far positive side were in non-intervention area and those on the far negative were from intervention area. This shows that intervention is one of the risk factors associated with variation of villages in this study. This implies that intervention had a positive impact hygiene behaviour of caregivers in Chikwawa ageing with previous researchers (Chidziwisano et al., 2020). However, credible intervals in Error! Reference source not found. are all overlapping indicating no significant differences between villages on washing hands with soap at critical times.
These findings agree with some researchers who found that behavioural determinants including norm, willingness, self-confidence, support mechanisms (i.e. interventions), risks and other broader contextual factors are likely to affect hand washing with soap at critical times (Zangana et al., 2020). In terms of behaviours, overall, it has been observed that most caregivers were not keeping utensils on an elevated surface when compared to those who were not using soap to clean kitchen utensils and those who were not washing hands with soap at critical times. This implies that factors included in this study did not influence caregivers on keeping utensils on an elevated surface.
The observations in this study show that interventions had a positive impact on hygiene behaviours amongst child caregivers. It can also be concluded that there were variations at both household and village levels for all the three hygiene behaviours.
Institutional Review Board Statement:
The University of Malawi’s College of Medicine Research Ethics Committee (P.04/16/1935) approved the study protocol. Permission was obtained from Chikwawa district council, Chikwawa district health office, and the traditional chiefs. The study was registered with the Pan African Clinical Trials Registry (sPACTR201703002084166).
Data Availability Statement
The raw data supporting the conclusions of this article will be made available by the authors on request.
Conflicts of Interest
The authors declare no conflicts of interest.
References
- Afolabi, R. F., & Palamuleni, M. E. (2021). Multilevel analysis of unhealthy bodyweight among women in Malawi: Does urbanisation matter? PLoS ONE, 16(3 March), 1–18. [CrossRef]
- Badu, S. Q., & Djafri, N. (2019). Effect of leadership village head on empowerment of village potential based on environmental management. International Journal of Innovative Science and Research Technology, 1(3463). https://repository.ung.ac.id/karyailmiah/show/3463/syamsu-qamar-badu-jurnal-internasional-effect-of-leadership-village-head-on-empowerment-of-village-potential-based-on-environmental-management.html.
- Chakraborty, N. M., Fry, K., Behl, R., & Longfield, K. (2016). Simplified asset indices to measure wealth and equity in health programs: A reliability and validity analysis using survey data from 16 countries. Global Health Science and Practice, 4(1), 141–154. [CrossRef]
- Chidziwisano, K., Slekiene, J., Kumwenda, S., Mosler, H. J., & Morse, T. (2019). Toward complementary food hygiene practices among child caregivers in rural Malawi. American Journal of Tropical Medicine and Hygiene, 101(2), 294–303. [CrossRef]
- Chidziwisano, K., Slekiene, J., Mosler, H. J., & Morse, T. (2020). Improving complementary food hygiene behaviors using the risk, attitude, norms, ability, and self-regulation approach in rural Malawi. American Journal of Tropical Medicine and Hygiene, 102(5), 1104–1115. [CrossRef]
- Curtis, V., & Cairncross, S. (2003). Effect of washing hands with soap on diarrhoea risk in the community: a systematic review. Lancet Infect Dis, 3, 275–281. [CrossRef]
- Ehiri, J., Azubuike, M., Ubbaonu, C., Anyanwu, E., Ibe, K., & Ogbonna, M. (2001). Critical control points of complementary food preparation and handling in eastern Nigeria. Bull World Health Organ, 79, 423–433. [CrossRef]
- Ejemot-Nwadiaro, R., Ehiri, J., Arikpo, D., Meremikwu, M., & Critchley, J. (2015). Hand washing promotion for preventing diarrhoea. In Cochrane Database Syst Rev (pp. 1–95). [CrossRef]
- Gil, A., Lanata, C., Hartinger, S., Mausezahl, D., Padilla, B., Ochoa, T., Lozada, M., Pineda, I., & Verastegui, H. (2013). Fecal contamina- tion of food, water, hands, and kitchen utensils at the household level in rural areas of Peru. J Environ Health, 76, 102–106.
- Government of Malawi. (2018). Malawi 2018 Census Preliminary Report.
- Huber, A., & Mosler, H.-J. (2013). Determining behavioral factors for interventions to increase safe water consumption: a cross- sectional field study in rural Ethiopia. Int J Environ Health Res, 23, 96–107. [CrossRef]
- Motarjemi, Y., Steffen, R., & Binder, H. (2012). Preventive strategy against infectious diarrhea—A holistic approach. Gastroenter- Ology, 143, 516–519. [CrossRef]
- Nkoka, O., Chuang, T. W., & Chen, Y. H. (2019). Multilevel analysis of factors associated with treatment-seeking behaviors among caregivers with febrile children in Malawi. American Journal of Tropical Medicine and Hygiene, 100(6), 1454–1465. [CrossRef]
- Slekiene, J., & Mosler, H. (2018). Characterizing the last latrine non- owners in rural Malawi. Am J Trop Med Hyg, 98, 295–299. [CrossRef]
- Thieschäfer, L., & Büsch, D. (2022). Development and trainability of agility in youth: A systematic scoping review. Frontiers in Sports and Active Living, 4. [CrossRef]
- Tutz, G. (2021). Hierarchical Models for the Analysis of Likert Scales in Regression and Item Response Analysis. International Statistical Review, 89(1), 18–35. [CrossRef]
- WHO. (2017). Key Facts About Diarrhoeal Diseases. http://www.who.int/mediacentre/factsheets/ %0Afs330/en/%0A.
- Zangana, A., Shabila, N., Heath, T., & White, S. (2020). The determinants of handwashing behaviour among internally displaced women in two camps in the Kurdistan Region of Iraq. PLoS ONE, 15(5), 1–17. [CrossRef]
Disclaimer/Publisher’s Note: The statements, opinions and data contained in all publications are solely those of the individual author(s) and contributor(s) and not of MDPI and/or the editor(s). MDPI and/or the editor(s) disclaim responsibility for any injury to people or property resulting from any ideas, methods, instructions or products referred to in the content. |
© 2024 by the authors. Licensee MDPI, Basel, Switzerland. This article is an open access article distributed under the terms and conditions of the Creative Commons Attribution (CC BY) license (http://creativecommons.org/licenses/by/4.0/).
Copyright: This open access article is published under a Creative Commons CC BY 4.0 license, which permit the free download, distribution, and reuse, provided that the author and preprint are cited in any reuse.


